Embed Size (px)
Citation preview
Foreign Direct Investment (FDI)
in Bangladesh
Survey Report July-December, 2016
Statistics Department
Bangladesh Bank

i
Editorial Committee
Chairman
A.K.M. Fazlul Haque Mia
Executive Director (Specialized)
Members
Md. Azizul Islam
General Manager
Nabadwip Chandra Biswas
Deputy General Manager
Mrinal Kanti Sarker
Deputy General Manager
Md. Meraj Uddin Sarker
Deputy General Manager
Mohammad Abu Sadat
Joint Director
Ataul Karim Bhuiyan
Joint Director
Muhammad Monsur Ahmed
Joint Director
Dewan Sonia Sultana
Joint Director
Faruqul Islam
Deputy Director
Shawkat Hossain Shoaib
Deputy Director
Taslima Aktar
Assistant Director
Tanzina Ahmed
Assistant Director
Md. Red-wan-ul Hoque Khandker
Assistant Director
Contents
Subject Pages
Concepts and Definitions 1
Survey Report (July-December, 2016)
1. Survey Methodology 7
2. Reporting Status of FDI Enterprises 7
3. Survey Findings 9
4. Stock Position of Foreign Direct Investment (FDI) 16
5. Outstanding Position of External Debt in Bangladesh 18
Annexure 1 : FDI Historical Data
Table I: FDI Inflows in Bangladesh for the year 2016 22
Table II: Time Series Data on FDI Inflows (net) by Components 23
Table III : Time Series Data on FDI Inflows (net) by Areas 24
Table IV : Time Series Data on FDI Stock by Components 25
Table V: FDI Inflows by Sectors for the year 2016 26
Table VI: Time Series Data on FDI Inflows (Net) by Sectors 27
Table VII : FDI Inflows by Countries for the year 2016 32
Table VIII : Time Series Data on FDI Inflows (Net) by Countries 34
Table IX : Time Series Data on FDI Stock by Sectors 40
Table X : Time Series Data on FDI Stock by Countries 43
Table XI : Time series Stock Data on Private Sector External Debt (PSED) 50
Annexure 2 : Survey Questionnaire 51
ii
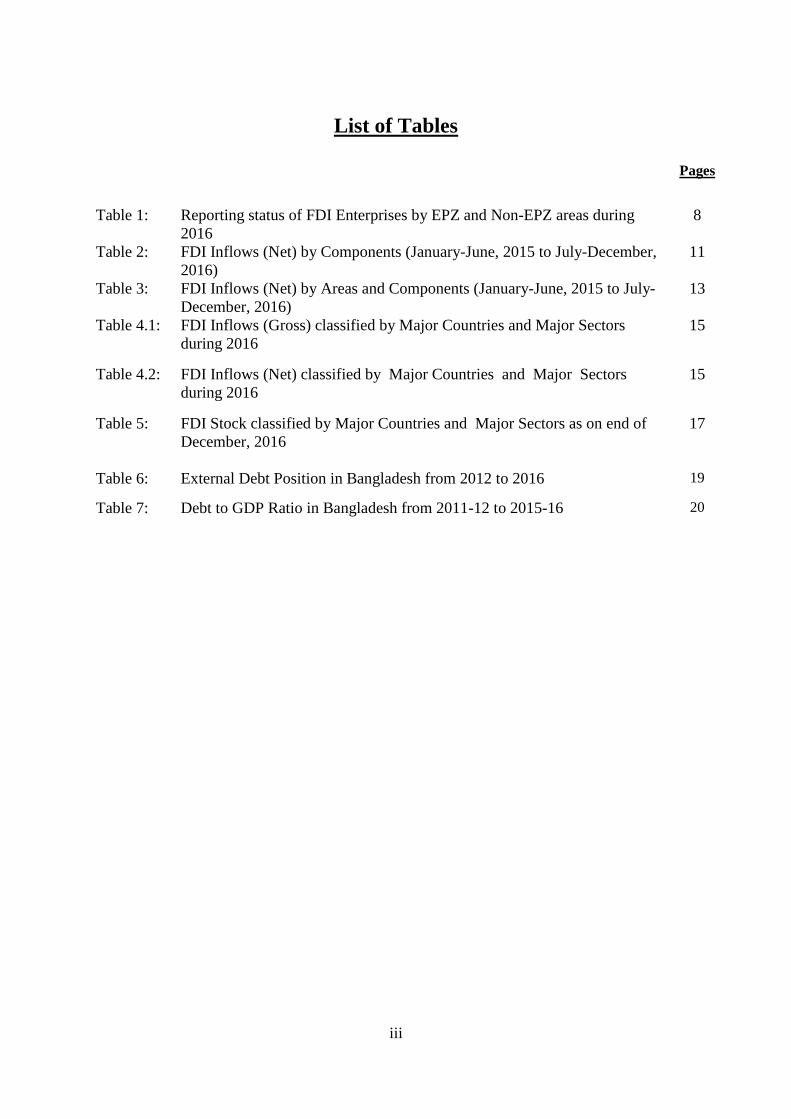
List of Tables
Pages
Table 1: Reporting status of FDI Enterprises by EPZ and Non-EPZ areas during
2016
8
Table 2: FDI Inflows (Net) by Components (January-June, 2015 to July-December,
2016)
11
Table 3: FDI Inflows (Net) by Areas and Components (January-June, 2015 to July-
December, 2016)
13
Table 4.1: FDI Inflows (Gross) classified by Major Countries and Major Sectors
during 2016
15
Table 4.2: FDI Inflows (Net) classified by Major Countries and Major Sectors
during 2016
15
Table 5: FDI Stock classified by Major Countries and Major Sectors as on end of
December, 2016
17
Table 6: External Debt Position in Bangladesh from 2012 to 2016 19
Table 7: Debt to GDP Ratio in Bangladesh from 2011-12 to 2015-16 20
iii
List of Figures
Pages
Figure 1.1 : Reporting Status of FDI enterprises for the period July-September, 2016 7
Figure 1.2 : Reporting Status of FDI enterprises for the period October-December,
2016 7
Figure 2.1 : Area-wise Reporting Status of FDI enterprises for the period July-
September, 2016 8
Figure 2.2 : Area-wise Reporting Status of FDI enterprises for the period October-
December, 2016 8
Figure 3 : FDI Inflows during 2016 9
Figure 4 : Half- yearly Time Series Data on FDI Inflows (Net) 10
Figure 5 : Yearly Time Series Data on FDI Inflows (Net) 10
Figure 6 : FDI Inflows (Net) by Components during July-December, 2016 11
Figure 7: FDI Inflows (Net) by Non-EPZ and EPZ Area 12
Figure 8 : FDI Inflows (Net) of Non-EPZ area by Components during July-December,
2016 12
Figure 9 : FDI Inflows (Net) of EPZ area by Components during July-December,
2016 12
Figure 10 : FDI Inflows (Net) by Major Sectors during 2016 13
Figure 11 : FDI Inflows (Net) by Major Countries during 2016 14
Figure 12 : Trends in FDI Stock 16
Figure 13 : Trends in Major Sector-wise FDI Stock 16
Figure 14 : Trends in Major Country-wise FDI Stock 17
Figure 15 : Debt Position in Bangladesh as of end December, 2016 18
Figure 16 : External Debt Position in Bangladesh 18
Figure 17 : Current Account Receipts/Debt ratio in Bangladesh 19
Figure 18: Debt to GDP ratio in Bangladesh 20
iv
Page 1 of 55
Concepts and Definitions
Foreign Direct Investment (FDI):
Foreign Direct Investment is the category of international investment that reflects the objective of a resident entity in
one economy obtaining a lasting interest in an enterprise resident in another economy (The resident entity is the direct
investor and the enterprise is the direct investment enterprise). The lasting interest implies the existence of a long-term
relationship between the direct investor and the enterprise and a significant degree of influence by the investor on the
management of the enterprise. Direct investment comprises not only the initial transaction establishing the relationship
between the investor and the enterprise but also all subsequent transactions between them and among affiliated
enterprises, both incorporated and unincorporated. A direct investment enterprise is an incorporated or unincorporated
enterprise in which a direct investor owns 10 percent or more of the ordinary shares or voting power for an
incorporated enterprise or the equivalent for an unincorporated enterprise (IMF, Balance of Payment Manual, 5th
addition, 1993, page-86). The components of FDI are: a) Equity capital b) Reinvested earnings and c) Intra-company
loans.
A foreign direct investor is an individual, an incorporated or unincorporated public or private enterprise, a group of
related individuals, or a group of related incorporated and/or unincorporated enterprise which has a direct investment
enterprise - that is, a subsidiary, associate or branch - operating in a country other than the country or countries of
residence of the foreign direct investor or investors.
A direct investment enterprise is defined as an incorporated or unincorporated enterprise in which a foreign investor
owns 10 per cent or more of the ordinary shares or voting power for an incorporated enterprise or the equivalent for an
unincorporated enterprise. A direct investment enterprise may be an incorporated enterprise - a subsidiary or associate
company - or an unincorporated enterprise (branch). Direct investors may have direct investment enterprise which has
subsidiaries, associates and branches in one country or in several countries.
In a subsidiary enterprise, a direct investor owns more than 50 percent of the shareholder’s voting power; in an
associate enterprise a direct investor owns at least 10% but not more than 50 percent of the shareholder’s voting
power and branches are wholly or jointly owned unincorporated enterprise either directly or indirectly owned by the
direct investor.
Inward Direct Investment & Outward Direct Investment
Inward Direct Investment, also called direct investment in the reporting economy, includes all liabilities and
assets transferred between resident direct investment enterprises and their direct investors. It also covers
transfers of assets and liabilities between resident and nonresident fellow enterprises, if the ultimate
controlling parent is nonresident.
Outward direct investment, also called direct investment abroad, includes assets and liabilities transferred
between resident direct investors and their direct investment enterprises. It also covers transfers of assets and
liabilities between resident and nonresident fellow enterprises, if the ultimate controlling parent is resident.
Outward direct investment is also called direct investment abroad.
Page 2 of 55
Residents and Non-residents:
Residents include all individuals, households, enterprises or other organizations operating in Bangladesh, regardless
of whether they are citizens of the country or not, and/or are owned by Bangladeshi citizens or foreigners. These units
have their centers of economic interest in Bangladesh. Branches, subsidiaries and affiliates of foreign banks and
enterprises operating in Bangladesh and persons who normally live in Bangladesh for one year or more are
Bangladeshi residents, regardless of citizenship.
Non-residents are individuals, households, enterprises or other organizations ordinarily domiciled in a country other
than Bangladesh. Non-resident branches and subsidiaries of Bangladeshi banks and enterprises operating in another
country are examples of non-residents, as are persons who do not normally live in Bangladesh.
Foreign Assets and Liabilities:
An asset or liability must represent actual claims that are legally in existence. Foreign assets of resident
enterprise/company/entity comprise its claims on non-residents and liabilities comprise its indebtedness to non-
residents.
Equity Capital:
Remittances received by the incorporated or unincorporated direct investment enterprises operating in
Bangladesh on account of equity participation in those by the nonresident direct investors. Equity capital
comprises:
a) Ordinary Shares:
This item represents the total paid-up capital against issue of ordinary shares.
b) Revaluation & Capital Reserves:
This item comprises revaluation reserve, capital reserve, non-remittable special capital
reserve, non-distributable special reserve and premium on shares.
c) Share Money Deposits:
These are the deposits of the shareholders to get ordinary shares in future.
d) Other Reserves:
This item comprises tax holiday reserve, reserve for bonus share, general reserve, special
reserve etc.
Reinvested earnings:
It is the amount of profit retained for reinvestment.
Intra-company loans:
Intra-company loans or intra-company debt transactions refer to short or long term borrowing and lending of
funds between direct investors (parent enterprises) and affiliate enterprises. The traditional distinction
between short and long term maturity based on the formal criterion of original maturity retained.
Short-term debt is defined as debt with an original maturity of one year or less. It includes loans,
overdrafts, suppliers’ credit, buyers’ credit, deferred payment etc. of a resident enterprise borrows from
direct investors.
Page 3 of 55
Long-term debt is defined as debt with an original maturity of more than one year. It includes loans,
overdrafts, suppliers’ credit, buyers’ credit, deferred payment etc. of a resident enterprise borrows from
direct investors.
Trade credit and accounts payable (Liabilities):
Trade Credits may arise due to direct extension of credit by buyers (nonresidents) to the reporting enterprise
for goods and services transactions. It also arises due to advance payments by nonresidents to the reporting
enterprise for "work that is in progress or to be undertaken". Trade Credit increases due to purchase
(foreign) or import of goods (say, yarn, raw materials etc.) from non-residents and decreases when its value
is paid. It is called accounts payable.
Trade Credit and accounts receivable (Claims):
Trade credits may arise due to direct extension of credit by suppliers (reporting enterprise) to non-residents
for goods and services transactions. Trade credits increase due to export of goods to non-residents and
decreases when its value is received. It is called accounts receivable.
Other debts:
Other short-term debt covers money market instruments, such as bills, commercial paper, and bankers'
acceptances that usually give the holder the unconditional right to receive a stated, fixed sum of money on a
specified date. It also includes debt securities that have been sold under repurchase agreements. In long-term
it also covers debt securities that have been sold under repurchase agreements and debt securities that have
been lent under a securities lending arrangement.
Bonds and notes:
It covers bonds, debentures, and notes that usually give the holder the unconditional right to a fixed cash
flow or contractually determined variable money income.
Equity securities:
A security is defined as an instrument that is traded or tradable. It covers all instruments and records
acknowledging, after the claims of all creditors have been met, claims to the residual values of enterprises.
Equity securities comprise:
a) Ordinary Share:
This item represents ownership share with full voting rights. Ordinary shares are usually
issued in registered form.
b) Preference share:
Part of the share capital of a company that ranks after secured creditors but before ordinary
shareholders in the event of liquidation. Preference rights are defined in the articles of association of the
Page 4 of 55
relevant company but may relate to dividend, voting rights, or distribution of surplus assets. There are two
types of preference shares such as
i) Participating Preference share
These preference shares have further rights that are normally linked to the relevant company's
profits or dividend payment on ordinary shares.
ii) Other Preference share
These will have the rights of standard preference shares but may also be:
cumulative (i.e., income arrears are carried forward to the next payment date),
convertible (into ordinary shares),
redeemable (at a fixed date or contingent on a special event), or
permanent (not redeemable except at issuer's option).
c) Share Money Deposits:
These are the deposits of the shareholders to get ordinary shares in future.
d) Other:
It covers shares in mutual funds and investment trusts, depository receipts etc.
Currency and Deposits:
These include domestic currency held by nonresidents and deposits held by nonresidents. Deposits may be
in domestic and foreign currencies, the defining factor being it is held in a resident financial institution and
owed to a nonresident.
Operating profit and net income:
In case of foreign direct investment in Bangladesh, the survey seeks information on the profit, net income,
and retained earnings of the reporting enterprise (and its subsidiaries) attributable to foreign direct investors.
Operating profit includes profits from the operations of enterprises. In calculating operating profit,
depreciation should be calculated at the written down replacement cost value; exchange rate gains and
losses, special tax provisions (such as accelerated depreciation), and any extraordinary items should be
excluded from the calculation. Taxes should be recorded when due without penalty.
Net income includes income received in the form of interest, dividends and the reinvested earnings
attributable to major owners, less interest paid. Major owners of an enterprise include the head office in the
case of a branch, the parent company in the case of a subsidiary and any enterprise in which an owner has
directly or indirectly a 10 percent or more ownership interest.
Interest on debt should be reported on an accrual basis. In the case of instruments for which interest
payments are made at maturity, interest accrued during the reporting period should be reported. For bonds
Page 5 of 55
and other deep-discounted instrument, the difference between the discounted issue price and the value at
maturity should be treated as interest and reported as it accrues during the period.
External Debt:
Gross external Debt, at any specific time, is the outstanding amount of those actual current, and not
contingent, liabilities that require payments of principal and/or interest by the debtor at some points in the
future and that are owed to non-residents by residents of a country.
Flows and Stocks
All of the data recorded in the macroeconomic statistical systems are either flows or stocks (stocks are also
referred to as positions or stock positions). Flows measure changes in the level of economic value over a
period of time, while stock positions measure the level of economic value at a specific point of time. The
term economic value refers to a unit’s assets, liabilities and net worth. The flows and stock positions
recorded in the macroeconomic statistical systems are integrated, which means that changes in stock
positions can be fully explained by the flows.
FDI capital flows are recorded on a net basis, in the same manner as other cross border financial flows, i.e.,
investments during the reporting period are netted against disinvestments, separately for claims and
liabilities.
Gross inflows are the total inward direct investment made by non-resident investors in the reporting
economy. Disinvestment includes capital repatriation, reverse investments, loans given to parent firms and
repayments of intra-company loans to parent firms. Net inflows are the Gross inflows minus disinvestment.
Gross outflows are the total outward direct investment made by the residents of the reporting economy to
external economies. Net outflows are the Gross outflows minus disinvestment.
In general, net recording of flows in financial assets and liabilities are recommended in the international
accounts from both the analytical and pragmatic perspectives. Net acquisition of external financial claims
and net incurrence of external liabilities are generally of more analytical interest than the gross flows.
(Balance of Payment and International Investment Position manual, Sixth edition, international Monetary
Fund, Para 3.117)
Valuation Principles
Data have been valued using the concept of the “own funds at book value (OFBV)”.
Page 6 of 55
Authority
Article 69 of the Bangladesh Bank Order, 1972 (President’s Order No. 127 of 1972) authorizes Bangladesh
Bank to request from natural or juridical persons including the government, such data or information as are
required for proper execution of its responsibilities.
Data Confidentiality
Bangladesh Bank respects the right to privacy and confidentiality of the respondents and likes to mention
that, under no circumstances will any individual statement or data be published or made known to any other
individual or corporate body without express written permission of the respondent concerned. Aggregated
data, when published, will naturally conceal individual identity.
Page 7 of 55
Survey Report (July-December, 2016)
1. Survey Methodology:
Bangladesh Bank, as the central bank of the country, is responsible for compilation of FDI Statistics needed for
drawing up balance of payments and international investment position of Bangladesh. The Statistics Department of
Bangladesh Bank has been conducting an enterprise survey since 1995 to collect detailed information on foreign direct
investment in Bangladesh. From 2014, this survey is being conducted quarterly, covering the period January-March,
April-June, July-September and October-December. This survey covers 100% foreign owned companies and joint-
venture companies operating in Bangladesh. A prescribed survey questionnaire (FORM FI -1) is used to collect data
from FDI enterprises situated both in EPZ and Non-EPZ areas. In compliance with the Bangladesh Bank’s FE Circular
No-21 of November 03, 2009 and the subsequent circulars Statistics Department Circular No. 1 of August 14, 2012
and StD. Circular no. 3 of May 12, 2014, the FDI enterprises are to submit the completed survey forms (FORM FI - 1)
through their designated banks on quarterly basis. The survey covers FDI gross and net inflows and outstanding stock
of investment by sectors, countries and enterprises. It also covers stock position of Private Sector External Debt
(PSED).
2. Reporting Status of FDI Enterprises
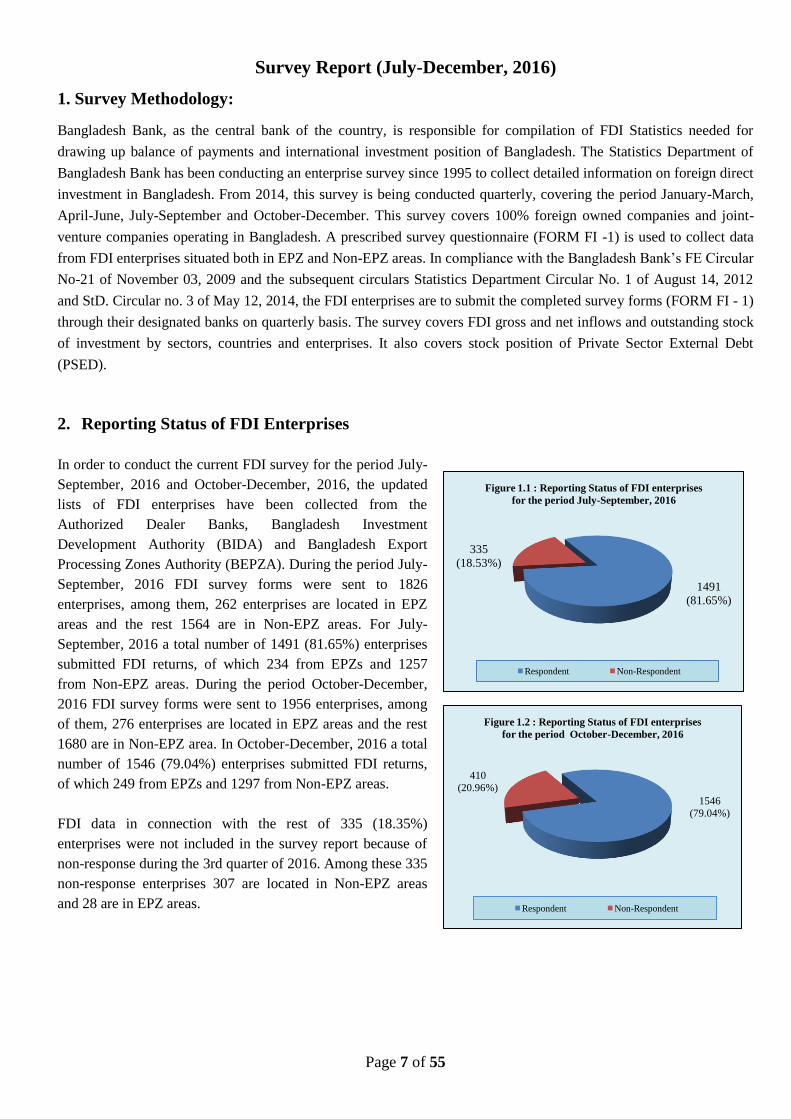
In order to conduct the current FDI survey for the period July-
September, 2016 and October-December, 2016, the updated
lists of FDI enterprises have been collected from the
Authorized Dealer Banks, Bangladesh Investment
Development Authority (BIDA) and Bangladesh Export
Processing Zones Authority (BEPZA). During the period July-
September, 2016 FDI survey forms were sent to 1826
enterprises, among them, 262 enterprises are located in EPZ
areas and the rest 1564 are in Non-EPZ areas. For July-
September, 2016 a total number of 1491 (81.65%) enterprises
submitted FDI returns, of which 234 from EPZs and 1257
from Non-EPZ areas. During the period October-December,
2016 FDI survey forms were sent to 1956 enterprises, among
of them, 276 enterprises are located in EPZ areas and the rest
1680 are in Non-EPZ area. In October-December, 2016 a total
number of 1546 (79.04%) enterprises submitted FDI returns,
of which 249 from EPZs and 1297 from Non-EPZ areas.
FDI data in connection with the rest of 335 (18.35%)
enterprises were not included in the survey report because of
non-response during the 3rd quarter of 2016. Among these 335
non-response enterprises 307 are located in Non-EPZ areas
and 28 are in EPZ areas.
1491
(81.65%)
335
(18.53%)
Figure 1.1 : Reporting Status of FDI enterprises
for the period July-September, 2016
Respondent Non-Respondent
1546
(79.04%)
410
(20.96%)
Figure 1.2 : Reporting Status of FDI enterprises
for the period October-December, 2016
Respondent Non-Respondent
Page 8 of 55
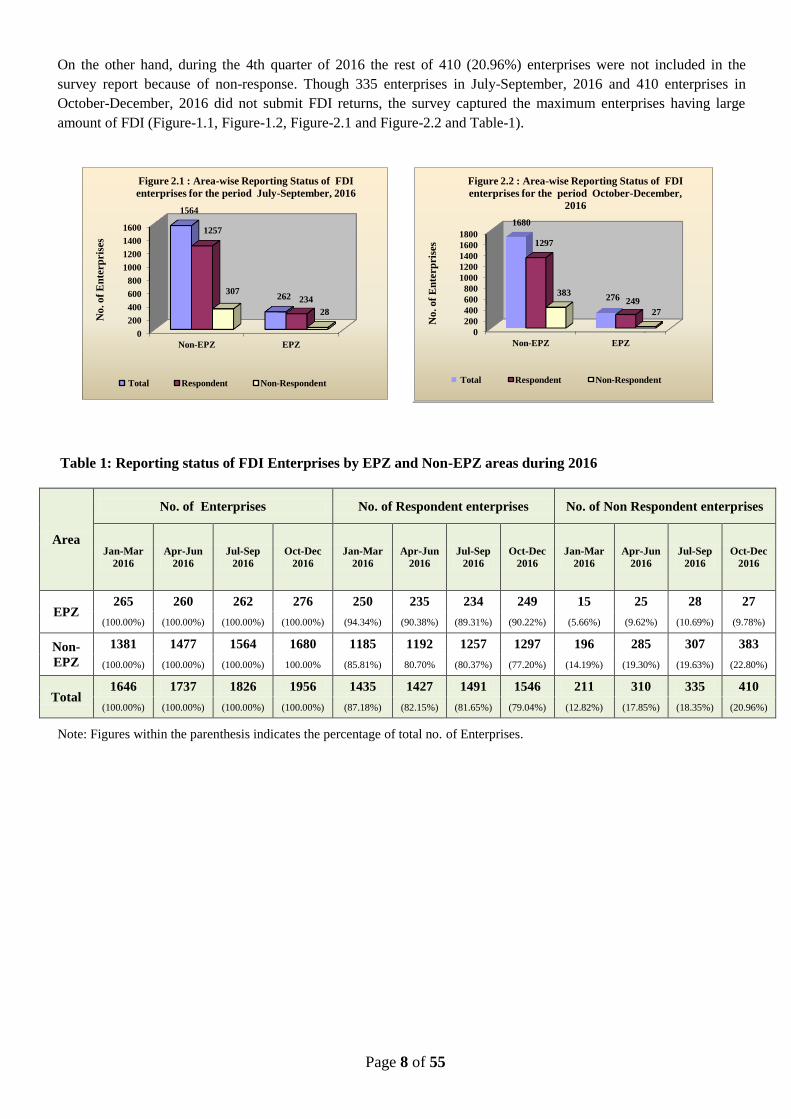
On the other hand, during the 4th quarter of 2016 the rest of 410 (20.96%) enterprises were not included in the
survey report because of non-response. Though 335 enterprises in July-September, 2016 and 410 enterprises in
October-December, 2016 did not submit FDI returns, the survey captured the maximum enterprises having large
amount of FDI (Figure-1.1, Figure-1.2, Figure-2.1 and Figure-2.2 and Table-1).
Table 1: Reporting status of FDI Enterprises by EPZ and Non-EPZ areas during 2016
Area
No. of Enterprises No. of Respondent enterprises No. of Non Respondent enterprises
Jan-Mar
2016
Apr-Jun
2016
Jul-Sep
2016
Oct-Dec
2016
Jan-Mar
2016
Apr-Jun
2016
Jul-Sep
2016
Oct-Dec
2016
Jan-Mar
2016
Apr-Jun
2016
Jul-Sep
2016
Oct-Dec
2016
EPZ 265 260 262 276 250 235 234 249 15 25 28 27
(100.00%) (100.00%) (100.00%) (100.00%) (94.34%) (90.38%) (89.31%) (90.22%) (5.66%) (9.62%) (10.69%) (9.78%)
Non-
EPZ
1381 1477 1564 1680 1185 1192 1257 1297 196 285 307 383
(100.00%) (100.00%) (100.00%) 100.00% (85.81%) 80.70% (80.37%) (77.20%) (14.19%) (19.30%) (19.63%) (22.80%)
Total 1646 1737 1826 1956 1435 1427 1491 1546 211 310 335 410
(100.00%) (100.00%) (100.00%) (100.00%) (87.18%) (82.15%) (81.65%) (79.04%) (12.82%) (17.85%) (18.35%) (20.96%)
Note: Figures within the parenthesis indicates the percentage of total no. of Enterprises.
0
200
400
600
800
1000
1200
1400
1600
Non-EPZ EPZ
1564
262
1257
234 307
28
No
. o
f E
nte
rp
ris
es
Figure 2.1 : Area-wise Reporting Status of FDI
enterprises for the period July-September, 2016
Total Respondent Non-Respondent
0
200
400
600
800
1000
1200
1400
1600
1800
Non-EPZ EPZ
1680
276
1297
249 383
27
No
. o
f E
nte
rp
ris
es
Figure 2.2 : Area-wise Reporting Status of FDI
enterprises for the period October-December,
2016
Total Respondent Non-Respondent
Page 9 of 55
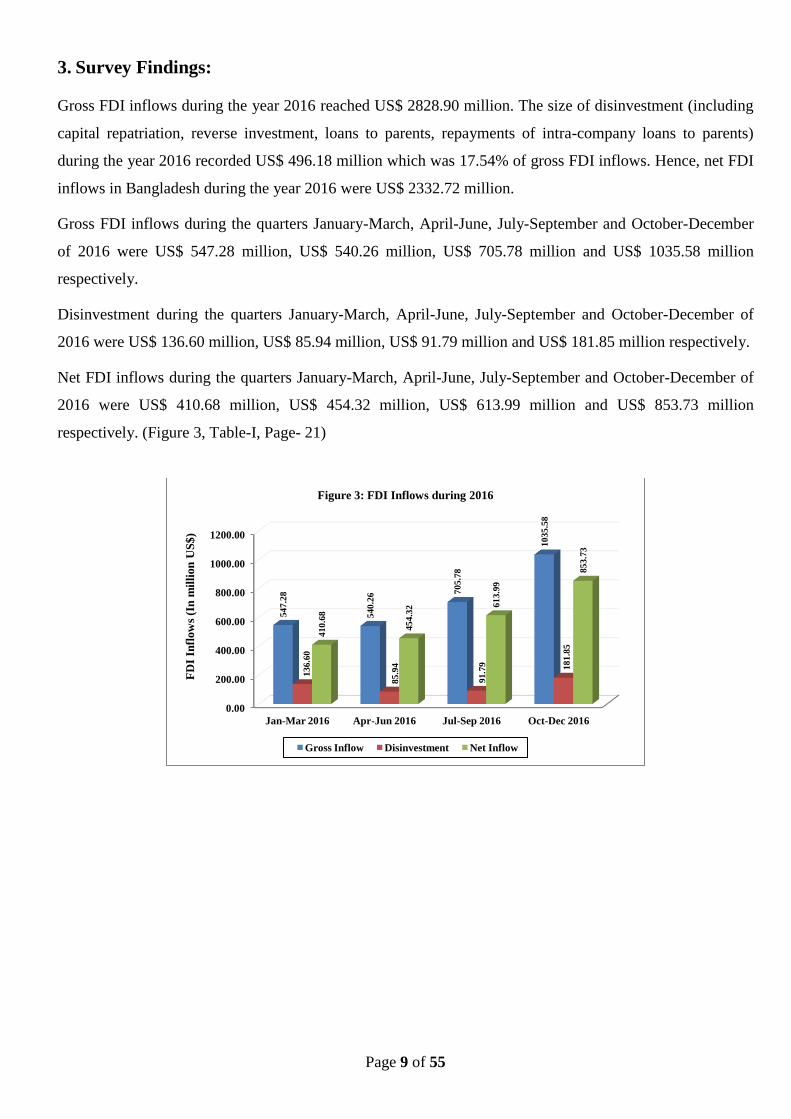
3. Survey Findings:
Gross FDI inflows during the year 2016 reached US$ 2828.90 million. The size of disinvestment (including
capital repatriation, reverse investment, loans to parents, repayments of intra-company loans to parents)
during the year 2016 recorded US$ 496.18 million which was 17.54% of gross FDI inflows. Hence, net FDI
inflows in Bangladesh during the year 2016 were US$ 2332.72 million.
Gross FDI inflows during the quarters January-March, April-June, July-September and October-December
of 2016 were US$ 547.28 million, US$ 540.26 million, US$ 705.78 million and US$ 1035.58 million
respectively.
Disinvestment during the quarters January-March, April-June, July-September and October-December of
2016 were US$ 136.60 million, US$ 85.94 million, US$ 91.79 million and US$ 181.85 million respectively.
Net FDI inflows during the quarters January-March, April-June, July-September and October-December of
2016 were US$ 410.68 million, US$ 454.32 million, US$ 613.99 million and US$ 853.73 million
respectively. (Figure 3, Table-I, Page- 21)
0.00
200.00
400.00
600.00
800.00
1000.00
1200.00
Jan-Mar 2016 Apr-Jun 2016 Jul-Sep 2016 Oct-Dec 2016
54
7.2
8
54
0.2
6 70
5.7
8
10
35
.58
13
6.6
0
85
.94
91
.79
18
1.8
5
41
0.6
8
45
4.3
2 61
3.9
9
85
3.7
3
FD
I In
flow
s (I
n m
illi
on
US
$)
Figure 3: FDI Inflows during 2016
Gross Inflow Disinvestment Net Inflow
Page 10 of 55
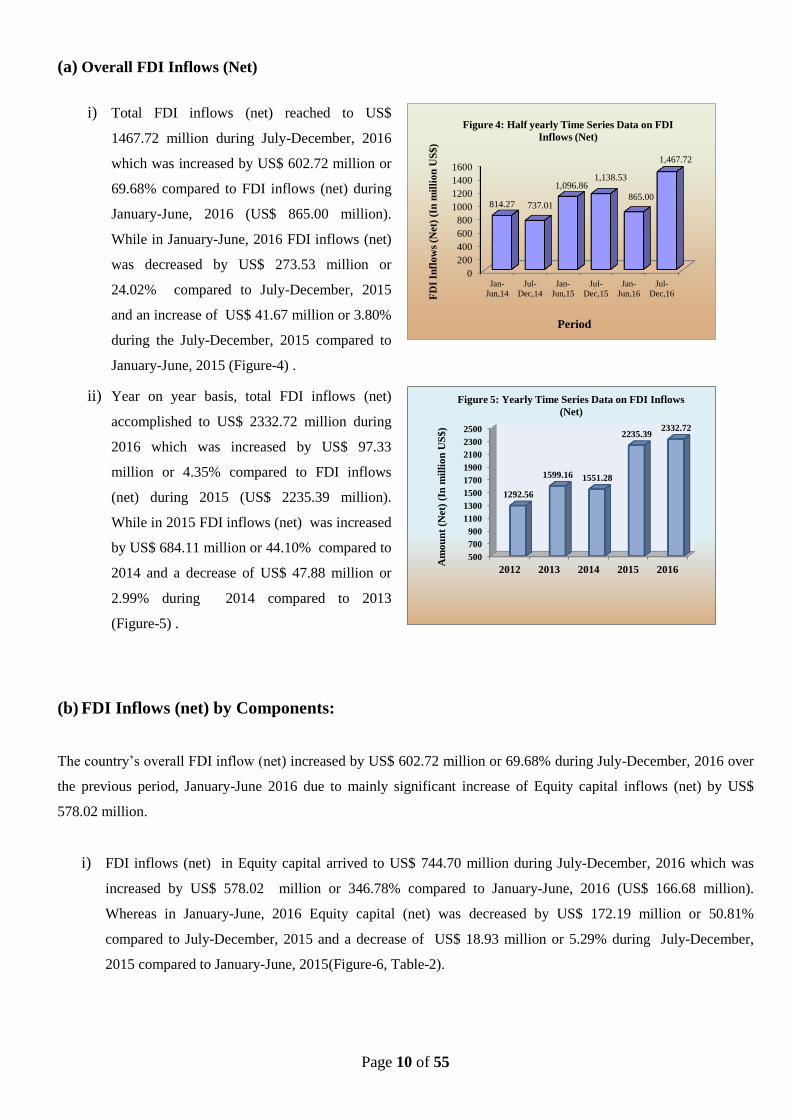
(a) Overall FDI Inflows (Net)
i) Total FDI inflows (net) reached to US$
1467.72 million during July-December, 2016
which was increased by US$ 602.72 million or
69.68% compared to FDI inflows (net) during
January-June, 2016 (US$ 865.00 million).
While in January-June, 2016 FDI inflows (net)
was decreased by US$ 273.53 million or
24.02% compared to July-December, 2015
and an increase of US$ 41.67 million or 3.80%
during the July-December, 2015 compared to
January-June, 2015 (Figure-4) .
ii) Year on year basis, total FDI inflows (net)
accomplished to US$ 2332.72 million during
2016 which was increased by US$ 97.33
million or 4.35% compared to FDI inflows
(net) during 2015 (US$ 2235.39 million).
While in 2015 FDI inflows (net) was increased
by US$ 684.11 million or 44.10% compared to
2014 and a decrease of US$ 47.88 million or
2.99% during 2014 compared to 2013
(Figure-5) .
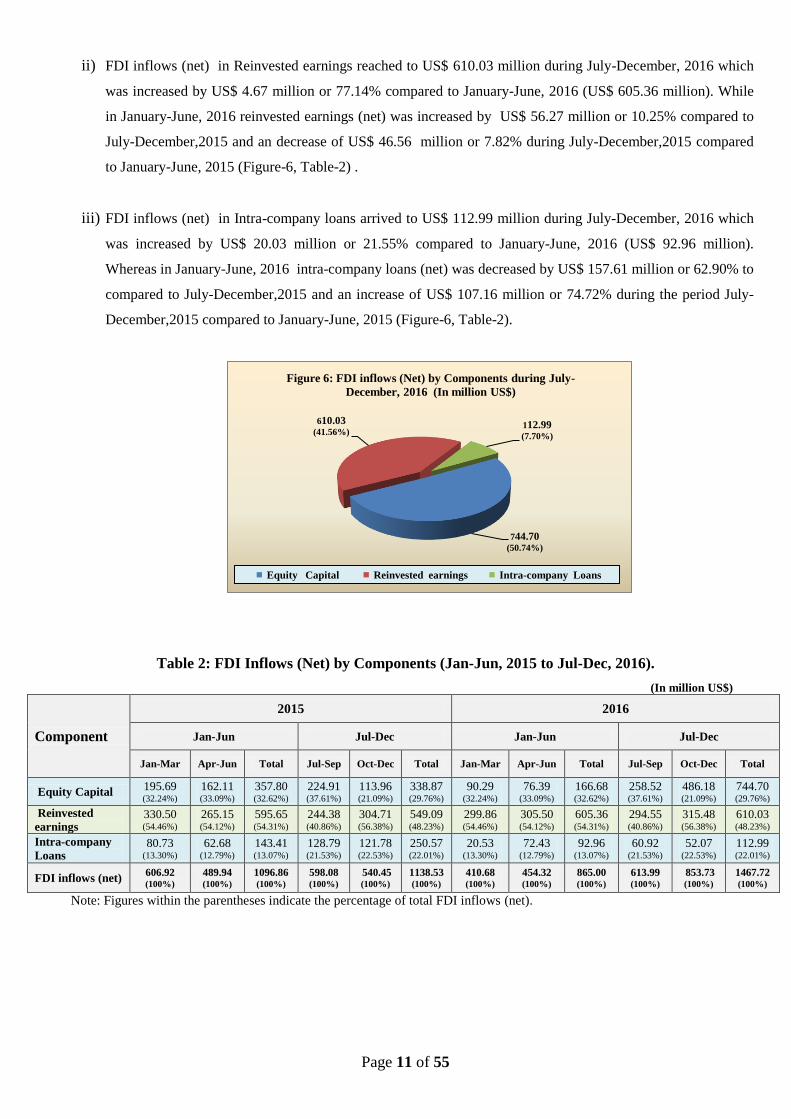
(b) FDI Inflows (net) by Components:
The country’s overall FDI inflow (net) increased by US$ 602.72 million or 69.68% during July-December, 2016 over
the previous period, January-June 2016 due to mainly significant increase of Equity capital inflows (net) by US$
578.02 million.
i) FDI inflows (net) in Equity capital arrived to US$ 744.70 million during July-December, 2016 which was
increased by US$ 578.02 million or 346.78% compared to January-June, 2016 (US$ 166.68 million).
Whereas in January-June, 2016 Equity capital (net) was decreased by US$ 172.19 million or 50.81%
compared to July-December, 2015 and a decrease of US$ 18.93 million or 5.29% during July-December,
2015 compared to January-June, 2015(Figure-6, Table-2).
0
200
400
600
800
1000
1200
1400
1600
Jan-
Jun,14
Jul-
Dec,14
Jan-
Jun,15
Jul-
Dec,15
Jan-
Jun,16
Jul-
Dec,16
814.27 737.01
1,096.86 1,138.53
865.00
1,467.72
FD
I In
flo
ws
(Net)
(In
mil
lio
n U
S$
)
Period
Figure 4: Half yearly Time Series Data on FDI
Inflows (Net)
500
700
900
1100
1300
1500
1700
1900
2100
2300
2500
2012 2013 2014 2015 2016
1292.56
1599.16 1551.28
2235.39 2332.72
Am
ou
nt
(Net)
(In
mil
lio
n U
S$
)
Figure 5: Yearly Time Series Data on FDI Inflows
(Net)
Page 11 of 55
ii) FDI inflows (net) in Reinvested earnings reached to US$ 610.03 million during July-December, 2016 which
was increased by US$ 4.67 million or 77.14% compared to January-June, 2016 (US$ 605.36 million). While
in January-June, 2016 reinvested earnings (net) was increased by US$ 56.27 million or 10.25% compared to
July-December,2015 and an decrease of US$ 46.56 million or 7.82% during July-December,2015 compared
to January-June, 2015 (Figure-6, Table-2) .
iii) FDI inflows (net) in Intra-company loans arrived to US$ 112.99 million during July-December, 2016 which
was increased by US$ 20.03 million or 21.55% compared to January-June, 2016 (US$ 92.96 million).
Whereas in January-June, 2016 intra-company loans (net) was decreased by US$ 157.61 million or 62.90% to
compared to July-December,2015 and an increase of US$ 107.16 million or 74.72% during the period July-
December,2015 compared to January-June, 2015 (Figure-6, Table-2).
Table 2: FDI Inflows (Net) by Components (Jan-Jun, 2015 to Jul-Dec, 2016).
(In million US$)
Component
2015 2016
Jan-Jun Jul-Dec Jan-Jun Jul-Dec
Jan-Mar Apr-Jun Total Jul-Sep Oct-Dec Total Jan-Mar Apr-Jun Total Jul-Sep Oct-Dec Total
Equity Capital 195.69 (32.24%)
162.11 (33.09%)
357.80 (32.62%)
224.91 (37.61%)
113.96 (21.09%)
338.87 (29.76%)
90.29 (32.24%)
76.39 (33.09%)
166.68 (32.62%)
258.52 (37.61%)
486.18 (21.09%)
744.70 (29.76%)
Reinvested
earnings 330.50 (54.46%)
265.15 (54.12%)
595.65 (54.31%)
244.38 (40.86%)
304.71 (56.38%)
549.09 (48.23%)
299.86 (54.46%)
305.50 (54.12%)
605.36 (54.31%)
294.55 (40.86%)
315.48 (56.38%)
610.03 (48.23%)
Intra-company
Loans 80.73
(13.30%)
62.68 (12.79%)
143.41 (13.07%)
128.79 (21.53%)
121.78 (22.53%)
250.57 (22.01%)
20.53 (13.30%)
72.43 (12.79%)
92.96 (13.07%)
60.92 (21.53%)
52.07 (22.53%)
112.99 (22.01%)
FDI inflows (net) 606.92 (100%)
489.94 (100%)
1096.86 (100%)
598.08 (100%)
540.45 (100%)
1138.53 (100%)
410.68 (100%)
454.32 (100%)
865.00 (100%)
613.99 (100%)
853.73 (100%)
1467.72 (100%)
Note: Figures within the parentheses indicate the percentage of total FDI inflows (net).
744.70
(50.74%)
610.03
(41.56%) 112.99
(7.70%)
Figure 6: FDI inflows (Net) by Components during July-
December, 2016 (In million US$)
Equity Capital Reinvested earnings Intra-company Loans
Page 12 of 55
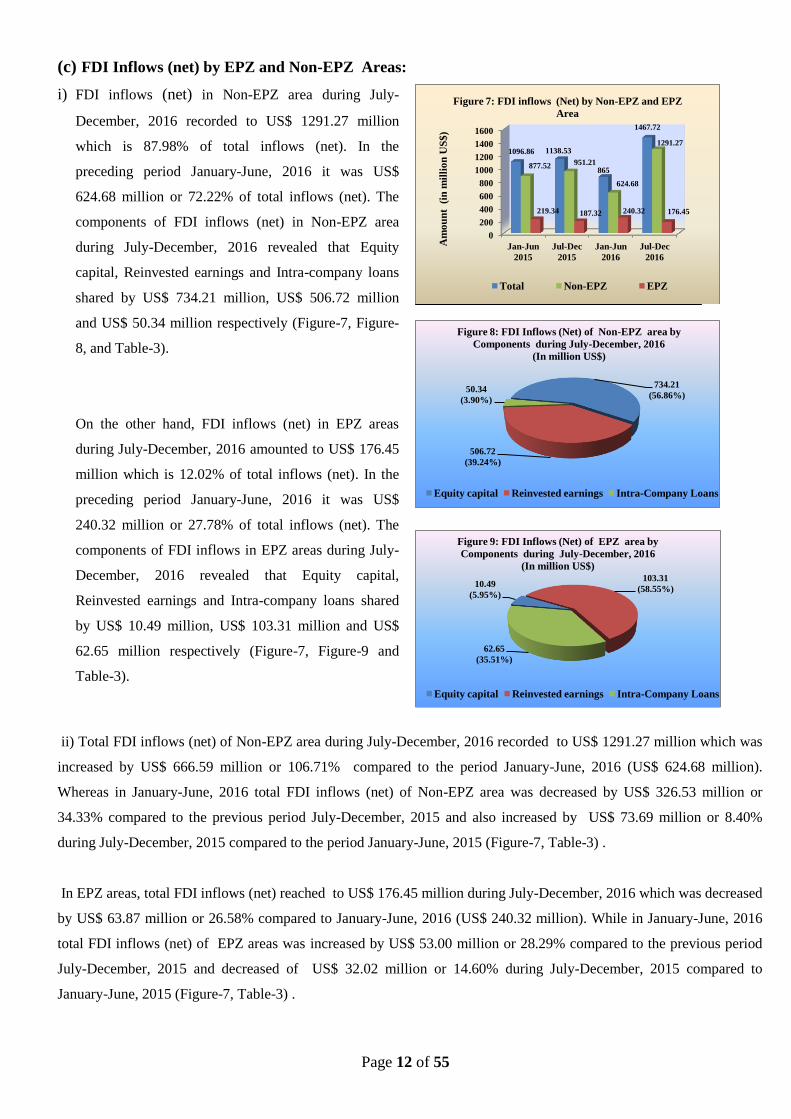
(c) FDI Inflows (net) by EPZ and Non-EPZ Areas:
i) FDI inflows (net) in Non-EPZ area during July-
December, 2016 recorded to US$ 1291.27 million
which is 87.98% of total inflows (net). In the
preceding period January-June, 2016 it was US$
624.68 million or 72.22% of total inflows (net). The
components of FDI inflows (net) in Non-EPZ area
during July-December, 2016 revealed that Equity
capital, Reinvested earnings and Intra-company loans
shared by US$ 734.21 million, US$ 506.72 million
and US$ 50.34 million respectively (Figure-7, Figure-
8, and Table-3).
On the other hand, FDI inflows (net) in EPZ areas
during July-December, 2016 amounted to US$ 176.45
million which is 12.02% of total inflows (net). In the
preceding period January-June, 2016 it was US$
240.32 million or 27.78% of total inflows (net). The
components of FDI inflows in EPZ areas during July-
December, 2016 revealed that Equity capital,
Reinvested earnings and Intra-company loans shared
by US$ 10.49 million, US$ 103.31 million and US$
62.65 million respectively (Figure-7, Figure-9 and
Table-3).
ii) Total FDI inflows (net) of Non-EPZ area during July-December, 2016 recorded to US$ 1291.27 million which was
increased by US$ 666.59 million or 106.71% compared to the period January-June, 2016 (US$ 624.68 million).
Whereas in January-June, 2016 total FDI inflows (net) of Non-EPZ area was decreased by US$ 326.53 million or
34.33% compared to the previous period July-December, 2015 and also increased by US$ 73.69 million or 8.40%
during July-December, 2015 compared to the period January-June, 2015 (Figure-7, Table-3) .
In EPZ areas, total FDI inflows (net) reached to US$ 176.45 million during July-December, 2016 which was decreased
by US$ 63.87 million or 26.58% compared to January-June, 2016 (US$ 240.32 million). While in January-June, 2016
total FDI inflows (net) of EPZ areas was increased by US$ 53.00 million or 28.29% compared to the previous period
July-December, 2015 and decreased of US$ 32.02 million or 14.60% during July-December, 2015 compared to
January-June, 2015 (Figure-7, Table-3) .
0
200
400
600
800
1000
1200
1400
1600
Jan-Jun
2015
Jul-Dec
2015
Jan-Jun
2016
Jul-Dec
2016
1096.86 1138.53
865
1467.72
877.52 951.21
624.68
1291.27
219.34 187.32 240.32 176.45
Am
ou
nt
(in
mil
lio
n U
S$
)
Figure 7: FDI inflows (Net) by Non-EPZ and EPZ
Area
Total Non-EPZ EPZ
734.21
(56.86%)
506.72
(39.24%)
50.34
(3.90%)
Figure 8: FDI Inflows (Net) of Non-EPZ area by
Components during July-December, 2016
(In million US$)
Equity capital Reinvested earnings Intra-Company Loans
10.49
(5.95%)
103.31
(58.55%)
62.65
(35.51%)
Figure 9: FDI Inflows (Net) of EPZ area by
Components during July-December, 2016
(In million US$)
Equity capital Reinvested earnings Intra-Company Loans
Page 13 of 55
Table 3: FDI Inflows (Net) by Areas and Components (Jan-Jun, 2015 to Jul-Dec, 2016)
(In million US$)
ITEM
Non-EPZ EPZ
Jan-Jun'15 Jul-Dec'15 Jan-Jun'16 Jul-Dec'16 Jan-Jun'15 Jul-Dec'15 Jan-Jun'16 Jul-Dec'16
Equity Capital 347.10 324.37 151.85 734.21 10.70 14.50 14.83 10.49
Reinvested
earnings 449.28 437.06 475.22 506.72 146.37 112.03 130.14 103.31
Intra-company
Loans 81.14 189.78 -2.39 50.34 62.27 60.79 95.35 62.65
FDI inflows (Net) 877.52 951.21 624.68 1291.27 219.34 187.32 240.32 176.45
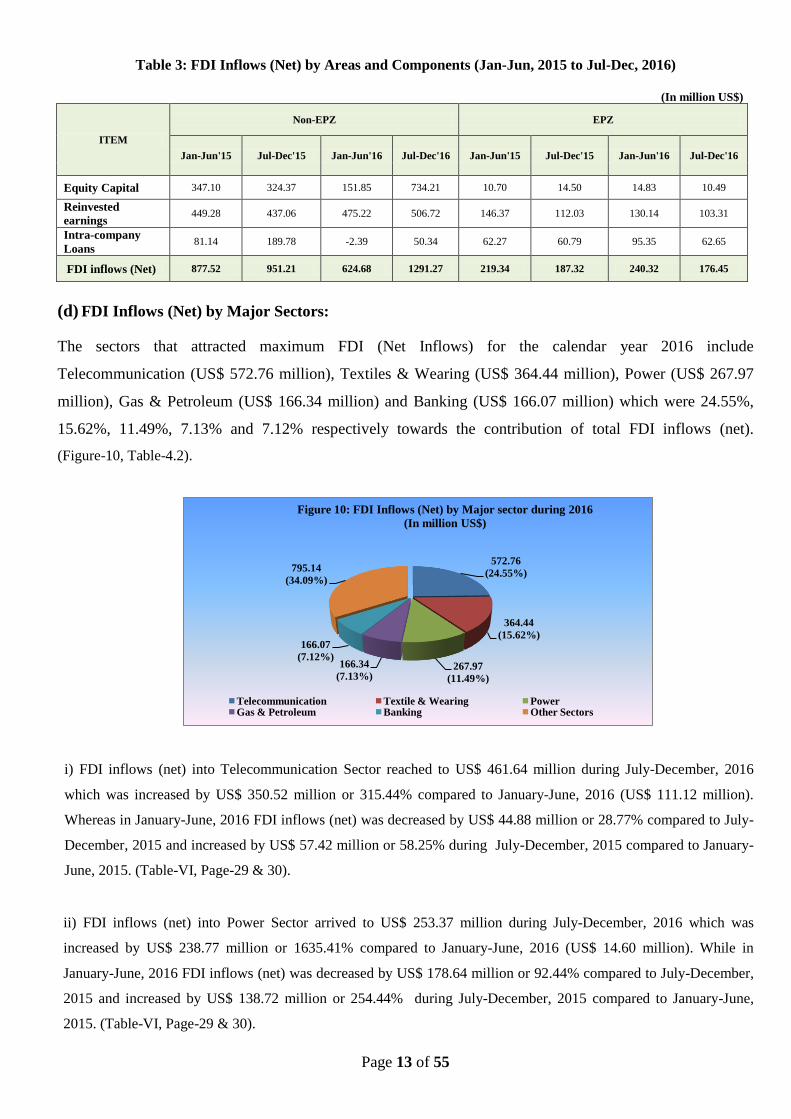
(d) FDI Inflows (Net) by Major Sectors:
The sectors that attracted maximum FDI (Net Inflows) for the calendar year 2016 include
Telecommunication (US$ 572.76 million), Textiles & Wearing (US$ 364.44 million), Power (US$ 267.97
million), Gas & Petroleum (US$ 166.34 million) and Banking (US$ 166.07 million) which were 24.55%,
15.62%, 11.49%, 7.13% and 7.12% respectively towards the contribution of total FDI inflows (net).
(Figure-10, Table-4.2).
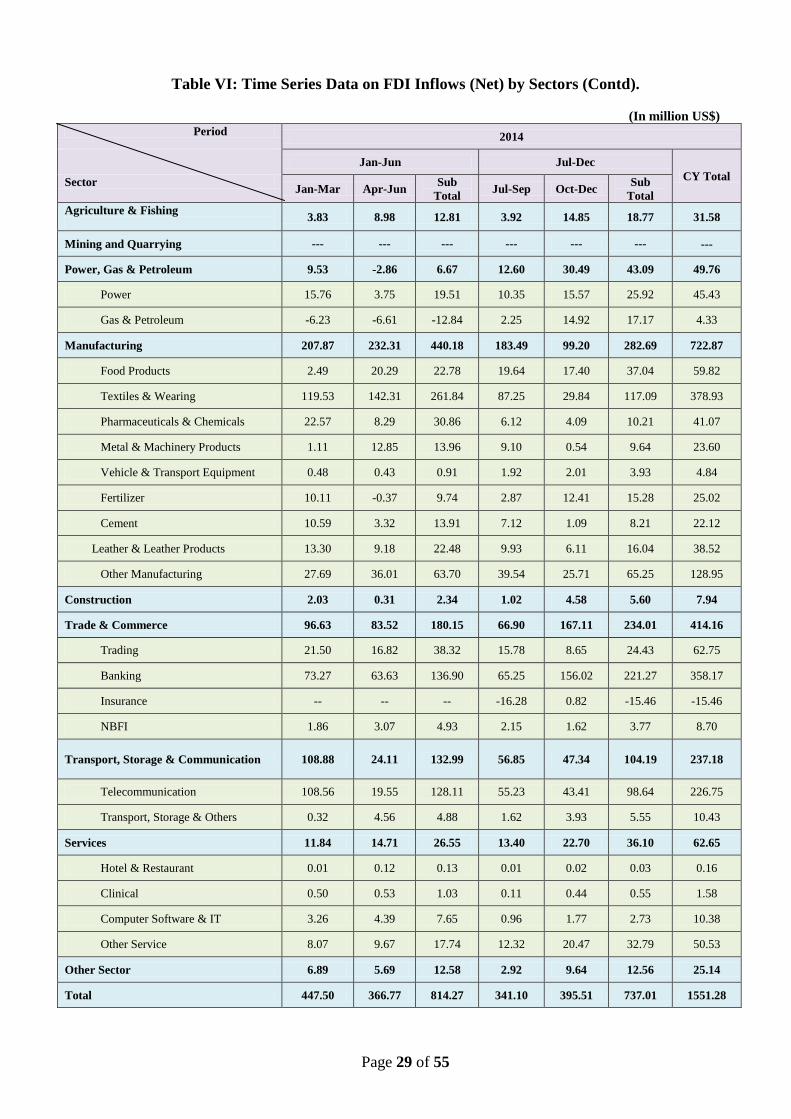
i) i) FDI inflows (net) into Telecommunication Sector reached to US$ 461.64 million during July-December, 2016
which was increased by US$ 350.52 million or 315.44% compared to January-June, 2016 (US$ 111.12 million).
Whereas in January-June, 2016 FDI inflows (net) was decreased by US$ 44.88 million or 28.77% compared to July-
December, 2015 and increased by US$ 57.42 million or 58.25% during July-December, 2015 compared to January-
June, 2015. (Table-VI, Page-29 & 30).
ii)
ii) FDI inflows (net) into Power Sector arrived to US$ 253.37 million during July-December, 2016 which was
increased by US$ 238.77 million or 1635.41% compared to January-June, 2016 (US$ 14.60 million). While in
January-June, 2016 FDI inflows (net) was decreased by US$ 178.64 million or 92.44% compared to July-December,
2015 and increased by US$ 138.72 million or 254.44% during July-December, 2015 compared to January-June,
2015. (Table-VI, Page-29 & 30).
572.76
(24.55%)
364.44
(15.62%)
267.97
(11.49%)
166.34
(7.13%)
166.07
(7.12%)
795.14
(34.09%)
Figure 10: FDI Inflows (Net) by Major sector during 2016
(In million US$)
Telecommunication Textile & Wearing Power Gas & Petroleum Banking Other Sectors
Page 14 of 55
iii) FDI inflows (net) into Textile & Wearing Sector achieved to US$ 176.78 million during July-December, 2016
which was decreased by US$ 10.88 million or 5.80% compared to January-June, 2016 (US$ 187.66 million). While
in January-June, 2016 FDI inflows (net) Sector was decreased by US$ 20.73 million or 9.95% compared to July-
December, 2015 and decreased by US$ 26.14 million or 11.15% during the period July-December, 2015 compared to
January-June, 2015. (Table-VI, Page-29 & 30).
iv) FDI inflows (net) into Gas & Petroleum Sector arrived to US$ 87.49 million during July-December, 2016 which
was increased by US$ 8.64 million or 10.96% compared to January-June, 2016 (US$ 78.85 million). Whereas in
January-June, 2016 FDI inflows (net) was decreased by US$ 64.62 million or 45.04% compared to July-December,
2015 and decreased by US$ 38.90 million or 21.33% during the period July-December, 2015 compared to January-
June, 2015. (Table-VI, Page-29 & 30)
v) FDI inflows (net) into Trading sector achieved to US$ 67.90 million during July-December, 2016 which was
increased by US$ 47.41 million or 231.38% compared to January-June, 2016 (US$ 20.49 million). While FDI
inflows (net) was decreased by US$ 1.55 million or 7.03% compared to July-December, 2015 and decreased by
US$ 36.89 million or 62.60% during the period July-December, 2015 compared to January-June, 2015.
(Table-VI, Page-29 & 30).
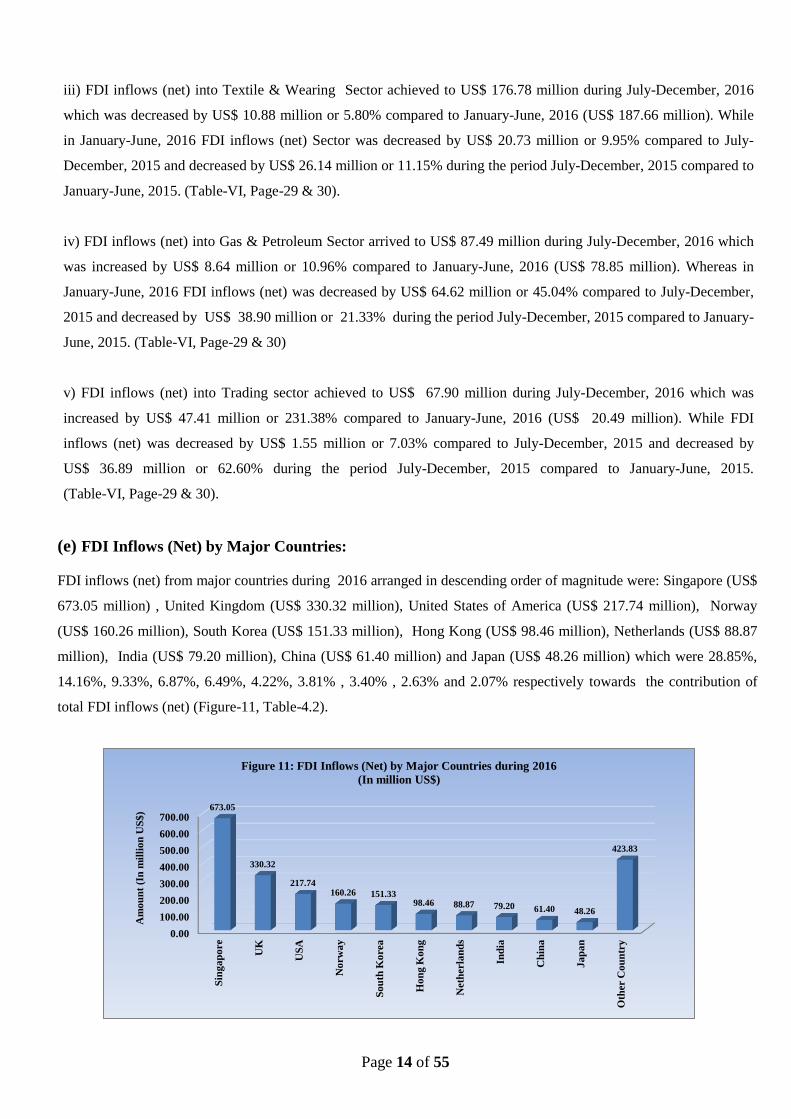
(e) FDI Inflows (Net) by Major Countries:
FDI inflows (net) from major countries during 2016 arranged in descending order of magnitude were: Singapore (US$
673.05 million) , United Kingdom (US$ 330.32 million), United States of America (US$ 217.74 million), Norway
(US$ 160.26 million), South Korea (US$ 151.33 million), Hong Kong (US$ 98.46 million), Netherlands (US$ 88.87
million), India (US$ 79.20 million), China (US$ 61.40 million) and Japan (US$ 48.26 million) which were 28.85%,
14.16%, 9.33%, 6.87%, 6.49%, 4.22%, 3.81% , 3.40% , 2.63% and 2.07% respectively towards the contribution of
total FDI inflows (net) (Figure-11, Table-4.2).
0.00
100.00
200.00
300.00
400.00
500.00
600.00
700.00
Sin
ga
po
re
UK
US
A
No
rw
ay
So
uth
Ko
rea
Ho
ng
Ko
ng
Neth
erla
nd
s
Ind
ia
Ch
ina
Ja
pa
n
Oth
er C
ou
ntr
y
673.05
330.32
217.74 160.26 151.33
98.46 88.87 79.20 61.40 48.26
423.83
Am
ou
nt
(In
mil
lio
n U
S$
)
Figure 11: FDI Inflows (Net) by Major Countries during 2016
(In million US$)
Page 15 of 55
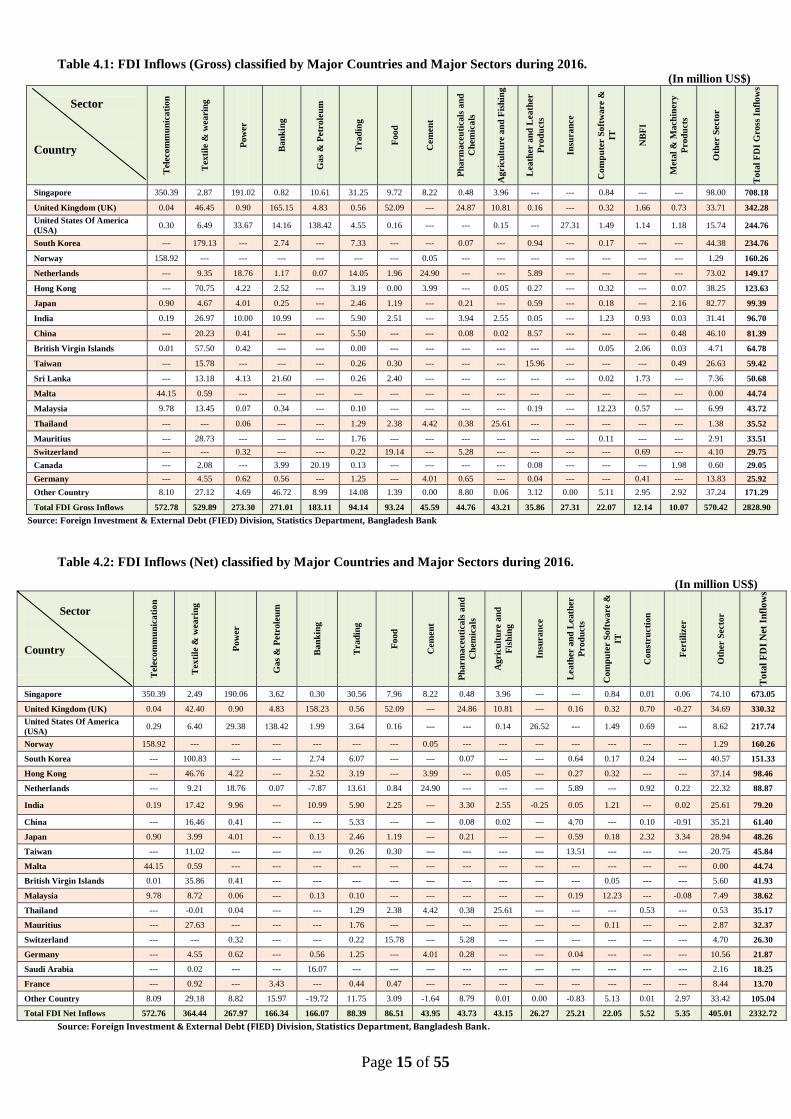
Table 4.1: FDI Inflows (Gross) classified by Major Countries and Major Sectors during 2016. (In million US$)
Sector
Country
Tele
com
mu
nic
ati
on
Texti
le &
wearin
g
Pow
er
Ban
kin
g
Gas
& P
etr
ole
um
Trad
ing
Food
Cem
en
t
Ph
arm
aceu
tica
ls a
nd
Ch
emic
als
Agric
ult
ure a
nd
Fis
hin
g
Leath
er a
nd
Leath
er
Prod
ucts
Insu
ran
ce
Com
pu
ter S
oft
ware &
IT
NB
FI
Meta
l &
Mach
inery
Prod
ucts
Oth
er S
ecto
r
Tota
l F
DI
Gro
ss I
nfl
ow
s
Singapore 350.39 2.87 191.02 0.82 10.61 31.25 9.72 8.22 0.48 3.96 --- --- 0.84 --- --- 98.00 708.18
United Kingdom (UK) 0.04 46.45 0.90 165.15 4.83 0.56 52.09 --- 24.87 10.81 0.16 --- 0.32 1.66 0.73 33.71 342.28
United States Of America
(USA) 0.30 6.49 33.67 14.16 138.42 4.55 0.16 --- --- 0.15 --- 27.31 1.49 1.14 1.18 15.74 244.76
South Korea --- 179.13 --- 2.74 --- 7.33 --- --- 0.07 --- 0.94 --- 0.17 --- --- 44.38 234.76
Norway 158.92 --- --- --- --- --- --- 0.05 --- --- --- --- --- --- --- 1.29 160.26
Netherlands --- 9.35 18.76 1.17 0.07 14.05 1.96 24.90 --- --- 5.89 --- --- --- --- 73.02 149.17
Hong Kong --- 70.75 4.22 2.52 --- 3.19 0.00 3.99 --- 0.05 0.27 --- 0.32 --- 0.07 38.25 123.63
Japan 0.90 4.67 4.01 0.25 --- 2.46 1.19 --- 0.21 --- 0.59 --- 0.18 --- 2.16 82.77 99.39
India 0.19 26.97 10.00 10.99 --- 5.90 2.51 --- 3.94 2.55 0.05 --- 1.23 0.93 0.03 31.41 96.70
China --- 20.23 0.41 --- --- 5.50 --- --- 0.08 0.02 8.57 --- --- --- 0.48 46.10 81.39
British Virgin Islands 0.01 57.50 0.42 --- --- 0.00 --- --- --- --- --- --- 0.05 2.06 0.03 4.71 64.78
Taiwan --- 15.78 --- --- --- 0.26 0.30 --- --- --- 15.96 --- --- --- 0.49 26.63 59.42
Sri Lanka --- 13.18 4.13 21.60 --- 0.26 2.40 --- --- --- --- --- 0.02 1.73 --- 7.36 50.68
Malta 44.15 0.59 --- --- --- --- --- --- --- --- --- --- --- --- --- 0.00 44.74
Malaysia 9.78 13.45 0.07 0.34 --- 0.10 --- --- --- --- 0.19 --- 12.23 0.57 --- 6.99 43.72
Thailand --- --- 0.06 --- --- 1.29 2.38 4.42 0.38 25.61 --- --- --- --- --- 1.38 35.52
Mauritius --- 28.73 --- --- --- 1.76 --- --- --- --- --- --- 0.11 --- --- 2.91 33.51
Switzerland --- --- 0.32 --- --- 0.22 19.14 --- 5.28 --- --- --- --- 0.69 --- 4.10 29.75
Canada --- 2.08 --- 3.99 20.19 0.13 --- --- --- --- 0.08 --- --- --- 1.98 0.60 29.05
Germany --- 4.55 0.62 0.56 --- 1.25 --- 4.01 0.65 --- 0.04 --- --- 0.41 --- 13.83 25.92
Other Country 8.10 27.12 4.69 46.72 8.99 14.08 1.39 0.00 8.80 0.06 3.12 0.00 5.11 2.95 2.92 37.24 171.29
Total FDI Gross Inflows 572.78 529.89 273.30 271.01 183.11 94.14 93.24 45.59 44.76 43.21 35.86 27.31 22.07 12.14 10.07 570.42 2828.90
Source: Foreign Investment & External Debt (FIED) Division, Statistics Department, Bangladesh Bank
Table 4.2: FDI Inflows (Net) classified by Major Countries and Major Sectors during 2016.
(In million US$)
Sector
Country
Tele
co
mm
un
ica
tio
n
Tex
tile
& w
ea
rin
g
Po
wer
Ga
s &
Petr
ole
um
Ba
nk
ing
Tra
din
g
Fo
od
Cem
en
t
Ph
arm
aceu
tica
ls a
nd
Ch
emic
als
Ag
ric
ult
ure a
nd
Fis
hin
g
Insu
ra
nce
Lea
ther a
nd
Lea
ther
Pro
du
cts
Co
mp
ute
r S
oft
wa
re &
IT
Co
nst
ru
cti
on
Ferti
lize
r
Oth
er S
ecto
r
To
tal
FD
I N
et I
nfl
ow
s
Singapore 350.39 2.49 190.06 3.62 0.30 30.56 7.96 8.22 0.48 3.96 --- --- 0.84 0.01 0.06 74.10 673.05
United Kingdom (UK) 0.04 42.40 0.90 4.83 158.23 0.56 52.09 --- 24.86 10.81 --- 0.16 0.32 0.70 -0.27 34.69 330.32
United States Of America
(USA) 0.29 6.40 29.38 138.42 1.99 3.64 0.16 --- --- 0.14 26.52 --- 1.49 0.69 --- 8.62 217.74
Norway 158.92 --- --- --- --- --- --- 0.05 --- --- --- --- --- --- --- 1.29 160.26
South Korea --- 100.83 --- --- 2.74 6.07 --- --- 0.07 --- --- 0.64 0.17 0.24 --- 40.57 151.33
Hong Kong --- 46.76 4.22 --- 2.52 3.19 --- 3.99 --- 0.05 --- 0.27 0.32 --- --- 37.14 98.46
Netherlands --- 9.21 18.76 0.07 -7.87 13.61 0.84 24.90 --- --- --- 5.89 --- 0.92 0.22 22.32 88.87
India 0.19 17.42 9.96 --- 10.99 5.90 2.25 --- 3.30 2.55 -0.25 0.05 1.21 --- 0.02 25.61 79.20
China --- 16.46 0.41 --- --- 5.33 --- --- 0.08 0.02 --- 4.70 --- 0.10 -0.91 35.21 61.40
Japan 0.90 3.99 4.01 --- 0.13 2.46 1.19 --- 0.21 --- --- 0.59 0.18 2.32 3.34 28.94 48.26
Taiwan --- 11.02 --- --- --- 0.26 0.30 --- --- --- --- 13.51 --- --- --- 20.75 45.84
Malta 44.15 0.59 --- --- --- --- --- --- --- --- --- --- --- --- --- 0.00 44.74
British Virgin Islands 0.01 35.86 0.41 --- --- --- --- --- --- --- --- --- 0.05 --- --- 5.60 41.93
Malaysia 9.78 8.72 0.06 --- 0.13 0.10 --- --- --- --- --- 0.19 12.23 --- -0.08 7.49 38.62
Thailand --- -0.01 0.04 --- --- 1.29 2.38 4.42 0.38 25.61 --- --- --- 0.53 --- 0.53 35.17
Mauritius --- 27.63 --- --- --- 1.76 --- --- --- --- --- --- 0.11 --- --- 2.87 32.37
Switzerland --- --- 0.32 --- --- 0.22 15.78 --- 5.28 --- --- --- --- --- --- 4.70 26.30
Germany --- 4.55 0.62 --- 0.56 1.25 --- 4.01 0.28 --- --- 0.04 --- --- --- 10.56 21.87
Saudi Arabia --- 0.02 --- --- 16.07 --- --- --- --- --- --- --- --- --- --- 2.16 18.25
France --- 0.92 --- 3.43 --- 0.44 0.47 --- --- --- --- --- --- --- --- 8.44 13.70
Other Country 8.09 29.18 8.82 15.97 -19.72 11.75 3.09 -1.64 8.79 0.01 0.00 -0.83 5.13 0.01 2.97 33.42 105.04
Total FDI Net Inflows 572.76 364.44 267.97 166.34 166.07 88.39 86.51 43.95 43.73 43.15 26.27 25.21 22.05 5.52 5.35 405.01 2332.72
Source: Foreign Investment & External Debt (FIED) Division, Statistics Department, Bangladesh Bank.
Page 16 of 55
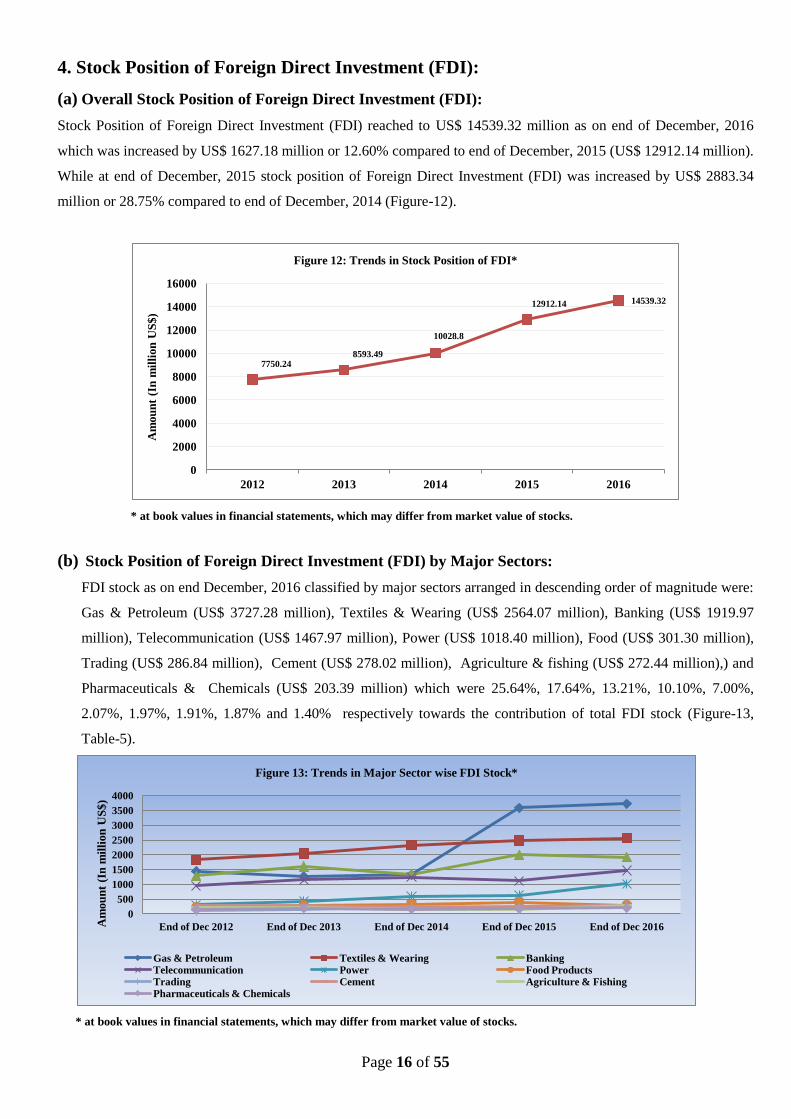
4. Stock Position of Foreign Direct Investment (FDI):
(a) Overall Stock Position of Foreign Direct Investment (FDI):
Stock Position of Foreign Direct Investment (FDI) reached to US$ 14539.32 million as on end of December, 2016
which was increased by US$ 1627.18 million or 12.60% compared to end of December, 2015 (US$ 12912.14 million).
While at end of December, 2015 stock position of Foreign Direct Investment (FDI) was increased by US$ 2883.34
million or 28.75% compared to end of December, 2014 (Figure-12).
* at book values in financial statements, which may differ from market value of stocks.
(b) Stock Position of Foreign Direct Investment (FDI) by Major Sectors:
FDI stock as on end December, 2016 classified by major sectors arranged in descending order of magnitude were:
Gas & Petroleum (US$ 3727.28 million), Textiles & Wearing (US$ 2564.07 million), Banking (US$ 1919.97
million), Telecommunication (US$ 1467.97 million), Power (US$ 1018.40 million), Food (US$ 301.30 million),
Trading (US$ 286.84 million), Cement (US$ 278.02 million), Agriculture & fishing (US$ 272.44 million),) and
Pharmaceuticals & Chemicals (US$ 203.39 million) which were 25.64%, 17.64%, 13.21%, 10.10%, 7.00%,
2.07%, 1.97%, 1.91%, 1.87% and 1.40% respectively towards the contribution of total FDI stock (Figure-13,
Table-5).
* at book values in financial statements, which may differ from market value of stocks.
7750.24 8593.49
10028.8
12912.14 14539.32
0
2000
4000
6000
8000
10000
12000
14000
16000
2012 2013 2014 2015 2016
Am
ou
nt
(In
mil
lion
US
$)
Figure 12: Trends in Stock Position of FDI*
0
500
1000
1500
2000
2500
3000
3500
4000
End of Dec 2012 End of Dec 2013 End of Dec 2014 End of Dec 2015 End of Dec 2016 Am
ou
nt
(In
mil
lion
US
$)
Figure 13: Trends in Major Sector wise FDI Stock*
Gas & Petroleum Textiles & Wearing Banking Telecommunication Power Food Products Trading Cement Agriculture & Fishing Pharmaceuticals & Chemicals
Page 17 of 55
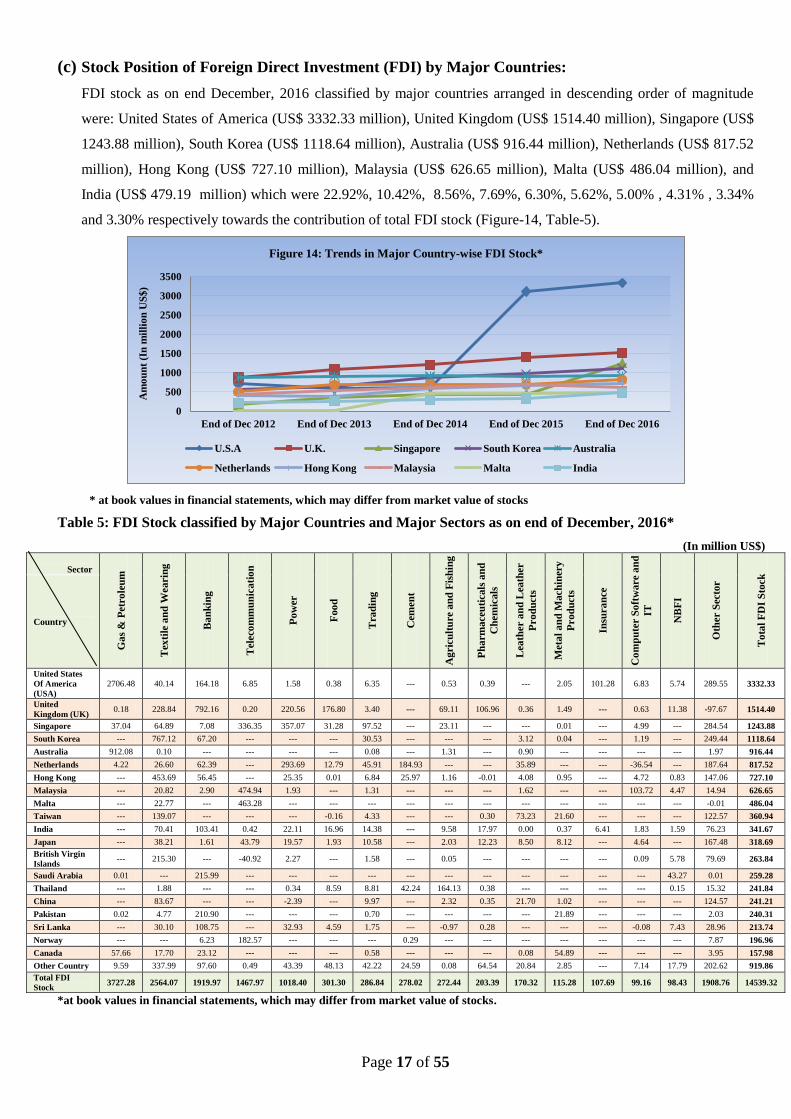
(c) Stock Position of Foreign Direct Investment (FDI) by Major Countries:
FDI stock as on end December, 2016 classified by major countries arranged in descending order of magnitude
were: United States of America (US$ 3332.33 million), United Kingdom (US$ 1514.40 million), Singapore (US$
1243.88 million), South Korea (US$ 1118.64 million), Australia (US$ 916.44 million), Netherlands (US$ 817.52
million), Hong Kong (US$ 727.10 million), Malaysia (US$ 626.65 million), Malta (US$ 486.04 million), and
India (US$ 479.19 million) which were 22.92%, 10.42%, 8.56%, 7.69%, 6.30%, 5.62%, 5.00% , 4.31% , 3.34%
and 3.30% respectively towards the contribution of total FDI stock (Figure-14, Table-5).
* at book values in financial statements, which may differ from market value of stocks
Table 5: FDI Stock classified by Major Countries and Major Sectors as on end of December, 2016*
(In million US$)
Sector
Ga
s &
Petr
ole
um
Tex
tile
an
d W
earin
g
Ba
nk
ing
Tele
com
mu
nic
ati
on
Po
wer
Foo
d
Tra
din
g
Cem
en
t
Ag
ric
ult
ure
an
d F
ish
ing
Ph
arm
aceu
ticals
an
d
Ch
em
icals
Lea
ther a
nd
Lea
ther
Pro
du
cts
Meta
l a
nd
Mach
iner
y
Pro
du
cts
Insu
ra
nce
Co
mp
ute
r S
oft
ware
an
d
IT
NB
FI
Oth
er S
ecto
r
To
tal
FD
I S
tock
Country
United States
Of America
(USA)
2706.48 40.14 164.18 6.85 1.58 0.38 6.35 --- 0.53 0.39 --- 2.05 101.28 6.83 5.74 289.55 3332.33
United
Kingdom (UK) 0.18 228.84 792.16 0.20 220.56 176.80 3.40 --- 69.11 106.96 0.36 1.49 --- 0.63 11.38 -97.67 1514.40
Singapore 37.04 64.89 7.08 336.35 357.07 31.28 97.52 --- 23.11 --- --- 0.01 --- 4.99 --- 284.54 1243.88
South Korea --- 767.12 67.20 --- --- --- 30.53 --- --- --- 3.12 0.04 --- 1.19 --- 249.44 1118.64
Australia 912.08 0.10 --- --- --- --- 0.08 --- 1.31 --- 0.90 --- --- --- --- 1.97 916.44
Netherlands 4.22 26.60 62.39 --- 293.69 12.79 45.91 184.93 --- --- 35.89 --- --- -36.54 --- 187.64 817.52
Hong Kong --- 453.69 56.45 --- 25.35 0.01 6.84 25.97 1.16 -0.01 4.08 0.95 --- 4.72 0.83 147.06 727.10
Malaysia --- 20.82 2.90 474.94 1.93 --- 1.31 --- --- --- 1.62 --- --- 103.72 4.47 14.94 626.65
Malta --- 22.77 --- 463.28 --- --- --- --- --- --- --- --- --- --- --- -0.01 486.04
Taiwan --- 139.07 --- --- --- -0.16 4.33 --- --- 0.30 73.23 21.60 --- --- --- 122.57 360.94
India --- 70.41 103.41 0.42 22.11 16.96 14.38 --- 9.58 17.97 0.00 0.37 6.41 1.83 1.59 76.23 341.67
Japan --- 38.21 1.61 43.79 19.57 1.93 10.58 --- 2.03 12.23 8.50 8.12 --- 4.64 --- 167.48 318.69
British Virgin
Islands --- 215.30 --- -40.92 2.27 --- 1.58 --- 0.05 --- --- --- --- 0.09 5.78 79.69 263.84
Saudi Arabia 0.01 --- 215.99 --- --- --- --- --- --- --- --- --- --- --- 43.27 0.01 259.28
Thailand --- 1.88 --- --- 0.34 8.59 8.81 42.24 164.13 0.38 --- --- --- --- 0.15 15.32 241.84
China --- 83.67 --- --- -2.39 --- 9.97 --- 2.32 0.35 21.70 1.02 --- --- --- 124.57 241.21
Pakistan 0.02 4.77 210.90 --- --- --- 0.70 --- --- --- --- 21.89 --- --- --- 2.03 240.31
Sri Lanka --- 30.10 108.75 --- 32.93 4.59 1.75 --- -0.97 0.28 --- --- --- -0.08 7.43 28.96 213.74
Norway --- --- 6.23 182.57 --- --- --- 0.29 --- --- --- --- --- --- --- 7.87 196.96
Canada 57.66 17.70 23.12 --- --- --- 0.58 --- --- --- 0.08 54.89 --- --- --- 3.95 157.98
Other Country 9.59 337.99 97.60 0.49 43.39 48.13 42.22 24.59 0.08 64.54 20.84 2.85 --- 7.14 17.79 202.62 919.86
Total FDI
Stock 3727.28 2564.07 1919.97 1467.97 1018.40 301.30 286.84 278.02 272.44 203.39 170.32 115.28 107.69 99.16 98.43 1908.76 14539.32
*at book values in financial statements, which may differ from market value of stocks.
0
500
1000
1500
2000
2500
3000
3500
End of Dec 2012 End of Dec 2013 End of Dec 2014 End of Dec 2015 End of Dec 2016
Am
ou
nt
(In
mil
lio
n U
S$
)
Figure 14: Trends in Major Country-wise FDI Stock*
U.S.A U.K. Singapore South Korea Australia
Netherlands Hong Kong Malaysia Malta India
Page 18 of 55
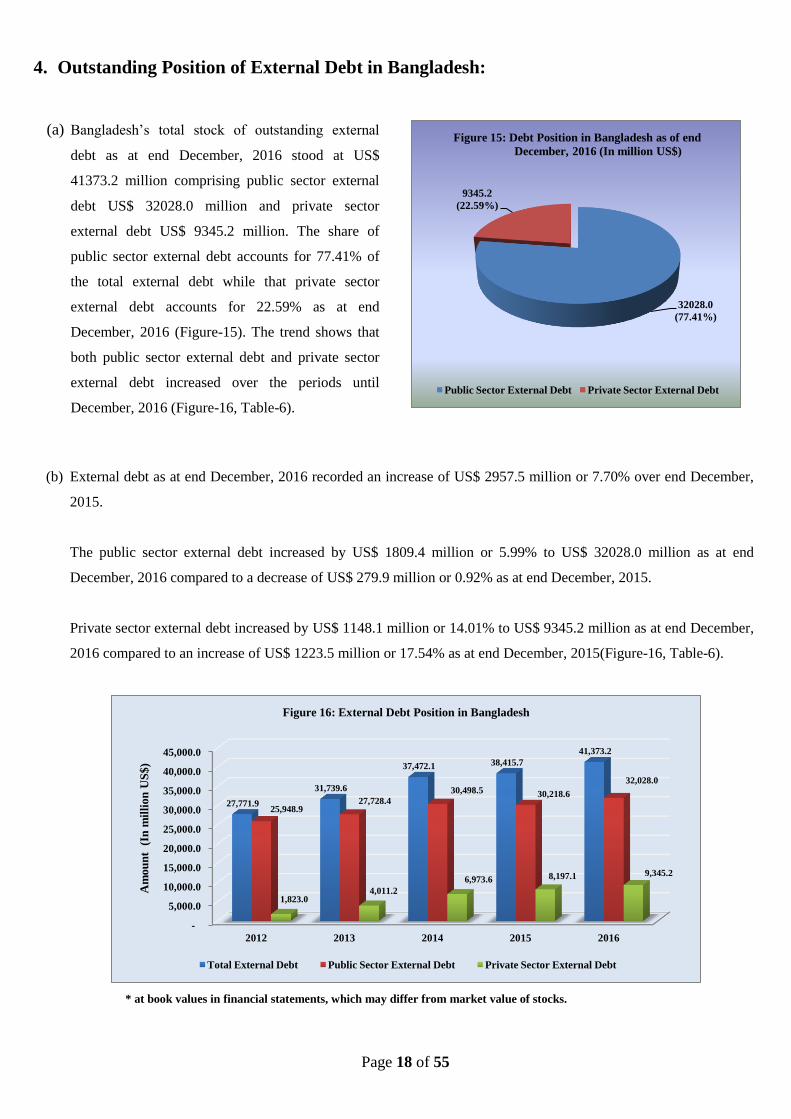
4. Outstanding Position of External Debt in Bangladesh:
(a) Bangladesh’s total stock of outstanding external
debt as at end December, 2016 stood at US$
41373.2 million comprising public sector external
debt US$ 32028.0 million and private sector
external debt US$ 9345.2 million. The share of
public sector external debt accounts for 77.41% of
the total external debt while that private sector
external debt accounts for 22.59% as at end
December, 2016 (Figure-15). The trend shows that
both public sector external debt and private sector
external debt increased over the periods until
December, 2016 (Figure-16, Table-6).
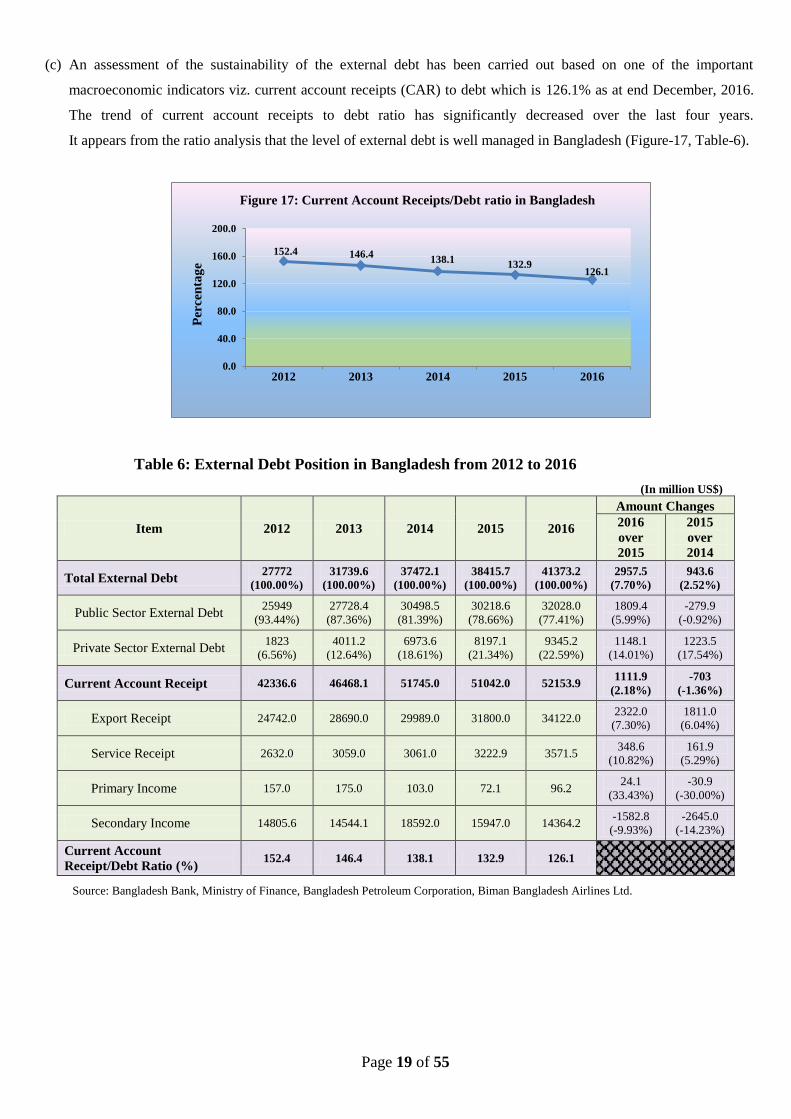
(b) External debt as at end December, 2016 recorded an increase of US$ 2957.5 million or 7.70% over end December,
2015.
The public sector external debt increased by US$ 1809.4 million or 5.99% to US$ 32028.0 million as at end
December, 2016 compared to a decrease of US$ 279.9 million or 0.92% as at end December, 2015.
Private sector external debt increased by US$ 1148.1 million or 14.01% to US$ 9345.2 million as at end December,
2016 compared to an increase of US$ 1223.5 million or 17.54% as at end December, 2015(Figure-16, Table-6).
* at book values in financial statements, which may differ from market value of stocks.
32028.0
(77.41%)
9345.2
(22.59%)
Figure 15: Debt Position in Bangladesh as of end
December, 2016 (In million US$)
Public Sector External Debt Private Sector External Debt
-
5,000.0
10,000.0
15,000.0
20,000.0
25,000.0
30,000.0
35,000.0
40,000.0
45,000.0
2012 2013 2014 2015 2016
27,771.9
31,739.6
37,472.1 38,415.7
41,373.2
25,948.9 27,728.4
30,498.5 30,218.6
32,028.0
1,823.0 4,011.2
6,973.6 8,197.1 9,345.2
Am
ou
nt
(In
mil
lion
US
$)
Figure 16: External Debt Position in Bangladesh
Total External Debt Public Sector External Debt Private Sector External Debt
Page 19 of 55
(c) An assessment of the sustainability of the external debt has been carried out based on one of the important
macroeconomic indicators viz. current account receipts (CAR) to debt which is 126.1% as at end December, 2016.
The trend of current account receipts to debt ratio has significantly decreased over the last four years.
It appears from the ratio analysis that the level of external debt is well managed in Bangladesh (Figure-17, Table-6).
Table 6: External Debt Position in Bangladesh from 2012 to 2016
(In million US$)
Item 2012 2013 2014 2015 2016
Amount Changes
2016
over
2015
2015
over
2014
Total External Debt 27772
(100.00%)
31739.6
(100.00%)
37472.1
(100.00%)
38415.7
(100.00%)
41373.2
(100.00%)
2957.5
(7.70%)
943.6
(2.52%)
Public Sector External Debt 25949
(93.44%)
27728.4
(87.36%)
30498.5
(81.39%)
30218.6
(78.66%)
32028.0
(77.41%)
1809.4
(5.99%)
-279.9
(-0.92%)
Private Sector External Debt 1823
(6.56%)
4011.2
(12.64%)
6973.6
(18.61%)
8197.1
(21.34%)
9345.2
(22.59%)
1148.1
(14.01%)
1223.5
(17.54%)
Current Account Receipt 42336.6 46468.1 51745.0 51042.0 52153.9 1111.9
(2.18%)
-703
(-1.36%)
Export Receipt 24742.0 28690.0 29989.0 31800.0 34122.0 2322.0
(7.30%)
1811.0
(6.04%)
Service Receipt 2632.0 3059.0 3061.0 3222.9 3571.5 348.6
(10.82%)
161.9
(5.29%)
Primary Income 157.0 175.0 103.0 72.1 96.2 24.1
(33.43%)
-30.9
(-30.00%)
Secondary Income 14805.6 14544.1 18592.0 15947.0 14364.2 -1582.8
(-9.93%)
-2645.0
(-14.23%)
Current Account
Receipt/Debt Ratio (%) 152.4 146.4 138.1 132.9 126.1
Source: Bangladesh Bank, Ministry of Finance, Bangladesh Petroleum Corporation, Biman Bangladesh Airlines Ltd.
152.4 146.4 138.1
132.9 126.1
0.0
40.0
80.0
120.0
160.0
200.0
2012 2013 2014 2015 2016
Per
cen
tag
e
Figure 17: Current Account Receipts/Debt ratio in Bangladesh
Page 20 of 55
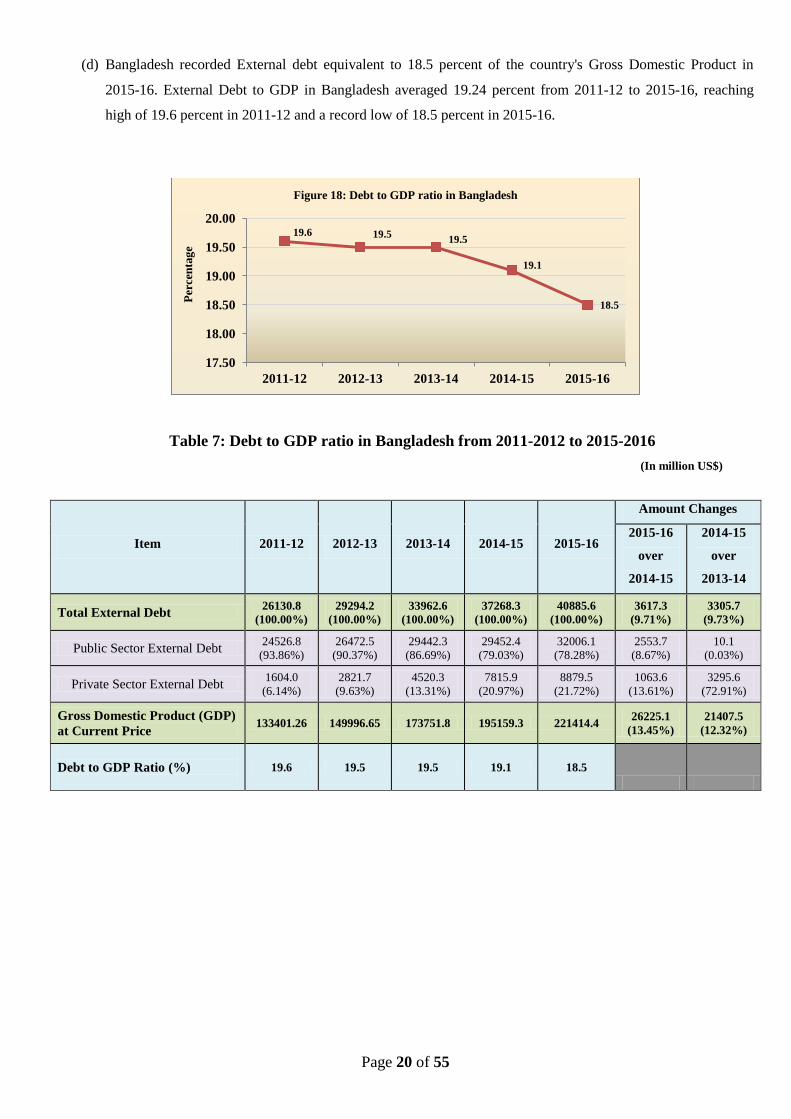
(d) Bangladesh recorded External debt equivalent to 18.5 percent of the country's Gross Domestic Product in
2015-16. External Debt to GDP in Bangladesh averaged 19.24 percent from 2011-12 to 2015-16, reaching
high of 19.6 percent in 2011-12 and a record low of 18.5 percent in 2015-16.
Table 7: Debt to GDP ratio in Bangladesh from 2011-2012 to 2015-2016
(In million US$)
Item 2011-12 2012-13 2013-14 2014-15 2015-16
Amount Changes
2015-16
over
2014-15
2014-15
over
2013-14
Total External Debt 26130.8
(100.00%)
29294.2
(100.00%)
33962.6
(100.00%)
37268.3
(100.00%)
40885.6
(100.00%)
3617.3
(9.71%)
3305.7
(9.73%)
Public Sector External Debt 24526.8
(93.86%)
26472.5
(90.37%)
29442.3
(86.69%)
29452.4
(79.03%)
32006.1
(78.28%)
2553.7
(8.67%)
10.1
(0.03%)
Private Sector External Debt 1604.0
(6.14%)
2821.7
(9.63%)
4520.3
(13.31%)
7815.9
(20.97%)
8879.5
(21.72%)
1063.6
(13.61%)
3295.6
(72.91%)
Gross Domestic Product (GDP)
at Current Price 133401.26 149996.65 173751.8 195159.3 221414.4
26225.1
(13.45%)
21407.5
(12.32%)
Debt to GDP Ratio (%)
19.6 19.5 19.5 19.1 18.5
19.6 19.5 19.5
19.1
18.5
17.50
18.00
18.50
19.00
19.50
20.00
2011-12 2012-13 2013-14 2014-15 2015-16
Per
cen
tag
e Figure 18: Debt to GDP ratio in Bangladesh

Page 21 of 55
Annexure 1: FDI Historical Data
Page 22 of 55
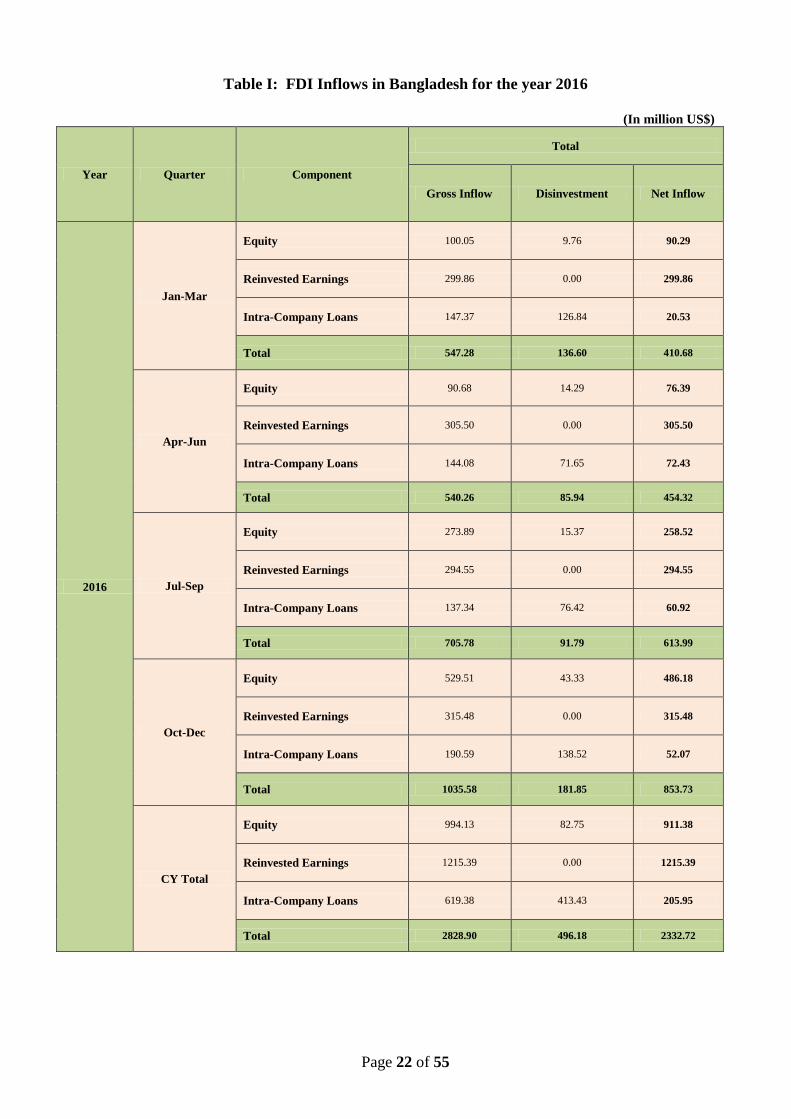
Table I: FDI Inflows in Bangladesh for the year 2016
(In million US$)
Year Quarter Component
Total
Gross Inflow Disinvestment Net Inflow
2016
Jan-Mar
Equity 100.05 9.76 90.29
Reinvested Earnings 299.86 0.00 299.86
Intra-Company Loans 147.37 126.84 20.53
Total 547.28 136.60 410.68
Apr-Jun
Equity 90.68 14.29 76.39
Reinvested Earnings 305.50 0.00 305.50
Intra-Company Loans 144.08 71.65 72.43
Total 540.26 85.94 454.32
Jul-Sep
Equity 273.89 15.37 258.52
Reinvested Earnings 294.55 0.00 294.55
Intra-Company Loans 137.34 76.42 60.92
Total 705.78 91.79 613.99
Oct-Dec
Equity 529.51 43.33 486.18
Reinvested Earnings 315.48 0.00 315.48
Intra-Company Loans 190.59 138.52 52.07
Total 1035.58 181.85 853.73
CY Total
Equity 994.13 82.75 911.38
Reinvested Earnings 1215.39 0.00 1215.39
Intra-Company Loans 619.38 413.43 205.95
Total 2828.90 496.18 2332.72
Page 23 of 55
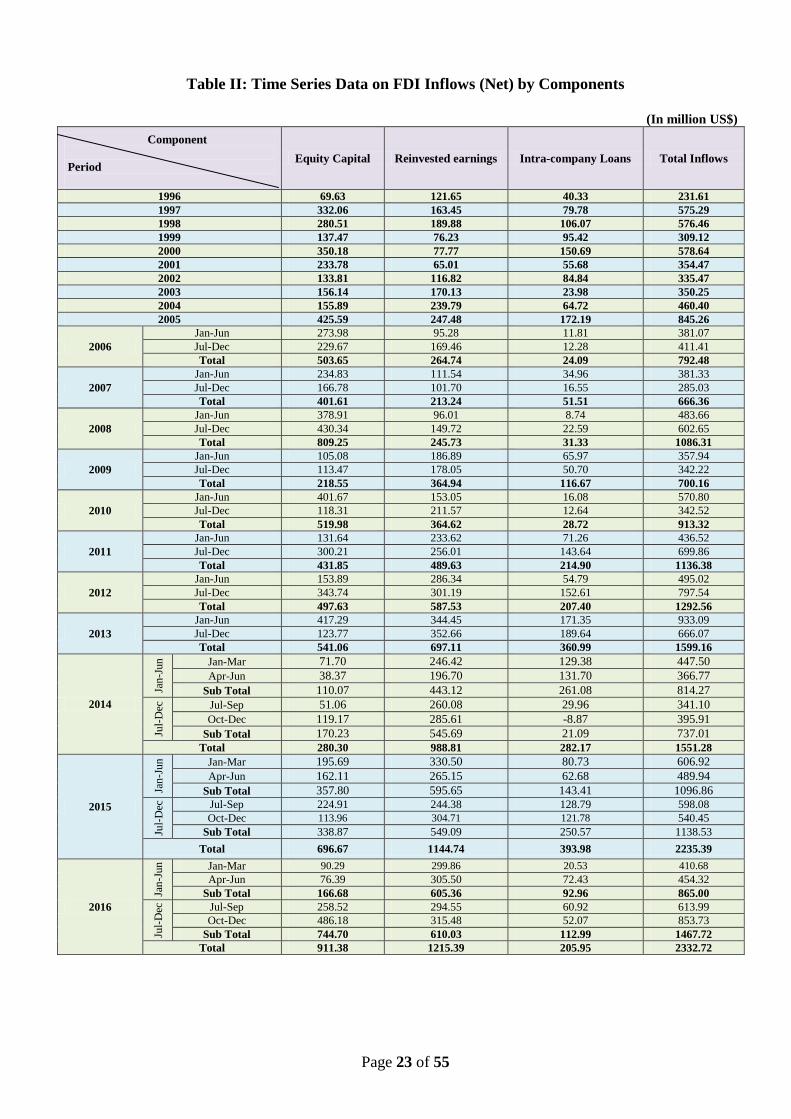
Table II: Time Series Data on FDI Inflows (Net) by Components
(In million US$)
Component
Period
Equity Capital Reinvested earnings Intra-company Loans Total Inflows
1996 69.63 121.65 40.33 231.61
1997 332.06 163.45 79.78 575.29
1998 280.51 189.88 106.07 576.46
1999 137.47 76.23 95.42 309.12
2000 350.18 77.77 150.69 578.64
2001 233.78 65.01 55.68 354.47
2002 133.81 116.82 84.84 335.47
2003 156.14 170.13 23.98 350.25
2004 155.89 239.79 64.72 460.40
2005 425.59 247.48 172.19 845.26
2006
Jan-Jun 273.98 95.28 11.81 381.07
Jul-Dec 229.67 169.46 12.28 411.41
Total 503.65 264.74 24.09 792.48
2007
Jan-Jun 234.83 111.54 34.96 381.33
Jul-Dec 166.78 101.70 16.55 285.03
Total 401.61 213.24 51.51 666.36
2008
Jan-Jun 378.91 96.01 8.74 483.66
Jul-Dec 430.34 149.72 22.59 602.65
Total 809.25 245.73 31.33 1086.31
2009
Jan-Jun 105.08 186.89 65.97 357.94
Jul-Dec 113.47 178.05 50.70 342.22
Total 218.55 364.94 116.67 700.16
2010
Jan-Jun 401.67 153.05 16.08 570.80
Jul-Dec 118.31 211.57 12.64 342.52
Total 519.98 364.62 28.72 913.32
2011
Jan-Jun 131.64 233.62 71.26 436.52
Jul-Dec 300.21 256.01 143.64 699.86
Total 431.85 489.63 214.90 1136.38
2012
Jan-Jun 153.89 286.34 54.79 495.02
Jul-Dec 343.74 301.19 152.61 797.54
Total 497.63 587.53 207.40 1292.56
2013
Jan-Jun 417.29 344.45 171.35 933.09
Jul-Dec 123.77 352.66 189.64 666.07
Total 541.06 697.11 360.99 1599.16
2014
Jan
-Jun
Jan-Mar 71.70 246.42 129.38 447.50
Apr-Jun 38.37 196.70 131.70 366.77
Sub Total 110.07 443.12 261.08 814.27
Jul-
Dec
Jul-Sep 51.06 260.08 29.96 341.10
Oct-Dec 119.17 285.61 -8.87 395.91
Sub Total 170.23 545.69 21.09 737.01
Total 280.30 988.81 282.17 1551.28
2015
Jan
-Jun
Jan-Mar 195.69 330.50 80.73 606.92
Apr-Jun 162.11 265.15 62.68 489.94
Sub Total 357.80 595.65 143.41 1096.86
Jul-
Dec
Jul-Sep 224.91 244.38 128.79 598.08
Oct-Dec 113.96 304.71 121.78 540.45
Sub Total 338.87 549.09 250.57 1138.53
Total 696.67 1144.74 393.98 2235.39
2016
Jan
-Jun
Jan-Mar 90.29 299.86 20.53 410.68
Apr-Jun 76.39 305.50 72.43 454.32
Sub Total 166.68 605.36 92.96 865.00
Jul-
Dec
Jul-Sep 258.52 294.55 60.92 613.99
Oct-Dec 486.18 315.48 52.07 853.73
Sub Total 744.70 610.03 112.99 1467.72
Total 911.38 1215.39 205.95 2332.72
Page 24 of 55
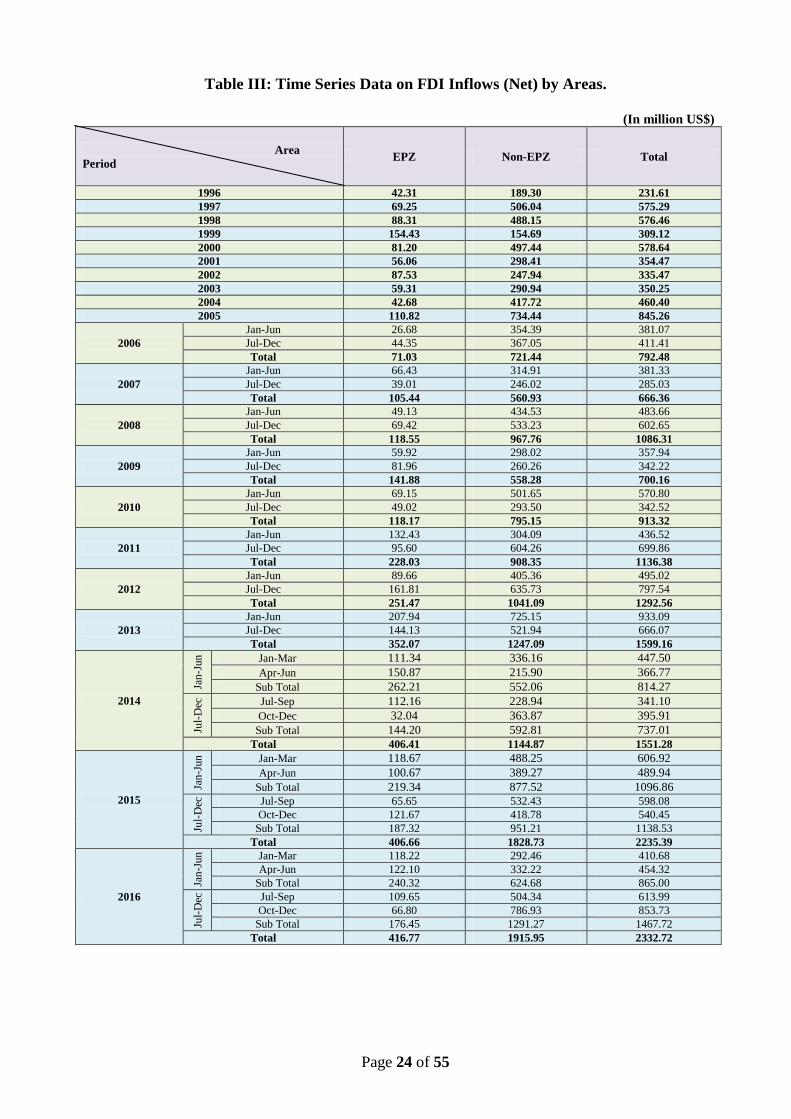
Table III: Time Series Data on FDI Inflows (Net) by Areas.
(In million US$)
Area
Period
EPZ Non-EPZ Total
1996 42.31 189.30 231.61
1997 69.25 506.04 575.29
1998 88.31 488.15 576.46
1999 154.43 154.69 309.12
2000 81.20 497.44 578.64
2001 56.06 298.41 354.47
2002 87.53 247.94 335.47
2003 59.31 290.94 350.25
2004 42.68 417.72 460.40
2005 110.82 734.44 845.26
2006
Jan-Jun 26.68 354.39 381.07
Jul-Dec 44.35 367.05 411.41
Total 71.03 721.44 792.48
2007
Jan-Jun 66.43 314.91 381.33
Jul-Dec 39.01 246.02 285.03
Total 105.44 560.93 666.36
2008
Jan-Jun 49.13 434.53 483.66
Jul-Dec 69.42 533.23 602.65
Total 118.55 967.76 1086.31
2009
Jan-Jun 59.92 298.02 357.94
Jul-Dec 81.96 260.26 342.22
Total 141.88 558.28 700.16
2010
Jan-Jun 69.15 501.65 570.80
Jul-Dec 49.02 293.50 342.52
Total 118.17 795.15 913.32
2011
Jan-Jun 132.43 304.09 436.52
Jul-Dec 95.60 604.26 699.86
Total 228.03 908.35 1136.38
2012
Jan-Jun 89.66 405.36 495.02
Jul-Dec 161.81 635.73 797.54
Total 251.47 1041.09 1292.56
2013
Jan-Jun 207.94 725.15 933.09
Jul-Dec 144.13 521.94 666.07
Total 352.07 1247.09 1599.16
2014
Jan
-Jun
Jan-Mar 111.34 336.16 447.50
Apr-Jun 150.87 215.90 366.77
Sub Total 262.21 552.06 814.27
Jul-
Dec
Jul-Sep 112.16 228.94 341.10
Oct-Dec 32.04 363.87 395.91
Sub Total 144.20 592.81 737.01
Total 406.41 1144.87 1551.28
2015
Jan
-Jun
Jan-Mar 118.67 488.25 606.92
Apr-Jun 100.67 389.27 489.94
Sub Total 219.34 877.52 1096.86
Jul-
Dec
Jul-Sep 65.65 532.43 598.08
Oct-Dec 121.67 418.78 540.45
Sub Total 187.32 951.21 1138.53
Total 406.66 1828.73 2235.39
2016
Jan
-Jun
Jan-Mar 118.22 292.46 410.68
Apr-Jun 122.10 332.22 454.32
Sub Total 240.32 624.68 865.00
Jul-
Dec
Jul-Sep 109.65 504.34 613.99
Oct-Dec 66.80 786.93 853.73
Sub Total 176.45 1291.27 1467.72
Total 416.77 1915.95 2332.72
Page 25 of 55
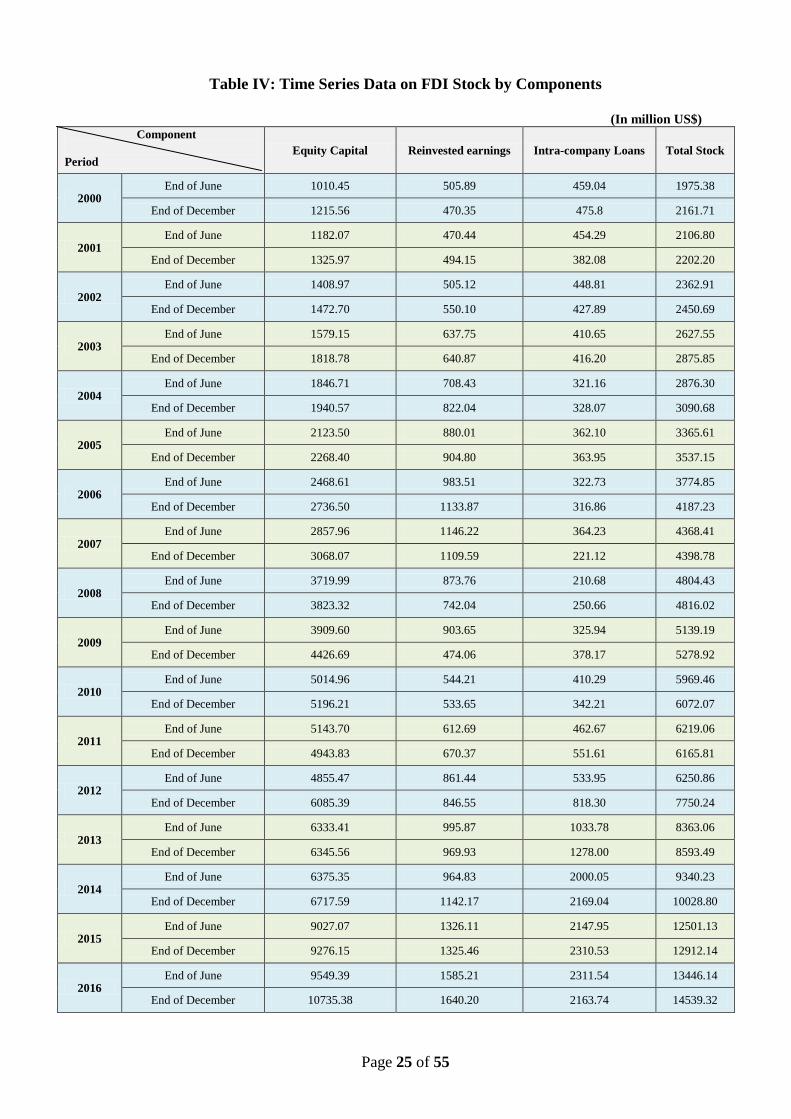
Table IV: Time Series Data on FDI Stock by Components
(In million US$)
Component
Period Equity Capital Reinvested earnings Intra-company Loans Total Stock
2000 End of June 1010.45 505.89 459.04 1975.38
End of December 1215.56 470.35 475.8 2161.71
2001 End of June 1182.07 470.44 454.29 2106.80
End of December 1325.97 494.15 382.08 2202.20
2002 End of June 1408.97 505.12 448.81 2362.91
End of December 1472.70 550.10 427.89 2450.69
2003 End of June 1579.15 637.75 410.65 2627.55
End of December 1818.78 640.87 416.20 2875.85
2004 End of June 1846.71 708.43 321.16 2876.30
End of December 1940.57 822.04 328.07 3090.68
2005 End of June 2123.50 880.01 362.10 3365.61
End of December 2268.40 904.80 363.95 3537.15
2006 End of June 2468.61 983.51 322.73 3774.85
End of December 2736.50 1133.87 316.86 4187.23
2007 End of June 2857.96 1146.22 364.23 4368.41
End of December 3068.07 1109.59 221.12 4398.78
2008 End of June 3719.99 873.76 210.68 4804.43
End of December 3823.32 742.04 250.66 4816.02
2009 End of June 3909.60 903.65 325.94 5139.19
End of December 4426.69 474.06 378.17 5278.92
2010 End of June 5014.96 544.21 410.29 5969.46
End of December 5196.21 533.65 342.21 6072.07
2011 End of June 5143.70 612.69 462.67 6219.06
End of December 4943.83 670.37 551.61 6165.81
2012 End of June 4855.47 861.44 533.95 6250.86
End of December 6085.39 846.55 818.30 7750.24
2013 End of June 6333.41 995.87 1033.78 8363.06
End of December 6345.56 969.93 1278.00 8593.49
2014 End of June 6375.35 964.83 2000.05 9340.23
End of December 6717.59 1142.17 2169.04 10028.80
2015 End of June 9027.07 1326.11 2147.95 12501.13
End of December 9276.15 1325.46 2310.53 12912.14
2016 End of June 9549.39 1585.21 2311.54 13446.14
End of December 10735.38 1640.20 2163.74 14539.32
Page 26 of 55
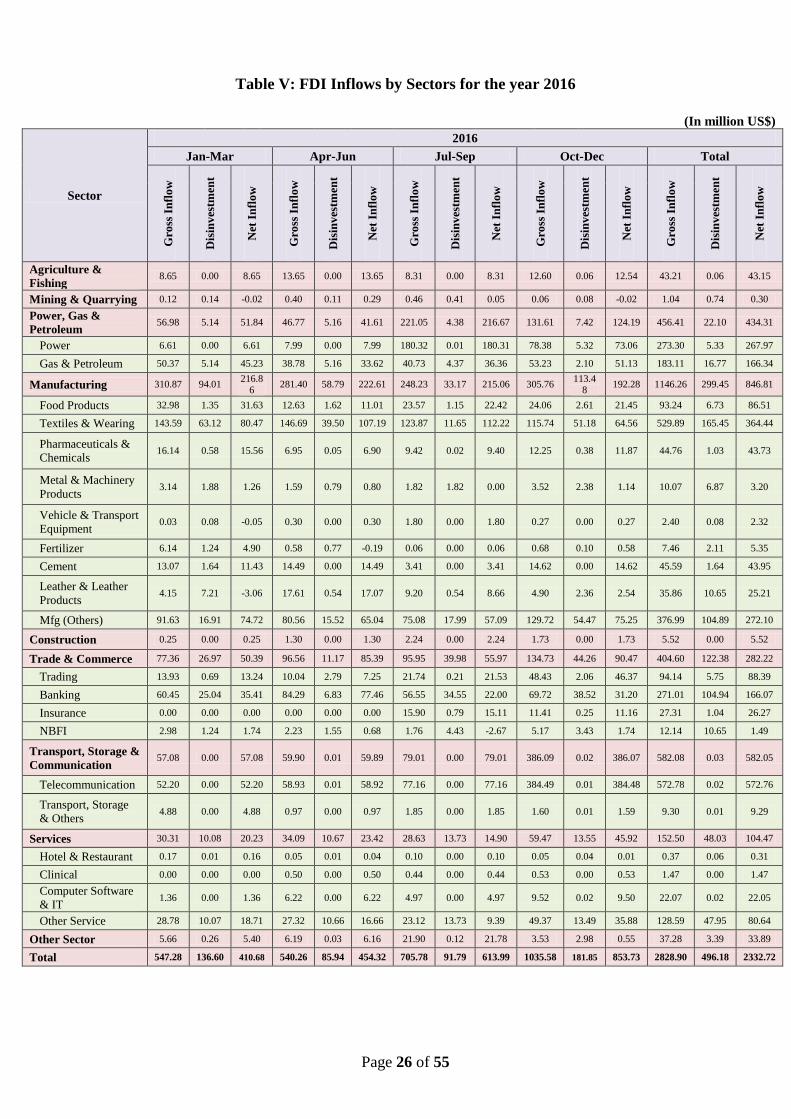
Table V: FDI Inflows by Sectors for the year 2016
(In million US$)
Sector
2016
Jan-Mar Apr-Jun Jul-Sep Oct-Dec Total G
ross
In
flo
w
Dis
inv
estm
ent
Net
In
flo
w
Gro
ss I
nfl
ow
Dis
inv
estm
ent
Net
In
flo
w
Gro
ss I
nfl
ow
Dis
inv
estm
ent
Net
In
flo
w
Gro
ss I
nfl
ow
Dis
inv
estm
ent
Net
In
flo
w
Gro
ss I
nfl
ow
Dis
inv
estm
ent
Net
In
flo
w
Agriculture &
Fishing 8.65 0.00 8.65 13.65 0.00 13.65 8.31 0.00 8.31 12.60 0.06 12.54 43.21 0.06 43.15
Mining & Quarrying 0.12 0.14 -0.02 0.40 0.11 0.29 0.46 0.41 0.05 0.06 0.08 -0.02 1.04 0.74 0.30
Power, Gas &
Petroleum 56.98 5.14 51.84 46.77 5.16 41.61 221.05 4.38 216.67 131.61 7.42 124.19 456.41 22.10 434.31
Power 6.61 0.00 6.61 7.99 0.00 7.99 180.32 0.01 180.31 78.38 5.32 73.06 273.30 5.33 267.97
Gas & Petroleum 50.37 5.14 45.23 38.78 5.16 33.62 40.73 4.37 36.36 53.23 2.10 51.13 183.11 16.77 166.34
Manufacturing 310.87 94.01 216.8
6 281.40 58.79 222.61 248.23 33.17 215.06 305.76
113.48
192.28 1146.26 299.45 846.81
Food Products 32.98 1.35 31.63 12.63 1.62 11.01 23.57 1.15 22.42 24.06 2.61 21.45 93.24 6.73 86.51
Textiles & Wearing 143.59 63.12 80.47 146.69 39.50 107.19 123.87 11.65 112.22 115.74 51.18 64.56 529.89 165.45 364.44
Pharmaceuticals &
Chemicals 16.14 0.58 15.56 6.95 0.05 6.90 9.42 0.02 9.40 12.25 0.38 11.87 44.76 1.03 43.73
Metal & Machinery
Products 3.14 1.88 1.26 1.59 0.79 0.80 1.82 1.82 0.00 3.52 2.38 1.14 10.07 6.87 3.20
Vehicle & Transport
Equipment 0.03 0.08 -0.05 0.30 0.00 0.30 1.80 0.00 1.80 0.27 0.00 0.27 2.40 0.08 2.32
Fertilizer 6.14 1.24 4.90 0.58 0.77 -0.19 0.06 0.00 0.06 0.68 0.10 0.58 7.46 2.11 5.35
Cement 13.07 1.64 11.43 14.49 0.00 14.49 3.41 0.00 3.41 14.62 0.00 14.62 45.59 1.64 43.95
Leather & Leather
Products 4.15 7.21 -3.06 17.61 0.54 17.07 9.20 0.54 8.66 4.90 2.36 2.54 35.86 10.65 25.21
Mfg (Others) 91.63 16.91 74.72 80.56 15.52 65.04 75.08 17.99 57.09 129.72 54.47 75.25 376.99 104.89 272.10
Construction 0.25 0.00 0.25 1.30 0.00 1.30 2.24 0.00 2.24 1.73 0.00 1.73 5.52 0.00 5.52
Trade & Commerce 77.36 26.97 50.39 96.56 11.17 85.39 95.95 39.98 55.97 134.73 44.26 90.47 404.60 122.38 282.22
Trading 13.93 0.69 13.24 10.04 2.79 7.25 21.74 0.21 21.53 48.43 2.06 46.37 94.14 5.75 88.39
Banking 60.45 25.04 35.41 84.29 6.83 77.46 56.55 34.55 22.00 69.72 38.52 31.20 271.01 104.94 166.07
Insurance 0.00 0.00 0.00 0.00 0.00 0.00 15.90 0.79 15.11 11.41 0.25 11.16 27.31 1.04 26.27
NBFI 2.98 1.24 1.74 2.23 1.55 0.68 1.76 4.43 -2.67 5.17 3.43 1.74 12.14 10.65 1.49
Transport, Storage &
Communication 57.08 0.00 57.08 59.90 0.01 59.89 79.01 0.00 79.01 386.09 0.02 386.07 582.08 0.03 582.05
Telecommunication 52.20 0.00 52.20 58.93 0.01 58.92 77.16 0.00 77.16 384.49 0.01 384.48 572.78 0.02 572.76
Transport, Storage
& Others 4.88 0.00 4.88 0.97 0.00 0.97 1.85 0.00 1.85 1.60 0.01 1.59 9.30 0.01 9.29
Services 30.31 10.08 20.23 34.09 10.67 23.42 28.63 13.73 14.90 59.47 13.55 45.92 152.50 48.03 104.47
Hotel & Restaurant 0.17 0.01 0.16 0.05 0.01 0.04 0.10 0.00 0.10 0.05 0.04 0.01 0.37 0.06 0.31
Clinical 0.00 0.00 0.00 0.50 0.00 0.50 0.44 0.00 0.44 0.53 0.00 0.53 1.47 0.00 1.47
Computer Software
& IT 1.36 0.00 1.36 6.22 0.00 6.22 4.97 0.00 4.97 9.52 0.02 9.50 22.07 0.02 22.05
Other Service 28.78 10.07 18.71 27.32 10.66 16.66 23.12 13.73 9.39 49.37 13.49 35.88 128.59 47.95 80.64
Other Sector 5.66 0.26 5.40 6.19 0.03 6.16 21.90 0.12 21.78 3.53 2.98 0.55 37.28 3.39 33.89
Total 547.28 136.60 410.68 540.26 85.94 454.32 705.78 91.79 613.99 1035.58 181.85 853.73 2828.90 496.18 2332.72
Page 27 of 55
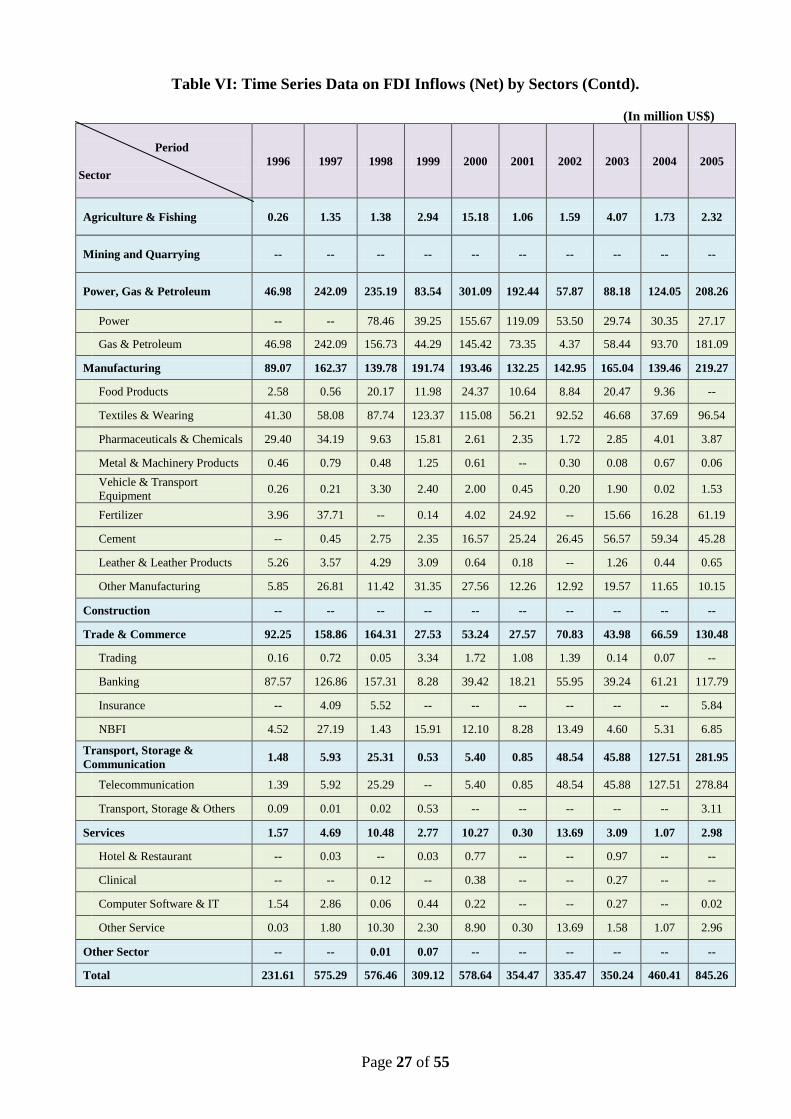
Table VI: Time Series Data on FDI Inflows (Net) by Sectors (Contd).
(In million US$)
Period
Sector
1996 1997 1998 1999 2000 2001 2002 2003 2004 2005
Agriculture & Fishing 0.26 1.35 1.38 2.94 15.18 1.06 1.59 4.07 1.73 2.32
Mining and Quarrying -- -- -- -- -- -- -- -- -- --
Power, Gas & Petroleum 46.98 242.09 235.19 83.54 301.09 192.44 57.87 88.18 124.05 208.26
Power -- -- 78.46 39.25 155.67 119.09 53.50 29.74 30.35 27.17
Gas & Petroleum 46.98 242.09 156.73 44.29 145.42 73.35 4.37 58.44 93.70 181.09
Manufacturing 89.07 162.37 139.78 191.74 193.46 132.25 142.95 165.04 139.46 219.27
Food Products 2.58 0.56 20.17 11.98 24.37 10.64 8.84 20.47 9.36 --
Textiles & Wearing 41.30 58.08 87.74 123.37 115.08 56.21 92.52 46.68 37.69 96.54
Pharmaceuticals & Chemicals 29.40 34.19 9.63 15.81 2.61 2.35 1.72 2.85 4.01 3.87
Metal & Machinery Products 0.46 0.79 0.48 1.25 0.61 -- 0.30 0.08 0.67 0.06
Vehicle & Transport
Equipment 0.26 0.21 3.30 2.40 2.00 0.45 0.20 1.90 0.02 1.53
Fertilizer 3.96 37.71 -- 0.14 4.02 24.92 -- 15.66 16.28 61.19
Cement -- 0.45 2.75 2.35 16.57 25.24 26.45 56.57 59.34 45.28
Leather & Leather Products 5.26 3.57 4.29 3.09 0.64 0.18 -- 1.26 0.44 0.65
Other Manufacturing 5.85 26.81 11.42 31.35 27.56 12.26 12.92 19.57 11.65 10.15
Construction -- -- -- -- -- -- -- -- -- --
Trade & Commerce 92.25 158.86 164.31 27.53 53.24 27.57 70.83 43.98 66.59 130.48
Trading 0.16 0.72 0.05 3.34 1.72 1.08 1.39 0.14 0.07 --
Banking 87.57 126.86 157.31 8.28 39.42 18.21 55.95 39.24 61.21 117.79
Insurance -- 4.09 5.52 -- -- -- -- -- -- 5.84
NBFI 4.52 27.19 1.43 15.91 12.10 8.28 13.49 4.60 5.31 6.85
Transport, Storage &
Communication 1.48 5.93 25.31 0.53 5.40 0.85 48.54 45.88 127.51 281.95
Telecommunication 1.39 5.92 25.29 -- 5.40 0.85 48.54 45.88 127.51 278.84
Transport, Storage & Others 0.09 0.01 0.02 0.53 -- -- -- -- -- 3.11
Services 1.57 4.69 10.48 2.77 10.27 0.30 13.69 3.09 1.07 2.98
Hotel & Restaurant -- 0.03 -- 0.03 0.77 -- -- 0.97 -- --
Clinical -- -- 0.12 -- 0.38 -- -- 0.27 -- --
Computer Software & IT 1.54 2.86 0.06 0.44 0.22 -- -- 0.27 -- 0.02
Other Service 0.03 1.80 10.30 2.30 8.90 0.30 13.69 1.58 1.07 2.96
Other Sector -- -- 0.01 0.07 -- -- -- -- -- --
Total 231.61 575.29 576.46 309.12 578.64 354.47 335.47 350.24 460.41 845.26
Page 28 of 55
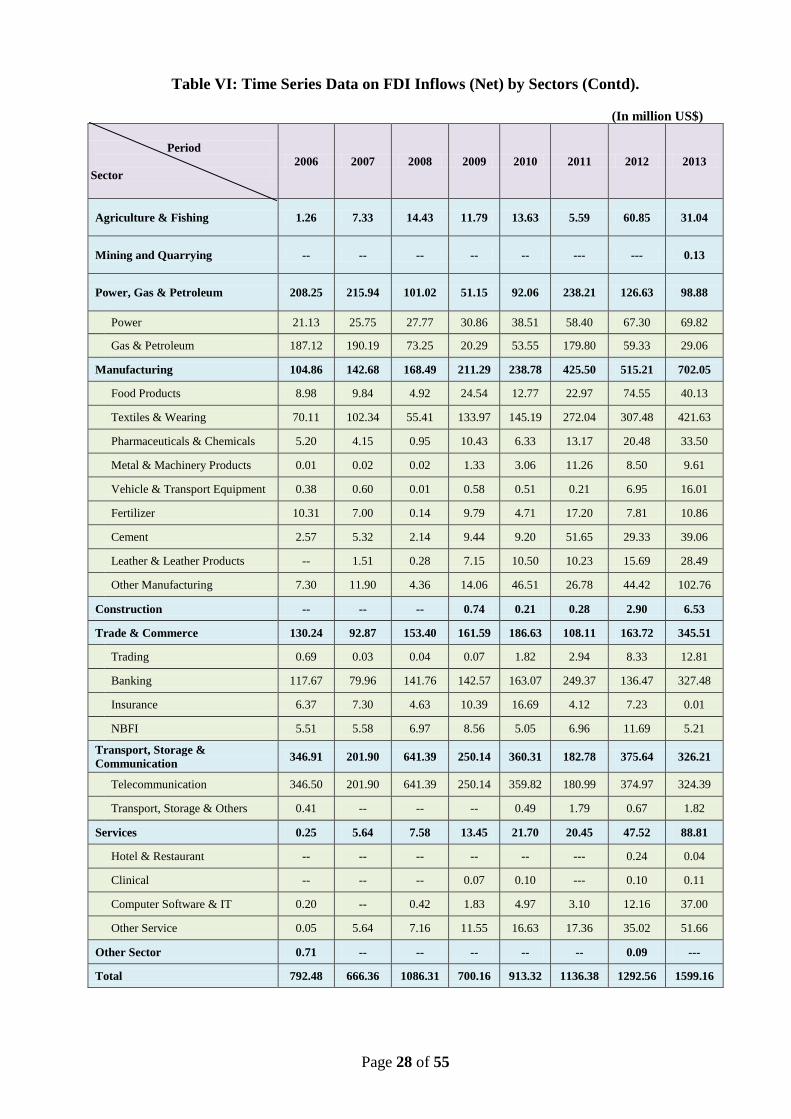
Table VI: Time Series Data on FDI Inflows (Net) by Sectors (Contd).
(In million US$)
Period
Sector
2006 2007 2008 2009 2010 2011 2012 2013
Agriculture & Fishing 1.26 7.33 14.43 11.79 13.63 5.59 60.85 31.04
Mining and Quarrying -- -- -- -- -- --- --- 0.13
Power, Gas & Petroleum 208.25 215.94 101.02 51.15 92.06 238.21 126.63 98.88
Power 21.13 25.75 27.77 30.86 38.51 58.40 67.30 69.82
Gas & Petroleum 187.12 190.19 73.25 20.29 53.55 179.80 59.33 29.06
Manufacturing 104.86 142.68 168.49 211.29 238.78 425.50 515.21 702.05
Food Products 8.98 9.84 4.92 24.54 12.77 22.97 74.55 40.13
Textiles & Wearing 70.11 102.34 55.41 133.97 145.19 272.04 307.48 421.63
Pharmaceuticals & Chemicals 5.20 4.15 0.95 10.43 6.33 13.17 20.48 33.50
Metal & Machinery Products 0.01 0.02 0.02 1.33 3.06 11.26 8.50 9.61
Vehicle & Transport Equipment 0.38 0.60 0.01 0.58 0.51 0.21 6.95 16.01
Fertilizer 10.31 7.00 0.14 9.79 4.71 17.20 7.81 10.86
Cement 2.57 5.32 2.14 9.44 9.20 51.65 29.33 39.06
Leather & Leather Products -- 1.51 0.28 7.15 10.50 10.23 15.69 28.49
Other Manufacturing 7.30 11.90 4.36 14.06 46.51 26.78 44.42 102.76
Construction -- -- -- 0.74 0.21 0.28 2.90 6.53
Trade & Commerce 130.24 92.87 153.40 161.59 186.63 108.11 163.72 345.51
Trading 0.69 0.03 0.04 0.07 1.82 2.94 8.33 12.81
Banking 117.67 79.96 141.76 142.57 163.07 249.37 136.47 327.48
Insurance 6.37 7.30 4.63 10.39 16.69 4.12 7.23 0.01
NBFI 5.51 5.58 6.97 8.56 5.05 6.96 11.69 5.21
Transport, Storage &
Communication 346.91 201.90 641.39 250.14 360.31 182.78 375.64 326.21
Telecommunication 346.50 201.90 641.39 250.14 359.82 180.99 374.97 324.39
Transport, Storage & Others 0.41 -- -- -- 0.49 1.79 0.67 1.82
Services 0.25 5.64 7.58 13.45 21.70 20.45 47.52 88.81
Hotel & Restaurant -- -- -- -- -- --- 0.24 0.04
Clinical -- -- -- 0.07 0.10 --- 0.10 0.11
Computer Software & IT 0.20 -- 0.42 1.83 4.97 3.10 12.16 37.00
Other Service 0.05 5.64 7.16 11.55 16.63 17.36 35.02 51.66
Other Sector 0.71 -- -- -- -- -- 0.09 ---
Total 792.48 666.36 1086.31 700.16 913.32 1136.38 1292.56 1599.16
Page 29 of 55
Table VI: Time Series Data on FDI Inflows (Net) by Sectors (Contd).
(In million US$) Period
2014
Jan-Jun Jul-Dec
CY Total Sector
Jan-Mar Apr-Jun Sub
Total Jul-Sep Oct-Dec
Sub
Total
Agriculture & Fishing
3.83 8.98 12.81 3.92 14.85 18.77 31.58
Mining and Quarrying --- --- --- --- --- --- ---
Power, Gas & Petroleum 9.53 -2.86 6.67 12.60 30.49 43.09 49.76
Power 15.76 3.75 19.51 10.35 15.57 25.92 45.43
Gas & Petroleum -6.23 -6.61 -12.84 2.25 14.92 17.17 4.33
Manufacturing 207.87 232.31 440.18 183.49 99.20 282.69 722.87
Food Products 2.49 20.29 22.78 19.64 17.40 37.04 59.82
Textiles & Wearing 119.53 142.31 261.84 87.25 29.84 117.09 378.93
Pharmaceuticals & Chemicals 22.57 8.29 30.86 6.12 4.09 10.21 41.07
Metal & Machinery Products 1.11 12.85 13.96 9.10 0.54 9.64 23.60
Vehicle & Transport Equipment 0.48 0.43 0.91 1.92 2.01 3.93 4.84
Fertilizer 10.11 -0.37 9.74 2.87 12.41 15.28 25.02
Cement 10.59 3.32 13.91 7.12 1.09 8.21 22.12
Leather & Leather Products 13.30 9.18 22.48 9.93 6.11 16.04 38.52
Other Manufacturing 27.69 36.01 63.70 39.54 25.71 65.25 128.95
Construction 2.03 0.31 2.34 1.02 4.58 5.60 7.94
Trade & Commerce 96.63 83.52 180.15 66.90 167.11 234.01 414.16
Trading 21.50 16.82 38.32 15.78 8.65 24.43 62.75
Banking 73.27 63.63 136.90 65.25 156.02 221.27 358.17
Insurance -- -- -- -16.28 0.82 -15.46 -15.46
NBFI 1.86 3.07 4.93 2.15 1.62 3.77 8.70
Transport, Storage & Communication 108.88 24.11 132.99 56.85 47.34 104.19 237.18
Telecommunication 108.56 19.55 128.11 55.23 43.41 98.64 226.75
Transport, Storage & Others 0.32 4.56 4.88 1.62 3.93 5.55 10.43
Services 11.84 14.71 26.55 13.40 22.70 36.10 62.65
Hotel & Restaurant 0.01 0.12 0.13 0.01 0.02 0.03 0.16
Clinical 0.50 0.53 1.03 0.11 0.44 0.55 1.58
Computer Software & IT 3.26 4.39 7.65 0.96 1.77 2.73 10.38
Other Service 8.07 9.67 17.74 12.32 20.47 32.79 50.53
Other Sector 6.89 5.69 12.58 2.92 9.64 12.56 25.14
Total 447.50 366.77 814.27 341.10 395.51 737.01 1551.28
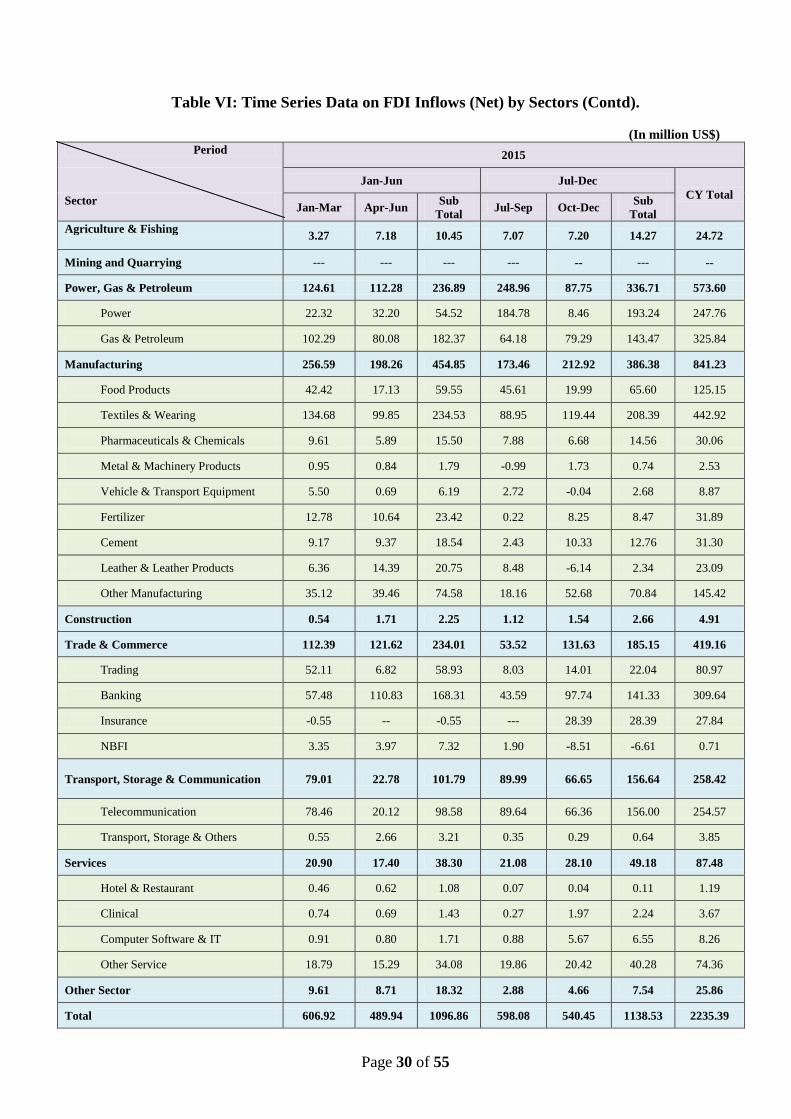
Page 30 of 55
Table VI: Time Series Data on FDI Inflows (Net) by Sectors (Contd).
(In million US$) Period
2015
Jan-Jun Jul-Dec
CY Total Sector
Jan-Mar Apr-Jun Sub
Total Jul-Sep Oct-Dec
Sub
Total
Agriculture & Fishing
3.27 7.18 10.45 7.07 7.20 14.27 24.72
Mining and Quarrying --- --- --- --- -- --- --
Power, Gas & Petroleum 124.61 112.28 236.89 248.96 87.75 336.71 573.60
Power 22.32 32.20 54.52 184.78 8.46 193.24 247.76
Gas & Petroleum 102.29 80.08 182.37 64.18 79.29 143.47 325.84
Manufacturing 256.59 198.26 454.85 173.46 212.92 386.38 841.23
Food Products 42.42 17.13 59.55 45.61 19.99 65.60 125.15
Textiles & Wearing 134.68 99.85 234.53 88.95 119.44 208.39 442.92
Pharmaceuticals & Chemicals 9.61 5.89 15.50 7.88 6.68 14.56 30.06
Metal & Machinery Products 0.95 0.84 1.79 -0.99 1.73 0.74 2.53
Vehicle & Transport Equipment 5.50 0.69 6.19 2.72 -0.04 2.68 8.87
Fertilizer 12.78 10.64 23.42 0.22 8.25 8.47 31.89
Cement 9.17 9.37 18.54 2.43 10.33 12.76 31.30
Leather & Leather Products 6.36 14.39 20.75 8.48 -6.14 2.34 23.09
Other Manufacturing 35.12 39.46 74.58 18.16 52.68 70.84 145.42
Construction 0.54 1.71 2.25 1.12 1.54 2.66 4.91
Trade & Commerce 112.39 121.62 234.01 53.52 131.63 185.15 419.16
Trading 52.11 6.82 58.93 8.03 14.01 22.04 80.97
Banking 57.48 110.83 168.31 43.59 97.74 141.33 309.64
Insurance -0.55 -- -0.55 --- 28.39 28.39 27.84
NBFI 3.35 3.97 7.32 1.90 -8.51 -6.61 0.71
Transport, Storage & Communication 79.01 22.78 101.79 89.99 66.65 156.64 258.42
Telecommunication 78.46 20.12 98.58 89.64 66.36 156.00 254.57
Transport, Storage & Others 0.55 2.66 3.21 0.35 0.29 0.64 3.85
Services 20.90 17.40 38.30 21.08 28.10 49.18 87.48
Hotel & Restaurant 0.46 0.62 1.08 0.07 0.04 0.11 1.19
Clinical 0.74 0.69 1.43 0.27 1.97 2.24 3.67
Computer Software & IT 0.91 0.80 1.71 0.88 5.67 6.55 8.26
Other Service 18.79 15.29 34.08 19.86 20.42 40.28 74.36
Other Sector 9.61 8.71 18.32 2.88 4.66 7.54 25.86
Total 606.92 489.94 1096.86 598.08 540.45 1138.53 2235.39
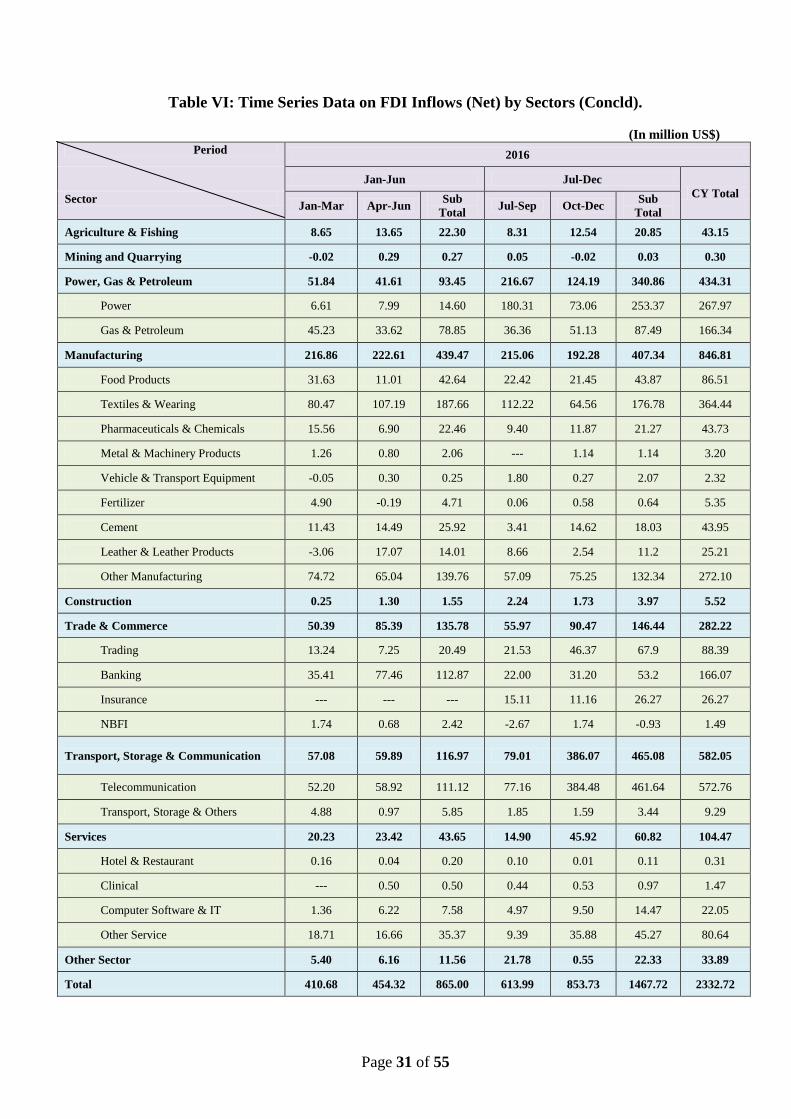
Page 31 of 55
Table VI: Time Series Data on FDI Inflows (Net) by Sectors (Concld).
(In million US$) Period 2016
Jan-Jun Jul-Dec
CY Total Sector
Jan-Mar Apr-Jun Sub
Total Jul-Sep Oct-Dec
Sub
Total
Agriculture & Fishing 8.65 13.65 22.30 8.31 12.54 20.85 43.15
Mining and Quarrying -0.02 0.29 0.27 0.05 -0.02 0.03 0.30
Power, Gas & Petroleum 51.84 41.61 93.45 216.67 124.19 340.86 434.31
Power 6.61 7.99 14.60 180.31 73.06 253.37 267.97
Gas & Petroleum 45.23 33.62 78.85 36.36 51.13 87.49 166.34
Manufacturing 216.86 222.61 439.47 215.06 192.28 407.34 846.81
Food Products 31.63 11.01 42.64 22.42 21.45 43.87 86.51
Textiles & Wearing 80.47 107.19 187.66 112.22 64.56 176.78 364.44
Pharmaceuticals & Chemicals 15.56 6.90 22.46 9.40 11.87 21.27 43.73
Metal & Machinery Products 1.26 0.80 2.06 --- 1.14 1.14 3.20
Vehicle & Transport Equipment -0.05 0.30 0.25 1.80 0.27 2.07 2.32
Fertilizer 4.90 -0.19 4.71 0.06 0.58 0.64 5.35
Cement 11.43 14.49 25.92 3.41 14.62 18.03 43.95
Leather & Leather Products -3.06 17.07 14.01 8.66 2.54 11.2 25.21
Other Manufacturing 74.72 65.04 139.76 57.09 75.25 132.34 272.10
Construction 0.25 1.30 1.55 2.24 1.73 3.97 5.52
Trade & Commerce 50.39 85.39 135.78 55.97 90.47 146.44 282.22
Trading 13.24 7.25 20.49 21.53 46.37 67.9 88.39
Banking 35.41 77.46 112.87 22.00 31.20 53.2 166.07
Insurance --- --- --- 15.11 11.16 26.27 26.27
NBFI 1.74 0.68 2.42 -2.67 1.74 -0.93 1.49
Transport, Storage & Communication 57.08 59.89 116.97 79.01 386.07 465.08 582.05
Telecommunication 52.20 58.92 111.12 77.16 384.48 461.64 572.76
Transport, Storage & Others 4.88 0.97 5.85 1.85 1.59 3.44 9.29
Services 20.23 23.42 43.65 14.90 45.92 60.82 104.47
Hotel & Restaurant 0.16 0.04 0.20 0.10 0.01 0.11 0.31
Clinical --- 0.50 0.50 0.44 0.53 0.97 1.47
Computer Software & IT 1.36 6.22 7.58 4.97 9.50 14.47 22.05
Other Service 18.71 16.66 35.37 9.39 35.88 45.27 80.64
Other Sector 5.40 6.16 11.56 21.78 0.55 22.33 33.89
Total 410.68 454.32 865.00 613.99 853.73 1467.72 2332.72
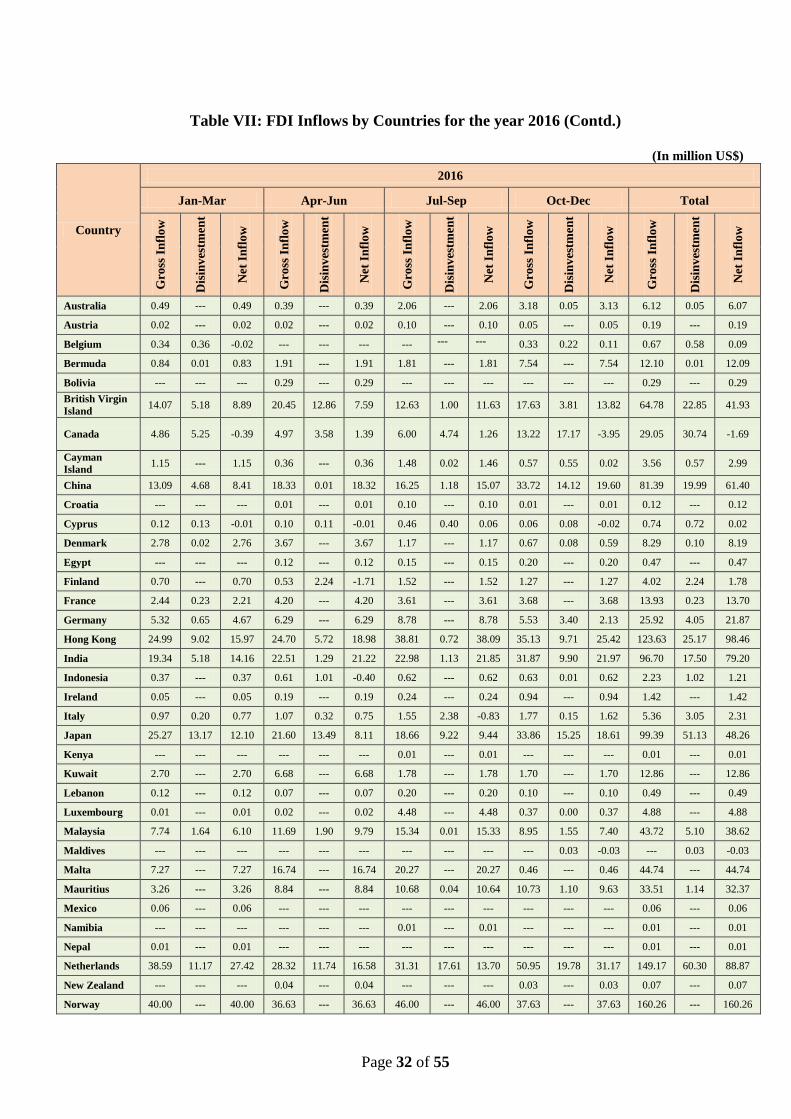
Page 32 of 55
Table VII: FDI Inflows by Countries for the year 2016 (Contd.)
(In million US$)
Country
2016
Jan-Mar Apr-Jun Jul-Sep Oct-Dec Total
Gro
ss I
nfl
ow
Dis
inv
estm
ent
Net
In
flo
w
Gro
ss I
nfl
ow
Dis
inv
estm
ent
Net
In
flo
w
Gro
ss I
nfl
ow
Dis
inv
estm
ent
Net
In
flo
w
Gro
ss I
nfl
ow
Dis
inv
estm
ent
Net
In
flo
w
Gro
ss I
nfl
ow
Dis
inv
estm
ent
Net
In
flo
w
Australia 0.49 --- 0.49 0.39 --- 0.39 2.06 --- 2.06 3.18 0.05 3.13 6.12 0.05 6.07
Austria 0.02 --- 0.02 0.02 --- 0.02 0.10 --- 0.10 0.05 --- 0.05 0.19 --- 0.19
Belgium 0.34 0.36 -0.02 --- --- --- --- --- --- 0.33 0.22 0.11 0.67 0.58 0.09
Bermuda 0.84 0.01 0.83 1.91 --- 1.91 1.81 --- 1.81 7.54 --- 7.54 12.10 0.01 12.09
Bolivia --- --- --- 0.29 --- 0.29 --- --- --- --- --- --- 0.29 --- 0.29
British Virgin
Island 14.07 5.18 8.89 20.45 12.86 7.59 12.63 1.00 11.63 17.63 3.81 13.82 64.78 22.85 41.93
Canada 4.86 5.25 -0.39 4.97 3.58 1.39 6.00 4.74 1.26 13.22 17.17 -3.95 29.05 30.74 -1.69
Cayman
Island 1.15 --- 1.15 0.36 --- 0.36 1.48 0.02 1.46 0.57 0.55 0.02 3.56 0.57 2.99
China 13.09 4.68 8.41 18.33 0.01 18.32 16.25 1.18 15.07 33.72 14.12 19.60 81.39 19.99 61.40
Croatia --- --- --- 0.01 --- 0.01 0.10 --- 0.10 0.01 --- 0.01 0.12 --- 0.12
Cyprus 0.12 0.13 -0.01 0.10 0.11 -0.01 0.46 0.40 0.06 0.06 0.08 -0.02 0.74 0.72 0.02
Denmark 2.78 0.02 2.76 3.67 --- 3.67 1.17 --- 1.17 0.67 0.08 0.59 8.29 0.10 8.19
Egypt --- --- --- 0.12 --- 0.12 0.15 --- 0.15 0.20 --- 0.20 0.47 --- 0.47
Finland 0.70 --- 0.70 0.53 2.24 -1.71 1.52 --- 1.52 1.27 --- 1.27 4.02 2.24 1.78
France 2.44 0.23 2.21 4.20 --- 4.20 3.61 --- 3.61 3.68 --- 3.68 13.93 0.23 13.70
Germany 5.32 0.65 4.67 6.29 --- 6.29 8.78 --- 8.78 5.53 3.40 2.13 25.92 4.05 21.87
Hong Kong 24.99 9.02 15.97 24.70 5.72 18.98 38.81 0.72 38.09 35.13 9.71 25.42 123.63 25.17 98.46
India 19.34 5.18 14.16 22.51 1.29 21.22 22.98 1.13 21.85 31.87 9.90 21.97 96.70 17.50 79.20
Indonesia 0.37 --- 0.37 0.61 1.01 -0.40 0.62 --- 0.62 0.63 0.01 0.62 2.23 1.02 1.21
Ireland 0.05 --- 0.05 0.19 --- 0.19 0.24 --- 0.24 0.94 --- 0.94 1.42 --- 1.42
Italy 0.97 0.20 0.77 1.07 0.32 0.75 1.55 2.38 -0.83 1.77 0.15 1.62 5.36 3.05 2.31
Japan 25.27 13.17 12.10 21.60 13.49 8.11 18.66 9.22 9.44 33.86 15.25 18.61 99.39 51.13 48.26
Kenya --- --- --- --- --- --- 0.01 --- 0.01 --- --- --- 0.01 --- 0.01
Kuwait 2.70 --- 2.70 6.68 --- 6.68 1.78 --- 1.78 1.70 --- 1.70 12.86 --- 12.86
Lebanon 0.12 --- 0.12 0.07 --- 0.07 0.20 --- 0.20 0.10 --- 0.10 0.49 --- 0.49
Luxembourg 0.01 --- 0.01 0.02 --- 0.02 4.48 --- 4.48 0.37 0.00 0.37 4.88 --- 4.88
Malaysia 7.74 1.64 6.10 11.69 1.90 9.79 15.34 0.01 15.33 8.95 1.55 7.40 43.72 5.10 38.62
Maldives --- --- --- --- --- --- --- --- --- --- 0.03 -0.03 --- 0.03 -0.03
Malta 7.27 --- 7.27 16.74 --- 16.74 20.27 --- 20.27 0.46 --- 0.46 44.74 --- 44.74
Mauritius 3.26 --- 3.26 8.84 --- 8.84 10.68 0.04 10.64 10.73 1.10 9.63 33.51 1.14 32.37
Mexico 0.06 --- 0.06 --- --- --- --- --- --- --- --- --- 0.06 --- 0.06
Namibia --- --- --- --- --- --- 0.01 --- 0.01 --- --- --- 0.01 --- 0.01
Nepal 0.01 --- 0.01 --- --- --- --- --- --- --- --- --- 0.01 --- 0.01
Netherlands 38.59 11.17 27.42 28.32 11.74 16.58 31.31 17.61 13.70 50.95 19.78 31.17 149.17 60.30 88.87
New Zealand --- --- --- 0.04 --- 0.04 --- --- --- 0.03 --- 0.03 0.07 --- 0.07
Norway 40.00 --- 40.00 36.63 --- 36.63 46.00 --- 46.00 37.63 --- 37.63 160.26 --- 160.26
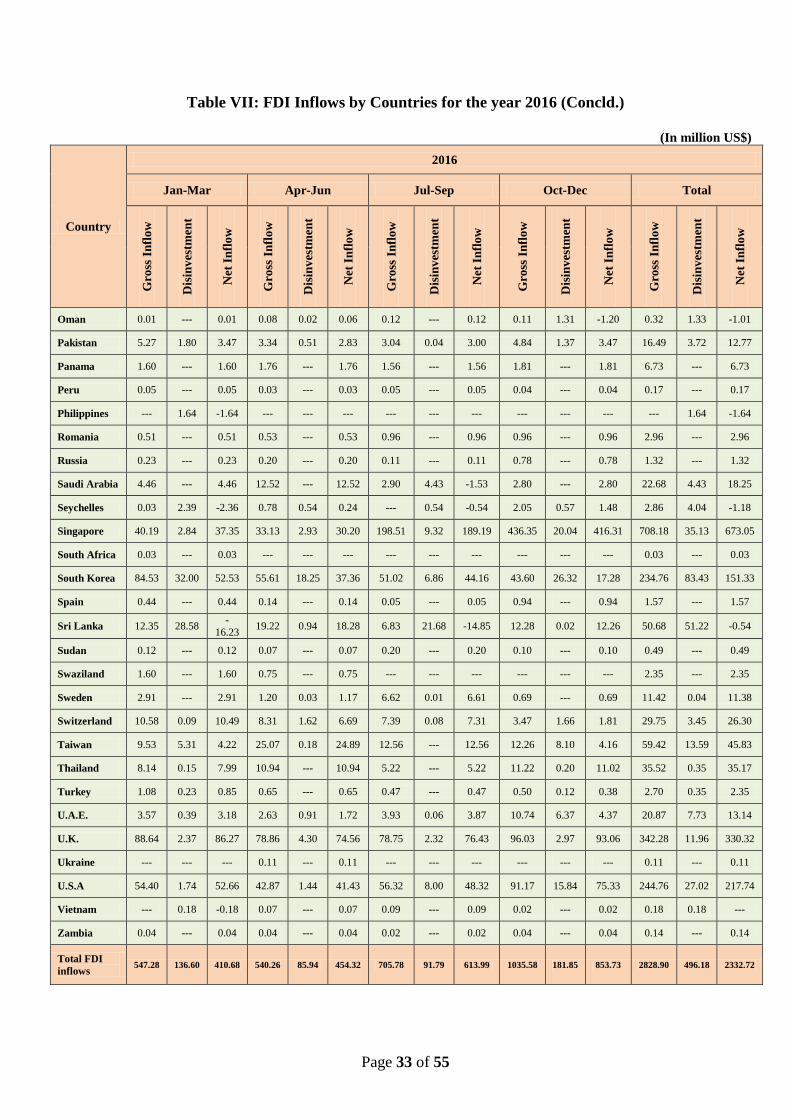
Page 33 of 55
Table VII: FDI Inflows by Countries for the year 2016 (Concld.)
(In million US$)
Country
2016
Jan-Mar Apr-Jun Jul-Sep Oct-Dec Total
Gro
ss I
nfl
ow
Dis
inv
estm
ent
Net
In
flo
w
Gro
ss I
nfl
ow
Dis
inv
estm
ent
Net
In
flo
w
Gro
ss I
nfl
ow
Dis
inv
estm
ent
Net
In
flo
w
Gro
ss I
nfl
ow
Dis
inv
estm
ent
Net
In
flo
w
Gro
ss I
nfl
ow
Dis
inv
estm
ent
Net
In
flo
w
Oman 0.01 --- 0.01 0.08 0.02 0.06 0.12 --- 0.12 0.11 1.31 -1.20 0.32 1.33 -1.01
Pakistan 5.27 1.80 3.47 3.34 0.51 2.83 3.04 0.04 3.00 4.84 1.37 3.47 16.49 3.72 12.77
Panama 1.60 --- 1.60 1.76 --- 1.76 1.56 --- 1.56 1.81 --- 1.81 6.73 --- 6.73
Peru 0.05 --- 0.05 0.03 --- 0.03 0.05 --- 0.05 0.04 --- 0.04 0.17 --- 0.17
Philippines --- 1.64 -1.64 --- --- --- --- --- --- --- --- --- --- 1.64 -1.64
Romania 0.51 --- 0.51 0.53 --- 0.53 0.96 --- 0.96 0.96 --- 0.96 2.96 --- 2.96
Russia 0.23 --- 0.23 0.20 --- 0.20 0.11 --- 0.11 0.78 --- 0.78 1.32 --- 1.32
Saudi Arabia 4.46 --- 4.46 12.52 --- 12.52 2.90 4.43 -1.53 2.80 --- 2.80 22.68 4.43 18.25
Seychelles 0.03 2.39 -2.36 0.78 0.54 0.24 --- 0.54 -0.54 2.05 0.57 1.48 2.86 4.04 -1.18
Singapore 40.19 2.84 37.35 33.13 2.93 30.20 198.51 9.32 189.19 436.35 20.04 416.31 708.18 35.13 673.05
South Africa 0.03 --- 0.03 --- --- --- --- --- --- --- --- --- 0.03 --- 0.03
South Korea 84.53 32.00 52.53 55.61 18.25 37.36 51.02 6.86 44.16 43.60 26.32 17.28 234.76 83.43 151.33
Spain 0.44 --- 0.44 0.14 --- 0.14 0.05 --- 0.05 0.94 --- 0.94 1.57 --- 1.57
Sri Lanka 12.35 28.58 -
16.23 19.22 0.94 18.28 6.83 21.68 -14.85 12.28 0.02 12.26 50.68 51.22 -0.54
Sudan 0.12 --- 0.12 0.07 --- 0.07 0.20 --- 0.20 0.10 --- 0.10 0.49 --- 0.49
Swaziland 1.60 --- 1.60 0.75 --- 0.75 --- --- --- --- --- --- 2.35 --- 2.35
Sweden 2.91 --- 2.91 1.20 0.03 1.17 6.62 0.01 6.61 0.69 --- 0.69 11.42 0.04 11.38
Switzerland 10.58 0.09 10.49 8.31 1.62 6.69 7.39 0.08 7.31 3.47 1.66 1.81 29.75 3.45 26.30
Taiwan 9.53 5.31 4.22 25.07 0.18 24.89 12.56 --- 12.56 12.26 8.10 4.16 59.42 13.59 45.83
Thailand 8.14 0.15 7.99 10.94 --- 10.94 5.22 --- 5.22 11.22 0.20 11.02 35.52 0.35 35.17
Turkey 1.08 0.23 0.85 0.65 --- 0.65 0.47 --- 0.47 0.50 0.12 0.38 2.70 0.35 2.35
U.A.E. 3.57 0.39 3.18 2.63 0.91 1.72 3.93 0.06 3.87 10.74 6.37 4.37 20.87 7.73 13.14
U.K. 88.64 2.37 86.27 78.86 4.30 74.56 78.75 2.32 76.43 96.03 2.97 93.06 342.28 11.96 330.32
Ukraine --- --- --- 0.11 --- 0.11 --- --- --- --- --- --- 0.11 --- 0.11
U.S.A 54.40 1.74 52.66 42.87 1.44 41.43 56.32 8.00 48.32 91.17 15.84 75.33 244.76 27.02 217.74
Vietnam --- 0.18 -0.18 0.07 --- 0.07 0.09 --- 0.09 0.02 --- 0.02 0.18 0.18 ---
Zambia 0.04 --- 0.04 0.04 --- 0.04 0.02 --- 0.02 0.04 --- 0.04 0.14 --- 0.14
Total FDI
inflows 547.28 136.60 410.68 540.26 85.94 454.32 705.78 91.79 613.99 1035.58 181.85 853.73 2828.90 496.18 2332.72
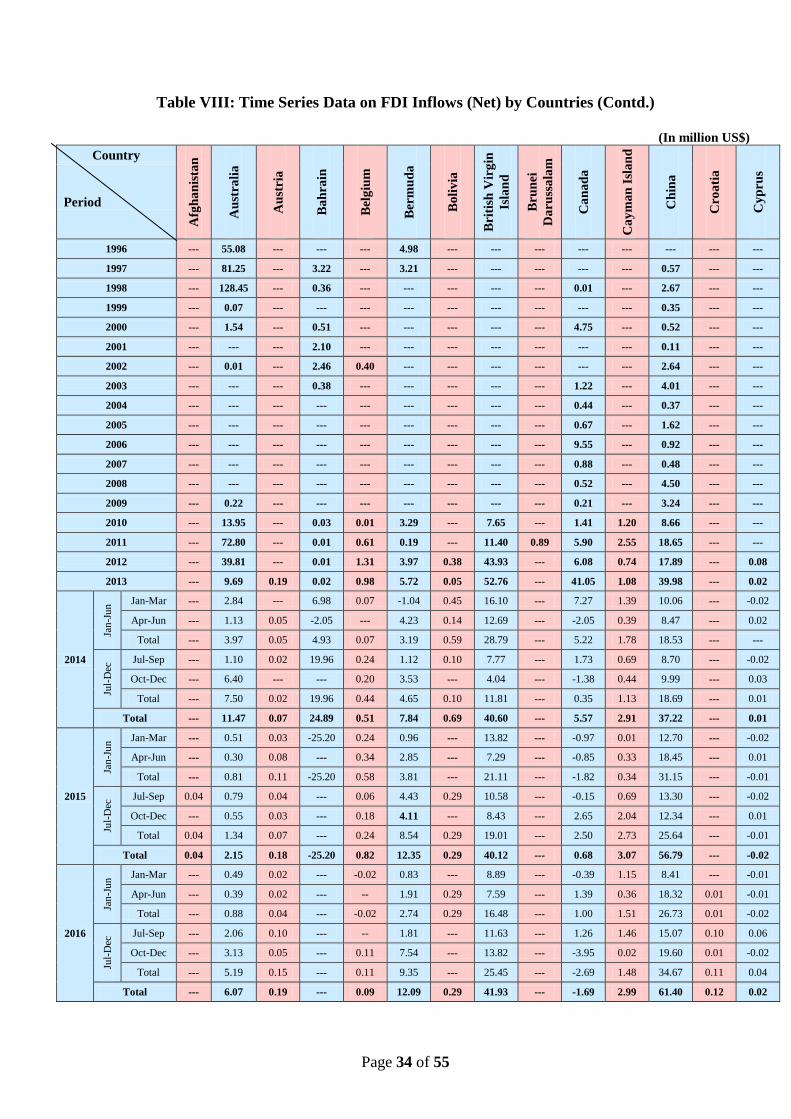
Page 34 of 55
Table VIII: Time Series Data on FDI Inflows (Net) by Countries (Contd.)
(In million US$)
Country
Afg
ha
nis
tan
Au
stra
lia
Au
stri
a
Ba
hra
in
Bel
giu
m
Ber
mu
da
Bo
liv
ia
Bri
tish
Vir
gin
Isla
nd
Bru
nei
Da
russ
ala
m
Ca
na
da
Ca
ym
an
Isl
an
d
Ch
ina
Cro
ati
a
Cy
pru
s
Period
1996 --- 55.08 --- --- --- 4.98 --- --- --- --- --- --- --- ---
1997 --- 81.25 --- 3.22 --- 3.21 --- --- --- --- --- 0.57 --- ---
1998 --- 128.45 --- 0.36 --- --- --- --- --- 0.01 --- 2.67 --- ---
1999 --- 0.07 --- --- --- --- --- --- --- --- --- 0.35 --- ---
2000 --- 1.54 --- 0.51 --- --- --- --- --- 4.75 --- 0.52 --- ---
2001 --- --- --- 2.10 --- --- --- --- --- --- --- 0.11 --- ---
2002 --- 0.01 --- 2.46 0.40 --- --- --- --- --- --- 2.64 --- ---
2003 --- --- --- 0.38 --- --- --- --- --- 1.22 --- 4.01 --- ---
2004 --- --- --- --- --- --- --- --- --- 0.44 --- 0.37 --- ---
2005 --- --- --- --- --- --- --- --- --- 0.67 --- 1.62 --- ---
2006 --- --- --- --- --- --- --- --- --- 9.55 --- 0.92 --- ---
2007 --- --- --- --- --- --- --- --- --- 0.88 --- 0.48 --- ---
2008 --- --- --- --- --- --- --- --- --- 0.52 --- 4.50 --- ---
2009 --- 0.22 --- --- --- --- --- --- --- 0.21 --- 3.24 --- ---
2010 --- 13.95 --- 0.03 0.01 3.29 --- 7.65 --- 1.41 1.20 8.66 --- ---
2011 --- 72.80 --- 0.01 0.61 0.19 --- 11.40 0.89 5.90 2.55 18.65 --- ---
2012 --- 39.81 --- 0.01 1.31 3.97 0.38 43.93 --- 6.08 0.74 17.89 --- 0.08
2013 --- 9.69 0.19 0.02 0.98 5.72 0.05 52.76 --- 41.05 1.08 39.98 --- 0.02
2014
Jan
-Ju
n Jan-Mar --- 2.84 --- 6.98 0.07 -1.04 0.45 16.10 --- 7.27 1.39 10.06 --- -0.02
Apr-Jun --- 1.13 0.05 -2.05 --- 4.23 0.14 12.69 --- -2.05 0.39 8.47 --- 0.02
Total --- 3.97 0.05 4.93 0.07 3.19 0.59 28.79 --- 5.22 1.78 18.53 --- ---
Jul-
Dec
Jul-Sep --- 1.10 0.02 19.96 0.24 1.12 0.10 7.77 --- 1.73 0.69 8.70 --- -0.02
Oct-Dec --- 6.40 --- --- 0.20 3.53 --- 4.04 --- -1.38 0.44 9.99 --- 0.03
Total --- 7.50 0.02 19.96 0.44 4.65 0.10 11.81 --- 0.35 1.13 18.69 --- 0.01
Total --- 11.47 0.07 24.89 0.51 7.84 0.69 40.60 --- 5.57 2.91 37.22 --- 0.01
2015
Jan
-Ju
n Jan-Mar --- 0.51 0.03 -25.20 0.24 0.96 --- 13.82 --- -0.97 0.01 12.70 --- -0.02
Apr-Jun --- 0.30 0.08 --- 0.34 2.85 --- 7.29 --- -0.85 0.33 18.45 --- 0.01
Total --- 0.81 0.11 -25.20 0.58 3.81 --- 21.11 --- -1.82 0.34 31.15 --- -0.01
Jul-
Dec
Jul-Sep 0.04 0.79 0.04 --- 0.06 4.43 0.29 10.58 --- -0.15 0.69 13.30 --- -0.02
Oct-Dec --- 0.55 0.03 --- 0.18 4.11 --- 8.43 --- 2.65 2.04 12.34 --- 0.01
Total 0.04 1.34 0.07 --- 0.24 8.54 0.29 19.01 --- 2.50 2.73 25.64 --- -0.01
Total 0.04 2.15 0.18 -25.20 0.82 12.35 0.29 40.12 --- 0.68 3.07 56.79 --- -0.02
2016
Jan
-Ju
n Jan-Mar --- 0.49 0.02 --- -0.02 0.83 --- 8.89 --- -0.39 1.15 8.41 --- -0.01
Apr-Jun --- 0.39 0.02 --- -- 1.91 0.29 7.59 --- 1.39 0.36 18.32 0.01 -0.01
Total --- 0.88 0.04 --- -0.02 2.74 0.29 16.48 --- 1.00 1.51 26.73 0.01 -0.02
Jul-
Dec
Jul-Sep --- 2.06 0.10 --- -- 1.81 --- 11.63 --- 1.26 1.46 15.07 0.10 0.06
Oct-Dec --- 3.13 0.05 --- 0.11 7.54 --- 13.82 --- -3.95 0.02 19.60 0.01 -0.02
Total --- 5.19 0.15 --- 0.11 9.35 --- 25.45 --- -2.69 1.48 34.67 0.11 0.04
Total --- 6.07 0.19 --- 0.09 12.09 0.29 41.93 --- -1.69 2.99 61.40 0.12 0.02
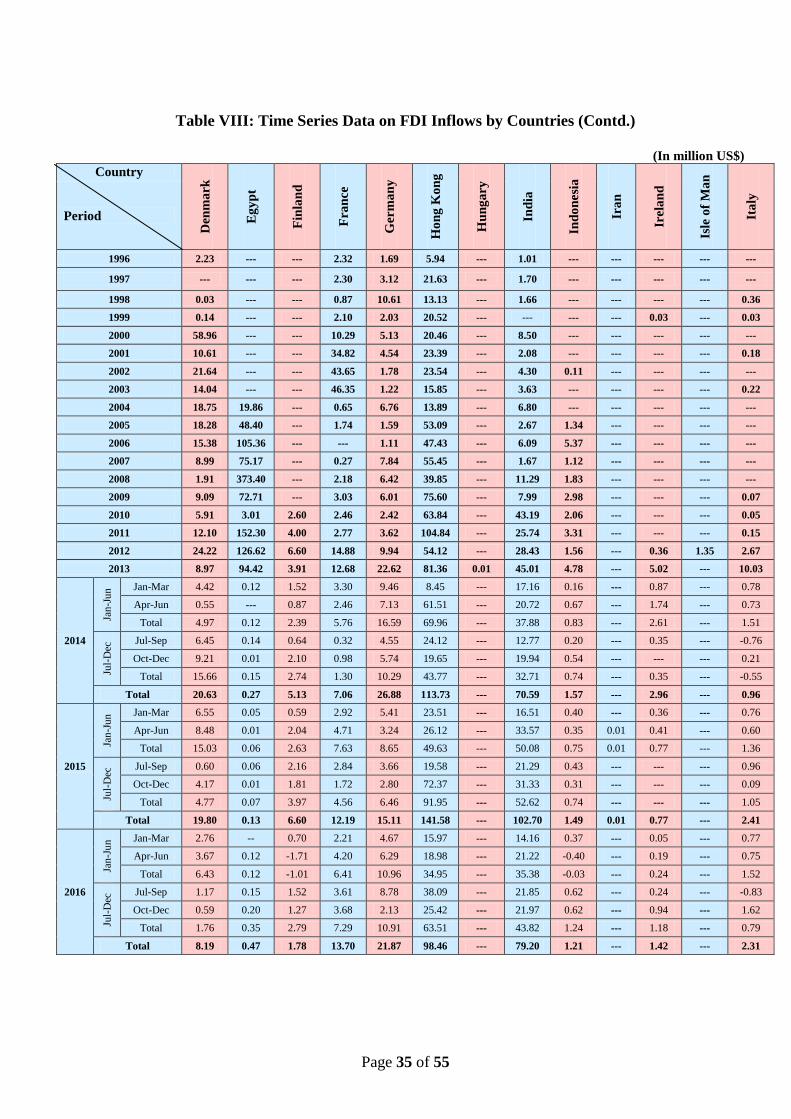
Page 35 of 55
Table VIII: Time Series Data on FDI Inflows by Countries (Contd.)
(In million US$)
Country
Den
ma
rk
Eg
yp
t
Fin
lan
d
Fra
nce
Ger
ma
ny
Ho
ng
Ko
ng
Hu
ng
ary
Ind
ia
Ind
on
esi
a
Ira
n
Irela
nd
Isle
of
Ma
n
Ita
ly
Period
1996 2.23 --- --- 2.32 1.69 5.94 --- 1.01 --- --- --- --- ---
1997 --- --- --- 2.30 3.12 21.63 --- 1.70 --- --- --- --- ---
1998 0.03 --- --- 0.87 10.61 13.13 --- 1.66 --- --- --- --- 0.36
1999 0.14 --- --- 2.10 2.03 20.52 --- --- --- --- 0.03 --- 0.03
2000 58.96 --- --- 10.29 5.13 20.46 --- 8.50 --- --- --- --- ---
2001 10.61 --- --- 34.82 4.54 23.39 --- 2.08 --- --- --- --- 0.18
2002 21.64 --- --- 43.65 1.78 23.54 --- 4.30 0.11 --- --- --- ---
2003 14.04 --- --- 46.35 1.22 15.85 --- 3.63 --- --- --- --- 0.22
2004 18.75 19.86 --- 0.65 6.76 13.89 --- 6.80 --- --- --- --- ---
2005 18.28 48.40 --- 1.74 1.59 53.09 --- 2.67 1.34 --- --- --- ---
2006 15.38 105.36 --- --- 1.11 47.43 --- 6.09 5.37 --- --- --- ---
2007 8.99 75.17 --- 0.27 7.84 55.45 --- 1.67 1.12 --- --- --- ---
2008 1.91 373.40 --- 2.18 6.42 39.85 --- 11.29 1.83 --- --- --- ---
2009 9.09 72.71 --- 3.03 6.01 75.60 --- 7.99 2.98 --- --- --- 0.07
2010 5.91 3.01 2.60 2.46 2.42 63.84 --- 43.19 2.06 --- --- --- 0.05
2011 12.10 152.30 4.00 2.77 3.62 104.84 --- 25.74 3.31 --- --- --- 0.15
2012 24.22 126.62 6.60 14.88 9.94 54.12 --- 28.43 1.56 --- 0.36 1.35 2.67
2013 8.97 94.42 3.91 12.68 22.62 81.36 0.01 45.01 4.78 --- 5.02 --- 10.03
2014
Jan
-Ju
n Jan-Mar 4.42 0.12 1.52 3.30 9.46 8.45 --- 17.16 0.16 --- 0.87 --- 0.78
Apr-Jun 0.55 --- 0.87 2.46 7.13 61.51 --- 20.72 0.67 --- 1.74 --- 0.73
Total 4.97 0.12 2.39 5.76 16.59 69.96 --- 37.88 0.83 --- 2.61 --- 1.51
Jul-
Dec
Jul-Sep 6.45 0.14 0.64 0.32 4.55 24.12 --- 12.77 0.20 --- 0.35 --- -0.76
Oct-Dec 9.21 0.01 2.10 0.98 5.74 19.65 --- 19.94 0.54 --- --- --- 0.21
Total 15.66 0.15 2.74 1.30 10.29 43.77 --- 32.71 0.74 --- 0.35 --- -0.55
Total 20.63 0.27 5.13 7.06 26.88 113.73 --- 70.59 1.57 --- 2.96 --- 0.96
2015
Jan
-Ju
n Jan-Mar 6.55 0.05 0.59 2.92 5.41 23.51 --- 16.51 0.40 --- 0.36 --- 0.76
Apr-Jun 8.48 0.01 2.04 4.71 3.24 26.12 --- 33.57 0.35 0.01 0.41 --- 0.60
Total 15.03 0.06 2.63 7.63 8.65 49.63 --- 50.08 0.75 0.01 0.77 --- 1.36
Jul-
Dec
Jul-Sep 0.60 0.06 2.16 2.84 3.66 19.58 --- 21.29 0.43 --- --- --- 0.96
Oct-Dec 4.17 0.01 1.81 1.72 2.80 72.37 --- 31.33 0.31 --- --- --- 0.09
Total 4.77 0.07 3.97 4.56 6.46 91.95 --- 52.62 0.74 --- --- --- 1.05
Total 19.80 0.13 6.60 12.19 15.11 141.58 --- 102.70 1.49 0.01 0.77 --- 2.41
2016
Jan
-Ju
n Jan-Mar 2.76 -- 0.70 2.21 4.67 15.97 --- 14.16 0.37 --- 0.05 --- 0.77
Apr-Jun 3.67 0.12 -1.71 4.20 6.29 18.98 --- 21.22 -0.40 --- 0.19 --- 0.75
Total 6.43 0.12 -1.01 6.41 10.96 34.95 --- 35.38 -0.03 --- 0.24 --- 1.52
Jul-
Dec
Jul-Sep 1.17 0.15 1.52 3.61 8.78 38.09 --- 21.85 0.62 --- 0.24 --- -0.83
Oct-Dec 0.59 0.20 1.27 3.68 2.13 25.42 --- 21.97 0.62 --- 0.94 --- 1.62
Total 1.76 0.35 2.79 7.29 10.91 63.51 --- 43.82 1.24 --- 1.18 --- 0.79
Total 8.19 0.47 1.78 13.70 21.87 98.46 --- 79.20 1.21 --- 1.42 --- 2.31
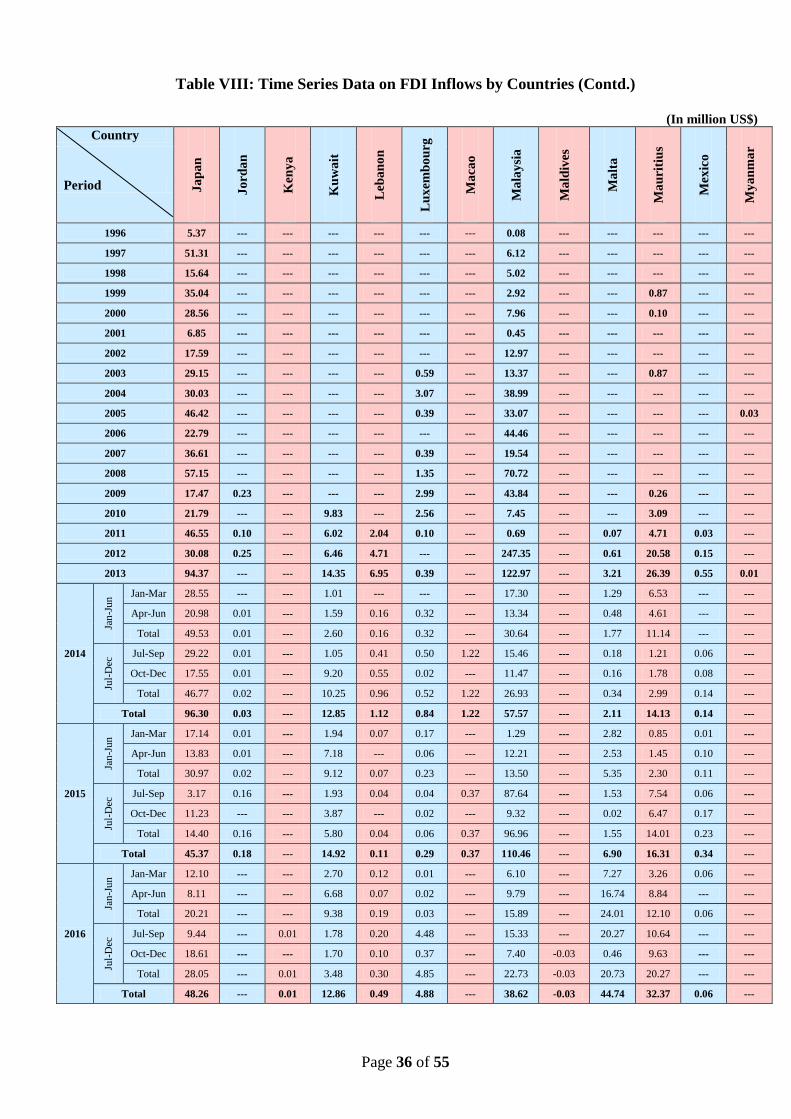
Page 36 of 55
Table VIII: Time Series Data on FDI Inflows by Countries (Contd.)
(In million US$) Country
Ja
pa
n
Jo
rda
n
Ken
ya
Ku
wa
it
Leb
an
on
Lu
xem
bo
urg
Ma
cao
Ma
lay
sia
Ma
ldiv
es
Ma
lta
Ma
uri
tiu
s
Mex
ico
My
an
ma
r
Period
1996 5.37 --- --- --- --- --- --- 0.08 --- --- --- --- ---
1997 51.31 --- --- --- --- --- --- 6.12 --- --- --- --- ---
1998 15.64 --- --- --- --- --- --- 5.02 --- --- --- --- ---
1999 35.04 --- --- --- --- --- --- 2.92 --- --- 0.87 --- ---
2000 28.56 --- --- --- --- --- --- 7.96 --- --- 0.10 --- ---
2001 6.85 --- --- --- --- --- --- 0.45 --- --- --- --- ---
2002 17.59 --- --- --- --- --- --- 12.97 --- --- --- --- ---
2003 29.15 --- --- --- --- 0.59 --- 13.37 --- --- 0.87 --- ---
2004 30.03 --- --- --- --- 3.07 --- 38.99 --- --- --- --- ---
2005 46.42 --- --- --- --- 0.39 --- 33.07 --- --- --- --- 0.03
2006 22.79 --- --- --- --- --- --- 44.46 --- --- --- --- ---
2007 36.61 --- --- --- --- 0.39 --- 19.54 --- --- --- --- ---
2008 57.15 --- --- --- --- 1.35 --- 70.72 --- --- --- --- ---
2009 17.47 0.23 --- --- --- 2.99 --- 43.84 --- --- 0.26 --- ---
2010 21.79 --- --- 9.83 --- 2.56 --- 7.45 --- --- 3.09 --- ---
2011 46.55 0.10 --- 6.02 2.04 0.10 --- 0.69 --- 0.07 4.71 0.03 ---
2012 30.08 0.25 --- 6.46 4.71 --- --- 247.35 --- 0.61 20.58 0.15 ---
2013 94.37 --- --- 14.35 6.95 0.39 --- 122.97 --- 3.21 26.39 0.55 0.01
2014
Jan
-Ju
n Jan-Mar 28.55 --- --- 1.01 --- --- --- 17.30 --- 1.29 6.53 --- ---
Apr-Jun 20.98 0.01 --- 1.59 0.16 0.32 --- 13.34 --- 0.48 4.61 --- ---
Total 49.53 0.01 --- 2.60 0.16 0.32 --- 30.64 --- 1.77 11.14 --- ---
Jul-
Dec
Jul-Sep 29.22 0.01 --- 1.05 0.41 0.50 1.22 15.46 --- 0.18 1.21 0.06 ---
Oct-Dec 17.55 0.01 --- 9.20 0.55 0.02 --- 11.47 --- 0.16 1.78 0.08 ---
Total 46.77 0.02 --- 10.25 0.96 0.52 1.22 26.93 --- 0.34 2.99 0.14 ---
Total 96.30 0.03 --- 12.85 1.12 0.84 1.22 57.57 --- 2.11 14.13 0.14 ---
2015
Jan
-Ju
n Jan-Mar 17.14 0.01 --- 1.94 0.07 0.17 --- 1.29 --- 2.82 0.85 0.01 ---
Apr-Jun 13.83 0.01 --- 7.18 --- 0.06 --- 12.21 --- 2.53 1.45 0.10 ---
Total 30.97 0.02 --- 9.12 0.07 0.23 --- 13.50 --- 5.35 2.30 0.11 ---
Jul-
Dec
Jul-Sep 3.17 0.16 --- 1.93 0.04 0.04 0.37 87.64 --- 1.53 7.54 0.06 ---
Oct-Dec 11.23 --- --- 3.87 --- 0.02 --- 9.32 --- 0.02 6.47 0.17 ---
Total 14.40 0.16 --- 5.80 0.04 0.06 0.37 96.96 --- 1.55 14.01 0.23 ---
Total 45.37 0.18 --- 14.92 0.11 0.29 0.37 110.46 --- 6.90 16.31 0.34 ---
2016
Jan
-Ju
n Jan-Mar 12.10 --- --- 2.70 0.12 0.01 --- 6.10 --- 7.27 3.26 0.06 ---
Apr-Jun 8.11 --- --- 6.68 0.07 0.02 --- 9.79 --- 16.74 8.84 --- ---
Total 20.21 --- --- 9.38 0.19 0.03 --- 15.89 --- 24.01 12.10 0.06 ---
Jul-
Dec
Jul-Sep 9.44 --- 0.01 1.78 0.20 4.48 --- 15.33 --- 20.27 10.64 --- ---
Oct-Dec 18.61 --- --- 1.70 0.10 0.37 --- 7.40 -0.03 0.46 9.63 --- ---
Total 28.05 --- 0.01 3.48 0.30 4.85 --- 22.73 -0.03 20.73 20.27 --- ---
Total 48.26 --- 0.01 12.86 0.49 4.88 --- 38.62 -0.03 44.74 32.37 0.06 ---
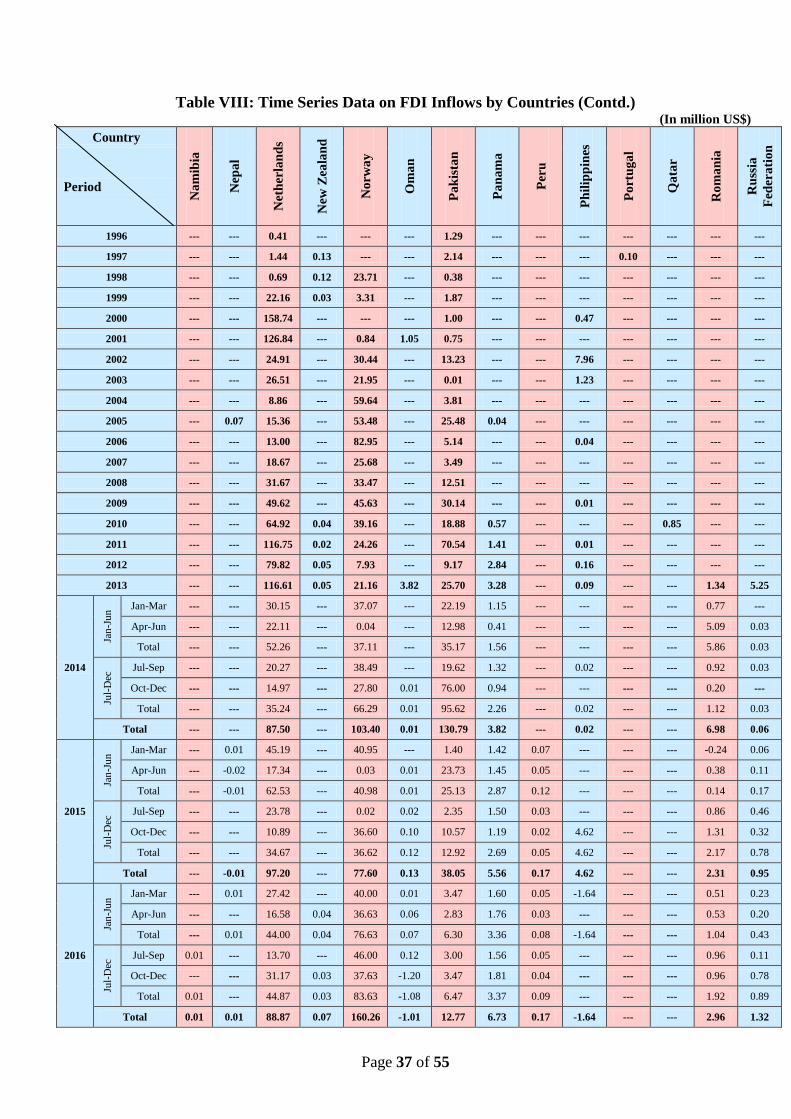
Page 37 of 55
Table VIII: Time Series Data on FDI Inflows by Countries (Contd.) (In million US$)
Country
Na
mib
ia
Nep
al
Net
her
lan
ds
New
Zea
lan
d
No
rwa
y
Om
an
Pa
kis
tan
Pa
na
ma
Per
u
Ph
ilip
pin
es
Po
rtu
ga
l
Qa
tar
Ro
ma
nia
Ru
ssia
Fed
era
tio
n
Period
1996 --- --- 0.41 --- --- --- 1.29 --- --- --- --- --- --- ---
1997 --- --- 1.44 0.13 --- --- 2.14 --- --- --- 0.10 --- --- ---
1998 --- --- 0.69 0.12 23.71 --- 0.38 --- --- --- --- --- --- ---
1999 --- --- 22.16 0.03 3.31 --- 1.87 --- --- --- --- --- --- ---
2000 --- --- 158.74 --- --- --- 1.00 --- --- 0.47 --- --- --- ---
2001 --- --- 126.84 --- 0.84 1.05 0.75 --- --- --- --- --- --- ---
2002 --- --- 24.91 --- 30.44 --- 13.23 --- --- 7.96 --- --- --- ---
2003 --- --- 26.51 --- 21.95 --- 0.01 --- --- 1.23 --- --- --- ---
2004 --- --- 8.86 --- 59.64 --- 3.81 --- --- --- --- --- --- ---
2005 --- 0.07 15.36 --- 53.48 --- 25.48 0.04 --- --- --- --- --- ---
2006 --- --- 13.00 --- 82.95 --- 5.14 --- --- 0.04 --- --- --- ---
2007 --- --- 18.67 --- 25.68 --- 3.49 --- --- --- --- --- --- ---
2008 --- --- 31.67 --- 33.47 --- 12.51 --- --- --- --- --- --- ---
2009 --- --- 49.62 --- 45.63 --- 30.14 --- --- 0.01 --- --- --- ---
2010 --- --- 64.92 0.04 39.16 --- 18.88 0.57 --- --- --- 0.85 --- ---
2011 --- --- 116.75 0.02 24.26 --- 70.54 1.41 --- 0.01 --- --- --- ---
2012 --- --- 79.82 0.05 7.93 --- 9.17 2.84 --- 0.16 --- --- --- ---
2013 --- --- 116.61 0.05 21.16 3.82 25.70 3.28 --- 0.09 --- --- 1.34 5.25
2014
Jan
-Ju
n Jan-Mar --- --- 30.15 --- 37.07 --- 22.19 1.15 --- --- --- --- 0.77 ---
Apr-Jun --- --- 22.11 --- 0.04 --- 12.98 0.41 --- --- --- --- 5.09 0.03
Total --- --- 52.26 --- 37.11 --- 35.17 1.56 --- --- --- --- 5.86 0.03
Jul-
Dec
Jul-Sep --- --- 20.27 --- 38.49 --- 19.62 1.32 --- 0.02 --- --- 0.92 0.03
Oct-Dec --- --- 14.97 --- 27.80 0.01 76.00 0.94 --- --- --- --- 0.20 ---
Total --- --- 35.24 --- 66.29 0.01 95.62 2.26 --- 0.02 --- --- 1.12 0.03
Total --- --- 87.50 --- 103.40 0.01 130.79 3.82 --- 0.02 --- --- 6.98 0.06
2015
Jan
-Ju
n Jan-Mar --- 0.01 45.19 --- 40.95 --- 1.40 1.42 0.07 --- --- --- -0.24 0.06
Apr-Jun --- -0.02 17.34 --- 0.03 0.01 23.73 1.45 0.05 --- --- --- 0.38 0.11
Total --- -0.01 62.53 --- 40.98 0.01 25.13 2.87 0.12 --- --- --- 0.14 0.17
Jul-
Dec
Jul-Sep --- --- 23.78 --- 0.02 0.02 2.35 1.50 0.03 --- --- --- 0.86 0.46
Oct-Dec --- --- 10.89 --- 36.60 0.10 10.57 1.19 0.02 4.62 --- --- 1.31 0.32
Total --- --- 34.67 --- 36.62 0.12 12.92 2.69 0.05 4.62 --- --- 2.17 0.78
Total --- -0.01 97.20 --- 77.60 0.13 38.05 5.56 0.17 4.62 --- --- 2.31 0.95
2016
Jan
-Ju
n Jan-Mar --- 0.01 27.42 --- 40.00 0.01 3.47 1.60 0.05 -1.64 --- --- 0.51 0.23
Apr-Jun --- --- 16.58 0.04 36.63 0.06 2.83 1.76 0.03 --- --- --- 0.53 0.20
Total --- 0.01 44.00 0.04 76.63 0.07 6.30 3.36 0.08 -1.64 --- --- 1.04 0.43
Jul-
Dec
Jul-Sep 0.01 --- 13.70 --- 46.00 0.12 3.00 1.56 0.05 --- --- --- 0.96 0.11
Oct-Dec --- --- 31.17 0.03 37.63 -1.20 3.47 1.81 0.04 --- --- --- 0.96 0.78
Total 0.01 --- 44.87 0.03 83.63 -1.08 6.47 3.37 0.09 --- --- --- 1.92 0.89
Total 0.01 0.01 88.87 0.07 160.26 -1.01 12.77 6.73 0.17 -1.64 --- --- 2.96 1.32
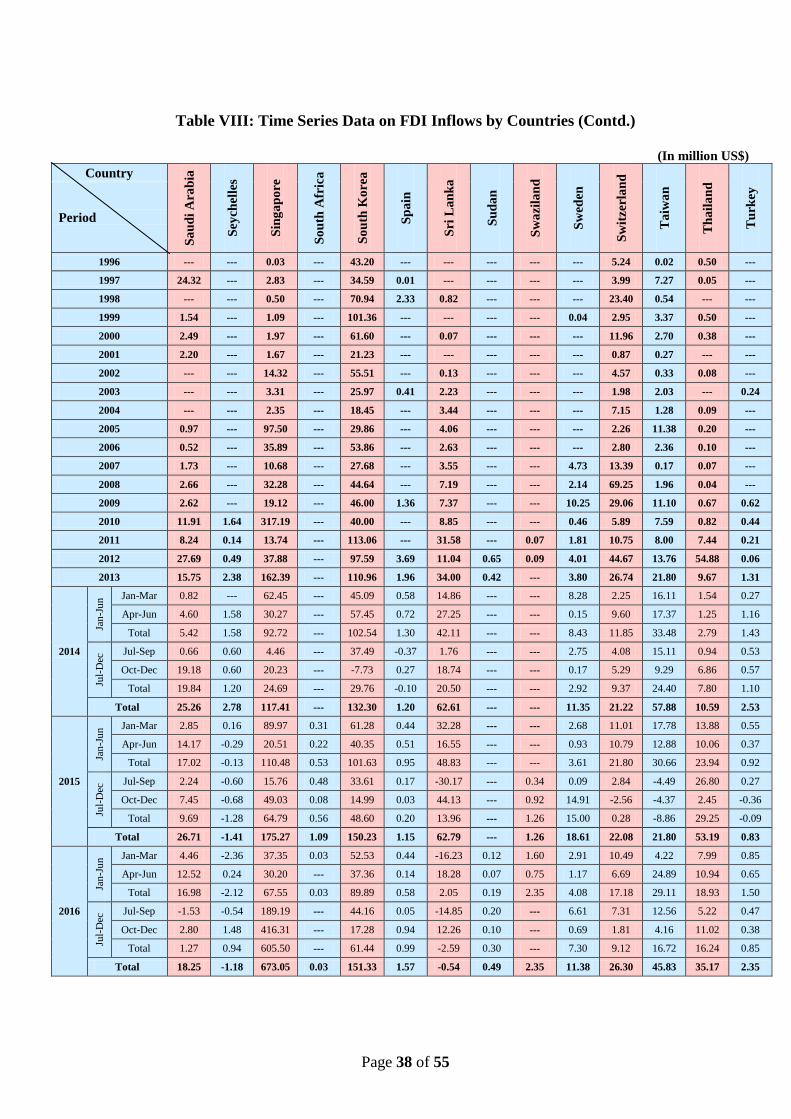
Page 38 of 55
Table VIII: Time Series Data on FDI Inflows by Countries (Contd.)
(In million US$)
Country S
au
di
Ara
bia
Sey
chel
les
Sin
ga
po
re
So
uth
Afr
ica
So
uth
Ko
rea
Sp
ain
Sri
La
nk
a
Su
da
n
Sw
azi
lan
d
Sw
eden
Sw
itzer
lan
d
Ta
iwa
n
Th
ail
an
d
Tu
rkey
Period
1996 --- --- 0.03 --- 43.20 --- --- --- --- --- 5.24 0.02 0.50 ---
1997 24.32 --- 2.83 --- 34.59 0.01 --- --- --- --- 3.99 7.27 0.05 ---
1998 --- --- 0.50 --- 70.94 2.33 0.82 --- --- --- 23.40 0.54 --- ---
1999 1.54 --- 1.09 --- 101.36 --- --- --- --- 0.04 2.95 3.37 0.50 ---
2000 2.49 --- 1.97 --- 61.60 --- 0.07 --- --- --- 11.96 2.70 0.38 ---
2001 2.20 --- 1.67 --- 21.23 --- --- --- --- --- 0.87 0.27 --- ---
2002 --- --- 14.32 --- 55.51 --- 0.13 --- --- --- 4.57 0.33 0.08 ---
2003 --- --- 3.31 --- 25.97 0.41 2.23 --- --- --- 1.98 2.03 --- 0.24
2004 --- --- 2.35 --- 18.45 --- 3.44 --- --- --- 7.15 1.28 0.09 ---
2005 0.97 --- 97.50 --- 29.86 --- 4.06 --- --- --- 2.26 11.38 0.20 ---
2006 0.52 --- 35.89 --- 53.86 --- 2.63 --- --- --- 2.80 2.36 0.10 ---
2007 1.73 --- 10.68 --- 27.68 --- 3.55 --- --- 4.73 13.39 0.17 0.07 ---
2008 2.66 --- 32.28 --- 44.64 --- 7.19 --- --- 2.14 69.25 1.96 0.04 ---
2009 2.62 --- 19.12 --- 46.00 1.36 7.37 --- --- 10.25 29.06 11.10 0.67 0.62
2010 11.91 1.64 317.19 --- 40.00 --- 8.85 --- --- 0.46 5.89 7.59 0.82 0.44
2011 8.24 0.14 13.74 --- 113.06 --- 31.58 --- 0.07 1.81 10.75 8.00 7.44 0.21
2012 27.69 0.49 37.88 --- 97.59 3.69 11.04 0.65 0.09 4.01 44.67 13.76 54.88 0.06
2013 15.75 2.38 162.39 --- 110.96 1.96 34.00 0.42 --- 3.80 26.74 21.80 9.67 1.31
2014
Jan
-Ju
n Jan-Mar 0.82 --- 62.45 --- 45.09 0.58 14.86 --- --- 8.28 2.25 16.11 1.54 0.27
Apr-Jun 4.60 1.58 30.27 --- 57.45 0.72 27.25 --- --- 0.15 9.60 17.37 1.25 1.16
Total 5.42 1.58 92.72 --- 102.54 1.30 42.11 --- --- 8.43 11.85 33.48 2.79 1.43
Jul-
Dec
Jul-Sep 0.66 0.60 4.46 --- 37.49 -0.37 1.76 --- --- 2.75 4.08 15.11 0.94 0.53
Oct-Dec 19.18 0.60 20.23 --- -7.73 0.27 18.74 --- --- 0.17 5.29 9.29 6.86 0.57
Total 19.84 1.20 24.69 --- 29.76 -0.10 20.50 --- --- 2.92 9.37 24.40 7.80 1.10
Total 25.26 2.78 117.41 --- 132.30 1.20 62.61 --- --- 11.35 21.22 57.88 10.59 2.53
2015
Jan
-Ju
n Jan-Mar 2.85 0.16 89.97 0.31 61.28 0.44 32.28 --- --- 2.68 11.01 17.78 13.88 0.55
Apr-Jun 14.17 -0.29 20.51 0.22 40.35 0.51 16.55 --- --- 0.93 10.79 12.88 10.06 0.37
Total 17.02 -0.13 110.48 0.53 101.63 0.95 48.83 --- --- 3.61 21.80 30.66 23.94 0.92
Jul-
Dec
Jul-Sep 2.24 -0.60 15.76 0.48 33.61 0.17 -30.17 --- 0.34 0.09 2.84 -4.49 26.80 0.27
Oct-Dec 7.45 -0.68 49.03 0.08 14.99 0.03 44.13 --- 0.92 14.91 -2.56 -4.37 2.45 -0.36
Total 9.69 -1.28 64.79 0.56 48.60 0.20 13.96 --- 1.26 15.00 0.28 -8.86 29.25 -0.09
Total 26.71 -1.41 175.27 1.09 150.23 1.15 62.79 --- 1.26 18.61 22.08 21.80 53.19 0.83
2016
Jan
-Ju
n Jan-Mar 4.46 -2.36 37.35 0.03 52.53 0.44 -16.23 0.12 1.60 2.91 10.49 4.22 7.99 0.85
Apr-Jun 12.52 0.24 30.20 --- 37.36 0.14 18.28 0.07 0.75 1.17 6.69 24.89 10.94 0.65
Total 16.98 -2.12 67.55 0.03 89.89 0.58 2.05 0.19 2.35 4.08 17.18 29.11 18.93 1.50
Jul-
Dec
Jul-Sep -1.53 -0.54 189.19 --- 44.16 0.05 -14.85 0.20 --- 6.61 7.31 12.56 5.22 0.47
Oct-Dec 2.80 1.48 416.31 --- 17.28 0.94 12.26 0.10 --- 0.69 1.81 4.16 11.02 0.38
Total 1.27 0.94 605.50 --- 61.44 0.99 -2.59 0.30 --- 7.30 9.12 16.72 16.24 0.85
Total 18.25 -1.18 673.05 0.03 151.33 1.57 -0.54 0.49 2.35 11.38 26.30 45.83 35.17 2.35
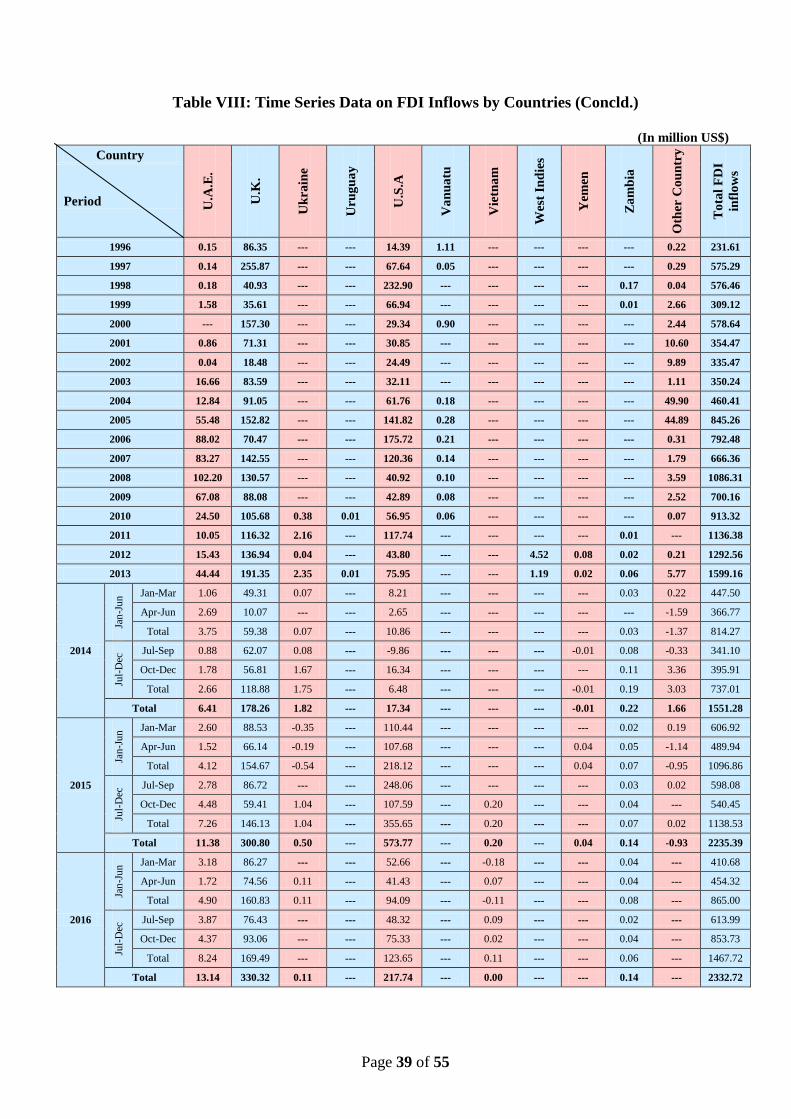
Page 39 of 55
Table VIII: Time Series Data on FDI Inflows by Countries (Concld.)
(In million US$)
Country
U.A
.E.
U.K
.
Uk
rain
e
Uru
gu
ay
U.S
.A
Va
nu
atu
Vie
tna
m
Wes
t In
die
s
Yem
en
Za
mb
ia
Oth
er C
ou
ntr
y
To
tal
FD
I
infl
ow
s
Period
1996 0.15 86.35 --- --- 14.39 1.11 --- --- --- --- 0.22 231.61
1997 0.14 255.87 --- --- 67.64 0.05 --- --- --- --- 0.29 575.29
1998 0.18 40.93 --- --- 232.90 --- --- --- --- 0.17 0.04 576.46
1999 1.58 35.61 --- --- 66.94 --- --- --- --- 0.01 2.66 309.12
2000 --- 157.30 --- --- 29.34 0.90 --- --- --- --- 2.44 578.64
2001 0.86 71.31 --- --- 30.85 --- --- --- --- --- 10.60 354.47
2002 0.04 18.48 --- --- 24.49 --- --- --- --- --- 9.89 335.47
2003 16.66 83.59 --- --- 32.11 --- --- --- --- --- 1.11 350.24
2004 12.84 91.05 --- --- 61.76 0.18 --- --- --- --- 49.90 460.41
2005 55.48 152.82 --- --- 141.82 0.28 --- --- --- --- 44.89 845.26
2006 88.02 70.47 --- --- 175.72 0.21 --- --- --- --- 0.31 792.48
2007 83.27 142.55 --- --- 120.36 0.14 --- --- --- --- 1.79 666.36
2008 102.20 130.57 --- --- 40.92 0.10 --- --- --- --- 3.59 1086.31
2009 67.08 88.08 --- --- 42.89 0.08 --- --- --- --- 2.52 700.16
2010 24.50 105.68 0.38 0.01 56.95 0.06 --- --- --- --- 0.07 913.32
2011 10.05 116.32 2.16 --- 117.74 --- --- --- --- 0.01 --- 1136.38
2012 15.43 136.94 0.04 --- 43.80 --- --- 4.52 0.08 0.02 0.21 1292.56
2013 44.44 191.35 2.35 0.01 75.95 --- --- 1.19 0.02 0.06 5.77 1599.16
2014
Jan
-Ju
n Jan-Mar 1.06 49.31 0.07 --- 8.21 --- --- --- --- 0.03 0.22 447.50
Apr-Jun 2.69 10.07 --- --- 2.65 --- --- --- --- --- -1.59 366.77
Total 3.75 59.38 0.07 --- 10.86 --- --- --- --- 0.03 -1.37 814.27
Jul-
Dec
Jul-Sep 0.88 62.07 0.08 --- -9.86 --- --- --- -0.01 0.08 -0.33 341.10
Oct-Dec 1.78 56.81 1.67 --- 16.34 --- --- --- --- 0.11 3.36 395.91
Total 2.66 118.88 1.75 --- 6.48 --- --- --- -0.01 0.19 3.03 737.01
Total 6.41 178.26 1.82 --- 17.34 --- --- --- -0.01 0.22 1.66 1551.28
2015
Jan
-Ju
n Jan-Mar 2.60 88.53 -0.35 --- 110.44 --- --- --- --- 0.02 0.19 606.92
Apr-Jun 1.52 66.14 -0.19 --- 107.68 --- --- --- 0.04 0.05 -1.14 489.94
Total 4.12 154.67 -0.54 --- 218.12 --- --- --- 0.04 0.07 -0.95 1096.86
Jul-
Dec
Jul-Sep 2.78 86.72 --- --- 248.06 --- --- --- --- 0.03 0.02 598.08
Oct-Dec 4.48 59.41 1.04 --- 107.59 --- 0.20 --- --- 0.04 --- 540.45
Total 7.26 146.13 1.04 --- 355.65 --- 0.20 --- --- 0.07 0.02 1138.53
Total 11.38 300.80 0.50 --- 573.77 --- 0.20 --- 0.04 0.14 -0.93 2235.39
2016
Jan
-Ju
n Jan-Mar 3.18 86.27 --- --- 52.66 --- -0.18 --- --- 0.04 --- 410.68
Apr-Jun 1.72 74.56 0.11 --- 41.43 --- 0.07 --- --- 0.04 --- 454.32
Total 4.90 160.83 0.11 --- 94.09 --- -0.11 --- --- 0.08 --- 865.00
Jul-
Dec
Jul-Sep 3.87 76.43 --- --- 48.32 --- 0.09 --- --- 0.02 --- 613.99
Oct-Dec 4.37 93.06 --- --- 75.33 --- 0.02 --- --- 0.04 --- 853.73
Total 8.24 169.49 --- --- 123.65 --- 0.11 --- --- 0.06 --- 1467.72
Total 13.14 330.32 0.11 --- 217.74 --- 0.00 --- --- 0.14 --- 2332.72
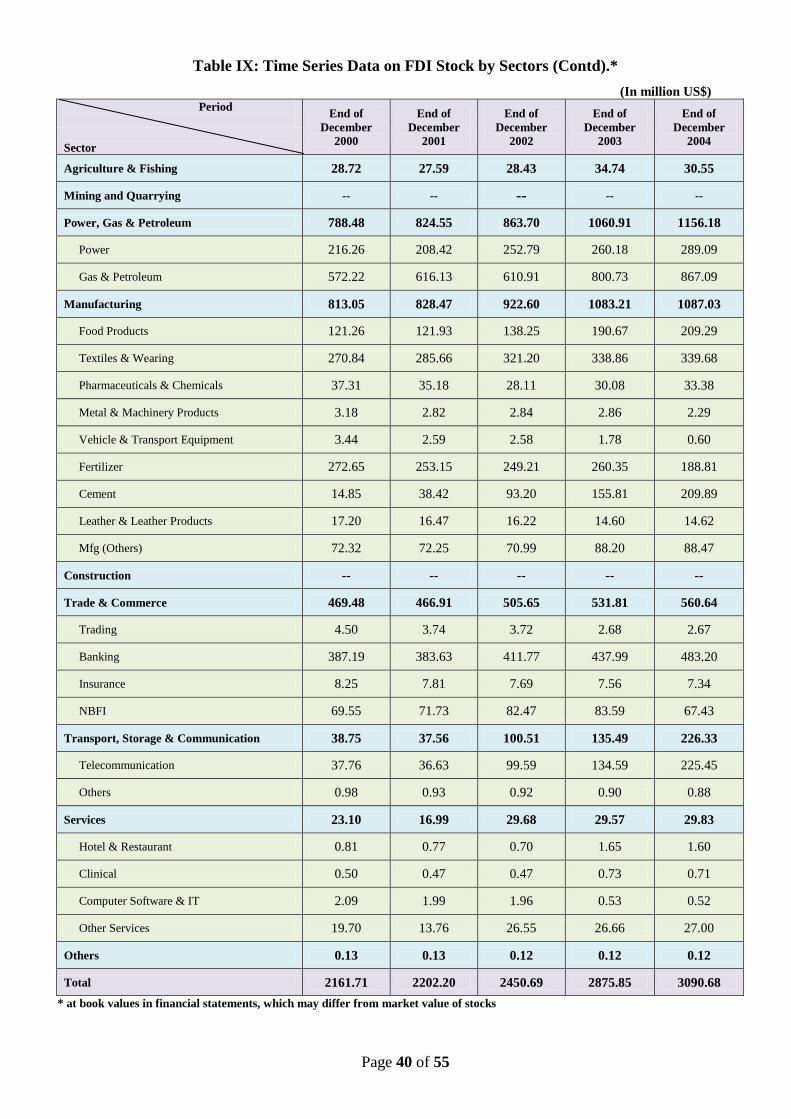
Page 40 of 55
Table IX: Time Series Data on FDI Stock by Sectors (Contd).*
(In million US$)
Period
End of
December
2000
End of
December
2001
End of
December
2002
End of
December
2003
End of
December
2004 Sector
Agriculture & Fishing 28.72 27.59 28.43 34.74 30.55
Mining and Quarrying -- -- -- -- --
Power, Gas & Petroleum 788.48 824.55 863.70 1060.91 1156.18
Power 216.26 208.42 252.79 260.18 289.09
Gas & Petroleum 572.22 616.13 610.91 800.73 867.09
Manufacturing 813.05 828.47 922.60 1083.21 1087.03
Food Products 121.26 121.93 138.25 190.67 209.29
Textiles & Wearing 270.84 285.66 321.20 338.86 339.68
Pharmaceuticals & Chemicals 37.31 35.18 28.11 30.08 33.38
Metal & Machinery Products 3.18 2.82 2.84 2.86 2.29
Vehicle & Transport Equipment 3.44 2.59 2.58 1.78 0.60
Fertilizer 272.65 253.15 249.21 260.35 188.81
Cement 14.85 38.42 93.20 155.81 209.89
Leather & Leather Products 17.20 16.47 16.22 14.60 14.62
Mfg (Others) 72.32 72.25 70.99 88.20 88.47
Construction -- -- -- -- --
Trade & Commerce 469.48 466.91 505.65 531.81 560.64
Trading 4.50 3.74 3.72 2.68 2.67
Banking 387.19 383.63 411.77 437.99 483.20
Insurance 8.25 7.81 7.69 7.56 7.34
NBFI 69.55 71.73 82.47 83.59 67.43
Transport, Storage & Communication 38.75 37.56 100.51 135.49 226.33
Telecommunication 37.76 36.63 99.59 134.59 225.45
Others 0.98 0.93 0.92 0.90 0.88
Services 23.10 16.99 29.68 29.57 29.83
Hotel & Restaurant 0.81 0.77 0.70 1.65 1.60
Clinical 0.50 0.47 0.47 0.73 0.71
Computer Software & IT 2.09 1.99 1.96 0.53 0.52
Other Services 19.70 13.76 26.55 26.66 27.00
Others 0.13 0.13 0.12 0.12 0.12
Total 2161.71
2202.20 2450.69 2875.85
3090.68
* at book values in financial statements, which may differ from market value of stocks
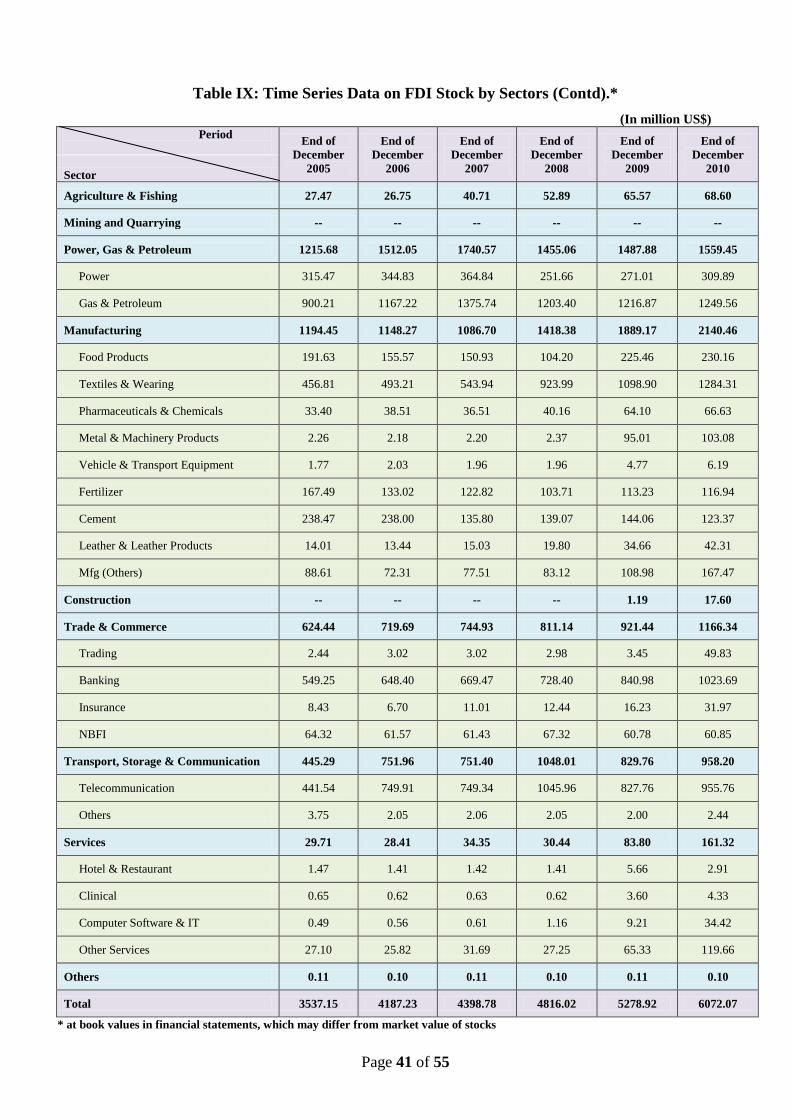
Page 41 of 55
Table IX: Time Series Data on FDI Stock by Sectors (Contd).*
(In million US$)
Period
End of
December
2005
End of
December
2006
End of
December
2007
End of
December
2008
End of
December
2009
End of
December
2010 Sector
Agriculture & Fishing 27.47 26.75 40.71 52.89 65.57 68.60
Mining and Quarrying -- -- -- -- -- --
Power, Gas & Petroleum 1215.68 1512.05 1740.57 1455.06 1487.88 1559.45
Power 315.47 344.83 364.84 251.66 271.01 309.89
Gas & Petroleum 900.21 1167.22 1375.74 1203.40 1216.87 1249.56
Manufacturing 1194.45 1148.27 1086.70 1418.38 1889.17 2140.46
Food Products 191.63 155.57 150.93 104.20 225.46 230.16
Textiles & Wearing 456.81 493.21 543.94 923.99 1098.90 1284.31
Pharmaceuticals & Chemicals 33.40 38.51 36.51 40.16 64.10 66.63
Metal & Machinery Products 2.26 2.18 2.20 2.37 95.01 103.08
Vehicle & Transport Equipment 1.77 2.03 1.96 1.96 4.77 6.19
Fertilizer 167.49 133.02 122.82 103.71 113.23 116.94
Cement 238.47 238.00 135.80 139.07 144.06 123.37
Leather & Leather Products 14.01 13.44 15.03 19.80 34.66 42.31
Mfg (Others) 88.61 72.31 77.51 83.12 108.98 167.47
Construction -- -- -- -- 1.19 17.60
Trade & Commerce 624.44 719.69 744.93 811.14 921.44 1166.34
Trading 2.44 3.02 3.02 2.98 3.45 49.83
Banking 549.25 648.40 669.47 728.40 840.98 1023.69
Insurance 8.43 6.70 11.01 12.44 16.23 31.97
NBFI 64.32 61.57 61.43 67.32 60.78 60.85
Transport, Storage & Communication 445.29 751.96 751.40 1048.01 829.76 958.20
Telecommunication 441.54 749.91 749.34 1045.96 827.76 955.76
Others 3.75 2.05 2.06 2.05 2.00 2.44
Services 29.71 28.41 34.35 30.44 83.80 161.32
Hotel & Restaurant 1.47 1.41 1.42 1.41 5.66 2.91
Clinical 0.65 0.62 0.63 0.62 3.60 4.33
Computer Software & IT 0.49 0.56 0.61 1.16 9.21 34.42
Other Services 27.10 25.82 31.69 27.25 65.33 119.66
Others 0.11 0.10 0.11 0.10 0.11 0.10
Total 3537.15 4187.23 4398.78 4816.02 5278.92 6072.07
* at book values in financial statements, which may differ from market value of stocks
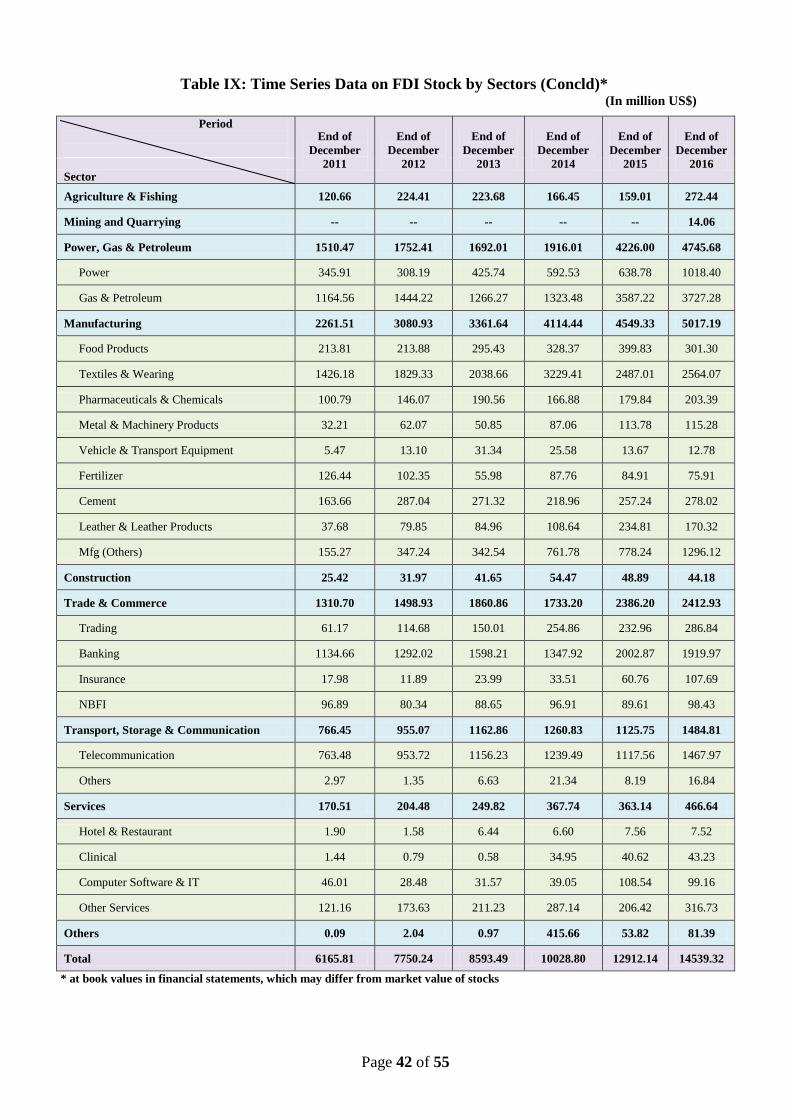
Page 42 of 55
Table IX: Time Series Data on FDI Stock by Sectors (Concld)*
(In million US$)
Period
End of
December
2011
End of
December
2012
End of
December
2013
End of
December
2014
End of
December
2015
End of
December
2016 Sector
Agriculture & Fishing 120.66 224.41 223.68 166.45 159.01 272.44
Mining and Quarrying -- -- -- -- -- 14.06
Power, Gas & Petroleum 1510.47 1752.41 1692.01 1916.01 4226.00 4745.68
Power 345.91 308.19 425.74 592.53 638.78 1018.40
Gas & Petroleum 1164.56 1444.22 1266.27 1323.48 3587.22 3727.28
Manufacturing 2261.51 3080.93 3361.64 4114.44 4549.33 5017.19
Food Products 213.81 213.88 295.43 328.37 399.83 301.30
Textiles & Wearing 1426.18 1829.33 2038.66 3229.41 2487.01 2564.07
Pharmaceuticals & Chemicals 100.79 146.07 190.56 166.88 179.84 203.39
Metal & Machinery Products 32.21 62.07 50.85 87.06 113.78 115.28
Vehicle & Transport Equipment 5.47 13.10 31.34 25.58 13.67 12.78
Fertilizer 126.44 102.35 55.98 87.76 84.91 75.91
Cement 163.66 287.04 271.32 218.96 257.24 278.02
Leather & Leather Products 37.68 79.85 84.96 108.64 234.81 170.32
Mfg (Others) 155.27 347.24 342.54 761.78 778.24 1296.12
Construction 25.42 31.97 41.65 54.47 48.89 44.18
Trade & Commerce 1310.70 1498.93 1860.86 1733.20 2386.20 2412.93
Trading 61.17 114.68 150.01 254.86 232.96 286.84
Banking 1134.66 1292.02 1598.21 1347.92 2002.87 1919.97
Insurance 17.98 11.89 23.99 33.51 60.76 107.69
NBFI 96.89 80.34 88.65 96.91 89.61 98.43
Transport, Storage & Communication 766.45 955.07 1162.86 1260.83 1125.75 1484.81
Telecommunication 763.48 953.72 1156.23 1239.49 1117.56 1467.97
Others 2.97 1.35 6.63 21.34 8.19 16.84
Services 170.51 204.48 249.82 367.74 363.14 466.64
Hotel & Restaurant 1.90 1.58 6.44 6.60 7.56 7.52
Clinical 1.44 0.79 0.58 34.95 40.62 43.23
Computer Software & IT 46.01 28.48 31.57 39.05 108.54 99.16
Other Services 121.16 173.63 211.23 287.14 206.42 316.73
Others 0.09 2.04 0.97 415.66 53.82 81.39
Total 6165.81 7750.24 8593.49 10028.80 12912.14 14539.32
* at book values in financial statements, which may differ from market value of stocks
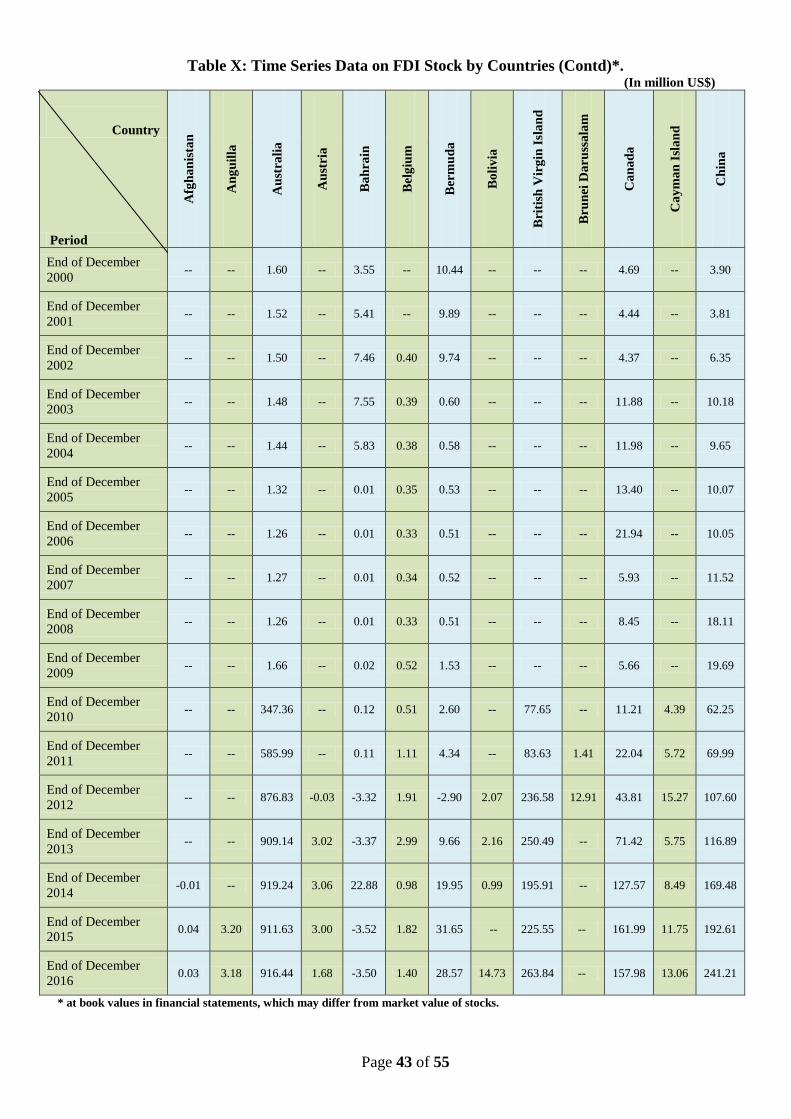
Page 43 of 55
Table X: Time Series Data on FDI Stock by Countries (Contd)*. (In million US$)
Country
Afg
ha
nis
tan
An
gu
illa
Au
stra
lia
Au
stri
a
Ba
hra
in
Bel
giu
m
Ber
mu
da
Bo
liv
ia
Bri
tish
Vir
gin
Isl
an
d
Bru
nei
Da
russ
ala
m
Ca
na
da
Ca
ym
an
Isl
an
d
Ch
ina
Period
End of December
2000 -- -- 1.60 -- 3.55 -- 10.44 -- -- -- 4.69 -- 3.90
End of December
2001 -- -- 1.52 -- 5.41 -- 9.89 -- -- -- 4.44 -- 3.81
End of December
2002 -- -- 1.50 -- 7.46 0.40 9.74 -- -- -- 4.37 -- 6.35
End of December
2003 -- -- 1.48 -- 7.55 0.39 0.60 -- -- -- 11.88 -- 10.18
End of December
2004 -- -- 1.44 -- 5.83 0.38 0.58 -- -- -- 11.98 -- 9.65
End of December
2005 -- -- 1.32 -- 0.01 0.35 0.53 -- -- -- 13.40 -- 10.07
End of December
2006 -- -- 1.26 -- 0.01 0.33 0.51 -- -- -- 21.94 -- 10.05
End of December
2007 -- -- 1.27 -- 0.01 0.34 0.52 -- -- -- 5.93 -- 11.52
End of December
2008 -- -- 1.26 -- 0.01 0.33 0.51 -- -- -- 8.45 -- 18.11
End of December
2009 -- -- 1.66 -- 0.02 0.52 1.53 -- -- -- 5.66 -- 19.69
End of December
2010 -- -- 347.36 -- 0.12 0.51 2.60 -- 77.65 -- 11.21 4.39 62.25
End of December
2011 -- -- 585.99 -- 0.11 1.11 4.34 -- 83.63 1.41 22.04 5.72 69.99
End of December
2012 -- -- 876.83 -0.03 -3.32 1.91 -2.90 2.07 236.58 12.91 43.81 15.27 107.60
End of December
2013 -- -- 909.14 3.02 -3.37 2.99 9.66 2.16 250.49 -- 71.42 5.75 116.89
End of December
2014 -0.01 -- 919.24 3.06 22.88 0.98 19.95 0.99 195.91 -- 127.57 8.49 169.48
End of December
2015 0.04 3.20 911.63 3.00 -3.52 1.82 31.65 -- 225.55 -- 161.99 11.75 192.61
End of December
2016 0.03 3.18 916.44 1.68 -3.50 1.40 28.57 14.73 263.84 -- 157.98 13.06 241.21
* at book values in financial statements, which may differ from market value of stocks.
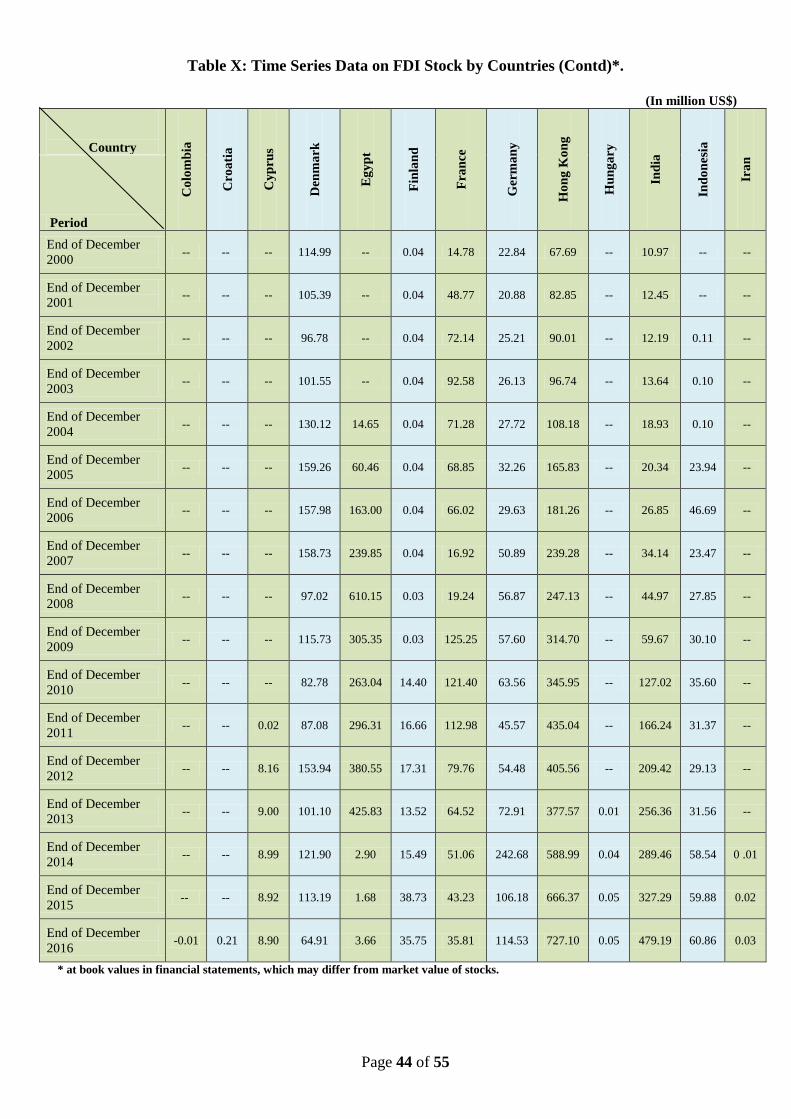
Page 44 of 55
Table X: Time Series Data on FDI Stock by Countries (Contd)*.
(In million US$)
Country
Co
lom
bia
Cro
ati
a
Cy
pru
s
Den
ma
rk
Eg
yp
t
Fin
lan
d
Fra
nce
Ger
ma
ny
Ho
ng
Ko
ng
Hu
ng
ary
Ind
ia
Ind
on
esi
a
Ira
n
Period
End of December
2000 -- -- -- 114.99 -- 0.04 14.78 22.84 67.69 -- 10.97 -- --
End of December
2001 -- -- -- 105.39 -- 0.04 48.77 20.88 82.85 -- 12.45 -- --
End of December
2002 -- -- -- 96.78 -- 0.04 72.14 25.21 90.01 -- 12.19 0.11 --
End of December
2003 -- -- -- 101.55 -- 0.04 92.58 26.13 96.74 -- 13.64 0.10 --
End of December
2004 -- -- -- 130.12 14.65 0.04 71.28 27.72 108.18 -- 18.93 0.10 --
End of December
2005 -- -- -- 159.26 60.46 0.04 68.85 32.26 165.83 -- 20.34 23.94 --
End of December
2006 -- -- -- 157.98 163.00 0.04 66.02 29.63 181.26 -- 26.85 46.69 --
End of December
2007 -- -- -- 158.73 239.85 0.04 16.92 50.89 239.28 -- 34.14 23.47 --
End of December
2008 -- -- -- 97.02 610.15 0.03 19.24 56.87 247.13 -- 44.97 27.85 --
End of December
2009 -- -- -- 115.73 305.35 0.03 125.25 57.60 314.70 -- 59.67 30.10 --
End of December
2010 -- -- -- 82.78 263.04 14.40 121.40 63.56 345.95 -- 127.02 35.60 --
End of December
2011 -- -- 0.02 87.08 296.31 16.66 112.98 45.57 435.04 -- 166.24 31.37 --
End of December
2012 -- -- 8.16 153.94 380.55 17.31 79.76 54.48 405.56 -- 209.42 29.13 --
End of December
2013 -- -- 9.00 101.10 425.83 13.52 64.52 72.91 377.57 0.01 256.36 31.56 --
End of December
2014 -- -- 8.99 121.90 2.90 15.49 51.06 242.68 588.99 0.04 289.46 58.54 0 .01
End of December
2015 -- -- 8.92 113.19 1.68 38.73 43.23 106.18 666.37 0.05 327.29 59.88 0.02
End of December
2016 -0.01 0.21 8.90 64.91 3.66 35.75 35.81 114.53 727.10 0.05 479.19 60.86 0.03
* at book values in financial statements, which may differ from market value of stocks.
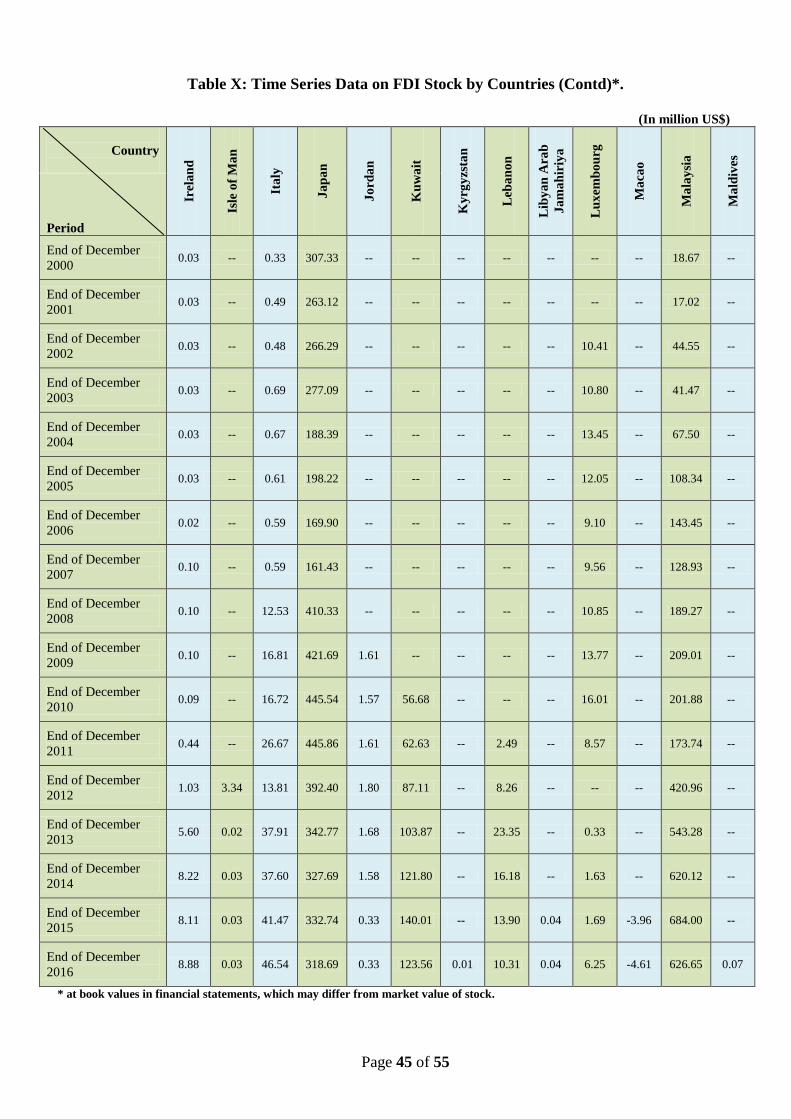
Page 45 of 55
Table X: Time Series Data on FDI Stock by Countries (Contd)*.
(In million US$)
Country
Irela
nd
Isle
of
Ma
n
Ita
ly
Ja
pa
n
Jo
rda
n
Ku
wa
it
Ky
rgy
zsta
n
Leb
an
on
Lib
ya
n A
ra
b
Ja
ma
hir
iya
Lu
xem
bo
urg
Ma
cao
Ma
lay
sia
Ma
ldiv
es
Period
End of December
2000 0.03 -- 0.33 307.33 -- -- -- -- -- -- -- 18.67 --
End of December
2001 0.03 -- 0.49 263.12 -- -- -- -- -- -- -- 17.02 --
End of December
2002 0.03 -- 0.48 266.29 -- -- -- -- -- 10.41 -- 44.55 --
End of December
2003 0.03 -- 0.69 277.09 -- -- -- -- -- 10.80 -- 41.47 --
End of December
2004 0.03 -- 0.67 188.39 -- -- -- -- -- 13.45 -- 67.50 --
End of December
2005 0.03 -- 0.61 198.22 -- -- -- -- -- 12.05 -- 108.34 --
End of December
2006 0.02 -- 0.59 169.90 -- -- -- -- -- 9.10 -- 143.45 --
End of December
2007 0.10 -- 0.59 161.43 -- -- -- -- -- 9.56 -- 128.93 --
End of December
2008 0.10 -- 12.53 410.33 -- -- -- -- -- 10.85 -- 189.27 --
End of December
2009 0.10 -- 16.81 421.69 1.61 -- -- -- -- 13.77 -- 209.01 --
End of December
2010 0.09 -- 16.72 445.54 1.57 56.68 -- -- -- 16.01 -- 201.88 --
End of December
2011 0.44 -- 26.67 445.86 1.61 62.63 -- 2.49 -- 8.57 -- 173.74 --
End of December
2012 1.03 3.34 13.81 392.40 1.80 87.11 -- 8.26 -- -- -- 420.96 --
End of December
2013 5.60 0.02 37.91 342.77 1.68 103.87 -- 23.35 -- 0.33 -- 543.28 --
End of December
2014 8.22 0.03 37.60 327.69 1.58 121.80 -- 16.18 -- 1.63 -- 620.12 --
End of December
2015 8.11 0.03 41.47 332.74 0.33 140.01 -- 13.90 0.04 1.69 -3.96 684.00 --
End of December
2016 8.88 0.03 46.54 318.69 0.33 123.56 0.01 10.31 0.04 6.25 -4.61 626.65 0.07
* at book values in financial statements, which may differ from market value of stock.
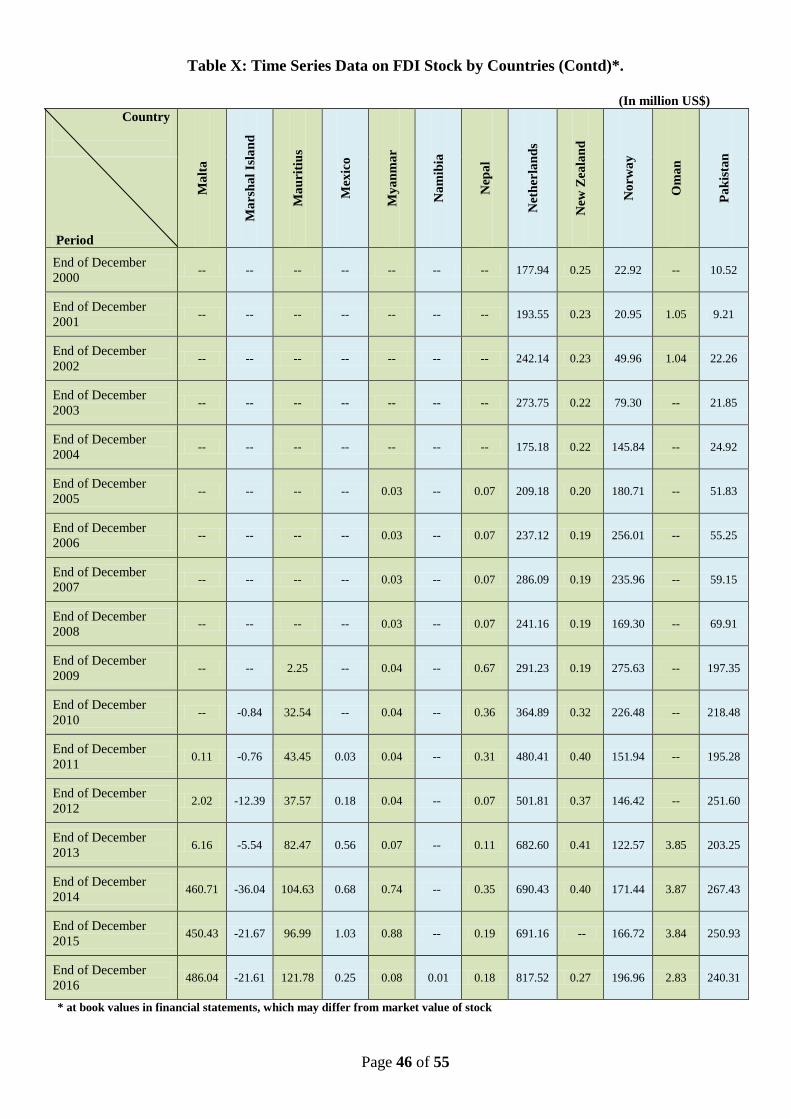
Page 46 of 55
Table X: Time Series Data on FDI Stock by Countries (Contd)*.
(In million US$)
Country
Ma
lta
Ma
rsh
al
Isla
nd
Ma
uri
tiu
s
Mex
ico
My
an
ma
r
Na
mib
ia
Nep
al
Net
her
lan
ds
New
Zea
lan
d
No
rwa
y
Om
an
Pa
kis
tan
Period
End of December
2000 -- -- -- -- -- -- -- 177.94 0.25 22.92 -- 10.52
End of December
2001 -- -- -- -- -- -- -- 193.55 0.23 20.95 1.05 9.21
End of December
2002 -- -- -- -- -- -- -- 242.14 0.23 49.96 1.04 22.26
End of December
2003 -- -- -- -- -- -- -- 273.75 0.22 79.30 -- 21.85
End of December
2004 -- -- -- -- -- -- -- 175.18 0.22 145.84 -- 24.92
End of December
2005 -- -- -- -- 0.03 -- 0.07 209.18 0.20 180.71 -- 51.83
End of December
2006 -- -- -- -- 0.03 -- 0.07 237.12 0.19 256.01 -- 55.25
End of December
2007 -- -- -- -- 0.03 -- 0.07 286.09 0.19 235.96 -- 59.15
End of December
2008 -- -- -- -- 0.03 -- 0.07 241.16 0.19 169.30 -- 69.91
End of December
2009 -- -- 2.25 -- 0.04 -- 0.67 291.23 0.19 275.63 -- 197.35
End of December
2010 -- -0.84 32.54 -- 0.04 -- 0.36 364.89 0.32 226.48 -- 218.48
End of December
2011 0.11 -0.76 43.45 0.03 0.04 -- 0.31 480.41 0.40 151.94 -- 195.28
End of December
2012 2.02 -12.39 37.57 0.18 0.04 -- 0.07 501.81 0.37 146.42 -- 251.60
End of December
2013 6.16 -5.54 82.47 0.56 0.07 -- 0.11 682.60 0.41 122.57 3.85 203.25
End of December
2014 460.71 -36.04 104.63 0.68 0.74 -- 0.35 690.43 0.40 171.44 3.87 267.43
End of December
2015 450.43 -21.67 96.99 1.03 0.88 -- 0.19 691.16 -- 166.72 3.84 250.93
End of December
2016 486.04 -21.61 121.78 0.25 0.08 0.01 0.18 817.52 0.27 196.96 2.83 240.31
* at book values in financial statements, which may differ from market value of stock
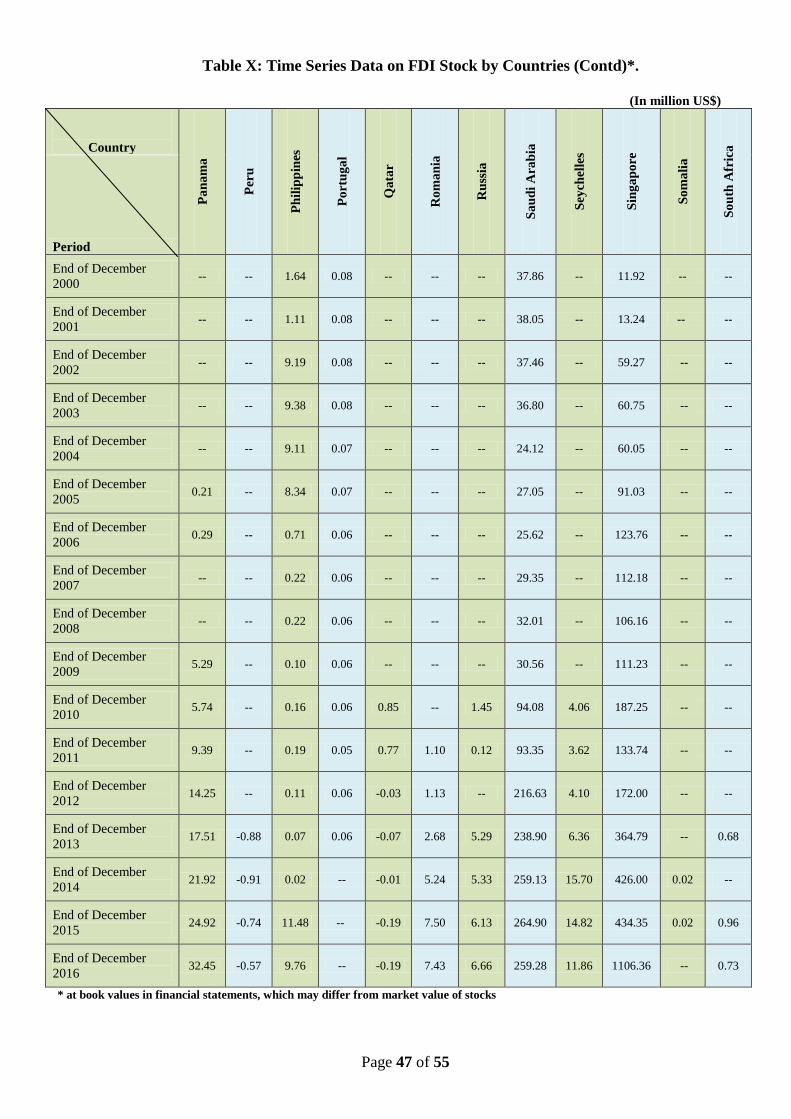
Page 47 of 55
Table X: Time Series Data on FDI Stock by Countries (Contd)*.
(In million US$)
Country
Pa
na
ma
Per
u
Ph
ilip
pin
es
Po
rtu
ga
l
Qa
tar
Ro
ma
nia
Ru
ssia
Sa
ud
i A
rab
ia
Sey
chel
les
Sin
ga
po
re
So
ma
lia
So
uth
Afr
ica
Period
End of December
2000 -- -- 1.64 0.08 -- -- -- 37.86 -- 11.92 -- --
End of December
2001 -- -- 1.11 0.08 -- -- -- 38.05 -- 13.24 -- --
End of December
2002 -- -- 9.19 0.08 -- -- -- 37.46 -- 59.27 -- --
End of December
2003 -- -- 9.38 0.08 -- -- -- 36.80 -- 60.75 -- --
End of December
2004 -- -- 9.11 0.07 -- -- -- 24.12 -- 60.05 -- --
End of December
2005 0.21 -- 8.34 0.07 -- -- -- 27.05 -- 91.03 -- --
End of December
2006 0.29 -- 0.71 0.06 -- -- -- 25.62 -- 123.76 -- --
End of December
2007 -- -- 0.22 0.06 -- -- -- 29.35 -- 112.18 -- --
End of December
2008 -- -- 0.22 0.06 -- -- -- 32.01 -- 106.16 -- --
End of December
2009 5.29 -- 0.10 0.06 -- -- -- 30.56 -- 111.23 -- --
End of December
2010 5.74 -- 0.16 0.06 0.85 -- 1.45 94.08 4.06 187.25 -- --
End of December
2011 9.39 -- 0.19 0.05 0.77 1.10 0.12 93.35 3.62 133.74 -- --
End of December
2012 14.25 -- 0.11 0.06 -0.03 1.13 -- 216.63 4.10 172.00 -- --
End of December
2013 17.51 -0.88 0.07 0.06 -0.07 2.68 5.29 238.90 6.36 364.79 -- 0.68
End of December
2014 21.92 -0.91 0.02 -- -0.01 5.24 5.33 259.13 15.70 426.00 0.02 --
End of December
2015 24.92 -0.74 11.48 -- -0.19 7.50 6.13 264.90 14.82 434.35 0.02 0.96
End of December
2016 32.45 -0.57 9.76 -- -0.19 7.43 6.66 259.28 11.86 1106.36 -- 0.73
* at book values in financial statements, which may differ from market value of stocks
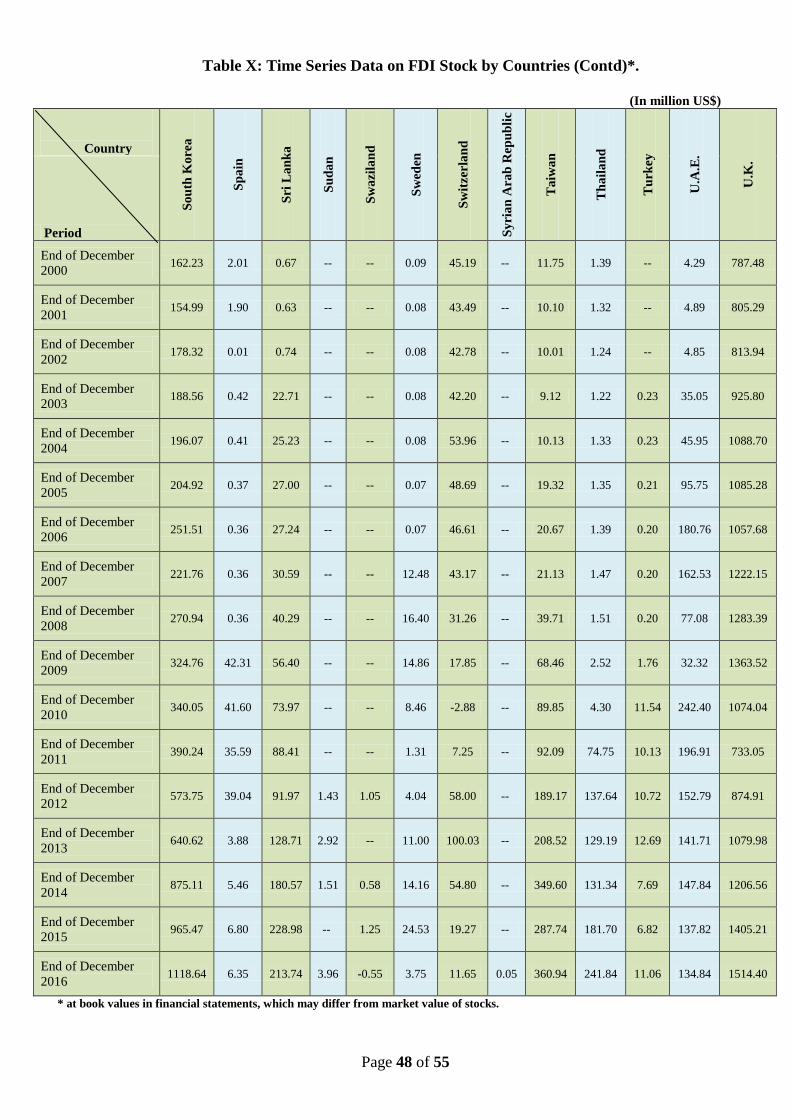
Page 48 of 55
Table X: Time Series Data on FDI Stock by Countries (Contd)*.
(In million US$)
Country
So
uth
Ko
rea
Sp
ain
Sri
La
nk
a
Su
da
n
Sw
azi
lan
d
Sw
eden
Sw
itzer
lan
d
Sy
ria
n A
ra
b R
ep
ub
lic
Ta
iwa
n
Th
ail
an
d
Tu
rkey
U.A
.E.
U.K
.
Period
End of December
2000 162.23 2.01 0.67 -- -- 0.09 45.19 -- 11.75 1.39 -- 4.29 787.48
End of December
2001 154.99 1.90 0.63 -- -- 0.08 43.49 -- 10.10 1.32 -- 4.89 805.29
End of December
2002 178.32 0.01 0.74 -- -- 0.08 42.78 -- 10.01 1.24 -- 4.85 813.94
End of December
2003 188.56 0.42 22.71 -- -- 0.08 42.20 -- 9.12 1.22 0.23 35.05 925.80
End of December
2004 196.07 0.41 25.23 -- -- 0.08 53.96 -- 10.13 1.33 0.23 45.95 1088.70
End of December
2005 204.92 0.37 27.00 -- -- 0.07 48.69 -- 19.32 1.35 0.21 95.75 1085.28
End of December
2006 251.51 0.36 27.24 -- -- 0.07 46.61 -- 20.67 1.39 0.20 180.76 1057.68
End of December
2007 221.76 0.36 30.59 -- -- 12.48 43.17 -- 21.13 1.47 0.20 162.53 1222.15
End of December
2008 270.94 0.36 40.29 -- -- 16.40 31.26 -- 39.71 1.51 0.20 77.08 1283.39
End of December
2009 324.76 42.31 56.40 -- -- 14.86 17.85 -- 68.46 2.52 1.76 32.32 1363.52
End of December
2010 340.05 41.60 73.97 -- -- 8.46 -2.88 -- 89.85 4.30 11.54 242.40 1074.04
End of December
2011 390.24 35.59 88.41 -- -- 1.31 7.25 -- 92.09 74.75 10.13 196.91 733.05
End of December
2012 573.75 39.04 91.97 1.43 1.05 4.04 58.00 -- 189.17 137.64 10.72 152.79 874.91
End of December
2013 640.62 3.88 128.71 2.92 -- 11.00 100.03 -- 208.52 129.19 12.69 141.71 1079.98
End of December
2014 875.11 5.46 180.57 1.51 0.58 14.16 54.80 -- 349.60 131.34 7.69 147.84 1206.56
End of December
2015 965.47 6.80 228.98 -- 1.25 24.53 19.27 -- 287.74 181.70 6.82 137.82 1405.21
End of December
2016 1118.64 6.35 213.74 3.96 -0.55 3.75 11.65 0.05 360.94 241.84 11.06 134.84 1514.40
* at book values in financial statements, which may differ from market value of stocks.
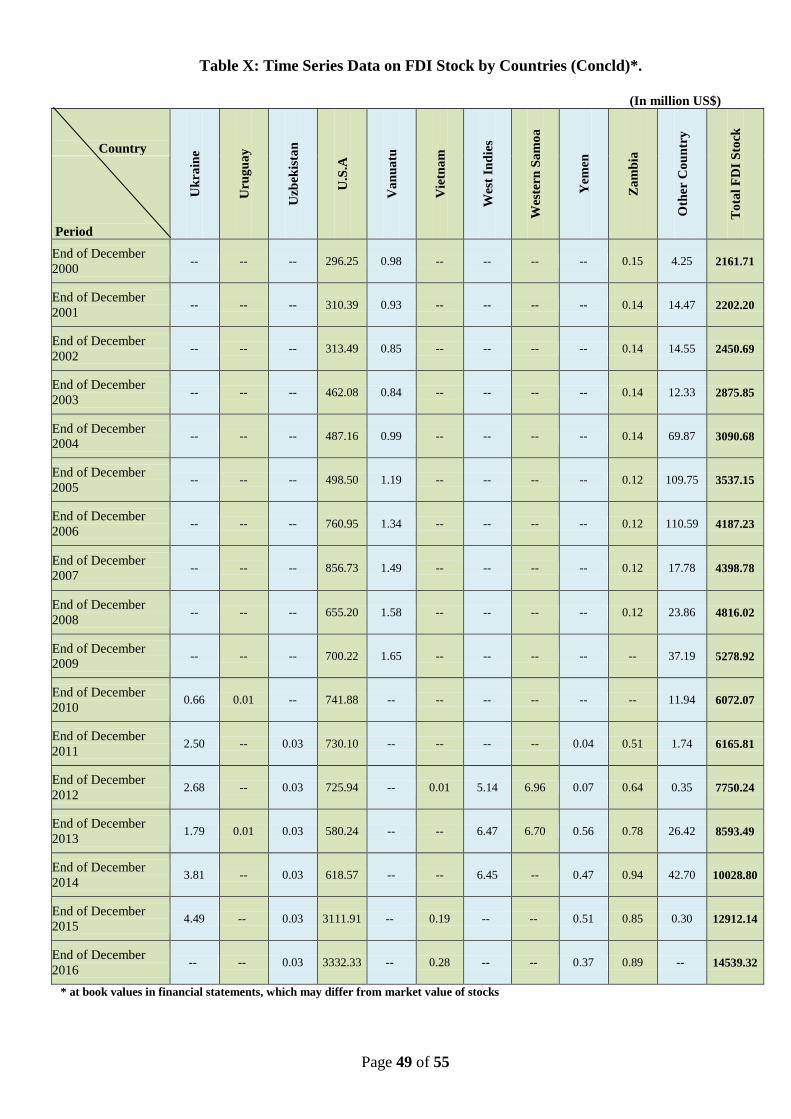
Page 49 of 55
Table X: Time Series Data on FDI Stock by Countries (Concld)*.
(In million US$)
Country
Uk
rain
e
Uru
gu
ay
Uzb
ekis
tan
U.S
.A
Va
nu
atu
Vie
tna
m
Wes
t In
die
s
Wes
tern
Sa
mo
a
Yem
en
Za
mb
ia
Oth
er C
ou
ntr
y
To
tal
FD
I S
tock
Period
End of December
2000 -- -- -- 296.25 0.98 -- -- -- -- 0.15 4.25 2161.71
End of December
2001 -- -- -- 310.39 0.93 -- -- -- -- 0.14 14.47 2202.20
End of December
2002 -- -- -- 313.49 0.85 -- -- -- -- 0.14 14.55 2450.69
End of December
2003 -- -- -- 462.08 0.84 -- -- -- -- 0.14 12.33 2875.85
End of December
2004 -- -- -- 487.16 0.99 -- -- -- -- 0.14 69.87 3090.68
End of December
2005 -- -- -- 498.50 1.19 -- -- -- -- 0.12 109.75 3537.15
End of December
2006 -- -- -- 760.95 1.34 -- -- -- -- 0.12 110.59 4187.23
End of December
2007 -- -- -- 856.73 1.49 -- -- -- -- 0.12 17.78 4398.78
End of December
2008 -- -- -- 655.20 1.58 -- -- -- -- 0.12 23.86 4816.02
End of December
2009 -- -- -- 700.22 1.65 -- -- -- -- -- 37.19 5278.92
End of December
2010 0.66 0.01 -- 741.88 -- -- -- -- -- -- 11.94 6072.07
End of December
2011 2.50 -- 0.03 730.10 -- -- -- -- 0.04 0.51 1.74 6165.81
End of December
2012 2.68 -- 0.03 725.94 -- 0.01 5.14 6.96 0.07 0.64 0.35 7750.24
End of December
2013 1.79 0.01 0.03 580.24 -- -- 6.47 6.70 0.56 0.78 26.42 8593.49
End of December
2014 3.81 -- 0.03 618.57 -- -- 6.45 -- 0.47 0.94 42.70 10028.80
End of December
2015 4.49 -- 0.03 3111.91 -- 0.19 -- -- 0.51 0.85 0.30 12912.14
End of December
2016 -- -- 0.03 3332.33 -- 0.28 -- -- 0.37 0.89 -- 14539.32
* at book values in financial statements, which may differ from market value of stocks
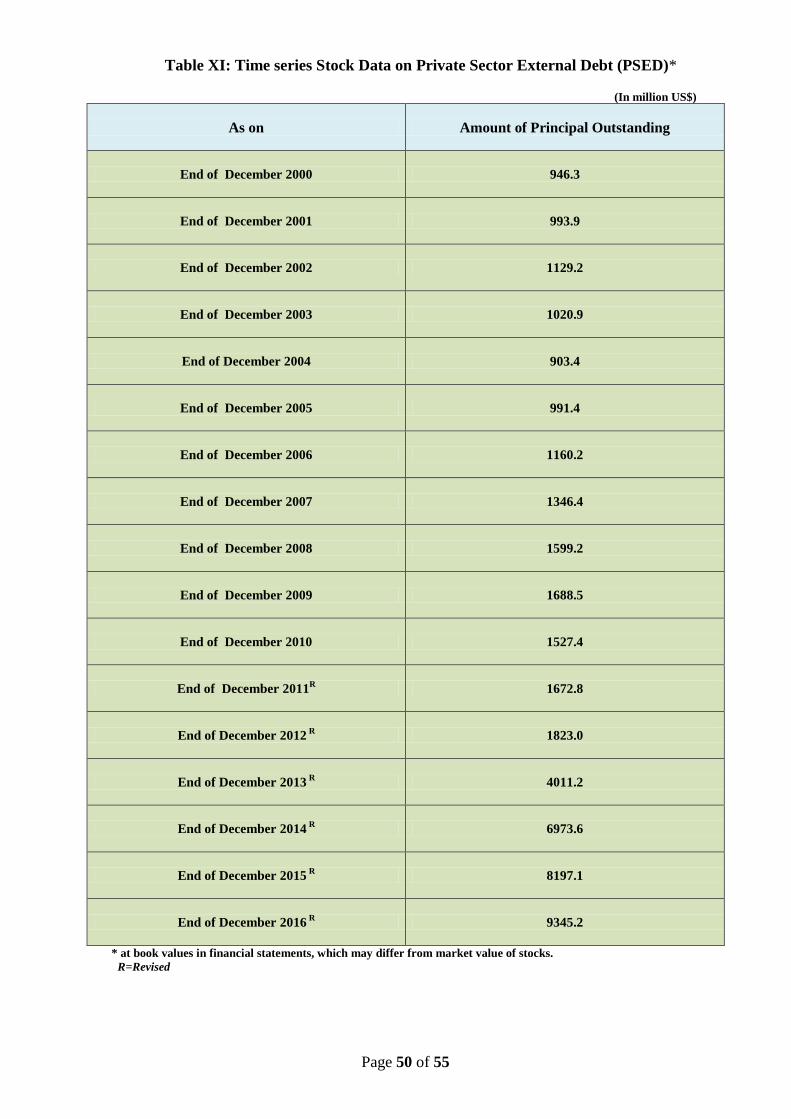
Page 50 of 55
Table XI: Time series Stock Data on Private Sector External Debt (PSED)*
(In million US$)
As on Amount of Principal Outstanding
End of December 2000 946.3
End of December 2001 993.9
End of December 2002 1129.2
End of December 2003 1020.9
End of December 2004 903.4
End of December 2005 991.4
End of December 2006 1160.2
End of December 2007 1346.4
End of December 2008 1599.2
End of December 2009 1688.5
End of December 2010 1527.4
End of December 2011R
1672.8
End of December 2012 R
1823.0
End of December 2013 R
4011.2
End of December 2014 R
6973.6
End of December 2015 R
8197.1
End of December 2016 R
9345.2
* at book values in financial statements, which may differ from market value of stocks.
R=Revised

Page 51 of 55
Annexure 2: Survey Questionnaire
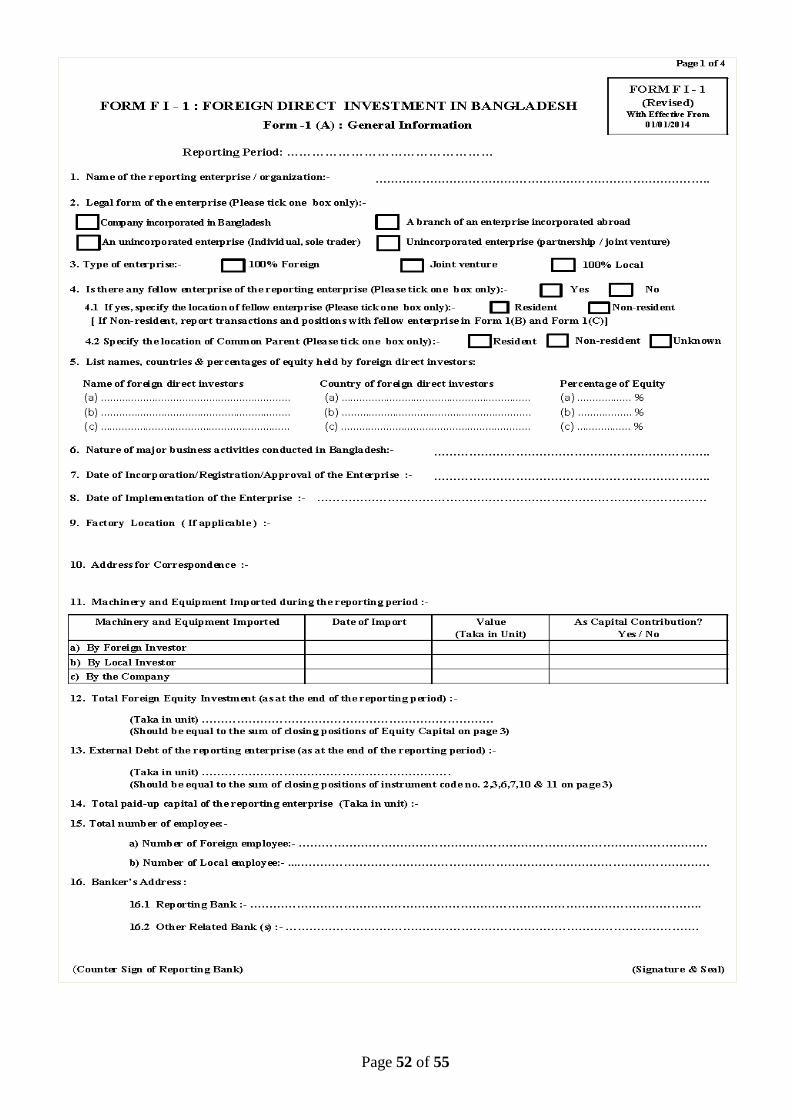
Page 52 of 55
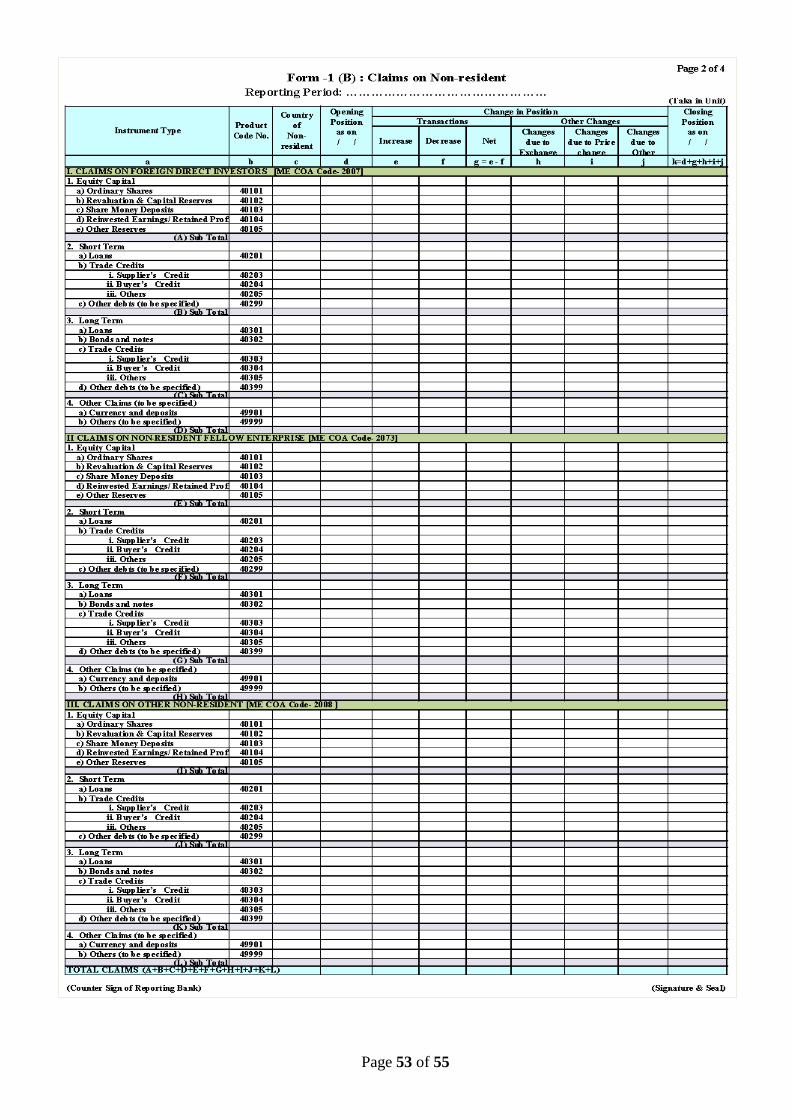
Page 53 of 55
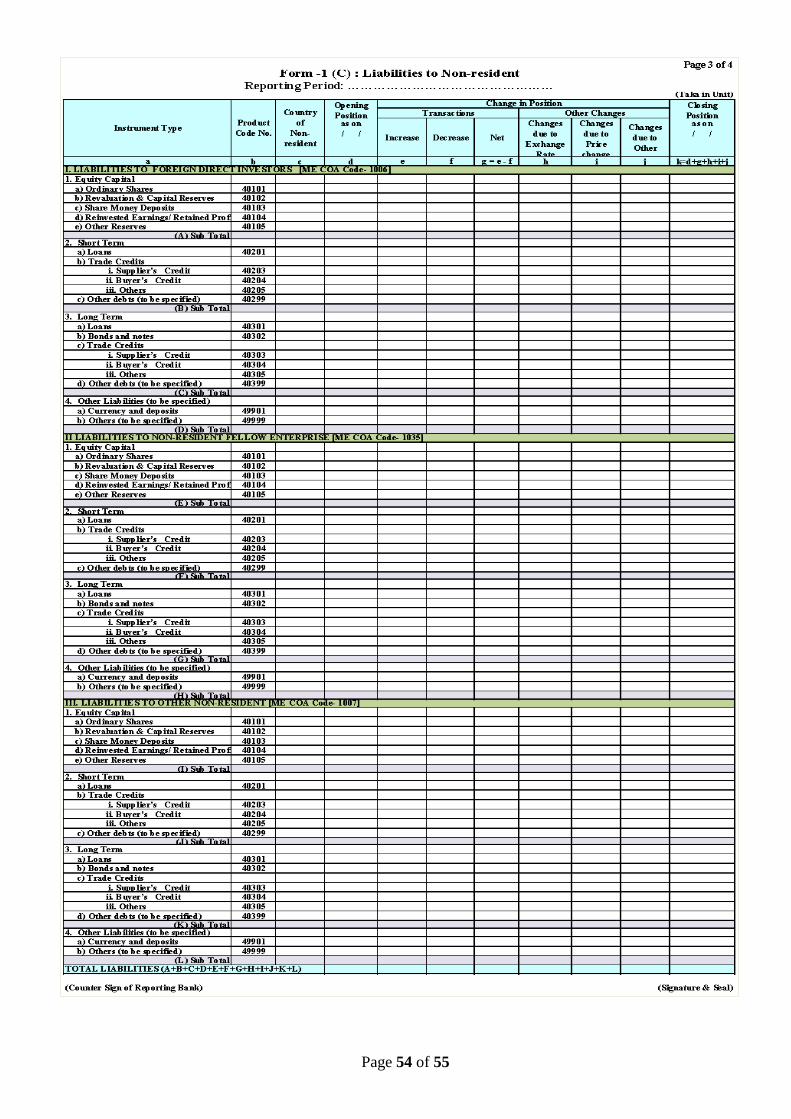
Page 54 of 55
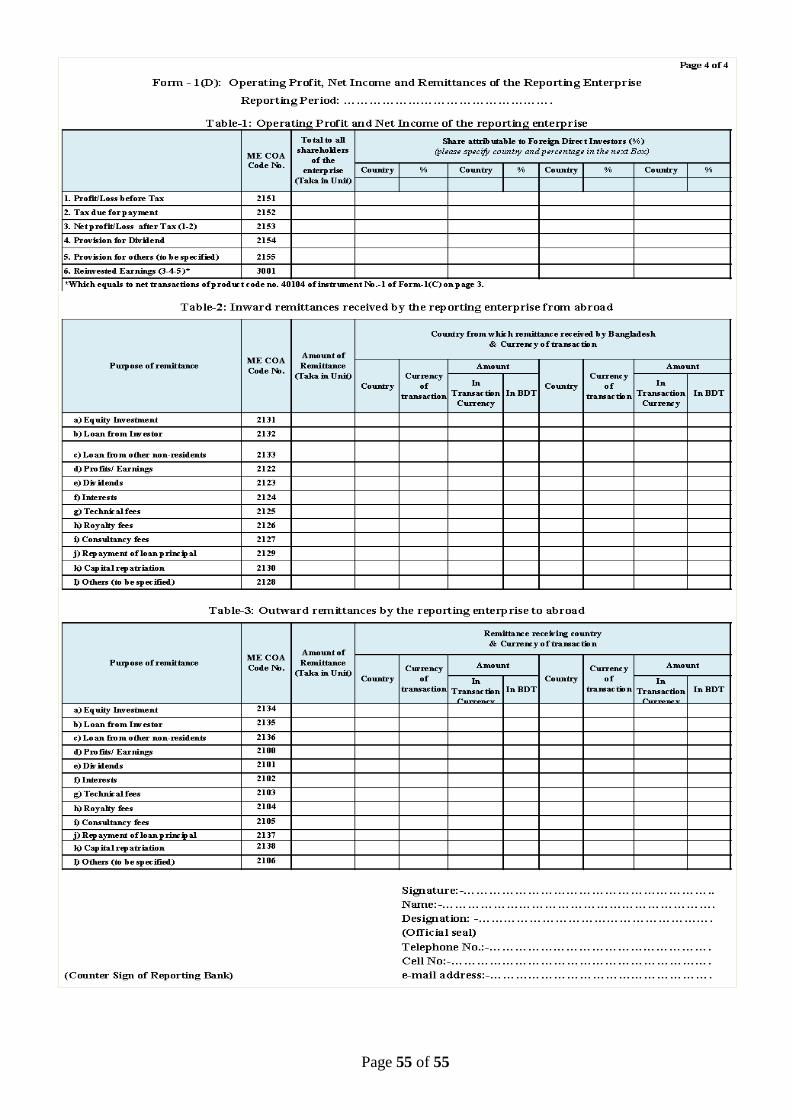
Page 55 of 55


![Scenario and Incentives of Foreign Direct Investment (FDI) inBangladesh · 2013-12-23 · FDI in Bangladesh [7]. Nasrin et al in the paper “Major determinants and hindrance of FDI](https://img.pdfslide.us/doc/110x75/5f32430635e3ee4a7b2be81e/scenario-and-incentives-of-foreign-direct-investment-fdi-inbangladesh-2013-12-23.jpg)