Embed Size (px)
Citation preview
Foreclosure and Catastrophe Insurance∗
Christian Laux†, Giedre Lenciauskaite‡, and Alexander Muermann§
November 8, 2018
Abstract
The foreclosure law in California provides homeowners with the option to walk away fromtheir loan repayment obligation, leaving the bank with the value of the home. Thus, a loancontract contains implicit insurance against a loss in property value after an earthquake.Banks require homeowners insurance for mortgage loans, but they generally do not requireearthquake coverage, which homeowners insurance contracts exclude. While banks may havea comparative advantage over insurance companies in dealing with earthquake risk (throughsecuritization and avoiding insurers’ risk of default), banks might also find it less costlyto bear earthquake risk because of bailouts and deposit insurance. We find that implicitearthquake insurance through lending is negatively related to explicit earthquake insurancecoverage and that banks price implicit earthquake coverage, which is cheaper than explicitinsurance for some risk factors. Moreover, higher implicit earthquake insurance is positivelyassociated with a higher sale of mortgages to government-sponsored enterprises (GSEs).
Key words: catastrophe insurance, foreclosure, bank bailouts
∗We thank Mark Browne, Randy Dumm, Thomas Holzheu, Mike Hoy, Martin Grace, Joyce Lin, CaseyRothschild, Stephen Shore, George Zanjani, and participants at the 2016 EGRIE, 2017 AEA meeting,2017 ARIA meeting, and PhD Student Symposium at the University of Georgia for valuable comments.
†WU (Vienna University of Economics and Business) and VGSF (Vienna Graduate School of Finance),Welthandelsplatz 1, 1020 Vienna, Austria, [email protected]
‡VGSF (Vienna Graduate School of Finance), Welthandelsplatz 1, 1020 Vienna, Austria,[email protected]
§WU (Vienna University of Economics and Business) and VGSF (Vienna Graduate School of Finance),Welthandelsplatz 1, 1020 Vienna, Austria, [email protected]
1
1 Introduction
Nearly everyone in California lives within 30 miles of an active fault that could cause adamaging earthquake.1 Yet, in 2013, only 10% of houses in California had earthquakeinsurance coverage.2 The lack of coverage against earthquake insurance triggered an intensivedebate. The reasons that are discussed range from homeowners’ heuristics and behavioralbiases to imperfect capital markets.3 We point to another possible reason: homeowners donot purchase earthquake insurance when their mortgage loan provides implicit insuranceagainst losses from an earthquake.
The foreclosure law in California implies that a loan contract effectively contains an insurancecomponent. If a homeowner defaults on the mortgage, the bank can take the house andsell it (foreclosure). In the case of a non-recourse mortgage, the bank cannot go after thehomeowner’s personal wealth if the proceeds from the sale are lower than the outstandingmortgage. California is known as a non-recourse state. Purchase money loans that are takenon initially to purchase an owner-occupied property are generally non-recourse. While thetreatment of loans taken on to refinance the initial loan was less clear, a change in regulationin January 2013 established that these loans are non-recourse loans as well. If a homeownerdefaults on a $300,000 non-recourse mortgage loan and the bank sells the house for $100,000,the homeowner is not liable for the deficiency of $200,000. When an earthquake severelydamages a house, it is optimal for the homeowner to exercise the option to default on theloan instead of continuing making further payments to the bank.
A non-recourse loan provides the homeowner with implicit insurance against severe damagescaused by an earthquake up to the mortgage loan. Thus, the mortgage used to finance thehouse, which in some cases might be close to the value of the house, limits a homeowner’sexposure to earthquake risk. Looking only at explicit earthquake insurance coverage thereforeyields a distorted picture of actual exposure of homeowners to earthquake risk. Implicit insur-ance through the possibility to default on non-recourse mortgage loans reduces homeowners’demand for explicit insurance coverage.
1California Faults and Quakes (California Earthquake Authority): http://www.californiarocks.com/california-faults-quakes
22013 CA EQ Premium, Exposure, and Policy Count Data Call Summary (California Depart-ment of Insurance): http://www.insurance.ca.gov/0400-news/0200-studies-reports/0300-earthquake-study/upload/EQEXP2013.pdf (Total Residential Market)
3For example, Kunreuther et al. (2001) argue that individuals have difficulties in evaluating very lowprobabilities without having access to comparison information about events that are meaningful to them.Kunreuther and Pauly (2004) show that search costs for obtaining information about low probabilities canexplain the lack of insurance demand for low-probability, high-consequence events. Froot (2001) providesa detailed analysis of the (re)insurance market for catastrophic risks and concludes that capital marketimperfections and market power of reinsurers explain high premiums and capital shortage in this market.
2
The prevalence of non-recourse mortgage lending does not automatically imply that bankshave to bear earthquake risk. Banks could require borrowers to purchase earthquake insurancecoverage and name them as beneficiaries in the case of an earthquake. After all, banks generallyrequire homeowners to purchase homeowners insurance. Even though such policies typicallyexclude earthquake risk, insurance companies that provide homeowners insurance policies arelegally obliged to offer earthquake insurance as a supplementary policy. This supplementarypolicy is generally not required by banks. While about 75%4 of owner-occupied homes werefinanced with mortgages in California in 2013, the earthquake insurance take-up rate, which isdefined as the number of earthquake policies divided by the number of homeowners insurancepolicies, was only 10%.5 If mortgages imply implicit insurance against earthquake risk, thepuzzle is not why homeowners do not purchase explicit earthquake insurance, but why banksdo not require the purchase of explicit insurance when providing mortgages to homeowners.After all, while homeowners might yield to behavioral biases, it is less clear that financialinstitutions such as banks do.
Banks can price the lack of earthquake insurance coverage and the possibility of default.Thus, homeowners do not automatically get a free lunch when using implicit insurancethrough banks. In a competitive market with zero frictional cost of insurance and lending,full insurance of earthquake risk is optimal. Rational homeowners are indifferent betweenexplicit insurance and implicit insurance through a loan with a repayment obligation equal tothe value of the house. Homeowners might prefer explicit insurance coverage if there is a costassociated with a deterioration of their personal credit score when defaulting on their loan.However, non-recourse loans implicitly cover damages against the entire property includingthe land, whereas standard earthquake insurance policies only cover damages against theconstruction. In areas in which the value of the land constitutes the major part of the valueof the property, and there is a high risk of a landslide in case of an earthquake, implicitcoverage provides substantially more coverage than explicit earthquake insurance.
Important differences between explicit and implicit insurance stem from differences in risktransfer. Catastrophe insurance is very costly because of high frictional cost of dealingwith catastrophic risk events (Froot, 2001). Therefore, full earthquake insurance coverage isgenerally not optimal anyway. Homeowners might then prefer implicit insurance throughtheir mortgage even if they bear part of the earthquake risk through their equity stake intheir home, which is equivalent to a deductible in explicit insurance. The question is whether
4U.S. Census Bureau, American Fact Finder: https://factfinder.census.gov/faces/nav/jsf/pages/index.xhtml52013 CA EQ Premium, Exposure, and Policy Count Data Call Summary (California Depart-ment of Insurance): http://www.insurance.ca.gov/0400-news/0200-studies-reports/0300-earthquake-study/upload/EQEXP2013.pdf (Total Residential Market)
3
insurers or banks bear the risk at lower cost. That is, who can provide the risk transfer fromhomeowners to the capital market at lower costs?6
Froot (2001) discusses several frictions related to using (re)insurance markets to transfercatastrophe risk. The challenge in insuring catastrophic events involves the high correlationof risks that requires large amounts of risk capital to bear the possible losses. This increasesthe cost of funding the losses and exposes policyholders to a potential counterparty risk if theinsurer cannot pay in the case of a catastrophic event. For risk averse policyholders, counter-party risk can be very costly. Implicit insurance avoids counterparty risk for policyholders.Indeed, the implicit nature of providing insurance through non-recourse mortgage lending,reverses the payment structure between the homeowner and the financial institution involvedin the risk transfer: the homeowner receives the mortgage, and does not repay in case of acatastrophic event (similarly to a catastrophe bond). If the bank requires explicit insuranceinstead, it bears the counterparty risk of the insurer. In addition, the bank may actually bebetter able to handle and transfer catastrophic risk than insurers. Holding large amounts ofcapital to bear possible losses can be costly for insurers or reinsurers since they might divertthe capital to other uses. Catastrophe bonds avoid this problem, but they are not used much.One problem of catastrophe bonds is that they require full collateralization, abandoning the(re)insurance principle of economizing on collateral through diversification (Lakdawalla andZanjani, 2012). Implicit insurance through banks does not require idle collateral but tiesit to the mortgage that the policyholder needs. Banks can transfer credit risk to capitalmarkets through securitization, thereby also transferring catastrophic repayment risk to thecapital market. Thus, securitization of loans has elements of a catastrophe bond, but involvesilliquid mortgage backed securities, combining the benefits of refinancing illiquid loans withthe benefits of transferring catastrophic risk to the capital market.
However, even if banks do not transfer catastrophic risk to the capital market throughsecuritization, they might be more willing to bear this type of risk than insurers since theyhave a more direct access to external funding through deposit insurance and bailouts. Indeed,banks’ shareholders have incentives to increase their exposure to systemic risk because ofdeposit insurance and bailouts. The deposit insurance rate is not fully risk-adjusted, e.g., itdoes not depend on whether houses in the banks’ loan portfolio are explicitly insured or not.Banks’ incentives to increase their exposure to earthquake risk result in banks being willingto provide implicit earthquake insurance to homeowners at a favorable rate. Thus, banksmay crowd out private catastrophe insurance markets even when insurers could bear the riskmore efficiently (at lower social cost). Moreover, the distorted price for the implicit insurance
6In the presence of behavioral biases, the benefit may also lay in bundling products and a joint pricing.
4
of earthquake risk can distort homeowners’ decision to build homes in high-risk areas.
Thus, banks might be able to provide insurance at lower costs for two reasons. First, banksmay have a comparative advantage in providing catastrophe insurance by bundling lendingand insurance. Second, banks may have a comparative advantage in transferring the risk toother parties that do not price this risk (bailouts and deposit insurance). The two reasonshave very different implications for optimal risk sharing. While the former would contributeto efficient risk transfer, the latter could distort an efficient risk allocation.
We develop a theoretical model to formalize the effects of foreclosure on the private marketfor earthquake insurance. Our model yields several predictions that implicit provision ofearthquake insurance by banks has. Most importantly, implicit insurance is a substitute forexplicit provision of coverage provided by the private insurance market for earthquake riskand increases homeowners’ incentives to choose a high loan-to-value ratio when financingtheir home. If banks have a comparative advantage in transferring earthquake risk, we shouldobserve a positive relation between the use of implicit insurance and the sale of loans throughsecuritization or to government-sponsored enterprises (GSEs) such as Fannie Mae and FreddieMac. The implicit provision of earthquake insurance through banks reduces homeowners’cost for earthquake risk. The finding sheds a new light on why few homeowners in Californiapurchase explicit earthquake risk; they may indeed find it “too costly” relative to the cost ofimplicit insurance.
2 Earthquake Insurance and Mortgage Market in California
2.1 Earthquake insurance market
California is exposed to earthquake risk, which can cause severe damages to or total destructionof properties located in affected areas. While a standard homeowners insurance policy inCalifornia covers losses caused by fire, hurricane, hail, lightening, or other disasters that arespecified in the policy, it typically excludes damages caused by an earthquake. However, thiscoverage is readily available in the insurance market. Since 1985, California law requiresinsurers underwriting homeowners insurance to also offer earthquake coverage policies. In turn,homeowners can only purchase earthquake coverage bundled with their homeowners insurancepolicy issued by the same insurer. Insurance companies can choose to offer earthquakecoverage through the California Earthquake Authority (CEA). The CEA was established afterthe Northridge earthquake (1994), which caused insured losses that exceeded the $3.5 billionin earthquake premiums collected by all earthquake insurers in California from 1969 through
5
1994 by a factor of four. In response, many insurers restricted the sale of new homeownerspolicies given the obligation to offer earthquake insurance as well.7 Today, with a marketshare of 75%, the CEA is the main earthquake insurance provider in California.8
When purchasing earthquake coverage, homeowners have to choose the identical insurancelimit as in their homeowners policy, but they can choose a fixed deductible between 5% and25% of the insured value.9 Importantly, earthquake insurance, including the policies offeredthrough the CEA, only provides coverage against earthquake hazard to the structure of thehouse, not the land.10
The premium for the earthquake insurance policy is determined by the earthquake risk ofthe location of the house, the insured value and characteristics of the house (for example,construction type, age, foundation type, and number of stories), and by the policy’s coverage,limit and deductible.11
2.2 Mortgage market
The residential mortgage market in California is the largest in the US. In 2013, the totalamount of loans originated exceeded $400 billion, which is approximately 22% of the totalamount of loans originated in the US that year. Moreover, nearly 75% owner-occupied housingunits in California have a mortgage, which translates into more than 5 million housing units.In addition, California is known as one of the borrower-friendliest state in the US due to thelegal environment that regulates homeowners’ defaults on their mortgage loans.
If a homeowner stops making payments and defaults on the mortgage loan, the bank can takethe house and sell it, i.e., foreclose the house. Depending on the type of loan, the bank mightor might not have the right to go after other financial assets of the homeowner to recover anydebt that is outstanding after foreclosure. If the homeowner defaults on a recourse loan, thebank can bring legal action against the homeowner, garnish wages, levy bank accounts, anduse other methods to collect the outstanding debt. In contrast, if the homeowner defaults ona non-recourse loan, the bank has no such right. The bank has to absorb any deficiency as aloss.
7http://www.rstreet.org/2014/06/12/the-california-earthquake-authority-a-confused-success-story/8http://www.insurance.ca.gov/0400-news/0200-studies-reports/0300-earthquake-study/upload/EQEXP2013.pdf
9http://www.earthquakeauthority.com/insurancepolicies/home/Pages/Coverage.aspx10CEA earthquake insurance policy covers up to $10,000 for the cost, including engineering cost, to replace,
rebuild, stabilize or otherwise restore the land (CEA Earthquake Basic policy)11http://www.earthquakeauthority.com/insurancepolicies/home/Pages/Rates-and-Premiums.aspx
6
California is known to be a non-recourse state. Typically, purchase money loans are non-recourse. The proceeds of these loans are used to buy a property that is owner-occupied andconsists of up to four units. Since January 1, 2013, loans to refinance purchase-money loansare generally also non-recourse loans.12
2.3 Insurance requirements for mortgaged houses
If a homeowner finances the purchase of a property through a loan, the bank requiresthe purchase of a homeowners insurance policy, which typically excludes losses caused byearthquakes.13 Banks generally do not demand earthquake insurance coverage.14 For example,Wells Fargo requires homeowners to purchase homeowners insurance (protection in case of fireor other common disasters), wind insurance (protection against damage from wind and/orhail), and flood insurance (in case the mortgaged house is located in special flood hazardareas and flood insurance is required by the Federal Law) which have “to cover at least 100%of the estimated replacement cost for your home and any improvements to your property.”15
Banks sell a significant share of their mortgage loan portfolio to government-sponsoredenterprises (GSEs) such as Fannie Mae and Freddie Mac. If a GSE purchases a loan, itgenerally also does not require the mortgaged house to be insured against earthquake hazards.Fannie Mae, for example, requires earthquake insurance only for buildings located in PuertoRico.16
Without any formal requirement by the regulator or bank, it is up to the homeowner todecide whether to purchase earthquake coverage for the mortgaged house or not. Andersonand Weinrobe (1986) find that in a sample of residential mortgage properties damaged bythe 1971 San Fernando earthquake in California none of the properties were insured againstearthquake damage. If the homeowner decides to purchase earthquake insurance, then he orshe has to insure the house up to the full value as the homeowner is required to purchasehomeowners insurance up to the full value of the house and as the two limits have to be thesame (as noted in the CEA Earthquake Basic Policy).
12http://www.alllaw.com/articles/nolo/foreclosure/deficiency-laws-in-california.html13The fire caused by an earthquake is typically covered by homeowners insurance policy:
http://www.insurance.ca.gov/01-consumers/105-type/95-guides/03-res/eq-ins.cfm14http://www.insurance.ca.gov/01-consumers/105-type/95-guides/03-res/eq-ins.cfm15https://www.wellsfargorelo.com/loans/rmw/manage-account/homeowners-insurance.page16https://www.fanniemae.com/content/guide/selling/b7/3/05.html\#Earthquake.20and.20Typhoon.20Insurance
7
3 The Model
3.1 Setting
We consider a setting with two periods, t = 0 and t = 1. A risk-averse individual with strictlyincreasing and concave utility function u receives income w0 and w1 in period t = 0 and t = 1,respectively. In period t = 0, the individual purchases a property at its current market valueV (which includes the value of the land in addition to the structure of the house).
An earthquake may hit the property between the two periods. Insurance companies, whichare owned by risk-neutral investors, offer full earthquake insurance coverage for damage to thestructure of the house, but not for the land. Therefore, it is important to distinguish betweenthe damage caused to the structure (of the house) and to the land, Lhouse ∈ [0, Vhouse] andLland ∈ [0, Vland] respectively. The total loss from the earthquake is L = Lland + Lhouse, andwe assume that the maximum possible total loss equals the current value of the property, i.e.,V = Vland + Vhouse. For example, if the property is located at the ocean, then an earthquakemay swallow the property. For simplicity, we ignore other costs that such a devastatingearthquake would have.
The insurance market is perfectly competitive, but there are two frictions. The first frictionis that holding capital to cover catastrophic events is costly. For diversifiable risks such as,e.g., car insurance, the average insured loss approaches the expected loss in a diversifiedportfolio. This is not true for catastrophic events where losses are highly correlated and theaverage loss conditional on an earthquake is considerably higher than the a priori expectedloss. With high cost of holding capital to cover all claims after an earthquake, it is notoptimal that insurers hold sufficient capital to cover all possible claims. Thus, there is arisk that the insurer cannot pay after an earthquake, which is the second friction. To modelthis counterparty risk in earthquake insurance, we assume that the insurer defaults withprobability ρ after an earthquake and does not make any payment to policyholders. Thepremium for full insurance is given by P = (1 + α) (1− ρ)E [Lhouse], where α captures thefrictional cost of insuring catastrophic events. For α = 0, the premium equals the expectedpayment from the insurer to the policyholder (fair premium).
The purchase price exceeds the individual’s period t = 0 income, i.e., V > w0. A bank offersa loan of size X ∈ [0, V ] in period t = 0 with repayment obligation R in period t = 1. Thebank is owned by risk-neutral investors, and the loan market is perfectly competitive. Therisk-free interest rate is zero. If the individual fails to fulfill the repayment obligation R,then the bank can initiate foreclosure. In foreclosure, the bank receives the minimum of
8
its claim and the value of the property min {R, V − L}. Whether the bank can recover thepossible difference between the repayment obligation and the proceeds from selling the house,R − (V − L), depends on the type of loan contract. Under a recourse loan, the bank canrecover the outstanding debt by going after the private wealth of the individual, which is notpossible under a non-recourse loan. However, if the house is insured, the bank recovers partof the outstanding debt from the insurance payment related to the loss to the house.
Given a non-recourse loan without insurance, the loss in the case of non-repayment of theloan for the bank is R − min {R, V − L} = max {R− (V − L) , 0}. We assume that theindividual bears a cost of not fulfilling the repayment obligation of the loan, e.g., fromincreased difficulties of receiving loans in the future due to the deterioration of the personalcredit score. This cost of foreclosure to the individual is captured by a disutility, equivalentto a monetary loss δ. It is then optimal for the individual to repay the loan if and onlyif the repayment obligation does not exceed the value of the house and disutility fromforeclosure, R ≤ V − L + δ. If R > V − L + δ, the individual does not repay the loan,and the bank initiates foreclosure and recovers V − L. Thus, the bank’s expected lossis E
[(L− (V −R)) · 1{L>V−R+δ}
]. We assume that the bank prices loans to reflect this
expected loss and charges a fee of C = (1 + β)E[(L− (V −R)) · 1{L>V−R+δ}
]. Thus, the
homeowner gets a loan equal to X = R − C in period t = 0 with a repayment obligationR in period t = 1. In a competitive market without frictions, β = 0 and the fee equalsthe expected loss, i.e., C = E
[(L− (V −R)) · 1{L>V−R+δ}
]. β captures market frictions of
bearing losses, similar to the case of an insurer. If the cost of bearing losses are lower for abank than for an insurer, β < α. For example, transferring the risk to the capital marketthrough securitization might involve lower cost than using catastrophe bonds given the highervolume of securitization by banks. Moreover, the bank might securitize the loans anyway, andthe transfer of the earthquake risk comes as a by-product of refinancing the loans rather thanbeing the main objective of the transaction. Thus, a lower cost of implicit insurance mightstem from more efficient risk financing. However, banks might also be willing to offer implicitcatastrophe insurance at a lower price than insurers if guarantees and bailouts provide bankswith incentives to seek this type of highly correlated risk and thus distort the pricing of therisk. Indeed, if banks have an incentive to engage in risk shifting or do not take into accountthe risk borne by their debt holders, β can even be negative.
The individual’s total income w0 + w1 is sufficiently high to afford to purchase the propertyand full insurance. For simplicity, we assume that w0 ≥ P so that the individual does notneed a loan to purchase insurance.
9
3.2 Explicit earthquake insurance in the absence of implicit insurance
If the bank has recourse to the private wealth of the individual, any loan X to purchasethe property is risk free since the individual’s total wealth w0 + w1 is sufficiently high,debt is risk free. The individual chooses the level of the loan X and decides whether topurchase earthquake insurance to maximize the expected utility of final wealth at t = 1.With earthquake insurance, the final wealth is W (L) = w0 + w1 + X − P − Lland − R incase the insurer fulfills its insurance obligation and W (L) = w0 + w1 + X − P − L − R,otherwise. If the individual does not purchase earthquake insurance, then the final wealth isW (L) = w0 + w1 +X − L−R.
Perfect competition in the loan market implies that R = X, and the loan cancels out inthe individual’s final wealth. Thus, the individual is indifferent with respect to any level ofthe loan that allows the purchase of the property, and X∗ ∈ [V − w0 − P, V ]. Moreover, thepricing of the loan as well as the decision to purchase earthquake insurance are independentof the level of the loan.
The expected utility of final wealth without insurance is
EU = E [u (w0 + w1 − L)]
The expected utility of final wealth with insurance is
EU = (1− ρ)E [u (w0 + w1 − (1 + α) (1− ρ)E [Lhouse]− Lland)]
+ρE [u (w0 + w1 − (1 + α) (1− ρ)E [Lhouse]− L)] .
The individual has to bear the risk of the uninsurable loss from the land and the risk of defaultby the insurer. It is optimal for a risk-averse individual to purchase earthquake insurance ata premium P = (1 + α) (1− ρ)E [Lhouse] if the premium loading α and the counterparty riskρ are not too large.
3.3 Implicit earthquake insurance with non-recourse loans
With a non-recourse loan, the individual is not liable for the repayment obligation R. If theindividual does not repay the loan after an earthquake, the bank can only initiate foreclosureand recover the value V − L. Thus, a non-recourse loan provides implicit insurance againstearthquake risk, encompassing implicit elements of an insurance premium, deductible, andupper limit similar to explicit insurance
10
To focus on the comparison between implicit and explicit insurance, we assume this subsectionthat the individual does not purchase earthquake insurance. It is then optimal for theindividual to repay the loan if and only if the repayment obligation does not exceed thevalue of the house and disutility from foreclosure, R ≤ V − L + δ. If R > V − L + δ, theindividual does not make the repayment, and the bank initiates foreclosure and recoversV −L. The final wealth is W (L) = w0 +w1 +X −L−min {R, V − L+ δ}. We assume thatthe minimum loan required to purchase the house is sufficiently low so that R ≤ V + δ canbe satisfied. (That is, either the loan repayment obligation is sufficiently low, or the disutilityfrom foreclosure is sufficiently high, so that the individual is willing to repay the loan whenthere is no earthquake.)
The optimal loan contract (X,R) is given by the following optimization problem
maxREU = E [u (w0 + w1 +X − L−min {R, V − L+ δ})] ,
with R = X + C = X + (1 + β)E[(R− (V − L)) · 1{R−(V−L)>δ}
].
A non-recourse loan provides the individual with implicit insurance as the individual canwalk away from the loan if the loss is high. Rearranging the objective function yields
maxREU = E [u (w0 + w1 − L− (R−X) +max {0, L− (V −R)− δ})] ,
where w0 + w1 − L is equivalent to the total payoff with a recourse loan and no insurance.With a non-recourse loan, the individual gains max {0, L− (V −R)− δ}, which resemblesthe payoff from an explicit insurance contract that fully indemnifies losses in excess of adeductible of (V −R) + δ. For this implicit insurance, the individual has to pay C = R−X,which can be interpreted as the lending premium for implicit insurance.
For β = δ = 0, the individual always defaults if R − (V − L) > 0 and X = R −E [max {0, R− (V − L)}]. In this case, the optimization problem is
maxREU = E [u (w0 + w1 − L− E [max {0, R− (V − L)}] +max {0, R− (V − L)})] ,
and it is optimal for the individual to choose R∗ = V so that the total payoff is equivalent tothe payoff with full explicit insurance at a fair premium, EU = u (w0 + w1 − E [L]) .
A non-recourse mortgage involves implicit insurance against earthquake risk that bears aresemblance to explicit insurance. For V = R, the individual is fully insured. V = R impliesV > X since R−X = C. Thus, the individual has an equity stake in the property equal toC, where C can be interpreted as the “cost of implicit insurance”, similar to a premium for
11
explicit insurance. If V > R, the individual is not fully insured, and the equity stake exceedsthe implicit insurance premium. V −R resembles a deductible in explicit insurance, whichmay stem, for example, from a (regulatory) limit on the maximum loan-to-value ratio. Thepersonal cost from foreclosure δ has a similar effect as the individual will not use implicitinsurance when losses are lower than δ. A low loan-to-value ratio and a high personal costof foreclosure limit the attractiveness of implicit insurance through non-recourse financing.However, there are also two important potential advantages associated with implicit insurance.First, implicit insurance “covers” also the damage to the land, not only the damage to thestructure of the house. Thus, even if the loan-to-value ratio is low, if the risk to the valueof the land is high, implicit insurance may still involve more coverage of the total loss thanexplicit insurance, which only covers the structure of the house. Second, implicit insurancedoes not involve counterparty risk for the individual. The negative effect of counterparty riskon the individual’s expected utility can be higher than from foreclosure.
Increasing β > 0 has an effect that is similar to increasing the premium loading α: It makesit less attractive to implicitly insure the property through a non-recourse home-purchase loan.However, if the risk is not correctly priced and β < 0 because of bank bailouts, the result isreversed.
3.4 Explicit earthquake insurance in the presence of non-recoursemortgages
With a non-recourse mortgage, the homeowner is fully insured against losses caused by anearthquake to both the land and the house above an implicit deductible level V − R + δ.Whether the homeowner purchases earthquake insurance or not depends on the characteristicsof the loan contract, the insurance contract, the distribution of losses to the land, and thecost of foreclosure to the homeowner. If V −R is large, then the deductible level of implicitinsurance is large and the homeowner is more likely to purchase explicit earthquake coverage.The positive effect on the demand for explicit coverage is similar if the cost of foreclosure tothe individual, δ, is high, if the potential loss to the land, Lland, is low relative to the lossto the house, Lhouse, or if the cost to the bank of bearing earthquake risk, β, is high. If thepremium loading of the insurance contract, α, and/or the counterparty risk of the insurancecompany, ρ, are sufficiently low, then explicit insurance is more attractive to the homeowner.
In any case, implicit insurance reduces incentives to use explicit insurance unless banks requireexplicit insurance or lending rates are sufficiently sensitive to having explicit insurance.
12
3.5 Implications and predictions
In California, looking only at the earthquake insurance take-up rate gives a distorted pictureof the extent to which homeowners bear earthquake risk. Our analysis suggests that implicitinsurance through mortgages is a substitute for explicit insurance for owner-occupied homes,as owner-occupied loans are non-recourse loans. Thus, explicit earthquake insurance andimplicit earthquake insurance are negatively related. Moreover, the benefits of implicitinsurance over explicit insurance for owner-occupied houses increases in the loan-to-value(LTV) ratio as a higher mortgage implies a higher level of implicit insurance coverage.
Catastrophic risks are costly to insure, and banks might be able to bear catastrophic risksat lower cost than insurers because of lower cost of risk transfer or bailouts. If banks havelower cost of bearing catastrophic events, they will require borrowers to purchase insurancefor risks that are easily diversifiable, but not for catastrophe risks. When homeowners chooseimplicit insurance, then they have an incentive to choose a high loan-to-value ratio. Thus,mortgage lending in states with non-recourse mortgages and high catastrophe risk will behigher than in states with recourse lending and low catastrophe risk.
Unless banks engage in risk shifting, it is likely that their comparative advantage from bearingearthquake insurance risk stems from their ability to transfer the risk through securitization orsale to GSEs. Therefore, we expect a positive relation between the level of implicit insuranceand securitization and sale to GSEs.
We expect that banks price implicit earthquake insurance coverage through adjusting theinterest rate on the mortgage loan. Thus, mortgage loans where the homeowner purchasesexplicit earthquake insurance should ceteris paribus have a lower interest rate than mortgageloans without earthquake insurance. Mortgage rates might be insensitive to the purchase ofexplicit insurance if banks want to bear the earthquake risk.
If bailouts and risk-shifting incentives distort bank’s pricing of the earthquake risk, implicitinsurance distorts homeowners’ incentives to take measures against earthquake risk and buildhomes at exposed locations, where they would otherwise not build a house.
Unfortunately, testing our predictions is difficult due to a lack of data on the purchase ofearthquake insurance, value of the house, and outstanding mortgage for individual homeown-ers.
13
4 Hypothesis and Empirical Strategy
4.1 Relation between explicit and implicit earthquake insurance
The lack of information on whether individual borrowers purchase earthquake insuranceseverely limits the ability to test our predictions empirically. The California Departmentof Insurance (CDI) biannually provides information on the aggregate number and type ofhomeowners and earthquake insurance policies in a 5-digit ZIP-code area in California. We usethis data to derive the average earthquake insurance take-up rate (EqRate) for owner-occupiedhomeowners for each 5-digit ZIP-code area in California in 2011 and 2015. The fact that wehave a measure only on the average use of earthquake insurance limits the predictions we cantest and affects our empirical strategy. For example, instead of testing whether homeownerswith a higher loan-to-value ratio of the home are less likely to purchase earthquake insurance,we can only test whether there is a negative association between the earthquake insurancetake-up rate and the average level of implicit insurance in a 5-digit ZIP code area. Wedescribe the data sources and derivation of our variables in the Data section, and all variablesare defined in Table 1.
We use two measures to proxy for implicit insurance (ImplIns). Our first measure is theaverage loan-to-value ratio (AvgLTV ) of owner-occupied, first lien, 1-to-4 units, conventionalmortgages in a 5-digit ZIP-code area. A higher average LTV ratio in an area implies a higherlevel of implicit coverage. Therefore, we predict a negative relation between the earthquakeinsurance take-up rate and the average LTV ratio.
Our second proxy is the mortgage take-up rate (MrtgRate). The mortgage take-up rate isthe share of all owner-occupied housing units with a mortgage in a 5-digit ZIP-code area. Ahigher mortgage take-up rate should be related to a lower demand for explicit coverage. Thedrawback of this measure is that it also includes mortgages with a very low LTV ratio forwhich the level of implicit insurance is low.
We run the following OLS regression:
EqRatei = α + βImplInsi + δXi + εi,
where i indicates variables related to a 5-digit ZIP-code area i.
Xi is the vector of -control variables. We control for the income of households, using thenatural logarithm of the median household income (log(Inc)), the share of unemployedcivilian labor force (Unemployment), and the share of the population that is at least 25 years
14
old and has a high school education or higher (Education) on a 5-digit ZIP-code level. Incomeand unemployment are important determinants of insurance demand, which is subject toincome and wealth effects. We include education as the behavioral literature on catastropheinsurance suggests that economic literacy is an important determinant of the demand forearthquake insurance. We also include the level of earthquake risk (Medium and High,where Low is used as a reference group).
4.2 Implicit insurance coverage and risk transfer
To test whether banks retain the exposure to earthquake risk on their balance sheet or whetherthey are more likely to sell (securitize) loans that are exposed to earthquake risk, we wouldlike to explicitly control for whether a mortgage borrower purchased earthquake insurance.Again, we do not have this information on loan level. Instead, we use the earthquake insurancetake-up rate (EqRate) for owner-occupied homeowners in a 5-digit ZIP-code area in California.We test whether there is a positive or negative association between the insurance take-uprate and the share of loans sold to GSEs (SoldGSE) on a 5-digit ZIP-code.
Another important variable is the average LTV ratio (AvgLTV ) of loans. A higher LTVratio implies a higher risk for banks in the case of default.
We run the following OLS regression:
SoldGSEi = α + βEqRatei + γAvgLTVi + δXi + εi,
where i indicates variables related to a 5-digit ZIP-code area.
The vector of controls Xi contains the average credit score of borrowers (AvgCreditScore)and the share of home-purchase loans (Purchase) in a 5-digit ZIP-code area. We also controlfor the income of households, using the natural logarithm of the median household income(log(Inc)), and the share of unemployed civilian labor force (Unemployment) on a 5-digitZIP-code level. Income and unemployment are important factors in determining the riskinessof the loan. We also include the level of earthquake risk (Medium and High, where Low isused as a reference group).
15
4.3 The cost of implicit insurance coverage
To test whether the bank prices implicit earthquake insurance coverage, we would like to runthe following regression:
IntRatej = α + βExplInsj + δXj + εj,
where IntRatej is the original interest rate on a loan j that a homeowner has to pay; ExplInsjis a dummy that equals 1 if the homeowner purchased earthquake insurance, and Xj is a setof controls including the average LTV ratio and borrower characteristics.
As we do not have this data, to test whether explicit insurance coverage is negatively relatedto the interest rate of the loan, we run the OLS regression on an aggregate level. We use theaverage interest rate set on the mortgage loans (AvgIntRate) in a 5-digit ZIP-code area asa depenedent variable and replace ExplInsj by the insurance take-up rate EqRate in the5-digit ZIP-code area where the mortgage loan is originated.
The vector of controls X contains the following loan level data: average loan-to-value ratio(AvgLTV ), average borrower’s credit score (AvgCreditScore), the natural logarithm ofthe average unpaid principal balance (log(UPB)), and the share of the purchase loans(Purchase).
We obtain explicit earthquake insurance premiums using the CEA Premium Calculator.
5 Data
We merge data from different sources and focus only on California and on the years 2011 and2015.
Explicit insurance: earthquake insurance take-up rate The California Department ofInsurance (CDI) provides data on insurance policies. It includes the aggregate number andtype of homeowners and earthquake insurance policies in a 5-digit ZIP-code area in Californiathat were in place as of the calendar year-end, i.e. December 31, 2011 and 2015. We use thedata to obtain standard owner-occupied homeowners insurance policies (HO-03 type, 55% ofthe sample) and dwelling owner-occupied policies (similar to standard homeowners insurancebut with more restricted coverage, 3% of the sample) and earthquake coverage provided forthose policies.17
17We do not consider renter’s insurance policies covering only contents but not the structure of the house(16% of the sample). We also exclude dwelling tenant-occupied policies covering the structure of a house
16
Since earthquake coverage can only be purchased together with homeowners insurance, wederive the earthquake insurance take-up rate by dividing the number of earthquake policiesby the number of homeowners insurance policies.
Implicit insurance We did not find any data set containing information about whether(individual) loans are insured through earthquake insurance. As a proxy for the potentialprotection against earthquake risk though mortgage loans, we use the average loan-to-valueratio in a 5-digit ZIP-code area provided by LPS.18 The average loan-to-value ratio iscalculated for all conventional, owner-occupied, first lien, and 1-to-4 units mortgage loansin a 5-digit ZIP-code area in California. It includes all existing mortgage loans as of thecalendar year-end, i.e. December 31, 2011 and 2015.
We obtain the mortgage take-up rate, calculated as the number of owner-occupied housingunits with a mortgage over the number of the owner-occupied housing units, in a 5-digitZIP-code area from the US Census Bureau Fact Finder.19 We also use the U.S. CensusBureau Fact finder to obtain the controls that we use in our regression on the relation betweenexplicit and implicit insurance, on a 5-digit ZIP code area level: median household income,unemployment rate of the civilian labor force, and the share of the population of 25 years oldand over with a high school education or higher.
Risk transfer We use the share of mortgage loans that were sold to GSEs (Fannie Maeand Freddie Mac) as a measure of earthquake risk transfer from banks to GSEs. This data isprovided by LPS and is for conventional, owner-occupied, first lien, 1-to-4 units mortgageloans. We use the average borrowers’ credit score and the share of home purchase loans in a5-digit ZIP-code area as controls (LPS). We also control for the median household income andunemployment ratio in a 5-digit ZIP-code area which we obtain from U.S. Census Bureau.
Cost of implicit insurance We use the average interest rate set on the mortgage loans fromLPS data set to calculate the premium rate of implicit insurance. This data set provides
that is rented (15% of the sample), since mortgages for tenant-occupied homes are generally recourseloans.
18LPS stands for Lender Processing Services, former known as McDash. Mortgage data provided by LPS isused in a number of academic papers, e.g. in Adelino et al (2016). The data is collected from mortgageservicers and covers about 65% of the U.S. residential mortgage market. It contains detailed informationon residential mortgages loans. However, due to legal restrictions we were allowed to only use dataaggregated on a 5-digit ZIP-code level. The data we use includes only conventional, owner-occupied, firstlien, and 1-to-4 units mortgage loans.
19http://factfinder.census.gov/faces/nav/jsf/pages/index.xhtml
17
the average interest rate in a 5-digit ZIP-code area for mortgage loans that are conventional,first-lien, owner-occupied, and 1-4 units.
Earthquake risk data California is not uniformly exposed to the same level of earthquakerisk. We adopt earthquake risk ratings by 5-digit ZIP codes from the California EarthquakeAuthority (CEA) Premium Calculator.20 The CEA uses 18 rating zones and the earthquakeinsurance premium in the highest risk zone is about nine times higher than in the lowest riskzone. While CEA earthquake risk ratings do not represent the earthquake risk precisely dueto cross-subsidization, they are a reasonable proxy for the actual earthquake risk in a 5-digitZIP-code area.21
Figure 1 shows the CEA earthquake insurance premium rates calculated for a house built in2005 with a frame construction and one store for an insurance policy with a 15% deductible.Based on the earthquake insurance premium rates, we divide them into three groups: low(zone 1), medium (zones 2-12), and high (zones 13-18) risk zones.
6 Results
We present the descriptive statistics and correlation coefficients of our main variables inTables 2 and 3, respectively.
Explicit and implicit insurance We present our results on the relation between explicit andimplicit earthquake insurance for years 2011 and 2015 in Table 4 and Table 5, respectively.Across all specifications, the average LTV ratio (AvgLTV ) has a negative and statisticallysignificant relation to the explicit earthquake insurance coverage measured by the earthquakeinsurance take-up rate (EqRate) on a 5-digit ZIP-code level. As exhibited in column (4) inTable 4, a 10 percentage points (pp) increase in the average LTV ratio (from 63.55% to 73.55%)is related to a decrease in the earthquake insurance take-up rate by 5.56 pp, i.e. from 11.88 %to 6.32 % which translates into a 53.2 % decrease. The relation between the mortgage take-uprate (MrtgRate) and the earthquake insurance take-up rate (EqRate) in a 5-digit ZIP-codearea is also negative and significant, as shown in column (5). Overall, these findings suggestthat there is a negative relation between implicit and explicit coverage. Compared to the low
20http://www2.earthquakeauthority.com/Pages/Calc.aspx21As discussed by Lin (2016), CEA rates are closely tied to the Peak Ground Acceleration, which is a
measure of earthquake acceleration on the ground to be experienced in a region along with a probabilityof exceedance (such as 10% in 50 years).
18
earthquake risk zone, a medium risk zone is related to a higher earthquake insurance-take uprate while the high risk zone has no statistically significant difference.
We also find that demographic characteristics of a ZIP-code area and the earthquake insurancetake-up rate are related: median household income (log(Inc)) and the share of the populationthat is at least 25 years old and has a high school education or higher (Education) have apositive relation while the unemployment rate (Unemployment) has a negative relation withthe earthquake insurance take-up rate (EqRate).
Risk transfer Tables 6 and 7 contain our results on earthquake insurance and risk transferin years 2011 and 2015, respectively. We find that, controlling for the average borrowers’credit score (AvgCreditScore), its purpose (Purchase), the homeowner’s income (log(Inc)),and unemployment (Unemployment), the earthquake insurance take-up rate is negativelyrelated to the share of loans sold to GSEs while the average LTV ratio is positively related.As exhibited in column (4) in Table 6, a 10 pp increase in the earthquake insurance take-uprate (from 11.88% to 21.88%) is associated with a decrease in the share of loans sold toGSEs by 1.84 pp, i.e., from 66.97 % to 65.13 %, which translates into a 2.74 % decrease.On the other hand, a 10 pp increase in the average LTV ratio (from 63.55% to 73.55 %) isrelated to a higher share of loans sold to GSEs by 6.31 pp, i.e., from 65.13% to 71.44 % whichtranslates into a 9.69 % increase. Our results suggest that implicit earthquake insurance andthe transfer of risk from banks to GSEs are positively related.
Cost of (implicit) insurance The results in Table 8 and 9 show that there is a statisticallysignificant negative association between the purchase of explicit earthquake insurance coverageand the interest rate of a loan. Our evidence suggests that banks price the provision ofimplicit insurance coverage with an average premium rate of 0.2%. To estimate the price forexplicit earthquake insurance coverage, we use the CEA Premium Calculator. The followinghouse characteristics (risk factors) are required by the CEA Premium Calculator to determinethe premium: the 5-digit ZIP-code of the house, the year the house was built, the insuredvalue of the house, whether the house has more than one store, the foundation type of thehouse, whether the house was built with a frame construction, and the deductible level of 10%or 15%. The 5-digit ZIP-code reflects the exposure to earthquake risk and has a significanteffect on the premium rate. We provide the range of premium rates from low risk zones tohigh risk zones. While the number of stores, the frame construction, and the deductiblelevel also have a significant effect on the premium rate, the year the house was built, theinsured value of the house, and the foundation type of the house do not matter. We choose
19
2005 as the year the house was built and slab as the foundation type. By varying thosecharacteristics, the premium rates do not change. For the insured value of the house, wechoose $420,000. In Table 10, we provide the premium ranges from low risk zones to highrisk zones (based on a 5-digit ZIP-code level) for different house characteristics.
The risk zone (5-digit ZIP-code area) and whether the house is built with a frame or not arethe two most important risk factors. Our estimate for the average premium rate for implicitinsurance (0.2%) is lower than the premium rate for explicit insurance coverage in high riskzones across all specifications (risk factors). However, for low risk zones, the average premiumrate for implicit insurance is higher than the premium rate for explicit insurance coverage.
20
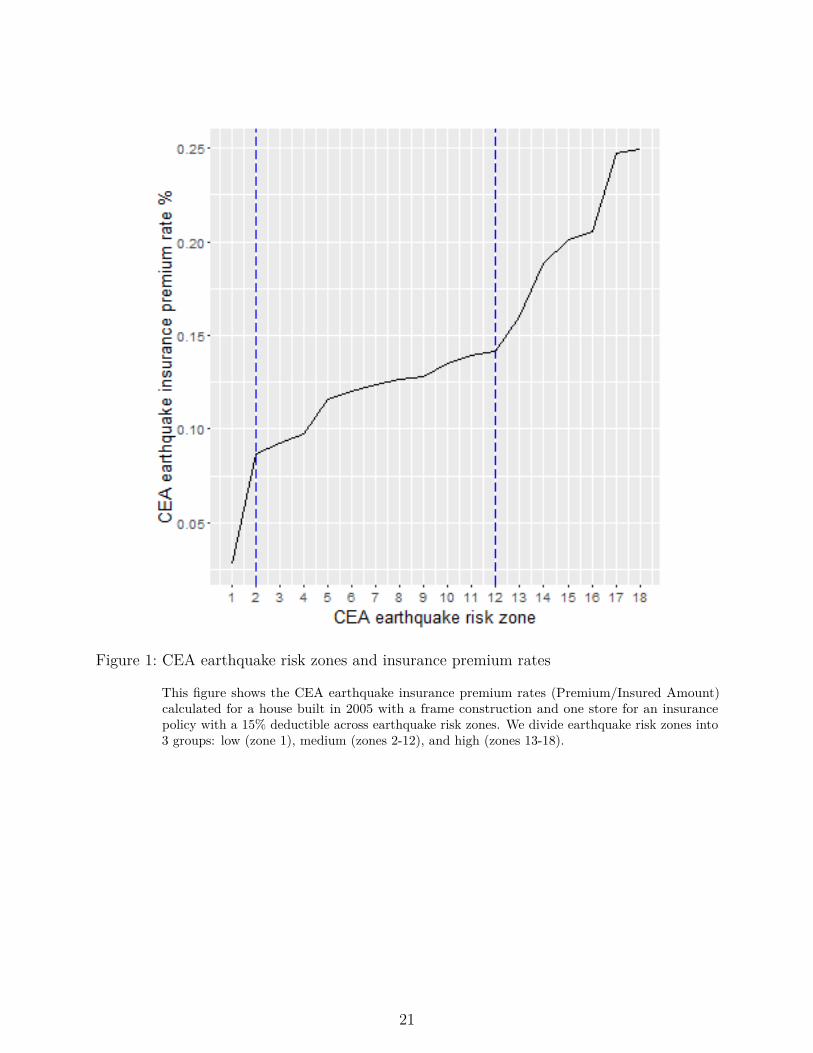
Figure 1: CEA earthquake risk zones and insurance premium rates
This figure shows the CEA earthquake insurance premium rates (Premium/Insured Amount)calculated for a house built in 2005 with a frame construction and one store for an insurancepolicy with a 15% deductible across earthquake risk zones. We divide earthquake risk zones into3 groups: low (zone 1), medium (zones 2-12), and high (zones 13-18).
21
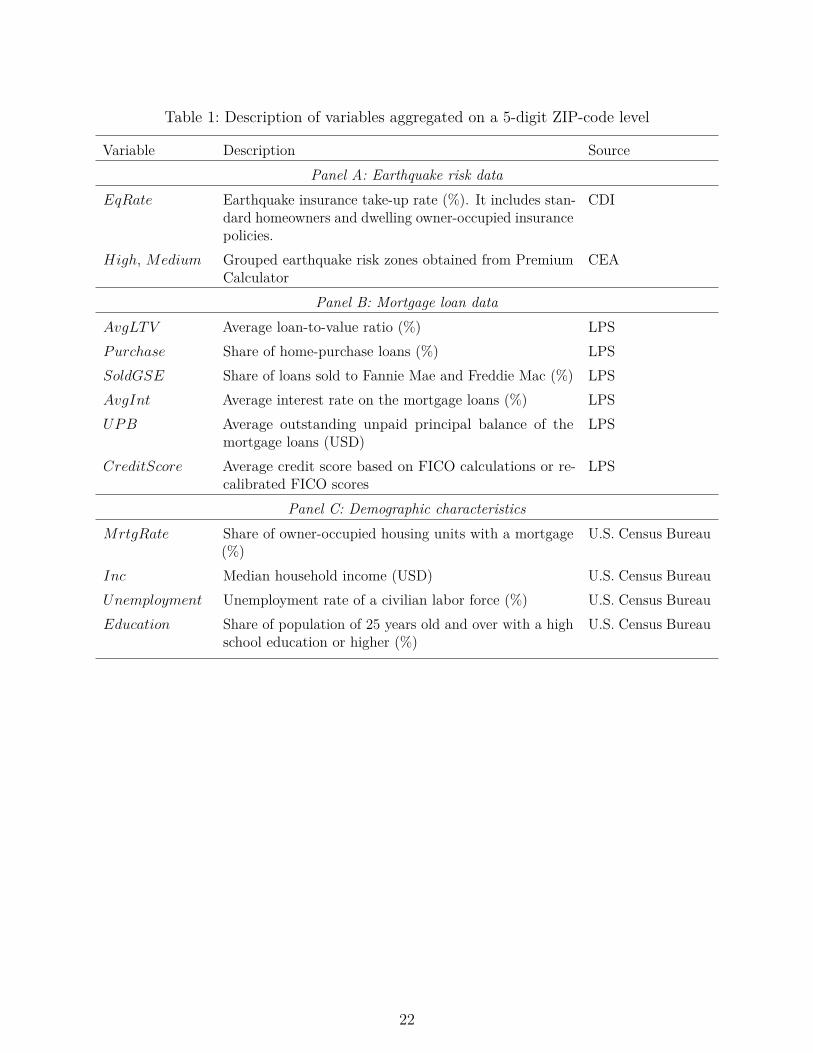
Table 1: Description of variables aggregated on a 5-digit ZIP-code level
Variable Description SourcePanel A: Earthquake risk data
EqRate Earthquake insurance take-up rate (%). It includes stan-dard homeowners and dwelling owner-occupied insurancepolicies.
CDI
High, Medium Grouped earthquake risk zones obtained from PremiumCalculator
CEA
Panel B: Mortgage loan dataAvgLTV Average loan-to-value ratio (%) LPSPurchase Share of home-purchase loans (%) LPSSoldGSE Share of loans sold to Fannie Mae and Freddie Mac (%) LPSAvgInt Average interest rate on the mortgage loans (%) LPSUPB Average outstanding unpaid principal balance of the
mortgage loans (USD)LPS
CreditScore Average credit score based on FICO calculations or re-calibrated FICO scores
LPS
Panel C: Demographic characteristicsMrtgRate Share of owner-occupied housing units with a mortgage
(%)U.S. Census Bureau
Inc Median household income (USD) U.S. Census BureauUnemployment Unemployment rate of a civilian labor force (%) U.S. Census BureauEducation Share of population of 25 years old and over with a high
school education or higher (%)U.S. Census Bureau
22
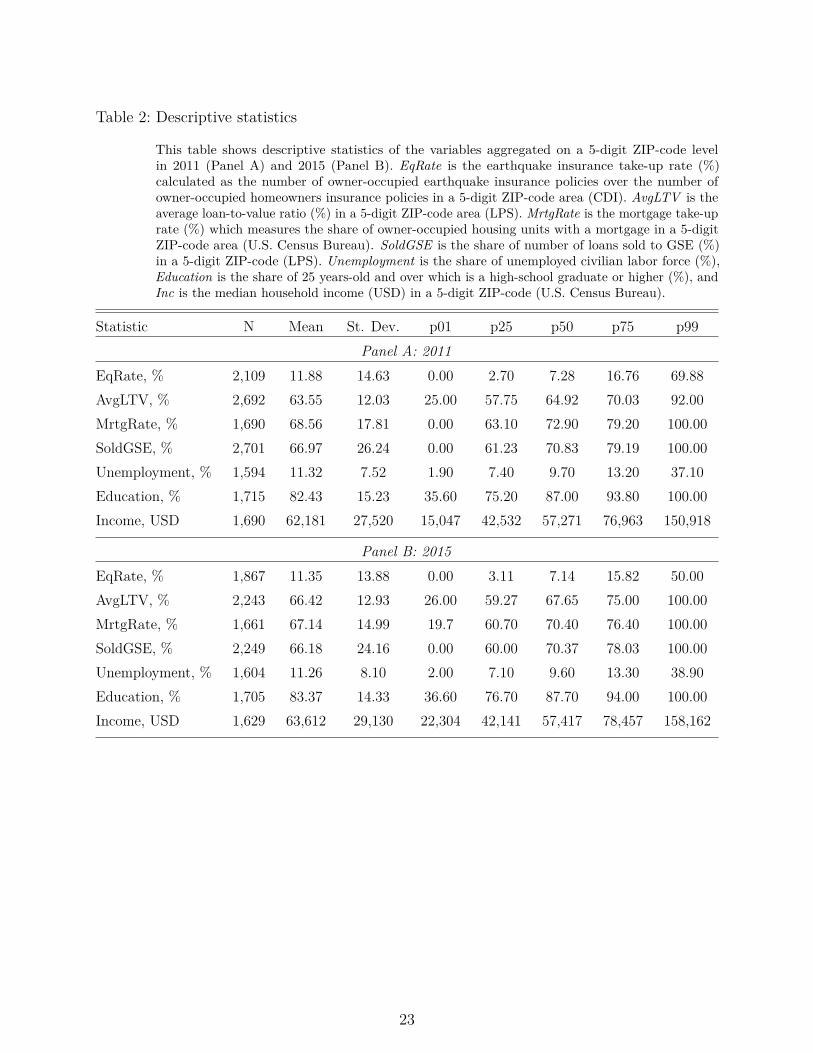
Table 2: Descriptive statistics
This table shows descriptive statistics of the variables aggregated on a 5-digit ZIP-code levelin 2011 (Panel A) and 2015 (Panel B). EqRate is the earthquake insurance take-up rate (%)calculated as the number of owner-occupied earthquake insurance policies over the number ofowner-occupied homeowners insurance policies in a 5-digit ZIP-code area (CDI). AvgLTV is theaverage loan-to-value ratio (%) in a 5-digit ZIP-code area (LPS). MrtgRate is the mortgage take-uprate (%) which measures the share of owner-occupied housing units with a mortgage in a 5-digitZIP-code area (U.S. Census Bureau). SoldGSE is the share of number of loans sold to GSE (%)in a 5-digit ZIP-code (LPS). Unemployment is the share of unemployed civilian labor force (%),Education is the share of 25 years-old and over which is a high-school graduate or higher (%), andInc is the median household income (USD) in a 5-digit ZIP-code (U.S. Census Bureau).
Statistic N Mean St. Dev. p01 p25 p50 p75 p99Panel A: 2011
EqRate, % 2,109 11.88 14.63 0.00 2.70 7.28 16.76 69.88AvgLTV, % 2,692 63.55 12.03 25.00 57.75 64.92 70.03 92.00MrtgRate, % 1,690 68.56 17.81 0.00 63.10 72.90 79.20 100.00SoldGSE, % 2,701 66.97 26.24 0.00 61.23 70.83 79.19 100.00Unemployment, % 1,594 11.32 7.52 1.90 7.40 9.70 13.20 37.10Education, % 1,715 82.43 15.23 35.60 75.20 87.00 93.80 100.00Income, USD 1,690 62,181 27,520 15,047 42,532 57,271 76,963 150,918
Panel B: 2015EqRate, % 1,867 11.35 13.88 0.00 3.11 7.14 15.82 50.00AvgLTV, % 2,243 66.42 12.93 26.00 59.27 67.65 75.00 100.00MrtgRate, % 1,661 67.14 14.99 19.7 60.70 70.40 76.40 100.00SoldGSE, % 2,249 66.18 24.16 0.00 60.00 70.37 78.03 100.00Unemployment, % 1,604 11.26 8.10 2.00 7.10 9.60 13.30 38.90Education, % 1,705 83.37 14.33 36.60 76.70 87.70 94.00 100.00Income, USD 1,629 63,612 29,130 22,304 42,141 57,417 78,457 158,162
23
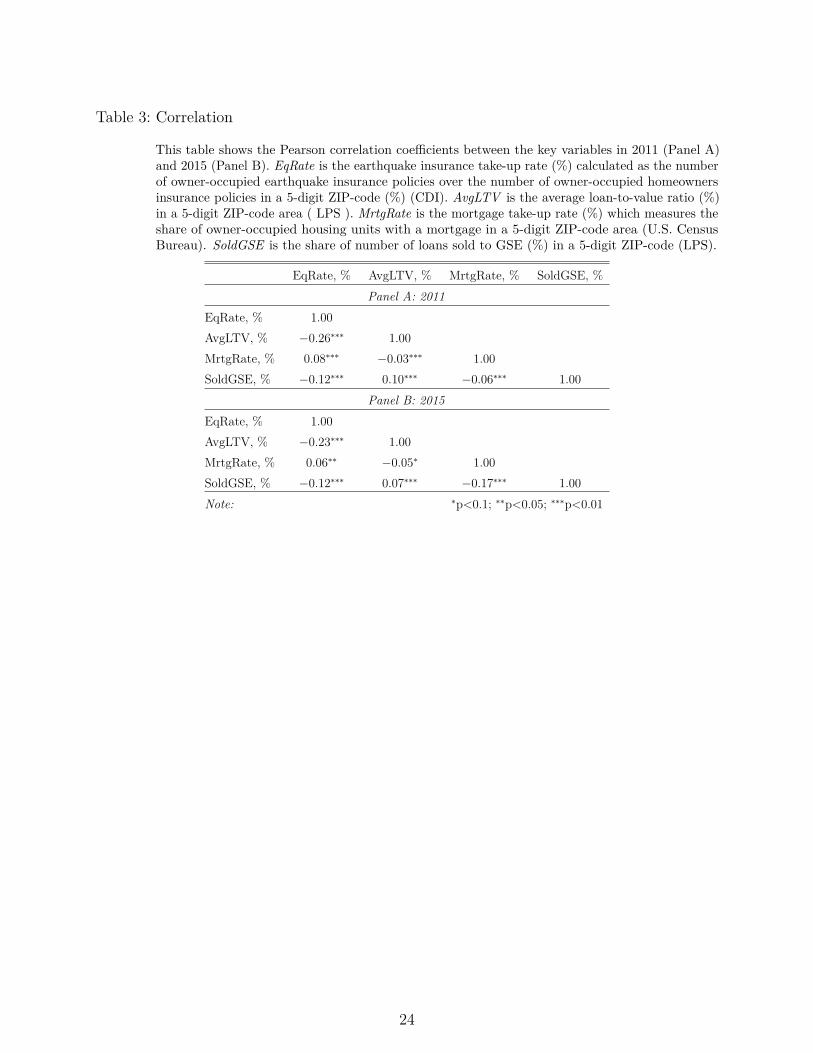
Table 3: Correlation
This table shows the Pearson correlation coefficients between the key variables in 2011 (Panel A)and 2015 (Panel B). EqRate is the earthquake insurance take-up rate (%) calculated as the numberof owner-occupied earthquake insurance policies over the number of owner-occupied homeownersinsurance policies in a 5-digit ZIP-code (%) (CDI). AvgLTV is the average loan-to-value ratio (%)in a 5-digit ZIP-code area ( LPS ). MrtgRate is the mortgage take-up rate (%) which measures theshare of owner-occupied housing units with a mortgage in a 5-digit ZIP-code area (U.S. CensusBureau). SoldGSE is the share of number of loans sold to GSE (%) in a 5-digit ZIP-code (LPS).
EqRate, % AvgLTV, % MrtgRate, % SoldGSE, %Panel A: 2011
EqRate, % 1.00AvgLTV, % −0.26∗∗∗ 1.00MrtgRate, % 0.08∗∗∗ −0.03∗∗∗ 1.00SoldGSE, % −0.12∗∗∗ 0.10∗∗∗ −0.06∗∗∗ 1.00
Panel B: 2015EqRate, % 1.00AvgLTV, % −0.23∗∗∗ 1.00MrtgRate, % 0.06∗∗ −0.05∗ 1.00SoldGSE, % −0.12∗∗∗ 0.07∗∗∗ −0.17∗∗∗ 1.00Note: ∗p<0.1; ∗∗p<0.05; ∗∗∗p<0.01
24
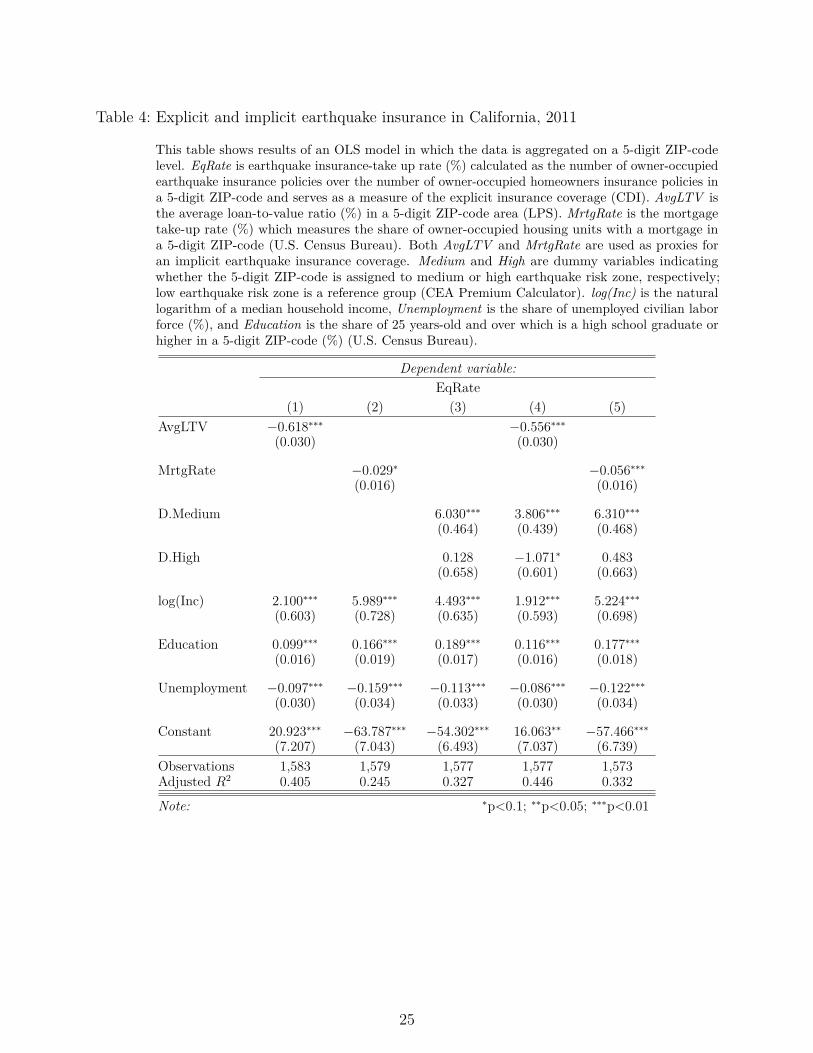
Table 4: Explicit and implicit earthquake insurance in California, 2011
This table shows results of an OLS model in which the data is aggregated on a 5-digit ZIP-codelevel. EqRate is earthquake insurance-take up rate (%) calculated as the number of owner-occupiedearthquake insurance policies over the number of owner-occupied homeowners insurance policies ina 5-digit ZIP-code and serves as a measure of the explicit insurance coverage (CDI). AvgLTV isthe average loan-to-value ratio (%) in a 5-digit ZIP-code area (LPS). MrtgRate is the mortgagetake-up rate (%) which measures the share of owner-occupied housing units with a mortgage ina 5-digit ZIP-code (U.S. Census Bureau). Both AvgLTV and MrtgRate are used as proxies foran implicit earthquake insurance coverage. Medium and High are dummy variables indicatingwhether the 5-digit ZIP-code is assigned to medium or high earthquake risk zone, respectively;low earthquake risk zone is a reference group (CEA Premium Calculator). log(Inc) is the naturallogarithm of a median household income, Unemployment is the share of unemployed civilian laborforce (%), and Education is the share of 25 years-old and over which is a high school graduate orhigher in a 5-digit ZIP-code (%) (U.S. Census Bureau).
Dependent variable:EqRate
(1) (2) (3) (4) (5)AvgLTV −0.618∗∗∗ −0.556∗∗∗
(0.030) (0.030)
MrtgRate −0.029∗ −0.056∗∗∗(0.016) (0.016)
D.Medium 6.030∗∗∗ 3.806∗∗∗ 6.310∗∗∗(0.464) (0.439) (0.468)
D.High 0.128 −1.071∗ 0.483(0.658) (0.601) (0.663)
log(Inc) 2.100∗∗∗ 5.989∗∗∗ 4.493∗∗∗ 1.912∗∗∗ 5.224∗∗∗(0.603) (0.728) (0.635) (0.593) (0.698)
Education 0.099∗∗∗ 0.166∗∗∗ 0.189∗∗∗ 0.116∗∗∗ 0.177∗∗∗(0.016) (0.019) (0.017) (0.016) (0.018)
Unemployment −0.097∗∗∗ −0.159∗∗∗ −0.113∗∗∗ −0.086∗∗∗ −0.122∗∗∗(0.030) (0.034) (0.033) (0.030) (0.034)
Constant 20.923∗∗∗ −63.787∗∗∗ −54.302∗∗∗ 16.063∗∗ −57.466∗∗∗(7.207) (7.043) (6.493) (7.037) (6.739)
Observations 1,583 1,579 1,577 1,577 1,573Adjusted R2 0.405 0.245 0.327 0.446 0.332
Note: ∗p<0.1; ∗∗p<0.05; ∗∗∗p<0.01
25
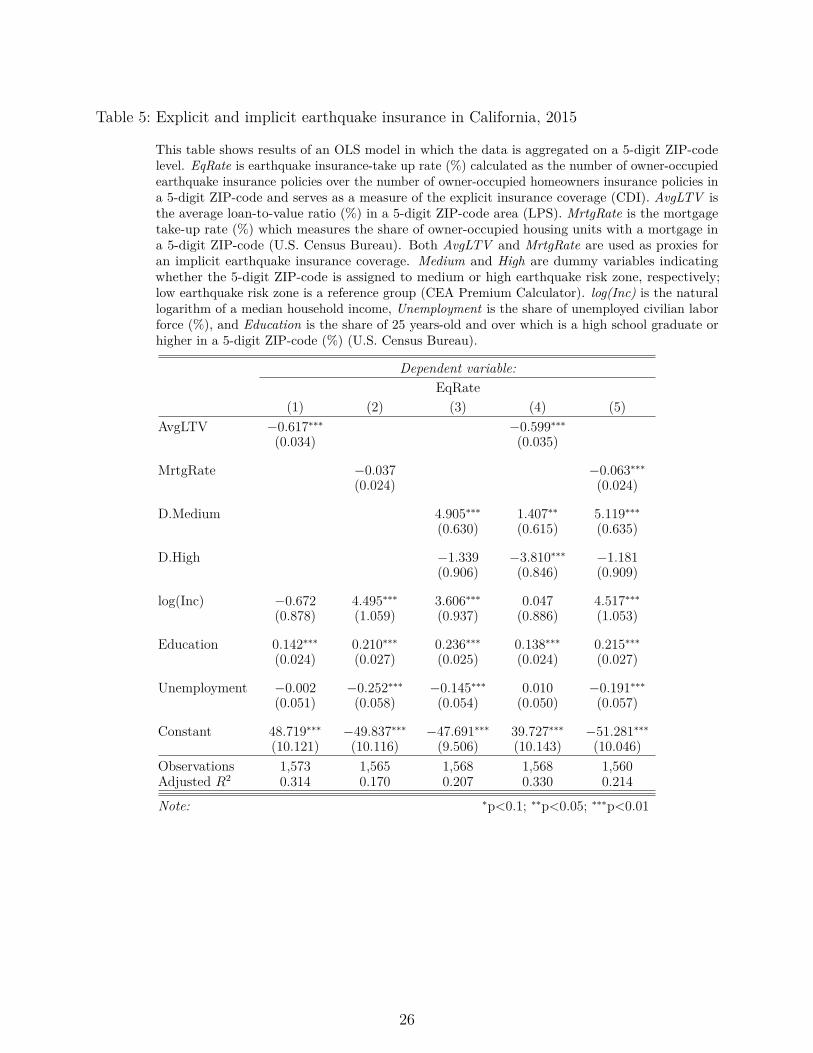
Table 5: Explicit and implicit earthquake insurance in California, 2015
This table shows results of an OLS model in which the data is aggregated on a 5-digit ZIP-codelevel. EqRate is earthquake insurance-take up rate (%) calculated as the number of owner-occupiedearthquake insurance policies over the number of owner-occupied homeowners insurance policies ina 5-digit ZIP-code and serves as a measure of the explicit insurance coverage (CDI). AvgLTV isthe average loan-to-value ratio (%) in a 5-digit ZIP-code area (LPS). MrtgRate is the mortgagetake-up rate (%) which measures the share of owner-occupied housing units with a mortgage ina 5-digit ZIP-code (U.S. Census Bureau). Both AvgLTV and MrtgRate are used as proxies foran implicit earthquake insurance coverage. Medium and High are dummy variables indicatingwhether the 5-digit ZIP-code is assigned to medium or high earthquake risk zone, respectively;low earthquake risk zone is a reference group (CEA Premium Calculator). log(Inc) is the naturallogarithm of a median household income, Unemployment is the share of unemployed civilian laborforce (%), and Education is the share of 25 years-old and over which is a high school graduate orhigher in a 5-digit ZIP-code (%) (U.S. Census Bureau).
Dependent variable:EqRate
(1) (2) (3) (4) (5)AvgLTV −0.617∗∗∗ −0.599∗∗∗
(0.034) (0.035)
MrtgRate −0.037 −0.063∗∗∗(0.024) (0.024)
D.Medium 4.905∗∗∗ 1.407∗∗ 5.119∗∗∗(0.630) (0.615) (0.635)
D.High −1.339 −3.810∗∗∗ −1.181(0.906) (0.846) (0.909)
log(Inc) −0.672 4.495∗∗∗ 3.606∗∗∗ 0.047 4.517∗∗∗(0.878) (1.059) (0.937) (0.886) (1.053)
Education 0.142∗∗∗ 0.210∗∗∗ 0.236∗∗∗ 0.138∗∗∗ 0.215∗∗∗(0.024) (0.027) (0.025) (0.024) (0.027)
Unemployment −0.002 −0.252∗∗∗ −0.145∗∗∗ 0.010 −0.191∗∗∗(0.051) (0.058) (0.054) (0.050) (0.057)
Constant 48.719∗∗∗ −49.837∗∗∗ −47.691∗∗∗ 39.727∗∗∗ −51.281∗∗∗(10.121) (10.116) (9.506) (10.143) (10.046)
Observations 1,573 1,565 1,568 1,568 1,560Adjusted R2 0.314 0.170 0.207 0.330 0.214
Note: ∗p<0.1; ∗∗p<0.05; ∗∗∗p<0.01
26
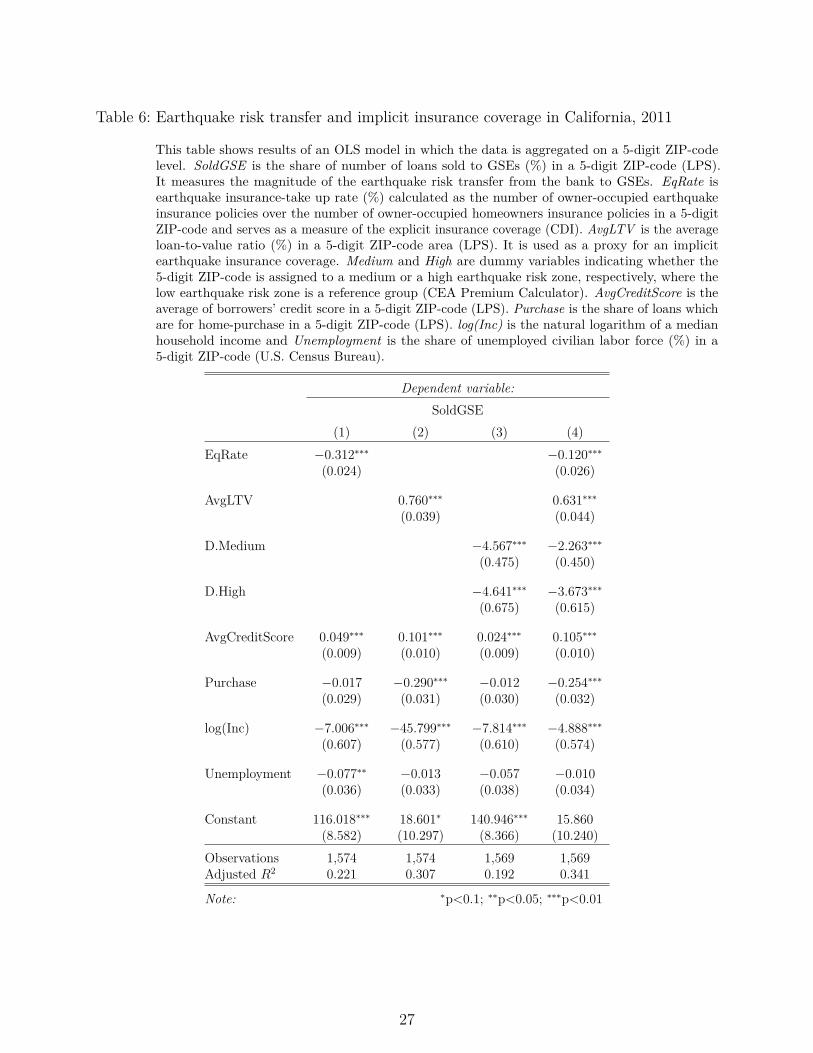
Table 6: Earthquake risk transfer and implicit insurance coverage in California, 2011
This table shows results of an OLS model in which the data is aggregated on a 5-digit ZIP-codelevel. SoldGSE is the share of number of loans sold to GSEs (%) in a 5-digit ZIP-code (LPS).It measures the magnitude of the earthquake risk transfer from the bank to GSEs. EqRate isearthquake insurance-take up rate (%) calculated as the number of owner-occupied earthquakeinsurance policies over the number of owner-occupied homeowners insurance policies in a 5-digitZIP-code and serves as a measure of the explicit insurance coverage (CDI). AvgLTV is the averageloan-to-value ratio (%) in a 5-digit ZIP-code area (LPS). It is used as a proxy for an implicitearthquake insurance coverage. Medium and High are dummy variables indicating whether the5-digit ZIP-code is assigned to a medium or a high earthquake risk zone, respectively, where thelow earthquake risk zone is a reference group (CEA Premium Calculator). AvgCreditScore is theaverage of borrowers’ credit score in a 5-digit ZIP-code (LPS). Purchase is the share of loans whichare for home-purchase in a 5-digit ZIP-code (LPS). log(Inc) is the natural logarithm of a medianhousehold income and Unemployment is the share of unemployed civilian labor force (%) in a5-digit ZIP-code (U.S. Census Bureau).
Dependent variable:SoldGSE
(1) (2) (3) (4)EqRate −0.312∗∗∗ −0.120∗∗∗
(0.024) (0.026)
AvgLTV 0.760∗∗∗ 0.631∗∗∗(0.039) (0.044)
D.Medium −4.567∗∗∗ −2.263∗∗∗(0.475) (0.450)
D.High −4.641∗∗∗ −3.673∗∗∗(0.675) (0.615)
AvgCreditScore 0.049∗∗∗ 0.101∗∗∗ 0.024∗∗∗ 0.105∗∗∗(0.009) (0.010) (0.009) (0.010)
Purchase −0.017 −0.290∗∗∗ −0.012 −0.254∗∗∗(0.029) (0.031) (0.030) (0.032)
log(Inc) −7.006∗∗∗ −45.799∗∗∗ −7.814∗∗∗ −4.888∗∗∗(0.607) (0.577) (0.610) (0.574)
Unemployment −0.077∗∗ −0.013 −0.057 −0.010(0.036) (0.033) (0.038) (0.034)
Constant 116.018∗∗∗ 18.601∗ 140.946∗∗∗ 15.860(8.582) (10.297) (8.366) (10.240)
Observations 1,574 1,574 1,569 1,569Adjusted R2 0.221 0.307 0.192 0.341
Note: ∗p<0.1; ∗∗p<0.05; ∗∗∗p<0.01
27
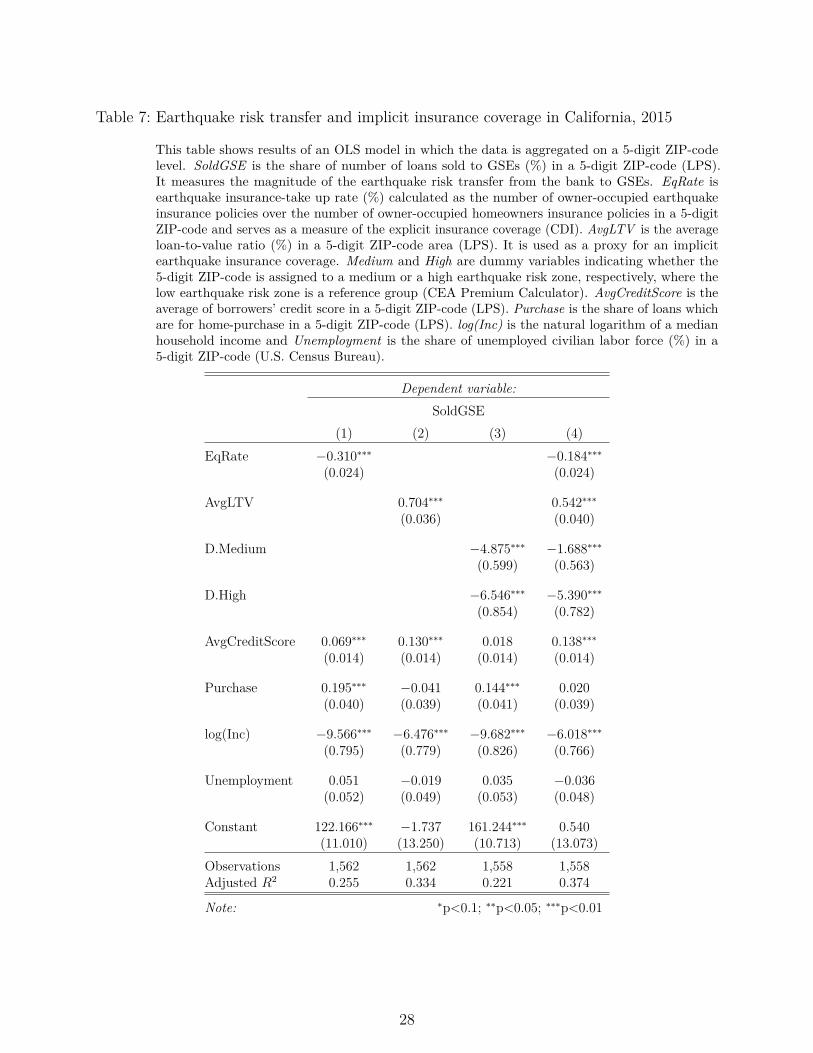
Table 7: Earthquake risk transfer and implicit insurance coverage in California, 2015
This table shows results of an OLS model in which the data is aggregated on a 5-digit ZIP-codelevel. SoldGSE is the share of number of loans sold to GSEs (%) in a 5-digit ZIP-code (LPS).It measures the magnitude of the earthquake risk transfer from the bank to GSEs. EqRate isearthquake insurance-take up rate (%) calculated as the number of owner-occupied earthquakeinsurance policies over the number of owner-occupied homeowners insurance policies in a 5-digitZIP-code and serves as a measure of the explicit insurance coverage (CDI). AvgLTV is the averageloan-to-value ratio (%) in a 5-digit ZIP-code area (LPS). It is used as a proxy for an implicitearthquake insurance coverage. Medium and High are dummy variables indicating whether the5-digit ZIP-code is assigned to a medium or a high earthquake risk zone, respectively, where thelow earthquake risk zone is a reference group (CEA Premium Calculator). AvgCreditScore is theaverage of borrowers’ credit score in a 5-digit ZIP-code (LPS). Purchase is the share of loans whichare for home-purchase in a 5-digit ZIP-code (LPS). log(Inc) is the natural logarithm of a medianhousehold income and Unemployment is the share of unemployed civilian labor force (%) in a5-digit ZIP-code (U.S. Census Bureau).
Dependent variable:SoldGSE
(1) (2) (3) (4)EqRate −0.310∗∗∗ −0.184∗∗∗
(0.024) (0.024)
AvgLTV 0.704∗∗∗ 0.542∗∗∗(0.036) (0.040)
D.Medium −4.875∗∗∗ −1.688∗∗∗(0.599) (0.563)
D.High −6.546∗∗∗ −5.390∗∗∗(0.854) (0.782)
AvgCreditScore 0.069∗∗∗ 0.130∗∗∗ 0.018 0.138∗∗∗(0.014) (0.014) (0.014) (0.014)
Purchase 0.195∗∗∗ −0.041 0.144∗∗∗ 0.020(0.040) (0.039) (0.041) (0.039)
log(Inc) −9.566∗∗∗ −6.476∗∗∗ −9.682∗∗∗ −6.018∗∗∗(0.795) (0.779) (0.826) (0.766)
Unemployment 0.051 −0.019 0.035 −0.036(0.052) (0.049) (0.053) (0.048)
Constant 122.166∗∗∗ −1.737 161.244∗∗∗ 0.540(11.010) (13.250) (10.713) (13.073)
Observations 1,562 1,562 1,558 1,558Adjusted R2 0.255 0.334 0.221 0.374
Note: ∗p<0.1; ∗∗p<0.05; ∗∗∗p<0.01
28
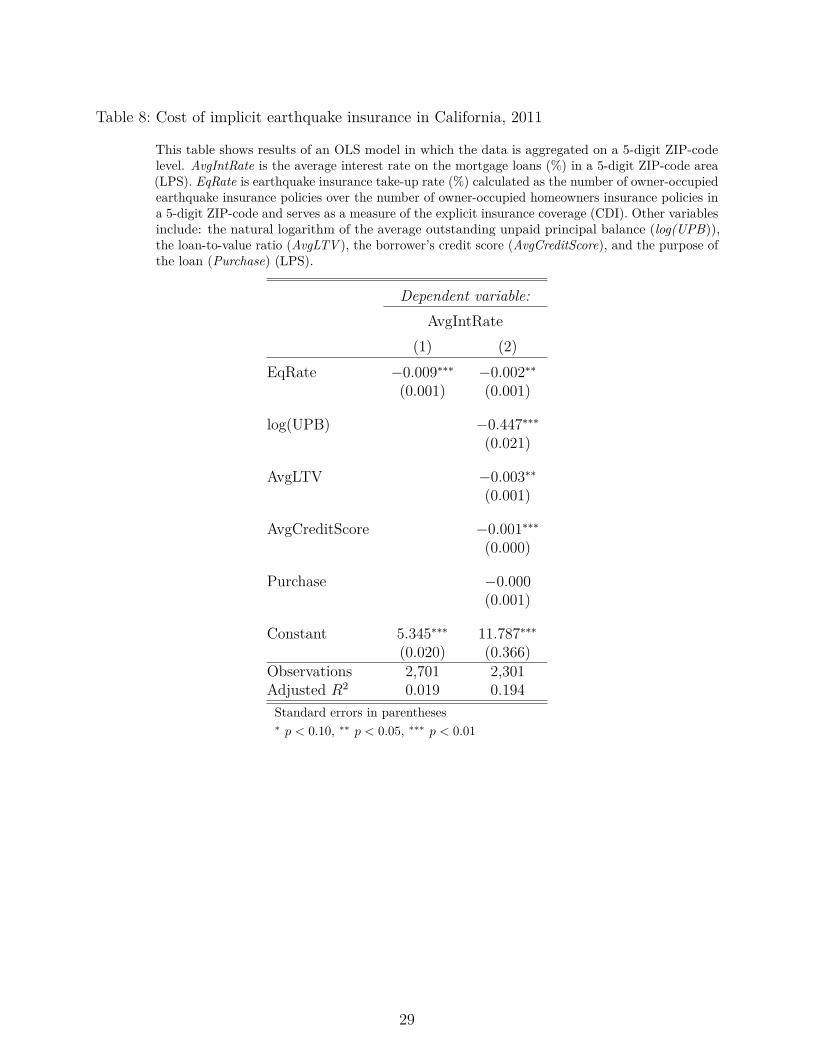
Table 8: Cost of implicit earthquake insurance in California, 2011
This table shows results of an OLS model in which the data is aggregated on a 5-digit ZIP-codelevel. AvgIntRate is the average interest rate on the mortgage loans (%) in a 5-digit ZIP-code area(LPS). EqRate is earthquake insurance take-up rate (%) calculated as the number of owner-occupiedearthquake insurance policies over the number of owner-occupied homeowners insurance policies ina 5-digit ZIP-code and serves as a measure of the explicit insurance coverage (CDI). Other variablesinclude: the natural logarithm of the average outstanding unpaid principal balance (log(UPB)),the loan-to-value ratio (AvgLTV ), the borrower’s credit score (AvgCreditScore), and the purpose ofthe loan (Purchase) (LPS).
Dependent variable:AvgIntRate
(1) (2)EqRate −0.009∗∗∗ −0.002∗∗
(0.001) (0.001)
log(UPB) −0.447∗∗∗(0.021)
AvgLTV −0.003∗∗(0.001)
AvgCreditScore −0.001∗∗∗(0.000)
Purchase −0.000(0.001)
Constant 5.345∗∗∗ 11.787∗∗∗(0.020) (0.366)
Observations 2,701 2,301Adjusted R2 0.019 0.194Standard errors in parentheses∗ p < 0.10, ∗∗ p < 0.05, ∗∗∗ p < 0.01
29
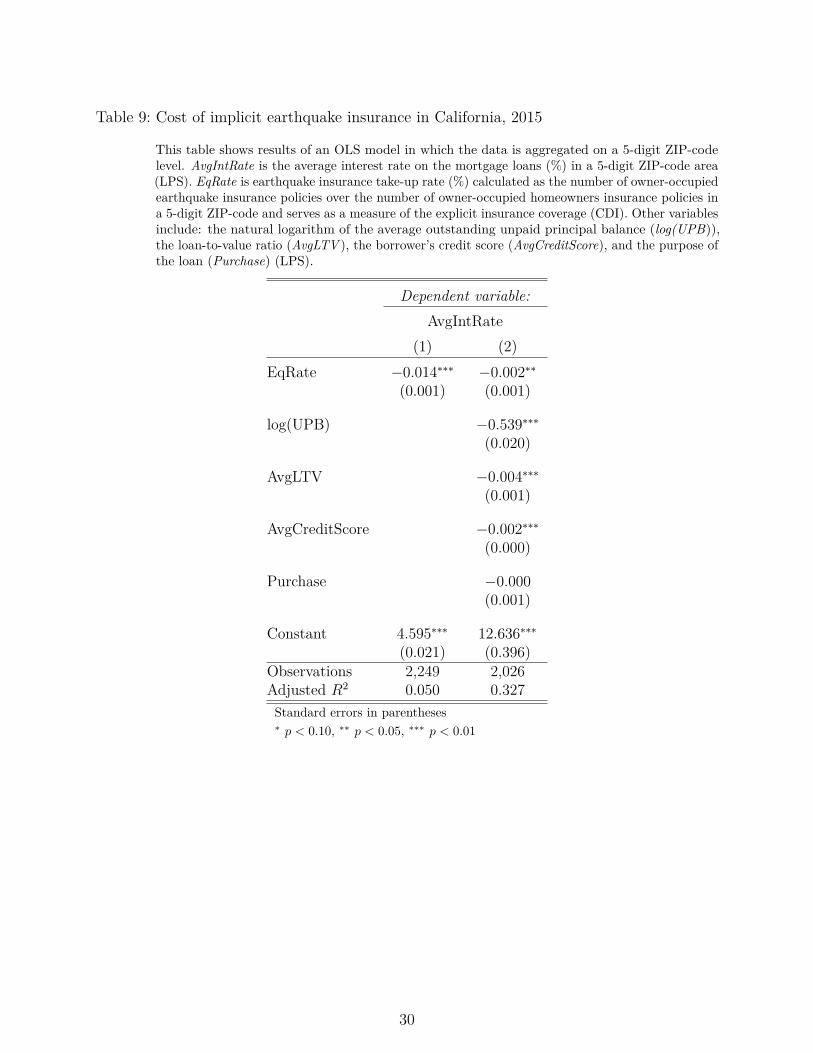
Table 9: Cost of implicit earthquake insurance in California, 2015
This table shows results of an OLS model in which the data is aggregated on a 5-digit ZIP-codelevel. AvgIntRate is the average interest rate on the mortgage loans (%) in a 5-digit ZIP-code area(LPS). EqRate is earthquake insurance take-up rate (%) calculated as the number of owner-occupiedearthquake insurance policies over the number of owner-occupied homeowners insurance policies ina 5-digit ZIP-code and serves as a measure of the explicit insurance coverage (CDI). Other variablesinclude: the natural logarithm of the average outstanding unpaid principal balance (log(UPB)),the loan-to-value ratio (AvgLTV ), the borrower’s credit score (AvgCreditScore), and the purpose ofthe loan (Purchase) (LPS).
Dependent variable:AvgIntRate
(1) (2)EqRate −0.014∗∗∗ −0.002∗∗
(0.001) (0.001)
log(UPB) −0.539∗∗∗(0.020)
AvgLTV −0.004∗∗∗(0.001)
AvgCreditScore −0.002∗∗∗(0.000)
Purchase −0.000(0.001)
Constant 4.595∗∗∗ 12.636∗∗∗(0.021) (0.396)
Observations 2,249 2,026Adjusted R2 0.050 0.327Standard errors in parentheses∗ p < 0.10, ∗∗ p < 0.05, ∗∗∗ p < 0.01
30
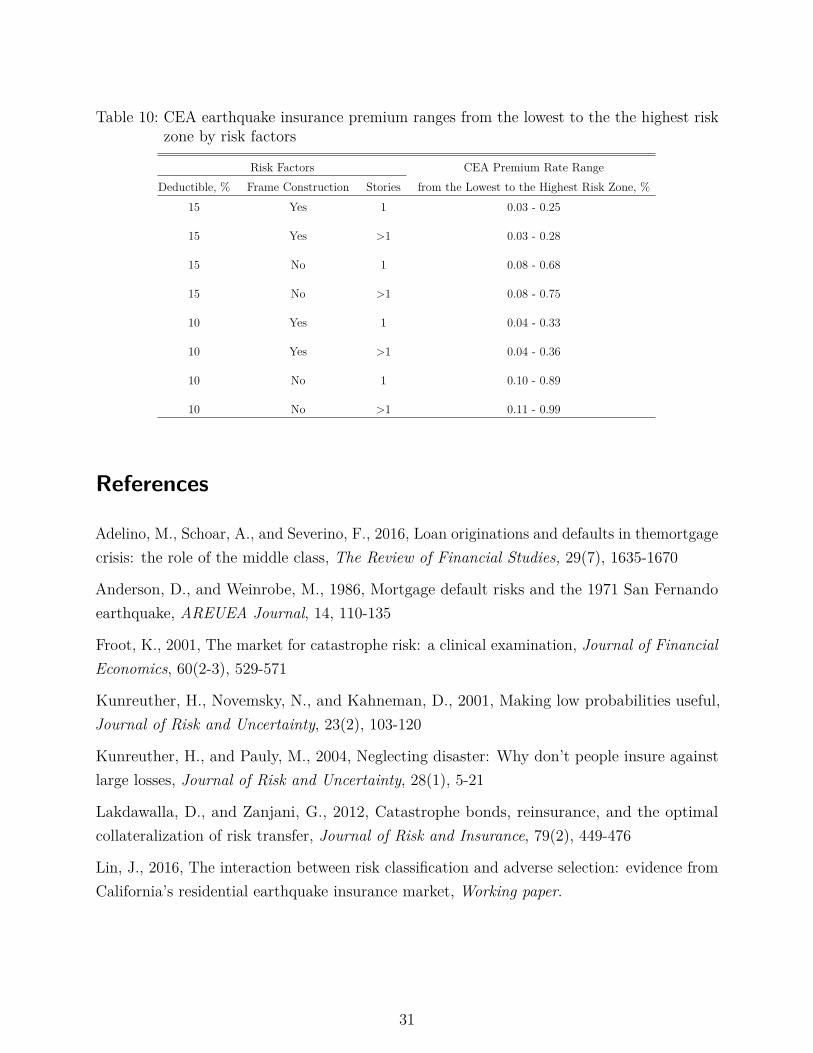
Table 10: CEA earthquake insurance premium ranges from the lowest to the the highest riskzone by risk factors
Risk Factors CEA Premium Rate RangeDeductible, % Frame Construction Stories from the Lowest to the Highest Risk Zone, %
15 Yes 1 0.03 - 0.25
15 Yes >1 0.03 - 0.28
15 No 1 0.08 - 0.68
15 No >1 0.08 - 0.75
10 Yes 1 0.04 - 0.33
10 Yes >1 0.04 - 0.36
10 No 1 0.10 - 0.89
10 No >1 0.11 - 0.99
References
Adelino, M., Schoar, A., and Severino, F., 2016, Loan originations and defaults in themortgagecrisis: the role of the middle class, The Review of Financial Studies, 29(7), 1635-1670
Anderson, D., and Weinrobe, M., 1986, Mortgage default risks and the 1971 San Fernandoearthquake, AREUEA Journal, 14, 110-135
Froot, K., 2001, The market for catastrophe risk: a clinical examination, Journal of FinancialEconomics, 60(2-3), 529-571
Kunreuther, H., Novemsky, N., and Kahneman, D., 2001, Making low probabilities useful,Journal of Risk and Uncertainty, 23(2), 103-120
Kunreuther, H., and Pauly, M., 2004, Neglecting disaster: Why don’t people insure againstlarge losses, Journal of Risk and Uncertainty, 28(1), 5-21
Lakdawalla, D., and Zanjani, G., 2012, Catastrophe bonds, reinsurance, and the optimalcollateralization of risk transfer, Journal of Risk and Insurance, 79(2), 449-476
Lin, J., 2016, The interaction between risk classification and adverse selection: evidence fromCalifornia’s residential earthquake insurance market, Working paper.
31