Embed Size (px)
Citation preview
IRJC
International Journal of Marketing, Financial Services & Management Research
Vol.1 Issue 8, August 2012, ISSN 2277 3622
ww
w.in
dia
nre
sear
chjo
urn
als.
com
1
FORECASTING VOLATILITY IN EQUITY PRICES
DR. S.D. VASHISHTHA*; DR. SHYAM VASHISHTHA**; RAJESH KUMAR***
*Dean and Professor,
Faculty of Commerce,
M.D. University, Rohtak.
**Assistant Professor,
B.L.J.S.P.G.College, Tosham.
***Research Scholar,
Department of Commerce,
M.D. University, Rohtak.
ABSTRACT
Volatility Forecasting helps to investors or players in the capital market to find out the buy and
sell signals about shares on the basis of quantity of risk thereon. In this paper researchers
examine the volatility in equity share prices of selected units under study. To measure the
volatility, the prices (for the financial year 2010-11) of Tata Motors Ltd. and Eicher Motors Ltd.
were analyzed with the help of statistical tool like, Mean, S.D. and t-statistics. The volatility in
the prices of Tata Motors was found of gyrated nature. It was concluded that volatility analysis is
a faithful analysis to measure the risk on financial assets and it is also helpful to take short and
long position in the market.
KEYWORDS: Volatility, Security, Short Position, Long Position, Market.
______________________________________________________________________________
INTRODUCTION
Prices of securities move up and down everyday in the stock markets. These ups and downs are
known by namely Fluctuation in the prices. Fluctuation in prices of a security comes from the
unbalanced demand and supply of that security. If demand side of a security is greater than its
supply, the price would start to go up and if supply side is greater than its demand, the price
would start to go down. The relative rate of fluctuation at which price of a security moves up and
down is called volatility or in other words, volatility refers to the amount of risk about the size of
changes in a security‟s value. It means if volatility increases in the prices of a financial
instrument, the risk also increases on that instrument. Sometime question arises that why
volatility is important? The volatility does not measure the direction of prices but it measures the
desperation among the prices which helps to know the risk (probable deviation from the
expected) on an instrument. On the basis of risk on an instrument, investors can analyze their
capacity to bear risk and also can make decisions relating to invest their excess fund in financial
assets.
IRJC
International Journal of Marketing, Financial Services & Management Research
Vol.1 Issue 8, August 2012, ISSN 2277 3622
ww
w.in
dia
nre
sear
chjo
urn
als.
com
2
REVIEW OF LITERATURE
In the past, various numbers of works have been conducted and completed on this topic and
some of the renowned works out of them are mentioned below:
Roy, et al. (1995)1 focused on two key issue: (a) what is the average level of volatility and
whether it has increased in the current period; (b)whether the present trend of share price
movement is likely to impair the development process of our economy through study „Stock
Market Volatility: Roots and Results‟. In this study, they examined that, several volatility
measures based on different price indices had been used to evaluate the stock price movement in
historical perspective. In such, instance, the conclusion was essentially the same, i.e., stock
market volatility had increased in the that period if the changes in share prices had been response
to fundamental economic factor or information and expectations about them, there was no social
cost associated with such volatility.
Reddy, (1996)2 analyzed the volatility of securities traded on the National Stock Exchange
(NSE) and the Bombay Stock Exchange (BSE). In this study, researcher employed stock market
trading data relating about 3,000 securities traded on Bombay Stock Exchange (BSE) and over
1,000 securities traded on NSE. Volatility of individual securities was also analyzed in this study
and it was found that the securities traded on BSE had more volatility than the securities traded
on NSE. Researcher also showed through this study that Indian Capital Markets were highly
volatile.
Mitra (2002)3 made a study on „Profiting from Technical Analysis in Indian Stock Market‟. He
tried to find out a trading strategy that is profitable even after transaction cost. He used daily
closing prices of ACC, Reliance industries, State bank of India, and TISCO from the stock
market published quotes during the period Dec, 1995 to Feb, 1999. He used two tools for
analysis purpose:
Moving average crossover, and Filter rules.
The trading tools or methods tested in the study were giving profitable results, which helps
investor to believe that making profit in stock market is not just a matter of chance. He
concluded that investor do not always to be right to enjoy the trading, but they need to have an
analytical and systematic approach to make trading profit on a cumulative basis.
Rao, (2007)4 in the study „Impact of Financial Derivatives Products on Spot Market Volatility: A
study on Nifty‟ examined the impact of index future, index options, stock options and stock
futures on the volatility of Nifty. For the purpose of this study the collected data from National
Stock Exchange and time period of study was June-7, 1999 to dec-31, 2005. He found that Nifty
volatility has increased with the introduction of derivatives product such as index futures. This
may be due to speculative operation and the Foreign Institutional Investors‟ active participation
in the market.
IRJC
International Journal of Marketing, Financial Services & Management Research
Vol.1 Issue 8, August 2012, ISSN 2277 3622
ww
w.in
dia
nre
sear
chjo
urn
als.
com
3
Sharma, (2007-08)5 tried to find out answers to these:-
To account the nature of individual investors in the investment-regions,
To study the methods and aspects which are considered by the individual investor while
investing in secondary market?
To find out the problems of individual investors.
Sharma examined, the most of investors belongs to the age group of 40-50 years, and Bombay is
having the highest (30.50%) numbers of investors in age group of 40-50 years. He found that
most of investors have high risk bearing capacity (45.16%). The maximum percentage of high
risk bearer investors‟ was obtained in Delhi area (48.75%) as compared to Bombay (42.25%) and
Calcutta (44.50%). He also found that, the investors of different areas were influenced by almost
six factors:-
News papers‟ news reading capital market and politics, Business magazines, Self knowledge/
assessment, Brokerage view points, the analysis plus news on business channels on T.V. and the
discussion with fellow investors and friends influences the investment behavior and decision of
the investor in the market.
Khan, et al. (2010)6 indicated through this paper „Causality and Volatility in the Firm Level
Stock Returns and Volume in India: Evidence from National Stock Exchange‟ towards the
presence of inefficiencies in Indian equity market. The information regarding trading volume and
returns may be used to predict the future prices. However, indication are that the changes in the
regulations and functioning of the Indian equity markets for the period under study are in
positive direction and inefficiencies seem to weaken in the later sub period (on the National
Stock Exchange).
OBJECTIVE OF THE STUDY
The objectives of the present study are:
1. To analyze the volatility of share prices of unit under study.
2. To test the significance of price fluctuations of the unit under study.
RESEARCH METHODOLOGY
The present study has been conducted to find out a solution for the problem „Forecasting
Volatility in Equity Share Price‟. Thus, an analytical research design has been used in this study.
STUDY AREA AND UNITS
The study is concerned with the some units selected from the sector of Indian automobile
industry. Two units were selected from category of light & heavy vehicles manufacturers (Tata
Motors Ltd. and Eicher Motors Ltd.). Each unit was matched for their size, technology, product
IRJC
International Journal of Marketing, Financial Services & Management Research
Vol.1 Issue 8, August 2012, ISSN 2277 3622
ww
w.in
dia
nre
sear
chjo
urn
als.
com
4
and organizational structure with the other unit in same category. Shares of each unit were listed
on the Bombay stock Exchange and the listing procedures of the securities of these units ensure
almost similar guidelines issued by SEBI. Both the units are quite old, i.e. two decades.
UNIT PROFILE: Unit wise profile of the selected units is given below:
TATA MOTORS LTD. - this company was established in 1945 by the founder, Mr. J. R. D.
Tata in Jamshedpur (Jharkhand). It is India‟s largest automobile company and it is the leaders in
commercial vehicles in each segment, and among the top three in passenger vehicles with
winning products in the compact, midsize car and utility vehicle segment. In this company over
25,000 employees are guided by the vision to be “best in the manner in which we operate, best in
the products we deliver, and best in our value system and ethics”
EICHER MOTORS LTD. – this company incorporated in 1982, is the flagship company of the
Eicher Group in India and a leading player of the Indian automobile industry. A 50-50 joint
venture with Volvo Group has been made by this company in July, 2008 in the form of VE
Commercial Vehicles Ltd (VECV). Buses and trucks are produced by VECV Ltd. and tractors
are produced by Eicher Group for agriculture sector.
SAMPLE DESIGN
A total of two securities of two units (Tata Motors Ltd. and Eicher Motors Ltd.) were selected by
accidental sampling. Sampling design is given in the Table-1.
TABLE-1: SELECTED UNITS IN THE SAMPLE
Name of the Unit Type of Manufacturers Type of Security
Tata Motors Ltd. Light, Commercial, and defense
vehicles
Equity shares
Eicher Motors Ltd. Light and Commercial Vehicles Equity shares
Sample for the study includes the 100% of risky securities (because all selected securities are
risky in nature such as equity shares) as indicated in Table-1
PROCEDURE OF DATA COLLECTIONS
Analysis of every research work is based on relevant data and it can be collected by two ways:
by way of primary data collection and by way of secondary data collection.
PRIMARY DATA – primary data are that data which are collected afresh and for the first time,
and thus happen to be original in character. It may be collected by observation, interview, mail
questionnaires, through schedules etc.
IRJC
International Journal of Marketing, Financial Services & Management Research
Vol.1 Issue 8, August 2012, ISSN 2277 3622
ww
w.in
dia
nre
sear
chjo
urn
als.
com
5
SECONDARY DATA – secondary data are that data which have been already collected by
someone else and which have already been passed through the statistical process. It may be
collected from published or unpublished sources.
In our study, secondary data about two units have been collected from different sources, these
were:
(A) News papers:-
(i) Economic Times Of India, and
(ii) The Times of India
(B) Website:- Website of Bombay Stock Exchange of India – http://www.bseindia.com
Data collected from all the sources were matched in the manner of consistency and finally the
data collected from the website of Bombay Stock Exchange of India have been taken for the
analysis purpose.
TIME PERIOD
Every research work is always limited by shortage of time and resources. Therefore, under the
study, share prices of selected companies from April, 2010 to March, 2011 were analyzed by the
researcher with the help of mean, standard deviation and t-test
HYPOTHESIS
Hypothesis refers to the assumption which is made about the sample before reading the final
result. It gives the direction for the whole project of the research. In our study, the hypotheses
which have been adopted given blow:-
Ho: There is no significant difference between volatility of two time period.
Ho: Opening volatility does not differ from closing volatility.
STATISTICAL METHODS
To test the hypothesis and to meet the objectives of the study, raw data were treated with
different kinds of analysis. For carrying out the analysis the different types of tests were used
like t-test and to know the volatility in the equity of unit of sample mean and standard deviation
were used. It may be clarified that the confidence level of probability to accept the hypothesis
fixed for T-test was 0.05.
The following are the procedures and formulas for the different tests:
IRJC
International Journal of Marketing, Financial Services & Management Research
Vol.1 Issue 8, August 2012, ISSN 2277 3622
ww
w.in
dia
nre
sear
chjo
urn
als.
com
6
ARITHMETIC MEAN
The central tendency was measured by using arithmetic mean. The arithmetic mean was obtained
by adding the observations and dividing by the number of observations. The steps were:
(i) Compute N (number of observations)
(ii) Compute X (sum of all the items of data)
(iii) To get mean apply formula :-
Mean N
X
N
xxxxx n
......321
STANDARD DEVIATION
The volatility in the share prices of selected company was measured by using standard deviation.
The standard deviation is the square root of the variance of a series. The steps were:
(i) First compute x (mean) of data
(ii) Take deviations of data from actual mean
(iii) Ensure that Zeroxx
(iv) Square the deviations, i.e., dx2 or
2
xx and add it to find 2
dx
(v) Divide 2
dx by number of items in the data and take under root to find standard
deviation or
S.D. = N
dx2
T-Test
The significant of differences of between means was tested by t-test which is appropriate for two
dependent groups the steps were:
(i) compute n1 and n2
(ii) Compute 21 xandx
2
2
2
1
1
1 and n
x
n
xxx
IRJC
International Journal of Marketing, Financial Services & Management Research
Vol.1 Issue 8, August 2012, ISSN 2277 3622
ww
w.in
dia
nre
sear
chjo
urn
als.
com
7
(iii)Compute combined standard deviation of the two sample:
2
11
21
2
22
2
11
nn
SnSnS
(iv) t-value:
21
2121
nn
nn
S
xxt
Here,
n1 = number of observations in the first sample
n2 = number of observation in the second sample
1x = mean of first sample
2x = mean of Second sample
S = combined standard deviation of two samples
t = value of t-Test
Degree of freedom = n1 + n2 – 2 or (n – k)
After obtaining the t and df., the standard tables can be referred to ascertain the probability. The
test was used to see the significant mean difference between various types of equity share prices.
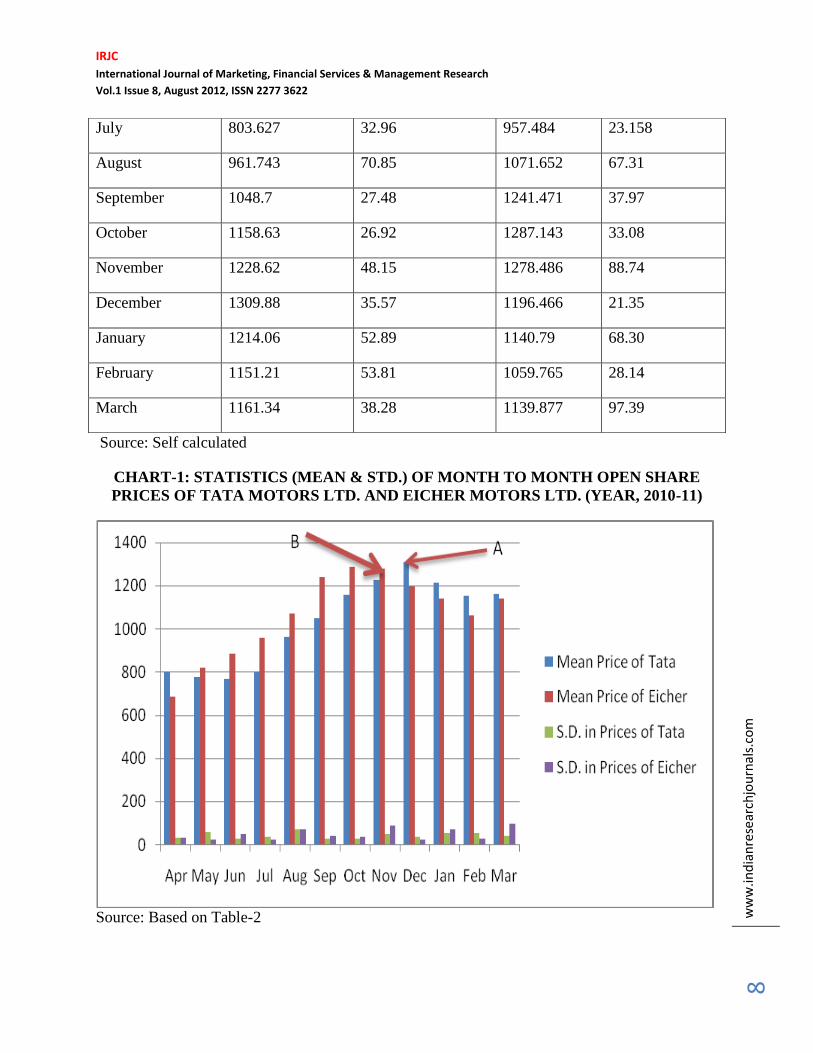
ANALYSIS AND EXPLANATION
TABLE-2: STATISTICS (MEAN & STD.) OF MONTH TO MONTH OPEN SHARE
PRICES OF TATA MOTORS LTD. AND EICHER MOTORS LTD. (YEAR 2010-11)
Months Tata Motors Ltd. Eicher Motors Ltd.
Mean Standard
Deviation
Mean Standard
Deviation
April 801.285 30.09 683.97 31.69
May 777.742 57.3 818.335 22.74
June 768.704 23.99 885.281 47.01
IRJC
International Journal of Marketing, Financial Services & Management Research
Vol.1 Issue 8, August 2012, ISSN 2277 3622
ww
w.in
dia
nre
sear
chjo
urn
als.
com
8
Source: Self calculated
CHART-1: STATISTICS (MEAN & STD.) OF MONTH TO MONTH OPEN SHARE
PRICES OF TATA MOTORS LTD. AND EICHER MOTORS LTD. (YEAR, 2010-11)
Source: Based on Table-2
July 803.627 32.96 957.484 23.158
August 961.743 70.85 1071.652 67.31
September 1048.7 27.48 1241.471 37.97
October 1158.63 26.92 1287.143 33.08
November 1228.62 48.15 1278.486 88.74
December 1309.88 35.57 1196.466 21.35
January 1214.06 52.89 1140.79 68.30
February 1151.21 53.81 1059.765 28.14
March 1161.34 38.28 1139.877 97.39
IRJC
International Journal of Marketing, Financial Services & Management Research
Vol.1 Issue 8, August 2012, ISSN 2277 3622
ww
w.in
dia
nre
sear
chjo
urn
als.
com
9
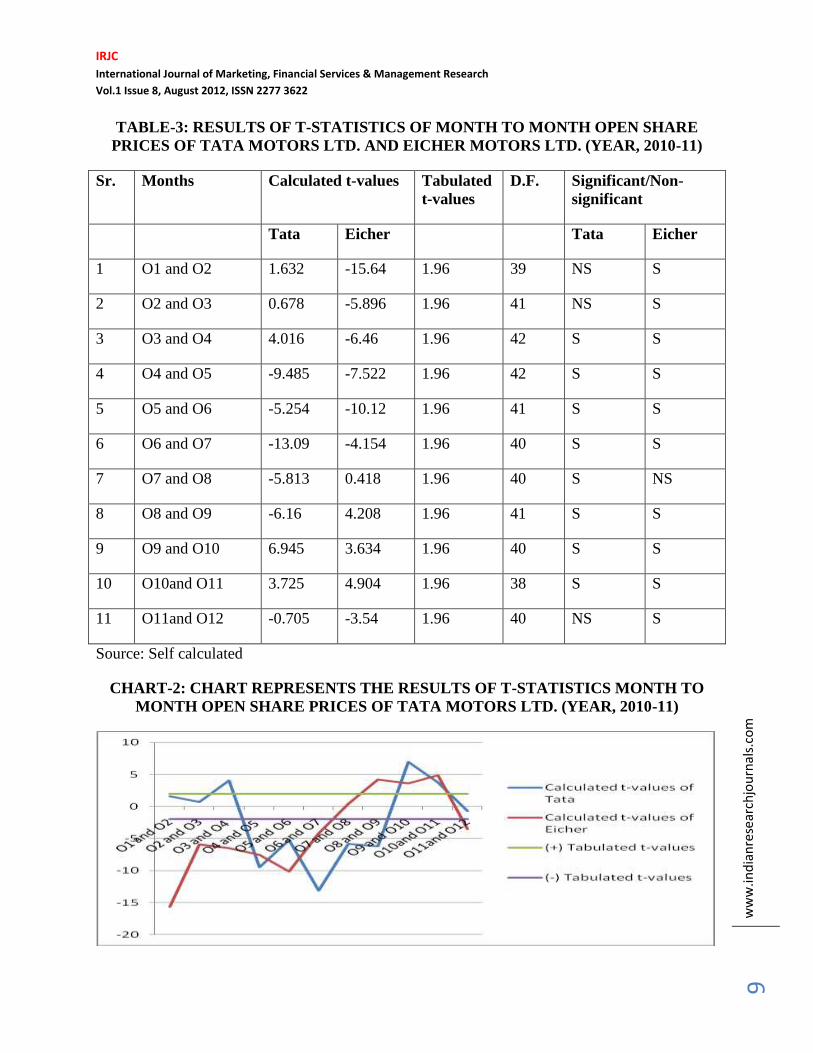
TABLE-3: RESULTS OF T-STATISTICS OF MONTH TO MONTH OPEN SHARE
PRICES OF TATA MOTORS LTD. AND EICHER MOTORS LTD. (YEAR, 2010-11)
Sr. Months Calculated t-values Tabulated
t-values
D.F. Significant/Non-
significant
Tata Eicher Tata Eicher
1 O1 and O2 1.632 -15.64 1.96 39 NS S
2 O2 and O3 0.678 -5.896 1.96 41 NS S
3 O3 and O4 4.016 -6.46 1.96 42 S S
4 O4 and O5 -9.485 -7.522 1.96 42 S S
5 O5 and O6 -5.254 -10.12 1.96 41 S S
6 O6 and O7 -13.09 -4.154 1.96 40 S S
7 O7 and O8 -5.813 0.418 1.96 40 S NS
8 O8 and O9 -6.16 4.208 1.96 41 S S
9 O9 and O10 6.945 3.634 1.96 40 S S
10 O10and O11 3.725 4.904 1.96 38 S S
11 O11and O12 -0.705 -3.54 1.96 40 NS S
Source: Self calculated
CHART-2: CHART REPRESENTS THE RESULTS OF T-STATISTICS MONTH TO
MONTH OPEN SHARE PRICES OF TATA MOTORS LTD. (YEAR, 2010-11)
IRJC
International Journal of Marketing, Financial Services & Management Research
Vol.1 Issue 8, August 2012, ISSN 2277 3622
ww
w.in
dia
nre
sear
chjo
urn
als.
com
1
0
Source: Based on Table-3
Note:
(i) O1- mean price of opening prices for April-2010, O2-mean price of opening prices for
May-2010, O3-for June-2010 and so on, up to March-2011.
The opening prices of the selected units under study were analyzed with the help of averages and
standard deviations. The data are of monthly nature. Month to month volatility was arrived at by
assessing the standard deviations. It was found that from June to January of the year 2010-11 the
volatility was statistically significant at 95% level of confidence (the values of statistics of Mean,
Standard Deviation and t-values are given in the Table-2 and Table-3) and decisions about buy
and sell of securities were effected by the volatility in share prices.
This volatility was graphically presented (Chart-1), it were being indicated by the chart of
statistics that as the standard deviation starts to come down sell out the security, in other words
take the short position and the lowest value of standard deviation signifies the opportunity to
take a long position. However, the trend of standard deviation‟s portrays that if invested at one
time; hold the security at least for more than six months (in case of Tata Motors Ltd as indicated
by point A) and more than five months (in case of Eicher Motors Ltd as indicated by point B)
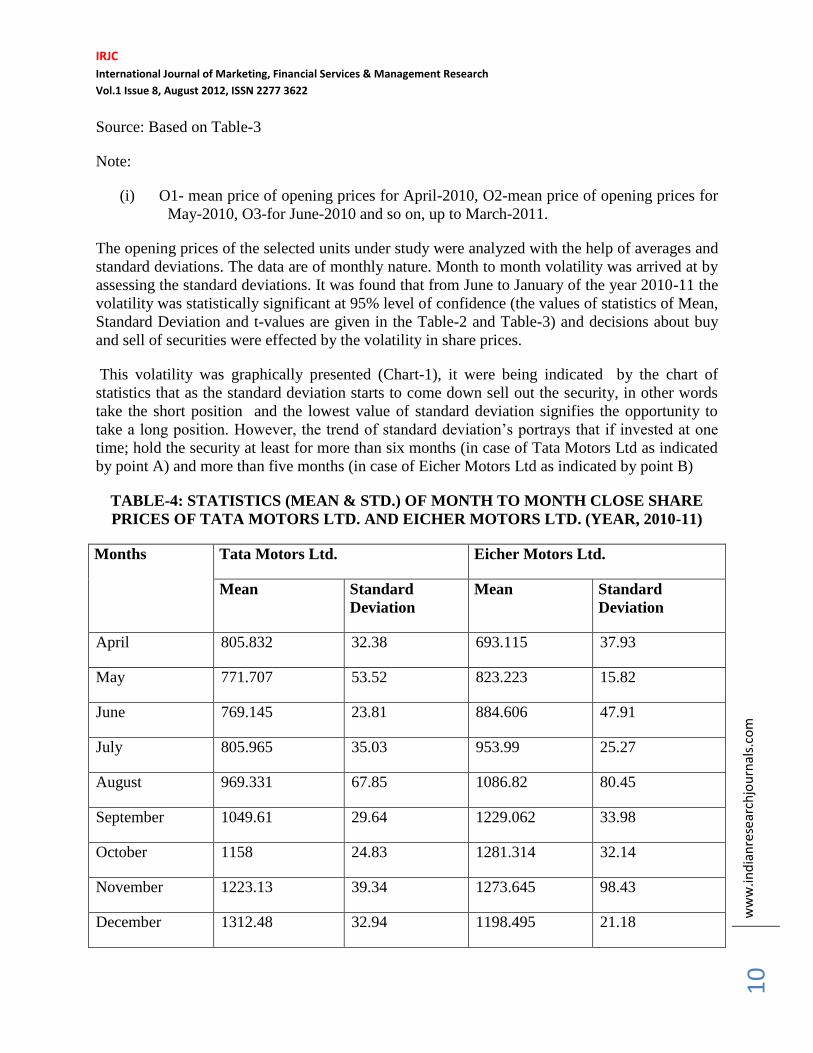
TABLE-4: STATISTICS (MEAN & STD.) OF MONTH TO MONTH CLOSE SHARE
PRICES OF TATA MOTORS LTD. AND EICHER MOTORS LTD. (YEAR, 2010-11)
Months Tata Motors Ltd. Eicher Motors Ltd.
Mean Standard
Deviation
Mean Standard
Deviation
April 805.832 32.38 693.115 37.93
May 771.707 53.52 823.223 15.82
June 769.145 23.81 884.606 47.91
July 805.965 35.03 953.99 25.27
August 969.331 67.85 1086.82 80.45
September 1049.61 29.64 1229.062 33.98
October 1158 24.83 1281.314 32.14
November 1223.13 39.34 1273.645 98.43
December 1312.48 32.94 1198.495 21.18
IRJC
International Journal of Marketing, Financial Services & Management Research
Vol.1 Issue 8, August 2012, ISSN 2277 3622
ww
w.in
dia
nre
sear
chjo
urn
als.
com
1
1
January 1205.26 47.52 1139.435 62.774
February 1144.80 57.94 1062.27 22.18
March 1167.20 38.59 1156.405 99.90
Source: Self calculated
CHART-3: CHART REPRESENTS THE STATISTICS (MEAN & STD.) OF MONTH TO
MONTH CLOSE SHARE PRICES OF TATA MOTORS LTD. AND EICHER MOTORS
LTD. (YEAR, 2010-11)
Source: Based on Table-4
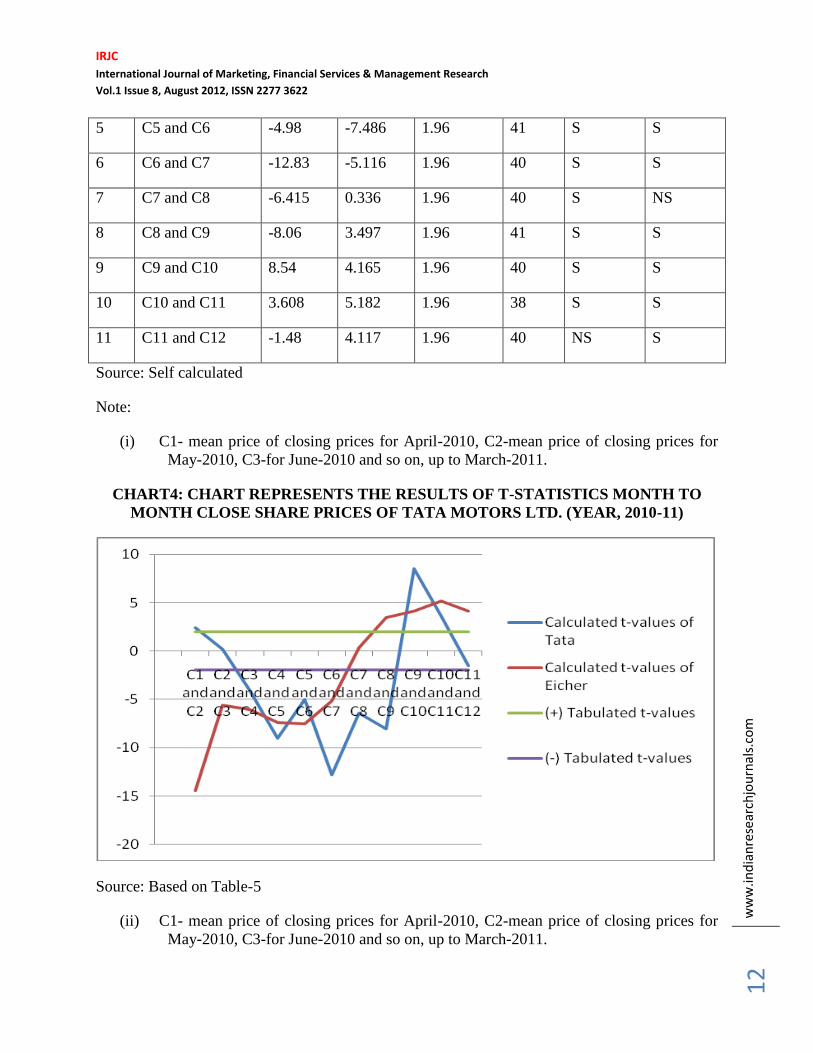
TABLE-5: RESULTS OF T-STATISTICS OF MONTH TO MONTH CLOSE SHARE
PRICES OF TATA MOTORS LTD. AND EICHER MOTORS LTD. (YEAR, 2010-11)
Sr. Months Calculated t-values Tabulated
t-values
D.F. Significant/Non-
significant
Tata Eicher Tata Eicher
1 C1 and C2 2.43 -14.43 1.96 39 S S
2 C2 and C3 0.203 -5.582 1.96 41 NS S
3 C3 and C4 -4.076 -6.006 1.96 42 S S
4 C4 and C5 -9.02 -7.386 1.96 42 S S
IRJC
International Journal of Marketing, Financial Services & Management Research
Vol.1 Issue 8, August 2012, ISSN 2277 3622
ww
w.in
dia
nre
sear
chjo
urn
als.
com
1
2
5 C5 and C6 -4.98 -7.486 1.96 41 S S
6 C6 and C7 -12.83 -5.116 1.96 40 S S
7 C7 and C8 -6.415 0.336 1.96 40 S NS
8 C8 and C9 -8.06 3.497 1.96 41 S S
9 C9 and C10 8.54 4.165 1.96 40 S S
10 C10 and C11 3.608 5.182 1.96 38 S S
11 C11 and C12 -1.48 4.117 1.96 40 NS S
Source: Self calculated
Note:
(i) C1- mean price of closing prices for April-2010, C2-mean price of closing prices for
May-2010, C3-for June-2010 and so on, up to March-2011.
CHART4: CHART REPRESENTS THE RESULTS OF T-STATISTICS MONTH TO
MONTH CLOSE SHARE PRICES OF TATA MOTORS LTD. (YEAR, 2010-11)
Source: Based on Table-5
(ii) C1- mean price of closing prices for April-2010, C2-mean price of closing prices for
May-2010, C3-for June-2010 and so on, up to March-2011.
IRJC
International Journal of Marketing, Financial Services & Management Research
Vol.1 Issue 8, August 2012, ISSN 2277 3622
ww
w.in
dia
nre
sear
chjo
urn
als.
com
1
3
To know the volatility in closing prices, month to month closing prices of the units were
analyzed with statistical toolsas averages and standard deviations. the results were found that, the
volatility from April to March (except May and March in case of Tata Motors and except october
in case of Eicher Motors) of the year 2010-11was statistically significant at 5% leve of
significance( the values of statistics of mean, standard deviation and t-values are given in the
Table-4 and Table-5) and decisions about buy and sell of securities were effected by the
volatility in share prices.
This volatility was also presented by graph mode ( Chart-3). The sell and Buy signals were being
indicated by the chart of statistics that as the standard deviation srats to come down, sell out the
security and the lowest value of standard deviation signifies the opportunity to take the long
position. However, trhe trend of standard deviation‟s portrays that if invested at one time hold
the security at least for more than six months (in case of Tata Motors) and more than five months
(in case of Eicher Motors). The graphical presentation (Chart-4) of t-statistics were being
indicated that mostly month to month calculated t-values don‟t lie between the boundaries of
their Tabulated values, therefore these are significantat at 5% level of significance and it is
concluded that mostly month to month closing prices are volatile.
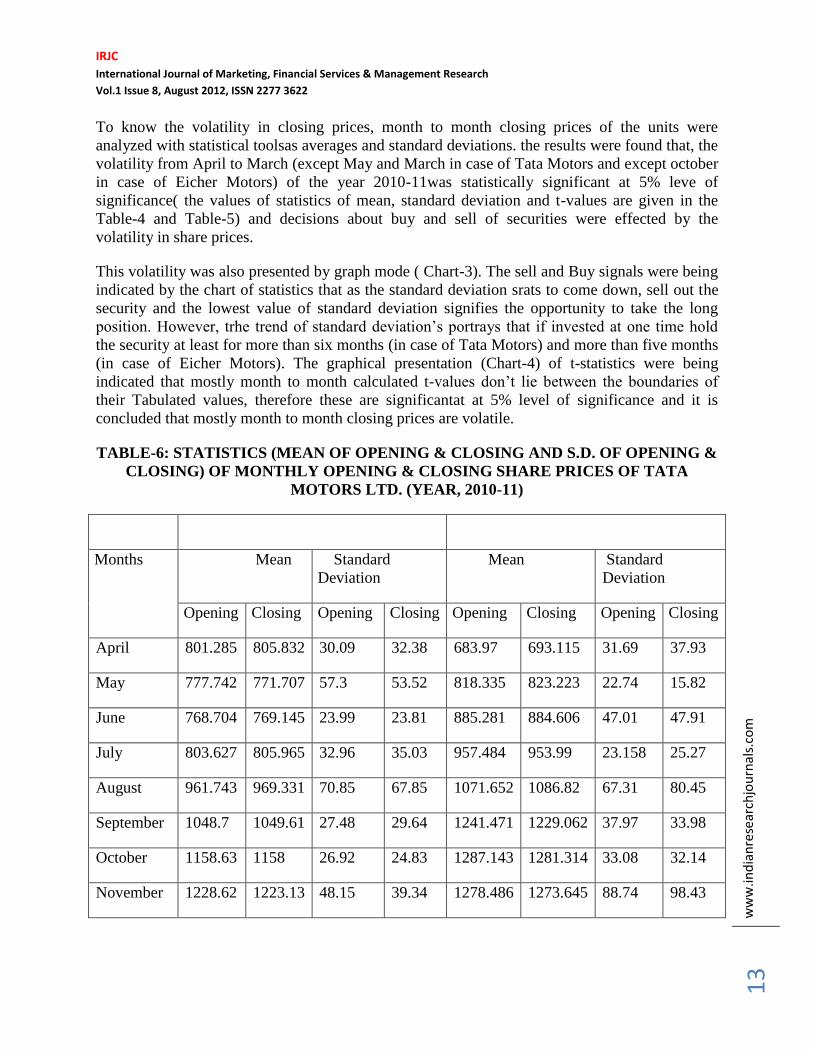
TABLE-6: STATISTICS (MEAN OF OPENING & CLOSING AND S.D. OF OPENING &
CLOSING) OF MONTHLY OPENING & CLOSING SHARE PRICES OF TATA
MOTORS LTD. (YEAR, 2010-11)
Months Mean Standard
Deviation
Mean Standard
Deviation
Opening Closing Opening Closing Opening Closing Opening Closing
April 801.285 805.832 30.09 32.38 683.97 693.115 31.69 37.93
May 777.742 771.707 57.3 53.52 818.335 823.223 22.74 15.82
June 768.704 769.145 23.99 23.81 885.281 884.606 47.01 47.91
July 803.627 805.965 32.96 35.03 957.484 953.99 23.158 25.27
August 961.743 969.331 70.85 67.85 1071.652 1086.82 67.31 80.45
September 1048.7 1049.61 27.48 29.64 1241.471 1229.062 37.97 33.98
October 1158.63 1158 26.92 24.83 1287.143 1281.314 33.08 32.14
November 1228.62 1223.13 48.15 39.34 1278.486 1273.645 88.74 98.43
IRJC
International Journal of Marketing, Financial Services & Management Research
Vol.1 Issue 8, August 2012, ISSN 2277 3622
ww
w.in
dia
nre
sear
chjo
urn
als.
com
1
4
December 1309.88 1312.48 35.57 32.94 1196.466 1198.495 21.35 21.18
January 1214.06 1205.26 52.89 47.52 1140.79 1139.435 68.30 62.774
February 1151.21 1144.80 53.81 57.94 1059.765 1062.27 28.14 22.18
March 1161.34 1167.20 38.28 38.59 1139.877 1156.405 97.39 99.90
Source: Self calculated
CHART-5: CHART REPRESENTS THE RESULTS OF T-STATISTICS OF MONTHLY
OPENING & CLOSING SHARE PRICES OF TATA MOTORS LTD. AND EICHER
MOTORS LTD. (YEAR, 2010-11)
Source: Based on Table-6
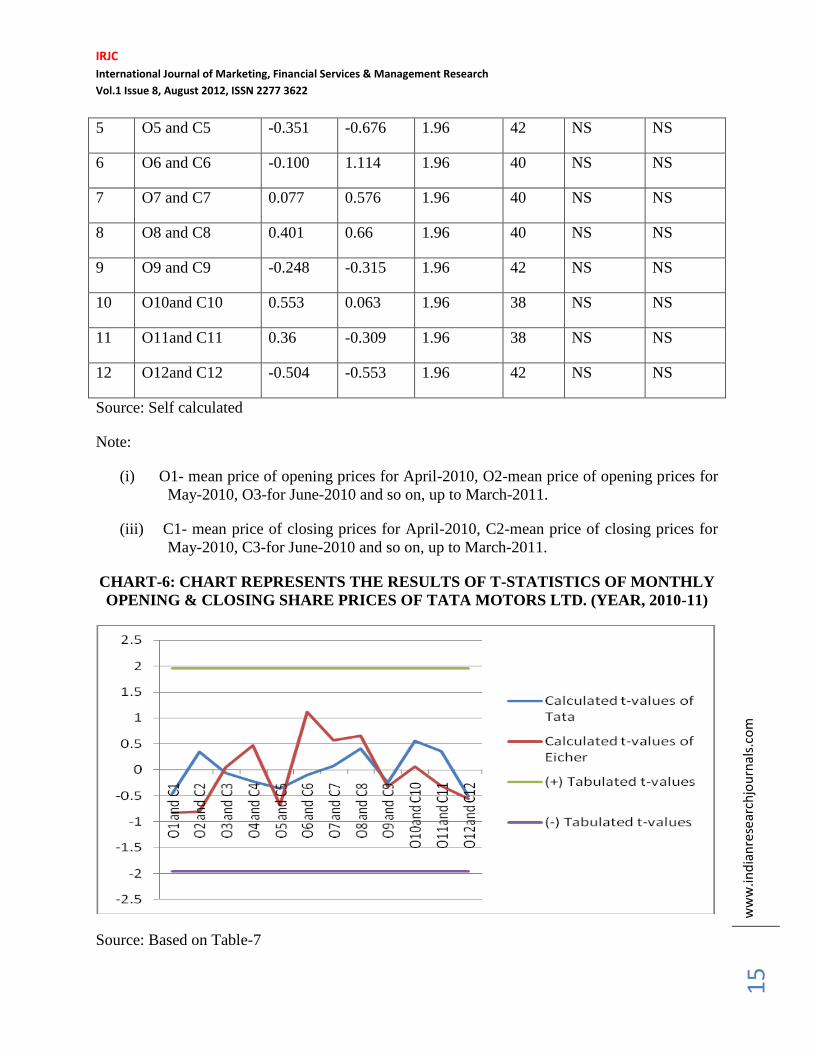
TABLE-7: RESULTS OF T-STATISTICS OF MONTHLY OPENING AND CLOSING
SHARE PRICES OF TATA MOTORS LTD. AND EICHER MOTORS LTD.
(YEAR, 2010-11)
Sr. Months Calculated t-values Tabulated
t-values
D.F. Significant/Non-
significant
Tata Eicher Tata Eicher
1 O1 and C1 -0.458 -0.825 1.96 38 NS NS
2 O2 and C2 0.349 -0.806 1.96 40 NS NS
3 O3 and C3 -0.059 0.046 1.96 42 NS NS
4 O4 and C4 -0.225 0.477 1.96 42 NS NS
IRJC
International Journal of Marketing, Financial Services & Management Research
Vol.1 Issue 8, August 2012, ISSN 2277 3622
ww
w.in
dia
nre
sear
chjo
urn
als.
com
1
5
5 O5 and C5 -0.351 -0.676 1.96 42 NS NS
6 O6 and C6 -0.100 1.114 1.96 40 NS NS
7 O7 and C7 0.077 0.576 1.96 40 NS NS
8 O8 and C8 0.401 0.66 1.96 40 NS NS
9 O9 and C9 -0.248 -0.315 1.96 42 NS NS
10 O10and C10 0.553 0.063 1.96 38 NS NS
11 O11and C11 0.36 -0.309 1.96 38 NS NS
12 O12and C12 -0.504 -0.553 1.96 42 NS NS
Source: Self calculated
Note:
(i) O1- mean price of opening prices for April-2010, O2-mean price of opening prices for
May-2010, O3-for June-2010 and so on, up to March-2011.
(iii) C1- mean price of closing prices for April-2010, C2-mean price of closing prices for
May-2010, C3-for June-2010 and so on, up to March-2011.
CHART-6: CHART REPRESENTS THE RESULTS OF T-STATISTICS OF MONTHLY
OPENING & CLOSING SHARE PRICES OF TATA MOTORS LTD. (YEAR, 2010-11)
Source: Based on Table-7
IRJC
International Journal of Marketing, Financial Services & Management Research
Vol.1 Issue 8, August 2012, ISSN 2277 3622
ww
w.in
dia
nre
sear
chjo
urn
als.
com
1
6
(ii) O1- mean price of opening prices for April-2010, O2-mean price of opening prices for
May-2010, O3-for June-2010 and so on, up to March-2011.
(iv) C1- mean price of closing prices for April-2010, C2-mean price of closing prices for
May-2010, C3-for June-2010 and so on, up to March-2011.
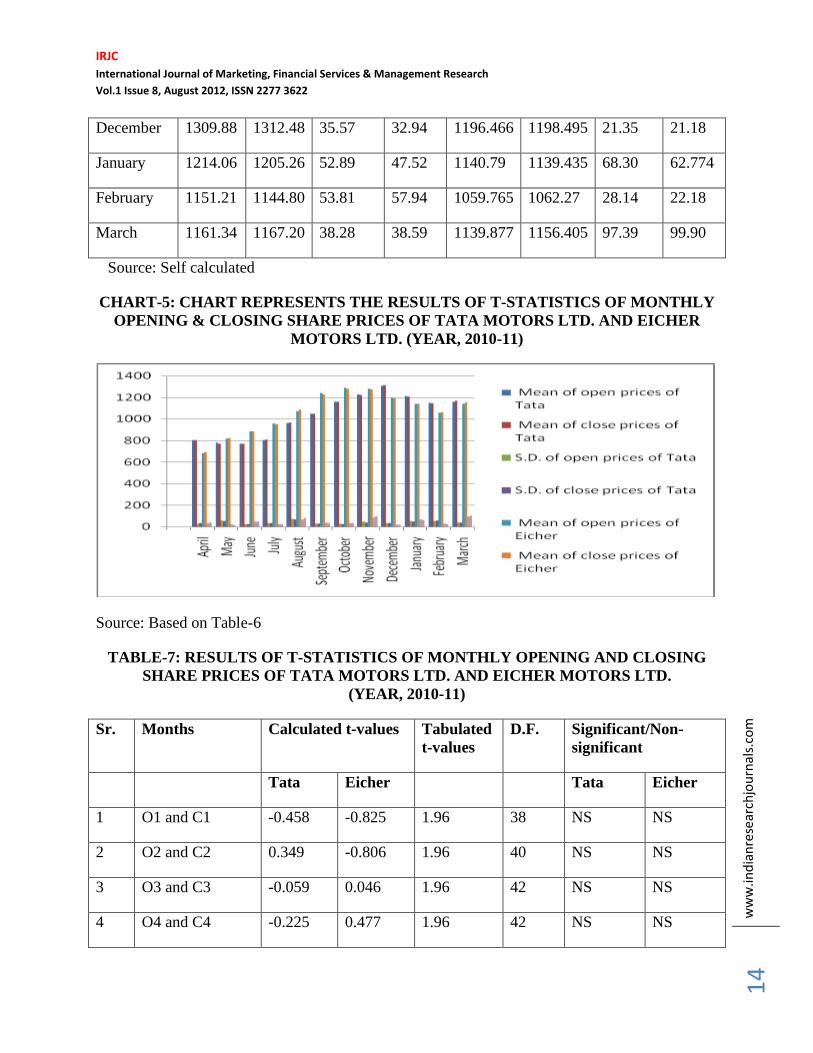
In the above Table-6 pertaining to the mean of opening & closing and standard deviation of
opening and closing monthly share prices of the units for the year 2010-11. By analysing the
mean and standard deviatiion of opening and closing share prices exhibit that- there is volatility
in the monthly opening and closing share prices. Table-7 related to t-values between open and
close share prices of a month. The volatility were being indicated non-significant at 5% level of
significance between opening and closing share prices of a month.
This also has been showed by graph. It is being portray by the technical Chart at no.6 that the
volatility starts to come down gradually when the standard deviation is highest. One more
interesting finding is that, as an average as the volatility increase at the highest level (eg.
standard deviation of August, 2010-11 is70.85and 67.85 at higest in case of Tata Motors and
standard deviation of March, 2010-11 is 97.39 and 99.90 at higest in case of Eicher Motors) the
prices of the share increase that the highest level 1312.48 after December, 2011( for Tata
Motors) and 1287.143 after October, 2011 (for Eicher Motors). The investers started to take the
short position ( as inference from results) and resulttantly the prices started to come down by
virtue of more share supply in the market. The prices of Tata motors was Rs. 889.5 as a close on
an August 5, 2011. It showed a tremendousnegative volatolity strength the reason needing
detailed fundamental analysis for the reason of volatility. However, it is the best time to take the
long position.
FINDINGS
I. The volatility in share prices of selected units was of gyrated nature (Table No. 2 may be
referred),
II. The volatility was found significant in monthly open to open and close to close share
prices at 95% level of confidence (Table No. 3 & 5 may be referred), and
III. The volatility in monthly opening and closing share prices, when was compared, no
difference was statistically significant. It indicates that the volatility in opening and
closing prices of selected units was almost same in every month (Table No. 7 may be
referred).
CONCLUSIONS
With the above study it can now be concluded that volatility analysis is an effective analysis to
measure the risk on financial instruments. This study also infers that, more wise full investment
decision can be taken by investors with the help of forecasting volatility in the share prices,
because it analyzes the security on the basis of range of price fluctuation of a security. But it
should not forget that actual share price are influenced by many factors as such- internal
IRJC
International Journal of Marketing, Financial Services & Management Research
Vol.1 Issue 8, August 2012, ISSN 2277 3622
ww
w.in
dia
nre
sear
chjo
urn
als.
com
1
7
information, speeches of the ministers, and etc. So, decisions relating to buy and sell of securities
should not take only on the basis of volatility analysis.
REFERENCES
1. Malay k Roy and Madhusudan Karmakar (1995), “Stock Market Volatility: Roots and
Results”, Vikalpa, Vol. 20, No. 1, January –March 1995, p.p. 37-48.
2. Yarram Subha Reddy (1996), “Volatility of Securities Traded on the National Stock
Exchange and Bombay Stock Exchange: A Comparison”, Decision, Vol. 23, No. 1-4,
Jan-Dec 1996, p.p. 1-24.
3. Subrata Kumar Mitra (2002), “Profiting from Technical Analysis in Indian stock
Market”, Finance India, Vol. xvi, No.1, March 2002, p.p. 109-120
4. S.V. Ramana Rao (2007), “Impact of Financial Derivative Products on Spot Market
Volatility: A Study on Nifty”, The Icfai Journal of Derivatives Market, Vol. iv, No. 1,
2007, p.p. 1-24.
5. Vipul Sharma (2007), “Investment Decision Making Behaviour of Investors in Capital
Market in India”, An Unpublished Thesis Submitted for Degree of Ph.D., Maharshi
Dayanand University, Rohtak.
6. Khan Masood Ahmad, Shahid Ashraf and Shahid Ahmed (2008), “Causality and
Volatility in the Firm Level Returns and Volume in India: Evidence from National Stock
Exchange”, Finance India, Vol. xxii, No. 1, March 2008, p.p. 99-115.