Embed Size (px)
Citation preview

INTERNATIONAL JOURNAL OF GEOMATICS AND GEOSCIENCES
Volume 2, No 2, 2011
© Copyright 2010 All rights reserved Integrated Publishing services
Case study ISSN 0976 – 4380
Submitted on October 2011 published on November 2011 568
Forecasting urban growth based on GIS, RS and SLEUTH model in Pune
metropolitan area Lakshmi KantaKumar N, Nikhil G Sawant, Shamita Kumar
Institute of Environment Education and Research, Bharati Vidyapeeth University, Pune
ABSTRACT
Geoinformatics is today used extensively for managing the rapidly growing urbanization of
our cities and villages. Growing urban areas increasingly encroach on the surrounding rural
areas putting enormous pressure on the meager infrastructure, very often leading to the
unplanned and unsustainable development. The study area is Pune and its surrounding rural
areas. In this study, a self modifying cellular automated Slope, Land use, Exclusion, Urban
extension, Transportation and Hill shade - model (SLEUTH) has been used to simulate and
predict urban growth of Pune city by 2030 and its impact on the surrounding rural areas. The
study is based on 38 years (1973-2011) of multi-temporal data compiled and interpreted from
Landsat images, Survey of India toposheets and Aster GDEM. The predicted urban growth
shows that Pune city may expand mainly in the North and East, rather than in the South and
West directions. Rural areas in Urli Knanchan, Wagoli, Rahu, Talegoan Dhandhere,
Hadapsar and Thergaon revenue circles might be the most influenced areas of Pune’s
urbanization by 2030. This study showed that the combined approach of geographical
information system, remote sensing and SLEUTH model is very useful in modeling and
predicting the future urban scenarios, which help in planning of rural infrastructure
development.
Keywords: Urbanization, Geoinformatics, SLEUTH, Multi-temporal data, Rural-
infrastructure.
1. Introduction
Urban growth is the expansion of town and cities with respect to the increase of the size of a
built-up area. Urban expansion mainly depends upon the city requirement, facilities available
and industrialization. These causes migration of people from rural to the urban areas, putting
immense pressure on infrastructure, natural resources and lead to formation of slums,
increase traffic congestions, reduced farmlands, increase deforestation and threaten wild life.
Modeling is tool that can assist in analysis and especially the prediction of urban growth
dynamics (Silva & Clarke, 2002). Urban growth models provide an extra layer of insight to
policy makers and planners, who can use the model to anticipate and forecast future changes
or trends of development, to understand the impacts of future development, and explore the
potential impacts of different policies (Pettit et al., 2002, Verburg et al., 2002). Urban growth
dynamics are highly complex and nonlinear in nature. There are several models in existence
that model urban growth phenomena such as cellular automata modeling, agent based
modeling, spatial-statistics modeling, artificial neural network modeling, fractal modeling etc.
With the increased computational power and greater availability of the spatial data, micro
simulation such as the agent based and cellular automata simulation method have shown
great potential for representing and simulating the complexity of the dynamic process
involved in urban growth and land use change (Dietzel & Clarke, 2004). The collection and

Forecasting urban growth based on GIS, RS and SLEUTH model in Pune metropolitan area
Lakshmi KantaKumar N, Nikhil G Sawant, Shamita Kumar
International Journal of Geomatics and Geosciences
Volume 2 Issue 2, 2011 569
analysis of spatial data became easier with the advance of geographic information system
(GIS) and remote sensing (RS) techniques. Cellular Automata (CA) is particularly well suited
to model complex dynamics composed of large number of individual elements linked by non
linear couplings (Openshaw & Openshaw, 1997) such as urban system. CA was highly
emphasized and has been widely used in urban sprawl mechanism, urban theory and
urbanization effect (Batty, 1998, Batty et al., 1999 & Clarke et al., 1996) and it is closely
integrated with GIS. The power of this tool has become important for city planners,
economists, ecologists and resource managers oriented towards sustainable development of
regions (Clarke et al., 2002). The SLEUTH model is a cellular automaton model, developed
with predefined growth rules applied spatially to gridded maps of the cities in a set of nested
loops, and was designed to be both scalable and universally applicable (Silva & Clarke, 2002).
SLEUTH is an acronym of input layers Slope, Land use, Exclusion, Urban, Transportation
and Hillshade. SLEUTH is composed of four growth rules to simulate the urban growth;
spontaneous growth rule is responsible for urbanization of randomly selected pixels. The
urban pixels created by the spontaneous growth are then tested for the probability to become
new urban spreading centers under the new spreading center growth rule. Edge growth rule is
responsible to stem the organic growth of new urban spreading centers and finally road
influenced growth rules determines the urban growth along the transportation network.
These four rules are influenced by the five growth coefficients i.e., Diffusion coefficient
(Diff): determines over all depressiveness of urban growth, Breed coefficient (Brd):
determines how likely a newly generated detached settlement is to begin its own growth cycle,
Spread coefficient (Sprd): controls the amount of infill and outward organic expansion, Slope
resistance coefficient (Slp): influences the likelihood of urban expansion on steeper slopes
and Road gravity coefficient (RG) impacts road influenced growth along with diffusion and
breed coefficients. Besides these initial growth rules a second level of growth rules termed
“self modification rules” applied to the model, are responsible to alter the values of growth
coefficients in order to achieve more accurate typical S-curve growth rate of urban expansion.
These self modification rules make the SLEUTH model more robust by preventing it from
projecting linear or exponential growth. SLEUTH has been successfully implemented in San
Francisco, Chicago, Sioux Falls and south coast California (NCGIA, 2011), Baltimore-
Washington (Jantz et al. 2003), Porto and Lisbon (Silva & Clarke, 2002) and Chiang Mai and
Taipei (Sangawongse et al. 2005). SLEUTH has been tested for more than 30 cities all over
the world (Clarke & Dietzel, 2004); one of the objectives of this paper is also to test the
applicability of SLEUTH in Indian context.
32.5% of the population of Pune Municipal Corporation (PMC) lives in slums and there are
477 slum pockets being found in the PMC area. This may be due to lack of efficient plans to
handle the rural migration and rapid urbanization of Pune. Thus, it is very important to
project the future scenario of urban growth of Pune in order to understand how the city can
expand; this may help the planners to carry out their planning more efficiently based on
computer simulation methods in additional to their expertise. This paper also aims to identify
the rural areas which would be mostly influenced by the Pune urbanization.
2 Materials and Method
2.1 Study Area
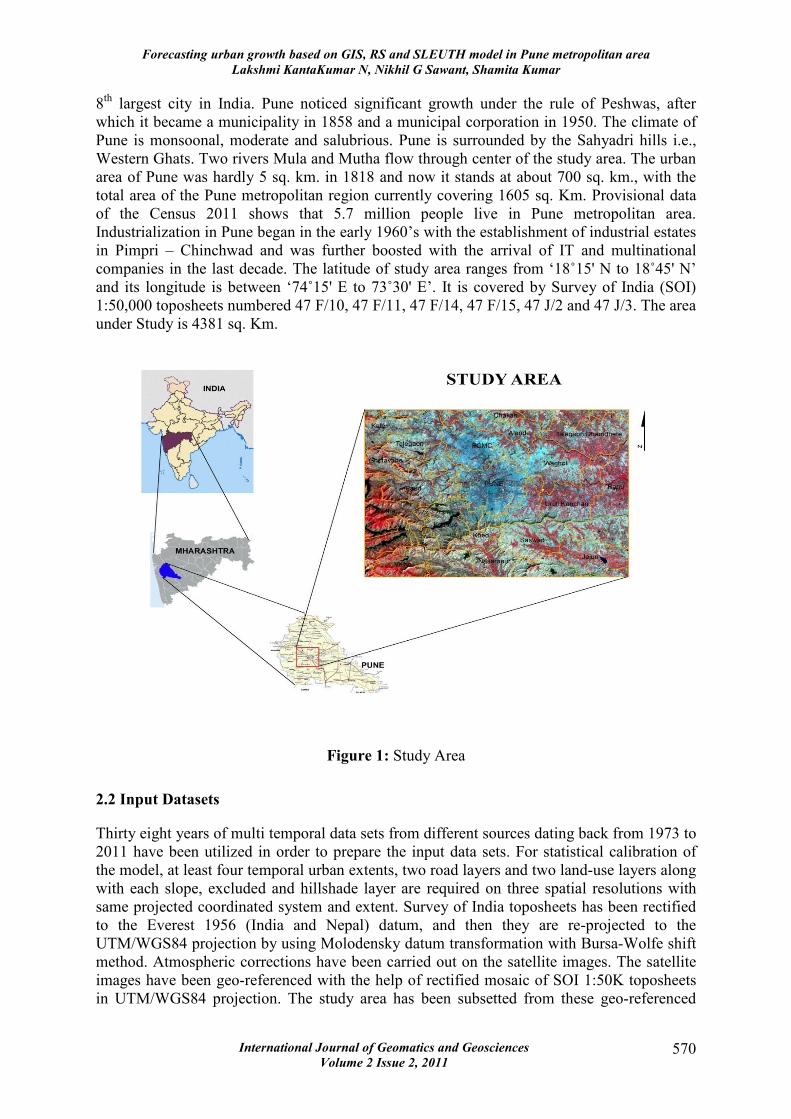
Pune is a plateau city situated near the Western margin of the Deccan plateau. The city
emerged from a tiny agriculture settlement called ‘Punnaka’ in the 8th century to become the
Forecasting urban growth based on GIS, RS and SLEUTH model in Pune metropolitan area
Lakshmi KantaKumar N, Nikhil G Sawant, Shamita Kumar
International Journal of Geomatics and Geosciences
Volume 2 Issue 2, 2011 570
8th largest city in India. Pune noticed significant growth under the rule of Peshwas, after
which it became a municipality in 1858 and a municipal corporation in 1950. The climate of
Pune is monsoonal, moderate and salubrious. Pune is surrounded by the Sahyadri hills i.e.,
Western Ghats. Two rivers Mula and Mutha flow through center of the study area. The urban
area of Pune was hardly 5 sq. km. in 1818 and now it stands at about 700 sq. km., with the
total area of the Pune metropolitan region currently covering 1605 sq. Km. Provisional data
of the Census 2011 shows that 5.7 million people live in Pune metropolitan area.
Industrialization in Pune began in the early 1960’s with the establishment of industrial estates
in Pimpri – Chinchwad and was further boosted with the arrival of IT and multinational
companies in the last decade. The latitude of study area ranges from ‘18˚15' N to 18˚45' N’
and its longitude is between ‘74˚15' E to 73˚30' E’. It is covered by Survey of India (SOI)
1:50,000 toposheets numbered 47 F/10, 47 F/11, 47 F/14, 47 F/15, 47 J/2 and 47 J/3. The area
under Study is 4381 sq. Km.
Figure 1: Study Area
2.2 Input Datasets
Thirty eight years of multi temporal data sets from different sources dating back from 1973 to
2011 have been utilized in order to prepare the input data sets. For statistical calibration of
the model, at least four temporal urban extents, two road layers and two land-use layers along
with each slope, excluded and hillshade layer are required on three spatial resolutions with
same projected coordinated system and extent. Survey of India toposheets has been rectified
to the Everest 1956 (India and Nepal) datum, and then they are re-projected to the
UTM/WGS84 projection by using Molodensky datum transformation with Bursa-Wolfe shift
method. Atmospheric corrections have been carried out on the satellite images. The satellite
images have been geo-referenced with the help of rectified mosaic of SOI 1:50K toposheets
in UTM/WGS84 projection. The study area has been subsetted from these geo-referenced

Forecasting urban growth based on GIS, RS and SLEUTH model in Pune metropolitan area
Lakshmi KantaKumar N, Nikhil G Sawant, Shamita Kumar
International Journal of Geomatics and Geosciences
Volume 2 Issue 2, 2011 571
satellite imageries. The subsetted imageries of Landsat-1 MSS of 1973 and Landsat-5 TM of
years 1992, 2000 and 2011 are classified by using the maximum likelihood supervised
classification method. Binary maps of urban extents showing urban/non-urban classes were
extracted from the classified images. Land use layers of 1973 and 2011 showing six classes
named as urban, agriculture, open scrub, forest, water and barren land have been prepared
with the help of classified images.
Figure 2: Methodology flow chart
Accuracy assessment has been carried out by using SOI 1: 50000 toposheets for 1973 land
use layer and field observation for 2011 land use layer. The overall kappa statistics for 1973
land use is 0.76 and for 2011 land use is 0.82. It was observed that confusion has been taken
place in classifying the open scrub and barren land. Reserved forests and water bodies such as
reservoirs, rivers and canals were excluded with 100% probability from the urban

Forecasting urban growth based on GIS, RS and SLEUTH model in Pune metropolitan area
Lakshmi KantaKumar N, Nikhil G Sawant, Shamita Kumar
International Journal of Geomatics and Geosciences
Volume 2 Issue 2, 2011 572
development in the excluded layer, it has been prepared with the help of SOI toposheets and
classified image of 2011. Two road layers of years 1973 and 2011 have been prepared by
using different sources like SOI toposheets and Google earth etc. Slope layer in percentage
slope and hillshade layer has been prepared with the help of ASTER GDEM 2009. In this
Study the input layers are resampled to the three spatial resolutions i.e., 100m coarse, 50m
fine and 25m final resolutions which corresponds to the image size of 559 by 796, 1117 by
1591 and 2234 by 3182 pixels for the purpose of model calibration. All input layers prepared
have been converted into GIF format for use in the SLEUTH model (See Figure 3).
2.3 SLEUTH Implementation
SLEUTH Model is composed of two inbuilt models; first one is Clarke urban growth model
(UGM) used to simulate the urban growth of study area. Second one is the land cover
deltatron model (LCD) used to simulate non-urban land class transitions, and is loosely
coupled with UGM (NCGIA, 2011). The implementation of SLEUTH involves three steps
called as test, calibration and prediction. It is very important to perform test mode before
calibration phase. In the test mode model verifies the data sets and their initial reaction to the
input data, including assuring that they conform to data input specifications (Silva & Clarke,
2002). The test mode is followed by the calibration mode, which is the crux of SLEUTH
model. The goal of calibration is to derive a set of values for the growth parameters that can
effectively model the growth during the historic time period (Jantz et al., 2003).There are two
methods available to carry out the calibration phase i.e. brute force and genetic Algorithm.
Brute force method uses a predetermined order of stepping through the coefficient space and
genetic algorithm to search through the coefficient space in an adaptive manner (Goldstein,
2004).
In this study brute force calibration method has been adopted to sequentially narrow down the
ranges of coefficient values with respect to the increasing spatial resolution of datasets in the
three phase i.e., coarse, fine, final. At the end of each calibration run, the model produced 13
least squares regression metrics, such as compare (modeled final population), population
(number of urban pixels), cluster (urban cluster edge pixels), edges (urban perimeter), Lee
Sallee metric (a shape index), average slope, Xmean (average X values) and Ymean (average
Y values) etc. Each metric represents the goodness fit between the simulated growth and the
actual growth for the control years. Selection of the coefficient ranges to the subsequent
phase of calibration is based on these 13 metrics. Several approaches used so far to narrow
down the coefficient space include: sorting on all metrics equally, weighting some metrics
more heavily than others, and sorting only on one metric (NCGIA, 2011). Most of the
previous studies used Lee Sallee metric as a measure to narrow down the coefficient space in
the calibration process (NCGIA, 2011and Silva & Clarke, 2002). In this study, it was first
decided to use Lee Sallee metric, which is a measure of spatial fit between the modeled urban
growth to the known urban extent of control years, as a primary measure to narrow down the
coefficients. But it was observed that Lee Sallee metric associated with little growth in the
study area during coarse calibration (See Table 1). Hence Optimum SLEUTH Metric (OSM)
(Dietzel & Clarke, 2007; NCGIA, 2011) has been adopted to narrow down the coefficient
ranges. OSM is the product of compare, population, edges, clusters, slope, Xmean and
Ymean metrics. The calibration mode is followed by the prediction mode. SLEUTH requires
an urban extent for initialization, an initial transportation network, an excluded layer, slope,

Forecasting urban growth based on GIS, RS and SLEUTH model in Pune metropolitan area
Lakshmi KantaKumar N, Nikhil G Sawant, Shamita Kumar
International Journal of Geomatics and Geosciences
Volume 2 Issue 2, 2011 573
Figure 3: Input data layers of Study area

Forecasting urban growth based on GIS, RS and SLEUTH model in Pune metropolitan area
Lakshmi KantaKumar N, Nikhil G Sawant, Shamita Kumar
International Journal of Geomatics and Geosciences
Volume 2 Issue 2, 2011 574
and a hillshade for its prediction process. The averaged coefficient results of all Monte Carlo
iterations have been used to forecast the urban growth of Pune by 2030.
Table 1: Coefficients sorted by Lee Sallee Metric
Leesale Diff Brd Sprd Slp RG
0.35 1 1 1 80 1
0.35 1 1 1 80 20
0.35 1 1 1 80 40
3. Results and Discussions
3.1 Calibration
Coarse calibration has been performed by taking a step value of 20 with 5 Monte Carlo
iterations, while the fine calibration has been performed by taking step value 5 except for
Road gravity is 10 with 8 Monte Carlo iterations and the final calibration has been performed
by taking step value 1 except for road gravity is 4 with 15 Monte Carlo iterations. Top three
scores in coarse, fine and final calibrations are presented in Table 2. Average slope metric i.e.,
the least square regression of average slope for modeled urbanized cells compared with
average slope of known urban cells for the control years decreased rapidly and almost
reached to zero. This may be due to the presence of highly undulating terrain in the study area.
It was also noticed that most of the metrics decreased with the increase in spatial resolution.
Table 2: Calibration results
Coarse Calibration
Compare Pop Edges Cluster Slope Xmean Ymean Diff Brd Sprd Slp RG
0.95 0.9 0.94 0.77 0.75 0.92 0.91 60 20 20 80 40
0.95 0.9 0.94 0.77 0.75 0.92 0.91 60 20 20 80 60
0.95 0.9 0.94 0.77 0.75 0.92 0.91 60 20 20 80 80
Fine Calibration
0.93 0.9 0.96 0.67 0.3 0.94 0.87 65 30 30 70 50
0.93 0.9 0.96 0.67 0.3 0.94 0.87 65 30 30 70 60
0.93 0.9 0.96 0.67 0.3 0.94 0.87 65 30 30 70 70
Final Calibration
0.62 0.9 0.94 0.61 0 0.95 0.45 67 30 30 70 50
0.62 0.9 0.94 0.61 0 0.95 0.45 67 30 30 70 54
0.62 0.9 0.94 0.61 0 0.95 0.45 67 30 30 70 58
This indicates that the SLEUTH model may appear impotent in dealing with those areas
which have very high undulations and the model is more appropriate for coarse resolutions. It
was noticed that the population metric, which is the goodness fit of modeled urban pixels
with the control years and Edge metric had high correlation while all other coefficients except
the average slope and Ymean had significant correlation with modeled data with real world

Forecasting urban growth based on GIS, RS and SLEUTH model in Pune metropolitan area
Lakshmi KantaKumar N, Nikhil G Sawant, Shamita Kumar
International Journal of Geomatics and Geosciences
Volume 2 Issue 2, 2011 575
data. Since a model is an abstraction of reality, SLEUTH model can be used to predict the
future urban scenario of Pune city.
3.2 Prediction
Models are often judged by their predictive power (Silva & Clarke, 2002). Hence urban
growth of year 2011 has been predicted by using the urban extent layer of 2009 as the seed
layer, which is prepared from Landsat-5 TM by using the maximum likelihood supervised
classification method. It was observed that the visual interpretation (See Figure 4 and 5) of
modeled urban growth with the actual urban growth says that the model was successful to
generate the overall urban growth of Pune by 2011. The urban layer of year 2011, road layer
of year 2011, slope and hillshade layers of year 2009 have been used as seed layers to predict
the urbanization by 2030. For this forecast 100 Monte Carlo iterations were performed. The
prediction best fit values have been derived from the avg.log file, which was produced during
the final calibration; the values for prediction best fit are presented in Table 3.
Table 3: Prediction best fit values
Diff Brd Sprd Slp RG
93 43 43 44 53
Figure 4: Comparison of modeled and actual urban growth of the Study area
Figure 5: Comparison of modeled and actual urban growth

Forecasting urban growth based on GIS, RS and SLEUTH model in Pune metropolitan area
Lakshmi KantaKumar N, Nikhil G Sawant, Shamita Kumar
International Journal of Geomatics and Geosciences
Volume 2 Issue 2, 2011 576
The probability map of urban growth of Pune by 2030 i.e., Figure 6, shows that the chances
of Pune’s expansion towards the North and East direction may be higher than the other
directions. This may be due to the presence of the Western Ghats in the South and West
direction. Road influenced growth may be much higher along the NH-9 and SH-27 than the
NH-4 towards the Bangalore.
Figure 6: Probability Map of urban growth
Figure 7: Increase in Built-up area map from 2011-2030

Forecasting urban growth based on GIS, RS and SLEUTH model in Pune metropolitan area
Lakshmi KantaKumar N, Nikhil G Sawant, Shamita Kumar
International Journal of Geomatics and Geosciences
Volume 2 Issue 2, 2011 577
Figure 7 shows that rural areas in Urli Knanchan, Wagoli, Rahu and Talegoan Dhandhere
revenue areas might be the main centers of attraction for Pune urbanization in the future; this
may be due to presence of Pune- Ahmednagar State Highway (SH-27), Pune-Hyderabad
National Highway (NH-9) and greater availability of flat ground compared to the West and
South sides of Pune. Figure 8 shows that maximum percentage of non built-up land in the
rural areas of Hadapsar, Kothurud and Thergaon revenue areas might be converted in to built-
up areas by 2030.
Figure 8: Percentage of Built-up area by 2030
MIDC’s development of the Rajiv Gandhi IT and Bio-tech Park in Hinjewadi and Talegaon
Industrial Areas (MIDC, 2011) supports the predicted urban growth in the North direction.
MIDC developed Kharadi Knowledge Park, Ranjangaon Industrial area (MIDC, 2011) and
new upcoming townships on the Pune- Ahmednagar State Highway supports the predicted
urban area in Wagoli and Talegaon Dhandhere Revenue Circles. Kurkumbh Industrial area,
Magarpatta and upcoming townships support the predicted urban growth along Pune-
Hyderabad National Highway.
4. Conclusion
This study has shown that remote sensing is an ideal data source and GIS as an efficient tool
for urban and regional modeling. The SLEUTH model is an appropriate model for coarse
resolution in India. Minor changes to the SLEUTH model are required to improve
performance in the Indian context on large scale. SLEUTH is an urban growth model; in fact
this study has shown that it can be useful in gauging the potential of rural areas to become
new urban centers of rapidly expanding cities like Pune. Our future research is concentrating

Forecasting urban growth based on GIS, RS and SLEUTH model in Pune metropolitan area
Lakshmi KantaKumar N, Nikhil G Sawant, Shamita Kumar
International Journal of Geomatics and Geosciences
Volume 2 Issue 2, 2011 578
on rigorous calibration methods in order to improve SLEUTH performance for the Indian
scenario.
5. Acknowledgement
We gratefully acknowledge Professor Keith C. Clarke, University of California Santa-
Barbara for providing necessary help and special thanks goes to Dr. Calrie A Jantz,
University of Shippensburg, David Rodrigues, BVIEER, Anuj K Singh, Bentley Systems and
Maj. Gen. P K Choudhury, Survey of India.
6. References
1. Batty, M., (1998), Urban evolution on the desktop: simulation with the use of
extended cellular automata. Environment and Planning A, 30(11), pp 1943 – 1967.
2. Batty, M., Xie, Y., & Sun, Z., (1999), Modeling urban dynamics through GIS-based
cellular automata. Computers, Environment and Urban Systems, 23(3), pp 205-233.
3. Clarke, K. C., and Dietzel C., (2004), A decade of SLEUTHing: Lessons learned from
applications of from applications of a cellular automaton land use change model. In:
The Joint International Workshop on Integrated Assessment of the Land System: The
Future of Land Use. Institute for Environmental Studies, Amsterdam.
4. Clarke, K.C., Hoppen, S., Gaydos, L., (1996), Methods and techniques for rigorous
calibration of a cellular automation model of urban growth. In: Proceedings of the
Third International Conference/Workshop on Integrating GIS and Environmental
Modelling, Santa Fe, New Mexico, January 21–25, 1996.
5. Clarke, K. C., Parks, B. O., Crane, M. P., and Parks, B. E., (2001), Geographic
Information Systems and Environmental Modeling (1st ed.). Prentice Hall.
6. Collectorate Pune district, (2011), http://pune.gov.in, accessed 03 Aug. 2011.
7. Dietzel, C., and Clarke, K. C., (2004), Spatial Differences in Multi‐Resolution Urban
Automata Modeling. Transactions in GIS, 8(4), pp 479-492.
8. Dietzel, C., and K. C. Clarke, (2007), Toward Optimal Calibration of the SLEUTH
Land Use Change Model. Transactions in GIS11, pp 29-45.
9. Goldstien, N. C., 2004. Brain Vs. Brawn: Comparative Strategies for the calibration
of a cellular automata-based urban growth model. In Atkinson P, Foody G, Darby S,
and Wu F (eds) Geodynamics. Boca Raton, FL, CRC Press: 00-00
10. Maharashtra Industrial Development Corporation (MIDC), (2011),
http://www.midcindia.org/Pages/DefaultMIDC.aspx, accessed 6 Sep. 2011.
11. NCGIA, (2011), Project Gigalopolis, University Of California, Santa Barbara., USGS,
http://www.ncgia.ucsb.edu/projects/gig, accessed 02 Jun. 2011.

Forecasting urban growth based on GIS, RS and SLEUTH model in Pune metropolitan area
Lakshmi KantaKumar N, Nikhil G Sawant, Shamita Kumar
International Journal of Geomatics and Geosciences
Volume 2 Issue 2, 2011 579
12. Openshaw, S., and Openshaw, C., (1997), Artificial intelligence in geography. John
Wiley, Chichester, UK.
13. Jantz, C. A., S. J. Goetz, and M. K. Shelley, (2003), Using the SLEUTH urban growth
model to simulate the impacts of future policy scenarios on urban land use in the
Baltimore – Washington metropolitan area, Environment and Planning B: Planning
and Design30, pp 251-271.
14. Pettit, C., Shyy T-K., and Stimson, R., (2002), An on-line planning support system to
evaluate urban and regional planning scenarios. In Geertman S and Stillwell J (eds)
Planning Support Systems in Practice. Heidelberg, Springer-Verlag, pp. 331- 47
15. Sangawongse, S., C. H. Sun, and Tsai B. W., (2005), Urban Growth and Land Cover
Change In Chiang Mai and Taipei: Results From The SLEUTH Model. In Zerger, A.
and Argent, R. M. (eds). MODSIM 2005 International Congress on Modelling and
Simulation. Modelling and Simulation Society of Australia and New Zealand,
December 2005, pp 2622-2628.
16. Silva, E. A., and K. C. Clarke, (2002), Calibration of the SLEUTH urban growth
model for Lisbon and Porto, Portugal”. Computers, Environment and Urban Systems.
26, pp 525-552.
17. United States Geological Survey, (2011), Earth explorer,
http://edcsns17.cr.usgs.gov/NewEarthExplorer, accessed 15 May 2011.
18. Verburg P H., Soepboer W, Veldkamp A, Limpiada R, Espaldon V, and Mastura S S
A, 2002. Modeling the spatial dynamics of regional land use The CLUE-S model.
Environmental Management, 30, pp 391-405.
19. Wu, X., Y. Hu, H. S. He, R. Bu, J. Onsted, and F. Xi, (2008), Performance Evaluation
of the SLEUTH Model in the Shenyang Metropolitan Area of Northeastern China.
Environmental Modeling and Assessment, 14, pp 221-230.