Embed Size (px)
Citation preview

Forecasting the BET-C Stock Forecasting the BET-C Stock Index with Artificial Neural Index with Artificial Neural
NetworksNetworks
DOCTORAL SCHOOL OF FINANCE AND BANKING DOFIN
ACADEMY OF ECONOMIC STUDIES
MSc Student: Stoica Ioan-Andrei
Supervisor: Professor Moisa Altar
July 2006

Stock Markets and PredictionStock Markets and Prediction
Predicting stock prices - goal of every investor trying to Predicting stock prices - goal of every investor trying to achieve profit on the stock market achieve profit on the stock market
predictability of the market - issue that has been discussed predictability of the market - issue that has been discussed
by a lot of researchers and academicsby a lot of researchers and academics Efficient Market Hypothesis - Eugene FamaEfficient Market Hypothesis - Eugene Fama three forms:three forms:
Weak: future stock prices can’t be predicted using past Weak: future stock prices can’t be predicted using past stock prices stock prices
Semi-strong: even published information can’t be used Semi-strong: even published information can’t be used
to predict future pricesto predict future prices Strong: market can’t be predicted no matter what Strong: market can’t be predicted no matter what
information is available information is available

Stock Markets and PredictionStock Markets and Prediction
Technical AnalysisTechnical Analysis ‘‘castles-in-the air’ castles-in-the air’ investors behavior and reactions according to these investors behavior and reactions according to these
anticipations anticipations Fundamental Analysis Fundamental Analysis
‘‘firm foundations’firm foundations’ stocks have an intrinsic value determined by present stocks have an intrinsic value determined by present
conditions and future prospects of the companyconditions and future prospects of the company Traditional Time Series AnalysisTraditional Time Series Analysis
uses historic data attempting to approximate future uses historic data attempting to approximate future
values of a time series as a linear combinationvalues of a time series as a linear combination Machine Learning - Artificial Neural NetworksMachine Learning - Artificial Neural Networks

The Artificial Neural NetworkThe Artificial Neural Network
computational technique that computational technique that benefits from techniques similar benefits from techniques similar to those employed in the human to those employed in the human brain brain
1943 - W.S. McCulloch and W. 1943 - W.S. McCulloch and W. Pitts attempted to mimic the Pitts attempted to mimic the ability of the human brain to ability of the human brain to process data and information and process data and information and comprehend patterns and comprehend patterns and dependencies dependencies
The human brain - a complex, The human brain - a complex, nonlinear and parallel computer nonlinear and parallel computer
The neurons:The neurons: elementary information elementary information
processing unitsprocessing units building blocks of a building blocks of a
neural network neural network

The Artificial Neural NetworkThe Artificial Neural Network
semi-parametric approximation methodsemi-parametric approximation method Advantages:Advantages:
ability to detect nonlinear dependenciesability to detect nonlinear dependencies parsimonious compared to polynomial expansionsparsimonious compared to polynomial expansions generalization ability and robustness generalization ability and robustness no assumptions of the model have to be made no assumptions of the model have to be made flexibilityflexibility
Disadvantages:Disadvantages: has the ‘black box’ propertyhas the ‘black box’ property training requires an experienced usertraining requires an experienced user training takes a lot of time, fast computer neededtraining takes a lot of time, fast computer needed overtraining overtraining overfitting overfitting undertraining undertraining underfitting underfitting

The Artificial Neural NetworkThe Artificial Neural Network
xxxfy lnsin)(

The Artificial Neural NetworkThe Artificial Neural Network
xy sin

The Artificial Neural NetworkThe Artificial Neural Network
Overtraining/OverfittingOvertraining/Overfitting

The Artificial Neural NetworkThe Artificial Neural Network
Undertraining/UnderfittingUndertraining/Underfitting

Architecture of the Neural Architecture of the Neural
NetworkNetwork Types of layers:Types of layers:
input layer: number of neurons = number of inputsinput layer: number of neurons = number of inputs output layer: number of neurons = number of outputsoutput layer: number of neurons = number of outputs hidden layer(s): number of neurons = trial and errorhidden layer(s): number of neurons = trial and error
Connections between neurons:Connections between neurons: fully connectedfully connected partially connectedpartially connected
The activation function:The activation function: threshold function threshold function piecewise linear function piecewise linear function sigmoid functionssigmoid functions

The feed forward networkThe feed forward network
n
itiikktk xn
1,,0,, *
tkntktke
nLN,1
1)( ,,
m = number of hidden layer neurons
n = number of inputs
m
ktkkt Ny
1,0
^
*

The Feed forward Network with Jump The Feed forward Network with Jump
ConnectionsConnections
n
itiikktk xn
1,,0,, *
tkntktke
nLN,1
1)( ,,
m
k
n
itiitkkt xNy
1 1,,0
^
*
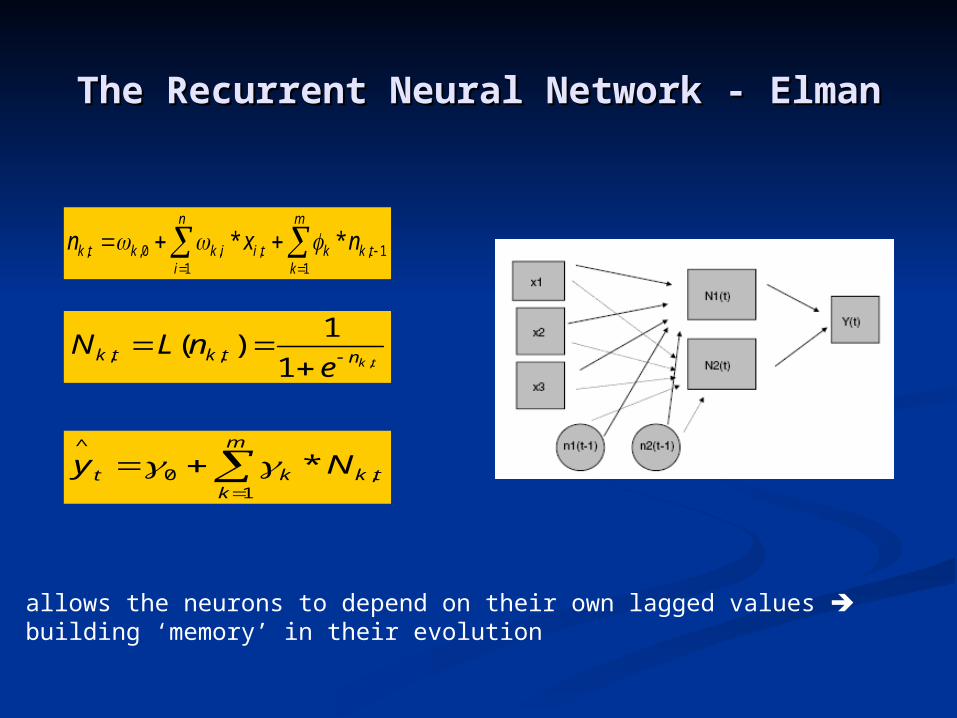
The Recurrent Neural Network - ElmanThe Recurrent Neural Network - Elman
m
ktkkt Ny
1,0
^
*
tkntktke
nLN,1
1)( ,,
m
ktkk
n
itiikktk nxn
11,
1,,0,, **
allows the neurons to depend on their own lagged values building ‘memory’ in their evolution

Training the Neural NetworkTraining the Neural Network
T
ttt yy
1
2^
)()(min
Objective: minimizing the discrepancy between real data and the output of the network
);(^
tt xfy
Ω - the set of parameters
Ψ – loss function
Ψ nonlinear nonlinear optimization problem
- backpropagation
- genetic algorithm

The Backpropagation AlgorithmThe Backpropagation Algorithm
alternative to quasi-Newton gradient descent alternative to quasi-Newton gradient descent ΩΩ00 – randomly generated – randomly generated
001 )(
ρρ – learning parameter, in [.05,.5] – learning parameter, in [.05,.5] after n iterations: after n iterations: μμ=0.9, momentum parameter=0.9, momentum parameter
)( 2111 nnnnn
problem: local minimum points problem: local minimum points

The Genetic AlgorithmThe Genetic Algorithm
based on Darwinian lawsbased on Darwinian laws Population Creation:Population Creation: N random vectors of weights N random vectors of weights Selection Selection (Ωi Ωj) parent vectors(Ωi Ωj) parent vectors Crossover & Mutation Crossover & Mutation C1,C2 C1,C2 children vectors children vectors Election Tournament: Election Tournament: the fittest 2 vectors passed the fittest 2 vectors passed
to the next generationto the next generation Convergence: Convergence: G* generationsG* generations G*G* - large enough so there are no significant - large enough so there are no significant
changes in the fitness of the best individual for changes in the fitness of the best individual for several generationsseveral generations

Experiments and ResultsExperiments and Results
BET-C stock index – daily closing prices, 16 April 1998 until 18 May BET-C stock index – daily closing prices, 16 April 1998 until 18 May 2006 2006
daily returns: daily returns:
conditional volatility - rolling 20-day standard deviation: conditional volatility - rolling 20-day standard deviation:
BDS-Test for nonlinear dependencies:BDS-Test for nonlinear dependencies: HH00: i.i.d. data: i.i.d. data
BDSBDSm,m,εε~N(0,1)~N(0,1)
Data
11 lnlnln
t
tttt P
PPPR
19
)(20
1
2_
i
tit
t
RRV
Series m=2 m=3 m=4
ε=1 ε=1.5 ε=1 ε=1.5 ε=1 ε=1.5
OD 16.6526 17.6970 18.5436 18.7202 19.7849 19.0588
ARF 16.2626 17.2148 18.3803 18.4839 19.7618 18.9595

Experiments and ResultsExperiments and Results 3 types of Ann's:3 types of Ann's:
feed-forward networkfeed-forward network feed-forward network with jump connectionsfeed-forward network with jump connections recurrent networkrecurrent network
Input: [Rt-1 Rt-2 Rt-3 Rt-4 Rt-5] & Vt Input: [Rt-1 Rt-2 Rt-3 Rt-4 Rt-5] & Vt Output: next-day-return Rt Output: next-day-return Rt Training: genetic algorithm & backpropagationTraining: genetic algorithm & backpropagation Data divided in:Data divided in:
training set – 90%training set – 90% test set – 10%test set – 10%
one-day-ahead forecasts - static forecastingone-day-ahead forecasts - static forecasting Network: Network:
trained 100 timestrained 100 times best 10 – SSEbest 10 – SSE best 1 - RMSEbest 1 - RMSE

Experiments and ResultsExperiments and Results
In-sample Criteria In-sample Criteria
Out-of-sample CriteriaOut-of-sample Criteria
Pesaran-Timmerman Test for Directional Accuracy: Pesaran-Timmerman Test for Directional Accuracy: HH0 0 : signs of the forecast and those of the real data : signs of the forecast and those of the real data
are independent are independent DA~N(0,1)DA~N(0,1)
T
ttt yy
TMAE
1
ˆ1
Evaluation Criteria
T
ttt
T
ttt
T
ttt
T
ttt
yy
yy
yy
yyR
1
2
1
2^
1
2
1
2^
2
)(
)(1
)(
)(
T
tt
T
ttt yySSE
1
2
1
2^
)(
T
yyRMSE
T
ttt
1
2^
)(
T
ttIHR
1
0
0,1^
ttt
yyifI
T
ttt ysignyROI
1
^
)(
T
tt
T
ttt
y
ysignyRP
1
1
^
||
)(

Experiments and ResultsExperiments and Results
ROI - trading strategy based on the sign forecasts:ROI - trading strategy based on the sign forecasts:
+ buy sign+ buy sign - sell sign- sell sign
Finite differences: Finite differences:
Benchmarks
Naïve model: RNaïve model: Rt+1t+1=R=Rtt
buy-and-hold strategybuy-and-hold strategy AR(1) model – LS – overfitting:AR(1) model – LS – overfitting:
RMSERMSE MAEMAE
i
ninii
i h
xxxfxhxxf
x
y ),...,...,(),...,,...,( 11
610 ih

Experiments and ResultsExperiments and Results
Naïve AR(1) FFN – no vol FFN FFN-jump RN
R2 - 0.079257 0.083252 0.083755 0.084827 0.091762
SSE - 0.332702 0.331258 0.331077 0.330689 0.328183
RMSE 0.015100 0.011344 0.011325 0.011304 0.011332 0.011319
MAE 0.011948 0.008932 0.008929 0.008873 0.008867 0.008892
HR 55.77% (111) 56.78% (113) 57.79% (115) 59.79% (119) 59.79% (119) 59.79% (119)
ROI 0.265271 0.255605 0.318374 0.351890 0.331464 0.412183
RP 15.02% 14.47% 18.02% 19.92% 18.77% 23.34%
PT-Test - - 14.79 15.01 15.01 14.49
B&H 0.2753 0.2753 0.2753 0.2753 0.2753 0.2753
FFN FFN-jump RN
Volatility -0.1123 -0.1358 -0.1841

Experiments and ResultsExperiments and Results
Actual, fitted ( training sample)

Experiments and ResultsExperiments and Results
Actual, fitted ( test sample)

ConclusionsConclusions
RMSE and MAE < AR(1) RMSE and MAE < AR(1) no signs of overfitting no signs of overfitting RR22 < 0.1 < 0.1 forecasting magnitude is a failure forecasting magnitude is a failure sign forecasting ~60% sign forecasting ~60% success success Volatility: Volatility:
improves sign forecastimproves sign forecast finite differences finite differences negative correlation negative correlation perceived as measure of riskperceived as measure of risk
trading strategy: outperforms naïve model and buy-and-trading strategy: outperforms naïve model and buy-and-holdhold
quality of the sign forecast – confirmed by Pesaran-quality of the sign forecast – confirmed by Pesaran-Timmerman testTimmerman test

Further developmentFurther development
Volatility: other estimatesVolatility: other estimates neural classificator: specialized in sign neural classificator: specialized in sign
forecastingforecasting using data outside the Bucharest Stock using data outside the Bucharest Stock
Exchange:Exchange: T-Bond yields T-Bond yields exchange rates exchange rates indexes from foreign capital markets indexes from foreign capital markets