Embed Size (px)
Citation preview

FORECASTING PANEL - GAS
1
2
3
4
5
6
7
8
9
10
11
12
13
14
15
16
17
18
19
20
21
22
23
24
Oo
Ao
Would the members of the Gas Forecasting Panel please
state their names and business address?
Frank C. Yaegel and Joanna Ostrowska. 4 Irving Place,
New York, New York 10003.
By whom are you employed, in what capacity, and what
are your professional backgrounds and qualifications?
We are employed by Consolidated Edison Company of New
York, Inc. (~Con Edison" or the ~Company").
(Yaegel) I have been employed by Con Edison since
1972. In March 1983, I was promoted to the position
of Gas and Steam Forecast Manager. I received a
Bachelor of Science degree in Economics from the City
University of New York. I have also completed the
Executive Education Program for the Gas Industry
conducted by the University of Colorado, Boulder
Graduate School of Business.
(Ostrowska) I am employed by Con Edison as a Senior
Analyst in the Gas and Steam section of the Revenue
and Volume Forecasting Department in Corporate
Accounting. I joined Con Edison in January 2007. I
received a Bachelor’s degree in Business
Administration from Pace University in 2002 and I am
currently enrolled in the Masters of Business
Administration program at Fordham University. Prior
-I-

FORECASTING PANEL - GAS
6
7
8
9
10
11
12
13
14
15
16
17
18
19
20
21
22
23
24
1
2
3 Q.
4 A.
5
Qo
ao
Oo
to working for the Company, I worked as a Financial
Analyst for approximately five years.
What are your current responsibilities?
(Yaegel) I supervlse the Gas and Steam Volume and
Revenue Forecasting section of the Revenue and Volume
Forecasting Department. In this position, I am
responsible for forecasting Con Edison and Orange &
Rockland gas sendout, delivery volumes, and resultant
revenues as well as Con Edison steam delivery volumes
and resultant revenues. Additionally, I am
responsible for the collection, maintenance, and
dissemination of weather data as well as the periodic
updating of the Company’s weather normals used to
forecast electric, gas and steam sales and sendout.
(Ostrowska) My current responsibilities include
assisting in the development of the Con Edison Gas
Volume and Revenue forecast under the direction of the
Gas and Steam Forecasting section Manager. I will
serve as the Chairperson of the Panel.
Have you previously submitted testimony to the New
York State Public Service Commission (~Commission")?
Yes. We have both either testified or submitted
testimony in prior case(s).
What is the purpose of the Forecasting Panel’s
-2-

FORECASTING PANEL - GAS
1
2
3
4
5
6
7
8
9
10
11
12
13
14
15
16
17
18
19
20
21
22
23
24
Ao
testimony in this proceeding?
The Forecasting Panel’s testimony presents the
Company’s forecast of gas delivery volumes and
revenues for the rate year, the twelve months ended
September 30, 2011. It addresses the development of
the forecast and the key components expected to impact
future delivery volumes. The forecasted firm delivery
volumes for the rate year are 116,432 MDTS. This
represents an average annual growth rate of
approximately 1.4 percent over the weather normalized
historic year firm delivery volumes.
The forecast of firm delivery revenues to Tariff
customers (other than Service Classification 14) was
determined based on billing determinants. Revenues
from contractual customers were based on the current
contract terms and revenues from Service
Classification 14 were determined using prices as of
June 2009. Fuel related revenues were provided by
Company witness Olmsted. Estimated revenues
associated with the increase ~n rates and charges were
provided by the Accounting Panel. Billing and Payment
Processing Charge revenues were estimated based on the
estimate of bills in the rate year and a weighted rate
charged per bill. PSL 18-a assessment charges were
-3-

FORECASTING PANEL - GAS
1
2
3
4
5
6
7
8
9
10
11
12
13
14
15
16
17
18
19
20
21
22
23
24
Oo
estimated based on the rate year volume forecast and
the current unit charges billed to customers. ~Other
Charges," which include Merchant Function Charges,
Monthly Rate Adjustment Charges, System Benefit
Charges, and Energy Efficiency Charges, were
separately computed by the Accounting Panel and added
for presentation purposes. Based on detailed rate
design data and billing determinant data the
Forecasting Panel provided to them, the Gas Rate Panel
determined the rates required to generate the proposed
revenue requirement in this proceeding. That amount
inclusive of increase in rates and charges is
$160,882,000. Assuming all firm customers to be full
service customers, the proposed base rate increase to
firm customers’ total costs equates to 8.3 percent.
Since the Company is also proposing a three-year rate
plan, the Forecasting Panel has also provided the
Accounting Panel with estimated volumes and revenues
for rate years two and three.
FIRM DELIVERY VOLUME FORECAST
Please describe the forecast methodology.
The process begins with the weather normalization of
the historic year volumes to neutralize deviations in
volumes due to warmer or colder than normal weather.
-4-
FORECASTING PANEL - GAS
1
2
3
4
5
6
7
8
9
10
11
12
13
14
15
16
17
18
19
20
21
22
23
24
Oo
Ao
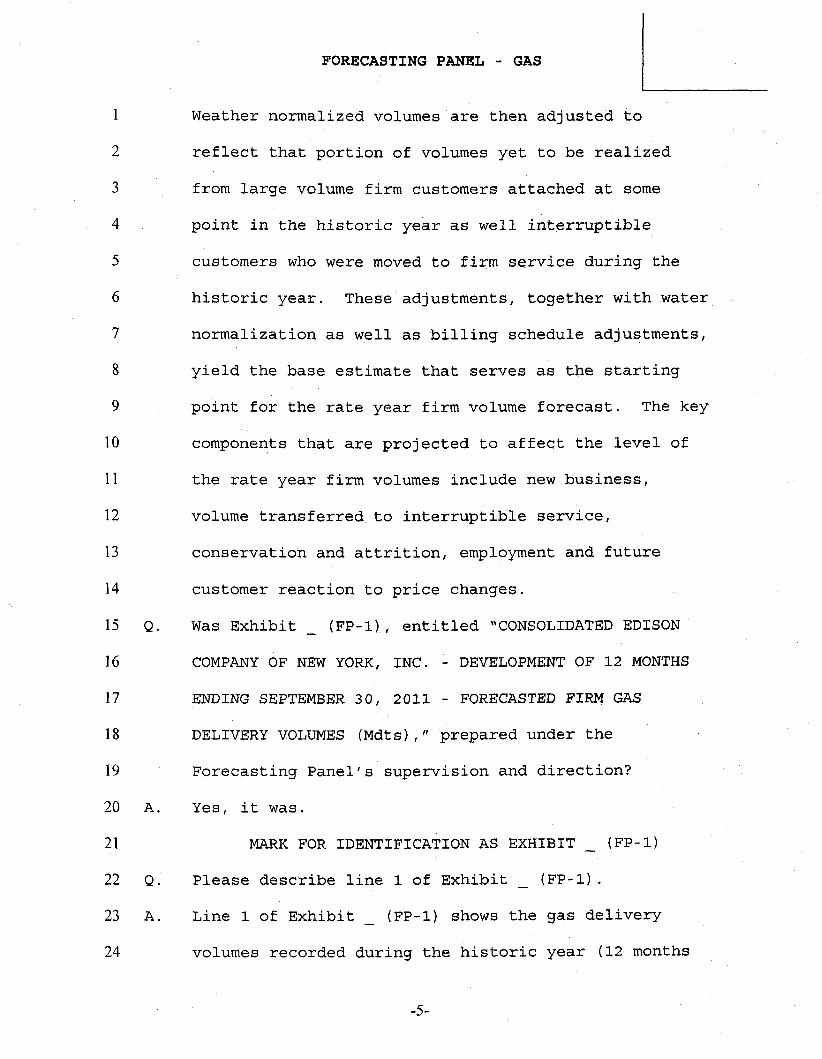
Weather normalized volumes are then adjusted to
reflect that portion of volumes yet to be realized
from large volume firm customers attached at some
point in the historic year as well interruptible
customers who were moved to firm service during the
historic year. These adjustments, together with water
normalization as well as billing schedule adjustments,
yield the base estimate that serves as the starting
point for the rate year firm volume forecast. The key
components that are projected to affect the level of
the rate year firm volumes include new business,
volume transferred to interruptible service,
conservation and attrition, employment and future
customer reaction to price changes.
Was Exhibit (FP-I), entitled ~CONSOLIDATED EDISON
COMPANY OF NEW YORK, INC. - DEVELOPMENT OF 12 MONTHS
ENDING SEPTEMBER 30, 2011 - FORECASTED FIRM GAS
DELIVERY VOLUMES (Mdts)," prepared under the
Forecasting Panel’s supervislon and direction?
Yes, it was.
MARK FOR IDENTIFICATION AS EXHIBIT (FP-I)
Please describe line 1 of Exhibit (FP’I).
Line 1 of Exhibit (FP-I) shows the gas delivery
volumes recorded during the historic year (12 months
-5-

FORECASTING PANEL GAS
6
7
8
9
10
11
12
13
14
15
16
17
18
19
20
21
22
23
24
1
2
3 Q.
4
5 A.
ended June 30, 2009) detailed on a service
classification basis.
Please describe the Weather Normalization adjustment
shown on line 2.
Line 2 shows the Weather Normalization adjustment
necessary to recognize that the historic year volumes
were higher than expected due to colder than normal
weather experienced. The historic year, on a heating
degree-day basis, was approximately 5.5 percent colder
than normal. The impact on firm delivery volumes by
service classification was calculated monthly by
multiplying the variation between normal and actual
heating degree-days, measured on a billing cycle
basis, by a "use per heating degree-day per average
customer factor" times the actual number of customers.
The factors, by service classification grouping, were
determined by regression analysis of actual average
monthly-billed volumes per customer per billing day
versus actual monthly billing cycle heating degree-
days per billing day. The resultant weather
normalization adjustment represents a 2.8 percent
downward adjustment to the total historic year
volumes.
Please define normal weather.
-6-

FORECASTING PANEL GAS
1
2
3
4
5
6
7
8
9
10
11
12
13
14
15
16
17
18
19
20
21
22
23
24
Ao Normal weather is defined as the average weather
condition over the 30 calendar years ended 2008. A
30-year average condition is used by the National
Weather Service to define normal conditions and is a
widely accepted standard in the energy industry. The
30-year average condition is utilized in the Company’s
gas Weather Normalization Clause and updated on an
annual basis.
Please explain the Annualization Adjustment labeled
Large Volume Customers.
Large volume customers are customers estimated to use
I0,000 dts or more annually. The Annualization
Adjustment reflects the impact on delivery volumes yet
to be realized from new large volume firm customers
added during the historic year. The Forecasting Panel
will explain new business related to small volume new
business later in our testimony.
Please explain the Annualization Adjustment labeled
Transfers From Interruptible Service shown on line 5.
In the first half of 2009, some 156 interrupt±ble
customers were moved to firm service. Most of these
customers were moved due to non-compliance with
interruptible service tariff requirements. The load
shown on line 5 represents the usage by these customers
-7-

FORECASTING PANEL - GAS
1
2
3
4
5
6
7
8
9
10
11
12
13
14
15
16
17
18
19
20
21
22
23
Oo
Ao
under interruptible service during the historic rate
year.
Please explain the Water Normalization adjustment
shown on line 7.
In addition to variances in space heating requirements
caused by abnormal weather conditions, deviations from
normal water temperatures impact water heating
requirements. Based on an analysis of the historic
relationship of air and water temperatures, a normal
water temperature condition consistent with the normal
weather condition was developed. The resultant normal
water temperature condition was then compared to the
actual water temperature conditions during the
historic year.
In the non-space heating classifications of SC 1 and
SC 2, usage per degree of water temperature for the
average customer was determined by regression
analysis. Those resultant usage factors were applied
in a similar manner as the space heating factors were
in the weather normalization adjustment to derive the
water normalization adjustments shown on line 7.
Water temperatures during the historic year were
warmer than normal and, as a result, the historic year
-8-

FORECASTING PANEL GAS
6
7
8
9
10
11
12
13
14
15
16
17
18
19
20
21
22
23
24
1
2
3 Q.
4
5 A.
Ao
delivery volumes lower than they otherwise should have
been, resulting in an upward adjustment of 163 Mdts.
Please explain the Billing Schedule Adjustments shown
on line 8.
These adjustments recognize that the historic year had
more billing days than the billings days associated
with the rate year (12 months ending September 30,
2011).
What does line 9, Base Estimate, represent?
The Base Estimate represents the historic year’s
volumes adjusted to normal weather and water
temperatures, as well as for large volume customers
occurring during the historic year that will impact
future firm delivery volumes and the number of billing
days in the rate year. It serves as the starting
point for the rate year’s firm delivery volume
forecast.
Please explain the ~Small Volume New Business"
forecast shown on line i0.
The ~Small Volume New Business" forecast represents
the estimate of expected incremental small firm new
business delivery volumes to be realized in the rate
year associated with new construction and conversion
customers connected and projected to be added to the
-9-

FORECASTING PANEL - GAS
1
2
3
4
5
6
7
8
9
10
11
12
13
14
15
16
17
18
19
20
21
22
23
24
Qo
system between July 2008 and September 2011.
Please explain in detail how the ~small volume new
business" forecast is developed.
The ~small volume new business" forecast is a product
of econometric models used to forecast the numbers
of customers in SC 2 rate 1 and SC 2 rate 2, and in SC
3, split between customers in the 1-4 dwelling group
and those in the greater than 4 dwelling unit group.
Each model consists of two parts: the first part is a
regresslon model, which correlates the sales volume
with the set of independent variables selected into
the model; the second part is an integrated
autoregressive and moving average (~ARIMA") model.
The combined model is often referred to as an ARIMAX
model in modeling literature, where the letter ~X"
stands for the set of independent variables included
in the model. The ARIMA model can take many different
forms, and each model has its own ARIMA structures,
statistically determined according to the data pattern
of each group modeled.
In forecasting modeling, the model can include only a
few economic variables, such as the level of
employment or prlce ratio of oil to gas. All other
economic variables, which may have an effect on the
-I0-

FORECASTING PANEL - GAS
1
2
3
4
5
6
7
8
9
10
11
12
13
14
15
16
17
18
19
20
21
22
23
24
level of new customers but either are not quantifiable
or have no data available, are excluded from the
model. The ARIMA mechanism captures the collective
effect of those excluded variables. In addition,
ARIMA smoothes out autocorrelation issues in the data.
The models were developed on a monthly basis, with the
modeling period starting in March 2002 and ending in
June 2009. Dummy variables were included to account
for outliers observed in the source data.
In SC 2 rate i, no economic variables were included
but two separate dummy variables were included to
account for outliers in the data.
In SC 2 rate 2, the economic variables included were
the logarithm of the price ratio of oil to gas and two
dummy variables to remove the effects of outliers in
the source data.
In SC 3 (1-4 dwelling unit group), two economic
variables were included, the first being the year over
year logarithm of the prlce ratio of oil to gas, and
the second being the year over year differences in the
logarithm of total non-manufacturing employment. One
dummy variable was included to account for the
outliers in the data.
In SC 3 (greater than 4 dwelling unit group), two
-II-

FORECASTING PANEL - GAS
1
2
3
4
5
6
7
8
9
10
11
12
13
14
15
16
17
18
19
20
21
22
23
24
Qo
economic variables were included, the first being the
year over year difference in the price ratio of oil to
gas, and the second being the year over year
difference in the logarithm of total non-manufacturing
employment.
Three dummy variables were included to account for the
outliers in the data.
Please explain the ~Large Volume New Business"
forecast shown on line II.
These volumes are associated with a relatively small
number of identified large volume customers estimated
to take service after June 30, 2009 for all or part of
the rate year.
Please explain the Distributed Generation forecast
shown in line 12.
This represents the anticipated usage in the rate year
of five large new distributed generation customers
anticipated to take service before the start of the
rate year. All of these customers were priced under
the terms of Rider H.
Please explain the Transfer to Interruptible Service
forecast shown on line 13.
This represents the historic annual volumes of one
very large customer included in the Transfers from
-12-

FORECASTING PANEL - GAS
1
2
3
4
5
6
7
8
9
10
11
12
13
14
15
16
17
18
19
20
21
22
23
24
Qo
Ao
Interruptible Service forecast previously discussed.
Under the terms of the Company’s tariff, this customer
is eligible to return to interruptible service in May
2010.
Is it possible that during the winters of 2009/2010
and 2010/2011 other interruptible customers might move
or be moved to firm service?
That is possible. It is also possible that other
customers from the group of 156 customers who moved or
were moved during this past winter might elect to
return to interruptible service.
Please explain the basis of the Conservation and
Attrition forecast shown on line 14.
The forecast shown in the column labeled SC 1 relates
to the overall decline in volumes delivered in this
residential service classification where the end use
is predominantly for cooking. Volumes in SC 1 have
declined at an average annual rate of 0.6 percent per
year over the last i0 years. This historic trend is
related, in part, to customer reclassification when
customers convert to gas for their space heating
requirements. The forecast assumes that this
declining trend will continue. The forecasts shown in
the columns labeled SC 2 NHt, SC 2 Ht, and SC 3
-13-

FORECASTING PANEL - GAS
1
2
3
4
5
6
7
8
9
10
11
12
13
14
15
16
17
18
19
20
21
22
23
24
Oo
ao
represent the anticipated reduction in volumes as a
result of the replacement of existing space and water
heating equipment with newer, more energy efficient
equipment.
The forecast assumes replacements of equipment based
on the assumption of a 20 year equipment life and
energy savings of approximately 20 percent for those
replacing space heating equipment and approximately
20-40 percent for those replacing water heating
equipment.
Please explain the basis for the projected impact of
Employment shown on line 15.
Employment relative to the levels experienced during
the historic year is projected to continue to decline
through 2010 and begin to improve in 2011 but not
return to 2008 levels until 2012. Historically,
analysis of firm commercial classification volumes
indicate that the percent change in commercial volumes
per percent change in employment is approximately
0.57. The projected change in employment and the
assumed change in volumes at this rate yield the
projected volume impact shown on line 14. The Company
receives it employment projections from Moody’s
Economy.com.
-14-

FORECASTING PANEL - GAS
6
7
8
9
10
11
12
13
14
15
16
17
18
19
20
21
22
23
24
1 Q.
2
3 ~.
4
5
Oo
Please explain the basis for the projected impact of
Price shown on line 15.
This projection reflects that customers will see
higher bills at the start of the rate year as a result
of the delivery rate increase proposed in this
proceeding, and that their reaction to price equates
to a price elasticity coefficient of 0.I.
What is the significance of the price elasticity
coefficient of 0.I?
The forecast assumes a 0oi percent decrease in usage
for each 1.0 percent increase in the total bill for
their usage.
Did the Forecasting Panel apply the price elasticity
coefficient to all firm customers?
No. The forecast does not assume any customer
reaction to prices in the SC 1 service classification
nor in the SC 3 residential space heating service
classification where the delivery volumes are
associated with customers with greater than four
dwelling units. Customers in the SC 1 service
classification are predominantly small cooking
customers with limited potential to reduce their usage
as a result of price changes. Residential space
heating in the SC 3 service classification with more
-15-
FORECASTING PANEL - GAS
1
2
3
4
5
6
7
8
9
10
11
12
13
14
15
16
17
18
19
20
21
22
23
24
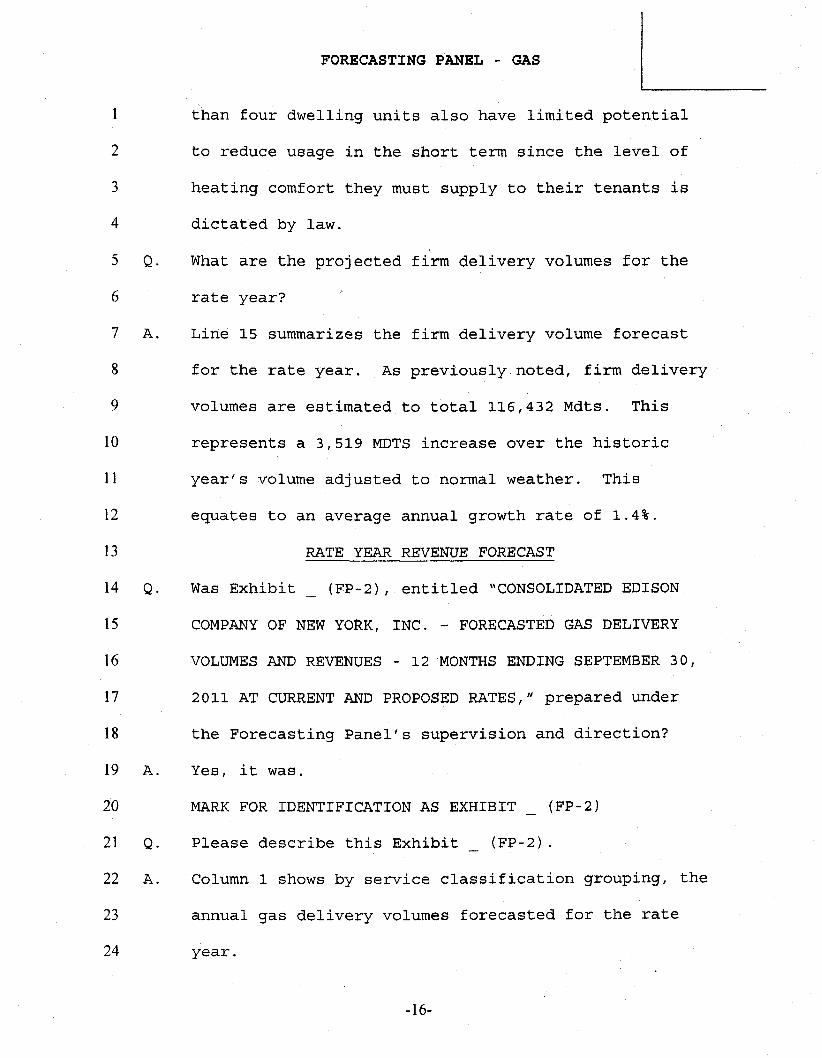
than four dwelling units also have limited potential
to reduce usage in the short term since the level of
heating comfort they must supply to their tenants is
dictated by law.
What are the projected firm delivery volumes for the
rate year?
Line 15 summarizes the firm delivery volume forecast
for the rate year. As previously noted, firm delivery
volumes are estimated to total 116,432 Mdts. This
represents a 3,519 MDTS increase over the historic
year’s volume adjusted to normal weather. This
equates to an average annual growth rate of 1.4%.
RATE YEAR REVENUE FORECAST
Was Exhibit (FP-2), entitled ~CONSOLIDATED EDISON
COMPANY OF NEW YORK, INC. - FORECASTED GAS DELIVERY
VOLUMES AND REVENUES - 12 MONTHS ENDING SEPTEMBER 30,
2011 AT CURRENT AND PROPOSED RATES," prepared under
the Forecasting Panel’s supervision and direction?
Yes, it was.
MARK FOR IDENTIFICATION AS EXHIBIT (FP-2)
Please describe this Exhibit (FP-2).
Column 1 shows by service classification grouping, the
annual gas delivery volumes forecasted for the rate
year.
-16-

FORECASTING PANEL - GAS
1
2
3
4
5
6
7
8
9
10
11
12
13
14
15
16
17
18
19
20
21
22
23
24
Oo
The firm gas service classifications are: SC 1 -
residential and religious; SC 2 NHt - commercial and
industrial (non-heating); SC 2 Ht - commercial and
industrial (heating); SC 3 - residential and religious
heating; SC 13 - seasonal off peak water heating; and
SC 14 - natural gas vehicle customers.
Please continue.
Also shown in column 1 is projected non-firm SC 12
Rate 1 and off peak firm SC 12 Rate 2 delivery volumes
for the rate year.
Please describe the differences between SC 12 Rate 1
and $C 12 Rate 2.
The differences between SC 12 Rate 1 and SC 12 Rate 2
service are the type of service provided, the manner
in which rates are developed, and how the resulting
revenue margins are treated.
How were the rate year volumes projected for SC 12
Rate 1 developed?
The forecast of the future volumes for SC 12 Rate 1
reflects a number of adjustments to the historic year
volumes. These adjustments include a downward weather
adjustment that was computed in a similar manner as
the weather normalization adjustments for the weather
sensitive firm rate classifications. The historic
-17-

FORECASTING PANEL ~ GAS
1
2
3
4
5
6
7
8
9
10
11
12
13
14
15
16
17
18
19
20
21
22
23
24
Oo
year volumes were also adjusted for the net difference
between the actual level of service interruptions in
the historic year and the estimated level of service
interruptions during the rate year assuming normal
weather conditions.
The forecast was also adjusted for the transfer of
load from interruptible to firm service we previously
mentioned.
How were the rate year volumes projected for SC 12
Rate 2 developed?
The forecast of rate year volumes for SC 12 Rate 2 was
developed in a manner consistent with that of SC 12
Rate I. In effect, the forecast was developed by
considering normal weather in the future, accounting
for the difference between actual and estimated
service interruptions assuming normal weather
conditions, load transferring from interruptible to
firm service, and the estimate of firm load projected
to return to interruptible service.
Please explain how the base revenues, shown in column
2, for firm related delivery volumes were determined.
For SC’s i, 2, 3, and 13, the forecast base revenues
by month were computed on a billing determinant basis.
The process in effect is the product of three steps:
-18-

FORECASTING PANEL - GAS
1
3
4
5
6
7
8
9
10
11
12
13
14
15
16
17
18
19
20
21
22
23
24
i) the estimated number of 30 day bills associated
with the forecasted usage was multiplied by the
current minimum charge rate to obtain minimum charge
revenues, 2) the forecast usage was broken down into
usage by rate block and multiplied by the associated
unit rate in each rate block, and 3) the minimum
charge revenues and block charge revenues were summed
to obtain total base revenues. The air conditioning
sales of certain customers within these service
classifications are charged lower rates for such
incremental sales and were priced separately. Volumes
to distributed generation customers and contract
customers were priced according to the rate/contract
terms of each group. The volumes related to SC 14
were priced at the existing tariff rate, which
includes fuel costs.
Please explain how the Base Revenues related to the
projected delivery volumes for SC 12 Rate 1 were
determined.
SC 12 Rate 1 has a number of rate sub-groups, the
differences in these sub-groups being the annual usage
requirements needed to qualify and the manner in which
rates are computed (e.g., consideration of the type of
alternative fuel used by the customers in the sub-
-19-

FORECASTING PANEL - GAS
I
2
3
4
5
6
7
8
9
10
11
12
13
14
15
16
17
18
19
20
21
22
23
24
Ao
group). Most of the customers in SC 12 Rate 1 take
service under rate sub-group "A/B." The delivery rate
for customers in this sub-group are designed to be
less than the delivery rate charged to firm service
rate customers.
Customers taking full service in the other rate sub-
groups within SC 12 Rate 1 are generally charged
applicable gas commodity costs, a contribution to gas
pipeline demand costs and a variable delivery rate
that attempts to maximize delivery revenues and enable
a total gas price competitive to the representative
alternative fuel price. In no case would customers
taking full service be charged a total price below the
commodity cost of gas plus $0.I0 per dekatherm.
Customers taking service in the other rate sub-groups
within SC 12 Rate 1 who purchase their gas from
marketers are charged the same delivery rate as full
service customers.
Please explain how the Base Revenues, shown in column
2, related to the projected delivery volumes for SC 12
Rate 2, were determined.
Customers taking full service are generally charged:
(i) commodity costs; (2) a contribution to pipeline
demand costs; and (3) a fixed tariff delivery charge
-20-
FORECASTING PANEL GAS
1
2
3
4
5
6
7
8
9
10
11
12
13
14
15
16
17
18
19
20
21
22
23
24
Oo
Ao
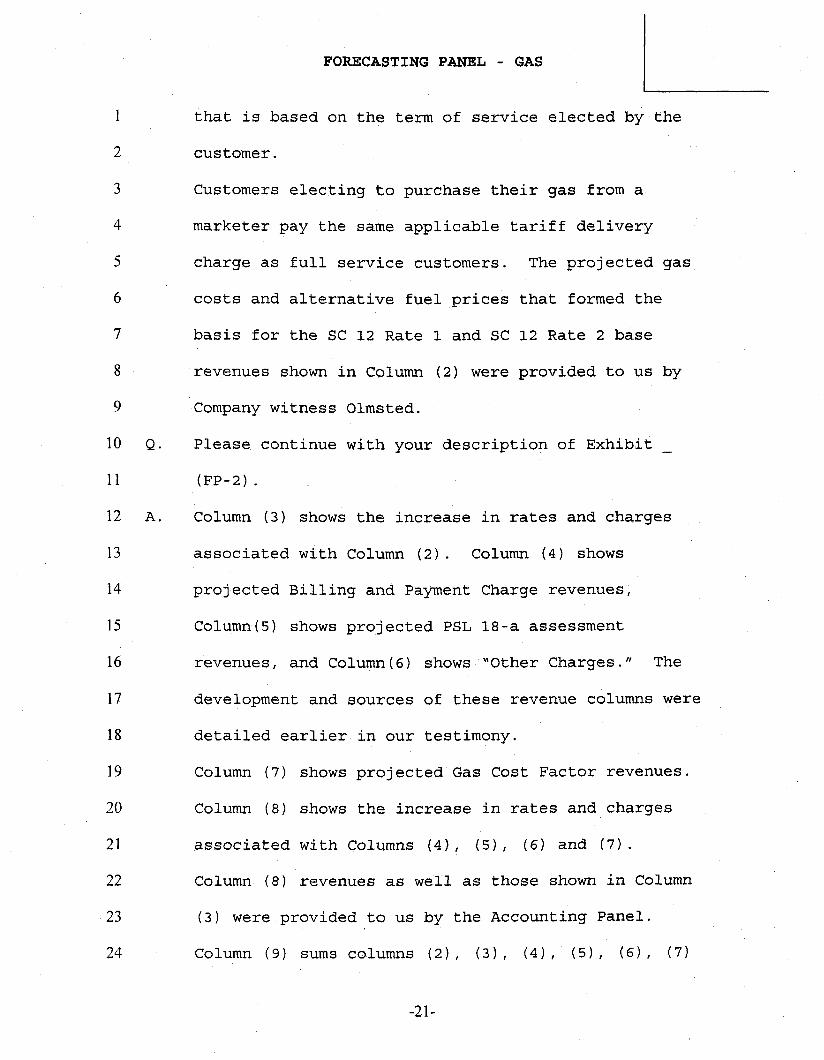
that is based on the term of service elected by the
customer.
Customers electing to purchase their gas from a
marketer pay the same applicable tariff delivery
charge as full service customers. The projected gas
costs and alternative fuel prices that formed the
basis for the SC 12 Rate 1 and SC 12 Rate 2 base
revenues shown in Column (2) were provided to us by
Company witness Olmsted.
Please continue with your description of Exhibit _
(FP-2) .
Column (3) shows the increase in rates and charges
associated with Column (2). Column (4) shows
projected Billing and Payment Charge revenues,
Column(5) shows projected PSL 18-a assessment
revenues, and Column(6) shows "Other Charges." The
development and sources of these revenue columns were
detailed earlier in our testimony.
Column (7) shows projected Gas Cost Factor revenues.
Column (8) shows the increase in rates and charges
associated with Columns (4), (5), (6) and (7).
Column (8) revenues as well as those shown in Column
(3) were provided to us by the Accounting Panel.
Column (9) sums columns (2), (3), (4), (5), (6), (7)
-21-

FORECASTING PANEL - GAS
1
2
3
4
5
6
7
8
9
10
11
12
13
14
15
16
17
18
19
20
21
22
23
Qo
and (8) and shows pro3ected total revenues for the
future rate year at current rates.
Column (i0) shows the proposed revenue increase
inclusive of the associated increase in rates and
charges provided to us by the Rate Panel.
Column (8) shows the estimated total revenue at
proposed rate.
It is important to note that the projected total
revenues for the rate year at Current Rates shown in
Column (9) reflects projected revenues from both full
service and retail access customers and does not
include any commodity cost projections associated with
customers anticipated to purchase their gas from
marketers. Assuming that retail access customers’ gas
commodity costs are equivalent to the commodity costs
charged by the Company to its full service customers,
(i.e., assumlng that all firm customers were full
service customers), the proposed base rate increase to
firm customers’ total gas costs equates to 8.6
percent.
Are there factors that could substantially affect the
level of future gas delivery volumes and revenues in
the rate year?
-22-

FORECASTING PANEL - GAS
1
2
3
4
5
6
7
8
9
10
11
12
13
14
15
16
17
18
19
20
21
22
23
24
Ao
Oo
Yes. These factors which are subject to uncertainty
- include, but are not limited to, the level of actual
new business, intra class transfers, the economy,
energy prices and customer fuel switching. These
forecast components will be monitored closely and to
the extent that updated data warrants changes to the
forecasts, such changes would be reflected in the
Company’s update filing.
Referring to the development of base revenues, the
testimony reflects that the Forecasting Panel
developed the rate year base revenue forecast by using
billing determinants. Did the Forecasting Panel
develop an exhibit summarizing the details of the
billing determinant forecast?
Yes.
Is that data shown on a one page exhibit entitled
~"CONSOLIDATED EDISON COMPANY OF NEW YORK, INC. -
FORECASTED GAS DELIVERY VOLUMES AND BASE REVENUES - 12
MONTHS ENDING SEPTEMBER 30, 2011 AT CURRENT RATES BY
BILLING DETERMINANT," and was this document prepared
under the Forecasting Panel’s supervision and
direction?
Yes, it was.
MARK FOR IDENTIFICATION AS EXHIBIT (FP-3)
-23-
FORECASTING PANEL - GAS
1
2
3
4
5
6
7
8
9
10
11
12
13
14
15
16
17
18
19
20
21
22
23
24
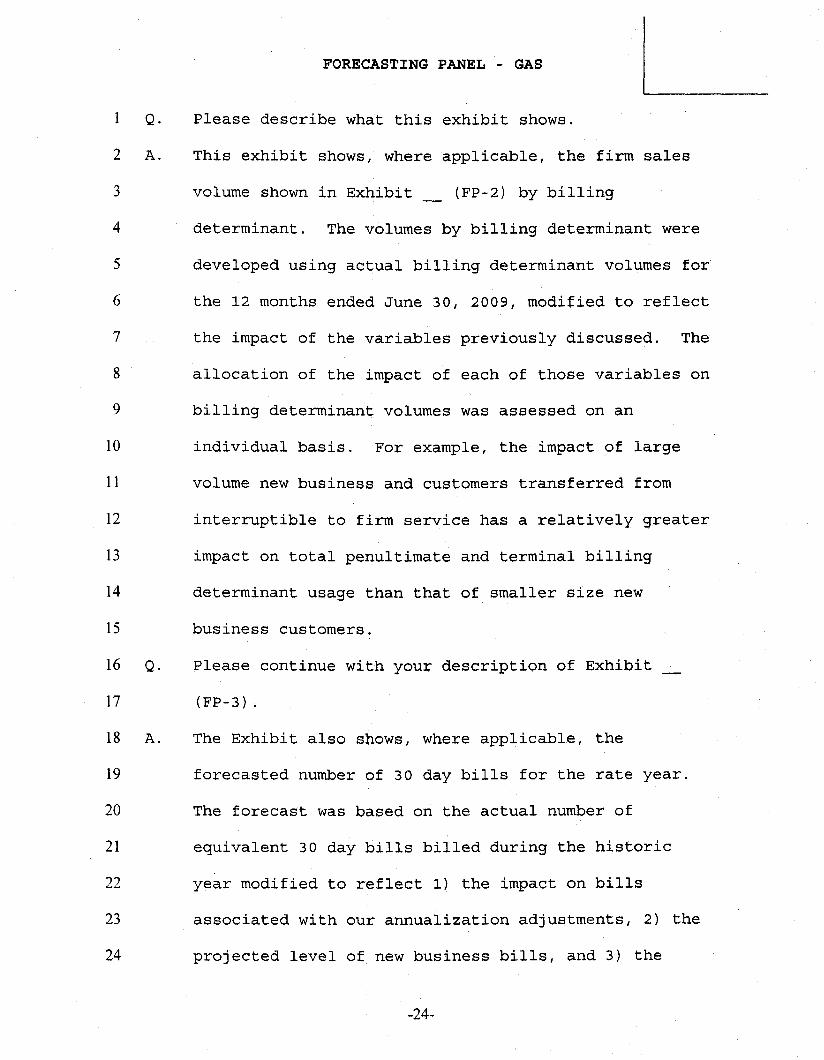
Please describe what this exhibit shows.
This exhibit shows, where applicable, the firm sales
volume shown in Exhibit (FP-2) by billing
determinant. The volumes by billing determinant were
developed using actual billing determinant volumes for
the 12 months ended June 30, 2009, modified to reflect
the impact of the variables previously discussed. The
allocation of the impact of each of those variables on
billing determinant volumes was assessed on an
individual basis. For example, the impact of large
volume new business and customers transferred from
interruptible to firm service has a relatively greater
impact on total penultimate and terminal billing
determinant usage than that of smaller size new
business customers.
Please continue with your description of Exhibit
(FP-3) .
The Exhibit also shows, where applicable, the
forecasted number of 30 day bills for the rate year.
The forecast was based on the actual number of
equivalent 30 day bills billed during the historic
year modified to reflect I) the impact on bills
associated with our annualization adjustments, 2) the
projected level of new business bills, and 3) the
-24-

FORECASTING PANEL - GAS
1
2
3
4
5
6
7
8
9
10
11
12
13
14
15
16
17
18
19
20
21
22
23
24
impact related to the rate year having fewer billing
days that the historic year.
The Exhibit shows, where applicable, the current
minimum charge rates and unit charge rates and
resultant revenue forecast computed by applying the
rates to the projected levels of 30 day bills and
usage by billing determinant.
The Exhiblt further details the volumes and revenues
shown on Exhibit (FP-3) into separately prlced
segments. For example, projected sales, bills and
base revenues associated with customers who received
Low Income and Economic Development Zone rates are
separately shown.
In the development of the rate year forecast, did the
Forecasting Panel also make projections of delivery
volumes and revenues beyond the rate year?
Yes, since the Company is also proposing a three-year
rate plan, as discussed by Company witness Muccilo,
the Forecasting Panel has also estimated volumes and
revenues for the 12 months ending September 30, 2012
and the 12 months ending September 30, 2013. Those
projections were provided to the Accounting Panel.
These forecasts reflect an average annual growth rate
of 1.5% percent per year over the rate year.
-25-

FORECASTING PANEL - GAS
1
2
3
4
5
6
7
8
9
10
11
12
13
14
15
16
17
18
19
20
21
22
23
Oo
Ao
Oo
What variables did the Forecasting Panel consider in
the development of these extended forecasts?
New business, employment, conservation and attrition,
anticipated rate relief and its impact on prices and
sales as well the impact on sales due to the
differences in future billing schedules.
Is the Company proposing the continuation of the
Weather Normalization Clause (~WNC") and the Revenue
Decoupling Mechanism (~RDM")?
Yes, the WNC serves the interests of both the customer
and the Company by correcting for abnormal weather on
a real time basis. The WNC complements the RDM in
that it acts to mitigate the size of any potential
charges or credits that customers may pay or receive
on a lagged basis under the RDM.
The Company’s gas department currently utilizes a
Revenue Per Customer ("RPC") form of a RDM, which
encourages the Company to grow the gas business to the
benefit of both the ratepayer and the Company, while
also encouraging conservation. The RPC form of a RDM
should be continued.
Does this conclude the Forecasting Panel’s testimony?
Yes, it does.
-26-

CONSOLIDATED EDISON COMPANY OF NEW YORK, INC.
DEVELOPMENT OF 12 MONTHS ENDING SEPTEMBER 30,2011FORECASTED FIRM GAS DELIVERY VOLUMES (Mdt’s)
Line No
123
456
789
Description SC 1 SC 2 NHt SC 2Ht SC 3 SC 13 SC 14 Total
Historic Test Year Volumes*Weather NormalizationWeather Normalized Volumes
4,685 19,653 30,146 61,564 90 12 116,150(877) (2,360) (3,237)
4,685 19,653 29,269 59,204 90 12 112,913
Annualization AdjustmentsLarge Volume Customers 24 21 I0 55Transfer from Interuptible to Firm 564 1,561 2,125Total 4,685 19,677 29,854 60,775 90 12 115,093
Water Normalization 51 112 163Billing Schedule Adjustments (24) (83) (66) (84) (257)
Base Estimate 4,712 19,706 29,788 60,691 90 12 114,999
i0 Small Volume New Businessii Large Volume New Business12 Distributed Generation13 Transfers from Firm to Interuptible14 Conservation & Attrition
15 Employment16 Price Elasticity
17
(53)
193 362 1,369 1,924396 343 191 930276 2,992 3,268
(1,403) (1,403)(474) (711) (1,218) (2,456)(204) (220) (424)
(93) (173) (140) (406)
Forecasted Firm Delivery Volumes12 Months Ending 9/30/2011 4,659 19,800 32,381 59,490 90 12 116,432
* 12 months ended June 30, 2009
EXHIBIT_(FP-1)

CONSOLIDATED EDISON COMPANY OF NEW YORK, INC.
FORECASTED GAS DELIVERY VOLUMES A~D REVENUES -12 MONTHS ENDING SEPTF~MBER 30, 2011AT CURRENT AND PROPOSED RATES
REVENUES IN $1000’s
GasDelivery Base Increases in Billing Process PSL 18a Other Gas Cost Increase in Total Revenue @ Total Proposed Total Revenue
Rates & & Payment Charges Factor Rates & Current Rates Base Rate @ ProposedVolumes RevenueCharges Charges
AssessmentCharges Increase Rates
(NUTS}
Line NO Service Classificiation (Column 1) (Colum~ 2) (Colum~ 3) (Column 4) (Column 5) (Column 6) (Coltum% 7) (Column 8) (Column 9) (Column I0) (Column 11)
1 SC 1 - Residential & Religious 4,659 $146,737 $7 048 $3,866 $3,663 $2,726 $27~399 $1,075 $192,515
SC 2 - General, Commerical and2 Industrial (Non-Heating) 19.800 $82.154 $2 300 $362 $5,021 $7,655 $71,959 $2,036 $171,486
SC 2 - General, Commerical and3 Industrial (Beating) 32,381 $135,498 $2,511 $366 $i0,036 $16,092 $193,057 $4,612 $362,171
SC 3 - Resideu%tial and Religious4 (Heating) 59,490 $350,506 $15,217 $i,625 $19,926 $27,391 $302,149 $8,109 $724,923
5 SC 13 - Seasonal Off Peak water Heating
6 SC 14 - Natural Gas Vehicles
90 S295 Sl0 SO $26 $62 $739 $14 $1,147
12 S199 S6 SO $0 $0 $0 $0 $205
7 Total Firm Delivery 116,432 S715,389 $27,091 $6,219 $38°672 $53,926 $595,303 $15°846 $1,452,447 $160,822 $1,613,269
8 SC 12 R1 - Non Firm 9.144 S45,174 $567 SO $3,056 $0 $0 $63 $48,860
9 SC 12 R2 - Off Peak Firm 14,437 $23,697 5240 SO $4,827 $0 $0 $99 $28,864
10 Total Interruptible 23,581 $68,871 $808 $0 $7,883 $0 $0 $162 $77,723 $77,723
ii Total Sysnem 1400013 $784,260 S27,899 $6,219 $46,555 $53,926 $595,303 $16,008 $i,530,170 $160,822 $1,690,992
EXHIBIT_(FP-2)

CONSOLIDATED EDISON COMPANY OF NEW YORK, INC.Forecasted Gas Delivery Volumes and Ease Revenues. 12 Months Ending September 38, 2011 at Current Rates by Billing Determinants
Bills & Therms
Summary of VolumesService Classification 1 Volumes (Therms)Service Classification 2 Non-Heating Volumes (Therms)Service Classification 2 Heating Volumes (Therms)Service Classification 2 - DG VolumesSe..rvice Classification 2 - Contract VolumesService Classification 3 Volumes (Therms)Service Classification 13 Volumes/Therms)Service Classification 14 Volumes (Therm~)Total Annual Volumes (Therms)
Service Classification 1Annual Bills 7.027,816Therms 0-3 13,822,885Therms >3 27,767,115Total Annual Volumes (Therms) 41,590,000Service Classification 1 - Low IncomeAnnual Bills 860,173Therms 0-3 1,998,712Therms >3 3,001,288Total Annual Volumes (Therms) 5,000,000Service Claas fication 2 Heat ngAnnual Bills 746. 063Therms 0-3 2,083,712Therms 3-90 41.932,708Therms 90-3000 164,656,290Therms >3000 73,137,575 iTotal Annual Volumes (Therms) 281,810~285Service Classification 2 Heating - Air ConditioningTherms 0-1200 196.097Then~as >1200 1,833,903Total Annual Volumes (Therms) 2,030,000Service Classification 2 Heating - Economic Development ZoneAnnual Bi#s 1,070 ’Therms 0-3 2,571Therms 3-90 59,153Therms 90-250 84,385Therms 250-3000 515,723Therms >3000 838,168Total Annual Volumes (Therms) 1,500,000Service Classification 2 Non-HeatingAnnual Biffs 737,910 ’Therms 0-3 2,072,417Therms 3-90 30,841,150Therms 90-3000 106,030,728Therms >3000 30,785,705 iTotal Annual Volumes (Therms)Service Classification 2 Non-Heating - Air ConditioningTherms 0-1200 104,307T_herms >1200 1,985,693Total Annual Volumes (Therms) 2,090,000Service Classification 2 Non-Heating - Economic Development ZoneAnnual Bills 1 45’Therms 0-3 425The~ls 3-90 12,298Therms 90-250 20,960Therms 250-3000 254,030Therms >3000 802,287Total Annual Volumes (Therms) 1.090,000Service Classification 3 (1 to 4 Housing Units)Annual Biffs 3,031,102Therms 0-3 9,015,234Therms 3-90 155,681,007Therms 90-3000 139,870,703Therms >3000 703,056Total Annual Volumes (Therms) 305,270,000Service Classification 3 (1 to 4 Housing Ueite) - Low IncomeAnnual BillsTherms 0-3Therms 3-90Therms 90-3000Therms >3000Total Annual Volumes (Therms)Service Classification 3 (More than 4 Housing Units)Annual Bills 182, 782Therms 0-3 533,150Therms 3-90 14,371,631Therms 90-3000 140,262,843~ 126,639,876Total Annual Volumes (ThelTns) 281,807,500Service Classification 3 (More than 4 Housing Units) - Low incomeAnnual Bills 109Therms 0-3 331Therms 3-90 7,670Therms 90-3000 12,898Therms >3000Total Annual Volumes (Therms) 20,899Service Classification 3 (More than 4 Housing Units) - Air Conditio~lingTherrns 0-1200 40,846Therms >1200 169,154Total Annual Volumes (Therms) 210,000Service Classification 13Annual Biffs 3, 828Therms 0-3 8,477Therms3-1200 550,344Therms >1200 341,179Total Annual Volumes (Therms) 900.000Service Classification 2 - Commercial Distributed GenerationTotal Annual Volumes (Therms) 47.650,000_Service Classification 2 - Contract SalesTotal Annual Volumes (Therms) 15,920,000_Service Classification 14Total Annual Volumes (Therms) 120,000=
Volume46.590,000
172,910,000285,340,28547,650,00015,920,000
594,898,399900,OOO
120,00--01,164,328,684
Unit Rate ! Base Revenue ($)
$ 15.28
$ 0,8716
$ 15.28
$ 0.6687
107,385,028.48
24,201,817.37131,586,845.85
2,006,961 0615,150,404.50
$ 0.6074 25,469,926.67$ 0.4267 70,258,839.04$ 0.2901 21,217,210.64
131,912,004.50
0r1942 38,081.960.1662 304,794.75
342,876.70
$ 20.06 21,464.20
$ 0.6074 35,929.25$ 0.4267 36,007.19$ 0.2817 145,279.28$ 0.1451 121,618.21
360.298.13
$ 20.05 14.795,101.85
$ 0.5971 18,415,250.41$ 0.3579 37,948,397.50$ 0.2465 7,588,676.37
78,747,4261~
$ 0.1942 20,256,34$ 0.1662 330,02224
350,278.58
$ 20.05 2,907.25
0.5971 7,343.170.3579 7,501.620.2347 59.620.770.1233 98,921.96
176,294.77
$ 15.38 46,618,353.87
$ 0.6379 99,308,91454$ 0.4851 67,851,278.15$ 0.4062 285,58146
214,064,128.02
103,444 $ 15.28240,821
4,193,989 $ 0.43503,133,425 $ 0.4851
21,765 $ 0.40627,590,000
15.38
$ 0.6379$ 0.4851$ 0.4062
$ 1528
$ 0.435O$ 0.4851$ 0.4062
$ 0.1942$ 0.1662
$ 34.37
$ 0 1942$ 0,1662
$ 1.6583
1,580,624.32
1,824,385.071,520,02456
8,840.914,933,874.86
2,811,18802
9,167,663.4868,041.505.00
1,665.52
3,336.416,256.82
11,258.75
7,932,29
36,045.69
131,55836
106,876 8856,703.88
295,149.11
4,485,296
1.277,249
196,998
Base Revenue ($)146.737,250.3579,273,999.48
132,615,179,334,485,296.081,277,248.80
350,506,781.42
198,998.40715~389,902.98
Exhibit_(FP-3)