Embed Size (px)
Citation preview
Presented by:
Mike Hermanson Water Resources Specialist
Spokane County Utilities
Exempt Well Conference
May 17, 2011
Forecasting Exempt Well Demand in Spokane County
Forecasting Exempt Well Demand in Spokane County
Background
• Spokane County Water Demand Forecast Model Project Completed in January 2011
• Model included all water use sectors including self supplied residential, or exempt wells
County Forecast
PublicSupply
Self Supply Residential
Self Supply
IndustryAgricultural
CommercialIndustrial
UrbanIrrigation
Public-SupplyAgriculture
Single Family
Multi-Family
Non RevenueWater
Residence& Yard
SmallAgriculture
ThermoelectricPower
Golf Courses
Large Industry
Livestock
IrrigatedAcres
Forecasting Exempt Well Demand in Spokane County
• 4 objectives for Exempt Well Water Use Model – Inventory and forecast for sub-areas – Seasonal aspects of use – Identify and incorporate factors that influence water
use – Model differences between geographic areas of the
county
• Two primary aspect to the model – The number of demand units – Residences – Water use per residence
Inventory & Forecasting Approach

Forecasting Exempt Well Demand in Spokane County
• Separated into forecast units – rural areas based on watershed boundaries
• Data from: – Spokane Regional
Transportation Council forecast &
– Spokane County Assessor
– US Census
Inventory & Forecasting Approach
Quantity of Demand Units
Forecasting Exempt Well Demand in Spokane County
Inventory & Forecasting Approach
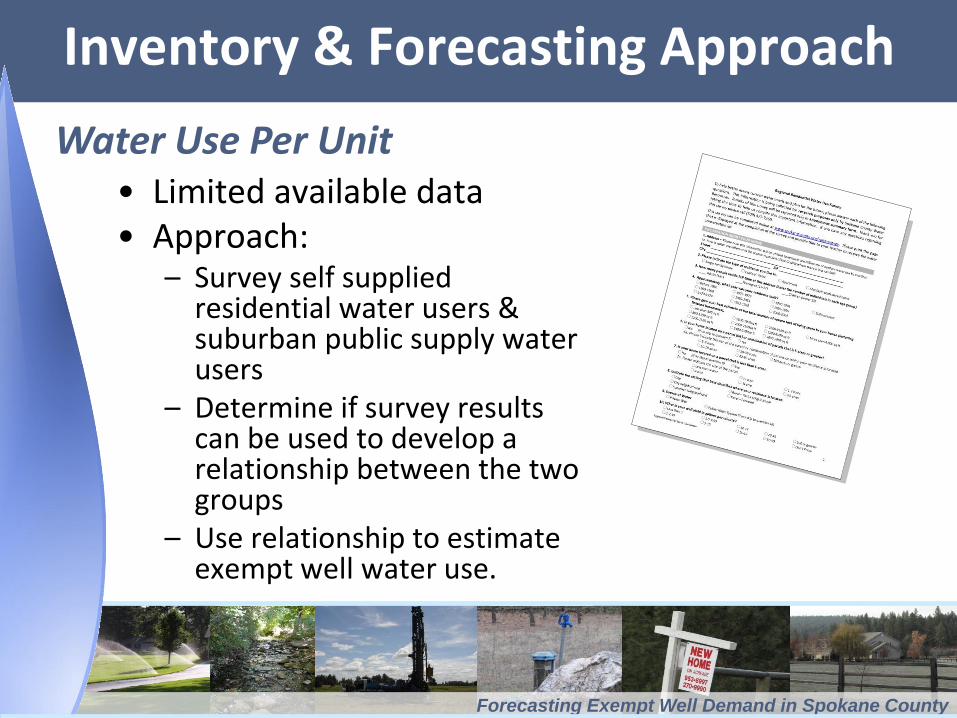
• Limited available data • Approach:
– Survey self supplied residential water users & suburban public supply water users
– Determine if survey results can be used to develop a relationship between the two groups
– Use relationship to estimate exempt well water use.
Water Use Per Unit
Forecasting Exempt Well Demand in Spokane County
Inventory & Forecast Approach
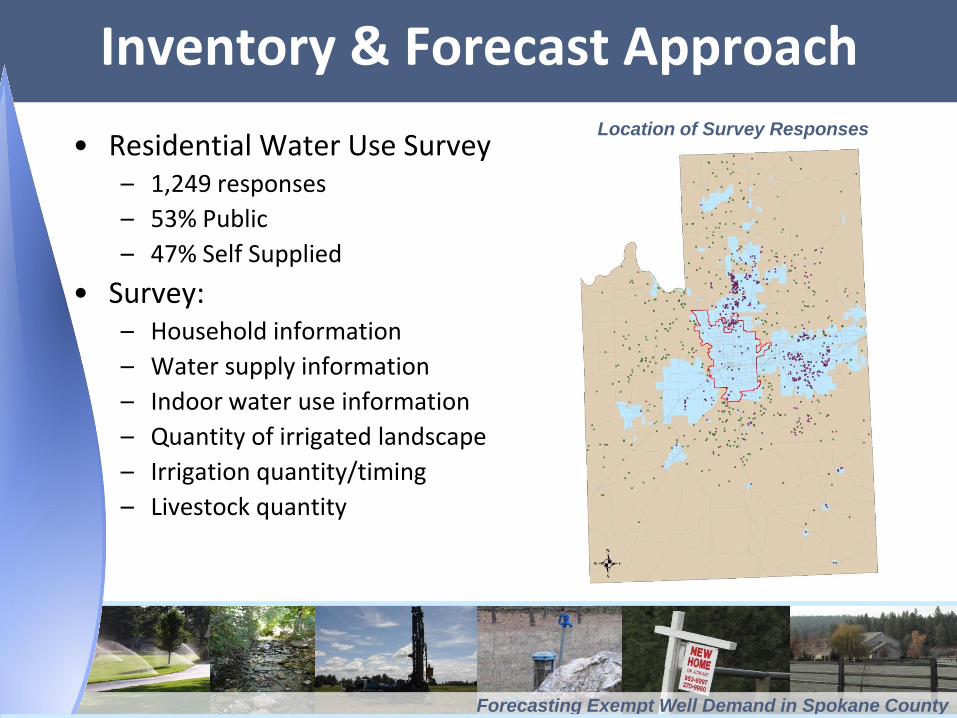
• Residential Water Use Survey – 1,249 responses
– 53% Public
– 47% Self Supplied
• Survey: – Household information
– Water supply information
– Indoor water use information
– Quantity of irrigated landscape
– Irrigation quantity/timing
– Livestock quantity
Location of Survey Responses
Forecasting Exempt Well Demand in Spokane County
Inventory & Forecast Approach
• Survey Results & Statistical Analysis:
– Indoor water use was not significantly different between self supplied and public supplied residences.
– There is not a significant difference in the amount of irrigated landscape between self supplied and public supplied residences – 8,000 sq ft.
– The average watering time per week was not significantly different.
– Self supplied residences with a well yield 5 gpm and below have on average 50% less irrigated landscape.
– Self supplied residences located in forested areas have on average 25% less irrigated landscape.
– 20% of self supplied residences have at least one livestock
Forecasting Exempt Well Demand in Spokane County
• Determined that using the public supplied residential model with correction factors for limited water availability areas and forested areas is appropriate
Inventory & Forecast Approach
Forecasting Exempt Well Demand in Spokane County
Demand Forecast Model
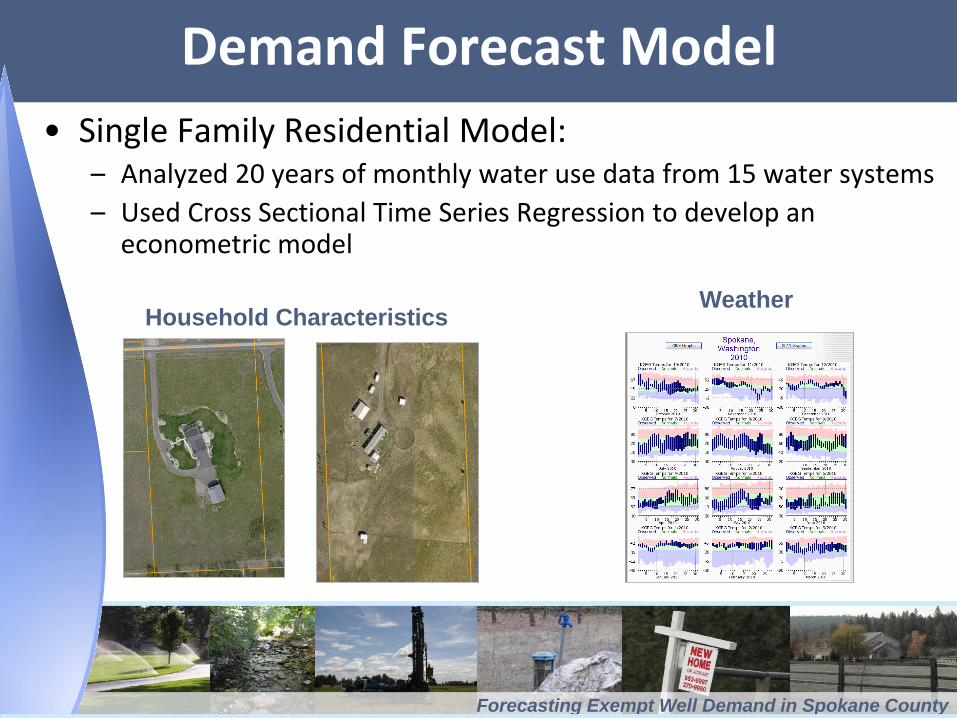
• Single Family Residential Model: – Analyzed 20 years of monthly water use data from 15 water systems
– Used Cross Sectional Time Series Regression to develop an econometric model
Household Characteristics Weather
Forecasting Exempt Well Demand in Spokane County
Demand Forecast Model
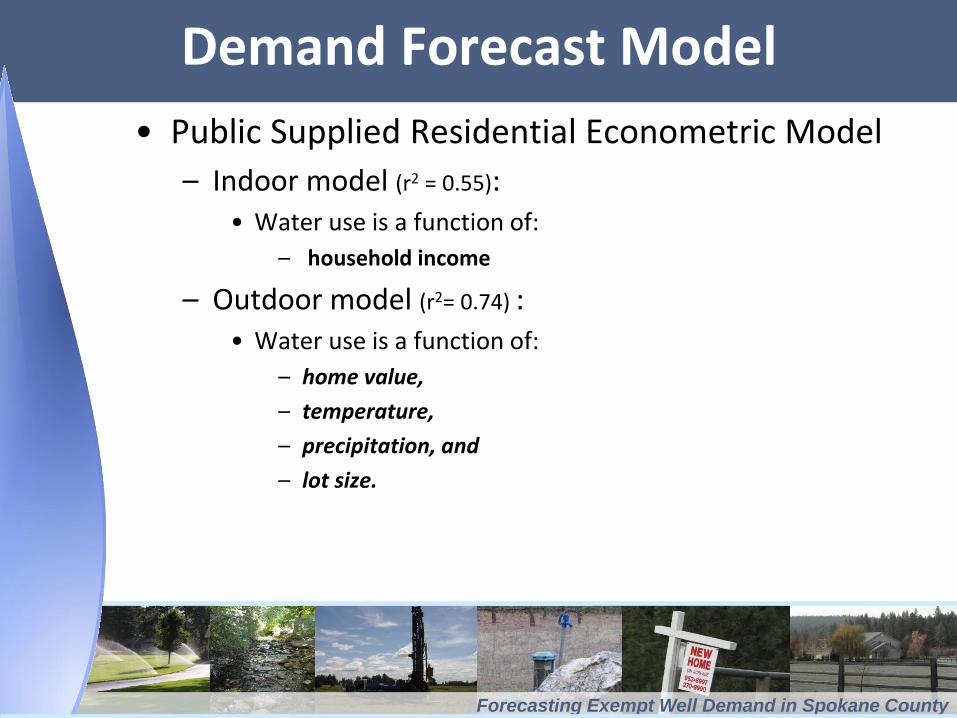
• Public Supplied Residential Econometric Model
– Indoor model (r2 = 0.55): • Water use is a function of:
– household income
– Outdoor model (r2= 0.74) : • Water use is a function of:
– home value,
– temperature,
– precipitation, and
– lot size.
Forecasting Exempt Well Demand in Spokane County
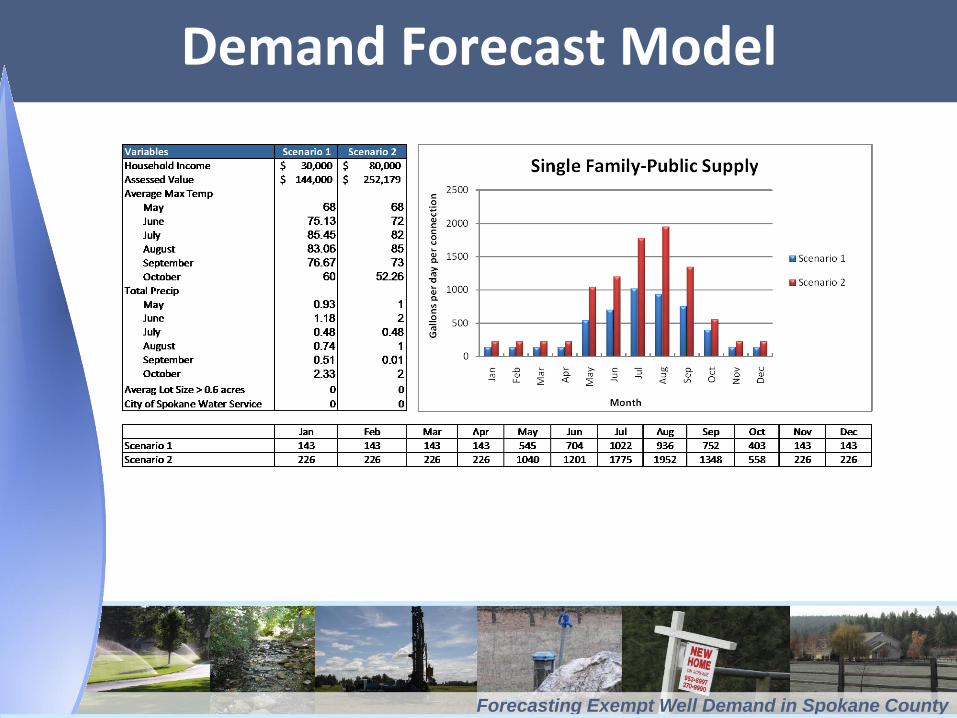
Demand Forecast Model
Forecasting Exempt Well Demand in Spokane County
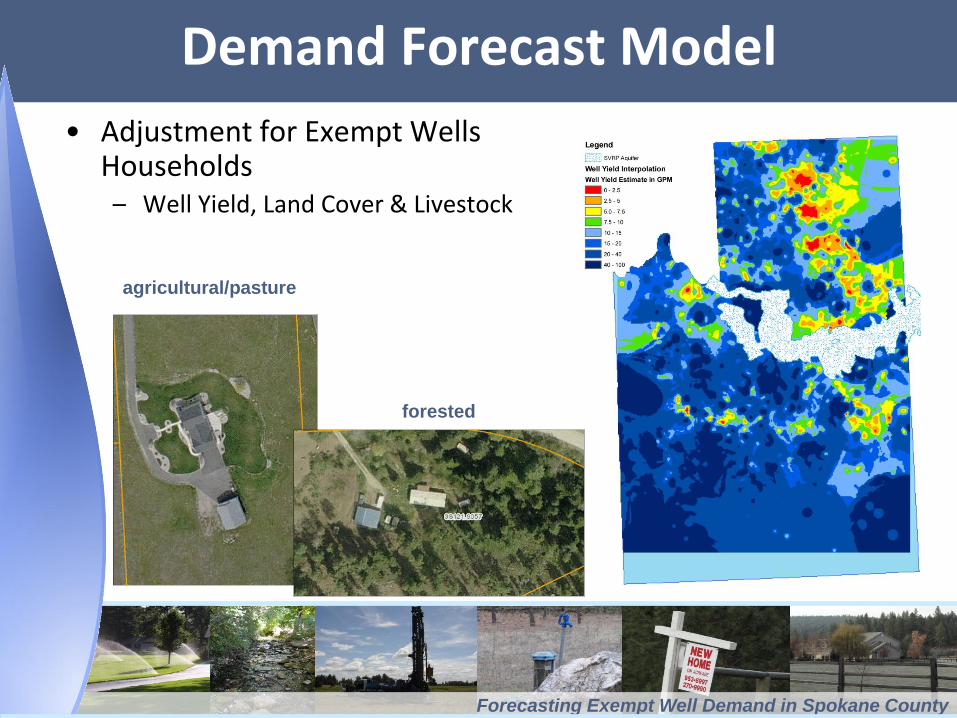
• Adjustment for Exempt Wells Households – Well Yield, Land Cover & Livestock
Demand Forecast Model
agricultural/pasture
forested
Forecasting Exempt Well Demand in Spokane County
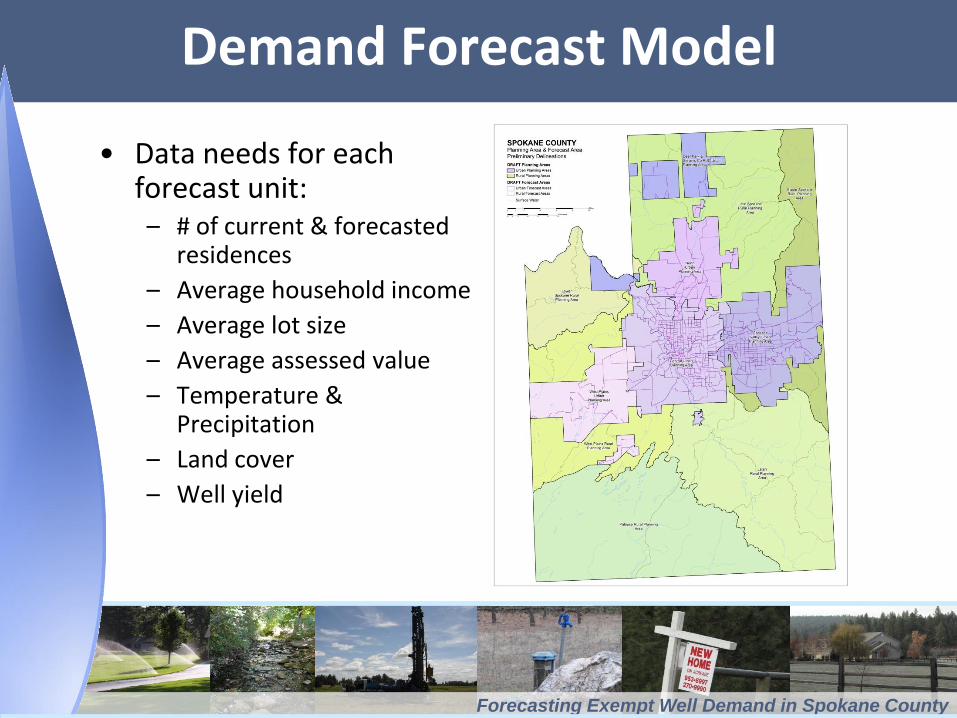
Demand Forecast Model
• Data needs for each forecast unit: – # of current & forecasted
residences
– Average household income
– Average lot size
– Average assessed value
– Temperature & Precipitation
– Land cover
– Well yield
Forecasting Exempt Well Demand in Spokane County
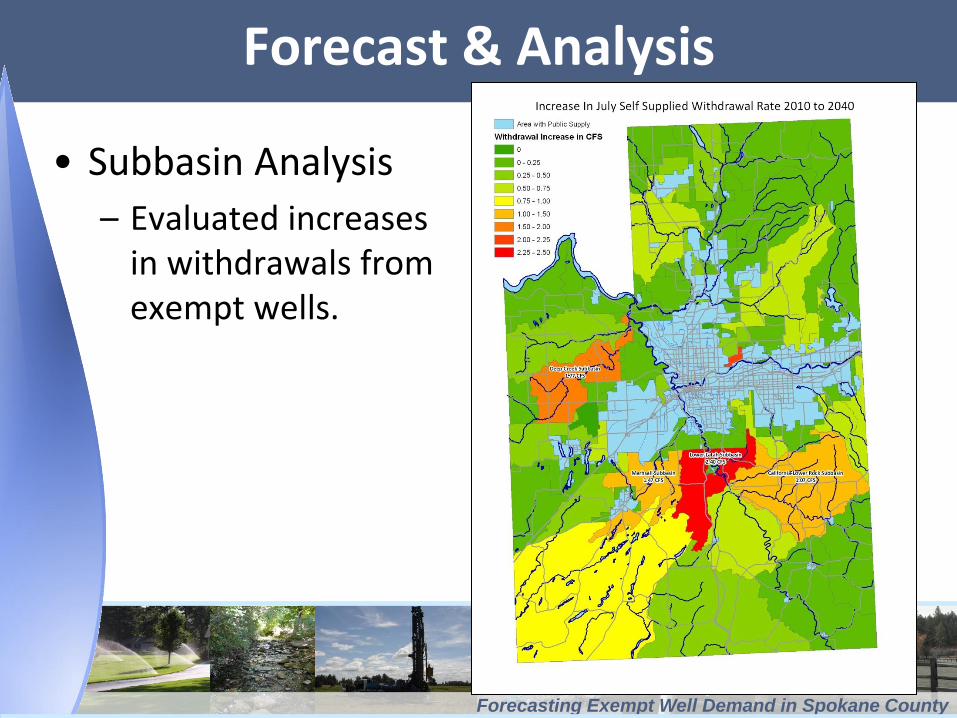
Forecast & Analysis
• Subbasin Analysis
– Evaluated increases in withdrawals from exempt wells.
Forecasting Exempt Well Demand in Spokane County
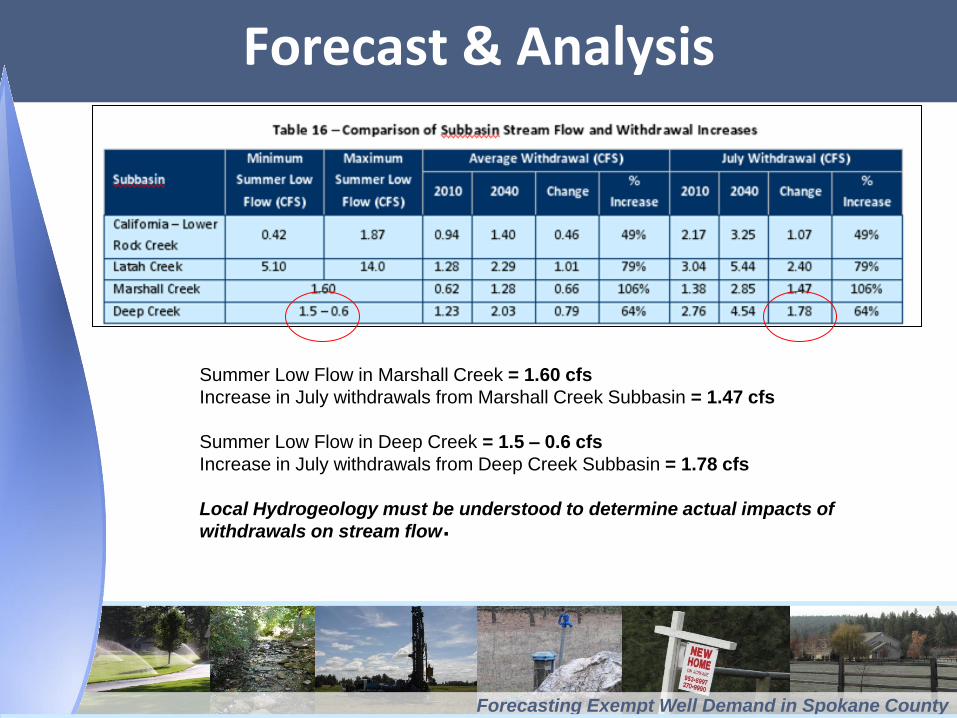
Forecast & Analysis
Summer Low Flow in Marshall Creek = 1.60 cfs
Increase in July withdrawals from Marshall Creek Subbasin = 1.47 cfs
Summer Low Flow in Deep Creek = 1.5 – 0.6 cfs
Increase in July withdrawals from Deep Creek Subbasin = 1.78 cfs
Local Hydrogeology must be understood to determine actual impacts of
withdrawals on stream flow .

Forecasting Exempt Well Demand in Spokane County
• For more information
– www.spokanecounty.org – Spokane County>Water Resources>Projects>Water Demand Forecast Model