Embed Size (px)
Citation preview
Earthquake prediction
Prediction: specifies that an earthquake of a specific magnitude will occur in a defined region during a
particular time period:
“There will be a M 7 or larger earthquake in southern California in March of 2015”
Forecast: provides a probability of the above, usually over 10 to 100 year timescales
“21% chance of a M 6.5 to M 7 earthquake on the San Andreas Fault in the next thirty years”
“62% chance of a M 6.5 or greater earthquake in the San Francisco Bay Area in the next thirty years”
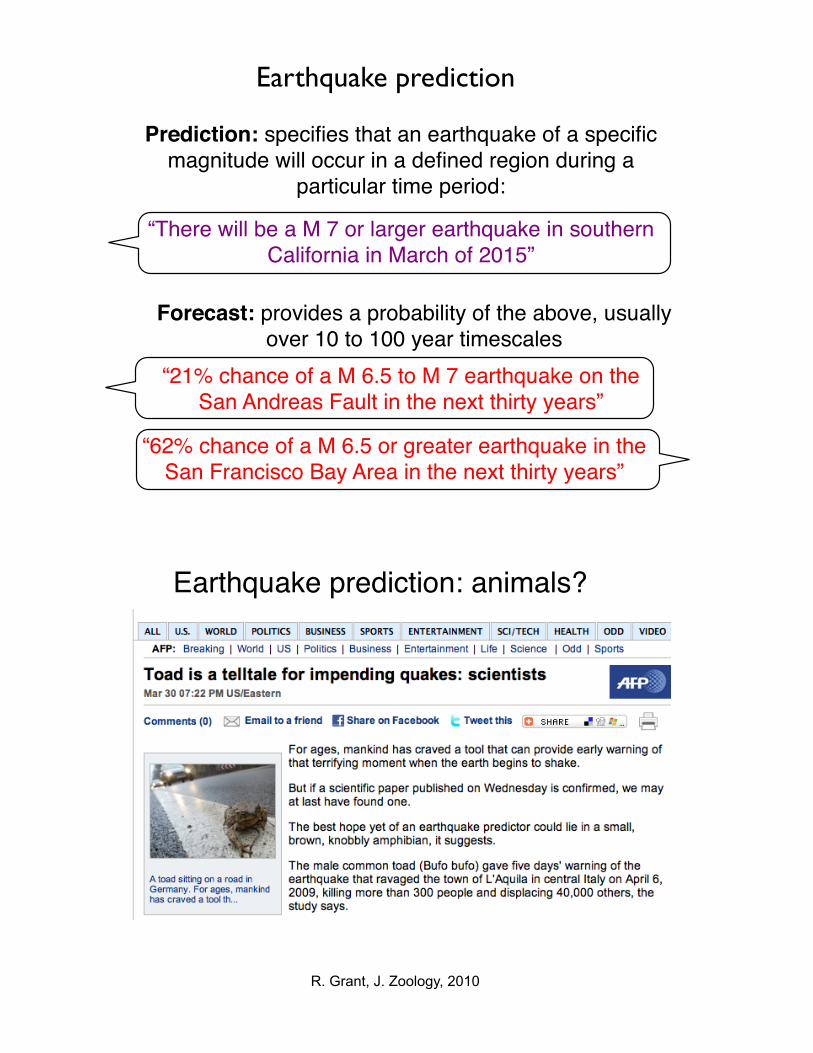
R. Grant, J. Zoology, 2010
Earthquake prediction: animals?
Earthquake prediction: animals?
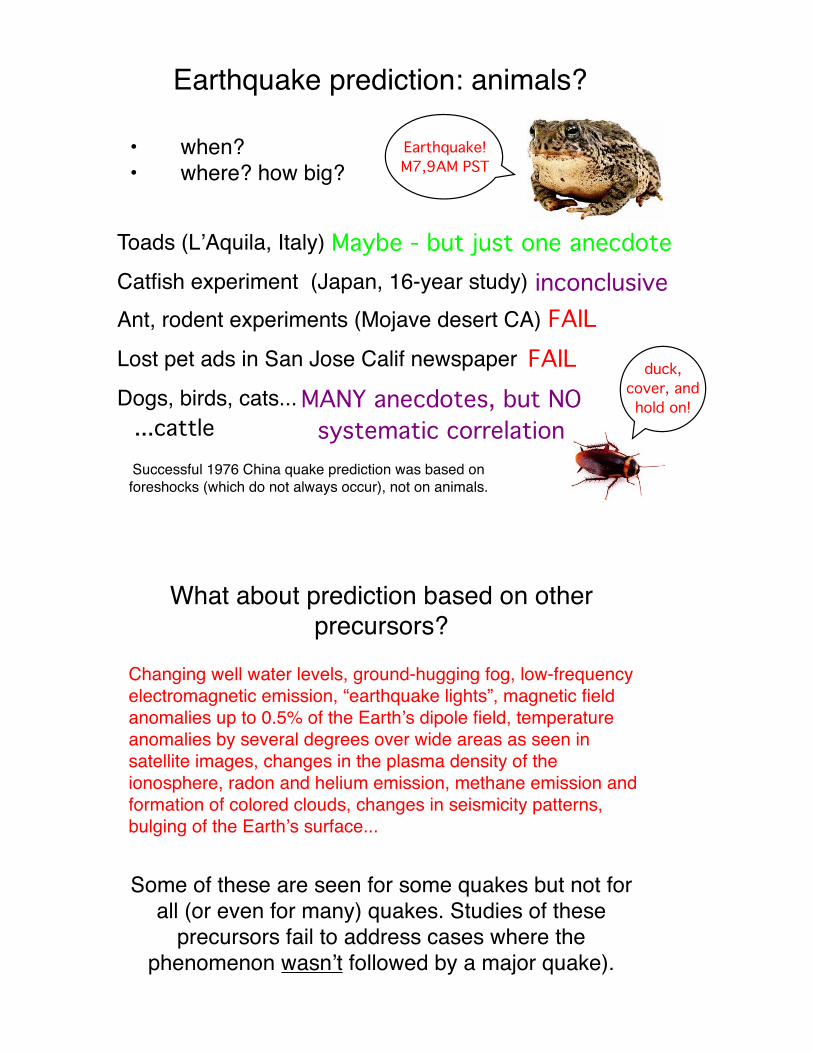
•! when?•! where? how big?
Toads (LʼAquila, Italy)
Catfish experiment (Japan, 16-year study)Ant, rodent experiments (Mojave desert CA)
Lost pet ads in San Jose Calif newspaper
Dogs, birds, cats...
Earthquake!M7,9AM PST
Successful 1976 China quake prediction was based on foreshocks (which do not always occur), not on animals.
duck, cover, and hold on!
Maybe - but just one anecdote
MANY anecdotes, but NO systematic correlation
inconclusiveFAIL
FAIL
...cattle
What about prediction based on other precursors?
Changing well water levels, ground-hugging fog, low-frequency electromagnetic emission, “earthquake lights”, magnetic field anomalies up to 0.5% of the Earthʼs dipole field, temperature anomalies by several degrees over wide areas as seen in satellite images, changes in the plasma density of the ionosphere, radon and helium emission, methane emission and formation of colored clouds, changes in seismicity patterns, bulging of the Earthʼs surface...
Some of these are seen for some quakes but not for all (or even for many) quakes. Studies of these
precursors fail to address cases where the phenomenon wasnʼt followed by a major quake).

Most earthquake forecasting is based on statistics of past earthquakes (how often, magnitude, how
regular, when was the last one...)In western Canada we know something about:
• The Queen Charlotte Fault
• The Cascadia Subduction zone Fault
In other BC regions we must use seismicity catalogues and the Gutenberg-Richter relationship, together with assumptions about the maximum earthquake size, to
forecast probability of damaging earthquakes.
Southwest BC: Our local dangerous fault zones
Queen Charlotte Fault M 8
Cascadia Subduction Zone Fault M 9.?
Faults in the subducting slab M < 7?
Shallow crustal faults M < 8
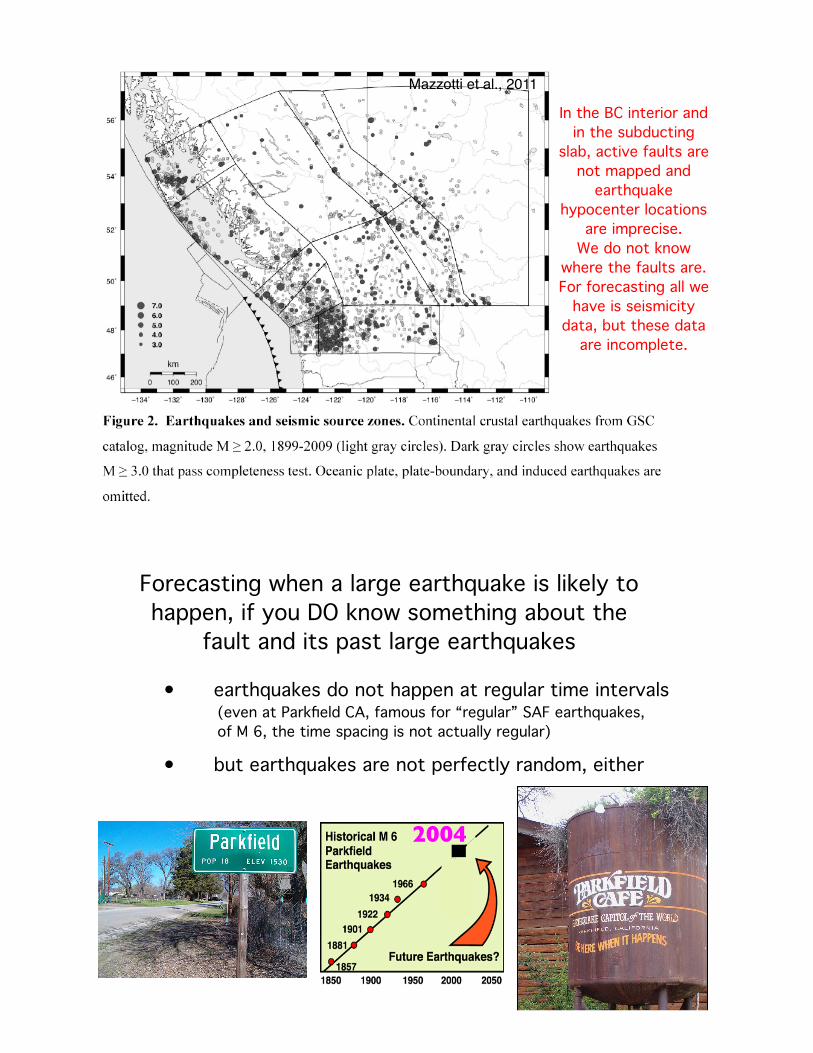
Mazzotti et al., 2011
In the BC interior and in the subducting
slab, active faults are not mapped and
earthquake hypocenter locations
are imprecise. We do not know
where the faults are. For forecasting all we
have is seismicity data, but these data
are incomplete.
Forecasting when a large earthquake is likely to happen, if you DO know something about the
fault and its past large earthquakes
•! earthquakes do not happen at regular time intervals(even at Parkfield CA, famous for “regular” SAF earthquakes, of M 6, the time spacing is not actually regular)
2004
•! but earthquakes are not perfectly random, either

Say all we know is an average recurrence interval. We have no clue how regular or random the large quakes are. In this case, the estimated probability is constant.
“Conventional Forecast”
Example: a fault has earthquakes on average every 150 years. That means that each year, there is a 1 in 150 chance of an earthquake. In 30 years, there is a 30 in 150, or 20% chance.
Queen Charlotte Fault: average recurrence interval for M 8 earthquakes is “about every 100 years, as little as 50, as much as 200”.
Thus, conventional forecast is about a 1% chance per year, or a 10% chance per decade (30% in 30 years).
“Conventional Forecast”
(this is for the North Anatolian Fault in Turkey)
QCF
• mean recurrence interval• standard deviation of the recurrence interval• time since the last large earthquake
Elastic stress on the fault increases gradually, so the chance of a big earthquake grows with time.
In this case the probability in 1900 was “30% in the next 30 years” but the probability in 2000 was “48% in the next 30 years”
We have renewal forecasts for the Casadia Subduction Zone fault.
We need to know:
Renewal forecast
(this is for the North Anatolian Fault in Turkey)
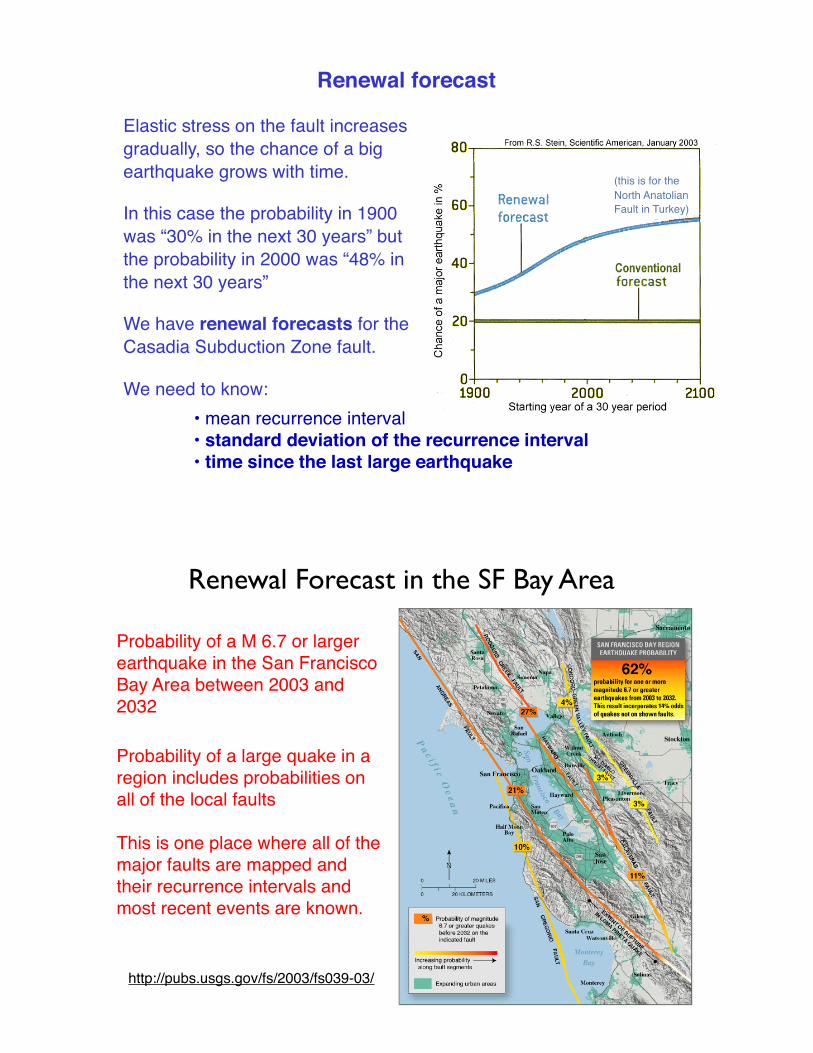
http://pubs.usgs.gov/fs/2003/fs039-03/
Probability of a large quake in a region includes probabilities on all of the local faults
This is one place where all of the major faults are mapped and their recurrence intervals and most recent events are known.
Renewal Forecast in the SF Bay Area
Probability of a M 6.7 or larger earthquake in the San Francisco Bay Area between 2003 and 2032
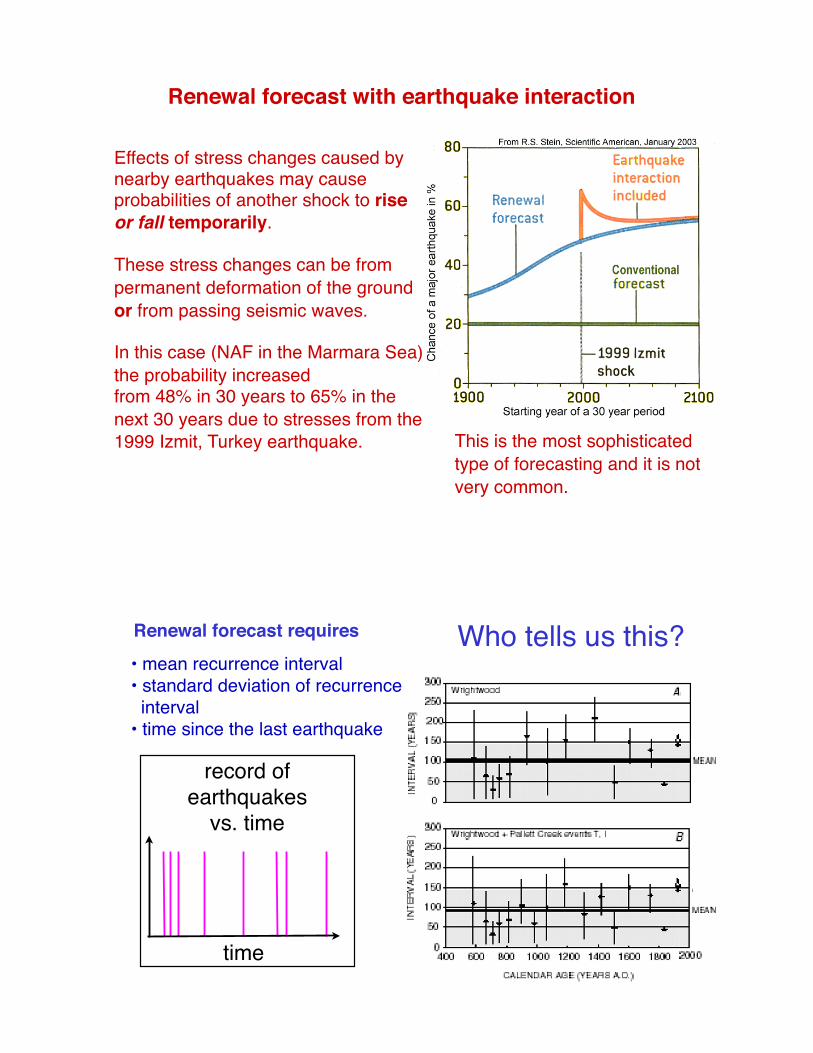
Effects of stress changes caused by nearby earthquakes may cause probabilities of another shock to rise or fall temporarily.
These stress changes can be from permanent deformation of the ground or from passing seismic waves.
In this case (NAF in the Marmara Sea) the probability increasedfrom 48% in 30 years to 65% in the next 30 years due to stresses from the 1999 Izmit, Turkey earthquake. This is the most sophisticated
type of forecasting and it is not very common.
Renewal forecast with earthquake interaction
Renewal forecast requires
time
record of earthquakes
vs. time
Who tells us this? • mean recurrence interval• standard deviation of recurrence interval• time since the last earthquake

Geologists.
Trenching across active faults, dating
offset former ground surfaces and
getting a time history of large
earthquakes
Signs of prehistoric earthquakes along the SAF: many trenches
19061700-1800 AD
1200-1400 AD
600-800 AD
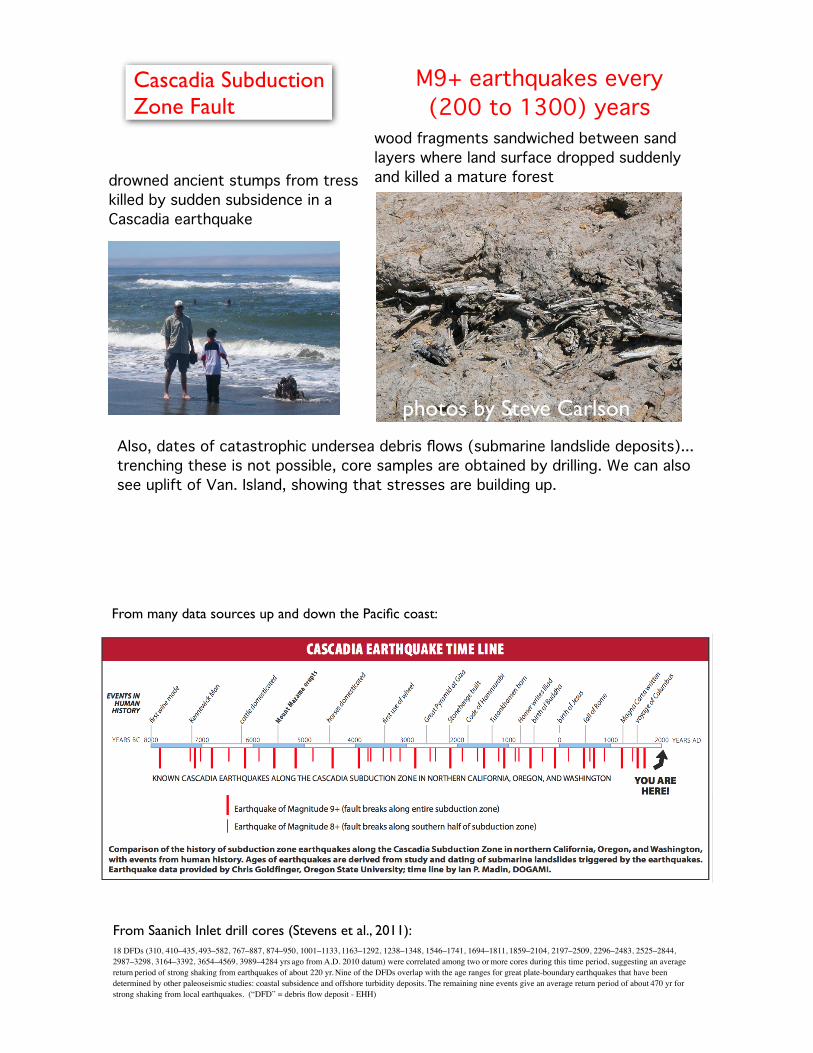
wood fragments sandwiched between sand layers where land surface dropped suddenly and killed a mature forest
photos by Steve Carlson
drowned ancient stumps from tress killed by sudden subsidence in a Cascadia earthquake
M9+ earthquakes every (200 to 1300) years
Also, dates of catastrophic undersea debris flows (submarine landslide deposits)... trenching these is not possible, core samples are obtained by drilling. We can also see uplift of Van. Island, showing that stresses are building up.
Cascadia Subduction Zone Fault
18 DFDs (310, 410–435, 493–582, 767–887, 874–950, 1001–1133, 1163–1292, 1238–1348, 1546–1741, 1694–1811, 1859–2104, 2197–2509, 2296–2483, 2525–2844, 2987–3298, 3164–3392, 3654–4569, 3989–4284!yrs ago from A.D.!2010 datum) were correlated among two or more cores during this time period, suggesting an average return period of strong shaking from earthquakes of about 220!yr. Nine of the DFDs overlap with the age ranges for great plate-boundary earthquakes that have been determined by other paleoseismic studies: coastal subsidence and offshore turbidity deposits. The remaining nine events give an average return period of about 470!yr for strong shaking from local earthquakes. (“DFD” = debris flow deposit - EHH)
From Saanich Inlet drill cores (Stevens et al., 2011):
From many data sources up and down the Pacific coast:
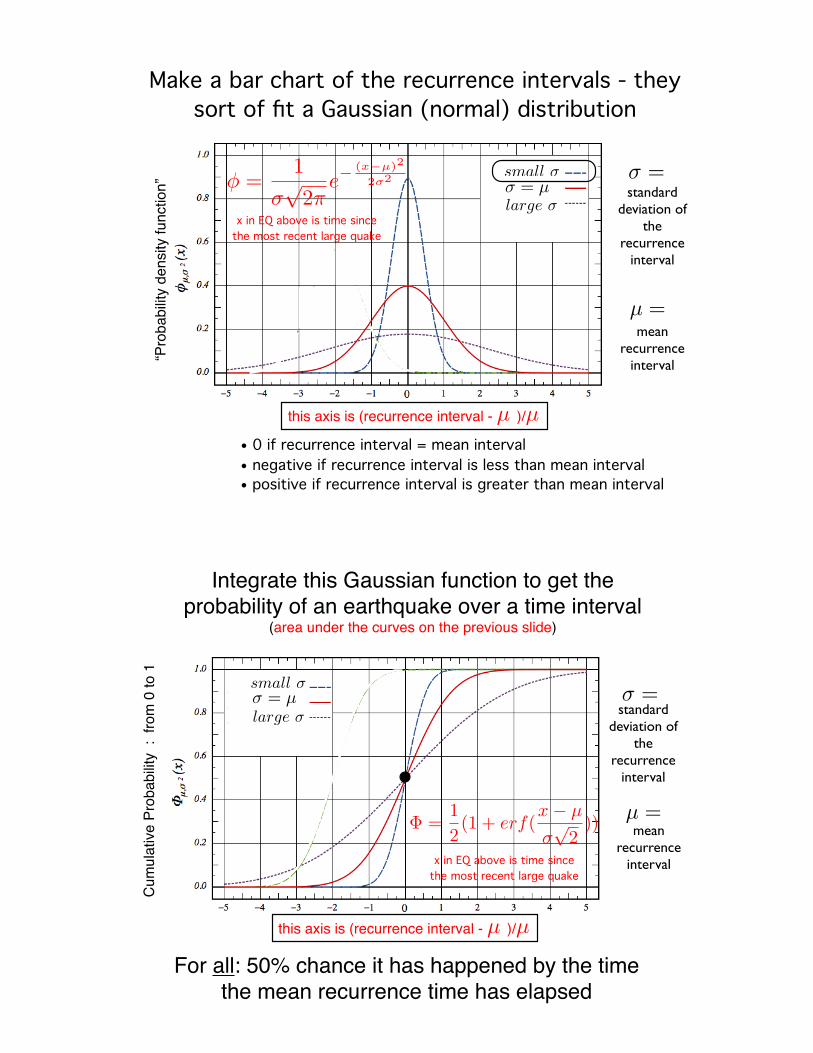
Make a bar chart of the recurrence intervals - they sort of fit a Gaussian (normal) distribution
“Pro
babi
lity
dens
ity fu
nctio
n” ! =1
"!
2#e!
(x!µ)2
2!2
large !
small !
! = µ! =
standard deviation of
the recurrence
interval
µ =
mean recurrence
interval
this axis is (recurrence interval - )/µ µ
• 0 if recurrence interval = mean interval• negative if recurrence interval is less than mean interval• positive if recurrence interval is greater than mean interval
x in EQ above is time since the most recent large quake
Cum
ulat
ive
Prob
abilit
y :
from
0 to
1
Integrate this Gaussian function to get the probability of an earthquake over a time interval
(area under the curves on the previous slide)
! =1
2(1 + erf(
x ! µ
!"
2))
large !
small !! = µ ! =
standard deviation of
the recurrence
interval
µ =
mean recurrence
intervalx in EQ above is time since the most recent large quake
For all: 50% chance it has happened by the time the mean recurrence time has elapsed
this axis is (recurrence interval - )/µ µ
Cum
ulat
ive
Prob
abilit
y Pr
obab
ility
dens
ity fu
nctio
n(b
ased
on
recu
rrenc
e tim
es)
0 0.10
1
0
1
500 years500 years
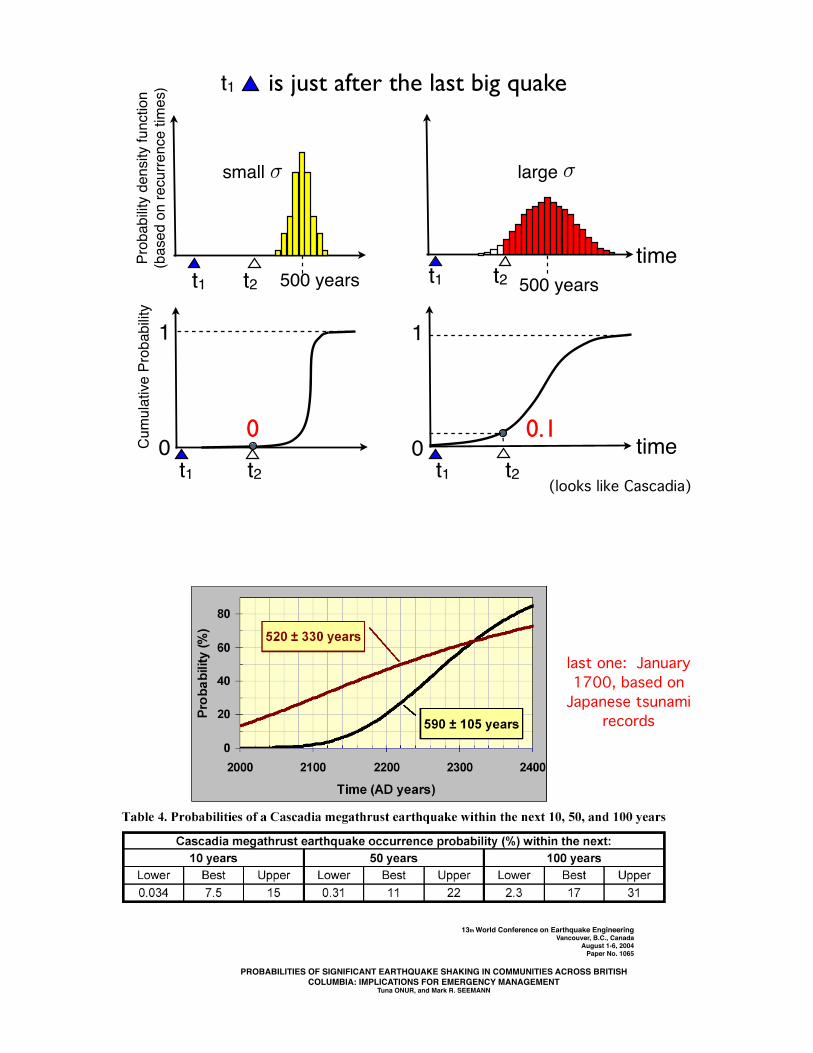
small ! large !
is just after the last big quake
t1
t1
t1
t1
t1 t2
t2t2
t2time
time
(looks like Cascadia)
13th World Conference on Earthquake Engineering Vancouver, B.C., Canada
August 1-6, 2004 Paper No. 1065
PROBABILITIES OF SIGNIFICANT EARTHQUAKE SHAKING IN COMMUNITIES ACROSS BRITISH COLUMBIA: IMPLICATIONS FOR EMERGENCY MANAGEMENT
Tuna ONUR, and Mark R. SEEMANN
last one: January 1700, based on
Japanese tsunami records

Cum
ulat
ive
Prob
abilit
y Pr
obab
ility
dens
ity fu
nctio
n(b
ased
on
recu
rrenc
e tim
es)
500 years500 years
0
1
0
1
0.5 0.5
t1
t1
t2
t2
t1
t1
t2
t2time
time
(looks like the southern SAF and some other California faults: SSAF recurrence interval is 200-300 y, it has been 300y since the last one)
Cum
ulat
ive
Prob
abilit
y Pr
obab
ility
dens
ity fu
nctio
n(b
ased
on
recu
rrenc
e tim
es)
500 years500 years
0
1
0
1
0.5 0.50.3
0.1
20% chance during !T
!T
40% chance during !T
!T
time
time
Predicting the probability for a time intervalin the future - just integrate between the two times
now
now

If we know the quake has not happened yet... and we are at time “__” then probability is higher
500 years
0
1
.2/.7 = 30% chance during next 30 years
then only use this part of the PDF
no earthquakeoccurred
!T = 30 yr
0.7
0.20.3
0.5
Prob
abilit
y de
nsity
func
tion
(bas
ed o
n re
curre
nce
times
)
500 years
no earthquakeoccurred
now
then only use this part of the PDF
Cum
ulat
ive
Prob
abilit
y
0
1
.4/.9 = 45% chance during next 30 years
now!T = 30 yr
0.9
0.40.1
0.5
Earthquake forecasting summaryWe can usually forecast where damaging earthquakes will be (seismic gaps on known faults) but we are still often surprised (e.g., blind faults, intraplate faults)
We cannot predict the timing of earthquakes very well (though we can forecast probabilities over long time periods if we have enough statistical data on earthquakes along the fault)
We can usually forecast their effects (e.g., strength and duration of shaking, tsunami genesis)