Embed Size (px)
Citation preview
I J C T A, 9(17) 2016, pp. 8415-8422© International Science Press
* Department of Computer Science and Engineering, ASET Amity University, Noida, Uttar Pradesh, India, E-mail: [email protected];[email protected]
Forecasting and Hypothesis Testing forCyberloafing in Organizations UsingMultiple Linear RegressionSoham Banerjee* and Sanjeev Thakur*
ABSTRACT
Business is an arena where organizations strive to rule the market. Employees use company resources to ensuremaximum productivity. With the recent uprisings in cybercrimes, organizations have heavily invested on employeesurveillance systems to monitor employee usage behavior of valuable resources like data, internet, applicationsoftware’s etc. Cyberloafing basically deals with employees who use company resources for personal use and slackwork during office hours. In this paper we have developed a forecast model based on multiple linear regression thatwill be applied over a set of factors generated by user responses. Based on the data set and p-values from regressionanalysis we will try to approve or disapprove certain hypothesizes based on cyberloafing.
Keywords: Forecast, Cyberloafing, Multiple Linear Regression, Hypothesis testing
I. INTRODUCTION
Employees form the competitive foundation for any organization and play a vital role to crown theorganization they work in. Productivity has a direct dependency on employee performance and in theglobalized network, organizations continuously monitor their employees and look forward to processimprovement. But in the due process of hectic market dominance, employees often avoid or don’t followcompany policies, especially in IT industries where the core asset is information. Among many employees,some try to adopt malpractices for personal benefit. For e.g. some employees send spam emails or try toaccess unauthorized data. Cyberloafing has now become an increased menace in the organization which isa threat to organizations with respect to cost and productivity.
Cyberloafing or goldbricking is a term used to define actions of employees who use organization resourcesespecially, internet to complete their own personal errands during organization work hours. Thus it isimportant for organizations to identify employees who misuse internet usage and create opportunities totamper with confidential data or harass other employees. Cyberloafing is based on human behavior whichchanges over time depending how the various work environment variables change over time. Psychologicalfactors like personality, age etc. also have a great emphasis on cyberloafing [11]. However it has beenobserved that most forecasting techniques especially multi linear regression generate low R-squared valueswhen predicting human behavior and almost in most cases this value is less than 50%. [10].
Therefore there is now a dire need of applications that can predict whether the employees of anorganization are satisfied with their job or will they misuse resources. Employee surveillance systems justmonitor the current state of usage and provide simple statistical support to analyze data. Also an organizationhas two opportunities to assess any employee or candidates during interviews for cyberloafing traits. If anyorganization has a standard application that can predict an employee’s characteristic and based on pre-
8416 Soham Banerjee and Sanjeev Thakur
defined weights can classify the existing employees as to whether they will use or misuse the resourcesassigned to them, then it will help managers to either penalize the employee or keep a track of the employee’sactivity for misuse.
The paper has been divided into three sections. In the first section we will follow a short overview ofthe technique used by us to predict an employee as a cyber-loafer or whether he is satisfied with the job. Inthe second section we will apply multiple linear regression over user responses followed by discussion ofresults. The final section will draw conclusion and future scope from our work.
II. LITERATURE REVIEW
In this section we will discuss and interpret multi linear regression and null hypothesis testing in detailalong with small descriptions of the various work environment variables identified through user responses.Our work will be an extension on the work done by Banerjee et al [9].
2.1. Multiple Linear Regression
Before we move on, let us first understand what do we mean by the word regression. Regression or regressionanalysis is simply a statistical technique that is used for making prediction or forecast based on someindependent variables over a dependent variable. To make things clear, regression basically estimatesrelationship among variables [17]. Regression analysis is basically used in wide spread applications tobuild forecasting models that are basically used to estimate or predict certain events. For example one canuse age and IQ as independent variables and predict the CGPA of a student. Regression analysis containsmany techniques, but our focus is particularly on multiple linear regression [14].
Consider X1, X2.......... X
n as independent variables that are not correlated in any form of relationship
with each other. Now we have a dependent variable Y which we need to estimate. Then we will fit a linealong a scatter plot whose equation will be of the form of
Y = �1X
1+ �
2X
2+ .......�
nX
n + � (1)
Where � is the intercept that represent the residual error and �1, �
2, .......�
n are regression coefficients of the
independent variables X1, X2.......... X
n. One can now clearly estimate the value of Y based on the line fitted
on the scatter plot generated by X and Y values as per equation (1) [1]. When we perform multiple linearregression over observational data, we test the quality of the model by computing the coefficient ofdetermination. Whenever we perform multiple linear regression we have to understand the following terms:
• R2 (R-squared): It is the coefficient of determination that measures how well the data fits theregression line in a scatter plot. It is denoted in percentage between 0 - 100%.
• Adjusted R2: It is simply the R2 that has been adjusted based on the number of predictors in theregression equation. Since R2 values are very sensitive to even one data point and cannot determinewhether the estimation or predictions are biased. Hence adjusted R2 will give an unbiased predictionbased on R2 population.
• Predicted R2: This measure comprehends that how well a regression model is able to make predictionsbased on new observations or data. It basically helps to judge whether a regression model is sufferingfrom the problem of over fitting.
2.2. Hypothesis Testing
In real world scenarios people often make assumptions and provide their interpretation of events throughjustification and proofs. In case of statistics, however the situation is different. A statistical claim can bevalidated using hypothesis testing [19]. Hypothesis testing is often applied over parameters that are population
Forecasting and Hypothesis Testing for Cyberloafing in Organizations using Multiple... 8417
based. For e.g. if a doctor claims that if a patient has sugar levels equal to 200 then he is suffering Type 2diabetes. It might be possible that the value can be less or more or not equal to 200 .One can validate thisstatement by determining the alternate hypothesis for the same and test using statistical significance measuresto prove which one is appropriate [20]. Whenever we perform hypothesis testing for any claim, we addresstwo types of hypothesis as follows:
• Null Hypothesis (Hnull
or H0): A null hypothesis generally denotes a claim that exists and there is
nothing new to be observed. Null hypothesis basically denotes that a particular parameter which isbased on population is equal to the value that is being claimed. For e.g. if we say that the minimumtemperature required to convert water into ice is 4 degree centigrade. Then the null hypothesis inshorthand will be denoted as H
0: µ = 4.
• Alternative Hypothesis (Halt
or Ha): When null hypothesis is rejected, one must develope another
set of hypothesis which is called alternative hypothesis. In this case the claimed value cannot beequal to the population parameter. Hence when generating an alternate hypothesis, three possiblesets can be generated. For e.g. if the null hypothesis fails for H
0: µ = 4, then alternate hypothesis
would be Ha: µ � 4 or H
a: µ > 4 or H
a: µ < 4.
Based on what we wish to conclude in our data set we can use alternate hypothesis for a new claim.Now the question arises as to select which H
a. We can select the appropriate alternate hypothesis using p-
values and T test statistics that are generated during multiple linear regression. We retain null hypothesis ifand only if the p-value is greater than 0.05 level of significance. Otherwise we can suggest an alternativehypothesis with proof.
2.3. Organization Work Factors
Employees in an organization handle multiple tasks of various complexities and often look for opportunitiesto showcase their work in front of the management. While employees look forward to salary raises andgrowth as key factors, learning as well as complexity of the task also effect an internal work environmentwithin the organization since solving a task is purely based on employee skills and judgment. Based onsuch factors we have listed all the work related factors that will help us to determine whether the employeesare satisfied or they will cyberloaf as follows:
• Work complexity: Employees often handle multiple tasks of different complexities. Harder thecomplexity, greater will be the challenge to resolve the work. In every organization irrespective ofits standards there are certain employees who might not be able to perform the task due to highcomplexity [9]. This often distinguishes a good employer from an ordinary one and often managersassign complex tasks to employees who they think can do the job. This creates an opportunity forordinary employees to slack from work or complete their allotted tasks later. The null and alternatehypothesis are:
H0: The work complexity faced by any cyberloafer is equal to 64.3% versus H
a: The work complexity
faced by any cyberloafer is greater than 40%
• Growth: Every employee wants to rise in his career path. Authority and designation play a vitalrole and every employee dreams to reach the top management positions with relevant experienceand credibility. Often managers and human resource executives judge the performance ofemployees and offer promotions to a select few [9]. Those who get the opportunity to climbwill put more effort at work as compared to those who will get demotivated and may wastetime in the internet rather than improving themselves [11]. Employees with good self-motivation and confidence can replenish their efforts towards work. The null and alternatehypothesis are:
8418 Soham Banerjee and Sanjeev Thakur
H0: The growth in career of any cyberloafer is equal to 44.5% versus H
a: The growth in career of any
cyberloafer is more than 35.5%.
• Warnings: Some employees are often warned when caught by managers or IT executives whenmisusing the internet. Also when employees don’t perform their tasks, then management useswarnings to question the employee’s contribution in the overall productivity [4]. This is specially acommon phenomenon in IT industry where employees are in constant pressure to deliver understrict deadlines. Warnings decrease employee moral however it is necessary to ensure that theorganization and its employees follow polices and standards on strict compliance [5]. The null andalternate hypothesis are:
H0: A cyberloafer is warned at an average equal to 66.7% of the times he performs activities over
the internet versus Ha: A cyberloafer is warned at an average less than 50% of the times he performsactivities over the internet.
• Perks: Often organizations provide non cashable benefits to employees that motivate them to performbetter and dedicate more time. Perks can be in the form of organizational gadgets, bill reimbursements,LTC etc. Perks are great motivators to improve employee morale, but in many scenarios it has beennoticed that employees prefer raise in salary rather than perks since cash speaks more. The null andalternate hypothesis are:
H0: An employee will leave cyberloafing if he receives perks equal to 54.5% of the total perks
covered in his package versus Ha: An employee will leave cyberloafing if he receives perks more
than 54.5% of the total perks covered in his package.
• Learning: Employees join industries not only to run their stomach but to inherit on the job skillsthat will distinguish them from the others. A confident and motivated employee will learn moreirrespective of talent. Small scale industries to large enterprises, every organization favors the factthat there should be a continuous process of learning and implementing skills [5]. Employees whocyberloaf generally make an excuse to learn using the internet and are more interested abusing it.Certain traits help managers distinguish between the lazy and the inquisitive like being proactive oraccountability. The null and alternate hypothesis are:
H0: An employee will leave cyberloafing if he learns new skills by spending 60.2% of the total time
he works in the office versus Ha: An employee will leave cyberloafing if he learns new skills by
spending more than 60.2% of the total time he works in the office.
• Raise: Organizations follow performance based appraisals for employees who work hard to achievea collective goal. Just like perks an appraisal or raise in the salary in the form of bonus can reallyboost the confidence and morale of employees working in the organization. Most cyberloaferspretend to work hard but the result of their work is judged based on organizational needs. In the ageof globalization organizations have adopted micro level of performance as an indicator to judge anemployee’s proficiency in his field. In the context of most small level IT companies and SME’s,low wages often force employees to leave their jobs as appraisal levels are extremely insignificant.The null and alternate hypothesis are:
H0: An employee will leave cyberloafing if he gets a onetime raise of 61.8% of the total salary he
earns in the office versus Ha: An employee will leave cyberloafing if he gets a onetime raise of more
than 61.8% of the total salary he earns in the office.
III. EXPERIMENT AND RESULT
Based on the factors discussed in the previous section, we prepared a questionnaire for 70 participants whoare working in the same organization. Out of the 70 participants, 58 responses were selected due to their
Forecasting and Hypothesis Testing for Cyberloafing in Organizations using Multiple... 8419
completeness. 59 % males and 41% of the females had participated between the ages of 22 - 55 years. Eachparticipant was asked to assign a score for all factors between 0 - 100. The discussed factors will be treatedas independent variables for regression while the dependent variable is an overall rating w.r.t cyberloafing.Next we apply multiple linear regression over the collected responses. We have used Minitab statisticalsoftware which provides a wide range of statistical measures and provides creative visualization of results.The data can be loaded directly through any CSV or XLSX file.
3.1. Results Found
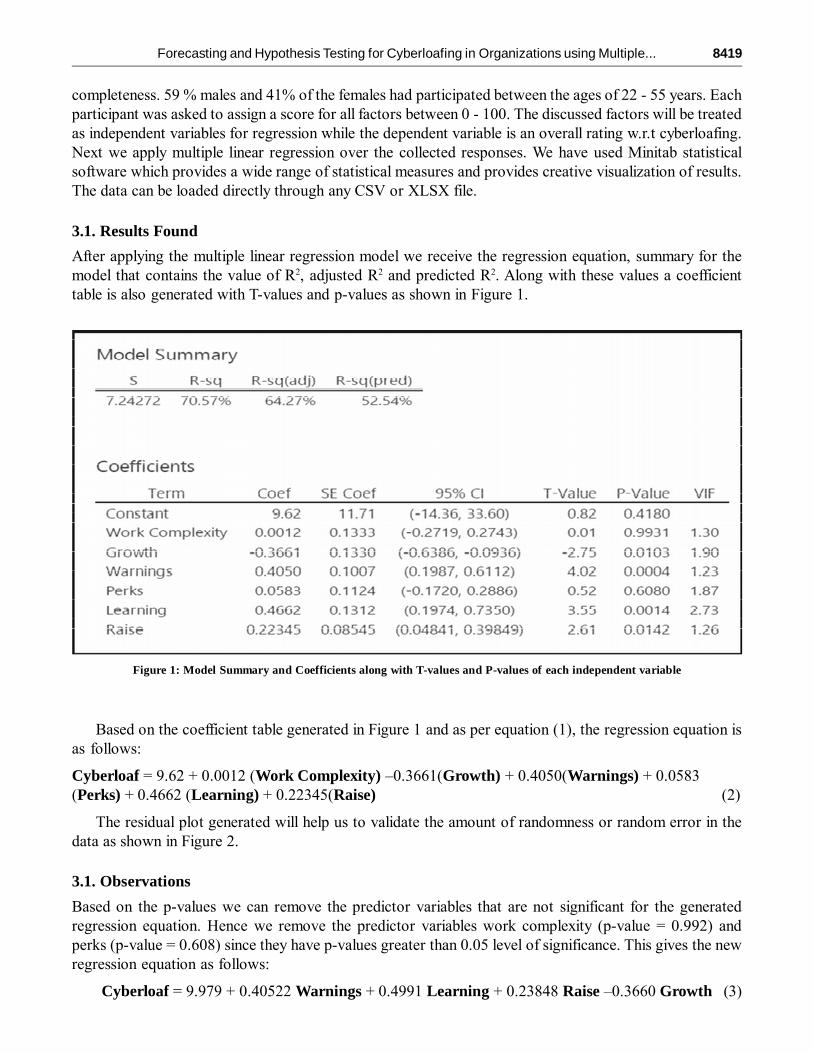
After applying the multiple linear regression model we receive the regression equation, summary for themodel that contains the value of R2, adjusted R2 and predicted R2. Along with these values a coefficienttable is also generated with T-values and p-values as shown in Figure 1.
Figure 1: Model Summary and Coefficients along with T-values and P-values of each independent variable
Based on the coefficient table generated in Figure 1 and as per equation (1), the regression equation isas follows:
Cyberloaf = 9.62 + 0.0012 (Work Complexity) –0.3661(Growth) + 0.4050(Warnings) + 0.0583(Perks) + 0.4662 (Learning) + 0.22345(Raise) (2)
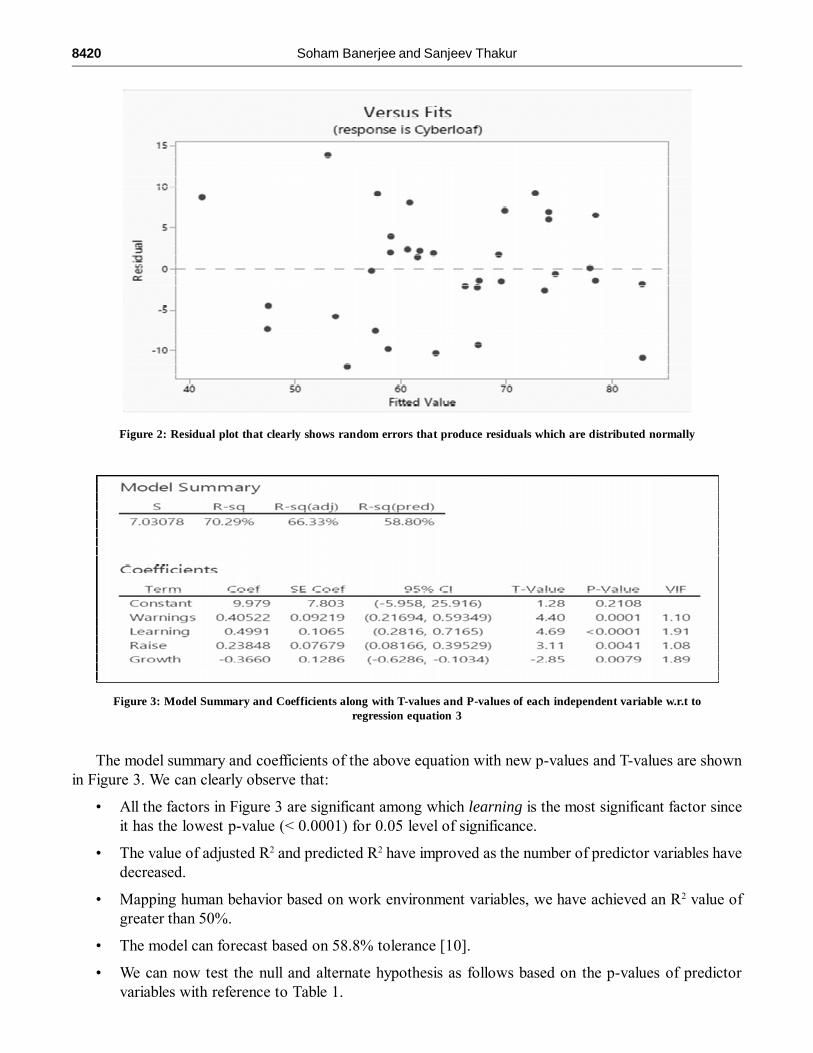
The residual plot generated will help us to validate the amount of randomness or random error in thedata as shown in Figure 2.
3.1. Observations
Based on the p-values we can remove the predictor variables that are not significant for the generatedregression equation. Hence we remove the predictor variables work complexity (p-value = 0.992) andperks (p-value = 0.608) since they have p-values greater than 0.05 level of significance. This gives the newregression equation as follows:
Cyberloaf = 9.979 + 0.40522 Warnings + 0.4991 Learning + 0.23848 Raise –0.3660 Growth (3)
8420 Soham Banerjee and Sanjeev Thakur
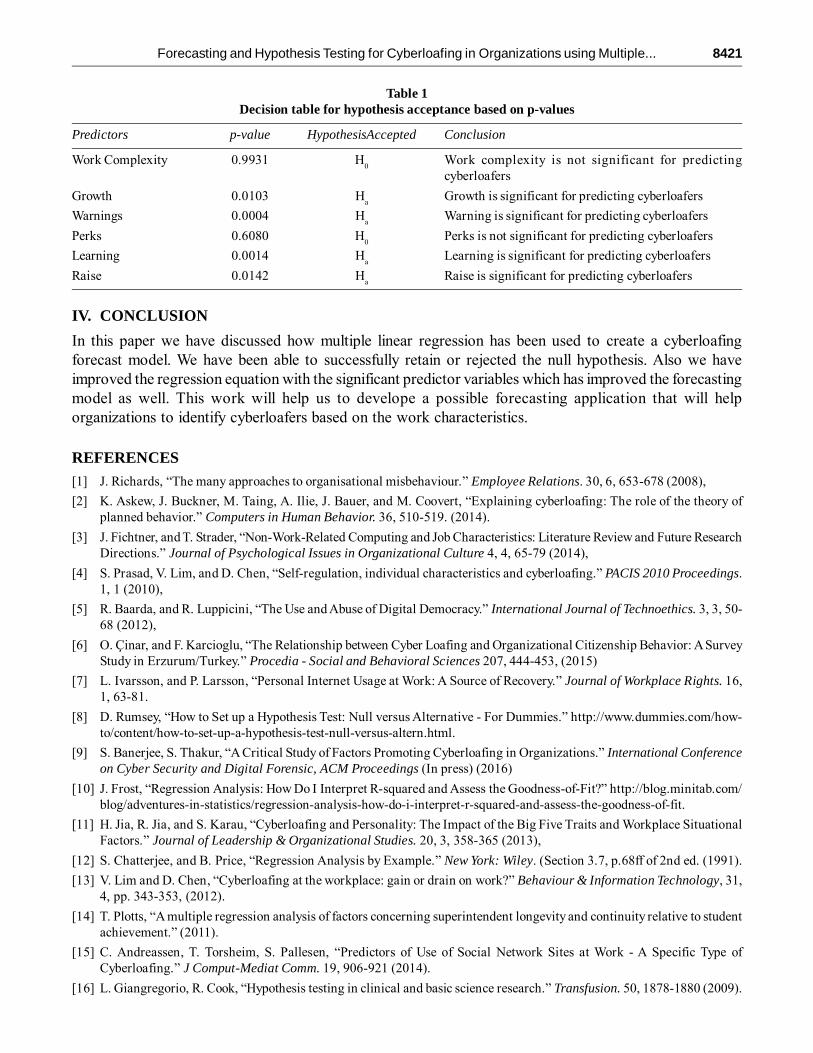
The model summary and coefficients of the above equation with new p-values and T-values are shownin Figure 3. We can clearly observe that:
• All the factors in Figure 3 are significant among which learning is the most significant factor sinceit has the lowest p-value (< 0.0001) for 0.05 level of significance.
• The value of adjusted R2 and predicted R2 have improved as the number of predictor variables havedecreased.
• Mapping human behavior based on work environment variables, we have achieved an R2 value ofgreater than 50%.
• The model can forecast based on 58.8% tolerance [10].
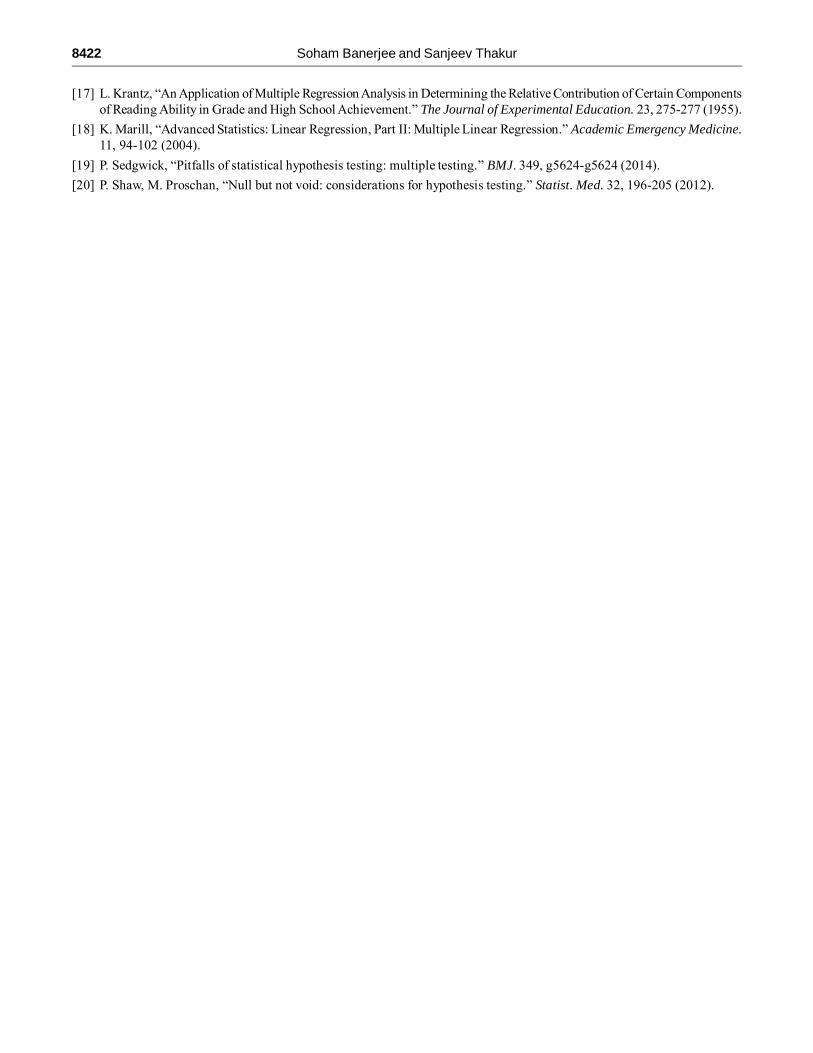
• We can now test the null and alternate hypothesis as follows based on the p-values of predictorvariables with reference to Table 1.
Figure 2: Residual plot that clearly shows random errors that produce residuals which are distributed normally
Figure 3: Model Summary and Coefficients along with T-values and P-values of each independent variable w.r.t toregression equation 3
Forecasting and Hypothesis Testing for Cyberloafing in Organizations using Multiple... 8421
Table 1Decision table for hypothesis acceptance based on p-values
Predictors p-value HypothesisAccepted Conclusion
Work Complexity 0.9931 H0
Work complexity is not significant for predictingcyberloafers
Growth 0.0103 Ha
Growth is significant for predicting cyberloafers
Warnings 0.0004 Ha
Warning is significant for predicting cyberloafers
Perks 0.6080 H0
Perks is not significant for predicting cyberloafers
Learning 0.0014 Ha
Learning is significant for predicting cyberloafers
Raise 0.0142 Ha
Raise is significant for predicting cyberloafers
IV. CONCLUSION
In this paper we have discussed how multiple linear regression has been used to create a cyberloafingforecast model. We have been able to successfully retain or rejected the null hypothesis. Also we haveimproved the regression equation with the significant predictor variables which has improved the forecastingmodel as well. This work will help us to develope a possible forecasting application that will helporganizations to identify cyberloafers based on the work characteristics.
REFERENCES[1] J. Richards, “The many approaches to organisational misbehaviour.” Employee Relations. 30, 6, 653-678 (2008),
[2] K. Askew, J. Buckner, M. Taing, A. Ilie, J. Bauer, and M. Coovert, “Explaining cyberloafing: The role of the theory ofplanned behavior.” Computers in Human Behavior. 36, 510-519. (2014).
[3] J. Fichtner, and T. Strader, “Non-Work-Related Computing and Job Characteristics: Literature Review and Future ResearchDirections.” Journal of Psychological Issues in Organizational Culture 4, 4, 65-79 (2014),
[4] S. Prasad, V. Lim, and D. Chen, “Self-regulation, individual characteristics and cyberloafing.” PACIS 2010 Proceedings.1, 1 (2010),
[5] R. Baarda, and R. Luppicini, “The Use and Abuse of Digital Democracy.” International Journal of Technoethics. 3, 3, 50-68 (2012),
[6] O. Çinar, and F. Karcioglu, “The Relationship between Cyber Loafing and Organizational Citizenship Behavior: A SurveyStudy in Erzurum/Turkey.” Procedia - Social and Behavioral Sciences 207, 444-453, (2015)
[7] L. Ivarsson, and P. Larsson, “Personal Internet Usage at Work: A Source of Recovery.” Journal of Workplace Rights. 16,1, 63-81.
[8] D. Rumsey, “How to Set up a Hypothesis Test: Null versus Alternative - For Dummies.” http://www.dummies.com/how-to/content/how-to-set-up-a-hypothesis-test-null-versus-altern.html.
[9] S. Banerjee, S. Thakur, “A Critical Study of Factors Promoting Cyberloafing in Organizations.” International Conferenceon Cyber Security and Digital Forensic, ACM Proceedings (In press) (2016)
[10] J. Frost, “Regression Analysis: How Do I Interpret R-squared and Assess the Goodness-of-Fit?” http://blog.minitab.com/blog/adventures-in-statistics/regression-analysis-how-do-i-interpret-r-squared-and-assess-the-goodness-of-fit.
[11] H. Jia, R. Jia, and S. Karau, “Cyberloafing and Personality: The Impact of the Big Five Traits and Workplace SituationalFactors.” Journal of Leadership & Organizational Studies. 20, 3, 358-365 (2013),
[12] S. Chatterjee, and B. Price, “Regression Analysis by Example.” New York: Wiley. (Section 3.7, p.68ff of 2nd ed. (1991).
[13] V. Lim and D. Chen, “Cyberloafing at the workplace: gain or drain on work?” Behaviour & Information Technology, 31,4, pp. 343-353, (2012).
[14] T. Plotts, “A multiple regression analysis of factors concerning superintendent longevity and continuity relative to studentachievement.” (2011).
[15] C. Andreassen, T. Torsheim, S. Pallesen, “Predictors of Use of Social Network Sites at Work - A Specific Type ofCyberloafing.” J Comput-Mediat Comm. 19, 906-921 (2014).
[16] L. Giangregorio, R. Cook, “Hypothesis testing in clinical and basic science research.” Transfusion. 50, 1878-1880 (2009).
8422 Soham Banerjee and Sanjeev Thakur
[17] L. Krantz, “An Application of Multiple Regression Analysis in Determining the Relative Contribution of Certain Componentsof Reading Ability in Grade and High School Achievement.” The Journal of Experimental Education. 23, 275-277 (1955).
[18] K. Marill, “Advanced Statistics: Linear Regression, Part II: Multiple Linear Regression.” Academic Emergency Medicine.11, 94-102 (2004).
[19] P. Sedgwick, “Pitfalls of statistical hypothesis testing: multiple testing.” BMJ. 349, g5624-g5624 (2014).
[20] P. Shaw, M. Proschan, “Null but not void: considerations for hypothesis testing.” Statist. Med. 32, 196-205 (2012).