Embed Size (px)
Citation preview
356167_WACF_2004-2005.qxd 9/15/04 11:54 AM Page 111

The Boeing Company issues the biennial World Air Cargo Forecast (WACF) to provide a comprehensive, up-to-date overview
of the air cargo industry. The forecast summarizes the world’s major air trade markets, identifies major trends, and presents
forecasts for the future performance and development of markets, as well as for the world freighter airplane fleet.
A strongly resurgent world air cargo industry characterizes the market for the 2004/2005 edition. Traffic has grown nearly
11% during the first half of 2004 relative to 2003, when concern over the Iraq War and the severe acute respiratory
syndrome (SARS) crisis in Asia curbed industry growth. If the current momentum of world air cargo traffic growth is
maintained through the end of 2004, it will mark the first double-digit percentage growth year for the industry since 1997.
In this edition of the WACF, new data sources were used to help model air cargo flows into and out of Europe, which has
improved our understanding of the continent’s air trade patterns. It is hoped that this new data will improve the usefulness
of WACF for all readers.
Data represented as historical in this document were compiled from many sources, including, but not limited to,
Air Cargo Management Group, the Air Transport Association (ATA), the Association of Asia-Pacific Airlines (AAPA),
the Association of European Airlines (AEA), Boeing Foreign Trade Database (TRADE), Global Insight, the International
Air Transport Association (IATA), International Civil Aviation Organization (ICAO), and U.S. Department of Transportation
(DOT) Form 41. Historical information is updated each year as individual sources revise their respective databases.
This document would not be possible without the efforts of several contributors. The Boeing World Air Cargo Forecast
2004/2005 production team included the Creative Services Group design, production, and web teams; the Writing
and Editing Services team; and our colleagues in marketing, John Riley and Lee Hibbets.
Special thanks are extended to Mr. Thomas Klein (www.contrails.de) and Mr. Tom Hoang for their photographic contributions
on the cover of this year’s edition of WACF. Mr. Klein contributed the Cargolux 747-400F photograph that adorns the cover,
and Mr. Hoang is the photographer of the Cathay Pacific 747-400F.
The next update to the WACF will appear fourth quarter 2006. The authors welcome any questions or comments readers
may have. All queries and suggestions should be directed to
The Boeing World Air Cargo Forecast Team
Boeing Commercial Airplanes
P. O. Box 3707, MC 21-33
Seattle, WA 98124-2207 USA
Fax: (206) 766-1030
Web:http://www.boeing.com/commercial/cargo/index.html
World Air Cargo Forecast 2004/200500
Foreword
Tom Crabtree Tom Hoang Jim Edgar
206-766-2576 206-766-2568 206-766-2643
thomas.crabtree thomas.l.hoang james.r.edgar
@boeing.com @boeing.com @boeing.com
Table of Contentse 00
Table of Contents
Executive Summary and Significant Industry Trends . . . . . . . . . . . . . . . . . . . . . . . . . . . . . . . . . . . . . . . . . . . . . . . . . . . . . . . . . . . . . . . . .1
World Overview and Forecast . . . . . . . . . . . . . . . . . . . . . . . . . . . . . . . . . . . . . . . . . . . . . . . . . . . . . . . . . . . .7
North America . . . . . . . . . . . . . . . . . . . . . . . . . . . . . . . . . . . . . . . . . . . . . . . . . . . . . . . . . . . . . . . . . . . . . . . . . . . . . .17
Latin America and North America . . . . . . . . . . . . . . . . . . . . . . . . . . . . . . . . . . . . . . . . . . . . . . . . . . . . . .25
Europe and North America . . . . . . . . . . . . . . . . . . . . . . . . . . . . . . . . . . . . . . . . . . . . . . . . . . . . . . . . . . . . . .31
Intra-Europe . . . . . . . . . . . . . . . . . . . . . . . . . . . . . . . . . . . . . . . . . . . . . . . . . . . . . . . . . . . . . . . . . . . . . . . . . . . . . . . .37
Middle East . . . . . . . . . . . . . . . . . . . . . . . . . . . . . . . . . . . . . . . . . . . . . . . . . . . . . . . . . . . . . . . . . . . . . . . . . . . . . . . . .43
Africa . . . . . . . . . . . . . . . . . . . . . . . . . . . . . . . . . . . . . . . . . . . . . . . . . . . . . . . . . . . . . . . . . . . . . . . . . . . . . . . . . . . . . . . . .49
Asia and North America . . . . . . . . . . . . . . . . . . . . . . . . . . . . . . . . . . . . . . . . . . . . . . . . . . . . . . . . . . . . . . . . . .55
Europe and Asia . . . . . . . . . . . . . . . . . . . . . . . . . . . . . . . . . . . . . . . . . . . . . . . . . . . . . . . . . . . . . . . . . . . . . . . . . . .61
Intra-Asia . . . . . . . . . . . . . . . . . . . . . . . . . . . . . . . . . . . . . . . . . . . . . . . . . . . . . . . . . . . . . . . . . . . . . . . . . . . . . . . . . . . .67
Southwest Asia . . . . . . . . . . . . . . . . . . . . . . . . . . . . . . . . . . . . . . . . . . . . . . . . . . . . . . . . . . . . . . . . . . . . . . . . . . . .73
Commonwealth of Independent States . . . . . . . . . . . . . . . . . . . . . . . . . . . . . . . . . . . . . . . . . . . . . . .79
Domestic China . . . . . . . . . . . . . . . . . . . . . . . . . . . . . . . . . . . . . . . . . . . . . . . . . . . . . . . . . . . . . . . . . . . . . . . . . . .85
World Freighter Fleet . . . . . . . . . . . . . . . . . . . . . . . . . . . . . . . . . . . . . . . . . . . . . . . . . . . . . . . . . . . . . . . . . . . . . .91
Glossary . . . . . . . . . . . . . . . . . . . . . . . . . . . . . . . . . . . . . . . . . . . . . . . . . . . . . . . . . . . . . . . . . . . . . . . . . . . . . . . . . . . . .99
Appendix . . . . . . . . . . . . . . . . . . . . . . . . . . . . . . . . . . . . . . . . . . . . . . . . . . . . . . . . . . . . . . . . . . . . . . . . . . . . . . . . . .103
Executive Summary and Significant Industry Trends 1
Summary
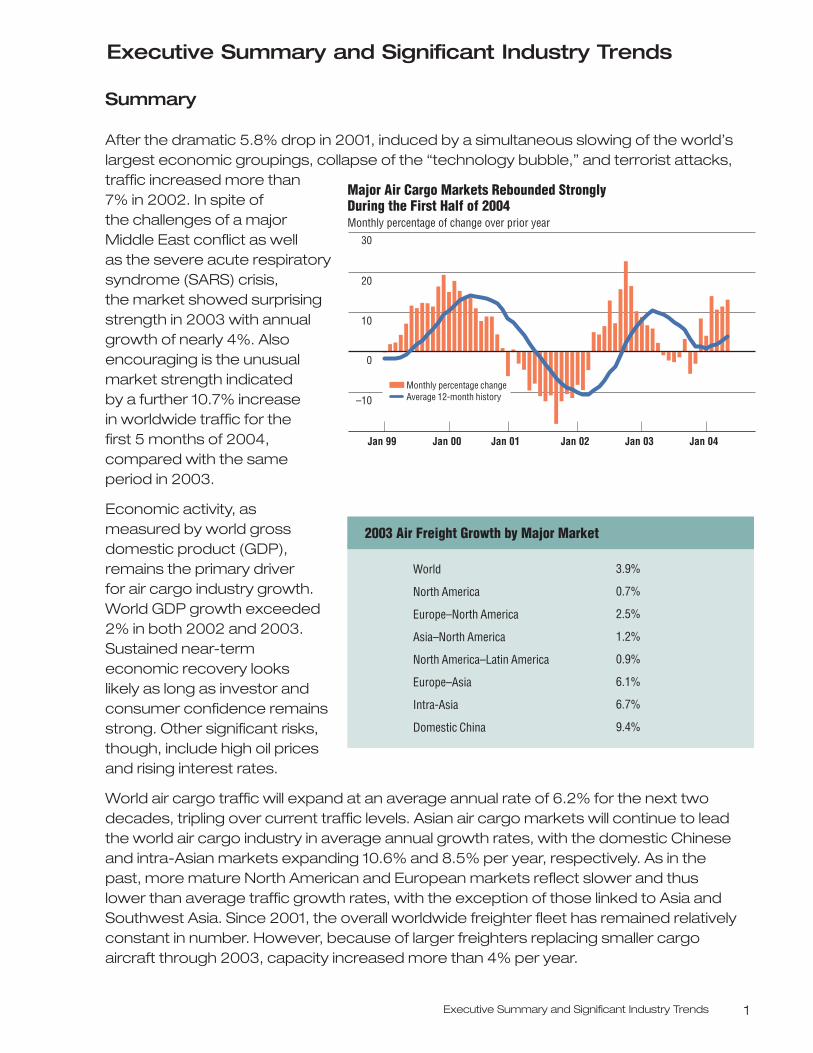
After the dramatic 5.8% drop in 2001, induced by a simultaneous slowing of the world’slargest economic groupings, collapse of the “technology bubble,” and terrorist attacks,traffic increased more than 7% in 2002. In spite of the challenges of a majorMiddle East conflict as well as the severe acute respiratorysyndrome (SARS) crisis, the market showed surprisingstrength in 2003 with annualgrowth of nearly 4%. Alsoencouraging is the unusualmarket strength indicated by a further 10.7% increase in worldwide traffic for the first 5 months of 2004,compared with the same period in 2003.
Economic activity, asmeasured by world grossdomestic product (GDP),remains the primary driver for air cargo industry growth.World GDP growth exceeded2% in both 2002 and 2003.Sustained near-termeconomic recovery looks likely as long as investor andconsumer confidence remainsstrong. Other significant risks,though, include high oil pricesand rising interest rates.
World air cargo traffic will expand at an average annual rate of 6.2% for the next twodecades, tripling over current traffic levels. Asian air cargo markets will continue to leadthe world air cargo industry in average annual growth rates, with the domestic Chineseand intra-Asian markets expanding 10.6% and 8.5% per year, respectively. As in thepast, more mature North American and European markets reflect slower and thuslower than average traffic growth rates, with the exception of those linked to Asia andSouthwest Asia. Since 2001, the overall worldwide freighter fleet has remained relativelyconstant in number. However, because of larger freighters replacing smaller cargoaircraft through 2003, capacity increased more than 4% per year.
–10
0
20
10
30
Major Air Cargo Markets Rebounded Strongly During the First Half of 2004 Monthly percentage of change over prior year
Jan 99 Jan 00 Jan 01 Jan 02 Jan 04Jan 03
Average 12-month historyMonthly percentage change
2003 Air Freight Growth by Major Market
3.9%
0.7%
2.5%
1.2%
0.9%
6.1%
6.7%
9.4%
World
North America
Europe–North America
Asia–North America
North America–Latin America
Europe–Asia
Intra-Asia
Domestic China
Executive Summary and Significant Industry Trends
World Air Cargo Forecast 2004/20052
This trend will continue over the next 20 years as well, with capacity increasing parallel to the tripling traffic levels, but with fleet size not quite doubling from 1,766 in 2003 to3,456 in 2023. Medium -widebody and large cargo aircraft will lead fleet additions,growing from an overall share of 44% to 60% as traffic continues to build on long-haul,international trade lanes.
Yield Trends
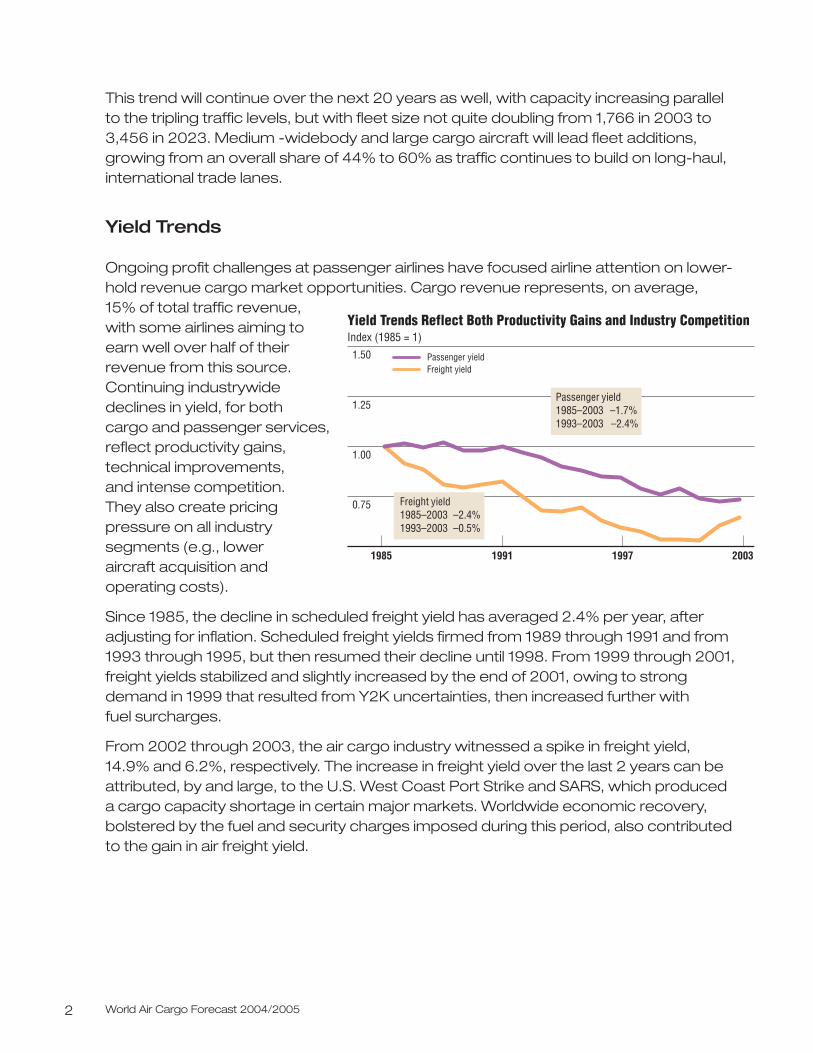
Ongoing profit challenges at passenger airlines have focused airline attention on lower-hold revenue cargo market opportunities. Cargo revenue represents, on average, 15% of total traffic revenue,with some airlines aiming toearn well over half of theirrevenue from this source.Continuing industrywidedeclines in yield, for both cargo and passenger services,reflect productivity gains,technical improvements, and intense competition. They also create pricingpressure on all industrysegments (e.g., lower aircraft acquisition andoperating costs).
Since 1985, the decline in scheduled freight yield has averaged 2.4% per year, afteradjusting for inflation. Scheduled freight yields firmed from 1989 through 1991 and from1993 through 1995, but then resumed their decline until 1998. From 1999 through 2001,freight yields stabilized and slightly increased by the end of 2001, owing to strongdemand in 1999 that resulted from Y2K uncertainties, then increased further with fuel surcharges.
From 2002 through 2003, the air cargo industry witnessed a spike in freight yield, 14.9% and 6.2%, respectively. The increase in freight yield over the last 2 years can beattributed, by and large, to the U.S. West Coast Port Strike and SARS, which produced a cargo capacity shortage in certain major markets. Worldwide economic recovery,bolstered by the fuel and security charges imposed during this period, also contributedto the gain in air freight yield.
Yield Trends Reflect Both Productivity Gains and Industry Competition Index (1985 = 1)1.50
1.25
1.00
0.75
Passenger yieldFreight yield
1985 1991 1997 2003
Passenger yield 1985–2003 –1.7% 1993–2003 –2.4%
Freight yield 1985–2003 –2.4% 1993–2003 –0.5%
Executive Summary and Significant Industry Trends 3
Widebody ACMI Services
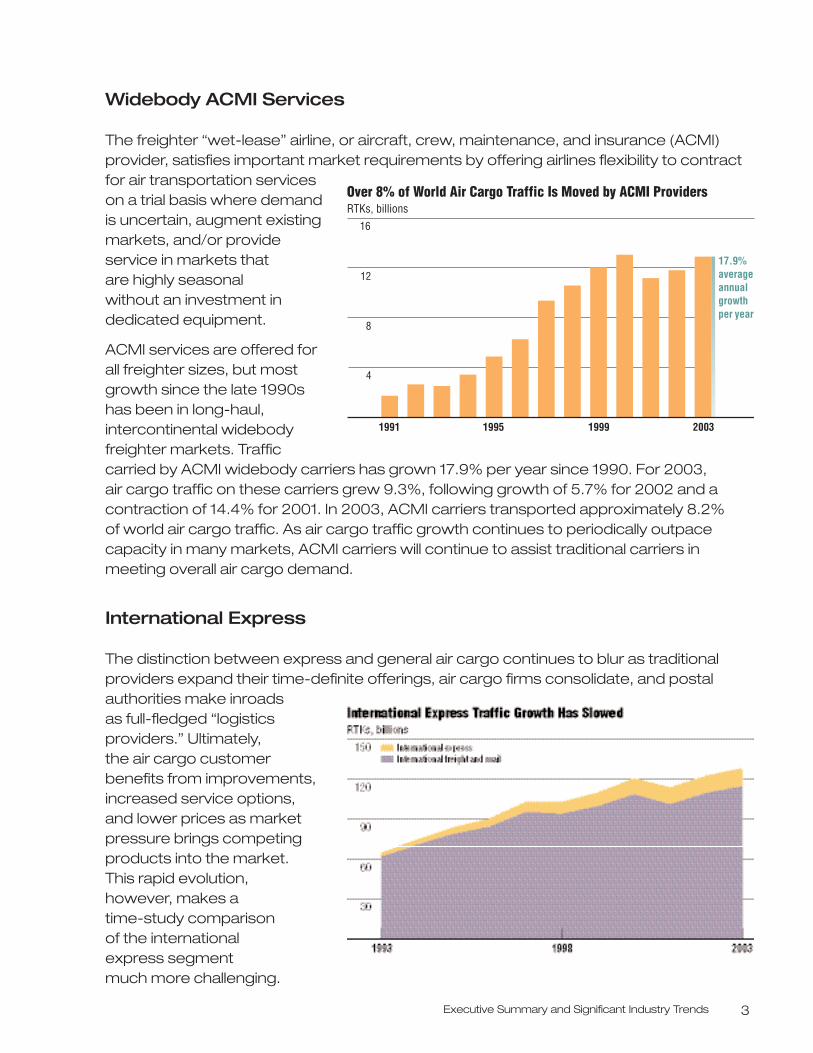
The freighter “wet-lease” airline, or aircraft, crew, maintenance, and insurance (ACMI)provider, satisfies important market requirements by offering airlines flexibility to contractfor air transportation serviceson a trial basis where demandis uncertain, augment existingmarkets, and/or provideservice in markets that are highly seasonal without an investment in dedicated equipment.
ACMI services are offered forall freighter sizes, but mostgrowth since the late 1990shas been in long-haul,intercontinental widebodyfreighter markets. Trafficcarried by ACMI widebody carriers has grown 17.9% per year since 1990. For 2003, air cargo traffic on these carriers grew 9.3%, following growth of 5.7% for 2002 and acontraction of 14.4% for 2001. In 2003, ACMI carriers transported approximately 8.2% of world air cargo traffic. As air cargo traffic growth continues to periodically outpacecapacity in many markets, ACMI carriers will continue to assist traditional carriers inmeeting overall air cargo demand.
International Express
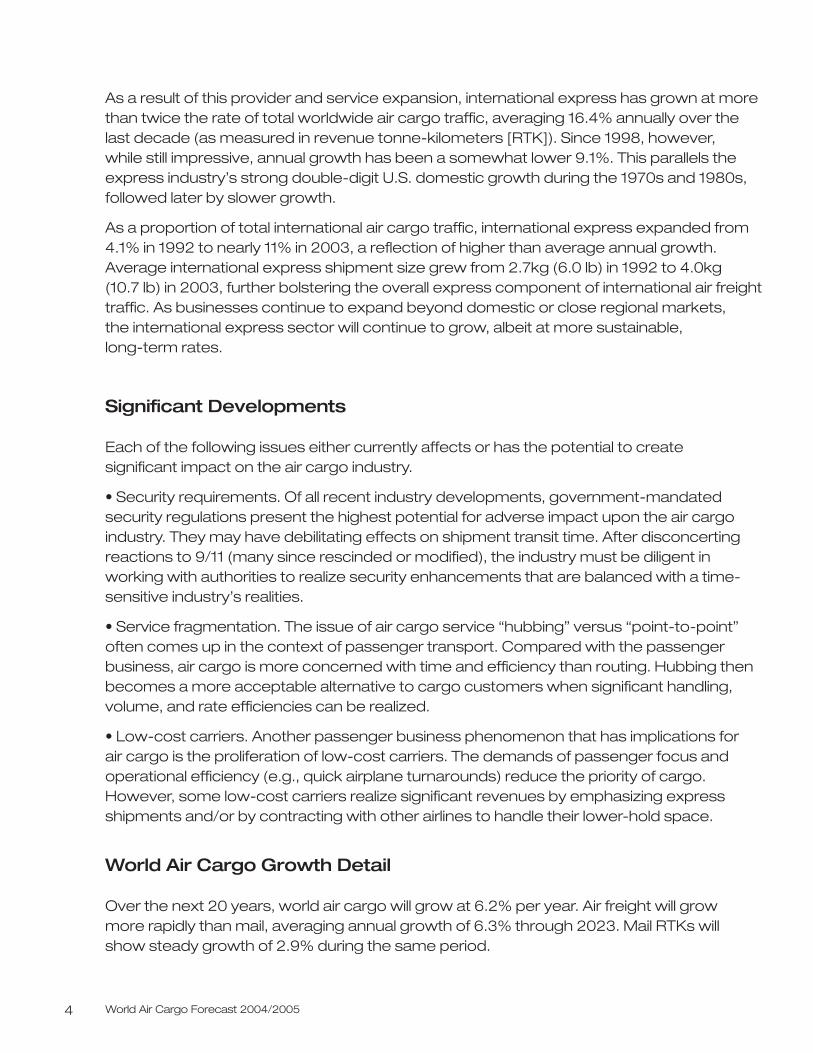
The distinction between express and general air cargo continues to blur as traditionalproviders expand their time-definite offerings, air cargo firms consolidate, and postalauthorities make inroads as full-fledged “logisticsproviders.” Ultimately, the air cargo customerbenefits from improvements,increased service options,and lower prices as marketpressure brings competingproducts into the market. This rapid evolution, however, makes a time-study comparison of the international express segment much more challenging.
Over 8% of World Air Cargo Traffic Is Moved by ACMI Providers RTKs, billions
16
12
4
8
1991 1995 20031999
17.9%averageannualgrowthper year
World Air Cargo Forecast 2004/20054
As a result of this provider and service expansion, international express has grown at morethan twice the rate of total worldwide air cargo traffic, averaging 16.4% annually over the last decade (as measured in revenue tonne-kilometers [RTK]). Since 1998, however, while still impressive, annual growth has been a somewhat lower 9.1%. This parallels theexpress industry’s strong double-digit U.S. domestic growth during the 1970s and 1980s,followed later by slower growth.
As a proportion of total international air cargo traffic, international express expanded from4.1% in 1992 to nearly 11% in 2003, a reflection of higher than average annual growth.Average international express shipment size grew from 2.7kg (6.0 lb) in 1992 to 4.0kg (10.7 lb) in 2003, further bolstering the overall express component of international air freighttraffic. As businesses continue to expand beyond domestic or close regional markets, the international express sector will continue to grow, albeit at more sustainable, long-term rates.
Significant Developments
Each of the following issues either currently affects or has the potential to create significant impact on the air cargo industry.
• Security requirements. Of all recent industry developments, government-mandatedsecurity regulations present the highest potential for adverse impact upon the air cargoindustry. They may have debilitating effects on shipment transit time. After disconcertingreactions to 9/11 (many since rescinded or modified), the industry must be diligent inworking with authorities to realize security enhancements that are balanced with a time-sensitive industry’s realities.
• Service fragmentation. The issue of air cargo service “hubbing” versus “point-to-point”often comes up in the context of passenger transport. Compared with the passengerbusiness, air cargo is more concerned with time and efficiency than routing. Hubbing thenbecomes a more acceptable alternative to cargo customers when significant handling,volume, and rate efficiencies can be realized.
• Low-cost carriers. Another passenger business phenomenon that has implications for air cargo is the proliferation of low-cost carriers. The demands of passenger focus andoperational efficiency (e.g., quick airplane turnarounds) reduce the priority of cargo.However, some low-cost carriers realize significant revenues by emphasizing expressshipments and/or by contracting with other airlines to handle their lower-hold space.
World Air Cargo Growth Detail
Over the next 20 years, world air cargo will grow at 6.2% per year. Air freight will grow more rapidly than mail, averaging annual growth of 6.3% through 2023. Mail RTKs will show steady growth of 2.9% during the same period.
Executive Summary and Significant Industry TrendsTitle 5
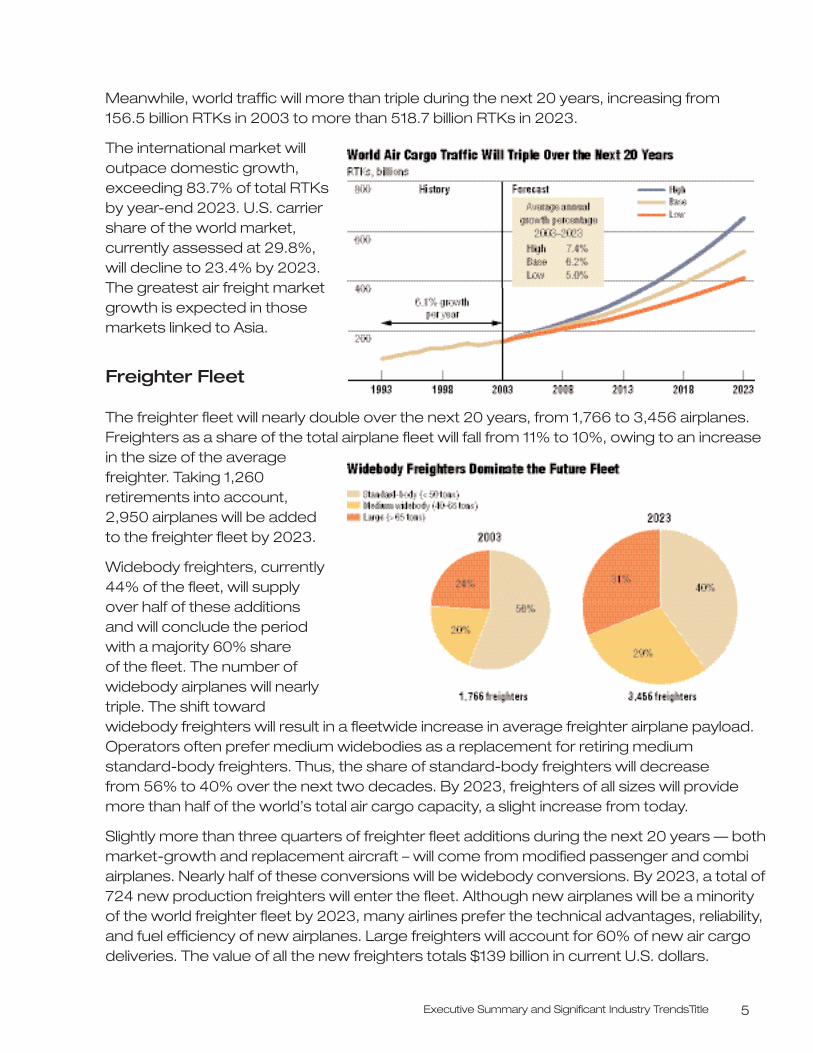
Meanwhile, world traffic will more than triple during the next 20 years, increasing from 156.5 billion RTKs in 2003 to more than 518.7 billion RTKs in 2023.
The international market willoutpace domestic growth,exceeding 83.7% of total RTKsby year-end 2023. U.S. carriershare of the world market,currently assessed at 29.8%,will decline to 23.4% by 2023.The greatest air freight marketgrowth is expected in thosemarkets linked to Asia.
Freighter Fleet
The freighter fleet will nearly double over the next 20 years, from 1,766 to 3,456 airplanes.Freighters as a share of the total airplane fleet will fall from 11% to 10%, owing to an increasein the size of the averagefreighter. Taking 1,260retirements into account,2,950 airplanes will be addedto the freighter fleet by 2023.
Widebody freighters, currently44% of the fleet, will supplyover half of these additions and will conclude the periodwith a majority 60% share of the fleet. The number ofwidebody airplanes will nearlytriple. The shift towardwidebody freighters will result in a fleetwide increase in average freighter airplane payload.Operators often prefer medium widebodies as a replacement for retiring medium standard-body freighters. Thus, the share of standard-body freighters will decrease from 56% to 40% over the next two decades. By 2023, freighters of all sizes will providemore than half of the world’s total air cargo capacity, a slight increase from today.
Slightly more than three quarters of freighter fleet additions during the next 20 years — bothmarket-growth and replacement aircraft – will come from modified passenger and combiairplanes. Nearly half of these conversions will be widebody conversions. By 2023, a total of724 new production freighters will enter the fleet. Although new airplanes will be a minorityof the world freighter fleet by 2023, many airlines prefer the technical advantages, reliability,and fuel efficiency of new airplanes. Large freighters will account for 60% of new air cargodeliveries. The value of all the new freighters totals $139 billion in current U.S. dollars.
World Overview and Forecast 7
World Overview and Forecast
World Economic Environment Favors Continued Growth
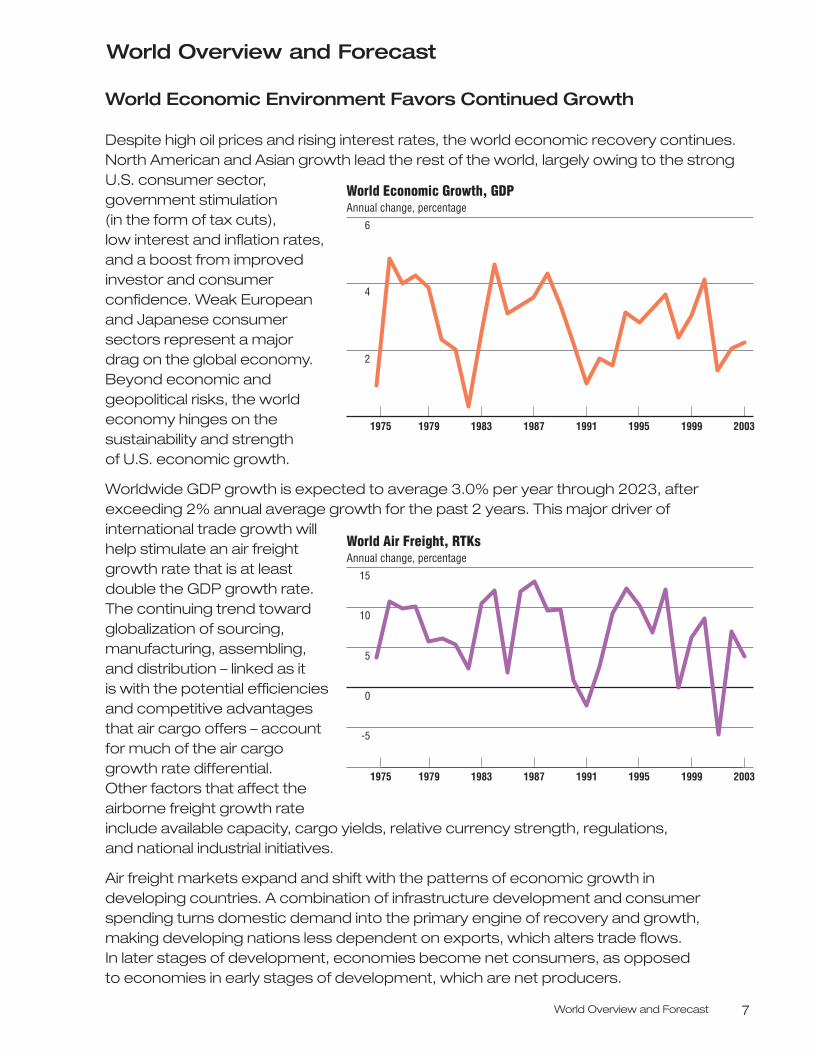
Despite high oil prices and rising interest rates, the world economic recovery continues.North American and Asian growth lead the rest of the world, largely owing to the strongU.S. consumer sector,government stimulation (in the form of tax cuts), low interest and inflation rates,and a boost from improvedinvestor and consumerconfidence. Weak Europeanand Japanese consumersectors represent a majordrag on the global economy.Beyond economic andgeopolitical risks, the worldeconomy hinges on thesustainability and strength of U.S. economic growth.
Worldwide GDP growth is expected to average 3.0% per year through 2023, afterexceeding 2% annual average growth for the past 2 years. This major driver ofinternational trade growth willhelp stimulate an air freightgrowth rate that is at leastdouble the GDP growth rate.The continuing trend towardglobalization of sourcing,manufacturing, assembling,and distribution – linked as it is with the potential efficienciesand competitive advantagesthat air cargo offers – accountfor much of the air cargogrowth rate differential. Other factors that affect theairborne freight growth rateinclude available capacity, cargo yields, relative currency strength, regulations, and national industrial initiatives.
Air freight markets expand and shift with the patterns of economic growth in developing countries. A combination of infrastructure development and consumerspending turns domestic demand into the primary engine of recovery and growth,making developing nations less dependent on exports, which alters trade flows. In later stages of development, economies become net consumers, as opposed to economies in early stages of development, which are net producers.
World Economic Growth, GDPAnnual change, percentage
6
4
2
1975 1979 1983 1991 1995 20031987 1999
World Air Freight, RTKsAnnual change, percentage
15
10
-5
1975 1979 1983 1991 1995 20031987 1999
0
5
World Air Cargo Forecast 2004/20058
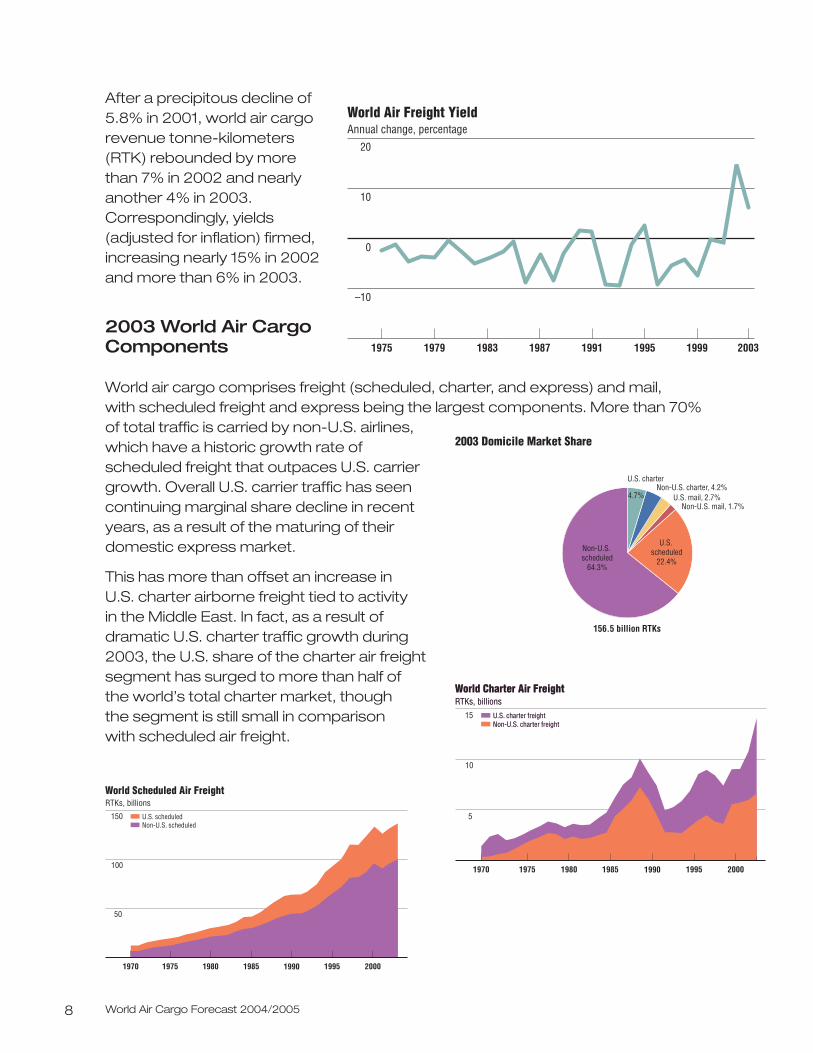
After a precipitous decline of5.8% in 2001, world air cargorevenue tonne-kilometers(RTK) rebounded by more than 7% in 2002 and nearlyanother 4% in 2003.Correspondingly, yields(adjusted for inflation) firmed,increasing nearly 15% in 2002and more than 6% in 2003.
2003 World Air CargoComponents
World air cargo comprises freight (scheduled, charter, and express) and mail, with scheduled freight and express being the largest components. More than 70% of total traffic is carried by non-U.S. airlines,which have a historic growth rate ofscheduled freight that outpaces U.S. carriergrowth. Overall U.S. carrier traffic has seencontinuing marginal share decline in recentyears, as a result of the maturing of theirdomestic express market.
This has more than offset an increase in U.S. charter airborne freight tied to activity in the Middle East. In fact, as a result ofdramatic U.S. charter traffic growth during2003, the U.S. share of the charter air freightsegment has surged to more than half of the world’s total charter market, though the segment is still small in comparison with scheduled air freight.
World Air Freight Yield Annual change, percentage
20
–10
10
0
1975 1979 1983 1991 19951987 20031999
50
100
150
World Scheduled Air FreightRTKs, billions
Non-U.S. scheduledU.S. scheduled
19751970 1980 1985 1995 20001990
World Charter Air FreightRTKs, billionsWorld Charter Air FreightRTKs, billions
Non-U.S. charter freightNon-U.S. charter freightU.S. charter freightU.S. charter freight
5
10
15
19751970 1980 1985 1995 20001990
156.5 billion RTKs
U.S. charter
4.7%Non-U.S. charter, 4.2%
U.S. mail, 2.7%Non-U.S. mail, 1.7%
U.S. scheduled
22.4%
2003 Domicile Market Share
Non-U.S. scheduled
64.3%
World Overview and Forecast 9
Forecasting Methods
Several approaches have been developed to handle both the range and complexity of managerial forecasting problems. Each has its special use, and some care should be taken when selecting the appropriate approach for a specific application. Four approaches –econometric modeling,judgmental evaluation, trend analysis, and potential analysis – provide useful forecasts.
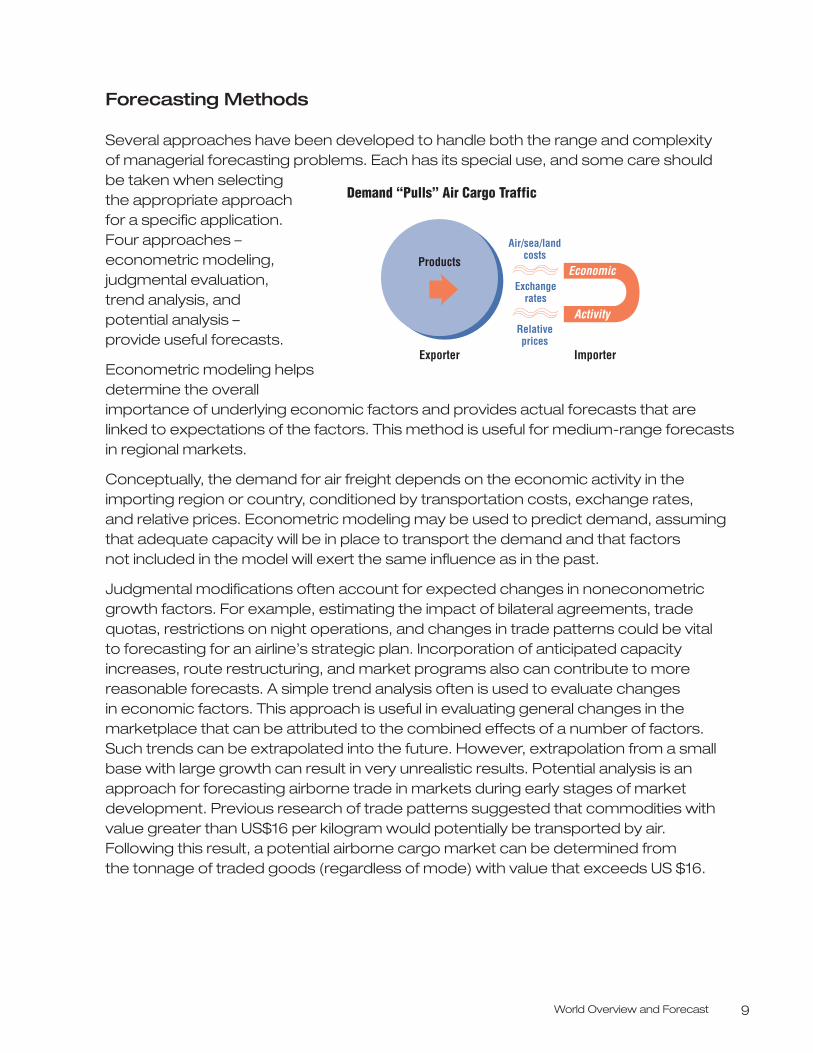
Econometric modeling helpsdetermine the overallimportance of underlying economic factors and provides actual forecasts that are linked to expectations of the factors. This method is useful for medium-range forecastsin regional markets.
Conceptually, the demand for air freight depends on the economic activity in theimporting region or country, conditioned by transportation costs, exchange rates, and relative prices. Econometric modeling may be used to predict demand, assumingthat adequate capacity will be in place to transport the demand and that factors not included in the model will exert the same influence as in the past.
Judgmental modifications often account for expected changes in noneconometricgrowth factors. For example, estimating the impact of bilateral agreements, tradequotas, restrictions on night operations, and changes in trade patterns could be vital to forecasting for an airline’s strategic plan. Incorporation of anticipated capacityincreases, route restructuring, and market programs also can contribute to morereasonable forecasts. A simple trend analysis often is used to evaluate changes in economic factors. This approach is useful in evaluating general changes in themarketplace that can be attributed to the combined effects of a number of factors. Such trends can be extrapolated into the future. However, extrapolation from a smallbase with large growth can result in very unrealistic results. Potential analysis is anapproach for forecasting airborne trade in markets during early stages of marketdevelopment. Previous research of trade patterns suggested that commodities withvalue greater than US$16 per kilogram would potentially be transported by air. Following this result, a potential airborne cargo market can be determined from the tonnage of traded goods (regardless of mode) with value that exceeds US $16.
Products
Exporter Importer
Exchange rates
Air/sea/land costs
Relative prices
Demand “Pulls” Air Cargo Traffic
Economic
Activity
World Air Cargo Forecast 2004/200510
Market Environment
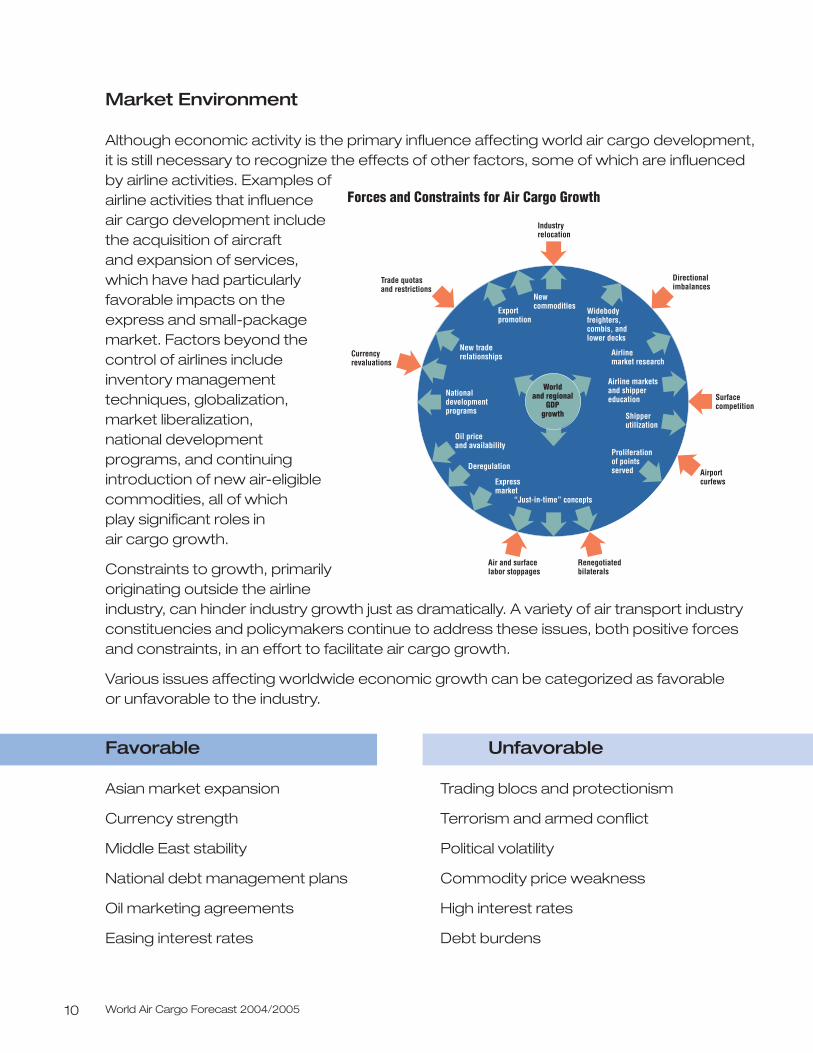
Although economic activity is the primary influence affecting world air cargo development,it is still necessary to recognize the effects of other factors, some of which are influencedby airline activities. Examples ofairline activities that influence air cargo development include the acquisition of aircraft and expansion of services,which have had particularlyfavorable impacts on theexpress and small-packagemarket. Factors beyond thecontrol of airlines includeinventory managementtechniques, globalization,market liberalization, national developmentprograms, and continuingintroduction of new air-eligiblecommodities, all of which play significant roles in air cargo growth.
Constraints to growth, primarilyoriginating outside the airlineindustry, can hinder industry growth just as dramatically. A variety of air transport industryconstituencies and policymakers continue to address these issues, both positive forcesand constraints, in an effort to facilitate air cargo growth.
Various issues affecting worldwide economic growth can be categorized as favorable or unfavorable to the industry.
Favorable Unfavorable
Asian market expansion Trading blocs and protectionism
Currency strength Terrorism and armed conflict
Middle East stability Political volatility
National debt management plans Commodity price weakness
Oil marketing agreements High interest rates
Easing interest rates Debt burdens
Forces and Constraints for Air Cargo Growth
Air and surface labor stoppages
Renegotiated bilaterals
Currency revaluations
National development programs
New trade relationships
Trade quotas and restrictions
Export promotion
New commodities
Industry relocation
Oil price and availability
Deregulation
Express market
“Just-in-time” concepts
Proliferation of points served Airport
curfews
Shipper utilization
Surface competition
Airline marketsand shipper education
Airline market research
Widebody freighters, combis, and lower decks
Directional imbalances
World and regional
GDP growth
World Overview and Forecast 11
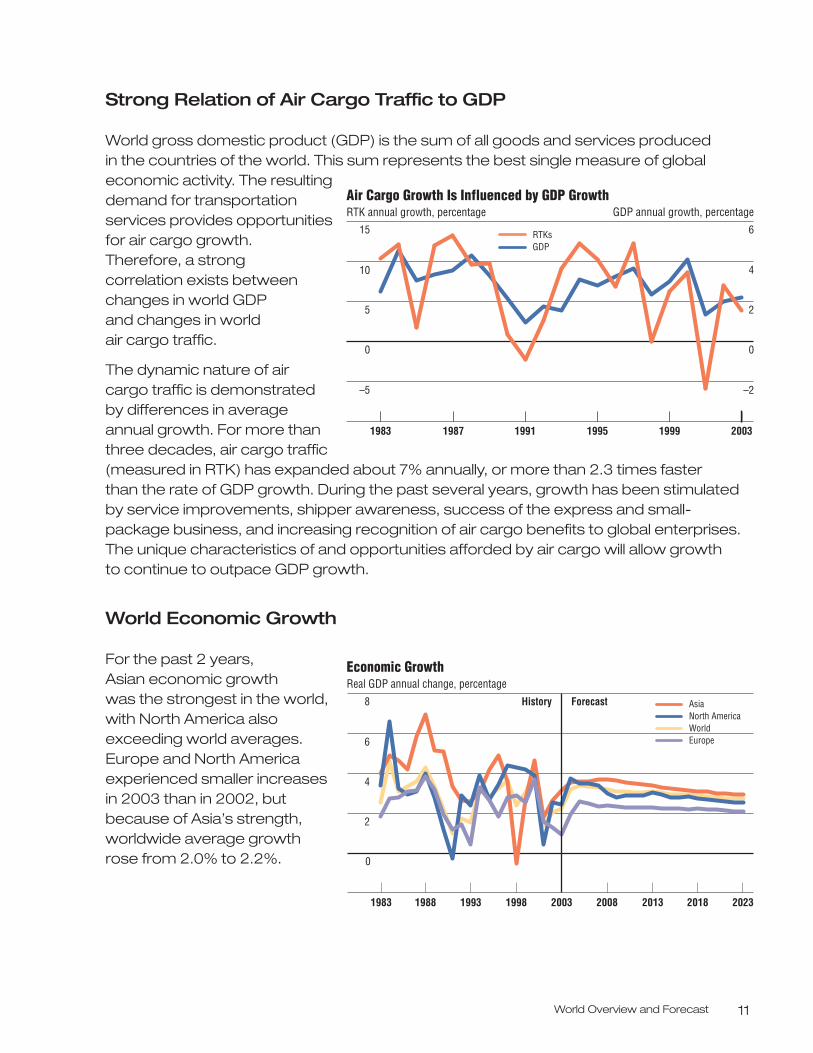
Strong Relation of Air Cargo Traffic to GDP
World gross domestic product (GDP) is the sum of all goods and services produced in the countries of the world. This sum represents the best single measure of globaleconomic activity. The resultingdemand for transportationservices provides opportunitiesfor air cargo growth. Therefore, a strong correlation exists betweenchanges in world GDP and changes in world air cargo traffic.
The dynamic nature of aircargo traffic is demonstratedby differences in averageannual growth. For more thanthree decades, air cargo traffic(measured in RTK) has expanded about 7% annually, or more than 2.3 times faster than the rate of GDP growth. During the past several years, growth has been stimulatedby service improvements, shipper awareness, success of the express and small-package business, and increasing recognition of air cargo benefits to global enterprises.The unique characteristics of and opportunities afforded by air cargo will allow growth to continue to outpace GDP growth.
World Economic Growth
For the past 2 years, Asian economic growth was the strongest in the world, with North America alsoexceeding world averages.Europe and North Americaexperienced smaller increasesin 2003 than in 2002, butbecause of Asia’s strength,worldwide average growthrose from 2.0% to 2.2%.
Air Cargo Growth Is Influenced by GDP Growth RTK annual growth, percentage
15
5
10
0
–5
6
2
4
0
–2
RTKsGDP
GDP annual growth, percentage
19991995199119871983 2003
Economic GrowthReal GDP annual change, percentage
8
4
2
6
0
History Forecast
1983 1993 2003 2008 2013 2018 2023
AsiaNorth AmericaWorldEurope
1988 1998
World Air Cargo Forecast 2004/200512
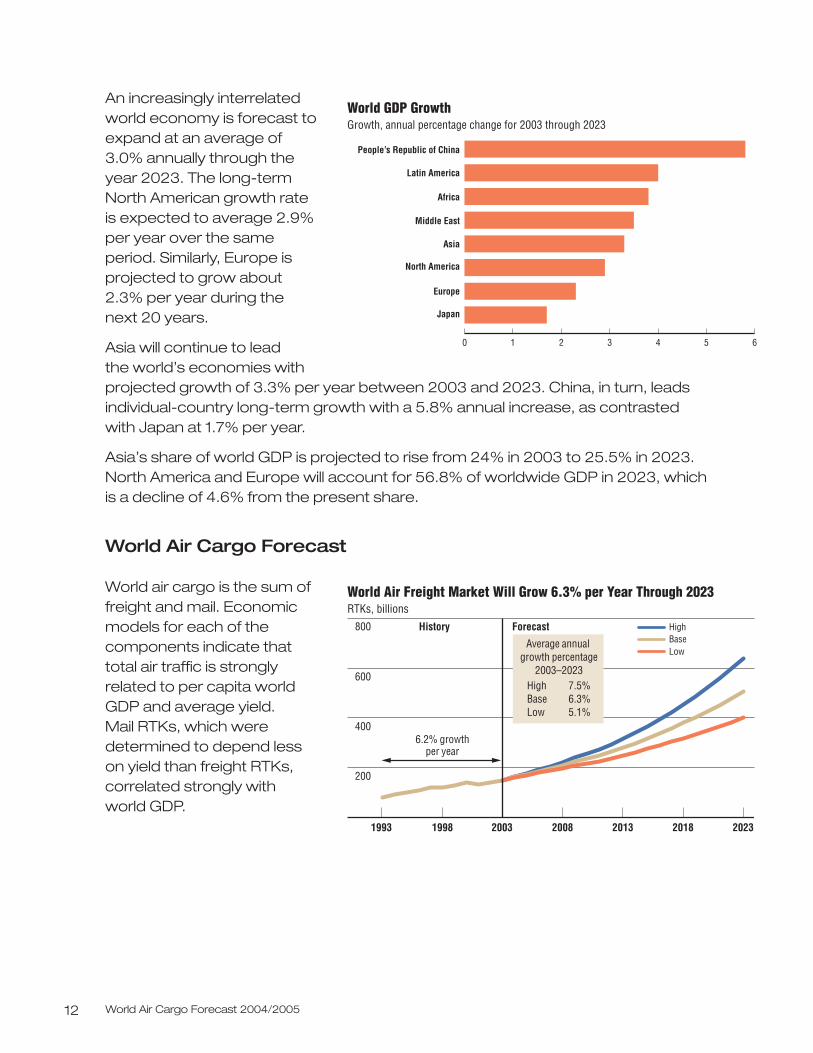
An increasingly interrelatedworld economy is forecast toexpand at an average of 3.0% annually through theyear 2023. The long-termNorth American growth rate is expected to average 2.9%per year over the sameperiod. Similarly, Europe isprojected to grow about 2.3% per year during the next 20 years.
Asia will continue to lead the world’s economies withprojected growth of 3.3% per year between 2003 and 2023. China, in turn, leadsindividual-country long-term growth with a 5.8% annual increase, as contrasted with Japan at 1.7% per year.
Asia’s share of world GDP is projected to rise from 24% in 2003 to 25.5% in 2023.North America and Europe will account for 56.8% of worldwide GDP in 2023, which is a decline of 4.6% from the present share.
World Air Cargo Forecast
World air cargo is the sum offreight and mail. Economicmodels for each of thecomponents indicate that total air traffic is stronglyrelated to per capita worldGDP and average yield. Mail RTKs, which weredetermined to depend less on yield than freight RTKs,correlated strongly with world GDP.
Japan
Europe
North America
Asia
Middle East
Africa
Latin America
People’s Republic of China
0 2 4 6
World GDP GrowthGrowth, annual percentage change for 2003 through 2023
31 5
2013
World Air Freight Market Will Grow 6.3% per Year Through 2023 RTKs, billions
800
600
400
200
20232018200820031993
HighBaseLow
History Forecast
Average annual growth percentage
2003–2023High 7.5%Base 6.3%Low 5.1%
6.2% growthper year
1998
World Overview and Forecast 13
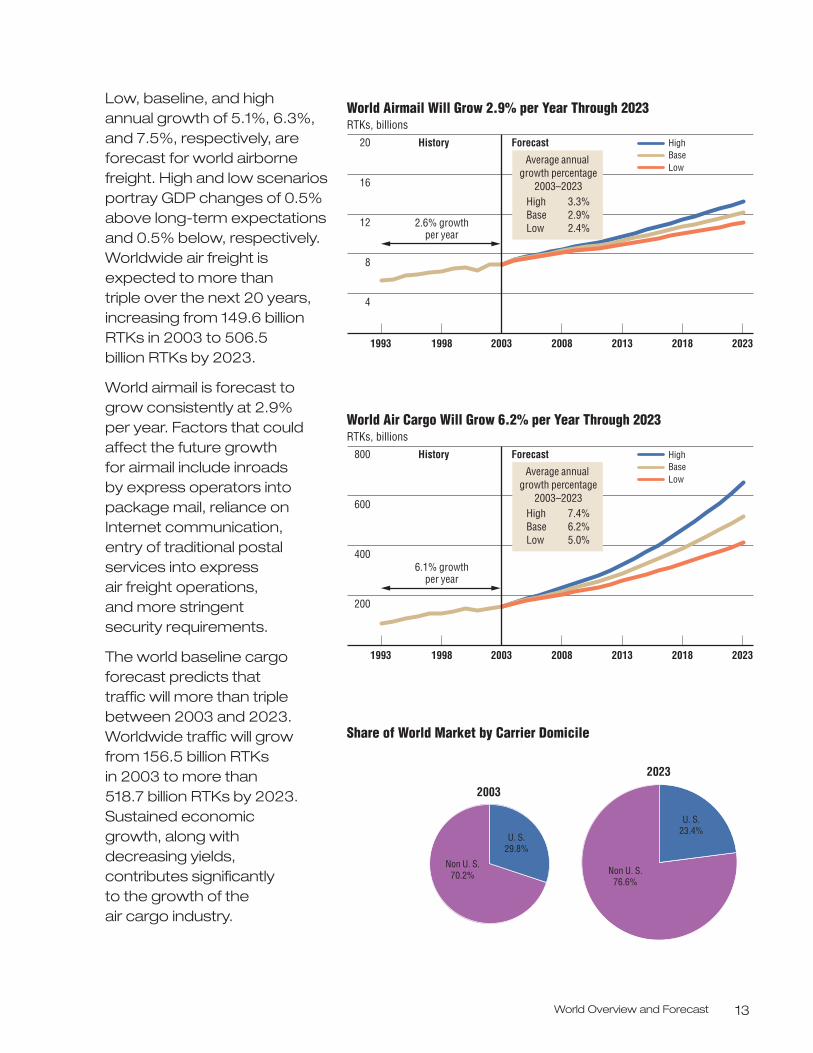
Low, baseline, and high annual growth of 5.1%, 6.3%,and 7.5%, respectively, areforecast for world airbornefreight. High and low scenariosportray GDP changes of 0.5%above long-term expectationsand 0.5% below, respectively.Worldwide air freight isexpected to more than triple over the next 20 years,increasing from 149.6 billionRTKs in 2003 to 506.5 billion RTKs by 2023.
World airmail is forecast to grow consistently at 2.9% per year. Factors that couldaffect the future growth for airmail include inroads by express operators intopackage mail, reliance onInternet communication, entry of traditional postalservices into express air freight operations, and more stringent security requirements.
The world baseline cargoforecast predicts that traffic will more than triplebetween 2003 and 2023.Worldwide traffic will growfrom 156.5 billion RTKsin 2003 to more than 518.7 billion RTKs by 2023.Sustained economic growth, along withdecreasing yields, contributes significantly to the growth of the air cargo industry.
2013
World Airmail Will Grow 2.9% per Year Through 2023 RTKs, billions
20
16
8
12
4
20232018200820031993
HighBaseLow
History Forecast
Average annual growth percentage
2003–2023High 3.3%Base 2.9%Low 2.4%2.6% growth
per year
1998
2013
World Air Cargo Will Grow 6.2% per Year Through 2023 RTKs, billions
800
600
400
200
20232018200820031993
HighBaseLow
History Forecast
Average annual growth percentage
2003–2023High 7.4%Base 6.2%Low 5.0%
6.1% growthper year
1998
2003
Share of World Market by Carrier Domicile
2023
U. S.23.4%
Non U. S.76.6%
Non U. S.70.2%
U. S.29.8%
World Air Cargo Forecast 2004/200514
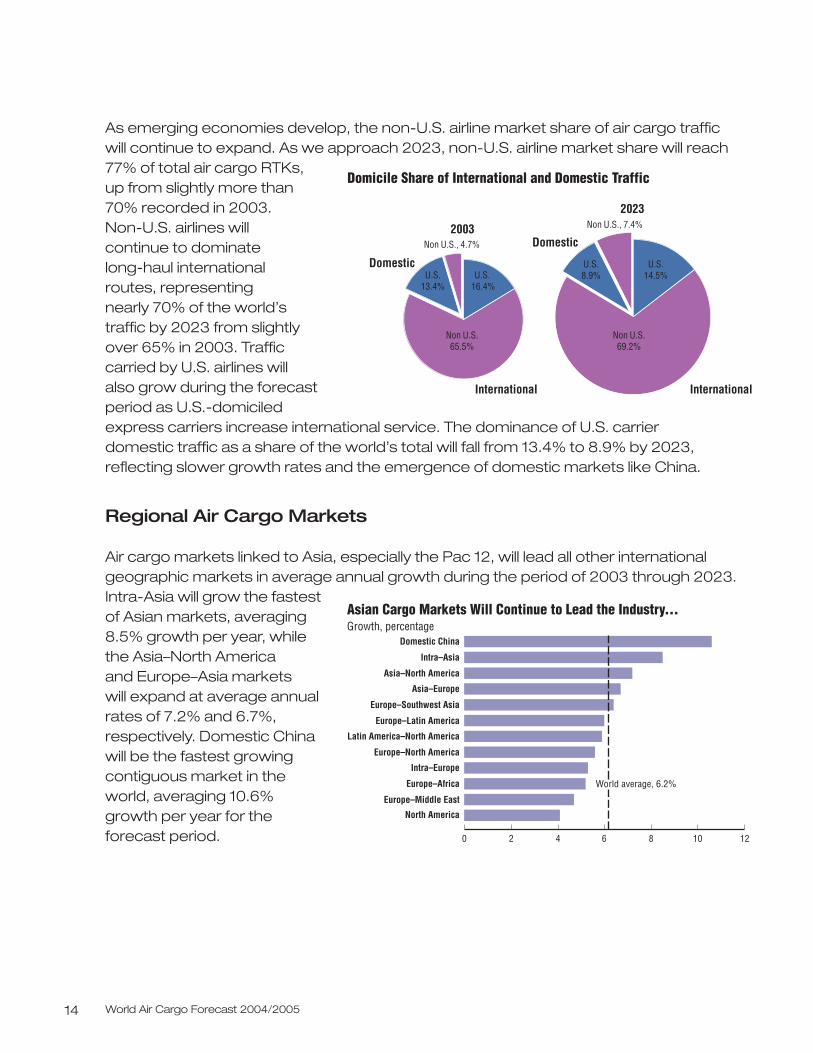
As emerging economies develop, the non-U.S. airline market share of air cargo trafficwill continue to expand. As we approach 2023, non-U.S. airline market share will reach77% of total air cargo RTKs, up from slightly more than 70% recorded in 2003. Non-U.S. airlines will continue to dominate long-haul international routes, representing nearly 70% of the world’s traffic by 2023 from slightlyover 65% in 2003. Trafficcarried by U.S. airlines will also grow during the forecastperiod as U.S.-domiciledexpress carriers increase international service. The dominance of U.S. carrier domestic traffic as a share of the world’s total will fall from 13.4% to 8.9% by 2023,reflecting slower growth rates and the emergence of domestic markets like China.
Regional Air Cargo Markets
Air cargo markets linked to Asia, especially the Pac 12, will lead all other internationalgeographic markets in average annual growth during the period of 2003 through 2023.Intra-Asia will grow the fastestof Asian markets, averaging8.5% growth per year, whilethe Asia–North America and Europe–Asia markets will expand at average annualrates of 7.2% and 6.7%,respectively. Domestic Chinawill be the fastest growingcontiguous market in theworld, averaging 10.6%growth per year for theforecast period.
2003
Domicile Share of International and Domestic Traffic
2023
Domestic
Domestic
InternationalInternational
U.S.8.9%
Non U.S., 7.4%
U.S. 14.5%
Non U.S. 69.2%
U.S.13.4%
Non U.S., 4.7%
U.S. 16.4%
Non U.S. 65.5%
Domestic China
Intra–Asia
Asia–North America
Asia–Europe
Europe–Southwest Asia
Europe–Latin America Latin America–North America
Europe–North America
Intra–Europe
Europe–Africa
Europe–Middle East
North America
0 2 4 6 8 10 12
Asian Cargo Markets Will Continue to Lead the Industry...Growth, percentage
World average, 6.2%
World Overview and Forecast 15
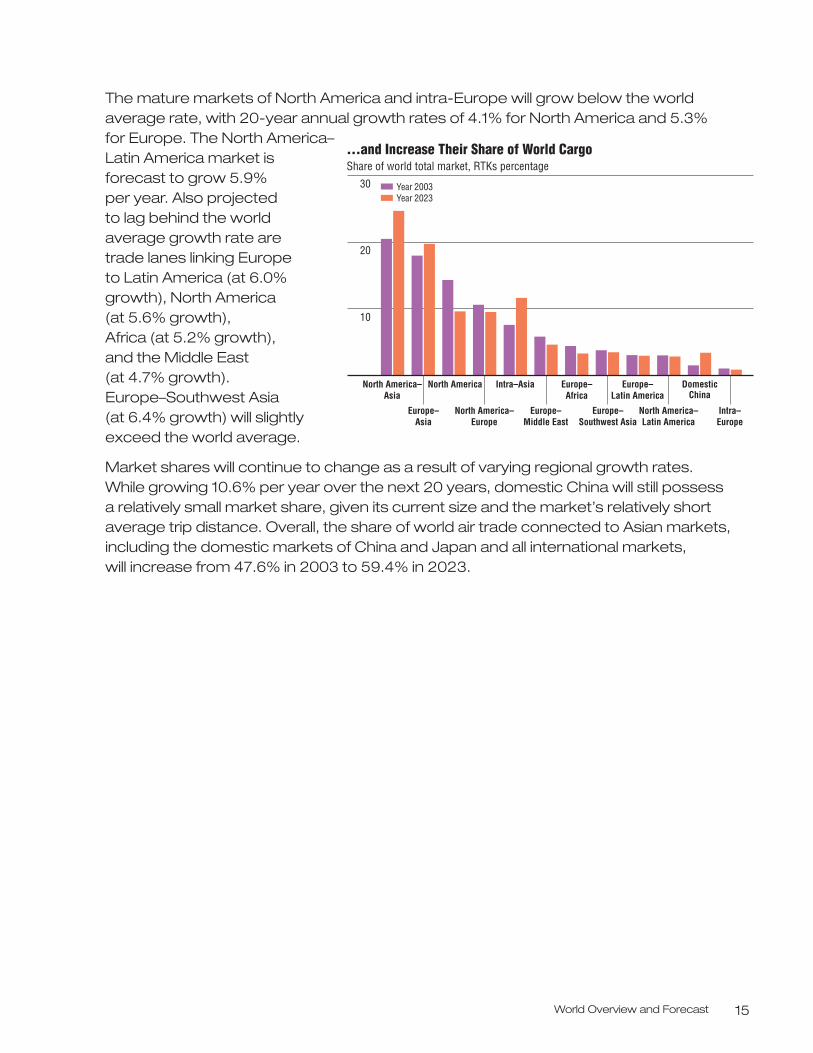
The mature markets of North America and intra-Europe will grow below the worldaverage rate, with 20-year annual growth rates of 4.1% for North America and 5.3% for Europe. The North America–Latin America market isforecast to grow 5.9% per year. Also projected to lag behind the world average growth rate are trade lanes linking Europe to Latin America (at 6.0%growth), North America (at 5.6% growth), Africa (at 5.2% growth), and the Middle East (at 4.7% growth).Europe–Southwest Asia (at 6.4% growth) will slightlyexceed the world average.
Market shares will continue to change as a result of varying regional growth rates. While growing 10.6% per year over the next 20 years, domestic China will still possess a relatively small market share, given its current size and the market’s relatively shortaverage trip distance. Overall, the share of world air trade connected to Asian markets,including the domestic markets of China and Japan and all international markets, will increase from 47.6% in 2003 to 59.4% in 2023.
30
20
10
...and Increase Their Share of World CargoShare of world total market, RTKs percentage
Year 2023Year 2003
North America– Asia
Intra–Asia Europe– Africa
Europe– Latin America
Domestic China
Europe– Asia
North America– Europe
Europe– Southwest Asia
North America– Latin America
Europe–Middle East
Intra– Europe
North America
North America 17
North America
North America Market Grew in 2003
The North America market consists of air freight moving to, from, and within Canada and the United States. The North America market accounts for 14.3% of the world’s air cargo traffic in tonne-kilometers and 22.6% in pure tonnage. In 2003, the North America market grew 0.7%, following growth of 1.9% in 2002, and acontraction of 9.8% in 2001.
U.S. Domestic Air Cargo in 2003
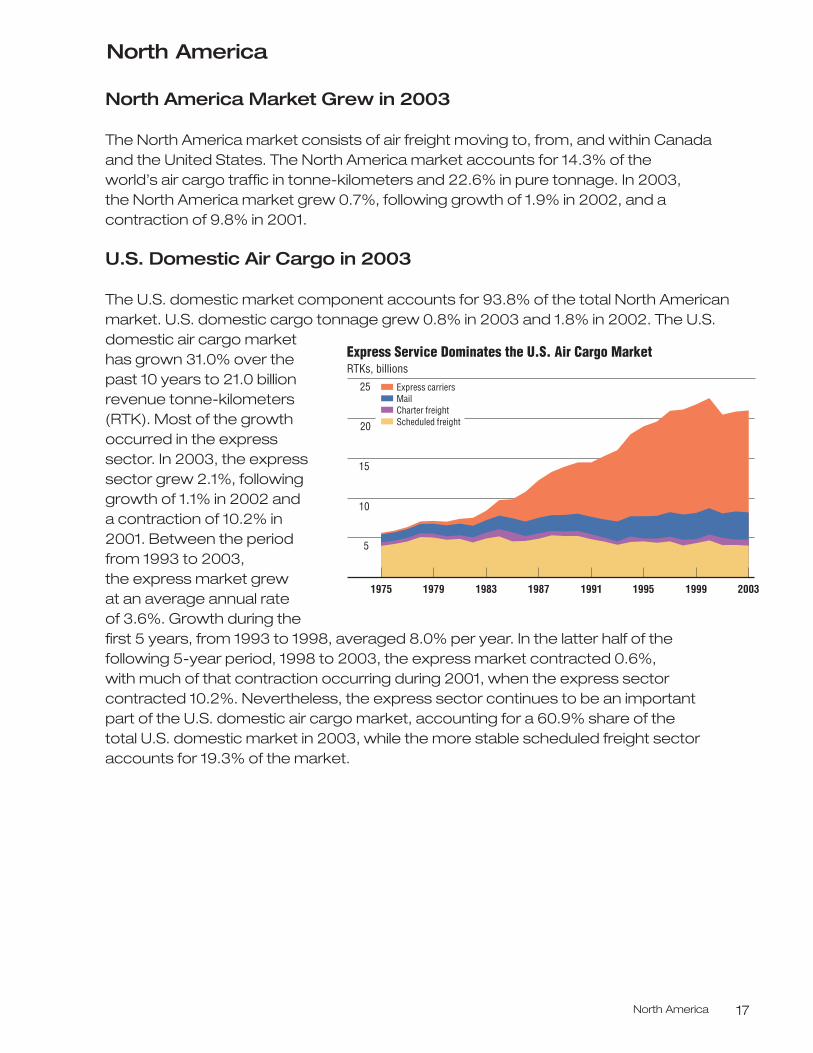
The U.S. domestic market component accounts for 93.8% of the total North Americanmarket. U.S. domestic cargo tonnage grew 0.8% in 2003 and 1.8% in 2002. The U.S.domestic air cargo market has grown 31.0% over thepast 10 years to 21.0 billionrevenue tonne-kilometers(RTK). Most of the growthoccurred in the expresssector. In 2003, the expresssector grew 2.1%, followinggrowth of 1.1% in 2002 and a contraction of 10.2% in2001. Between the periodfrom 1993 to 2003, the express market grew at an average annual rate of 3.6%. Growth during thefirst 5 years, from 1993 to 1998, averaged 8.0% per year. In the latter half of the following 5-year period, 1998 to 2003, the express market contracted 0.6%, with much of that contraction occurring during 2001, when the express sectorcontracted 10.2%. Nevertheless, the express sector continues to be an important part of the U.S. domestic air cargo market, accounting for a 60.9% share of the total U.S. domestic market in 2003, while the more stable scheduled freight sectoraccounts for 19.3% of the market.
1975 1979 1983 1991 1995
5
10
15
20
25
Express Service Dominates the U.S. Air Cargo MarketRTKs, billions
Charter freightMail
Scheduled freight
Express carriers
1987 1999 2003
World Air Cargo Forecast 2004/200518
Canadian Domestic Air Cargo in 2003
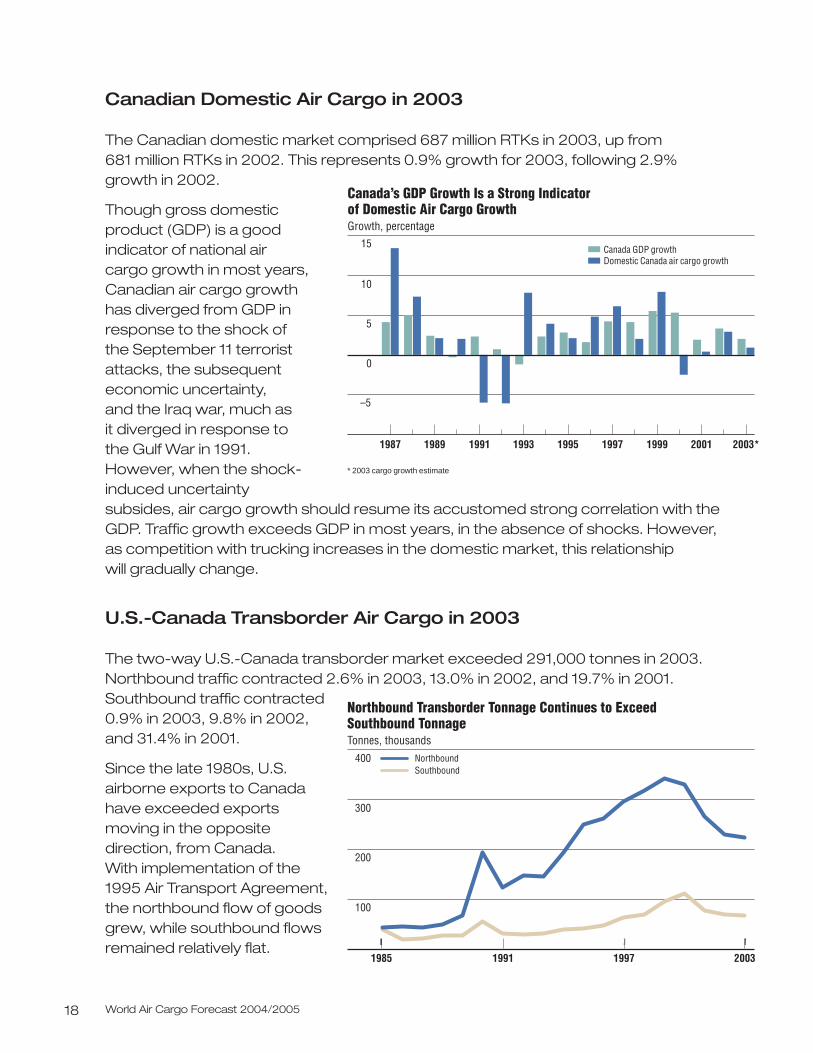
The Canadian domestic market comprised 687 million RTKs in 2003, up from 681 million RTKs in 2002. This represents 0.9% growth for 2003, following 2.9%growth in 2002.
Though gross domesticproduct (GDP) is a goodindicator of national air cargo growth in most years,Canadian air cargo growth has diverged from GDP inresponse to the shock of the September 11 terroristattacks, the subsequenteconomic uncertainty, and the Iraq war, much asit diverged in response to the Gulf War in 1991.However, when the shock-induced uncertaintysubsides, air cargo growth should resume its accustomed strong correlation with theGDP. Traffic growth exceeds GDP in most years, in the absence of shocks. However, as competition with trucking increases in the domestic market, this relationship will gradually change.
U.S.-Canada Transborder Air Cargo in 2003
The two-way U.S.-Canada transborder market exceeded 291,000 tonnes in 2003.Northbound traffic contracted 2.6% in 2003, 13.0% in 2002, and 19.7% in 2001.Southbound traffic contracted0.9% in 2003, 9.8% in 2002,and 31.4% in 2001.
Since the late 1980s, U.S.airborne exports to Canadahave exceeded exportsmoving in the oppositedirection, from Canada. With implementation of the1995 Air Transport Agreement,the northbound flow of goodsgrew, while southbound flowsremained relatively flat.
–5
0
10
5
15
Canada’s GDP Growth Is a Strong Indicatorof Domestic Air Cargo GrowthGrowth, percentage
Domestic Canada air cargo growthCanada GDP growth
2001 2003*1999199719951993199119891987
* 2003 cargo growth estimate
1985 1991 1997 2003
400
300
200
100
Northbound Transborder Tonnage Continues to Exceed Southbound TonnageTonnes, thousands
NorthboundSouthbound
North America 19
The greatest share of goods moving northbound by air includes computersubassemblies, documents, and motor vehicle parts. Southbound flows are dominated by telecommunication equipment, documents, and crustaceans
Time-Deferred Services
Time-deferred services, which include 2- and 3-day delivery services, include time-definite services beyond those delivery periods. Deferred services, which are lessexpensive than traditional overnight express shipments, appeal to shippers who need to reduce shipping costs but still require time-definite transport. Such lower costofferings often imply lower yields and profits.
The success of air express companies with time-deferred service has attracted othertransportation providers, including combination carriers, combinations of transportationproviders/brokers and less-than-truckload (LTL) shipping companies. Ground-basedlogistics companies offer time-deferred services with similar reliability, yet lower costthan traditional air express carriers
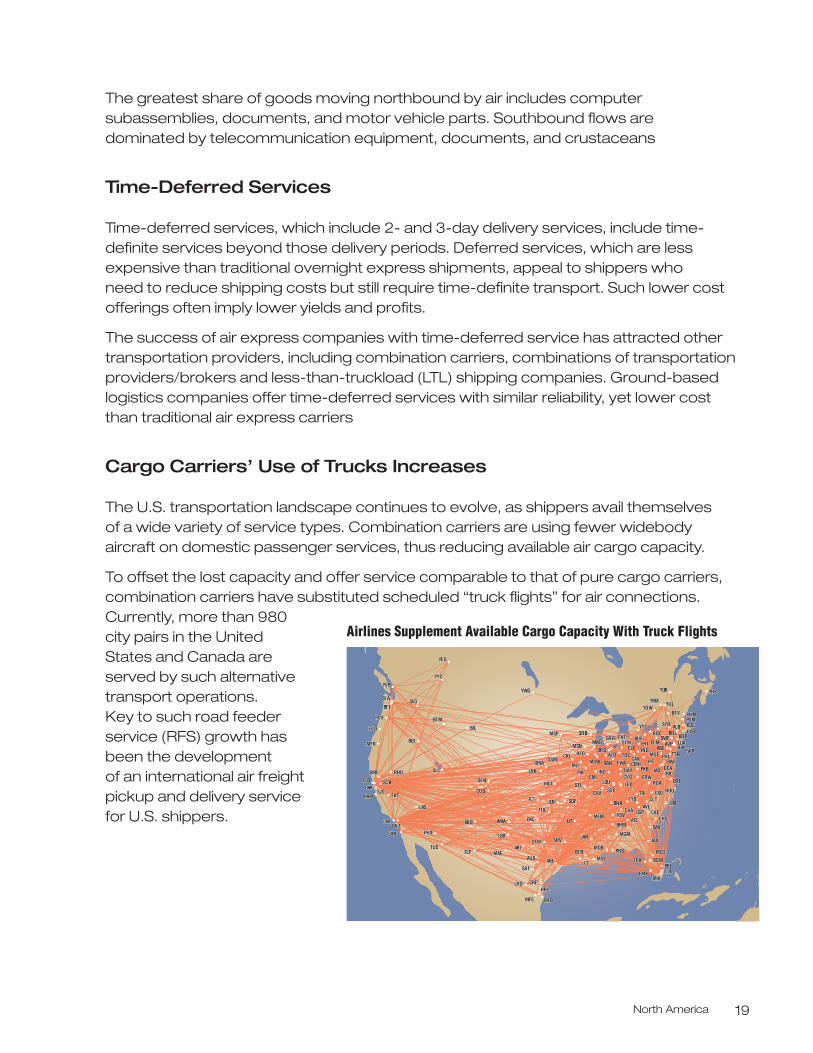
Cargo Carriers’ Use of Trucks Increases
The U.S. transportation landscape continues to evolve, as shippers avail themselves of a wide variety of service types. Combination carriers are using fewer widebodyaircraft on domestic passenger services, thus reducing available air cargo capacity.
To offset the lost capacity and offer service comparable to that of pure cargo carriers,combination carriers have substituted scheduled “truck flights” for air connections.Currently, more than 980city pairs in the UnitedStates and Canada areserved by such alternativetransport operations. Key to such road feederservice (RFS) growth hasbeen the development of an international air freightpickup and delivery servicefor U.S. shippers.
Airlines Supplement Available Cargo Capacity With Truck Flights
ALALBBDBDL BDBDR
BOSBOS
SWSWF
SYSYR
AVAVELELMJFJFKLGALGA
T L
PVPVD
BTBTR
DSDSM
ICTICT
JAJAN
JLJLN
LFLFT
LILIT
LNLNK
MCMCI
MEMEM
MGMGM
MOMOB
MSMSY
OKCOKC
OMOMA
PNPNS
SGFSGF
TULTUL
ABABI
ABABQ AMAMA
AUAUS
BRBRO
COCOS
CRPCRP
DEDEN
DFWDFW
ELPELP
FAFAT
HRLHRL
IAIAH
LASLAS
LAXLAX
LBBLBB
LRLRD
MAMAF
MFMFE
MRMR
OAKOAK
ONONTPHPHX
RNORNO
SASAN
SASAT
SCSCKSFSFO
SHSHV
SJSJC
SLCSLCSMSMF
TUSTUS
ATATL
AVAVL
BHBHM
BNBNA
BOBOW
CACAECHACHA
CHSCHS
CLCLT
FLFLLFMFMY
GSOGSO
GSPGSPHSHSV
ILILM
JAJAX
LELEX
MCOMCO
MIAMIA
PBPBI
RDURDUROROA
SASAV
TPTPA
TRITRITYTYS
ABABEAZAZO
BTBTL
CACAKCIDCIDCLCLE
CMHCMHDADAY
DTWDTW
FWFWAMDMD
MDMDWMLMLI
MSMSN
PIPIA
PIPITPKPKB
RFDRFD
SBSBN
STSTL
TOTOLBWBWI
CMICMI CRWCRWCVCVG
DCADCA
EVEVV
EWEWR
IAIADINDIND
LOULOU ORORF
PHPH
RICRIC
SDSDF
TTTTNYNYNG
P
BTBTV
BUBUFERER
FNTFNTGRGRB
GRGRRMKMKE
MSMSP
PSPSMPWPWM
ROROC
YHYHZ
YMYMXYOYOW
YQBYQB
YUYUL
YYYY
Y
BFBFI
BOBOI
BTBTM
EUEUG
GEGGEG
MFMFR
PDPDX
SESEA
YEYEG
YVYVR
YYYYC
BIBIL
IORORD
YWYWG
Z ALBBDL BDR
BOS
SWF
SYR
AVELMJFKLGA
T L
PVD
BTR
DSM
ICT
JAN
JLN
LFT
LIT
LNK
MCI
MEM
MGM
MOB
MSY
OKC
OMA
PNS
SGF
TUL
ABI
ABQ AMA
AUS
BRO
COS
CRP
DEN
DFW
ELP
FAT
HRL
IAH
LAS
LAX
LBB
LRD
MAF
MFE
MR
OAK
ONTPHX
RNO
SAN
SAT
SCKSFO
SHV
SJC
SLCSMF
TUS
ATL
AVL
BHM
BNA
BOW
CAECHA
CHS
CLT
FLLFMY
GSO
GSPHSV
ILM
JAX
LEX
MCO
MIA
PBI
RDUROA
SAV
TPA
TRITYS
ABEAZO
BTL
CAKCIDCLE
CMHDAY
DTW
FWAMD
MDWMLI
MSN
PIA
PITPKB
RFD
SBN
STL
TOLBWI
CMI CRWCVG
DCA
EVV
EWR
IADIND
LOU ORF
PH
RIC
SDF
TTNYNG
P
BTV
BUFER
FNTGRB
GRRMKE
MSP
PSMPWM
ROC
YHZ
YMXYOW
YQB
YUL
YY
Y
BFI
BOI
BTM
EUG
GEG
MFR
PDX
SEA
YEG
YVR
YYC
BIL
IORD
YWG
Z
World Air Cargo Forecast 2004/200520
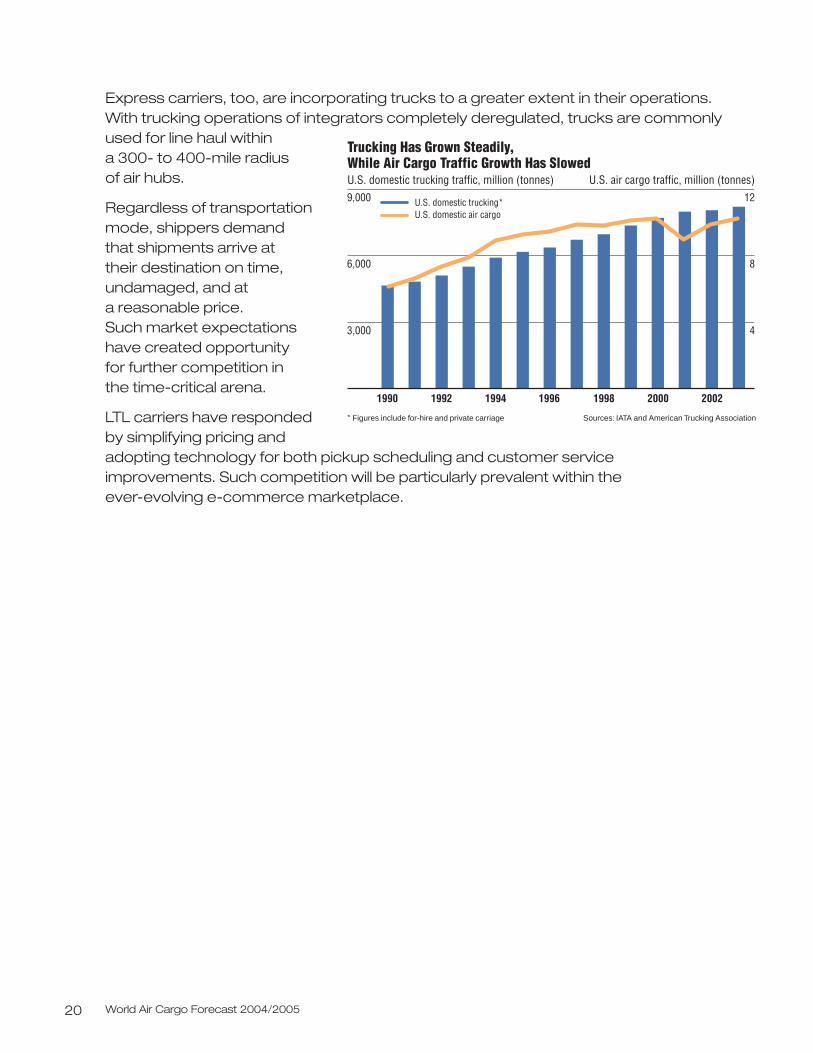
Express carriers, too, are incorporating trucks to a greater extent in their operations.With trucking operations of integrators completely deregulated, trucks are commonly used for line haul within a 300- to 400-mile radius of air hubs.
Regardless of transportationmode, shippers demand that shipments arrive at their destination on time,undamaged, and at a reasonable price. Such market expectationshave created opportunity for further competition in the time-critical arena.
LTL carriers have respondedby simplifying pricing andadopting technology for both pickup scheduling and customer serviceimprovements. Such competition will be particularly prevalent within the ever-evolving e-commerce marketplace.
Trucking Has Grown Steadily, While Air Cargo Traffic Growth Has SlowedU.S. domestic trucking traffic, million (tonnes)9,000
6,000
3,000
12
8
4
1990 1992 1994 1996 1998 2000 2002
U.S. domestic trucking*U.S. domestic air cargo
U.S. air cargo traffic, million (tonnes)
* Figures include for-hire and private carriage Sources: IATA and American Trucking Association
North America 21
North America Economy and Forecast
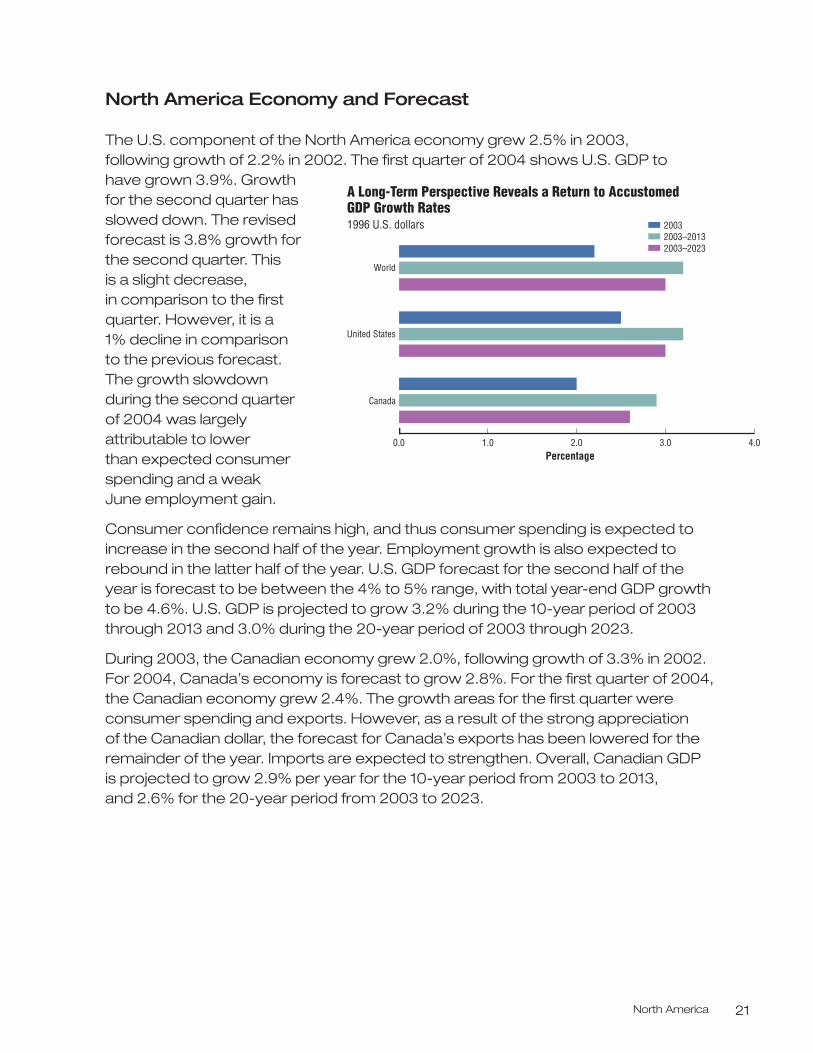
The U.S. component of the North America economy grew 2.5% in 2003, following growth of 2.2% in 2002. The first quarter of 2004 shows U.S. GDP to have grown 3.9%. Growth for the second quarter hasslowed down. The revisedforecast is 3.8% growth for the second quarter. This is a slight decrease, in comparison to the firstquarter. However, it is a 1% decline in comparison to the previous forecast. The growth slowdown during the second quarter of 2004 was largelyattributable to lowerthan expected consumerspending and a weak June employment gain.
Consumer confidence remains high, and thus consumer spending is expected toincrease in the second half of the year. Employment growth is also expected to rebound in the latter half of the year. U.S. GDP forecast for the second half of the year is forecast to be between the 4% to 5% range, with total year-end GDP growth to be 4.6%. U.S. GDP is projected to grow 3.2% during the 10-year period of 2003 through 2013 and 3.0% during the 20-year period of 2003 through 2023.
During 2003, the Canadian economy grew 2.0%, following growth of 3.3% in 2002. For 2004, Canada’s economy is forecast to grow 2.8%. For the first quarter of 2004, the Canadian economy grew 2.4%. The growth areas for the first quarter wereconsumer spending and exports. However, as a result of the strong appreciation of the Canadian dollar, the forecast for Canada’s exports has been lowered for theremainder of the year. Imports are expected to strengthen. Overall, Canadian GDP is projected to grow 2.9% per year for the 10-year period from 2003 to 2013,and 2.6% for the 20-year period from 2003 to 2023.
0.0 1.0 2.0 3.0 4.0
Canada
United States
World
A Long-Term Perspective Reveals a Return to Accustomed GDP Growth Rates1996 U.S. dollars
2003–20232003–20132003
Percentage
World Air Cargo Forecast 2004/200522
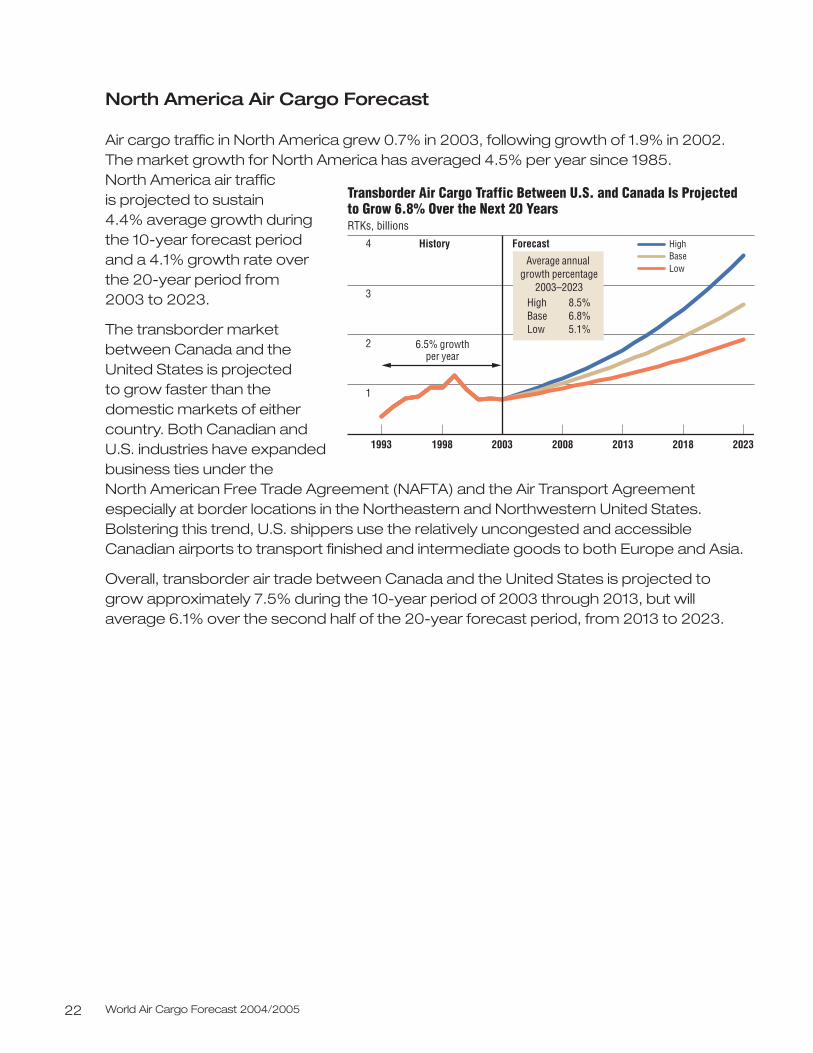
North America Air Cargo Forecast
Air cargo traffic in North America grew 0.7% in 2003, following growth of 1.9% in 2002.The market growth for North America has averaged 4.5% per year since 1985. North America air traffic is projected to sustain 4.4% average growth during the 10-year forecast period and a 4.1% growth rate overthe 20-year period from 2003 to 2023.
The transborder marketbetween Canada and theUnited States is projected to grow faster than thedomestic markets of eithercountry. Both Canadian andU.S. industries have expandedbusiness ties under the North American Free Trade Agreement (NAFTA) and the Air Transport Agreementespecially at border locations in the Northeastern and Northwestern United States.Bolstering this trend, U.S. shippers use the relatively uncongested and accessibleCanadian airports to transport finished and intermediate goods to both Europe and Asia.
Overall, transborder air trade between Canada and the United States is projected togrow approximately 7.5% during the 10-year period of 2003 through 2013, but will average 6.1% over the second half of the 20-year forecast period, from 2013 to 2023.
2013
Transborder Air Cargo Traffic Between U.S. and Canada Is Projected to Grow 6.8% Over the Next 20 YearsRTKs, billions
4
3
2
1
20232018200820031993
HighBaseLow
History Forecast
Average annual growth percentage
2003–2023High 8.5%Base 6.8%Low 5.1%
6.5% growthper year
1998
North America 23
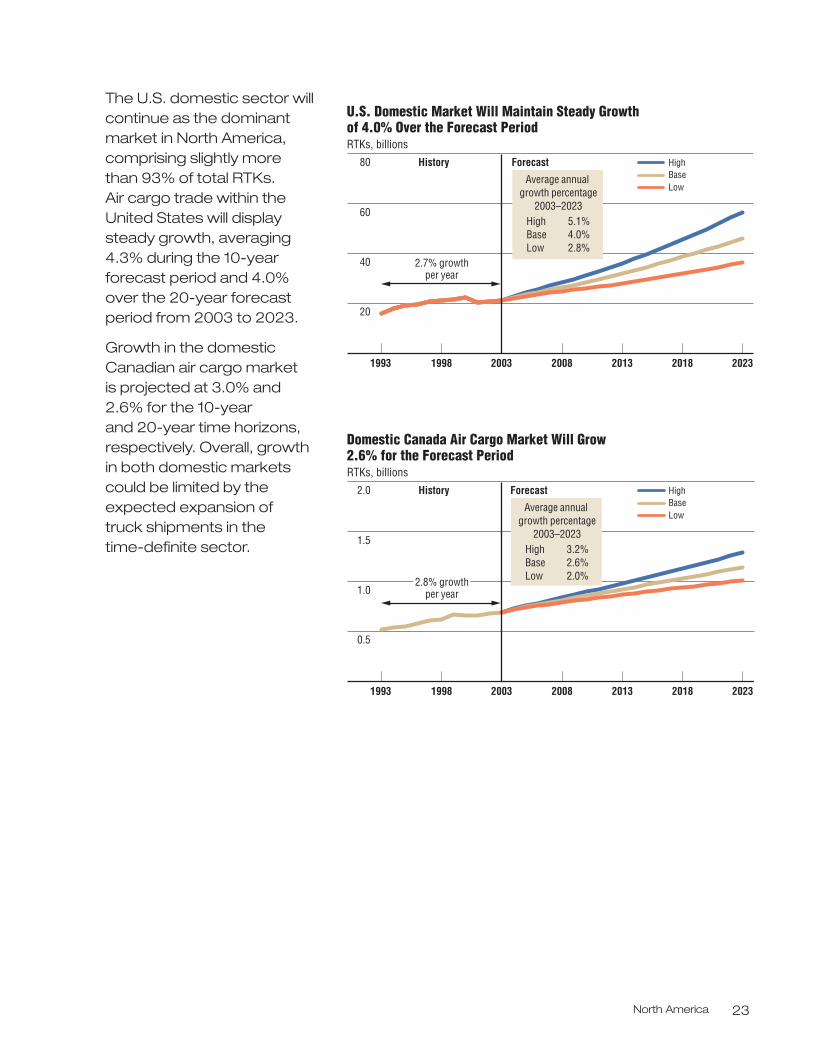
The U.S. domestic sector willcontinue as the dominantmarket in North America,comprising slightly more than 93% of total RTKs. Air cargo trade within theUnited States will displaysteady growth, averaging4.3% during the 10-yearforecast period and 4.0%over the 20-year forecastperiod from 2003 to 2023.
Growth in the domesticCanadian air cargo market is projected at 3.0% and 2.6% for the 10-year and 20-year time horizons,respectively. Overall, growthin both domestic marketscould be limited by theexpected expansion of truck shipments in the time-definite sector.
2013
U.S. Domestic Market Will Maintain Steady Growth of 4.0% Over the Forecast PeriodRTKs, billions
80
60
40
20
20232018200820031993
HighBaseLow
History Forecast
Average annual growth percentage
2003–2023High 5.1%Base 4.0%Low 2.8%
2.7% growthper year
1998
2013
Domestic Canada Air Cargo Market Will Grow 2.6% for the Forecast Period RTKs, billions
2.0
1.5
1.0
0.5
20232018200820031993
HighBaseLow
History Forecast
Average annual growth percentage
2003–2023High 3.2%Base 2.6%Low 2.0%2.8% growth
per year
1998
Latin America and North America 25
Latin America and North America
Trade With America Is Uneven Among Latin America Regions
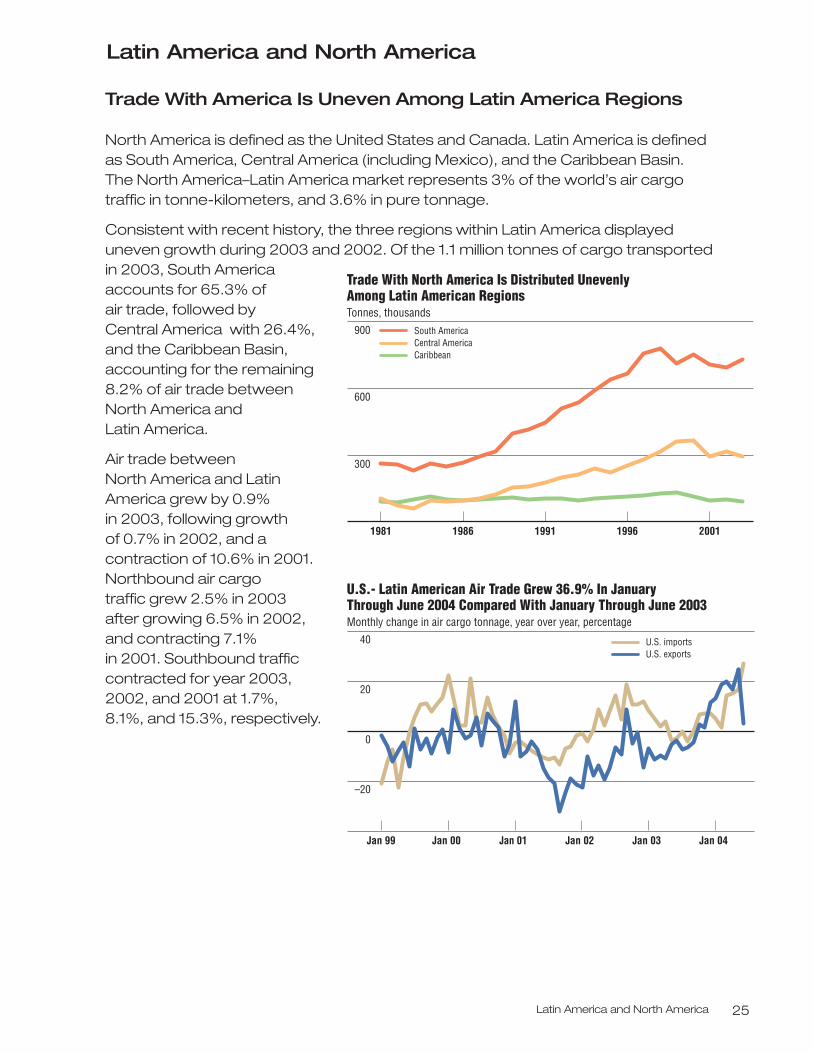
North America is defined as the United States and Canada. Latin America is defined as South America, Central America (including Mexico), and the Caribbean Basin. The North America–Latin America market represents 3% of the world’s air cargotraffic in tonne-kilometers, and 3.6% in pure tonnage.
Consistent with recent history, the three regions within Latin America displayeduneven growth during 2003 and 2002. Of the 1.1 million tonnes of cargo transportedin 2003, South Americaaccounts for 65.3% of air trade, followed by Central America with 26.4%,and the Caribbean Basin, accounting for the remaining8.2% of air trade between North America and Latin America.
Air trade between North America and LatinAmerica grew by 0.9% in 2003, following growth of 0.7% in 2002, and a contraction of 10.6% in 2001.Northbound air cargo traffic grew 2.5% in 2003after growing 6.5% in 2002, and contracting 7.1% in 2001. Southbound trafficcontracted for year 2003,2002, and 2001 at 1.7%, 8.1%, and 15.3%, respectively.
Trade With North America Is Distributed Unevenly Among Latin American RegionsTonnes, thousands
900
600
300
1981 19911986 1996 2001
South AmericaCentral AmericaCaribbean
U.S.- Latin American Air Trade Grew 36.9% In January Through June 2004 Compared With January Through June 2003Monthly change in air cargo tonnage, year over year, percentage
40
20
0
–20
Jan 99 Jan 00 Jan 02 Jan 03
U.S. importsU.S. exports
Jan 01 Jan 04
World Air Cargo Forecast 2004/200526
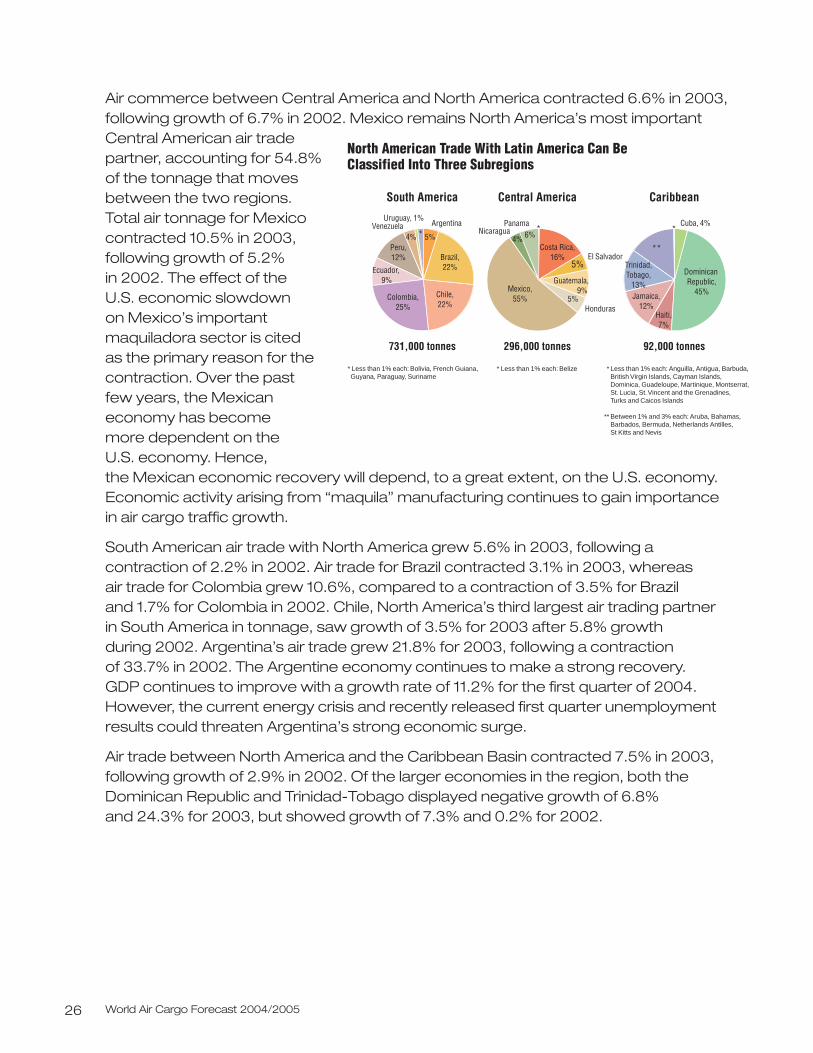
Air commerce between Central America and North America contracted 6.6% in 2003,following growth of 6.7% in 2002. Mexico remains North America’s most importantCentral American air tradepartner, accounting for 54.8%of the tonnage that movesbetween the two regions. Total air tonnage for Mexicocontracted 10.5% in 2003,following growth of 5.2% in 2002. The effect of the U.S. economic slowdown on Mexico’s importantmaquiladora sector is cited as the primary reason for thecontraction. Over the past few years, the Mexicaneconomy has become more dependent on the U.S. economy. Hence, the Mexican economic recovery will depend, to a great extent, on the U.S. economy.Economic activity arising from “maquila” manufacturing continues to gain importancein air cargo traffic growth.
South American air trade with North America grew 5.6% in 2003, following acontraction of 2.2% in 2002. Air trade for Brazil contracted 3.1% in 2003, whereas air trade for Colombia grew 10.6%, compared to a contraction of 3.5% for Brazil and 1.7% for Colombia in 2002. Chile, North America’s third largest air trading partnerin South America in tonnage, saw growth of 3.5% for 2003 after 5.8% growth during 2002. Argentina’s air trade grew 21.8% for 2003, following a contraction of 33.7% in 2002. The Argentine economy continues to make a strong recovery. GDP continues to improve with a growth rate of 11.2% for the first quarter of 2004.However, the current energy crisis and recently released first quarter unemploymentresults could threaten Argentina’s strong economic surge.
Air trade between North America and the Caribbean Basin contracted 7.5% in 2003,following growth of 2.9% in 2002. Of the larger economies in the region, both theDominican Republic and Trinidad-Tobago displayed negative growth of 6.8% and 24.3% for 2003, but showed growth of 7.3% and 0.2% for 2002.
North American Trade With Latin America Can Be Classified Into Three Subregions
92,000 tonnes
Caribbean
296,000 tonnes
Central America
731,000 tonnes
South America
* Less than 1% each: Bolivia, French Guiana, Guyana, Paraguay, Suriname
* Less than 1% each: Belize *
**
Less than 1% each: Anguilla, Antigua, Barbuda, British Virgin Islands, Cayman Islands, Dominica, Guadeloupe, Martinique, Montserrat, St. Lucia, St. Vincent and the Grenadines, Turks and Caicos Islands
Between 1% and 3% each: Aruba, Bahamas, Barbados, Bermuda, Netherlands Antilles, St Kitts and Nevis
Jamaica,12%
Trinidad,Tobago,
13%
ArgentinaUruguay, 1%
Venezuela
Brazil,22%
Chile,22%
Colombia,25%
Ecuador, 9%
Peru,12%
Mexico,55%
El Salvador
Guatemala, 9%
Honduras
NicaraguaPanama
Haiti,7%
*
**
**Cuba, 4%
Dominican Republic,
45%
5%
5%
4% 6%5%4%Costa Rica,
16%
Latin America and North America 27
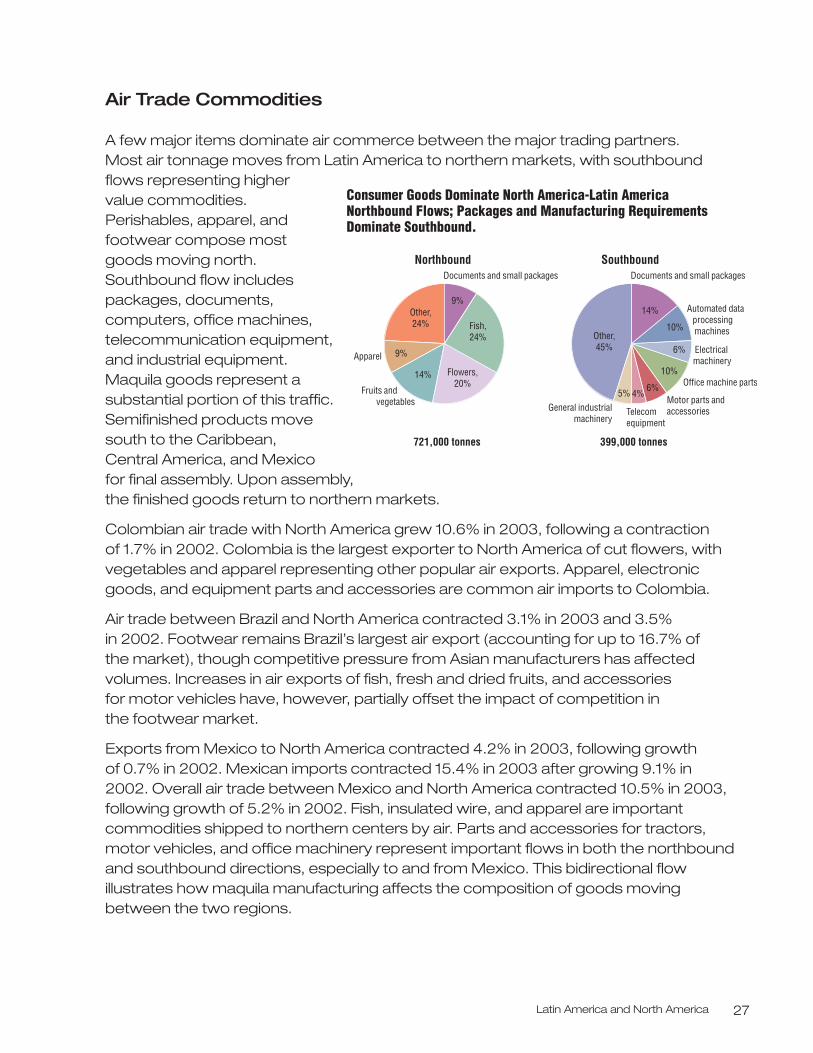
Air Trade Commodities
A few major items dominate air commerce between the major trading partners. Most air tonnage moves from Latin America to northern markets, with southboundflows representing higher value commodities.Perishables, apparel, andfootwear compose mostgoods moving north.Southbound flow includespackages, documents,computers, office machines,telecommunication equipment,and industrial equipment.Maquila goods represent asubstantial portion of this traffic.Semifinished products movesouth to the Caribbean, Central America, and Mexicofor final assembly. Upon assembly, the finished goods return to northern markets.
Colombian air trade with North America grew 10.6% in 2003, following a contraction of 1.7% in 2002. Colombia is the largest exporter to North America of cut flowers, withvegetables and apparel representing other popular air exports. Apparel, electronicgoods, and equipment parts and accessories are common air imports to Colombia.
Air trade between Brazil and North America contracted 3.1% in 2003 and 3.5% in 2002. Footwear remains Brazil’s largest air export (accounting for up to 16.7% of the market), though competitive pressure from Asian manufacturers has affectedvolumes. Increases in air exports of fish, fresh and dried fruits, and accessories for motor vehicles have, however, partially offset the impact of competition in the footwear market.
Exports from Mexico to North America contracted 4.2% in 2003, following growth of 0.7% in 2002. Mexican imports contracted 15.4% in 2003 after growing 9.1% in2002. Overall air trade between Mexico and North America contracted 10.5% in 2003,following growth of 5.2% in 2002. Fish, insulated wire, and apparel are importantcommodities shipped to northern centers by air. Parts and accessories for tractors,motor vehicles, and office machinery represent important flows in both the northboundand southbound directions, especially to and from Mexico. This bidirectional flowillustrates how maquila manufacturing affects the composition of goods movingbetween the two regions.
Apparel
Telecomequipment
Automated data processing machines
Electrical machinery
Office machine parts
Motor parts and accessories
Fruits and vegetables
Consumer Goods Dominate North America-Latin America Northbound Flows; Packages and Manufacturing Requirements Dominate Southbound.
Northbound
399,000 tonnes
SouthboundDocuments and small packages Documents and small packages
General industrialmachinery
9%Other,24% Fish,
24%
Flowers,20%
14%
9%
14%
10%
6%
10%
6%4%5%
Other,45%
721,000 tonnes
World Air Cargo Forecast 2004/200528
Air commerce between the Caribbean Basin and North America contracted 7.5% in2003 after growing 2.9% in 2002. Apparel, fresh and dried fruits, and fish are importantcommodities that are transported northbound. Small packages, dairy products, officemachinery, and electrical apparatus represent flows in the southbound direction.
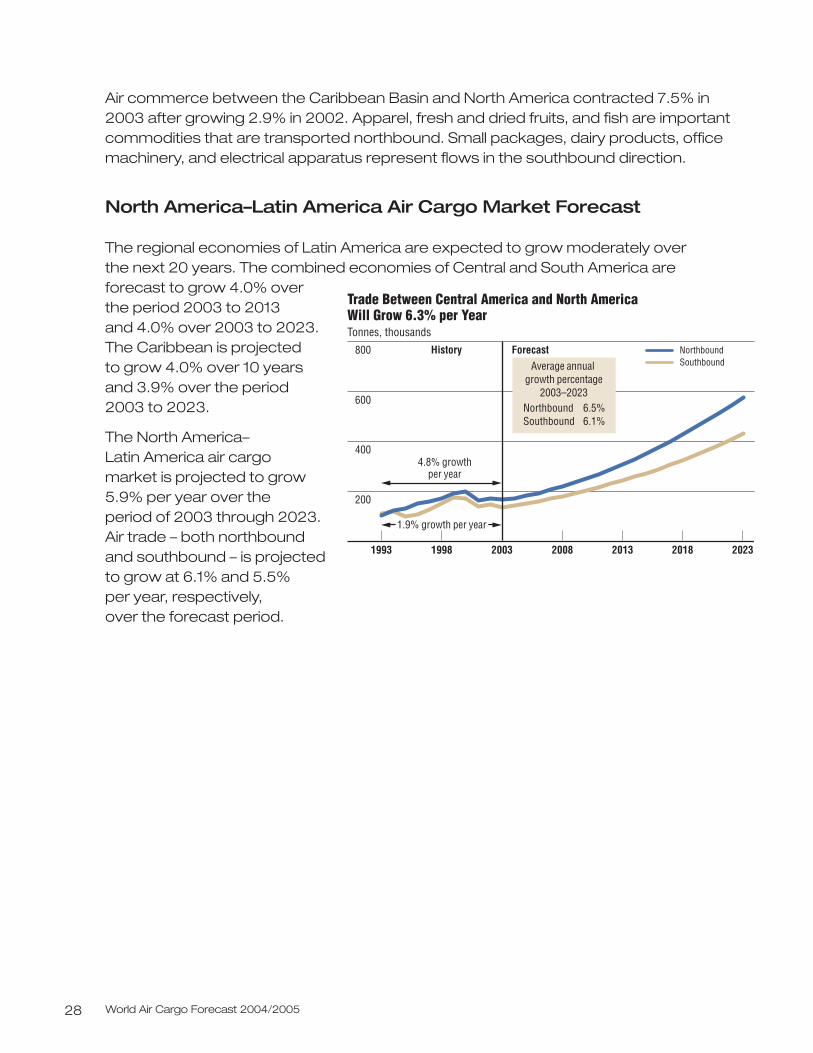
North America–Latin America Air Cargo Market Forecast
The regional economies of Latin America are expected to grow moderately over the next 20 years. The combined economies of Central and South America are forecast to grow 4.0% over the period 2003 to 2013 and 4.0% over 2003 to 2023. The Caribbean is projected to grow 4.0% over 10 yearsand 3.9% over the period 2003 to 2023.
The North America–Latin America air cargo market is projected to grow5.9% per year over the period of 2003 through 2023. Air trade – both northboundand southbound – is projectedto grow at 6.1% and 5.5% per year, respectively, over the forecast period.
1993 1998 2003 2008 2013 2018
800
600
400
200
Trade Between Central America and North AmericaWill Grow 6.3% per YearTonnes, thousands
NorthboundSouthbound
2023
Average annual growth percentage
2003–2023Northbound 6.5%Southbound 6.1%
History Forecast
4.8% growthper year
1.9% growth per year
Latin America and North America 29
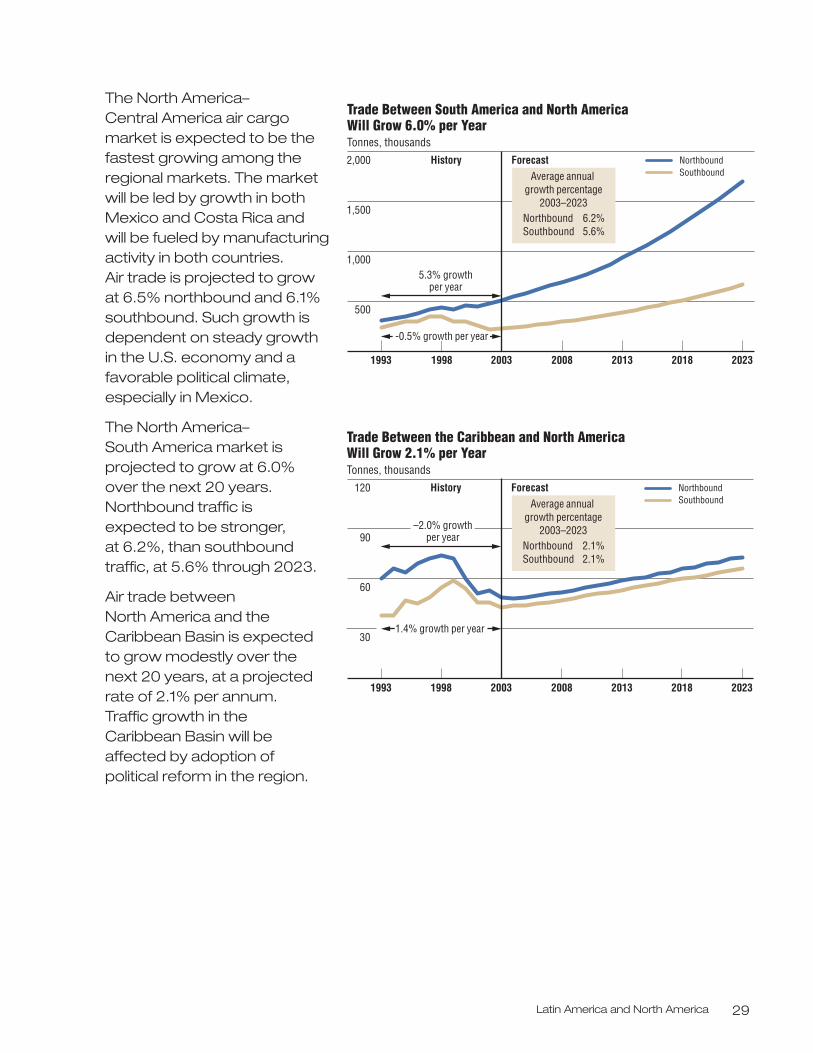
The North America–Central America air cargomarket is expected to be thefastest growing among theregional markets. The marketwill be led by growth in bothMexico and Costa Rica and will be fueled by manufacturingactivity in both countries. Air trade is projected to growat 6.5% northbound and 6.1%southbound. Such growth isdependent on steady growthin the U.S. economy and afavorable political climate,especially in Mexico.
The North America–South America market isprojected to grow at 6.0%over the next 20 years.Northbound traffic is expected to be stronger, at 6.2%, than southboundtraffic, at 5.6% through 2023.
Air trade between North America and theCaribbean Basin is expectedto grow modestly over thenext 20 years, at a projectedrate of 2.1% per annum. Traffic growth in the Caribbean Basin will be affected by adoption of political reform in the region.
1993 1998 2003 2008 2013 2018 2023
2,000
1,500
1,000
500
Trade Between South America and North AmericaWill Grow 6.0% per YearTonnes, thousands
NorthboundSouthboundAverage annual
growth percentage2003–2023
Northbound 6.2%Southbound 5.6%
History Forecast
5.3% growthper year
-0.5% growth per year
1993 1998 2003 2008 2013 2018 2023
120
90
60
30
Trade Between the Caribbean and North AmericaWill Grow 2.1% per YearTonnes, thousands
NorthboundSouthboundAverage annual
growth percentage2003–2023
Northbound 2.1%Southbound 2.1%
History Forecast
–2.0% growthper year
1.4% growth per year
Europe and North America 31
Europe and North America
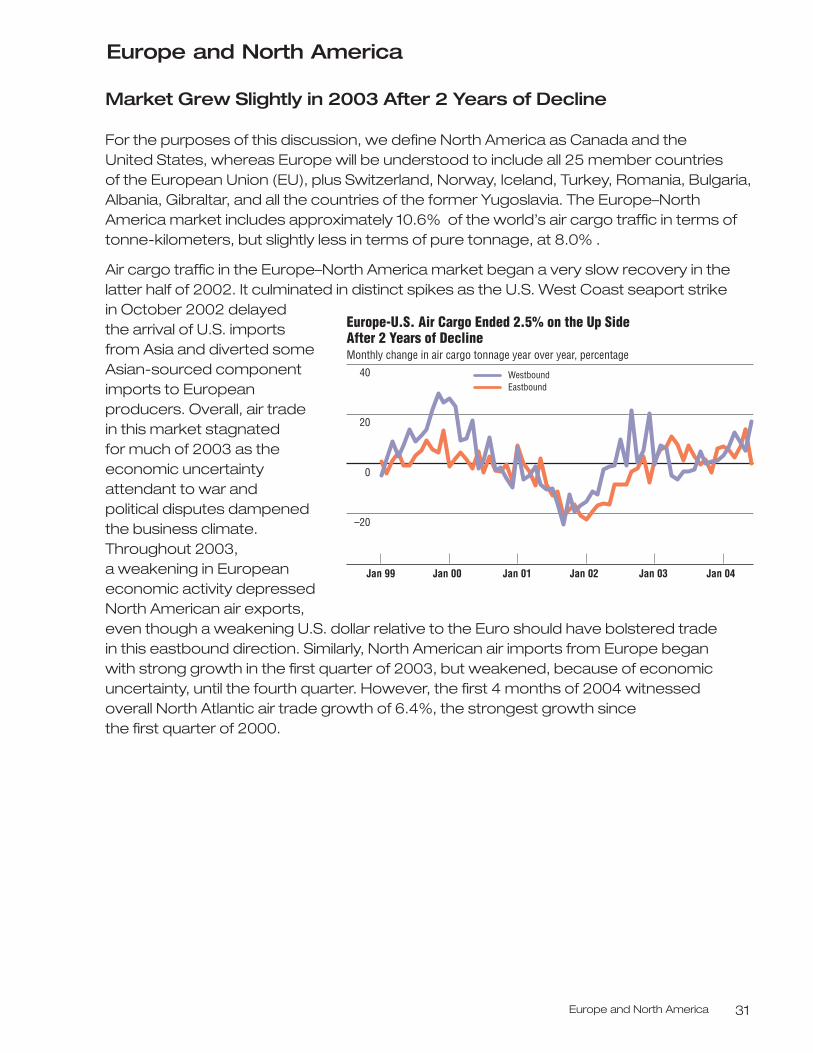
Market Grew Slightly in 2003 After 2 Years of Decline
For the purposes of this discussion, we define North America as Canada and the United States, whereas Europe will be understood to include all 25 member countries of the European Union (EU), plus Switzerland, Norway, Iceland, Turkey, Romania, Bulgaria,Albania, Gibraltar, and all the countries of the former Yugoslavia. The Europe–NorthAmerica market includes approximately 10.6% of the world’s air cargo traffic in terms oftonne-kilometers, but slightly less in terms of pure tonnage, at 8.0% .
Air cargo traffic in the Europe–North America market began a very slow recovery in thelatter half of 2002. It culminated in distinct spikes as the U.S. West Coast seaport strike in October 2002 delayed the arrival of U.S. imports from Asia and diverted some Asian-sourced componentimports to Europeanproducers. Overall, air trade in this market stagnated for much of 2003 as theeconomic uncertaintyattendant to war and political disputes dampenedthe business climate.Throughout 2003, a weakening in Europeaneconomic activity depressedNorth American air exports,even though a weakening U.S. dollar relative to the Euro should have bolstered trade in this eastbound direction. Similarly, North American air imports from Europe began with strong growth in the first quarter of 2003, but weakened, because of economicuncertainty, until the fourth quarter. However, the first 4 months of 2004 witnessed overall North Atlantic air trade growth of 6.4%, the strongest growth since the first quarter of 2000.
Europe-U.S. Air Cargo Ended 2.5% on the Up Side After 2 Years of Decline Monthly change in air cargo tonnage year over year, percentage
40
20
0
–20
WestboundEastbound
Jan 99 Jan 00 Jan 02 Jan 03 Jan 04Jan 01
World Air Cargo Forecast 2004/200532
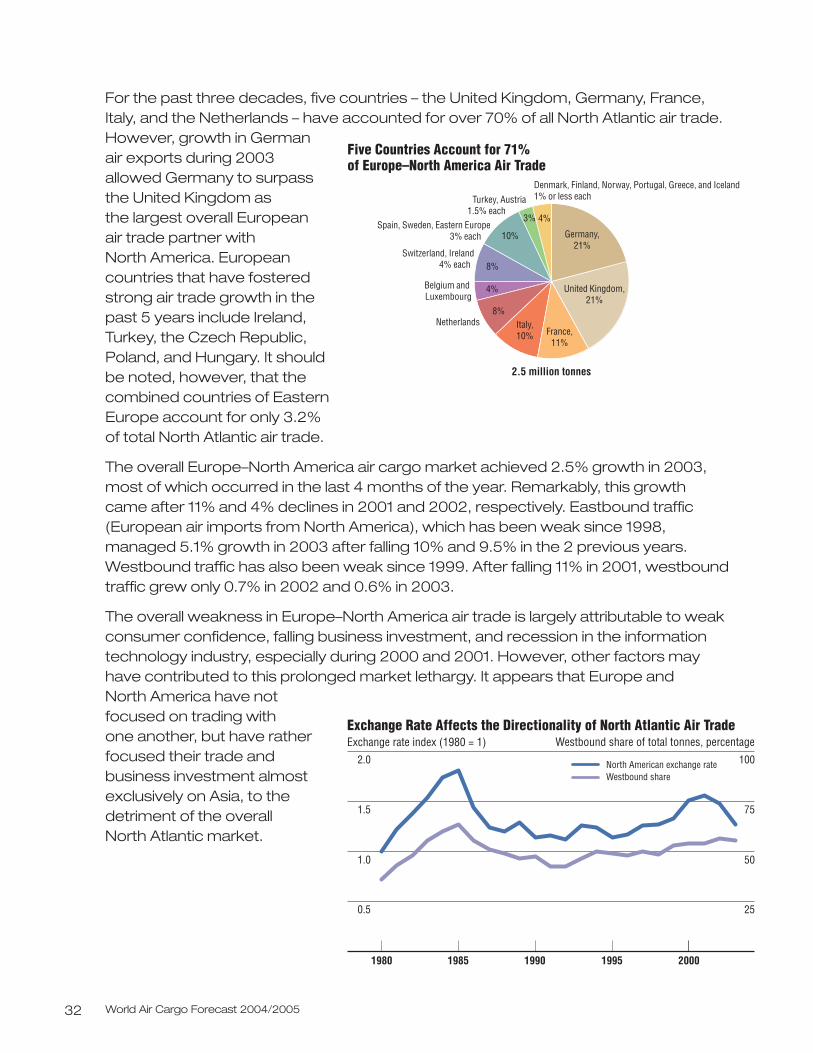
For the past three decades, five countries – the United Kingdom, Germany, France,Italy, and the Netherlands – have accounted for over 70% of all North Atlantic air trade.However, growth in German air exports during 2003allowed Germany to surpassthe United Kingdom as the largest overall European air trade partner with North America. Europeancountries that have fosteredstrong air trade growth in thepast 5 years include Ireland,Turkey, the Czech Republic,Poland, and Hungary. It shouldbe noted, however, that thecombined countries of EasternEurope account for only 3.2% of total North Atlantic air trade.
The overall Europe–North America air cargo market achieved 2.5% growth in 2003,most of which occurred in the last 4 months of the year. Remarkably, this growth came after 11% and 4% declines in 2001 and 2002, respectively. Eastbound traffic (European air imports from North America), which has been weak since 1998,managed 5.1% growth in 2003 after falling 10% and 9.5% in the 2 previous years.Westbound traffic has also been weak since 1999. After falling 11% in 2001, westboundtraffic grew only 0.7% in 2002 and 0.6% in 2003.
The overall weakness in Europe–North America air trade is largely attributable to weakconsumer confidence, falling business investment, and recession in the informationtechnology industry, especially during 2000 and 2001. However, other factors mayhave contributed to this prolonged market lethargy. It appears that Europe and North America have notfocused on trading with one another, but have ratherfocused their trade andbusiness investment almostexclusively on Asia, to thedetriment of the overall North Atlantic market.
2.5 million tonnes
Netherlands
Five Countries Account for 71% of Europe–North America Air Trade
Switzerland, Ireland 4% each
Belgium and Luxembourg
Denmark, Finland, Norway, Portugal, Greece, and Iceland 1% or less eachTurkey, Austria
1.5% each
4%
8%
10%
3% 4%
8%Italy,10% France,
11%
Germany,21%
United Kingdom,21%
Spain, Sweden, Eastern Europe 3% each
Exchange Rate Affects the Directionality of North Atlantic Air TradeExchange rate index (1980 = 1)
2.0
1.5
1.0
0.5
100
75
50
25
1980 2000
North American exchange rateWestbound share
Westbound share of total tonnes, percentage
1990 19951985
Europe and North America 33
Directionality and Exchange Rates
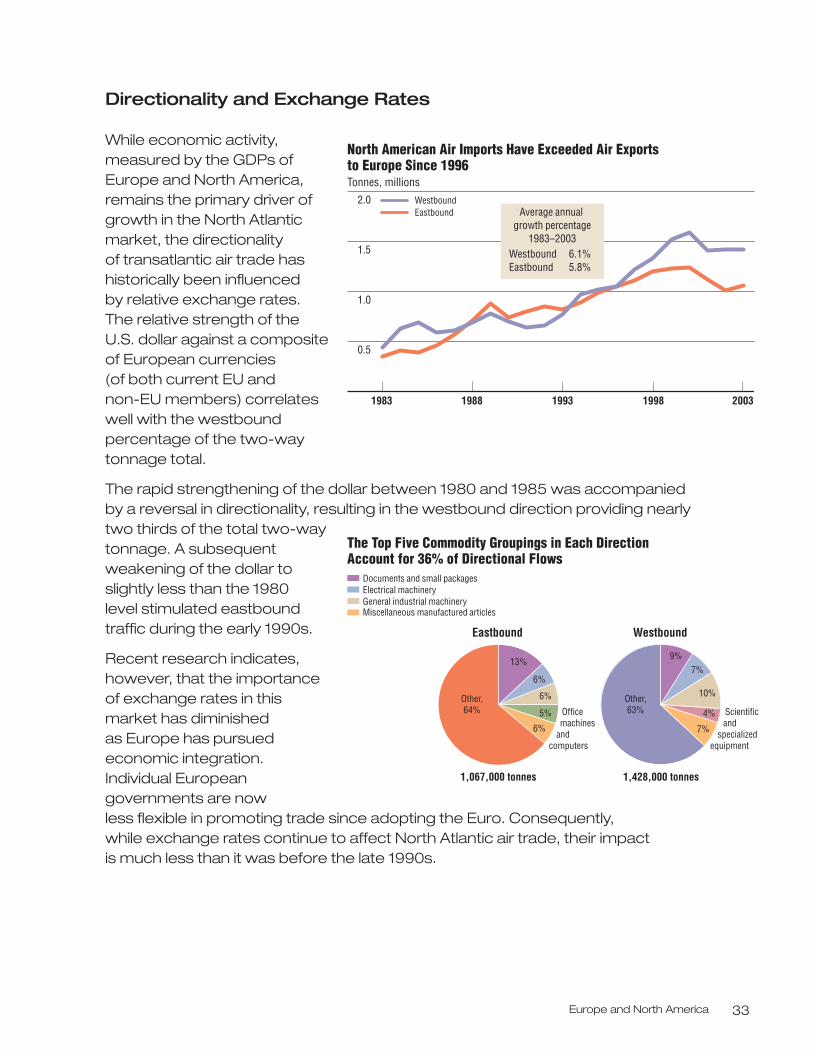
While economic activity,measured by the GDPs ofEurope and North America,remains the primary driver ofgrowth in the North Atlanticmarket, the directionality of transatlantic air trade hashistorically been influenced by relative exchange rates.The relative strength of theU.S. dollar against a compositeof European currencies (of both current EU and non-EU members) correlateswell with the westboundpercentage of the two-waytonnage total.
The rapid strengthening of the dollar between 1980 and 1985 was accompaniedby a reversal in directionality, resulting in the westbound direction providing nearly two thirds of the total two-waytonnage. A subsequentweakening of the dollar toslightly less than the 1980 level stimulated eastboundtraffic during the early 1990s.
Recent research indicates,however, that the importanceof exchange rates in thismarket has diminished as Europe has pursued economic integration.Individual Europeangovernments are now less flexible in promoting trade since adopting the Euro. Consequently, while exchange rates continue to affect North Atlantic air trade, their impact is much less than it was before the late 1990s.
North American Air Imports Have Exceeded Air Exports to Europe Since 1996Tonnes, millions
2.0
1.5
1.0
0.5
1983 1993 1998 2003
WestboundEastbound
1988
Average annual growth percentage
1983–2003Westbound 6.1%Eastbound 5.8%
1,067,000 tonnes
Scientific and specialized equipment
Office machines and computers
The Top Five Commodity Groupings in Each Direction Account for 36% of Directional Flows
Eastbound
1,428,000 tonnes
Westbound
13%
Other,64%
6%
6%
5%
6%
9%
Other,63%
7%
10%
4%
7%
Miscellaneous manufactured articlesGeneral industrial machineryElectrical machineryDocuments and small packages
World Air Cargo Forecast 2004/200534
Europe–North America Air Trade Commodities
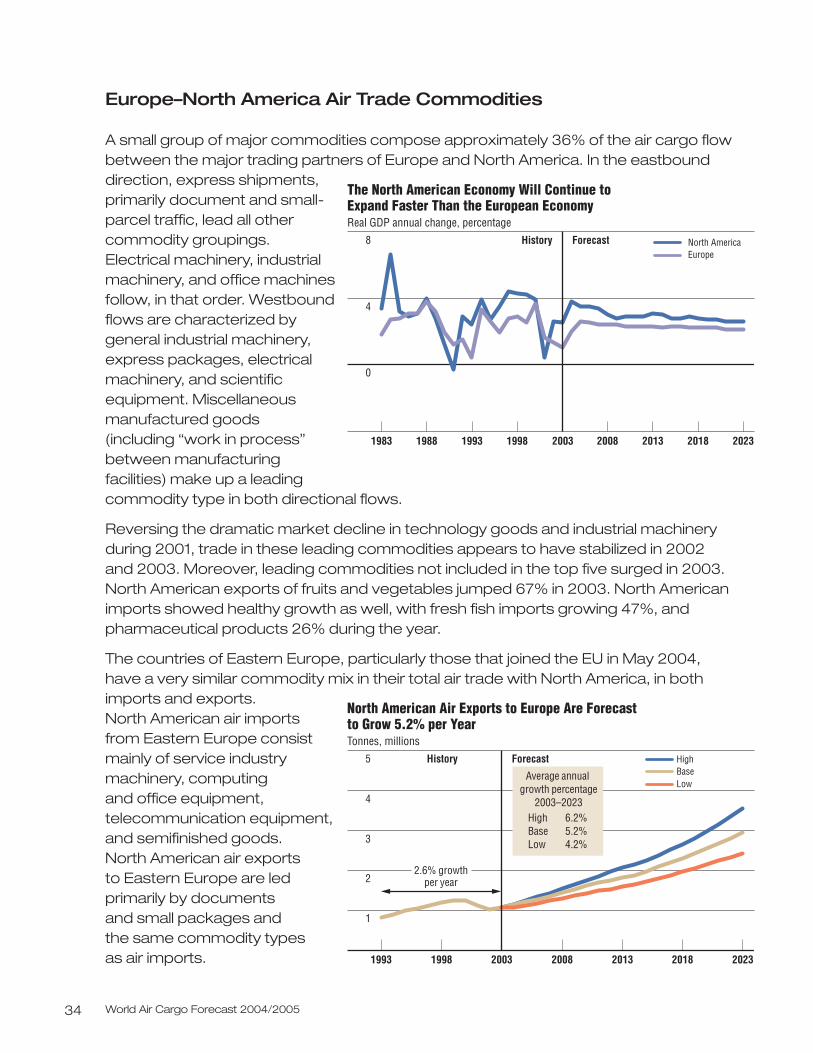
A small group of major commodities compose approximately 36% of the air cargo flowbetween the major trading partners of Europe and North America. In the eastbounddirection, express shipments, primarily document and small-parcel traffic, lead all othercommodity groupings.Electrical machinery, industrialmachinery, and office machinesfollow, in that order. Westboundflows are characterized bygeneral industrial machinery,express packages, electricalmachinery, and scientificequipment. Miscellaneousmanufactured goods (including “work in process”between manufacturingfacilities) make up a leading commodity type in both directional flows.
Reversing the dramatic market decline in technology goods and industrial machineryduring 2001, trade in these leading commodities appears to have stabilized in 2002and 2003. Moreover, leading commodities not included in the top five surged in 2003.North American exports of fruits and vegetables jumped 67% in 2003. North Americanimports showed healthy growth as well, with fresh fish imports growing 47%, andpharmaceutical products 26% during the year.
The countries of Eastern Europe, particularly those that joined the EU in May 2004,have a very similar commodity mix in their total air trade with North America, in bothimports and exports. North American air importsfrom Eastern Europe consistmainly of service industrymachinery, computing and office equipment,telecommunication equipment,and semifinished goods. North American air exports to Eastern Europe are ledprimarily by documents and small packages and the same commodity types as air imports.
The North American Economy Will Continue to Expand Faster Than the European EconomyReal GDP annual change, percentage
8
4
0
History Forecast
1983 1988 1993 1998 2003 2008 2013 2018 2023
North AmericaEurope
North American Air Exports to Europe Are Forecast to Grow 5.2% per YearTonnes, millions
5
4
3
2
1
HighBaseLow
2.6% growthper year
1993 1998 2003 2008 2013 2018 2023
History Forecast
Average annual growth percentage
2003–2023High 6.2%Base 5.2%Low 4.2%
Europe and North America 35
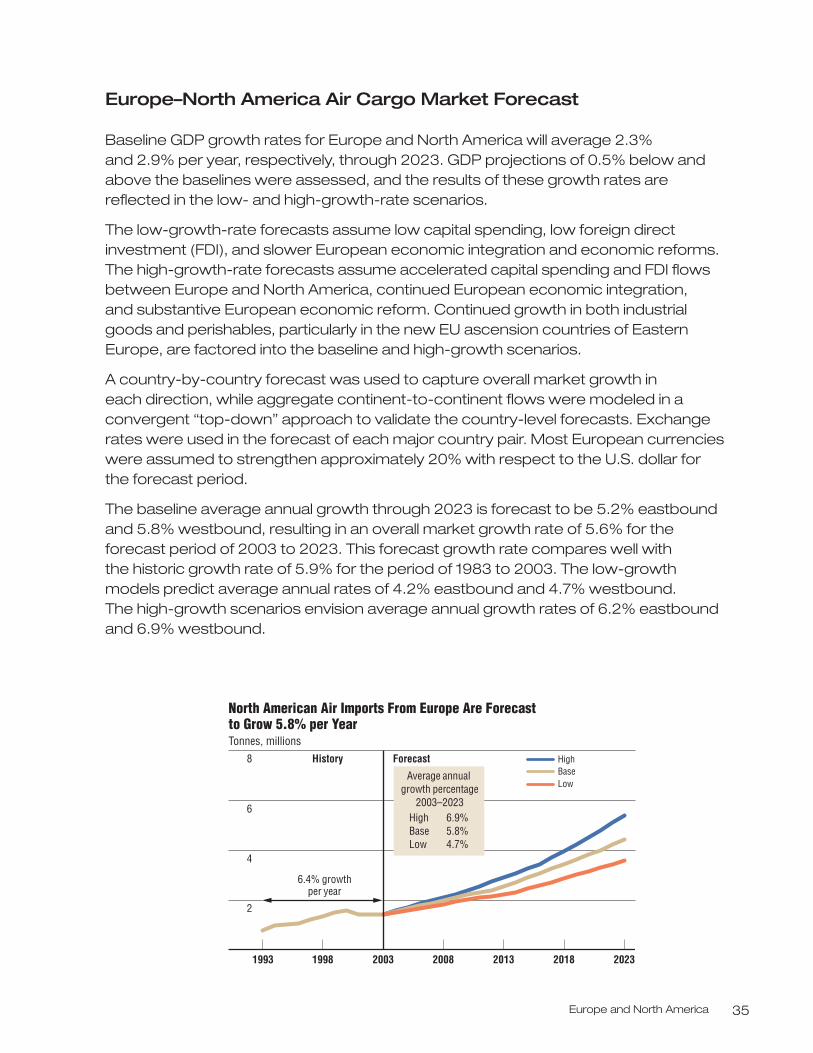
Europe–North America Air Cargo Market Forecast
Baseline GDP growth rates for Europe and North America will average 2.3% and 2.9% per year, respectively, through 2023. GDP projections of 0.5% below andabove the baselines were assessed, and the results of these growth rates arereflected in the low- and high-growth-rate scenarios.
The low-growth-rate forecasts assume low capital spending, low foreign directinvestment (FDI), and slower European economic integration and economic reforms.The high-growth-rate forecasts assume accelerated capital spending and FDI flowsbetween Europe and North America, continued European economic integration, and substantive European economic reform. Continued growth in both industrialgoods and perishables, particularly in the new EU ascension countries of EasternEurope, are factored into the baseline and high-growth scenarios.
A country-by-country forecast was used to capture overall market growth in each direction, while aggregate continent-to-continent flows were modeled in a convergent “top-down” approach to validate the country-level forecasts. Exchangerates were used in the forecast of each major country pair. Most European currencieswere assumed to strengthen approximately 20% with respect to the U.S. dollar for the forecast period.
The baseline average annual growth through 2023 is forecast to be 5.2% eastboundand 5.8% westbound, resulting in an overall market growth rate of 5.6% for theforecast period of 2003 to 2023. This forecast growth rate compares well with the historic growth rate of 5.9% for the period of 1983 to 2003. The low-growthmodels predict average annual rates of 4.2% eastbound and 4.7% westbound. The high-growth scenarios envision average annual growth rates of 6.2% eastboundand 6.9% westbound.
North American Air Imports From Europe Are Forecast to Grow 5.8% per YearTonnes, millions
8
6
4
2
HighBaseLow
6.4% growthper year
1993 1998 2003 2008 2013 2018 2023
History Forecast
Average annual growth percentage
2003–2023High 6.9%Base 5.8%Low 4.7%
Intra-Europe 37
Intra-Europe
Regional Overview
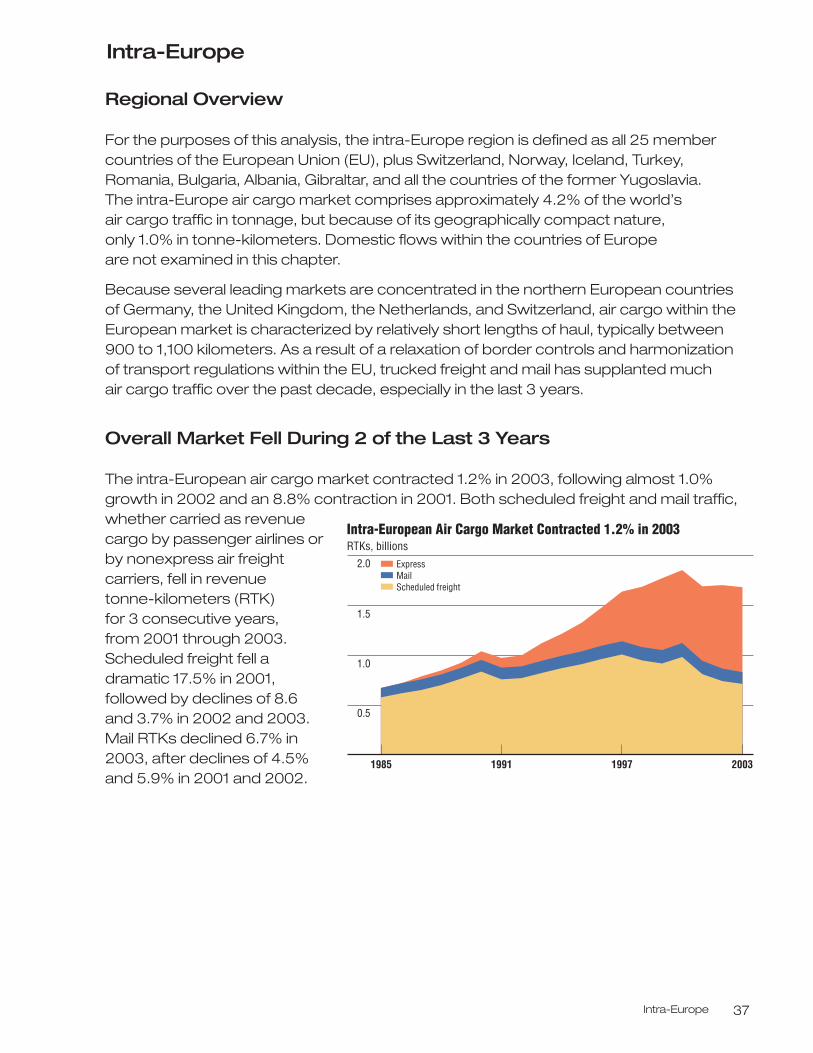
For the purposes of this analysis, the intra-Europe region is defined as all 25 membercountries of the European Union (EU), plus Switzerland, Norway, Iceland, Turkey,Romania, Bulgaria, Albania, Gibraltar, and all the countries of the former Yugoslavia. The intra-Europe air cargo market comprises approximately 4.2% of the world’s air cargo traffic in tonnage, but because of its geographically compact nature, only 1.0% in tonne-kilometers. Domestic flows within the countries of Europe are not examined in this chapter.
Because several leading markets are concentrated in the northern European countriesof Germany, the United Kingdom, the Netherlands, and Switzerland, air cargo within theEuropean market is characterized by relatively short lengths of haul, typically between900 to 1,100 kilometers. As a result of a relaxation of border controls and harmonizationof transport regulations within the EU, trucked freight and mail has supplanted much air cargo traffic over the past decade, especially in the last 3 years.
Overall Market Fell During 2 of the Last 3 Years
The intra-European air cargo market contracted 1.2% in 2003, following almost 1.0%growth in 2002 and an 8.8% contraction in 2001. Both scheduled freight and mail traffic,whether carried as revenuecargo by passenger airlines orby nonexpress air freightcarriers, fell in revenue tonne-kilometers (RTK) for 3 consecutive years, from 2001 through 2003.Scheduled freight fell adramatic 17.5% in 2001,followed by declines of 8.6 and 3.7% in 2002 and 2003.Mail RTKs declined 6.7% in2003, after declines of 4.5%and 5.9% in 2001 and 2002.
Intra-European Air Cargo Market Contracted 1.2% in 2003 RTKs, billions
2.0
1.5
1.0
0.5
1985 1991 1997 2003
Scheduled freightMailExpress
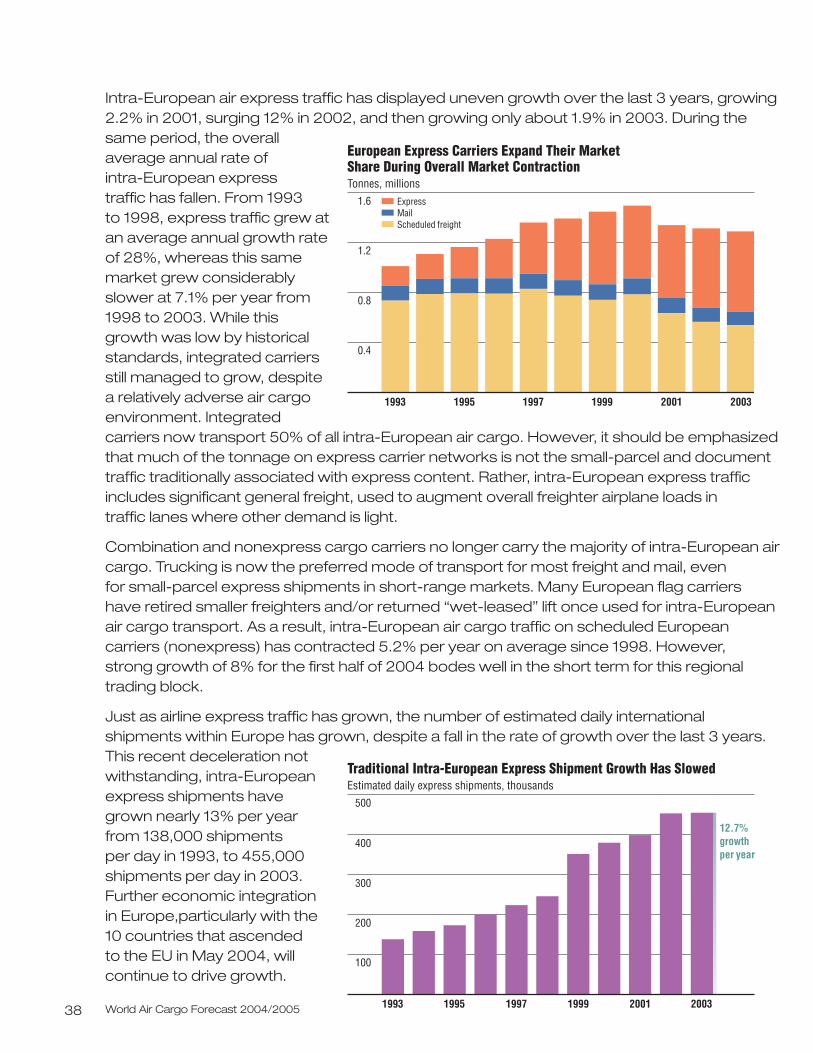
Intra-European air express traffic has displayed uneven growth over the last 3 years, growing2.2% in 2001, surging 12% in 2002, and then growing only about 1.9% in 2003. During thesame period, the overallaverage annual rate of intra-European express traffic has fallen. From 1993 to 1998, express traffic grew atan average annual growth rateof 28%, whereas this samemarket grew considerablyslower at 7.1% per year from1998 to 2003. While thisgrowth was low by historicalstandards, integrated carriersstill managed to grow, despitea relatively adverse air cargoenvironment. Integratedcarriers now transport 50% of all intra-European air cargo. However, it should be emphasizedthat much of the tonnage on express carrier networks is not the small-parcel and documenttraffic traditionally associated with express content. Rather, intra-European express trafficincludes significant general freight, used to augment overall freighter airplane loads in traffic lanes where other demand is light.
Combination and nonexpress cargo carriers no longer carry the majority of intra-European aircargo. Trucking is now the preferred mode of transport for most freight and mail, even for small-parcel express shipments in short-range markets. Many European flag carriers have retired smaller freighters and/or returned “wet-leased” lift once used for intra-European air cargo transport. As a result, intra-European air cargo traffic on scheduled Europeancarriers (nonexpress) has contracted 5.2% per year on average since 1998. However, strong growth of 8% for the first half of 2004 bodes well in the short term for this regionaltrading block.
Just as airline express traffic has grown, the number of estimated daily international shipments within Europe has grown, despite a fall in the rate of growth over the last 3 years.This recent deceleration notwithstanding, intra-Europeanexpress shipments have grown nearly 13% per year from 138,000 shipments per day in 1993, to 455,000shipments per day in 2003.Further economic integration in Europe,particularly with the 10 countries that ascended to the EU in May 2004, willcontinue to drive growth.
World Air Cargo Forecast 2004/200538
European Express Carriers Expand Their MarketShare During Overall Market ContractionTonnes, millions
1.6
1.2
0.8
0.4
200320011999199719951993
Scheduled freightMailExpress
Traditional Intra-European Express Shipment Growth Has SlowedEstimated daily express shipments, thousands
500
400
100
200
300
20031999199719951993 2001
12.7%growthper year
Intra-Europe 39
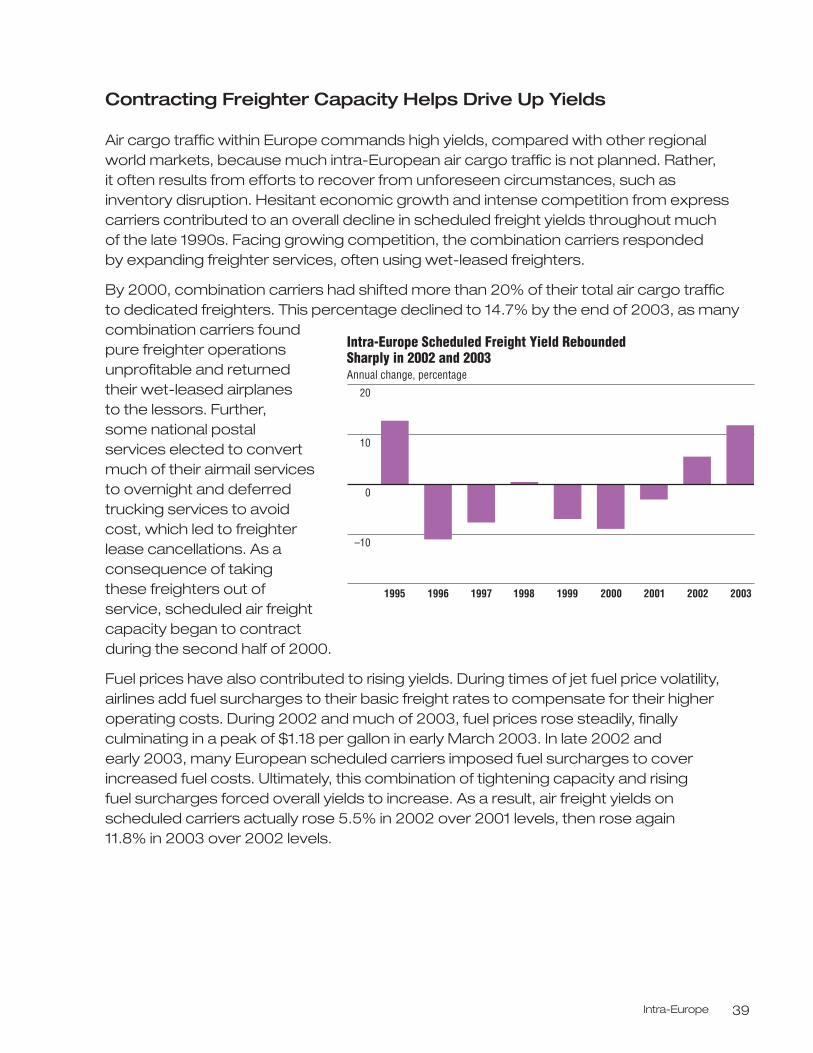
Contracting Freighter Capacity Helps Drive Up Yields
Air cargo traffic within Europe commands high yields, compared with other regionalworld markets, because much intra-European air cargo traffic is not planned. Rather, it often results from efforts to recover from unforeseen circumstances, such asinventory disruption. Hesitant economic growth and intense competition from expresscarriers contributed to an overall decline in scheduled freight yields throughout much of the late 1990s. Facing growing competition, the combination carriers responded by expanding freighter services, often using wet-leased freighters.
By 2000, combination carriers had shifted more than 20% of their total air cargo traffic to dedicated freighters. This percentage declined to 14.7% by the end of 2003, as manycombination carriers foundpure freighter operationsunprofitable and returnedtheir wet-leased airplanes to the lessors. Further, some national postal services elected to convertmuch of their airmail services to overnight and deferredtrucking services to avoidcost, which led to freighterlease cancellations. As aconsequence of taking these freighters out ofservice, scheduled air freightcapacity began to contract during the second half of 2000.
Fuel prices have also contributed to rising yields. During times of jet fuel price volatility,airlines add fuel surcharges to their basic freight rates to compensate for their higheroperating costs. During 2002 and much of 2003, fuel prices rose steadily, finallyculminating in a peak of $1.18 per gallon in early March 2003. In late 2002 and early 2003, many European scheduled carriers imposed fuel surcharges to coverincreased fuel costs. Ultimately, this combination of tightening capacity and rising fuel surcharges forced overall yields to increase. As a result, air freight yields onscheduled carriers actually rose 5.5% in 2002 over 2001 levels, then rose again 11.8% in 2003 over 2002 levels.
Intra-Europe Scheduled Freight Yield Rebounded Sharply in 2002 and 2003 Annual change, percentage
20
10
–10
0
1995 200320012000199919981996 20021997
World Air Cargo Forecast 2004/200540
Trucks Provide Complementary Scheduled Freight Services to Aircraft
Air cargo has never been a solely airport-to-airport service. Rather, it is a singlecomponent of a transportation infrastructure that links the shipper and consignee.Trucking has the inherent ability to offer door-to-door and factory-to-distribution-center dockside service, a feature that air transport alone cannot match.
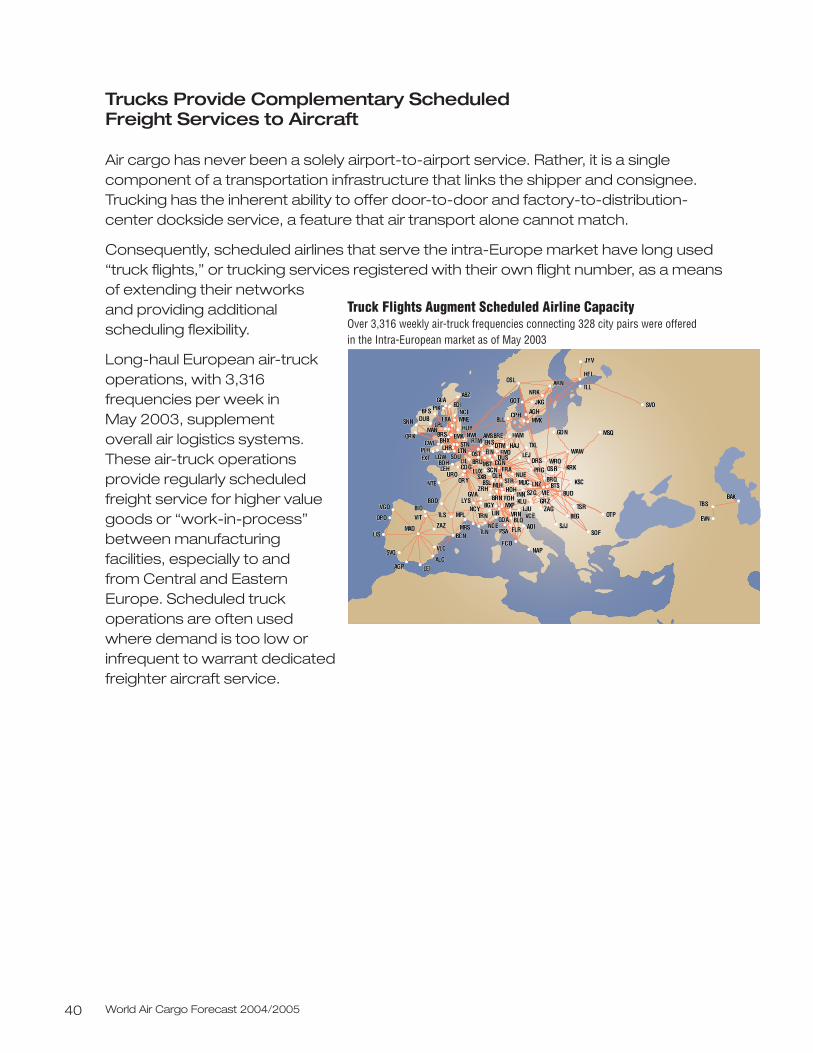
Consequently, scheduled airlines that serve the intra-Europe market have long used“truck flights,” or trucking services registered with their own flight number, as a meansof extending their networksand providing additionalscheduling flexibility.
Long-haul European air-truckoperations, with 3,316frequencies per week in May 2003, supplement overall air logistics systems.These air-truck operationsprovide regularly scheduledfreight service for higher valuegoods or “work-in-process”between manufacturingfacilities, especially to andfrom Central and EasternEurope. Scheduled truckoperations are often usedwhere demand is too low orinfrequent to warrant dedicated freighter aircraft service.
Truck Flights Augment Scheduled Airline CapacityOver 3,316 weekly air-truck frequencies connecting 328 city pairs were offered in the Intra-European market as of May 2003
I
FLFL J
S
EIEIN
R
GOGOA
OSOSR
SJSJ
B
BLBLL
HOHOH
KLKLU
AGAGPALALC
AOAOIBCBCN
BIBIO
BLBLQ
BOBOD
FCFCO
LELE
LILIN
LILISMAMAD
MPMPL
MRMRS
NANAP
NCNCE
NCNCY
NTNTE
OPOPO
PSAPSA
SVQSVQ
TLTLN
TLTLS TRTRNVGVGO
VIVIT
VLVLC
ZAZAZ
BAKBAK
BEGBEG
BGBGYBRBRN
EVNEVN
FDFDH GRGRZGVGVA ININN
LJLJULYLYS
MSMSQ
MXMXPOTOTP
SOSOF
SVOSVO
SZSZG
TBTBSTSTSRVCVCE
VIVIE
VRVRN
BOBOH
BSLBSL
CDCDG
CWCWL
EXEXT
LELEH
LGLGW
LULUX
MLMLH
ORORK
ORORY
PLPLH
SXSXURURO
ABZABZ
AGAGH
AMAM
ARARN
BFBFS
BHBHXBRBRE
BRBRQ
BRBRS
BRBRU
BTBTS
CGCGN
CPCPH
DTDTM
DUDUB
DUDUS
EDEDI
EMEMAENENS
FMFMO
FRFRA
GDGDN
GLGLA GOGOT
HAHAJ
HAHAM
HEHEL
HUHUY
JKJKG
JYJYV
LBLBA
LHLHR
LILIL
LNLNZ
LPLPL
LTLTN
MAMAN
MMMME MMMMX
MSMST
MUMUC
NCNCL
NRNRK
NUNUE
NWNWI
OSOSL
OSOST
PIPIK
QLQLH
RTRTM
SCSCN
SNSNN
SOSOU
STSTN
STSTR
TLTLL
BUBUD
DRDRSKRKRK
KSCKSC
LELEJ
PRPRG
TXTXLWAWAW
WRWRO
ZAZAG
ZRZRH
I
FL J
S
EIN
R
GOA
OSR
SJ
B
BLL
HOH
KLU
AGPALC
AOIBCN
BIO
BLQ
BOD
FCO
LE
LIN
LISMAD
MPL
MRS
NAP
NCE
NCY
NTE
OPO
PSA
SVQ
TLN
TLS TRNVGO
VIT
VLC
ZAZ
BAK
BEG
BGYBRN
EVN
FDH GRZGVA INN
LJULYS
MSQ
MXPOTP
SOF
SVO
SZG
TBSTSRVCE
VIE
VRN
BOH
BSL
CDG
CWL
EXT
LEH
LGW
LUX
MLH
ORK
ORY
PLH
SXURO
ABZ
AGH
AM
ARN
BFS
BHXBRE
BRQ
BRS
BRU
BTS
CGN
CPH
DTM
DUB
DUS
EDI
EMAENS
FMO
FRA
GDN
GLA GOT
HAJ
HAM
HEL
HUY
JKG
JYV
LBA
LHR
LIL
LNZ
LPL
LTN
MAN
MME MMX
MST
MUC
NCL
NRK
NUE
NWI
OSL
OST
PIK
QLH
RTM
SCN
SNN
SOU
STN
STR
TLL
BUD
DRSKRK
KSC
LEJ
PRG
TXLWAW
WRO
ZAG
ZRH
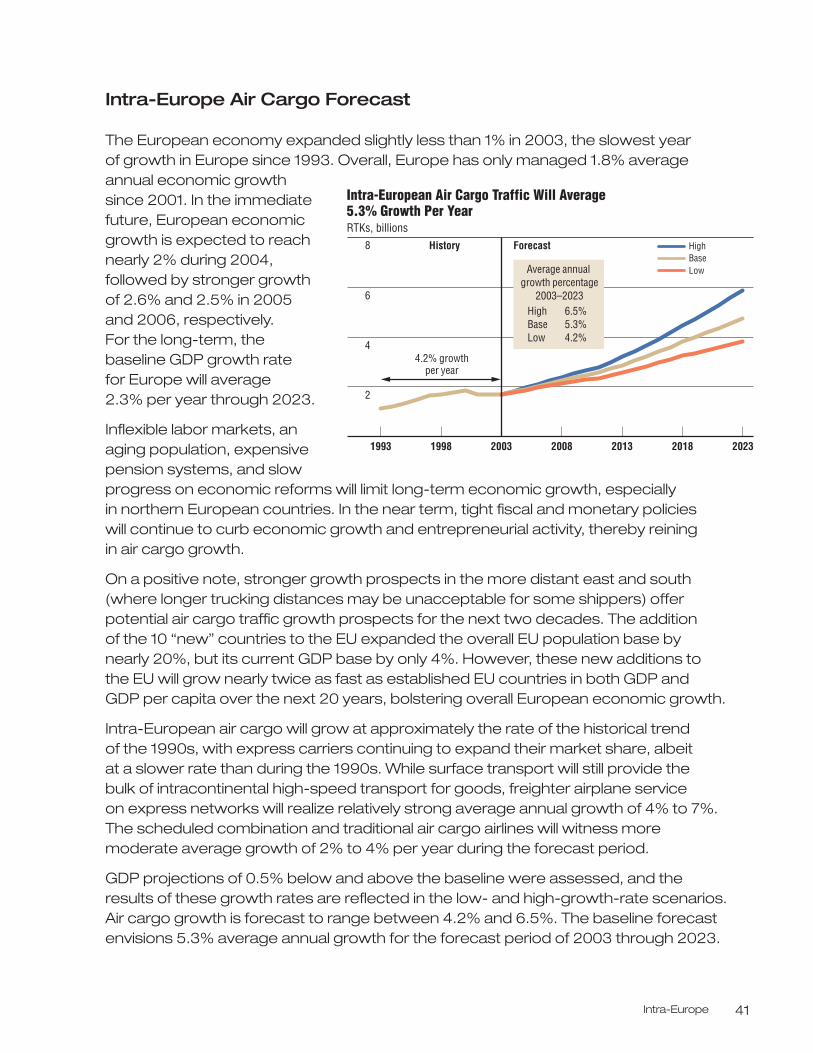
Intra-Europe 41
Intra-Europe Air Cargo Forecast
The European economy expanded slightly less than 1% in 2003, the slowest year of growth in Europe since 1993. Overall, Europe has only managed 1.8% averageannual economic growthsince 2001. In the immediatefuture, European economicgrowth is expected to reachnearly 2% during 2004,followed by stronger growthof 2.6% and 2.5% in 2005and 2006, respectively. For the long-term, thebaseline GDP growth rate for Europe will average 2.3% per year through 2023.
Inflexible labor markets, anaging population, expensivepension systems, and slowprogress on economic reforms will limit long-term economic growth, especially in northern European countries. In the near term, tight fiscal and monetary policies will continue to curb economic growth and entrepreneurial activity, thereby reining in air cargo growth.
On a positive note, stronger growth prospects in the more distant east and south(where longer trucking distances may be unacceptable for some shippers) offerpotential air cargo traffic growth prospects for the next two decades. The addition of the 10 “new” countries to the EU expanded the overall EU population base by nearly 20%, but its current GDP base by only 4%. However, these new additions to the EU will grow nearly twice as fast as established EU countries in both GDP and GDP per capita over the next 20 years, bolstering overall European economic growth.
Intra-European air cargo will grow at approximately the rate of the historical trend of the 1990s, with express carriers continuing to expand their market share, albeit at a slower rate than during the 1990s. While surface transport will still provide the bulk of intracontinental high-speed transport for goods, freighter airplane service on express networks will realize relatively strong average annual growth of 4% to 7%.The scheduled combination and traditional air cargo airlines will witness moremoderate average growth of 2% to 4% per year during the forecast period.
GDP projections of 0.5% below and above the baseline were assessed, and theresults of these growth rates are reflected in the low- and high-growth-rate scenarios.Air cargo growth is forecast to range between 4.2% and 6.5%. The baseline forecastenvisions 5.3% average annual growth for the forecast period of 2003 through 2023.
Intra-European Air Cargo Traffic Will Average 5.3% Growth Per Year RTKs, billions
8
6
4
2
202320182013200820031993
HighBaseLow
History Forecast
Average annual growth percentage
2003–2023High 6.5%Base 5.3%Low 4.2%
4.2% growthper year
1998
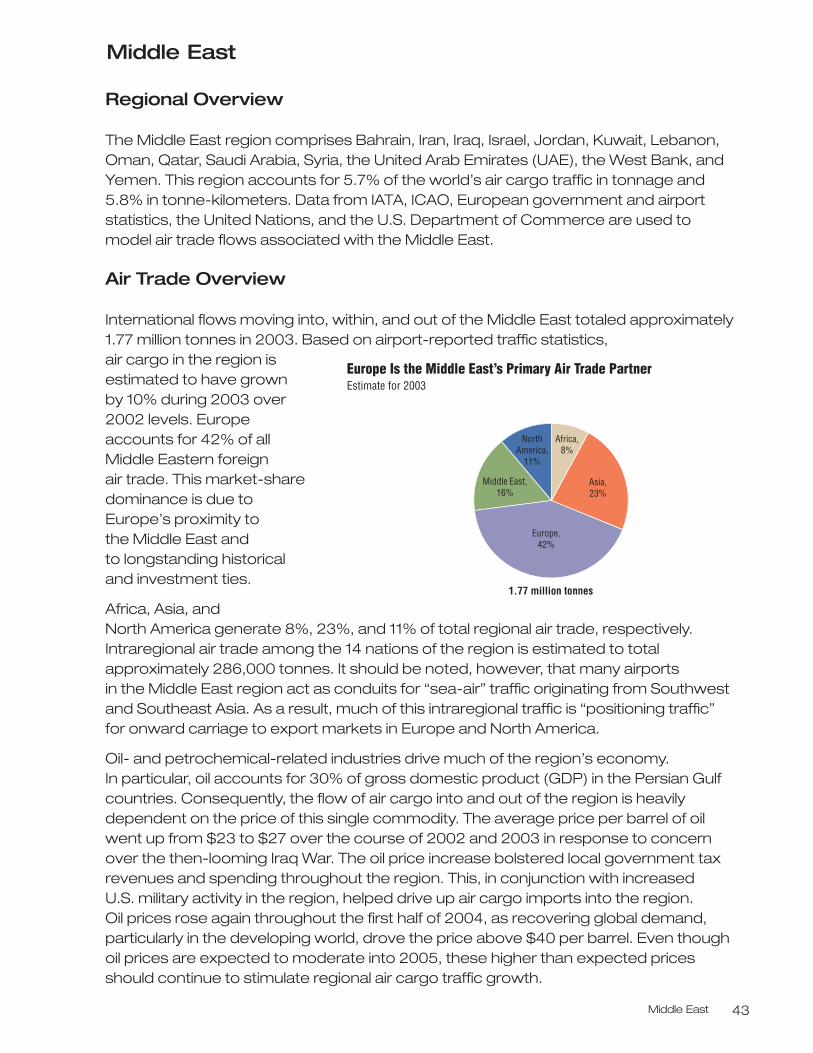
Middle East 43
Middle East
Regional Overview
The Middle East region comprises Bahrain, Iran, Iraq, Israel, Jordan, Kuwait, Lebanon,Oman, Qatar, Saudi Arabia, Syria, the United Arab Emirates (UAE), the West Bank, andYemen. This region accounts for 5.7% of the world’s air cargo traffic in tonnage and5.8% in tonne-kilometers. Data from IATA, ICAO, European government and airportstatistics, the United Nations, and the U.S. Department of Commerce are used tomodel air trade flows associated with the Middle East.
Air Trade Overview
International flows moving into, within, and out of the Middle East totaled approximately1.77 million tonnes in 2003. Based on airport-reported traffic statistics, air cargo in the region isestimated to have grown by 10% during 2003 over2002 levels. Europeaccounts for 42% of allMiddle Eastern foreign air trade. This market-sharedominance is due toEurope’s proximity to the Middle East and to longstanding historical and investment ties.
Africa, Asia, and North America generate 8%, 23%, and 11% of total regional air trade, respectively.Intraregional air trade among the 14 nations of the region is estimated to totalapproximately 286,000 tonnes. It should be noted, however, that many airports in the Middle East region act as conduits for “sea-air” traffic originating from Southwestand Southeast Asia. As a result, much of this intraregional traffic is “positioning traffic”for onward carriage to export markets in Europe and North America.
Oil- and petrochemical-related industries drive much of the region’s economy.In particular, oil accounts for 30% of gross domestic product (GDP) in the Persian Gulfcountries. Consequently, the flow of air cargo into and out of the region is heavilydependent on the price of this single commodity. The average price per barrel of oilwent up from $23 to $27 over the course of 2002 and 2003 in response to concernover the then-looming Iraq War. The oil price increase bolstered local government taxrevenues and spending throughout the region. This, in conjunction with increased U.S. military activity in the region, helped drive up air cargo imports into the region. Oil prices rose again throughout the first half of 2004, as recovering global demand,particularly in the developing world, drove the price above $40 per barrel. Even thoughoil prices are expected to moderate into 2005, these higher than expected pricesshould continue to stimulate regional air cargo traffic growth.
1.77 million tonnes
Europe Is the Middle East’s Primary Air Trade PartnerEstimate for 2003
Middle East,16%
Europe,42%
Africa,8%
Asia,23%
NorthAmerica,
11%
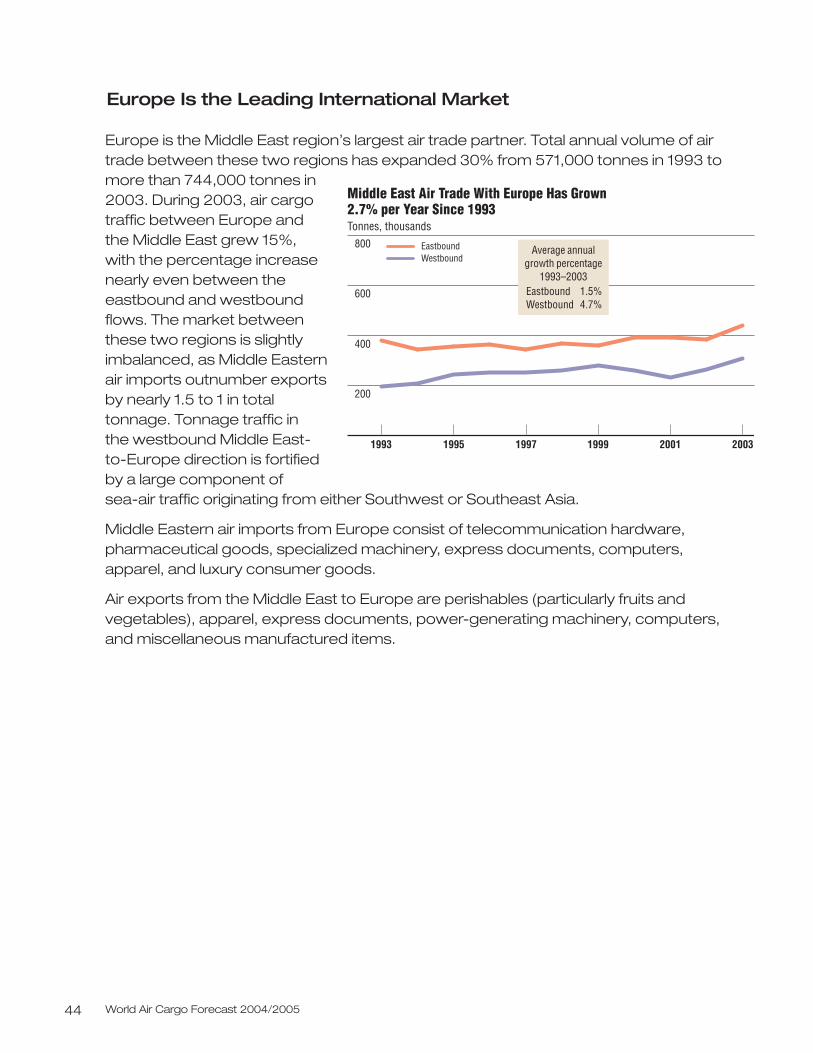
World Air Cargo Forecast 2004/200544
Europe is the Middle East region’s largest air trade partner. Total annual volume of airtrade between these two regions has expanded 30% from 571,000 tonnes in 1993 tomore than 744,000 tonnes in2003. During 2003, air cargotraffic between Europe and the Middle East grew 15%, with the percentage increasenearly even between theeastbound and westboundflows. The market betweenthese two regions is slightlyimbalanced, as Middle Easternair imports outnumber exportsby nearly 1.5 to 1 in totaltonnage. Tonnage traffic in the westbound Middle East-to-Europe direction is fortifiedby a large component of sea-air traffic originating from either Southwest or Southeast Asia.
Middle Eastern air imports from Europe consist of telecommunication hardware,pharmaceutical goods, specialized machinery, express documents, computers,apparel, and luxury consumer goods.
Air exports from the Middle East to Europe are perishables (particularly fruits andvegetables), apparel, express documents, power-generating machinery, computers,and miscellaneous manufactured items.
2001
800
600
400
200
1993 1995 1997 1999 2003
EastboundWestbound
Middle East Air Trade With Europe Has Grown2.7% per Year Since 1993 Tonnes, thousands
Average annualgrowth percentage
1993–2003Eastbound 1.5%Westbound 4.7%
Europe Is the Leading International Market
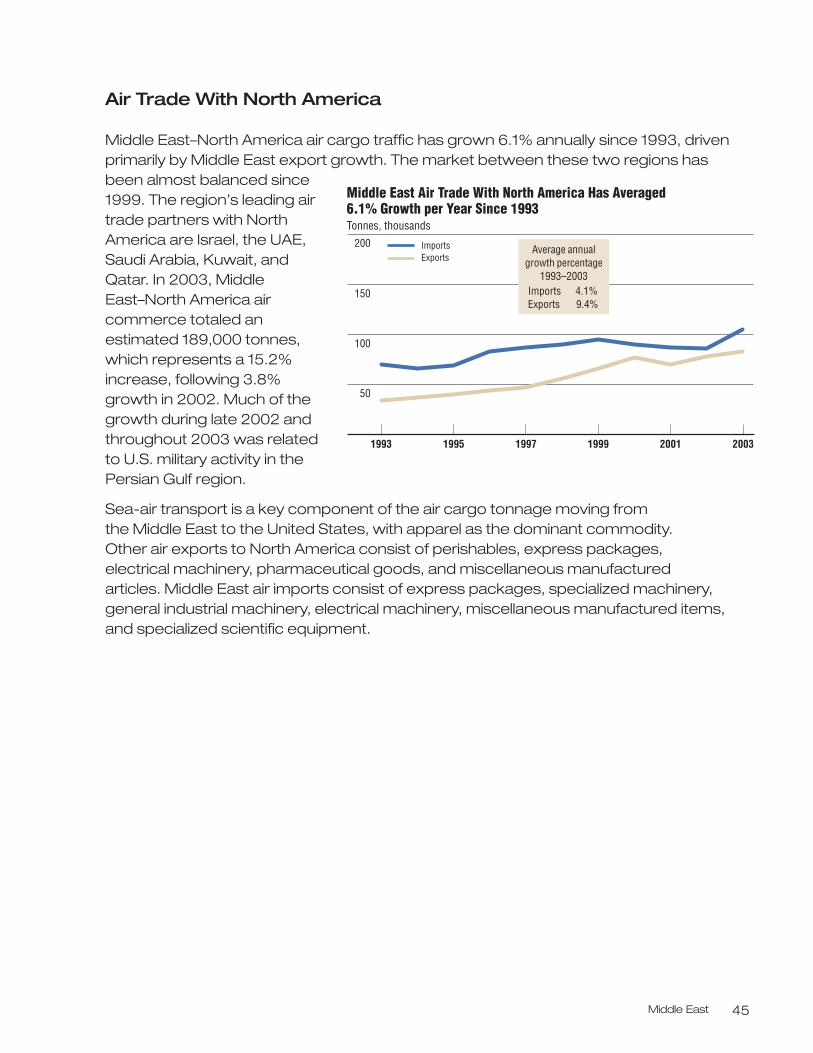
Middle East 45
Air Trade With North America
Middle East–North America air cargo traffic has grown 6.1% annually since 1993, drivenprimarily by Middle East export growth. The market between these two regions hasbeen almost balanced since1999. The region’s leading airtrade partners with NorthAmerica are Israel, the UAE,Saudi Arabia, Kuwait, andQatar. In 2003, MiddleEast–North America aircommerce totaled anestimated 189,000 tonnes,which represents a 15.2%increase, following 3.8%growth in 2002. Much of thegrowth during late 2002 andthroughout 2003 was relatedto U.S. military activity in thePersian Gulf region.
Sea-air transport is a key component of the air cargo tonnage moving from the Middle East to the United States, with apparel as the dominant commodity. Other air exports to North America consist of perishables, express packages, electrical machinery, pharmaceutical goods, and miscellaneous manufactured articles. Middle East air imports consist of express packages, specialized machinery,general industrial machinery, electrical machinery, miscellaneous manufactured items,and specialized scientific equipment.
200
150
100
50
1993 1995 1997 1999 2001 2003
ImportsExports
Middle East Air Trade With North America Has Averaged 6.1% Growth per Year Since 1993 Tonnes, thousands
Average annualgrowth percentage
1993–2003Imports 4.1%Exports 9.4%
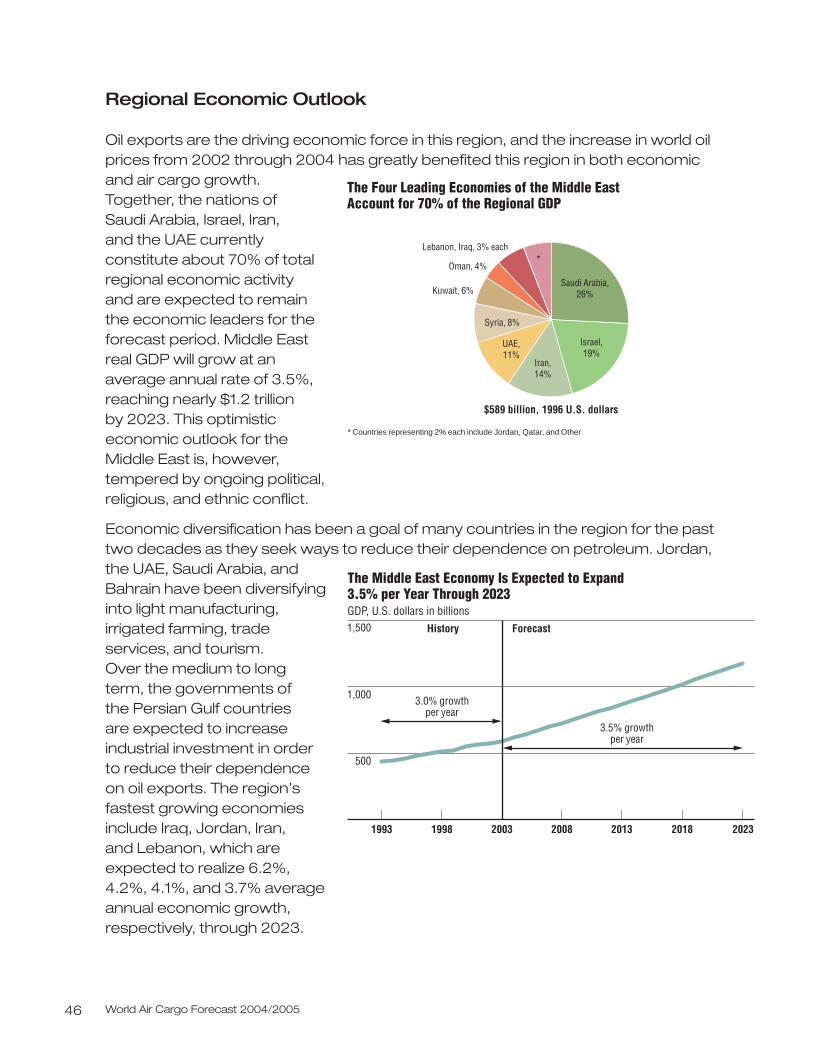
World Air Cargo Forecast 2004/200546
Regional Economic Outlook
Oil exports are the driving economic force in this region, and the increase in world oilprices from 2002 through 2004 has greatly benefited this region in both economicand air cargo growth.Together, the nations of Saudi Arabia, Israel, Iran, and the UAE currentlyconstitute about 70% of totalregional economic activity and are expected to remainthe economic leaders for theforecast period. Middle Eastreal GDP will grow at anaverage annual rate of 3.5%,reaching nearly $1.2 trillion by 2023. This optimisticeconomic outlook for theMiddle East is, however,tempered by ongoing political, religious, and ethnic conflict.
Economic diversification has been a goal of many countries in the region for the pasttwo decades as they seek ways to reduce their dependence on petroleum. Jordan,the UAE, Saudi Arabia, andBahrain have been diversifyinginto light manufacturing,irrigated farming, tradeservices, and tourism. Over the medium to long term, the governments of the Persian Gulf countries are expected to increaseindustrial investment in order to reduce their dependenceon oil exports. The region’sfastest growing economiesinclude Iraq, Jordan, Iran, and Lebanon, which areexpected to realize 6.2%, 4.2%, 4.1%, and 3.7% average annual economic growth, respectively, through 2023.
$589 billion, 1996 U.S. dollars
The Four Leading Economies of the Middle EastAccount for 70% of the Regional GDP
Saudi Arabia,26%
UAE,11%
Syria, 8%
Kuwait, 6%
Oman, 4%
Lebanon, Iraq, 3% each
Israel,19%
Iran,14%
*
* Countries representing 2% each include Jordan, Qatar, and Other
The Middle East Economy Is Expected to Expand 3.5% per Year Through 2023 GDP, U.S. dollars in billions
1,000
1,500
500
2008 2013 2018 2023200319981993
3.0% growthper year
3.5% growthper year
History Forecast
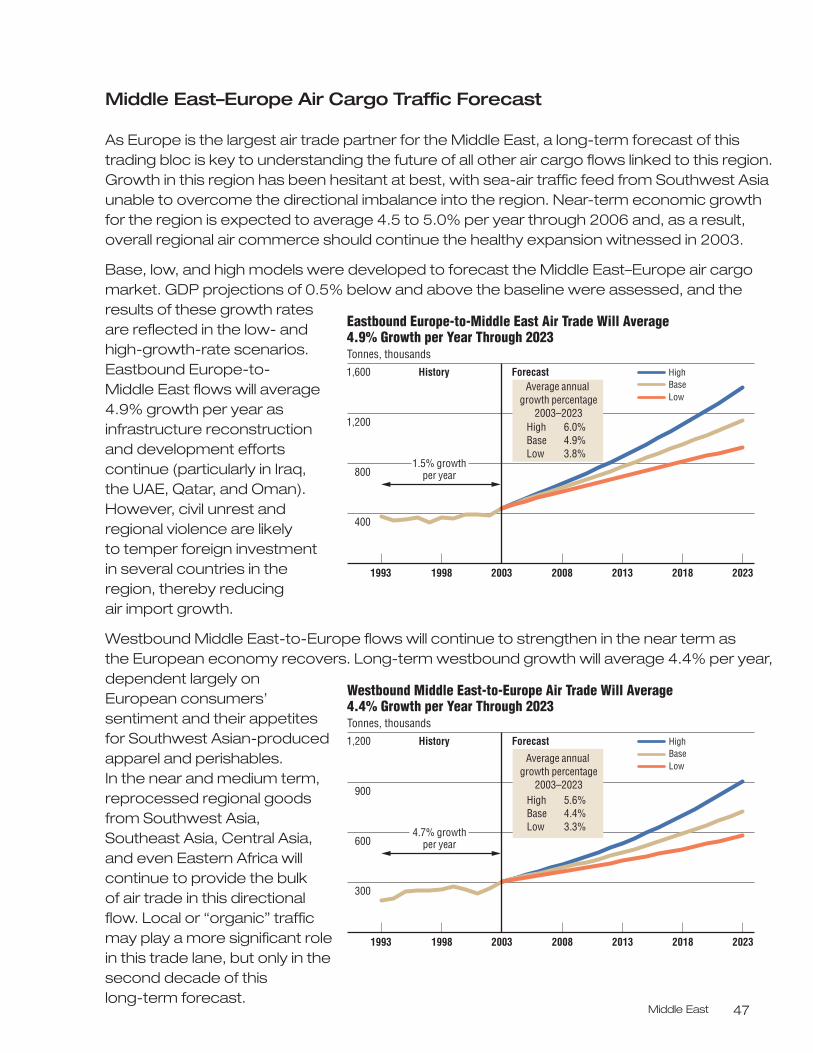
Middle East 47
Middle East–Europe Air Cargo Traffic Forecast
As Europe is the largest air trade partner for the Middle East, a long-term forecast of thistrading bloc is key to understanding the future of all other air cargo flows linked to this region.Growth in this region has been hesitant at best, with sea-air traffic feed from Southwest Asiaunable to overcome the directional imbalance into the region. Near-term economic growthfor the region is expected to average 4.5 to 5.0% per year through 2006 and, as a result,overall regional air commerce should continue the healthy expansion witnessed in 2003.
Base, low, and high models were developed to forecast the Middle East–Europe air cargomarket. GDP projections of 0.5% below and above the baseline were assessed, and theresults of these growth ratesare reflected in the low- andhigh-growth-rate scenarios.Eastbound Europe-to-Middle East flows will average4.9% growth per year asinfrastructure reconstructionand development effortscontinue (particularly in Iraq,the UAE, Qatar, and Oman).However, civil unrest andregional violence are likely to temper foreign investmentin several countries in theregion, thereby reducing air import growth.
Westbound Middle East-to-Europe flows will continue to strengthen in the near term as the European economy recovers. Long-term westbound growth will average 4.4% per year,dependent largely onEuropean consumers’sentiment and their appetitesfor Southwest Asian-producedapparel and perishables. In the near and medium term,reprocessed regional goodsfrom Southwest Asia,Southeast Asia, Central Asia,and even Eastern Africa willcontinue to provide the bulk of air trade in this directionalflow. Local or “organic” trafficmay play a more significant rolein this trade lane, but only in thesecond decade of this long-term forecast.
2013
Eastbound Europe-to-Middle East Air Trade Will Average 4.9% Growth per Year Through 2023 Tonnes, thousands
1,600
1,200
800
20232018200820031993
HighBaseLow
History Forecast
1.5% growthper year
1998
Average annual growth percentage
2003–2023High 6.0%Base 4.9%Low 3.8%
400
2013
Westbound Middle East-to-Europe Air Trade Will Average 4.4% Growth per Year Through 2023 Tonnes, thousands
1,200
900
600
20232018200820031993
HighBaseLow
History Forecast
4.7% growthper year
1998
Average annual growth percentage
2003–2023High 5.6%Base 4.4%Low 3.3%
300
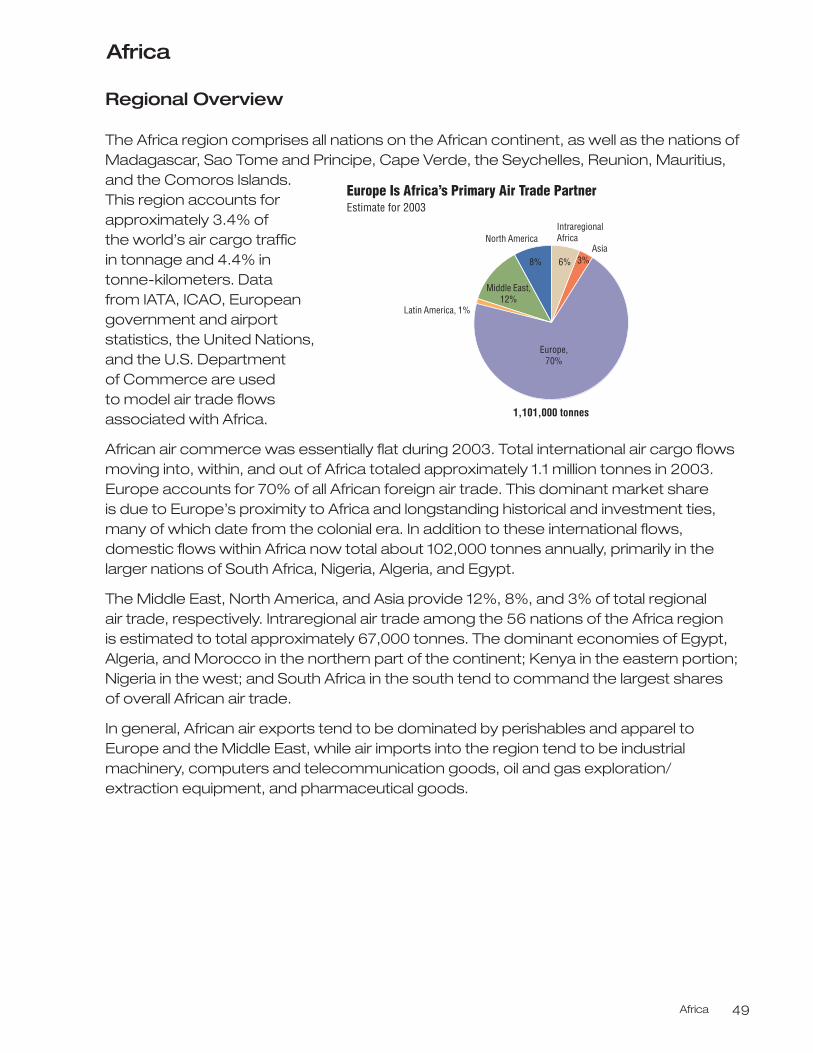
Africa 49
Africa
Regional Overview
The Africa region comprises all nations on the African continent, as well as the nations ofMadagascar, Sao Tome and Principe, Cape Verde, the Seychelles, Reunion, Mauritius,and the Comoros Islands.This region accounts forapproximately 3.4% of the world’s air cargo traffic in tonnage and 4.4% intonne-kilometers. Data from IATA, ICAO, Europeangovernment and airportstatistics, the United Nations,and the U.S. Department of Commerce are used to model air trade flowsassociated with Africa.
African air commerce was essentially flat during 2003. Total international air cargo flowsmoving into, within, and out of Africa totaled approximately 1.1 million tonnes in 2003.Europe accounts for 70% of all African foreign air trade. This dominant market shareis due to Europe’s proximity to Africa and longstanding historical and investment ties,many of which date from the colonial era. In addition to these international flows, domestic flows within Africa now total about 102,000 tonnes annually, primarily in thelarger nations of South Africa, Nigeria, Algeria, and Egypt.
The Middle East, North America, and Asia provide 12%, 8%, and 3% of total regional air trade, respectively. Intraregional air trade among the 56 nations of the Africa region is estimated to total approximately 67,000 tonnes. The dominant economies of Egypt,Algeria, and Morocco in the northern part of the continent; Kenya in the eastern portion;Nigeria in the west; and South Africa in the south tend to command the largest shares of overall African air trade.
In general, African air exports tend to be dominated by perishables and apparel to Europe and the Middle East, while air imports into the region tend to be industrialmachinery, computers and telecommunication goods, oil and gas exploration/extraction equipment, and pharmaceutical goods.
1,101,000 tonnes
Latin America, 1%
Asia
Intraregional AfricaNorth America
Europe Is Africa’s Primary Air Trade PartnerEstimate for 2003
Middle East,12%
3%8% 6%
Europe, 70%
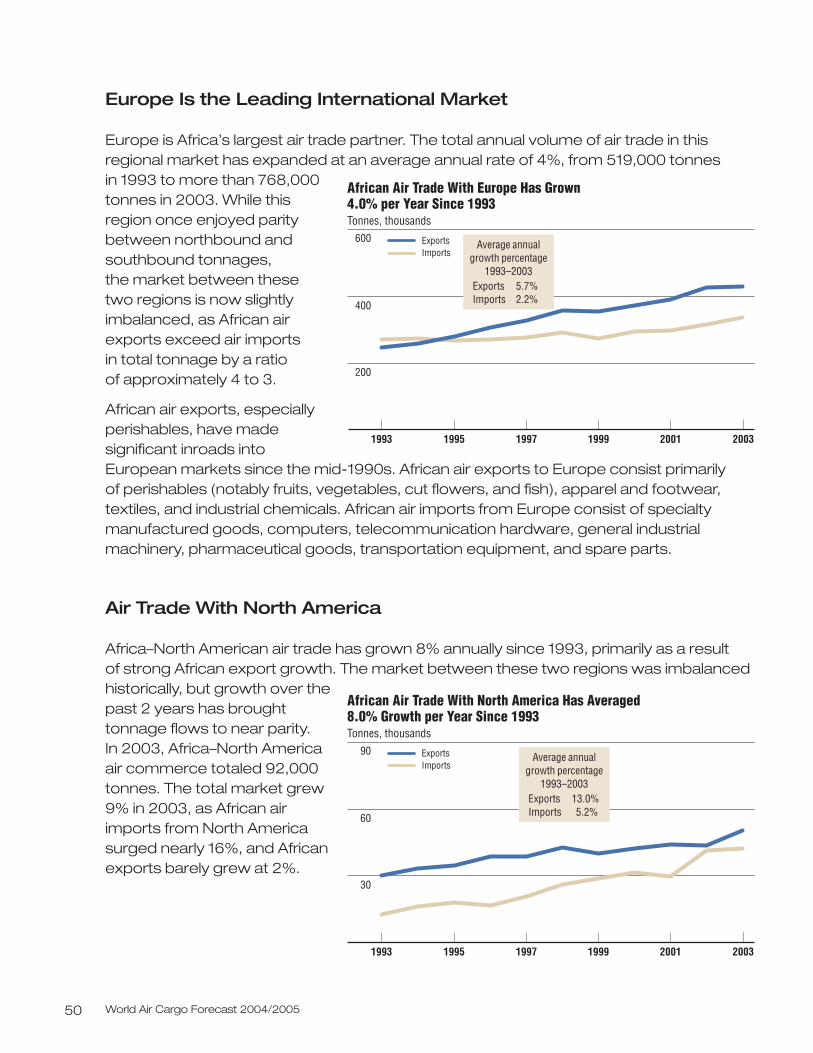
World Air Cargo Forecast 2004/200550
Europe Is the Leading International Market
Europe is Africa’s largest air trade partner. The total annual volume of air trade in thisregional market has expanded at an average annual rate of 4%, from 519,000 tonnes in 1993 to more than 768,000tonnes in 2003. While thisregion once enjoyed paritybetween northbound andsouthbound tonnages, the market between these two regions is now slightlyimbalanced, as African airexports exceed air imports in total tonnage by a ratio of approximately 4 to 3.
African air exports, especiallyperishables, have madesignificant inroads intoEuropean markets since the mid-1990s. African air exports to Europe consist primarily of perishables (notably fruits, vegetables, cut flowers, and fish), apparel and footwear,textiles, and industrial chemicals. African air imports from Europe consist of specialtymanufactured goods, computers, telecommunication hardware, general industrialmachinery, pharmaceutical goods, transportation equipment, and spare parts.
Air Trade With North America
Africa–North American air trade has grown 8% annually since 1993, primarily as a result of strong African export growth. The market between these two regions was imbalancedhistorically, but growth over thepast 2 years has broughttonnage flows to near parity. In 2003, Africa–North Americaair commerce totaled 92,000tonnes. The total market grew9% in 2003, as African airimports from North Americasurged nearly 16%, and Africanexports barely grew at 2%.
600
400
200
1993 1995 1999 2001 2003
ExportsImports
African Air Trade With Europe Has Grown 4.0% per Year Since 1993 Tonnes, thousands
Average annualgrowth percentage
1993–2003Exports 5.7%Imports 2.2%
1997
90
60
30
1993 1995 1999 2001 2003
ExportsImports
African Air Trade With North America Has Averaged8.0% Growth per Year Since 1993 Tonnes, thousands
Average annualgrowth percentage
1993–2003Exports 13.0%Imports 5.2%
1997
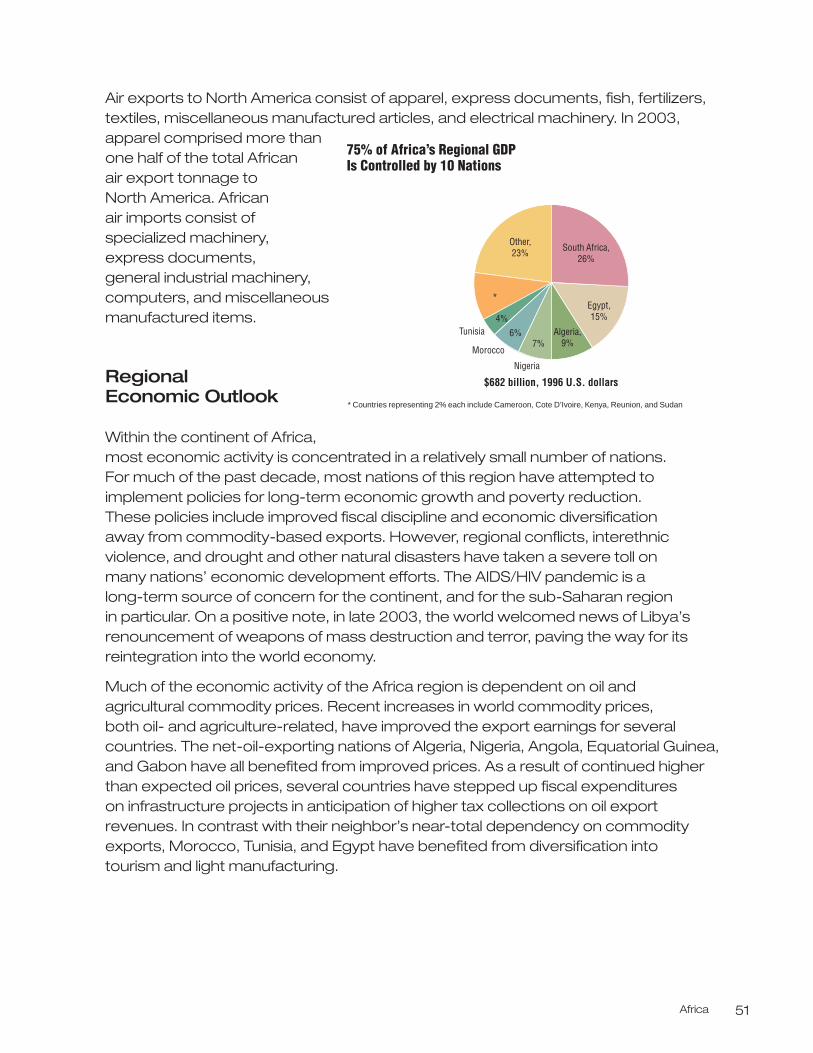
Africa 51
Air exports to North America consist of apparel, express documents, fish, fertilizers,textiles, miscellaneous manufactured articles, and electrical machinery. In 2003,apparel comprised more thanone half of the total African air export tonnage to North America. African air imports consist ofspecialized machinery, express documents, general industrial machinery,computers, and miscellaneousmanufactured items.
Regional Economic Outlook
Within the continent of Africa,most economic activity is concentrated in a relatively small number of nations. For much of the past decade, most nations of this region have attempted toimplement policies for long-term economic growth and poverty reduction. These policies include improved fiscal discipline and economic diversification away from commodity-based exports. However, regional conflicts, interethnicviolence, and drought and other natural disasters have taken a severe toll on many nations’ economic development efforts. The AIDS/HIV pandemic is a long-term source of concern for the continent, and for the sub-Saharan region in particular. On a positive note, in late 2003, the world welcomed news of Libya’srenouncement of weapons of mass destruction and terror, paving the way for itsreintegration into the world economy.
Much of the economic activity of the Africa region is dependent on oil and agricultural commodity prices. Recent increases in world commodity prices, both oil- and agriculture-related, have improved the export earnings for severalcountries. The net-oil-exporting nations of Algeria, Nigeria, Angola, Equatorial Guinea,and Gabon have all benefited from improved prices. As a result of continued higherthan expected oil prices, several countries have stepped up fiscal expenditures on infrastructure projects in anticipation of higher tax collections on oil exportrevenues. In contrast with their neighbor’s near-total dependency on commodityexports, Morocco, Tunisia, and Egypt have benefited from diversification into tourism and light manufacturing.
$682 billion, 1996 U.S. dollars
Morocco
Tunisia
75% of Africa’s Regional GDP Is Controlled by 10 Nations
Nigeria
* Countries representing 2% each include Cameroon, Cote D’Ivoire, Kenya, Reunion, and Sudan
South Africa, 26%
Egypt, 15%
Algeria, 9%7%
6%4%
Other, 23%
*
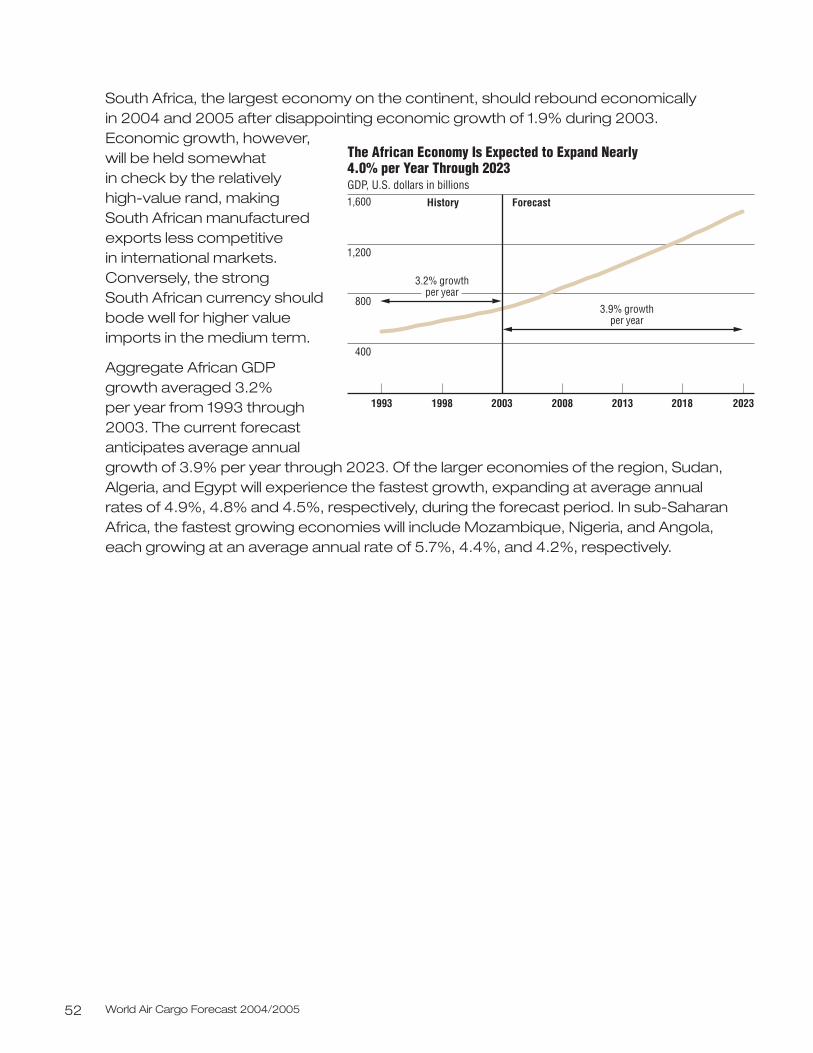
World Air Cargo Forecast 2004/200552
South Africa, the largest economy on the continent, should rebound economically in 2004 and 2005 after disappointing economic growth of 1.9% during 2003. Economic growth, however,will be held somewhat in check by the relatively high-value rand, making South African manufacturedexports less competitive in international markets.Conversely, the strong South African currency shouldbode well for higher valueimports in the medium term.
Aggregate African GDPgrowth averaged 3.2% per year from 1993 through2003. The current forecastanticipates average annualgrowth of 3.9% per year through 2023. Of the larger economies of the region, Sudan,Algeria, and Egypt will experience the fastest growth, expanding at average annualrates of 4.9%, 4.8% and 4.5%, respectively, during the forecast period. In sub-SaharanAfrica, the fastest growing economies will include Mozambique, Nigeria, and Angola,each growing at an average annual rate of 5.7%, 4.4%, and 4.2%, respectively.
The African Economy Is Expected to Expand Nearly 4.0% per Year Through 2023 GDP, U.S. dollars in billions
800
1,200
1,600
400
2008 2013 2018 2023200319981993
3.2% growthper year
3.9% growthper year
History Forecast
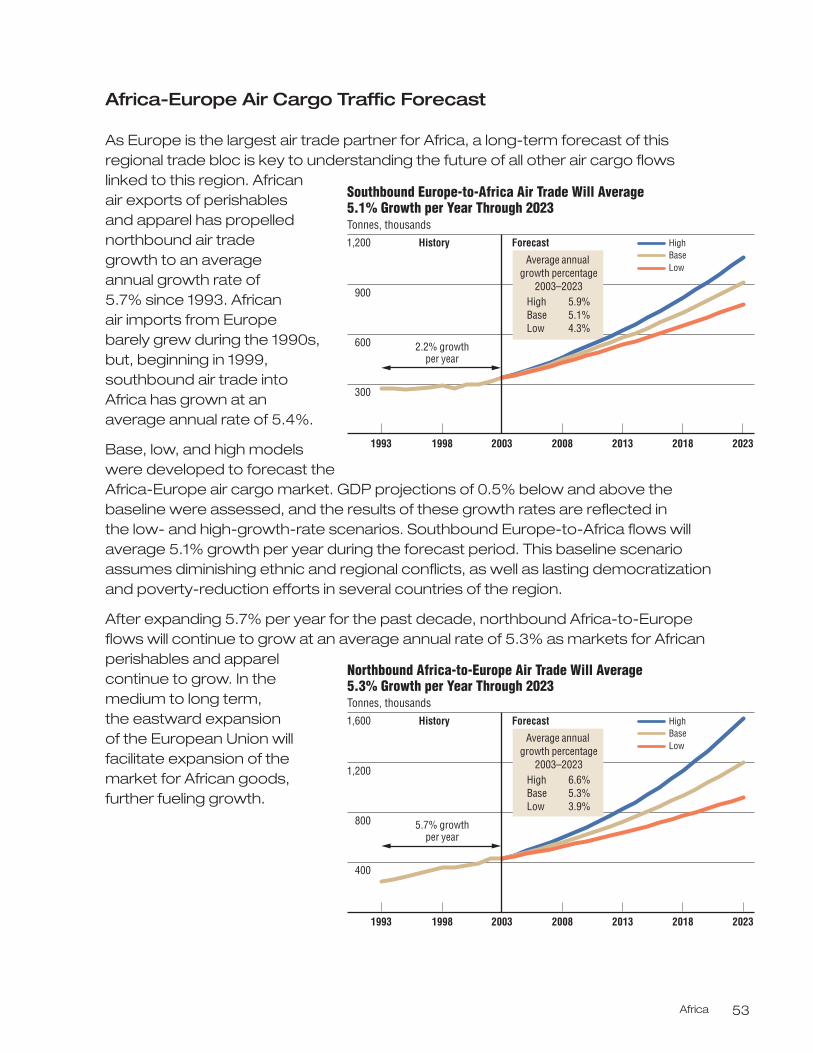
Africa 53
Africa-Europe Air Cargo Traffic Forecast
As Europe is the largest air trade partner for Africa, a long-term forecast of thisregional trade bloc is key to understanding the future of all other air cargo flows linked to this region. Africanair exports of perishables and apparel has propellednorthbound air trade growth to an average annual growth rate of 5.7% since 1993. African air imports from Europebarely grew during the 1990s,but, beginning in 1999,southbound air trade intoAfrica has grown at anaverage annual rate of 5.4%.
Base, low, and high modelswere developed to forecast the Africa-Europe air cargo market. GDP projections of 0.5% below and above thebaseline were assessed, and the results of these growth rates are reflected in the low- and high-growth-rate scenarios. Southbound Europe-to-Africa flows willaverage 5.1% growth per year during the forecast period. This baseline scenarioassumes diminishing ethnic and regional conflicts, as well as lasting democratizationand poverty-reduction efforts in several countries of the region.
After expanding 5.7% per year for the past decade, northbound Africa-to-Europeflows will continue to grow at an average annual rate of 5.3% as markets for Africanperishables and apparelcontinue to grow. In themedium to long term, the eastward expansion of the European Union willfacilitate expansion of themarket for African goods,further fueling growth.
2013
Southbound Europe-to-Africa Air Trade Will Average 5.1% Growth per Year Through 2023 Tonnes, thousands
1,200
900
600
300
20232018200820031993
HighBaseLow
History Forecast
Average annual growth percentage
2003–2023High 5.9%Base 5.1%Low 4.3%
2.2% growthper year
1998
2013
Northbound Africa-to-Europe Air Trade Will Average 5.3% Growth per Year Through 2023 Tonnes, thousands
1,600
1,200
800
400
20232018200820031993
HighBaseLow
History Forecast
Average annual growth percentage
2003–2023High 6.6%Base 5.3%Low 3.9%
5.7% growthper year
1998
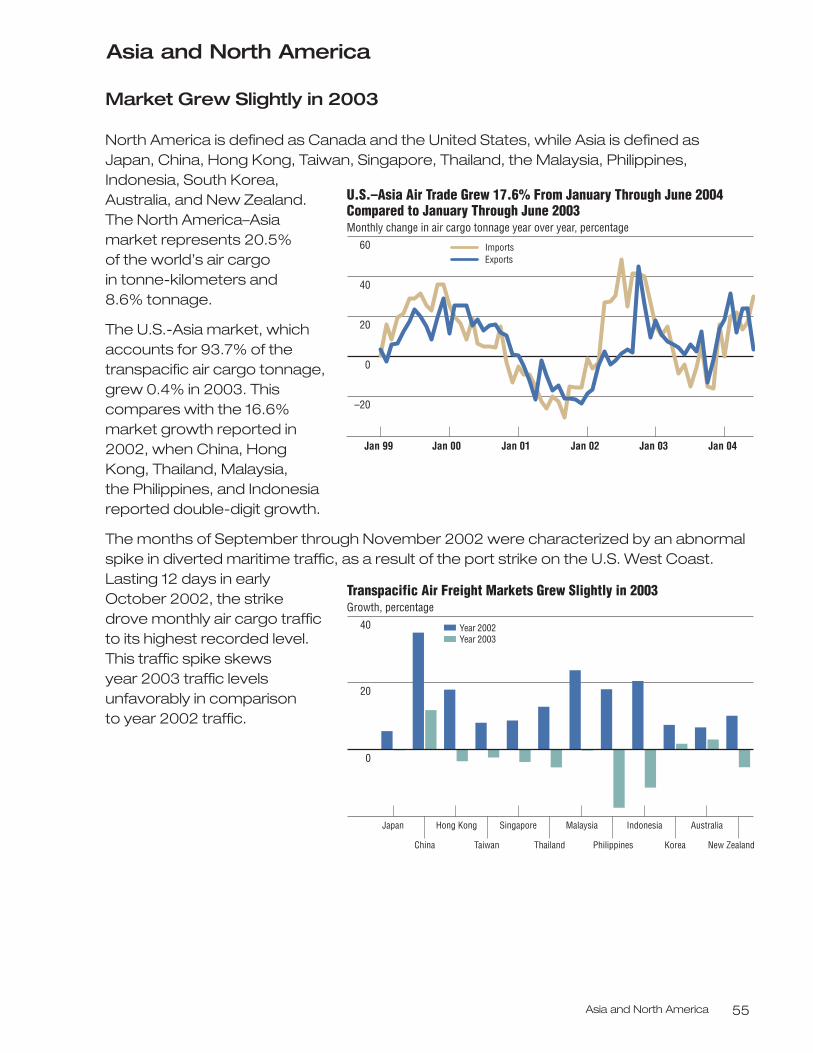
Asia and North America 55
Asia and North America
Market Grew Slightly in 2003
North America is defined as Canada and the United States, while Asia is defined as Japan, China, Hong Kong, Taiwan, Singapore, Thailand, the Malaysia, Philippines,Indonesia, South Korea,Australia, and New Zealand.The North America–Asiamarket represents 20.5% of the world’s air cargo in tonne-kilometers and 8.6% tonnage.
The U.S.-Asia market, whichaccounts for 93.7% of thetranspacific air cargo tonnage,grew 0.4% in 2003. Thiscompares with the 16.6% market growth reported in2002, when China, HongKong, Thailand, Malaysia, the Philippines, and Indonesia reported double-digit growth.
The months of September through November 2002 were characterized by an abnormalspike in diverted maritime traffic, as a result of the port strike on the U.S. West Coast.Lasting 12 days in early October 2002, the strike drove monthly air cargo trafficto its highest recorded level.This traffic spike skews year 2003 traffic levelsunfavorably in comparison to year 2002 traffic.
U.S.–Asia Air Trade Grew 17.6% From January Through June 2004 Compared to January Through June 2003 Monthly change in air cargo tonnage year over year, percentage
60
40
20
0
–20
Jan 99 Jan 00 Jan 01 Jan 02 Jan 03
ImportsExports
Jan 04
40
20
0
Transpacific Air Freight Markets Grew Slightly in 2003 Growth, percentage
Year 2003Year 2002
Thailand New Zealand
Japan Hong Kong Singapore Malaysia Indonesia Australia
China Taiwan Philippines Korea
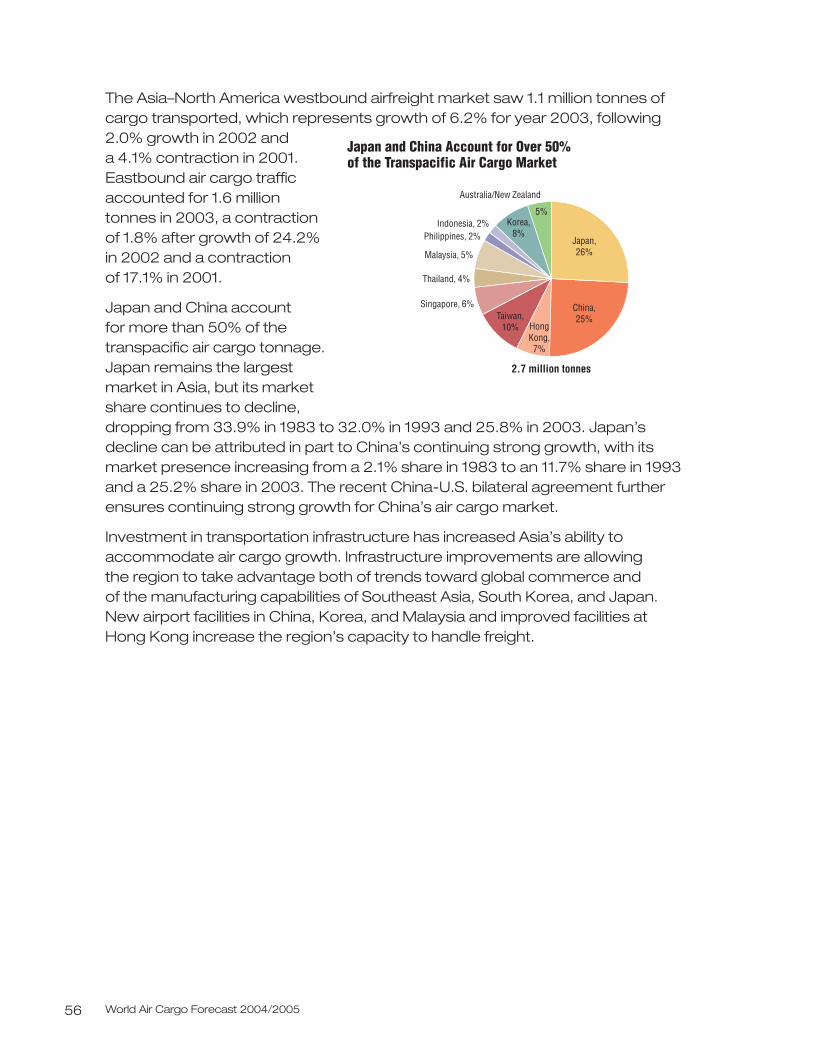
World Air Cargo Forecast 2004/200556
The Asia–North America westbound airfreight market saw 1.1 million tonnes of cargo transported, which represents growth of 6.2% for year 2003, following 2.0% growth in 2002 and a 4.1% contraction in 2001.Eastbound air cargo trafficaccounted for 1.6 milliontonnes in 2003, a contractionof 1.8% after growth of 24.2%in 2002 and a contraction of 17.1% in 2001.
Japan and China account for more than 50% of thetranspacific air cargo tonnage.Japan remains the largestmarket in Asia, but its marketshare continues to decline,dropping from 33.9% in 1983 to 32.0% in 1993 and 25.8% in 2003. Japan’s decline can be attributed in part to China’s continuing strong growth, with its market presence increasing from a 2.1% share in 1983 to an 11.7% share in 1993 and a 25.2% share in 2003. The recent China-U.S. bilateral agreement further ensures continuing strong growth for China’s air cargo market.
Investment in transportation infrastructure has increased Asia’s ability to accommodate air cargo growth. Infrastructure improvements are allowing the region to take advantage both of trends toward global commerce and of the manufacturing capabilities of Southeast Asia, South Korea, and Japan. New airport facilities in China, Korea, and Malaysia and improved facilities at Hong Kong increase the region’s capacity to handle freight.
2.7 million tonnes
Australia/New Zealand
Japan and China Account for Over 50%of the Transpacific Air Cargo Market
Indonesia, 2%
Japan,26%
Philippines, 2%
Malaysia, 5%
Thailand, 4%
5%Korea,
8%
Singapore, 6%Taiwan,
10%
China,25%
HongKong,7%
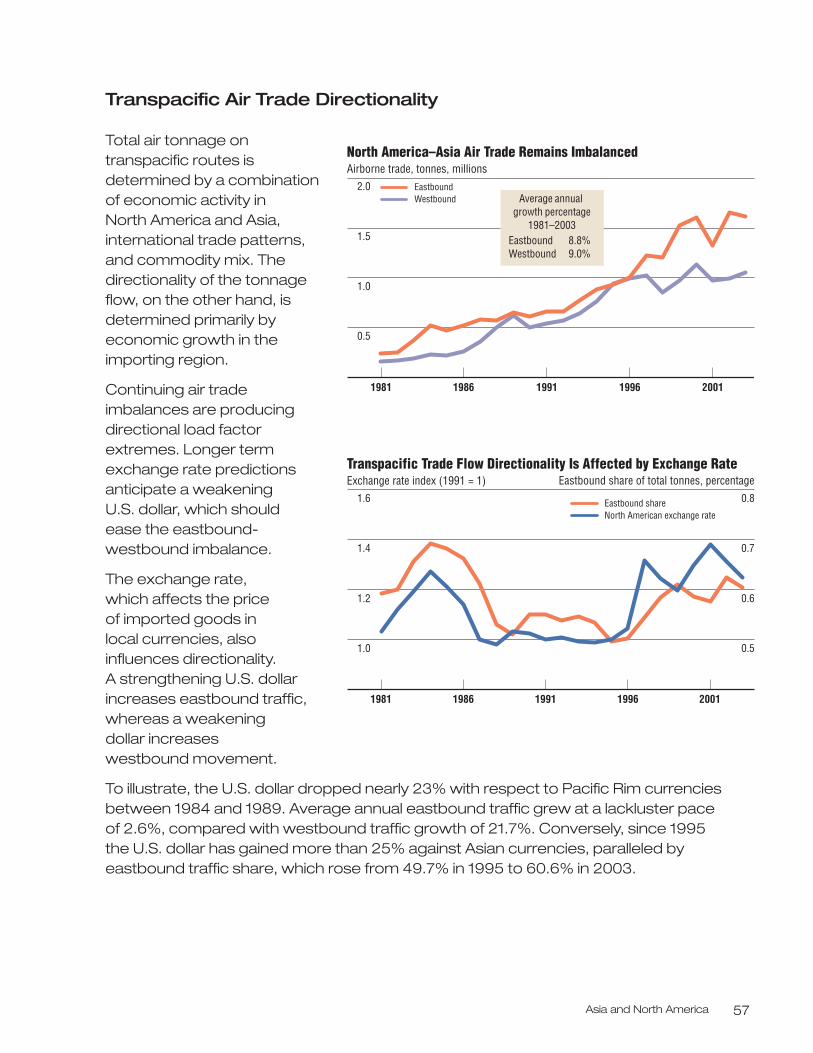
Asia and North America 57
Transpacific Air Trade Directionality
Total air tonnage ontranspacific routes isdetermined by a combinationof economic activity in North America and Asia,international trade patterns,and commodity mix. Thedirectionality of the tonnageflow, on the other hand, isdetermined primarily byeconomic growth in theimporting region.
Continuing air tradeimbalances are producingdirectional load factorextremes. Longer termexchange rate predictionsanticipate a weakening U.S. dollar, which should ease the eastbound-westbound imbalance.
The exchange rate, which affects the price of imported goods in local currencies, alsoinfluences directionality. A strengthening U.S. dollarincreases eastbound traffic,whereas a weakening dollar increases westbound movement.
To illustrate, the U.S. dollar dropped nearly 23% with respect to Pacific Rim currenciesbetween 1984 and 1989. Average annual eastbound traffic grew at a lackluster paceof 2.6%, compared with westbound traffic growth of 21.7%. Conversely, since 1995the U.S. dollar has gained more than 25% against Asian currencies, paralleled byeastbound traffic share, which rose from 49.7% in 1995 to 60.6% in 2003.
North America–Asia Air Trade Remains ImbalancedAirborne trade, tonnes, millions
2.0
1.5
1.0
0.5
1981 1986 1996
EastboundWestbound
1991 2001
Average annual growth percentage
1981–2003Eastbound 8.8%Westbound 9.0%
Transpacific Trade Flow Directionality Is Affected by Exchange RateExchange rate index (1991 = 1)
1.6
1.4
1.0
1.2
0.7
0.5
0.6
0.8
1981 1986 19961991 2001
Eastbound shareNorth American exchange rate
Eastbound share of total tonnes, percentage
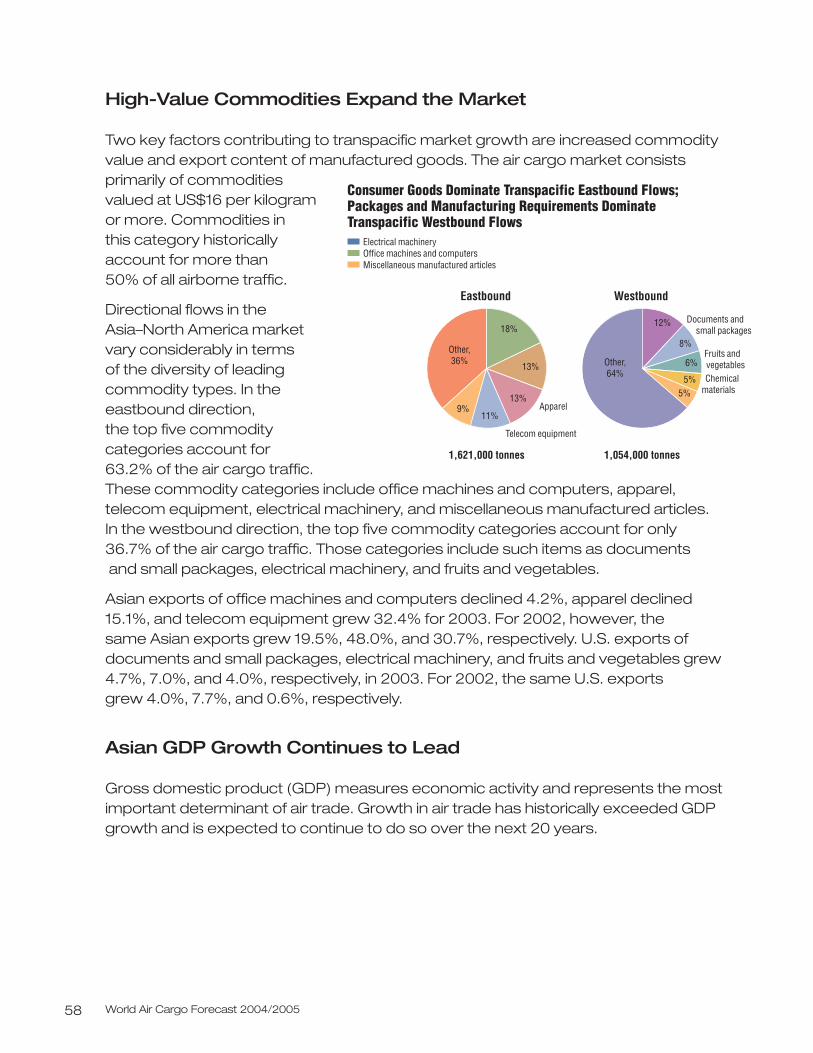
World Air Cargo Forecast 2004/200558
High-Value Commodities Expand the Market
Two key factors contributing to transpacific market growth are increased commodityvalue and export content of manufactured goods. The air cargo market consistsprimarily of commoditiesvalued at US$16 per kilogramor more. Commodities in this category historicallyaccount for more than 50% of all airborne traffic.
Directional flows in theAsia–North America marketvary considerably in terms of the diversity of leadingcommodity types. In theeastbound direction, the top five commoditycategories account for 63.2% of the air cargo traffic.These commodity categories include office machines and computers, apparel,telecom equipment, electrical machinery, and miscellaneous manufactured articles. In the westbound direction, the top five commodity categories account for only 36.7% of the air cargo traffic. Those categories include such items as documentsand small packages, electrical machinery, and fruits and vegetables.
Asian exports of office machines and computers declined 4.2%, apparel declined15.1%, and telecom equipment grew 32.4% for 2003. For 2002, however, the same Asian exports grew 19.5%, 48.0%, and 30.7%, respectively. U.S. exports ofdocuments and small packages, electrical machinery, and fruits and vegetables grew4.7%, 7.0%, and 4.0%, respectively, in 2003. For 2002, the same U.S. exports grew 4.0%, 7.7%, and 0.6%, respectively.
Asian GDP Growth Continues to Lead
Gross domestic product (GDP) measures economic activity and represents the mostimportant determinant of air trade. Growth in air trade has historically exceeded GDPgrowth and is expected to continue to do so over the next 20 years.
1,621,000 tonnes
Apparel
Telecom equipment
Chemical materials
Documents and small packages
Fruits and vegetables
Consumer Goods Dominate Transpacific Eastbound Flows; Packages and Manufacturing Requirements Dominate Transpacific Westbound Flows
Eastbound
1,054,000 tonnes
Westbound
18%
Other,36%
13%
13%
11%9%
12%
Other,64%
6%
5%5%
8%
Miscellaneous manufactured articlesOffice machines and computersElectrical machinery
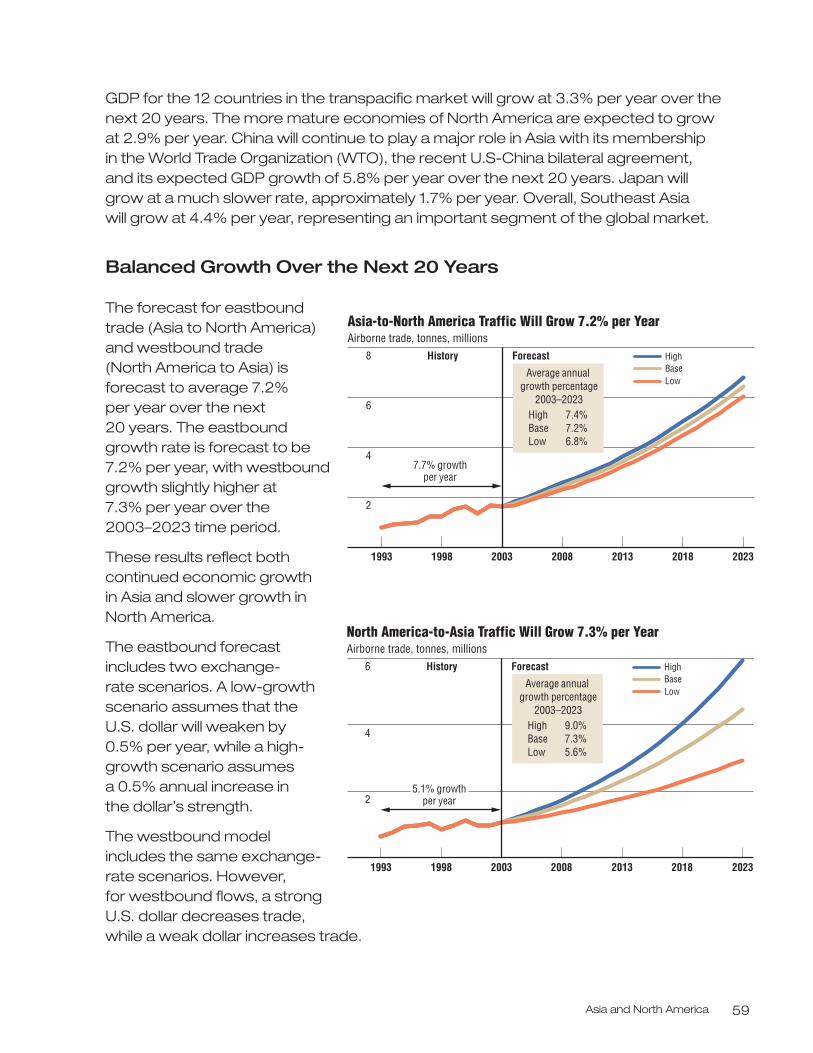
Asia and North America 59
GDP for the 12 countries in the transpacific market will grow at 3.3% per year over thenext 20 years. The more mature economies of North America are expected to growat 2.9% per year. China will continue to play a major role in Asia with its membershipin the World Trade Organization (WTO), the recent U.S-China bilateral agreement, and its expected GDP growth of 5.8% per year over the next 20 years. Japan willgrow at a much slower rate, approximately 1.7% per year. Overall, Southeast Asia will grow at 4.4% per year, representing an important segment of the global market.
Balanced Growth Over the Next 20 Years
The forecast for eastboundtrade (Asia to North America) and westbound trade (North America to Asia) isforecast to average 7.2% per year over the next 20 years. The eastboundgrowth rate is forecast to be7.2% per year, with westboundgrowth slightly higher at 7.3% per year over the2003–2023 time period.
These results reflect bothcontinued economic growthin Asia and slower growth in North America.
The eastbound forecastincludes two exchange- rate scenarios. A low-growthscenario assumes that theU.S. dollar will weaken by 0.5% per year, while a high-growth scenario assumes a 0.5% annual increase in the dollar’s strength.
The westbound modelincludes the same exchange-rate scenarios. However, for westbound flows, a strong U.S. dollar decreases trade, while a weak dollar increases trade.
Asia-to-North America Traffic Will Grow 7.2% per YearAirborne trade, tonnes, millions
8
6
4
2
HighBaseLow
History Forecast
Average annual growth percentage
2003–2023High 7.4%Base 7.2%Low 6.8%
7.7% growthper year
1993 1998 2003 2008 2013 2018 2023
North America-to-Asia Traffic Will Grow 7.3% per YearAirborne trade, tonnes, millions
6
4
2
HighBaseLow
History Forecast
Average annual growth percentage
2003–2023High 9.0%Base 7.3%Low 5.6%
5.1% growthper year
1993 1998 2003 2008 2013 2018 2023
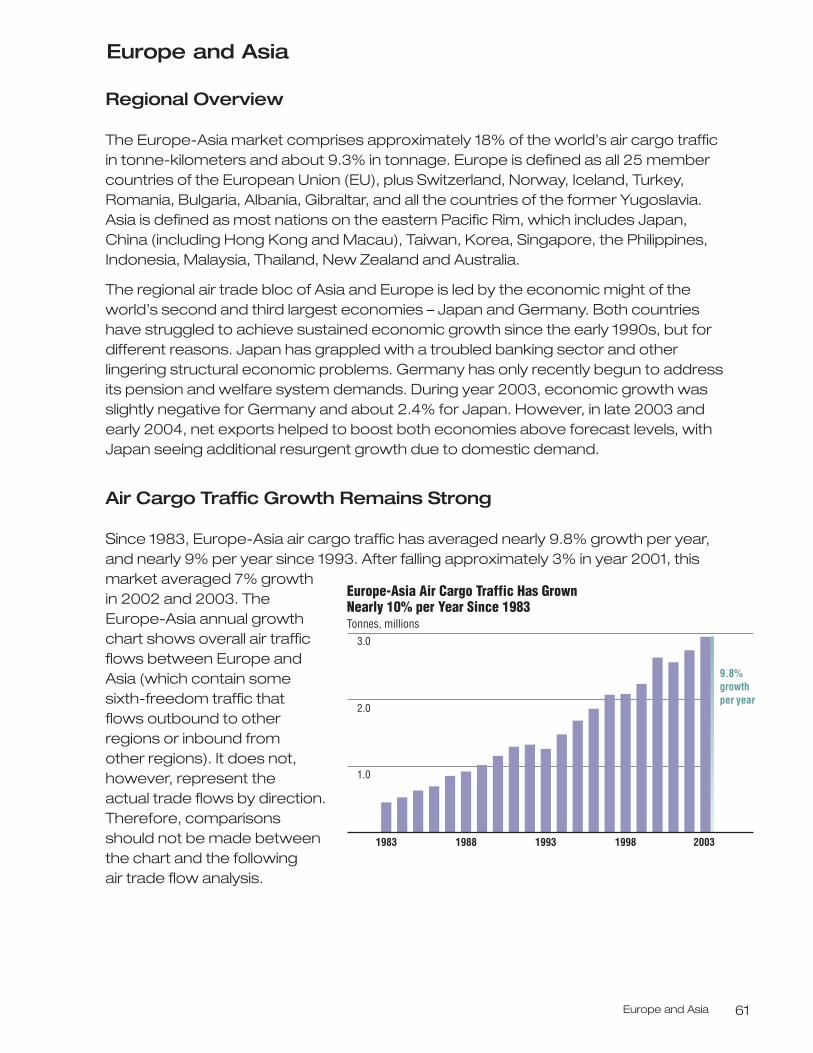
Europe and Asia 61
Europe and Asia
Regional Overview
The Europe-Asia market comprises approximately 18% of the world’s air cargo trafficin tonne-kilometers and about 9.3% in tonnage. Europe is defined as all 25 membercountries of the European Union (EU), plus Switzerland, Norway, Iceland, Turkey,Romania, Bulgaria, Albania, Gibraltar, and all the countries of the former Yugoslavia.Asia is defined as most nations on the eastern Pacific Rim, which includes Japan,China (including Hong Kong and Macau), Taiwan, Korea, Singapore, the Philippines,Indonesia, Malaysia, Thailand, New Zealand and Australia.
The regional air trade bloc of Asia and Europe is led by the economic might of theworld’s second and third largest economies – Japan and Germany. Both countrieshave struggled to achieve sustained economic growth since the early 1990s, but fordifferent reasons. Japan has grappled with a troubled banking sector and otherlingering structural economic problems. Germany has only recently begun to addressits pension and welfare system demands. During year 2003, economic growth wasslightly negative for Germany and about 2.4% for Japan. However, in late 2003 andearly 2004, net exports helped to boost both economies above forecast levels, withJapan seeing additional resurgent growth due to domestic demand.
Air Cargo Traffic Growth Remains Strong
Since 1983, Europe-Asia air cargo traffic has averaged nearly 9.8% growth per year,and nearly 9% per year since 1993. After falling approximately 3% in year 2001, thismarket averaged 7% growth in 2002 and 2003. TheEurope-Asia annual growthchart shows overall air trafficflows between Europe andAsia (which contain some sixth-freedom traffic thatflows outbound to otherregions or inbound from other regions). It does not,however, represent the actual trade flows by direction. Therefore, comparisonsshould not be made between the chart and the following air trade flow analysis.
Europe-Asia Air Cargo Traffic Has Grown Nearly 10% per Year Since 1983Tonnes, millions
3.0
1.0
2.0
1983 1988 1993 1998 2003
9.8%growthper year
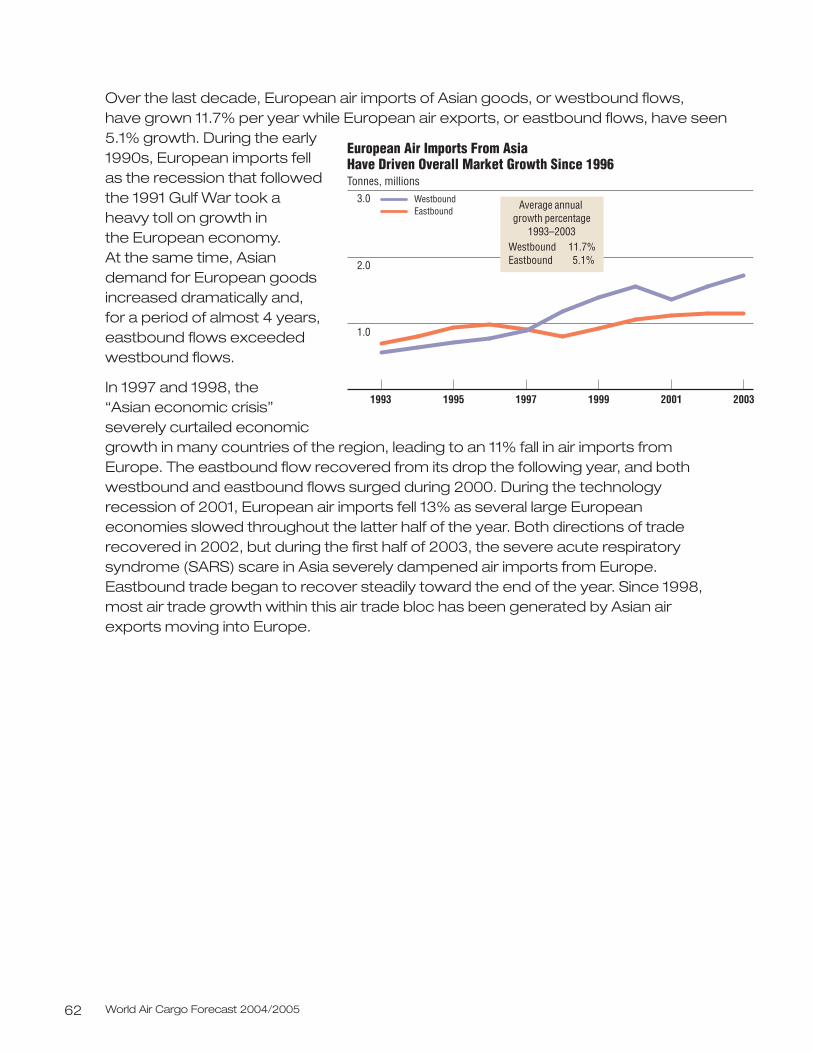
World Air Cargo Forecast 2004/200562
Over the last decade, European air imports of Asian goods, or westbound flows, have grown 11.7% per year while European air exports, or eastbound flows, have seen5.1% growth. During the early1990s, European imports fell as the recession that followedthe 1991 Gulf War took a heavy toll on growth in the European economy. At the same time, Asiandemand for European goodsincreased dramatically and, for a period of almost 4 years,eastbound flows exceededwestbound flows.
In 1997 and 1998, the “Asian economic crisis”severely curtailed economicgrowth in many countries of the region, leading to an 11% fall in air imports fromEurope. The eastbound flow recovered from its drop the following year, and bothwestbound and eastbound flows surged during 2000. During the technologyrecession of 2001, European air imports fell 13% as several large Europeaneconomies slowed throughout the latter half of the year. Both directions of traderecovered in 2002, but during the first half of 2003, the severe acute respiratorysyndrome (SARS) scare in Asia severely dampened air imports from Europe.Eastbound trade began to recover steadily toward the end of the year. Since 1998,most air trade growth within this air trade bloc has been generated by Asian airexports moving into Europe.
European Air Imports From Asia Have Driven Overall Market Growth Since 1996Tonnes, millions
3.0
2.0
1.0
1993 1995 1997 1999 2001 2003
WestboundEastbound Average annual
growth percentage1993–2003
Westbound 11.7%Eastbound 5.1%
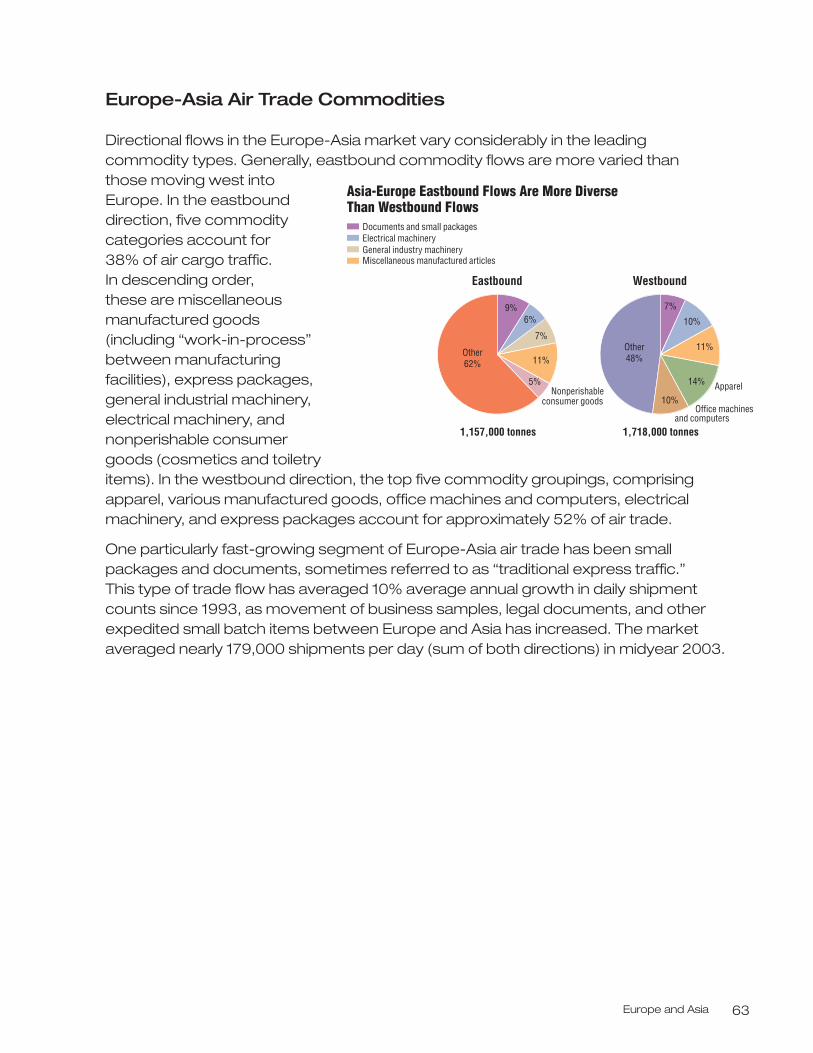
Europe and Asia 63
Europe-Asia Air Trade Commodities
Directional flows in the Europe-Asia market vary considerably in the leadingcommodity types. Generally, eastbound commodity flows are more varied than those moving west intoEurope. In the eastbounddirection, five commoditycategories account for 38% of air cargo traffic. In descending order, these are miscellaneousmanufactured goods(including “work-in-process”between manufacturingfacilities), express packages,general industrial machinery,electrical machinery, andnonperishable consumergoods (cosmetics and toiletryitems). In the westbound direction, the top five commodity groupings, comprisingapparel, various manufactured goods, office machines and computers, electricalmachinery, and express packages account for approximately 52% of air trade.
One particularly fast-growing segment of Europe-Asia air trade has been smallpackages and documents, sometimes referred to as “traditional express traffic.” This type of trade flow has averaged 10% average annual growth in daily shipmentcounts since 1993, as movement of business samples, legal documents, and otherexpedited small batch items between Europe and Asia has increased. The marketaveraged nearly 179,000 shipments per day (sum of both directions) in midyear 2003.
1,157,000 tonnes
Apparel
Asia-Europe Eastbound Flows Are More DiverseThan Westbound Flows
Eastbound
1,718,000 tonnes
Westbound
7%
Other62%
5%
9% 7%
14%
6%
Other48%
10%
11%
10%
11%
Miscellaneous manufactured articlesGeneral industry machineryElectrical machineryDocuments and small packages
Nonperishable consumer goods
Office machines and computers
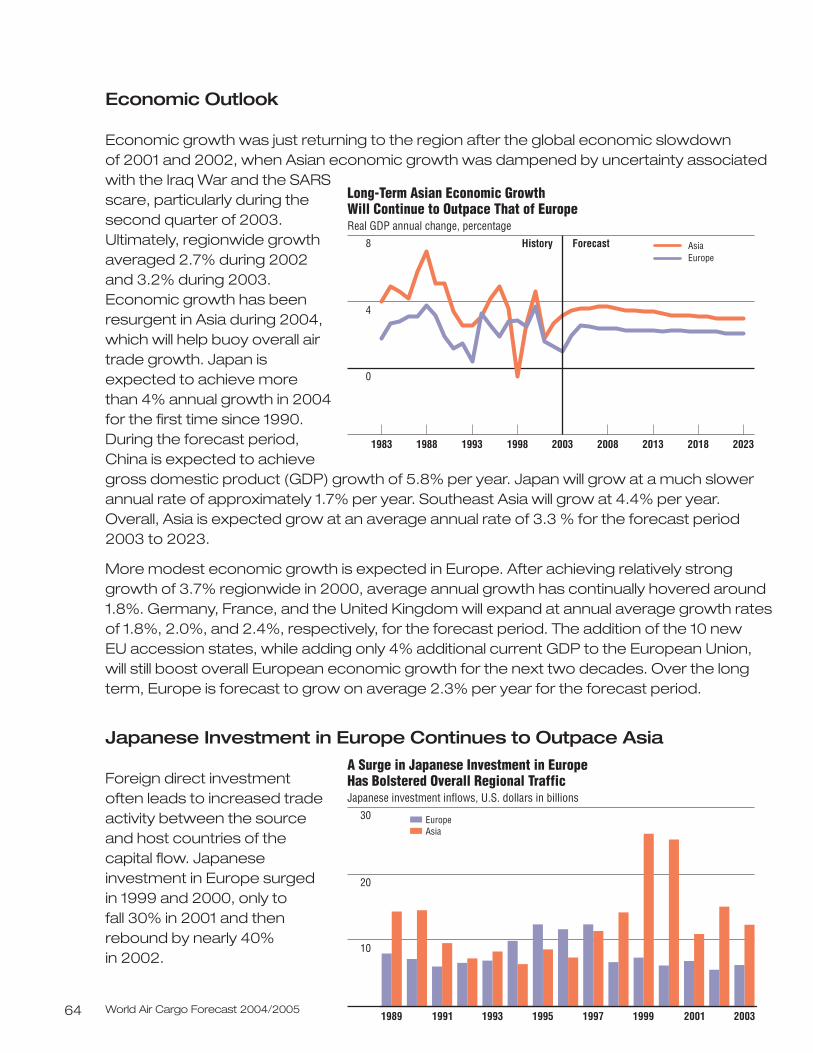
World Air Cargo Forecast 2004/200564
Economic Outlook
Economic growth was just returning to the region after the global economic slowdown of 2001 and 2002, when Asian economic growth was dampened by uncertainty associated with the Iraq War and the SARSscare, particularly during thesecond quarter of 2003.Ultimately, regionwide growthaveraged 2.7% during 2002and 3.2% during 2003.Economic growth has beenresurgent in Asia during 2004,which will help buoy overall airtrade growth. Japan isexpected to achieve morethan 4% annual growth in 2004for the first time since 1990.During the forecast period,China is expected to achievegross domestic product (GDP) growth of 5.8% per year. Japan will grow at a much slowerannual rate of approximately 1.7% per year. Southeast Asia will grow at 4.4% per year. Overall, Asia is expected grow at an average annual rate of 3.3 % for the forecast period 2003 to 2023.
More modest economic growth is expected in Europe. After achieving relatively strong growth of 3.7% regionwide in 2000, average annual growth has continually hovered around1.8%. Germany, France, and the United Kingdom will expand at annual average growth ratesof 1.8%, 2.0%, and 2.4%, respectively, for the forecast period. The addition of the 10 new EU accession states, while adding only 4% additional current GDP to the European Union, will still boost overall European economic growth for the next two decades. Over the longterm, Europe is forecast to grow on average 2.3% per year for the forecast period.
Japanese Investment in Europe Continues to Outpace Asia
Foreign direct investmentoften leads to increased tradeactivity between the sourceand host countries of thecapital flow. Japaneseinvestment in Europe surgedin 1999 and 2000, only to fall 30% in 2001 and thenrebound by nearly 40% in 2002.
Long-Term Asian Economic Growth Will Continue to Outpace That of EuropeReal GDP annual change, percentage
8
4
0
History Forecast
1983 1988 1993 1998 2003 2008 2013 2018 2023
AsiaEurope
A Surge in Japanese Investment in EuropeHas Bolstered Overall Regional TrafficJapanese investment inflows, U.S. dollars in billions
199919971995199319911989 20032001
30
20
10
AsiaEurope
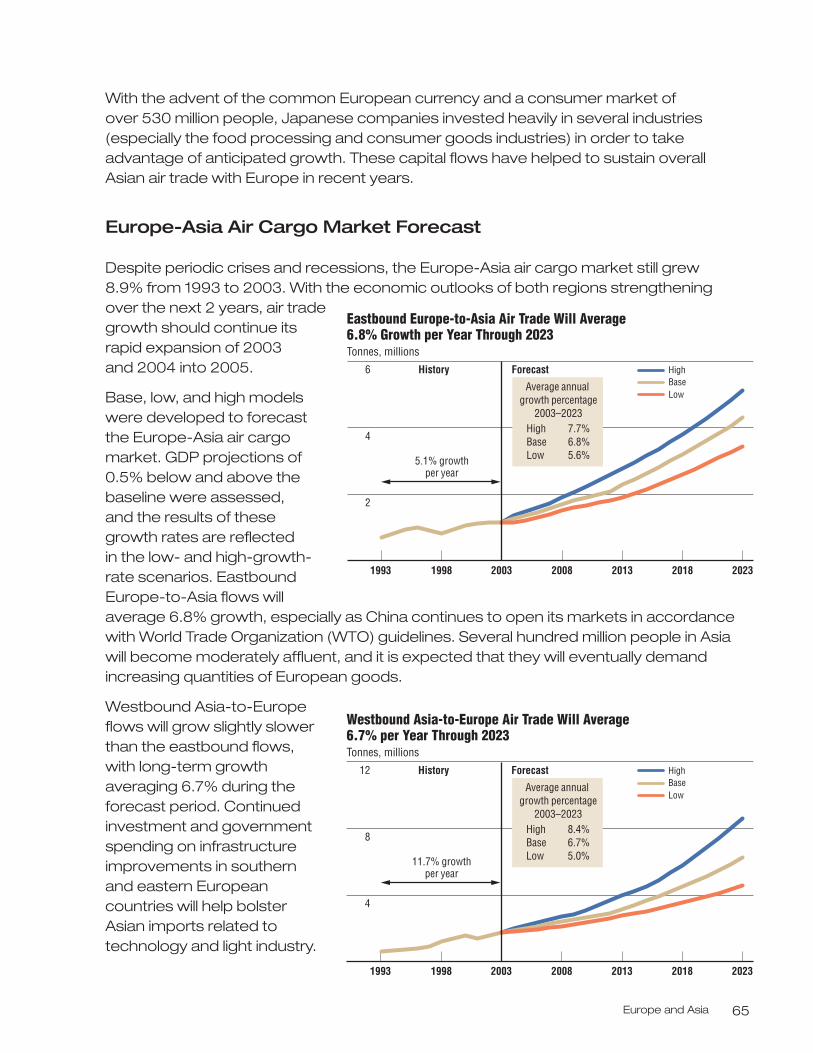
Europe and Asia 65
With the advent of the common European currency and a consumer market of over 530 million people, Japanese companies invested heavily in several industries(especially the food processing and consumer goods industries) in order to takeadvantage of anticipated growth. These capital flows have helped to sustain overallAsian air trade with Europe in recent years.
Europe-Asia Air Cargo Market Forecast
Despite periodic crises and recessions, the Europe-Asia air cargo market still grew8.9% from 1993 to 2003. With the economic outlooks of both regions strengtheningover the next 2 years, air tradegrowth should continue itsrapid expansion of 2003 and 2004 into 2005.
Base, low, and high modelswere developed to forecastthe Europe-Asia air cargomarket. GDP projections of0.5% below and above thebaseline were assessed, and the results of thesegrowth rates are reflectedin the low- and high-growth-rate scenarios. EastboundEurope-to-Asia flows willaverage 6.8% growth, especially as China continues to open its markets in accordancewith World Trade Organization (WTO) guidelines. Several hundred million people in Asiawill become moderately affluent, and it is expected that they will eventually demandincreasing quantities of European goods.
Westbound Asia-to-Europeflows will grow slightly slowerthan the eastbound flows,with long-term growthaveraging 6.7% during theforecast period. Continuedinvestment and governmentspending on infrastructureimprovements in southernand eastern Europeancountries will help bolsterAsian imports related totechnology and light industry.
2013
Eastbound Europe-to-Asia Air Trade Will Average 6.8% Growth per Year Through 2023Tonnes, millions
6
4
2
20232018200820031993
HighBaseLow
History Forecast
Average annual growth percentage
2003–2023High 7.7%Base 6.8%Low 5.6%5.1% growth
per year
1998
2013
Westbound Asia-to-Europe Air Trade Will Average 6.7% per Year Through 2023Tonnes, millions
12
8
4
20232018200820031993
HighBaseLow
History Forecast
11.7% growthper year
1998
Average annual growth percentage
2003–2023High 8.4%Base 6.7%Low 5.0%
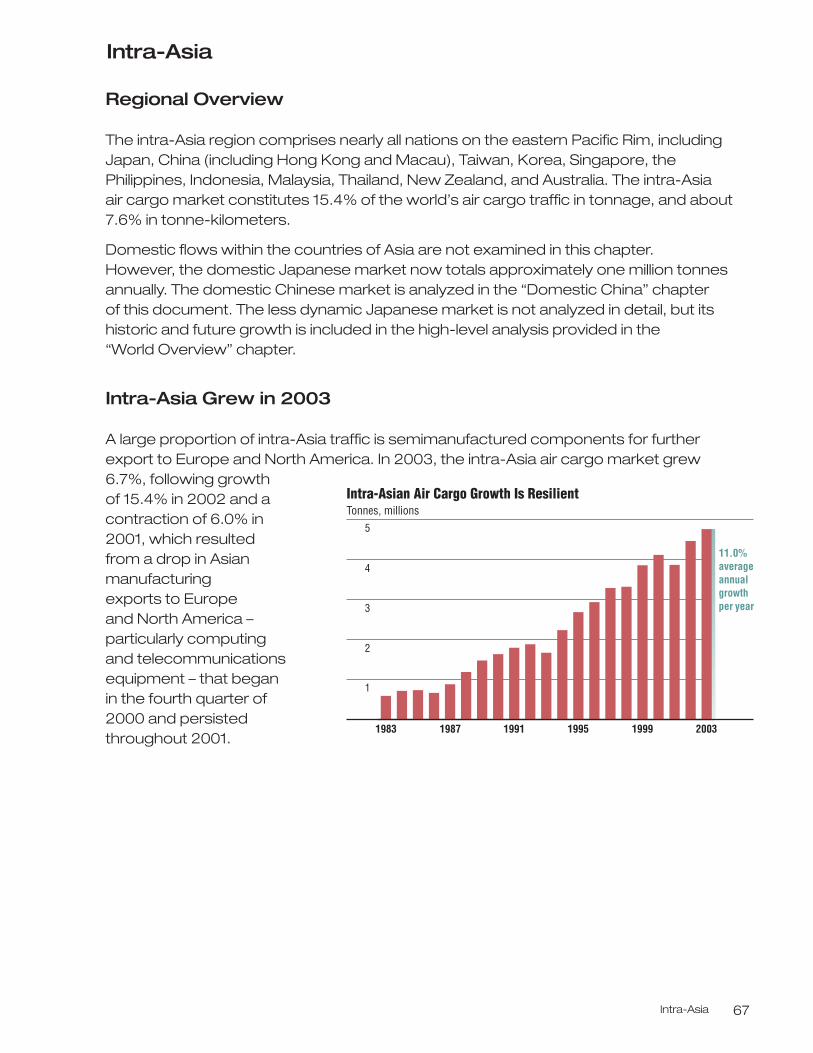
Intra-Asia 67
Intra-Asia
Regional Overview
The intra-Asia region comprises nearly all nations on the eastern Pacific Rim, includingJapan, China (including Hong Kong and Macau), Taiwan, Korea, Singapore, thePhilippines, Indonesia, Malaysia, Thailand, New Zealand, and Australia. The intra-Asia air cargo market constitutes 15.4% of the world’s air cargo traffic in tonnage, and about7.6% in tonne-kilometers.
Domestic flows within the countries of Asia are not examined in this chapter. However, the domestic Japanese market now totals approximately one million tonnesannually. The domestic Chinese market is analyzed in the “Domestic China” chapter of this document. The less dynamic Japanese market is not analyzed in detail, but its historic and future growth is included in the high-level analysis provided in the “World Overview” chapter.
Intra-Asia Grew in 2003
A large proportion of intra-Asia traffic is semimanufactured components for furtherexport to Europe and North America. In 2003, the intra-Asia air cargo market grew6.7%, following growth of 15.4% in 2002 and acontraction of 6.0% in 2001, which resulted from a drop in Asianmanufacturing exports to Europe and North America –particularly computing and telecommunicationsequipment – that began in the fourth quarter of 2000 and persistedthroughout 2001.
Intra-Asian Air Cargo Growth Is ResilientTonnes, millions
5
3
4
1
2
1987 1991 19991995 20031983
11.0%averageannualgrowthper year
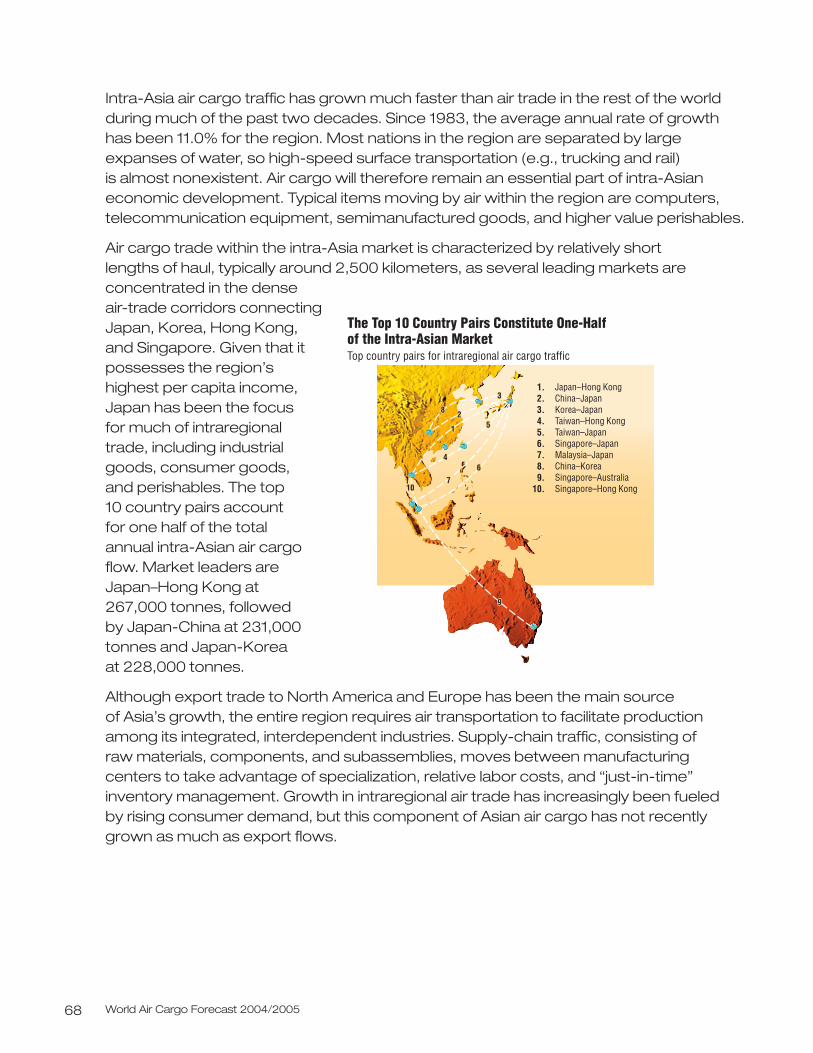
World Air Cargo Forecast 2004/200568
Intra-Asia air cargo traffic has grown much faster than air trade in the rest of the worldduring much of the past two decades. Since 1983, the average annual rate of growth has been 11.0% for the region. Most nations in the region are separated by largeexpanses of water, so high-speed surface transportation (e.g., trucking and rail) is almost nonexistent. Air cargo will therefore remain an essential part of intra-Asianeconomic development. Typical items moving by air within the region are computers,telecommunication equipment, semimanufactured goods, and higher value perishables.
Air cargo trade within the intra-Asia market is characterized by relatively short lengths of haul, typically around 2,500 kilometers, as several leading markets areconcentrated in the dense air-trade corridors connectingJapan, Korea, Hong Kong,and Singapore. Given that itpossesses the region’shighest per capita income, Japan has been the focus for much of intraregionaltrade, including industrialgoods, consumer goods, and perishables. The top 10 country pairs account for one half of the total annual intra-Asian air cargoflow. Market leaders areJapan–Hong Kong at 267,000 tonnes, followed by Japan-China at 231,000tonnes and Japan-Korea at 228,000 tonnes.
Although export trade to North America and Europe has been the main source of Asia’s growth, the entire region requires air transportation to facilitate productionamong its integrated, interdependent industries. Supply-chain traffic, consisting of raw materials, components, and subassemblies, moves between manufacturing centers to take advantage of specialization, relative labor costs, and “just-in-time”inventory management. Growth in intraregional air trade has increasingly been fueled by rising consumer demand, but this component of Asian air cargo has not recentlygrown as much as export flows.
1.2.3.4.5.6.7.8.9.
10.
The Top 10 Country Pairs Constitute One-Half of the Intra-Asian MarketTop country pairs for intraregional air cargo traffic
Japan–Hong KongChina–JapanKorea–JapanTaiwan–Hong KongTaiwan–JapanSingapore–JapanMalaysia–JapanChina–KoreaSingapore–AustraliaSingapore–Hong Kong
22
44
55
88
771010
11
66
99
33
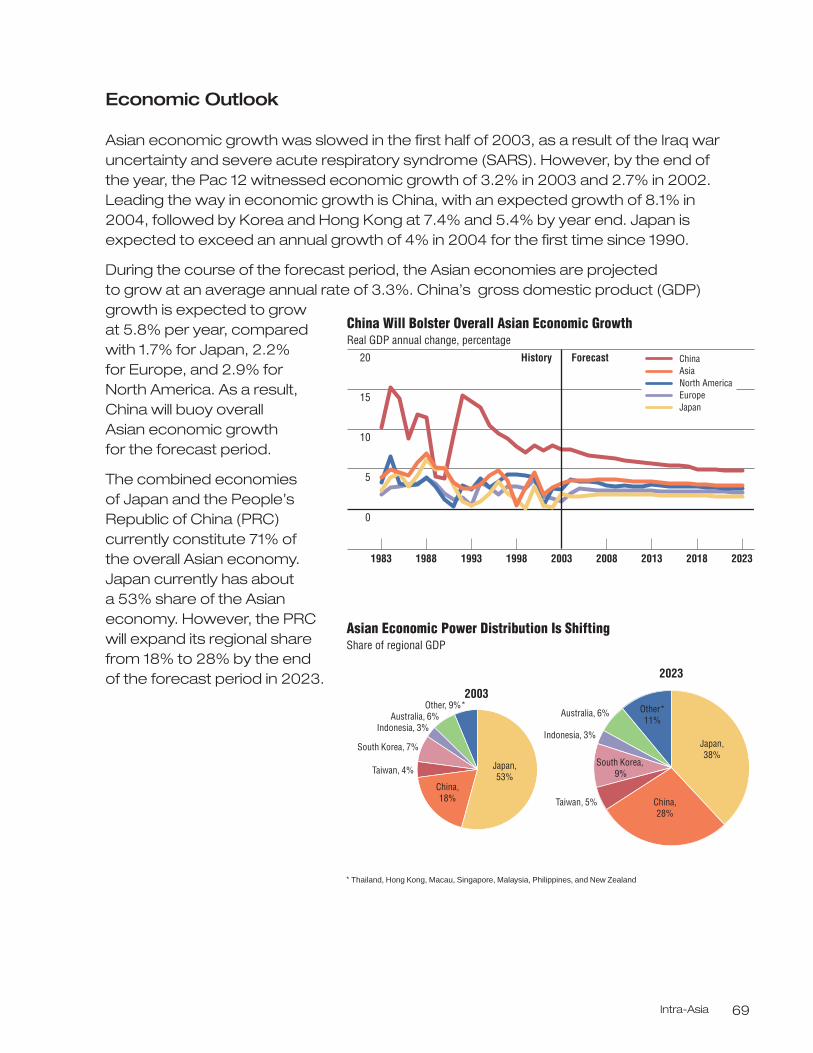
Intra-Asia 69
Economic Outlook
Asian economic growth was slowed in the first half of 2003, as a result of the Iraq waruncertainty and severe acute respiratory syndrome (SARS). However, by the end ofthe year, the Pac 12 witnessed economic growth of 3.2% in 2003 and 2.7% in 2002.Leading the way in economic growth is China, with an expected growth of 8.1% in2004, followed by Korea and Hong Kong at 7.4% and 5.4% by year end. Japan isexpected to exceed an annual growth of 4% in 2004 for the first time since 1990.
During the course of the forecast period, the Asian economies are projected to grow at an average annual rate of 3.3%. China’s gross domestic product (GDP)growth is expected to grow at 5.8% per year, comparedwith 1.7% for Japan, 2.2% for Europe, and 2.9% for North America. As a result,China will buoy overall Asian economic growth for the forecast period.
The combined economies of Japan and the People’sRepublic of China (PRC)currently constitute 71% of the overall Asian economy.Japan currently has about a 53% share of the Asian economy. However, the PRC will expand its regional share from 18% to 28% by the end of the forecast period in 2023.
China Will Bolster Overall Asian Economic GrowthReal GDP annual change, percentage
20
10
5
15
0
1983 1988 1993 1998 2003 2008 2013 2018 2023
ChinaAsiaNorth AmericaEuropeJapan
History Forecast
2003
Asian Economic Power Distribution Is ShiftingShare of regional GDP
* Thailand, Hong Kong, Macau, Singapore, Malaysia, Philippines, and New Zealand
2023
South Korea, 7%
South Korea, 9%
Indonesia, 3%Indonesia, 3%
Australia, 6% Australia, 6%
China,18%
Taiwan, 4%
Taiwan, 5% China,28%
Japan,53%
Other, 9%* Other*11%
Japan,38%
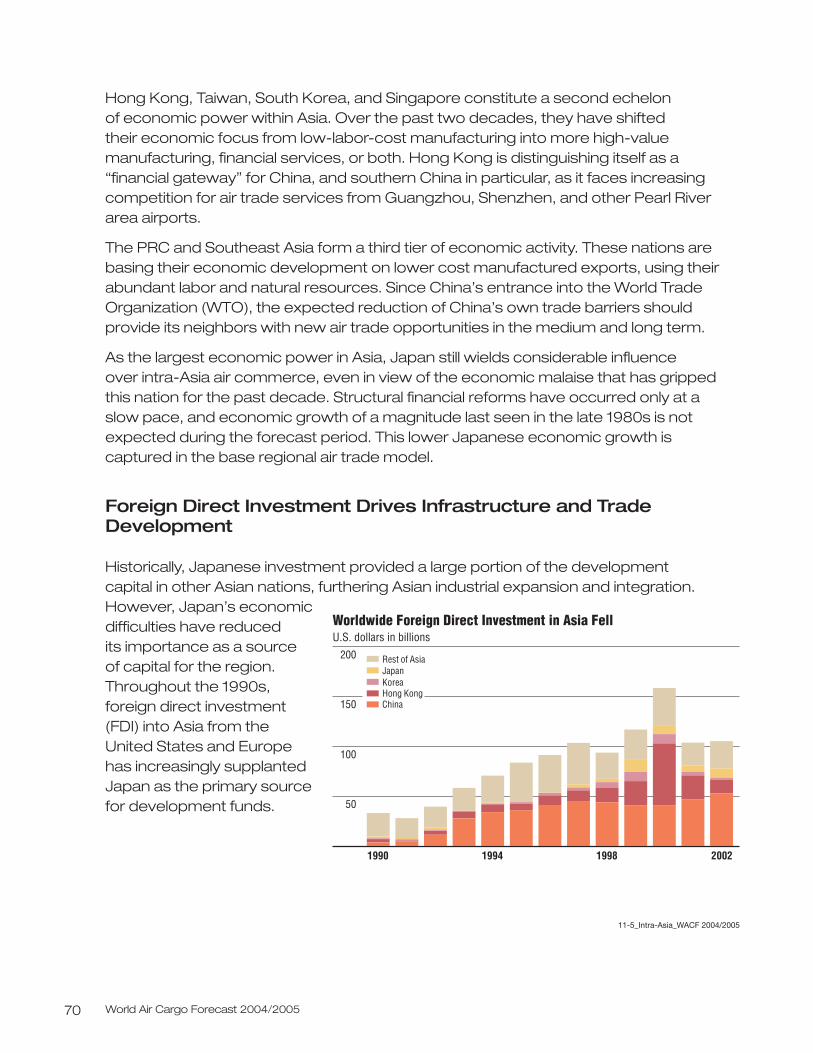
World Air Cargo Forecast 2004/200570
Hong Kong, Taiwan, South Korea, and Singapore constitute a second echelon of economic power within Asia. Over the past two decades, they have shifted their economic focus from low-labor-cost manufacturing into more high-valuemanufacturing, financial services, or both. Hong Kong is distinguishing itself as a“financial gateway” for China, and southern China in particular, as it faces increasingcompetition for air trade services from Guangzhou, Shenzhen, and other Pearl Riverarea airports.
The PRC and Southeast Asia form a third tier of economic activity. These nations arebasing their economic development on lower cost manufactured exports, using theirabundant labor and natural resources. Since China’s entrance into the World TradeOrganization (WTO), the expected reduction of China’s own trade barriers shouldprovide its neighbors with new air trade opportunities in the medium and long term.
As the largest economic power in Asia, Japan still wields considerable influence over intra-Asia air commerce, even in view of the economic malaise that has grippedthis nation for the past decade. Structural financial reforms have occurred only at aslow pace, and economic growth of a magnitude last seen in the late 1980s is notexpected during the forecast period. This lower Japanese economic growth iscaptured in the base regional air trade model.
Foreign Direct Investment Drives Infrastructure and TradeDevelopment
Historically, Japanese investment provided a large portion of the development capital in other Asian nations, furthering Asian industrial expansion and integration.However, Japan’s economicdifficulties have reduced its importance as a source of capital for the region.Throughout the 1990s, foreign direct investment (FDI) into Asia from the United States and Europe has increasingly supplantedJapan as the primary sourcefor development funds.
Worldwide Foreign Direct Investment in Asia Fell U.S. dollars in billions
2002199819941990
200
150
100
50
11-5_Intra-Asia_WACF 2004/2005
Hong KongKoreaJapanRest of Asia
China
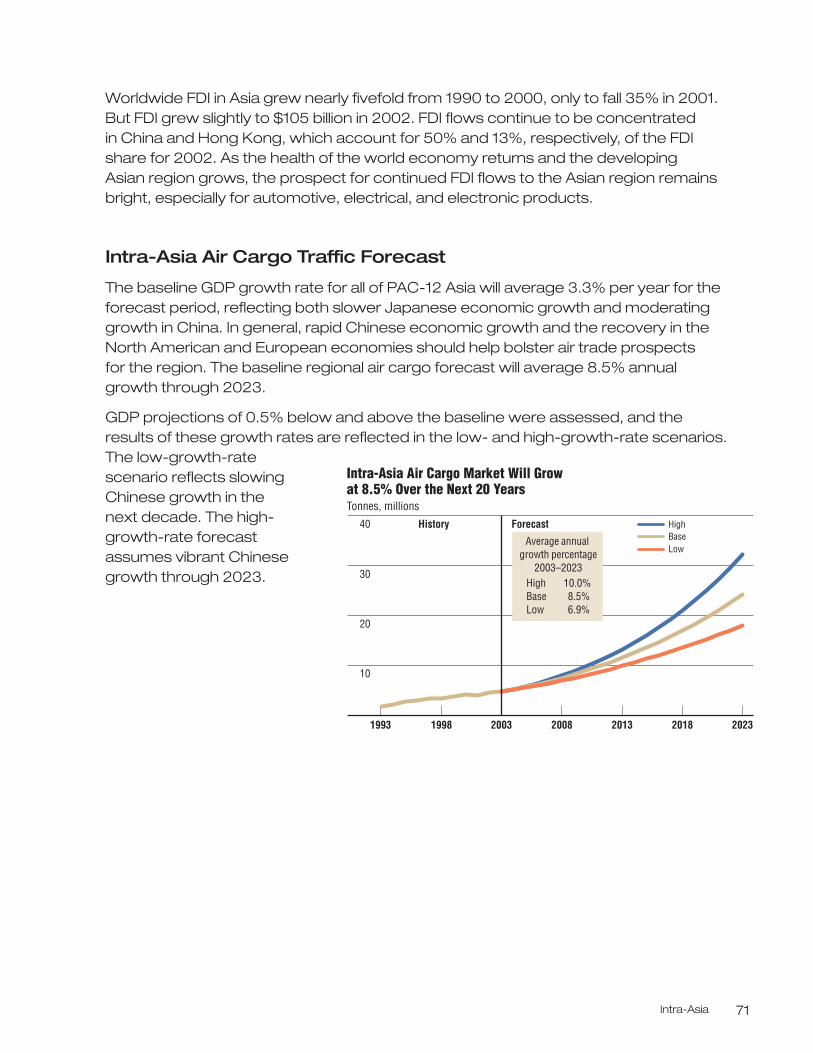
Intra-Asia 71
Worldwide FDI in Asia grew nearly fivefold from 1990 to 2000, only to fall 35% in 2001.But FDI grew slightly to $105 billion in 2002. FDI flows continue to be concentrated in China and Hong Kong, which account for 50% and 13%, respectively, of the FDIshare for 2002. As the health of the world economy returns and the developing Asian region grows, the prospect for continued FDI flows to the Asian region remainsbright, especially for automotive, electrical, and electronic products.
Intra-Asia Air Cargo Traffic Forecast
The baseline GDP growth rate for all of PAC-12 Asia will average 3.3% per year for theforecast period, reflecting both slower Japanese economic growth and moderatinggrowth in China. In general, rapid Chinese economic growth and the recovery in theNorth American and European economies should help bolster air trade prospects for the region. The baseline regional air cargo forecast will average 8.5% annualgrowth through 2023.
GDP projections of 0.5% below and above the baseline were assessed, and theresults of these growth rates are reflected in the low- and high-growth-rate scenarios.The low-growth-rate scenario reflects slowingChinese growth in the next decade. The high-growth-rate forecast assumes vibrant Chinesegrowth through 2023.
2013
Intra-Asia Air Cargo Market Will Grow at 8.5% Over the Next 20 Years Tonnes, millions
40
30
20
10
20232018200820031993
HighBaseLow
History Forecast
Average annual growth percentage
2003–2023High 10.0%Base 8.5%Low 6.9%
1998
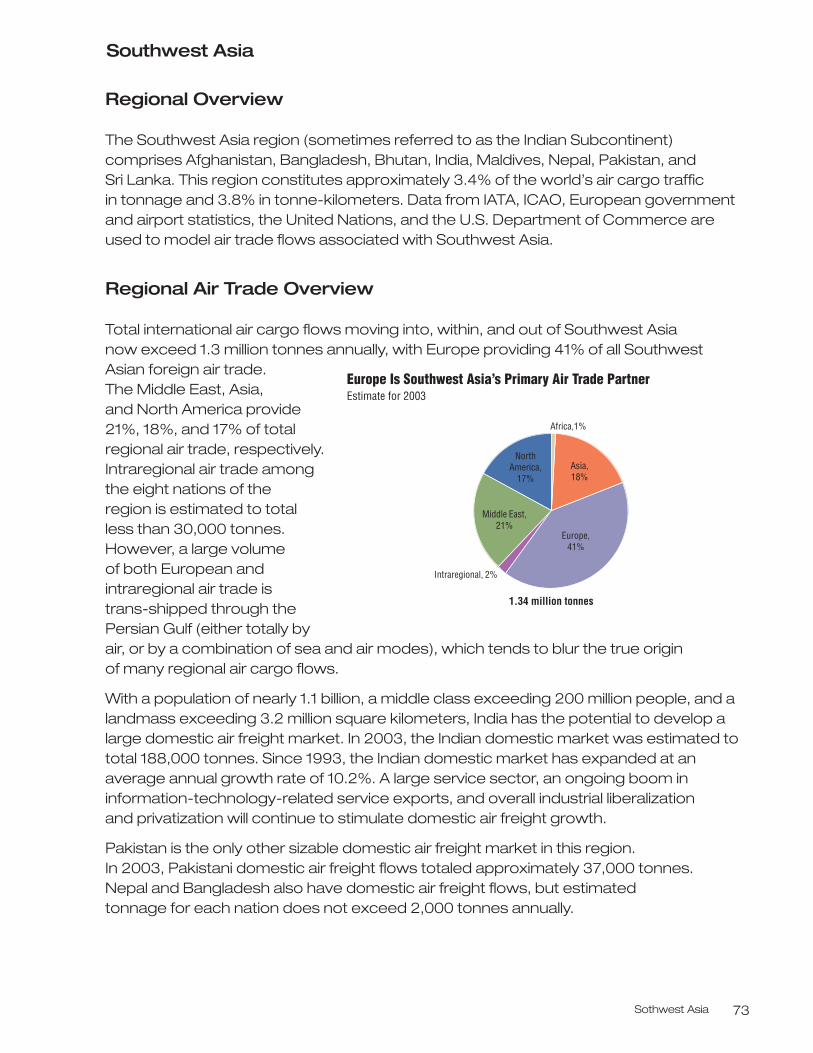
Sothwest Asia 73
Southwest Asia
Regional Overview
The Southwest Asia region (sometimes referred to as the Indian Subcontinent)comprises Afghanistan, Bangladesh, Bhutan, India, Maldives, Nepal, Pakistan, and Sri Lanka. This region constitutes approximately 3.4% of the world’s air cargo traffic in tonnage and 3.8% in tonne-kilometers. Data from IATA, ICAO, European governmentand airport statistics, the United Nations, and the U.S. Department of Commerce areused to model air trade flows associated with Southwest Asia.
Regional Air Trade Overview
Total international air cargo flows moving into, within, and out of Southwest Asia now exceed 1.3 million tonnes annually, with Europe providing 41% of all SouthwestAsian foreign air trade. The Middle East, Asia, and North America provide21%, 18%, and 17% of totalregional air trade, respectively.Intraregional air trade amongthe eight nations of the region is estimated to total less than 30,000 tonnes.However, a large volume of both European andintraregional air trade is trans-shipped through thePersian Gulf (either totally byair, or by a combination of sea and air modes), which tends to blur the true origin of many regional air cargo flows.
With a population of nearly 1.1 billion, a middle class exceeding 200 million people, and alandmass exceeding 3.2 million square kilometers, India has the potential to develop alarge domestic air freight market. In 2003, the Indian domestic market was estimated tototal 188,000 tonnes. Since 1993, the Indian domestic market has expanded at anaverage annual growth rate of 10.2%. A large service sector, an ongoing boom ininformation-technology-related service exports, and overall industrial liberalization and privatization will continue to stimulate domestic air freight growth.
Pakistan is the only other sizable domestic air freight market in this region. In 2003, Pakistani domestic air freight flows totaled approximately 37,000 tonnes. Nepal and Bangladesh also have domestic air freight flows, but estimated tonnage for each nation does not exceed 2,000 tonnes annually.
1.34 million tonnes
Europe Is Southwest Asia’s Primary Air Trade PartnerEstimate for 2003
Middle East,21%
NorthAmerica,
17%
Europe,41%
Asia,18%
Intraregional, 2%
Africa,1%
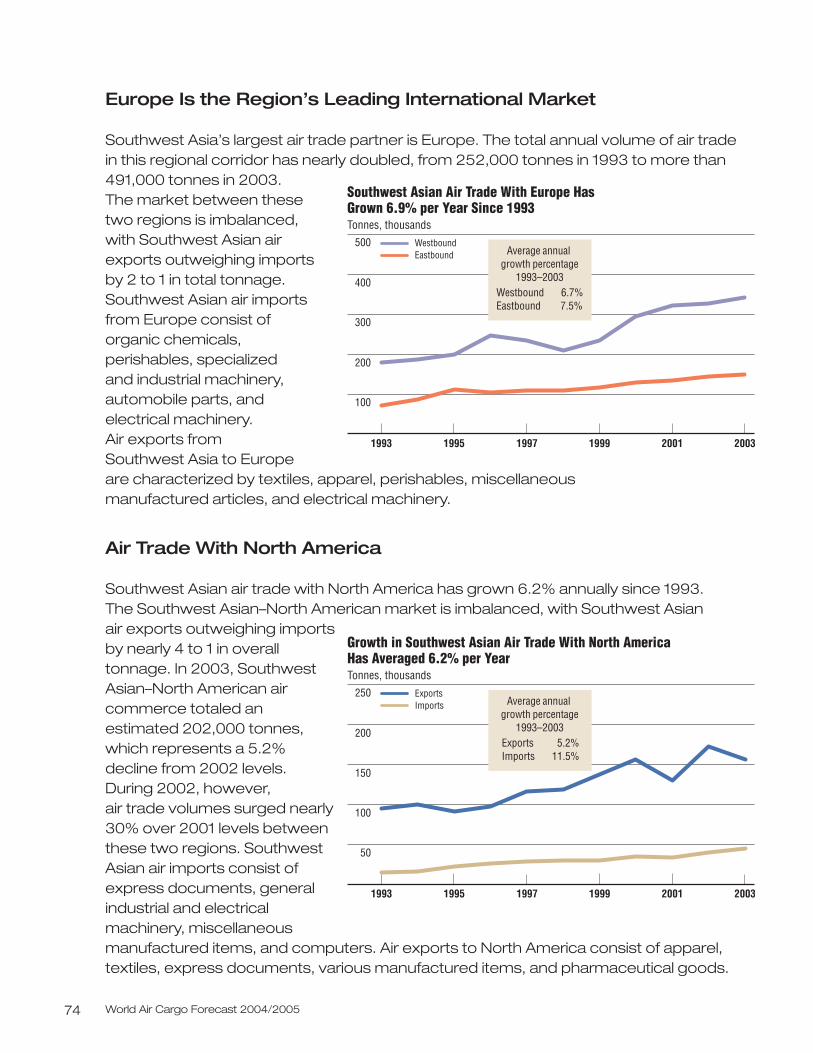
World Air Cargo Forecast 2004/200574
Europe Is the Region’s Leading International Market
Southwest Asia’s largest air trade partner is Europe. The total annual volume of air tradein this regional corridor has nearly doubled, from 252,000 tonnes in 1993 to more than491,000 tonnes in 2003. The market between thesetwo regions is imbalanced,with Southwest Asian airexports outweighing importsby 2 to 1 in total tonnage.Southwest Asian air importsfrom Europe consist of organic chemicals,perishables, specialized and industrial machinery,automobile parts, andelectrical machinery. Air exports from Southwest Asia to Europe are characterized by textiles, apparel, perishables, miscellaneous manufactured articles, and electrical machinery.
Air Trade With North America
Southwest Asian air trade with North America has grown 6.2% annually since 1993. The Southwest Asian–North American market is imbalanced, with Southwest Asian air exports outweighing importsby nearly 4 to 1 in overalltonnage. In 2003, SouthwestAsian–North American aircommerce totaled anestimated 202,000 tonnes,which represents a 5.2%decline from 2002 levels.During 2002, however, air trade volumes surged nearly 30% over 2001 levels betweenthese two regions. SouthwestAsian air imports consist ofexpress documents, generalindustrial and electricalmachinery, miscellaneousmanufactured items, and computers. Air exports to North America consist of apparel,textiles, express documents, various manufactured items, and pharmaceutical goods.
Southwest Asian Air Trade With Europe HasGrown 6.9% per Year Since 1993 Tonnes, thousands
500
400
300
200
100
1993 1995 1997 1999 2001 2003
WestboundEastbound Average annual
growth percentage1993–2003
Westbound 6.7%Eastbound 7.5%
Growth in Southwest Asian Air Trade With North AmericaHas Averaged 6.2% per YearTonnes, thousands
250
200
150
50
100
1993 1995 1997 1999 2001 2003
ExportsImports Average annual
growth percentage1993–2003
Exports 5.2%Imports 11.5%
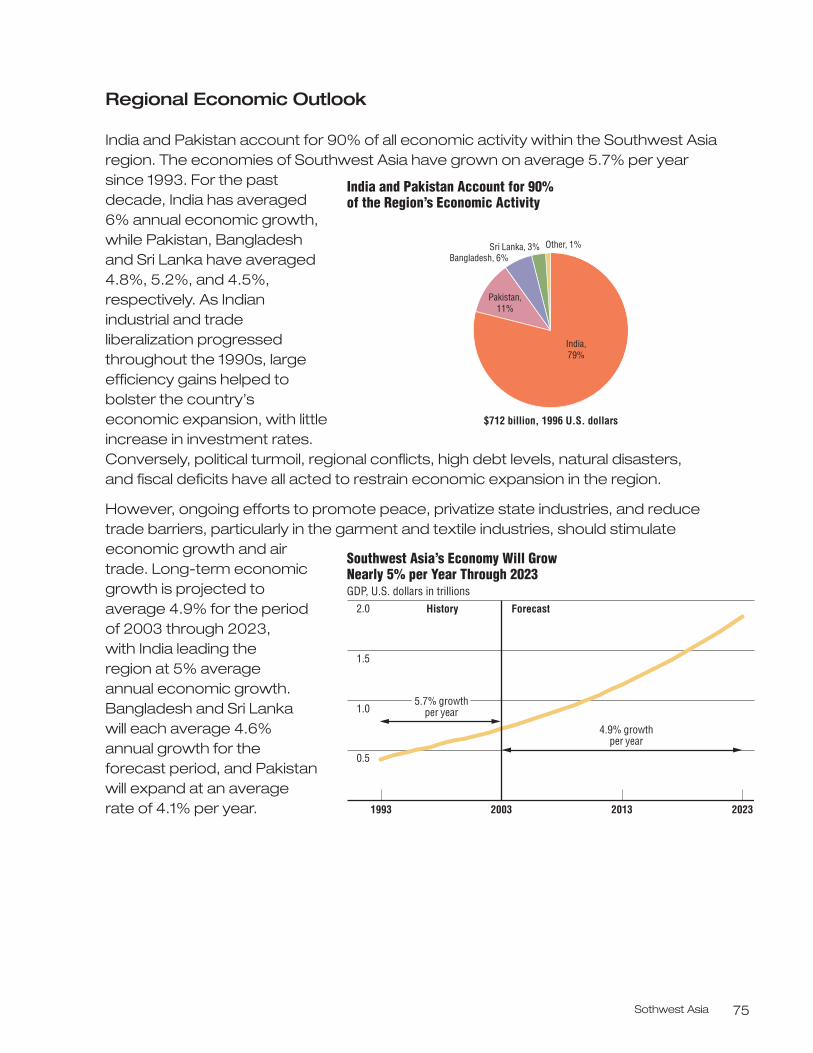
Sothwest Asia 75
Regional Economic Outlook
India and Pakistan account for 90% of all economic activity within the Southwest Asiaregion. The economies of Southwest Asia have grown on average 5.7% per yearsince 1993. For the pastdecade, India has averaged6% annual economic growth,while Pakistan, Bangladeshand Sri Lanka have averaged4.8%, 5.2%, and 4.5%,respectively. As Indianindustrial and tradeliberalization progressedthroughout the 1990s, largeefficiency gains helped tobolster the country’seconomic expansion, with littleincrease in investment rates.Conversely, political turmoil, regional conflicts, high debt levels, natural disasters, and fiscal deficits have all acted to restrain economic expansion in the region.
However, ongoing efforts to promote peace, privatize state industries, and reducetrade barriers, particularly in the garment and textile industries, should stimulateeconomic growth and airtrade. Long-term economicgrowth is projected toaverage 4.9% for the period of 2003 through 2023, with India leading the region at 5% average annual economic growth.Bangladesh and Sri Lanka will each average 4.6% annual growth for the forecast period, and Pakistanwill expand at an average rate of 4.1% per year.
$712 billion, 1996 U.S. dollars
Bangladesh, 6%Sri Lanka, 3%
India and Pakistan Account for 90% of the Region’s Economic Activity
Pakistan,11%
Other, 1%
India,79%
Southwest Asia’s Economy Will Grow Nearly 5% per Year Through 2023 GDP, U.S. dollars in trillions
2.0
1.5
1.0
0.5
2013 202320031993
5.7% growthper year
4.9% growthper year
History Forecast
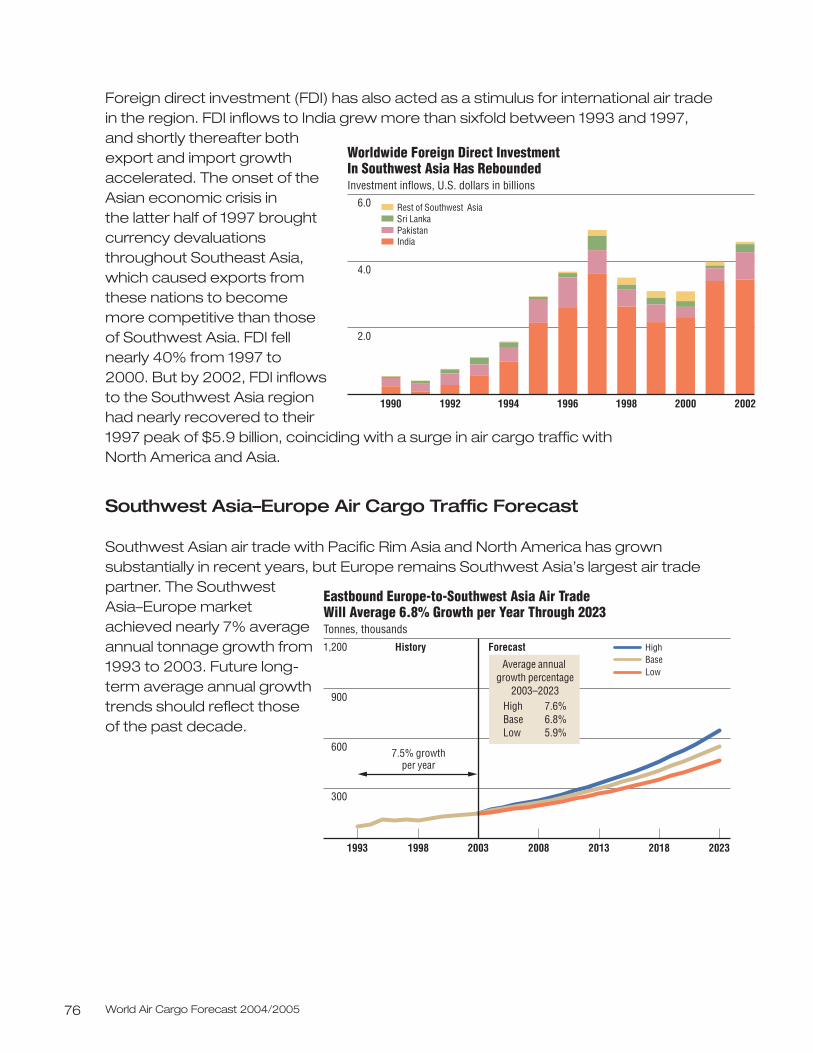
World Air Cargo Forecast 2004/200576
Foreign direct investment (FDI) has also acted as a stimulus for international air tradein the region. FDI inflows to India grew more than sixfold between 1993 and 1997, and shortly thereafter bothexport and import growthaccelerated. The onset of theAsian economic crisis in the latter half of 1997 broughtcurrency devaluationsthroughout Southeast Asia,which caused exports fromthese nations to becomemore competitive than thoseof Southwest Asia. FDI fellnearly 40% from 1997 to2000. But by 2002, FDI inflowsto the Southwest Asia regionhad nearly recovered to their1997 peak of $5.9 billion, coinciding with a surge in air cargo traffic with North America and Asia.
Southwest Asia–Europe Air Cargo Traffic Forecast
Southwest Asian air trade with Pacific Rim Asia and North America has grownsubstantially in recent years, but Europe remains Southwest Asia’s largest air tradepartner. The SouthwestAsia–Europe marketachieved nearly 7% averageannual tonnage growth from1993 to 2003. Future long-term average annual growthtrends should reflect those of the past decade.
Worldwide Foreign Direct Investment In Southwest Asia Has ReboundedInvestment inflows, U.S. dollars in billions
6.0
2.0
4.0
1990 1992 1994 1996 1998 2000 2002
IndiaPakistanSri LankaRest of Southwest Asia
2013
Eastbound Europe-to-Southwest Asia Air Trade Will Average 6.8% Growth per Year Through 2023 Tonnes, thousands
1,200
900
600
300
20232018200820031993
HighBaseLow
History Forecast
Average annual growth percentage
2003–2023High 7.6%Base 6.8%Low 5.9%
7.5% growthper year
1998
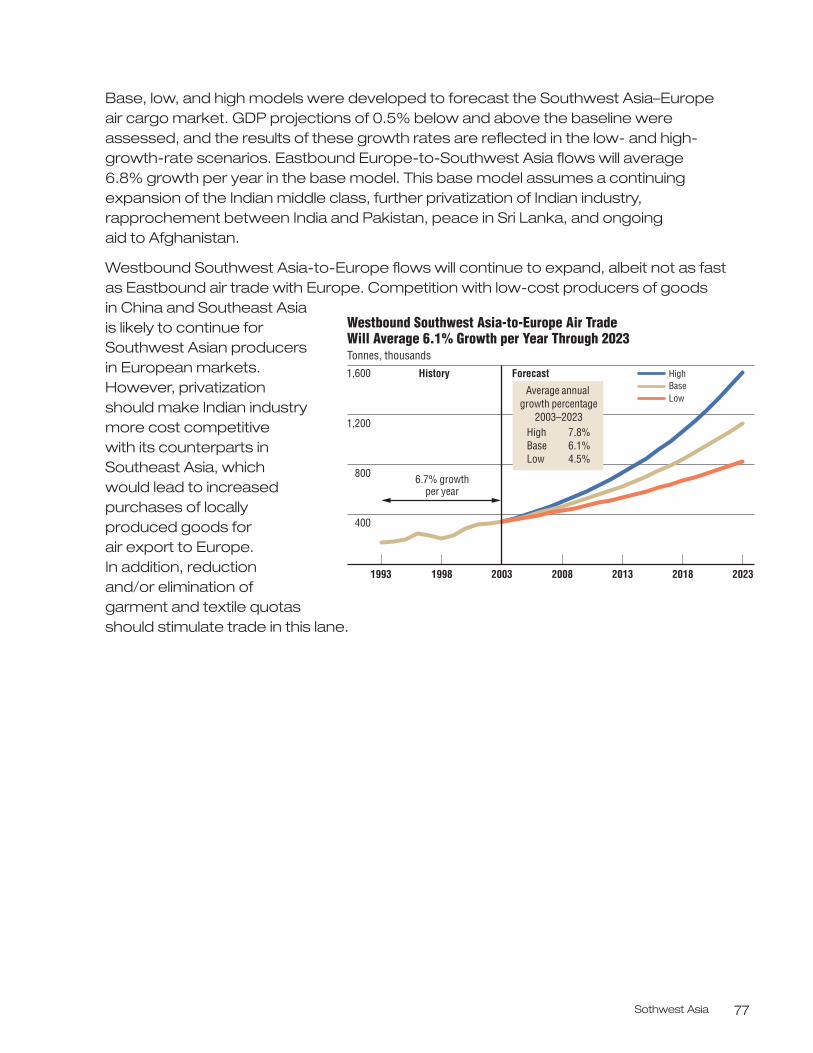
Sothwest Asia 77
Base, low, and high models were developed to forecast the Southwest Asia–Europeair cargo market. GDP projections of 0.5% below and above the baseline wereassessed, and the results of these growth rates are reflected in the low- and high-growth-rate scenarios. Eastbound Europe-to-Southwest Asia flows will average 6.8% growth per year in the base model. This base model assumes a continuingexpansion of the Indian middle class, further privatization of Indian industry,rapprochement between India and Pakistan, peace in Sri Lanka, and ongoing aid to Afghanistan.
Westbound Southwest Asia-to-Europe flows will continue to expand, albeit not as fastas Eastbound air trade with Europe. Competition with low-cost producers of goodsin China and Southeast Asia is likely to continue forSouthwest Asian producers in European markets.However, privatization should make Indian industrymore cost competitive with its counterparts inSoutheast Asia, which would lead to increasedpurchases of locallyproduced goods for air export to Europe. In addition, reduction and/or elimination of garment and textile quotas should stimulate trade in this lane.
2013
Westbound Southwest Asia-to-Europe Air Trade Will Average 6.1% Growth per Year Through 2023 Tonnes, thousands
1,600
1,200
800
400
20232018200820031993
HighBaseLow
History Forecast
Average annual growth percentage
2003–2023High 7.8%Base 6.1%Low 4.5%
6.7% growthper year
1998
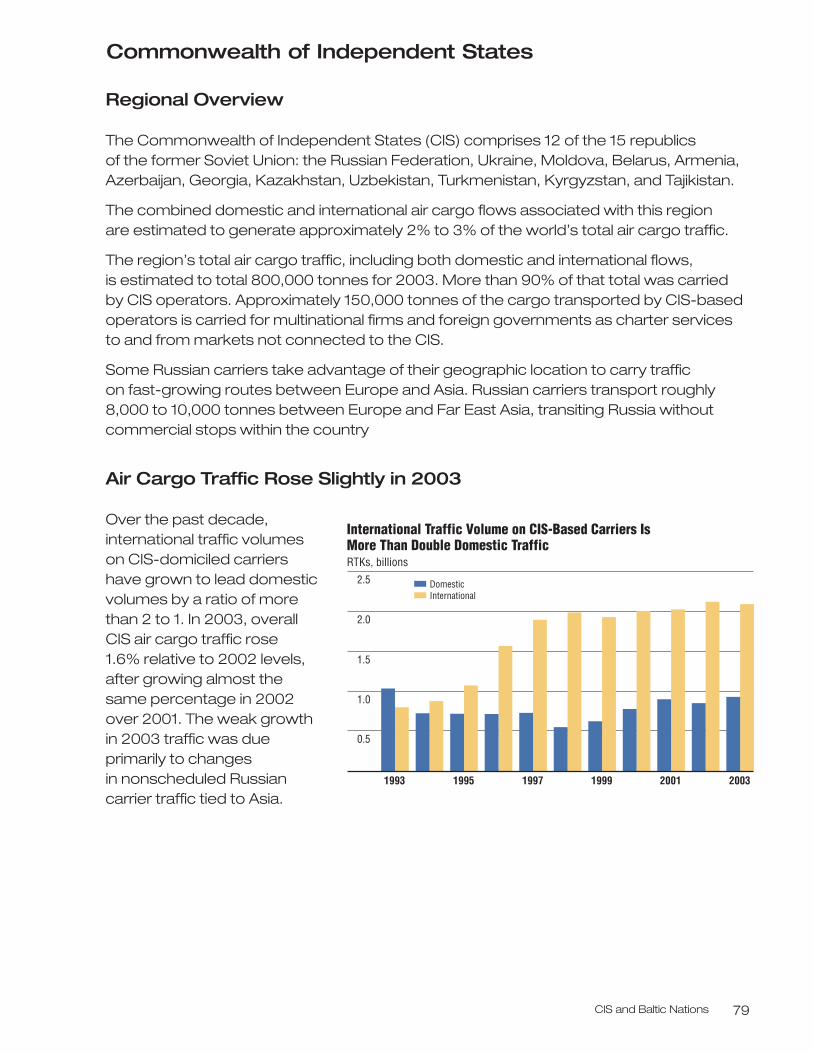
CIS and Baltic Nations 79
Commonwealth of Independent States
Regional Overview
The Commonwealth of Independent States (CIS) comprises 12 of the 15 republics of the former Soviet Union: the Russian Federation, Ukraine, Moldova, Belarus, Armenia,Azerbaijan, Georgia, Kazakhstan, Uzbekistan, Turkmenistan, Kyrgyzstan, and Tajikistan.
The combined domestic and international air cargo flows associated with this region are estimated to generate approximately 2% to 3% of the world’s total air cargo traffic.
The region’s total air cargo traffic, including both domestic and international flows,is estimated to total 800,000 tonnes for 2003. More than 90% of that total was carried by CIS operators. Approximately 150,000 tonnes of the cargo transported by CIS-basedoperators is carried for multinational firms and foreign governments as charter services to and from markets not connected to the CIS.
Some Russian carriers take advantage of their geographic location to carry traffic on fast-growing routes between Europe and Asia. Russian carriers transport roughly 8,000 to 10,000 tonnes between Europe and Far East Asia, transiting Russia withoutcommercial stops within the country
Air Cargo Traffic Rose Slightly in 2003
Over the past decade,international traffic volumeson CIS-domiciled carriershave grown to lead domesticvolumes by a ratio of morethan 2 to 1. In 2003, overallCIS air cargo traffic rose 1.6% relative to 2002 levels,after growing almost thesame percentage in 2002over 2001. The weak growthin 2003 traffic was dueprimarily to changes in nonscheduled Russian carrier traffic tied to Asia.
International Traffic Volume on CIS-Based Carriers Is More Than Double Domestic Traffic RTKs, billions
20011999199719951993 2003
2.5
2.0
1.5
1.0
0.5
InternationalDomestic
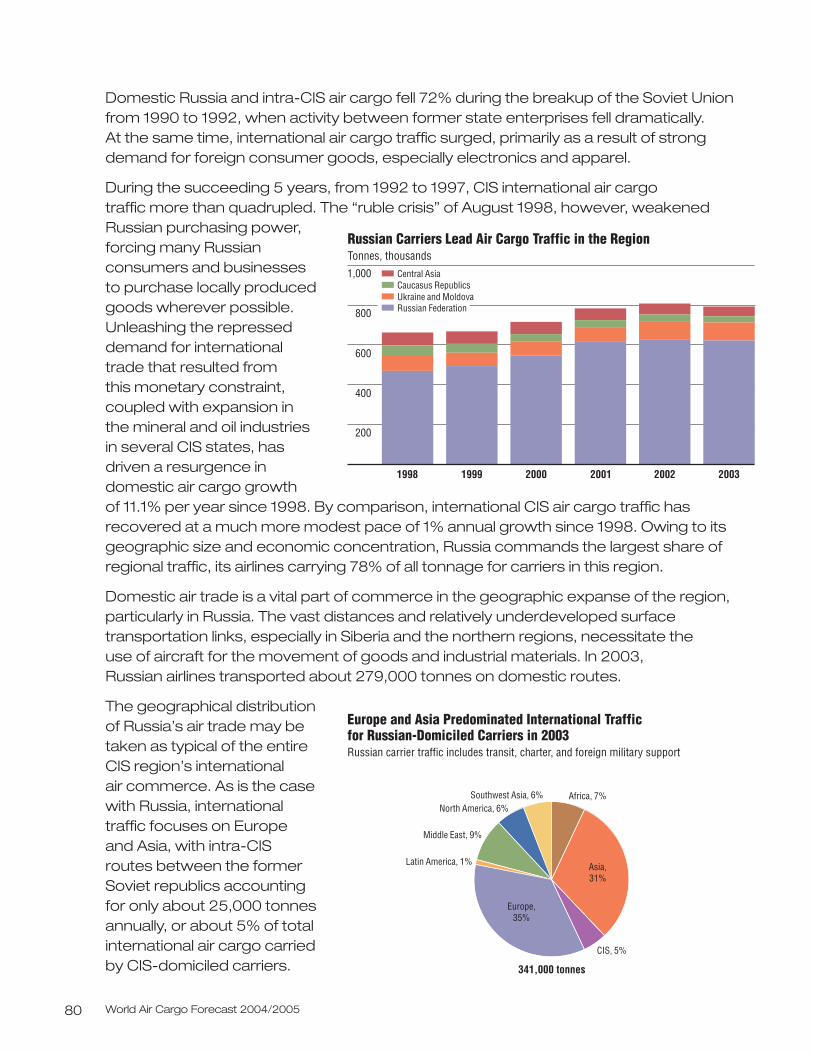
World Air Cargo Forecast 2004/200580
Domestic Russia and intra-CIS air cargo fell 72% during the breakup of the Soviet Unionfrom 1990 to 1992, when activity between former state enterprises fell dramatically. At the same time, international air cargo traffic surged, primarily as a result of strongdemand for foreign consumer goods, especially electronics and apparel.
During the succeeding 5 years, from 1992 to 1997, CIS international air cargo traffic more than quadrupled. The “ruble crisis” of August 1998, however, weakenedRussian purchasing power,forcing many Russianconsumers and businesses to purchase locally producedgoods wherever possible. Unleashing the represseddemand for international trade that resulted from this monetary constraint,coupled with expansion in the mineral and oil industries in several CIS states, hasdriven a resurgence indomestic air cargo growth of 11.1% per year since 1998. By comparison, international CIS air cargo traffic hasrecovered at a much more modest pace of 1% annual growth since 1998. Owing to itsgeographic size and economic concentration, Russia commands the largest share ofregional traffic, its airlines carrying 78% of all tonnage for carriers in this region.
Domestic air trade is a vital part of commerce in the geographic expanse of the region,particularly in Russia. The vast distances and relatively underdeveloped surfacetransportation links, especially in Siberia and the northern regions, necessitate the use of aircraft for the movement of goods and industrial materials. In 2003, Russian airlines transported about 279,000 tonnes on domestic routes.
The geographical distributionof Russia’s air trade may betaken as typical of the entireCIS region’s international air commerce. As is the casewith Russia, internationaltraffic focuses on Europe and Asia, with intra-CISroutes between the formerSoviet republics accountingfor only about 25,000 tonnesannually, or about 5% of totalinternational air cargo carriedby CIS-domiciled carriers.
Russian Carriers Lead Air Cargo Traffic in the Region Tonnes, thousands
2000 200119991998 2002 2003
1,000
800
600
400
200
Ukraine and MoldovaCaucasus RepublicsCentral Asia
Russian Federation
341,000 tonnes
Middle East, 9%
North America, 6%Africa, 7%Southwest Asia, 6%
Latin America, 1%
Europe and Asia Predominated International Traffic for Russian-Domiciled Carriers in 2003 Russian carrier traffic includes transit, charter, and foreign military support
Europe,35%
Asia,31%
CIS, 5%
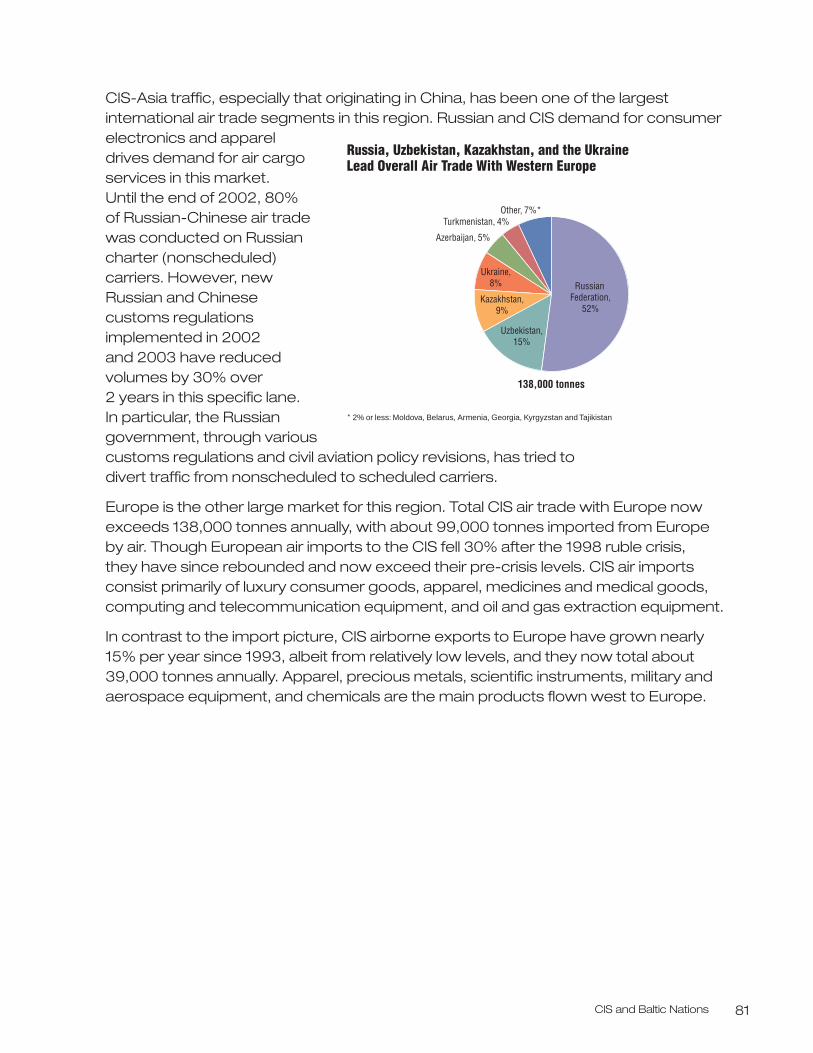
CIS and Baltic Nations 81
CIS-Asia traffic, especially that originating in China, has been one of the largestinternational air trade segments in this region. Russian and CIS demand for consumerelectronics and apparel drives demand for air cargoservices in this market. Until the end of 2002, 80% of Russian-Chinese air tradewas conducted on Russiancharter (nonscheduled)carriers. However, newRussian and Chinesecustoms regulationsimplemented in 2002 and 2003 have reducedvolumes by 30% over 2 years in this specific lane. In particular, the Russiangovernment, through variouscustoms regulations and civil aviation policy revisions, has tried to divert traffic from nonscheduled to scheduled carriers.
Europe is the other large market for this region. Total CIS air trade with Europe nowexceeds 138,000 tonnes annually, with about 99,000 tonnes imported from Europeby air. Though European air imports to the CIS fell 30% after the 1998 ruble crisis, they have since rebounded and now exceed their pre-crisis levels. CIS air importsconsist primarily of luxury consumer goods, apparel, medicines and medical goods,computing and telecommunication equipment, and oil and gas extraction equipment.
In contrast to the import picture, CIS airborne exports to Europe have grown nearly15% per year since 1993, albeit from relatively low levels, and they now total about39,000 tonnes annually. Apparel, precious metals, scientific instruments, military andaerospace equipment, and chemicals are the main products flown west to Europe.
138,000 tonnes
Kazakhstan,9%
Other, 7%*
Russian Federation,
52%
Ukraine,8%
Uzbekistan, 15%
Azerbaijan, 5%
Turkmenistan, 4%
Russia, Uzbekistan, Kazakhstan, and the UkraineLead Overall Air Trade With Western Europe
* 2% or less: Moldova, Belarus, Armenia, Georgia, Kyrgyzstan and Tajikistan
World Air Cargo Forecast 2004/200582
Military-Design Freighters Will Remain Essential to Regional Air Trade
Most CIS-related air trade is transported on former Soviet military aircraft, both turboprop and jet-powered. These aircraft are typically rear-ramp loaders,requiring minimal ground support equipment. These loading features are crucial in the more remote regions of the CIS, where airport infrastructure is often lacking. The combined effect of a plentiful supply of used military aircraft, low acquisition costs, and lagging airport infrastructure investment will keep these indigenous aircraft in CIS fleets for the forecast period.
There are approximately 460 CIS-built freighters domiciled in the region that arecapable of carrying 15 tonnes or more of payload. Of these, about 340 are airworthyand serving civilian markets. Given that their actual utilization is neither high nor widely known, these aircraft are not included in the “World Freighter Fleet” section of this forecast. However, several factors will contribute to the introduction of morepurpose-built civilian freighters into this region’s fleets.
• As of April 1, 2002, most former Soviet military aircraft cannot meet ICAO Chapter 3 noise regulations and CAEP emission regulations.
• Military aircraft production rates are too low to meet replacement requirements during the forecast period.
• Military aircraft cannot operate economically enough to compete in the international marketplace.
Military aircraft have allowed certain CIS cargo carriers to become the uniqueproviders of “outsize” transport capacity in world air freight markets. Outsize air cargois defined as freight that is too large, dimensionally, or too heavy for civilian widebodyfreighter aircraft. A select group of Russian and Ukrainian carriers, allied in some cases with Western partners, uses very large and medium-size ramp-loading military freighter aircraft to serve this specialized sector, which accounts for nearly130,000 tonnes of freight annually worldwide. It should be emphasized that most of the outsize cargo traffic does not originate or terminate in the CIS.
Most outsize carriers fly charters, transporting industrial shipments between Europe,North America, and Asia. Typical industries served by these carriers include oil and gasextraction, aerospace manufacturing, electrical power generation, and infrastructuredevelopment. These carriers have also participated in transporting materiel in supportof the U.S. military in the Middle East and Afghanistan.
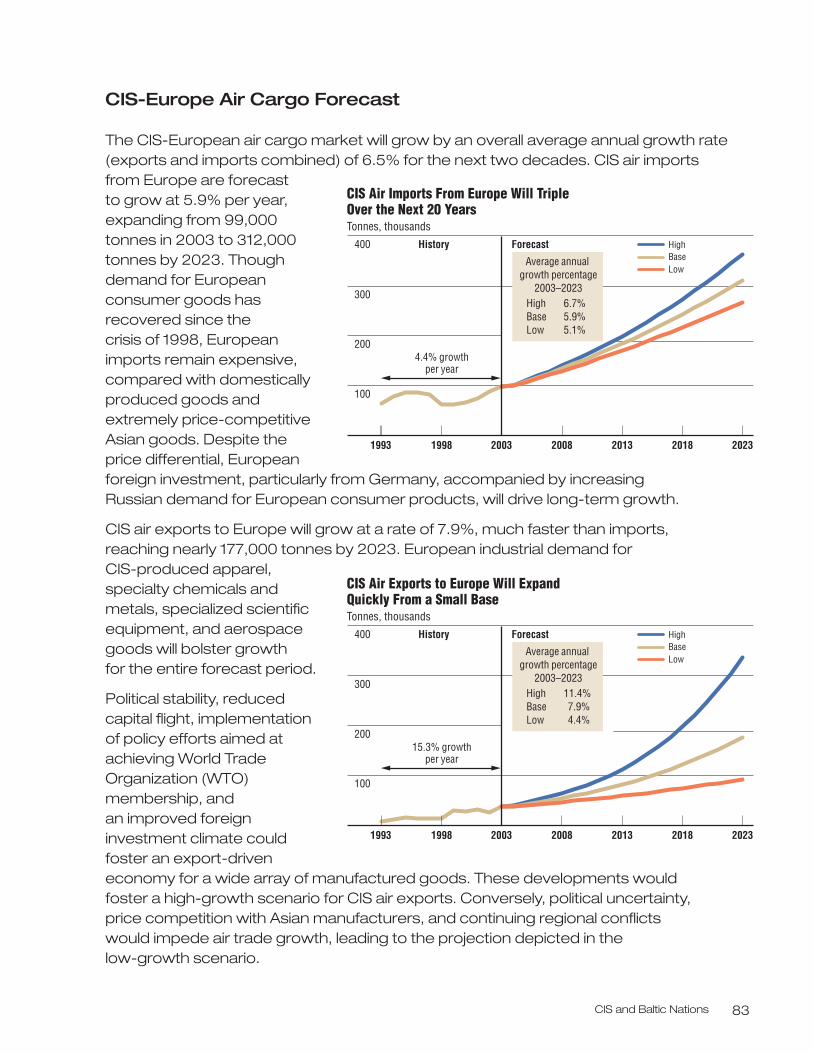
CIS and Baltic Nations 83
CIS-Europe Air Cargo Forecast
The CIS-European air cargo market will grow by an overall average annual growth rate(exports and imports combined) of 6.5% for the next two decades. CIS air importsfrom Europe are forecast to grow at 5.9% per year,expanding from 99,000tonnes in 2003 to 312,000tonnes by 2023. Thoughdemand for Europeanconsumer goods hasrecovered since the crisis of 1998, Europeanimports remain expensive,compared with domesticallyproduced goods andextremely price-competitiveAsian goods. Despite theprice differential, Europeanforeign investment, particularly from Germany, accompanied by increasing Russian demand for European consumer products, will drive long-term growth.
CIS air exports to Europe will grow at a rate of 7.9%, much faster than imports,reaching nearly 177,000 tonnes by 2023. European industrial demand for CIS-produced apparel,specialty chemicals andmetals, specialized scientificequipment, and aerospacegoods will bolster growth for the entire forecast period.
Political stability, reducedcapital flight, implementationof policy efforts aimed atachieving World TradeOrganization (WTO)membership, and an improved foreigninvestment climate couldfoster an export-driveneconomy for a wide array of manufactured goods. These developments would foster a high-growth scenario for CIS air exports. Conversely, political uncertainty,price competition with Asian manufacturers, and continuing regional conflicts would impede air trade growth, leading to the projection depicted in the low-growth scenario.
2013
CIS Air Imports From Europe Will Triple Over the Next 20 Years Tonnes, thousands
400
300
200
100
20232018200820031993
HighBaseLow
History Forecast
Average annual growth percentage
2003–2023High 6.7%Base 5.9%Low 5.1%
4.4% growthper year
1998
2013
CIS Air Exports to Europe Will Expand Quickly From a Small BaseTonnes, thousands
400
300
200
100
20232018200820031993
HighBaseLow
History Forecast
Average annual growth percentage
2003–2023High 11.4%Base 7.9%Low 4.4%
15.3% growthper year
1998
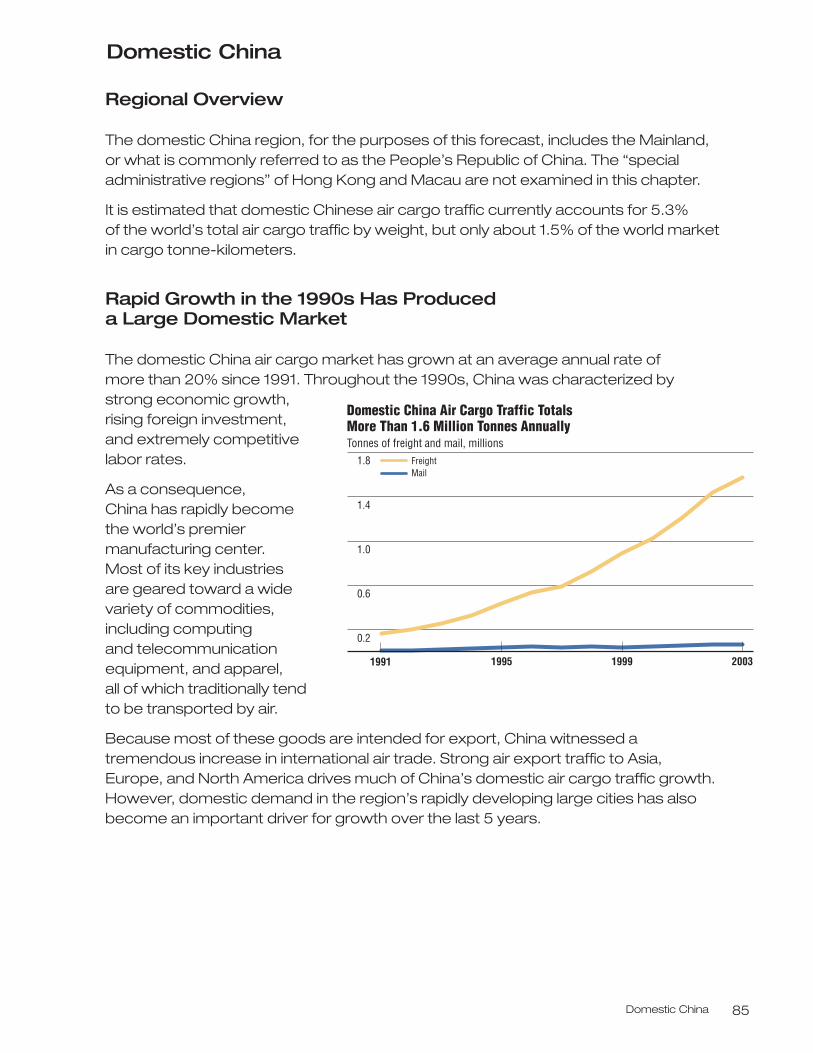
Domestic China 85
Domestic China
Regional Overview
The domestic China region, for the purposes of this forecast, includes the Mainland,or what is commonly referred to as the People’s Republic of China. The “specialadministrative regions” of Hong Kong and Macau are not examined in this chapter.
It is estimated that domestic Chinese air cargo traffic currently accounts for 5.3%of the world’s total air cargo traffic by weight, but only about 1.5% of the world marketin cargo tonne-kilometers.
Rapid Growth in the 1990s Has Produced a Large Domestic Market
The domestic China air cargo market has grown at an average annual rate of more than 20% since 1991. Throughout the 1990s, China was characterized by strong economic growth,rising foreign investment, and extremely competitivelabor rates.
As a consequence, China has rapidly become the world’s premiermanufacturing center. Most of its key industries are geared toward a widevariety of commodities,including computing and telecommunicationequipment, and apparel, all of which traditionally tendto be transported by air.
Because most of these goods are intended for export, China witnessed atremendous increase in international air trade. Strong air export traffic to Asia, Europe, and North America drives much of China’s domestic air cargo traffic growth.However, domestic demand in the region’s rapidly developing large cities has alsobecome an important driver for growth over the last 5 years.
Domestic China Air Cargo Traffic TotalsMore Than 1.6 Million Tonnes Annually Tonnes of freight and mail, millions
1.8
1.0
1.4
0.6
0.2
2003199919951991
FreightMail
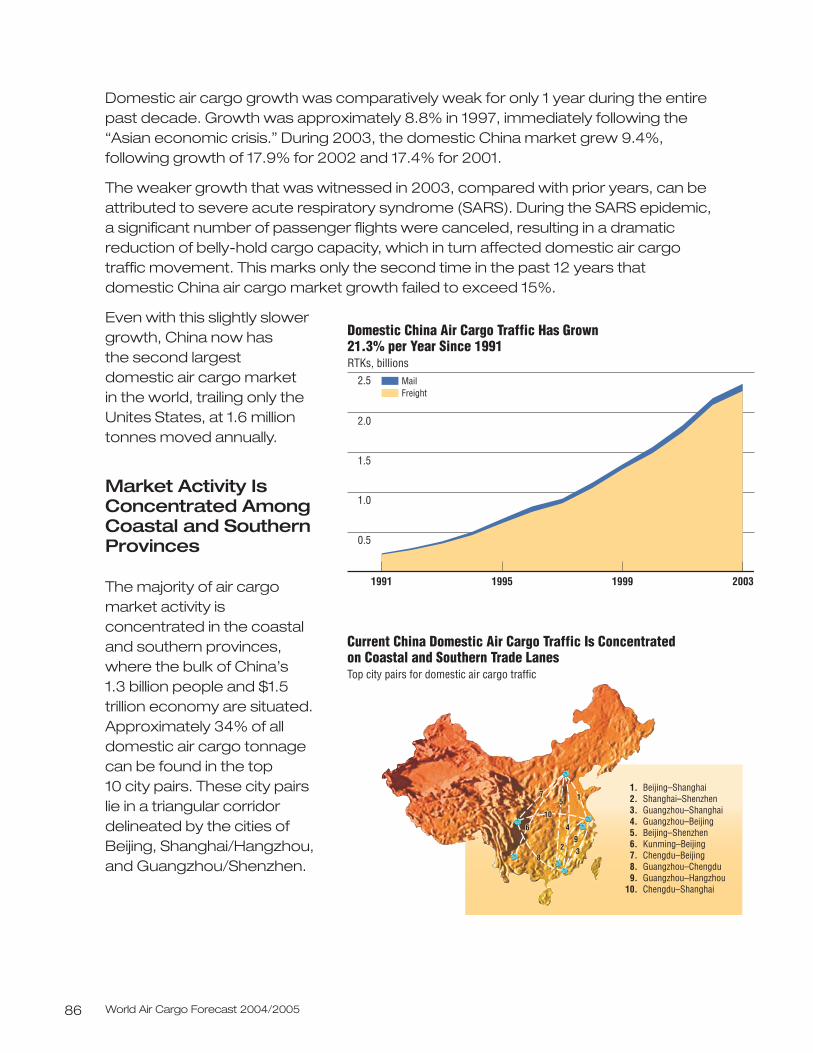
World Air Cargo Forecast 2004/200586
Domestic air cargo growth was comparatively weak for only 1 year during the entirepast decade. Growth was approximately 8.8% in 1997, immediately following the“Asian economic crisis.” During 2003, the domestic China market grew 9.4%,following growth of 17.9% for 2002 and 17.4% for 2001.
The weaker growth that was witnessed in 2003, compared with prior years, can beattributed to severe acute respiratory syndrome (SARS). During the SARS epidemic, a significant number of passenger flights were canceled, resulting in a dramaticreduction of belly-hold cargo capacity, which in turn affected domestic air cargo traffic movement. This marks only the second time in the past 12 years that domestic China air cargo market growth failed to exceed 15%.
Even with this slightly slowergrowth, China now has the second largest domestic air cargo market in the world, trailing only the Unites States, at 1.6 milliontonnes moved annually.
Market Activity IsConcentrated AmongCoastal and SouthernProvinces
The majority of air cargomarket activity isconcentrated in the coastaland southern provinces,where the bulk of China’s 1.3 billion people and $1.5trillion economy are situated.Approximately 34% of alldomestic air cargo tonnagecan be found in the top 10 city pairs. These city pairslie in a triangular corridordelineated by the cities ofBeijing, Shanghai/Hangzhou,and Guangzhou/Shenzhen.
Domestic China Air Cargo Traffic Has Grown21.3% per Year Since 1991 RTKs, billions
2.5
2.0
1.5
0.5
1.0
2003199919951991
MailFreight
1.2.3.4.5.6.7.8.9.
10.
Current China Domestic Air Cargo Traffic Is Concentrated on Coastal and Southern Trade LanesTop city pairs for domestic air cargo traffic
Beijing–ShanghaiShanghai–ShenzhenGuangzhou–ShanghaiGuangzhou–BeijingBeijing–ShenzhenKunming–BeijingChengdu–BeijingGuangzhou–ChengduGuangzhou–HangzhouChengdu–Shanghai
22 33
44
55
88
99
1010
11
66
77
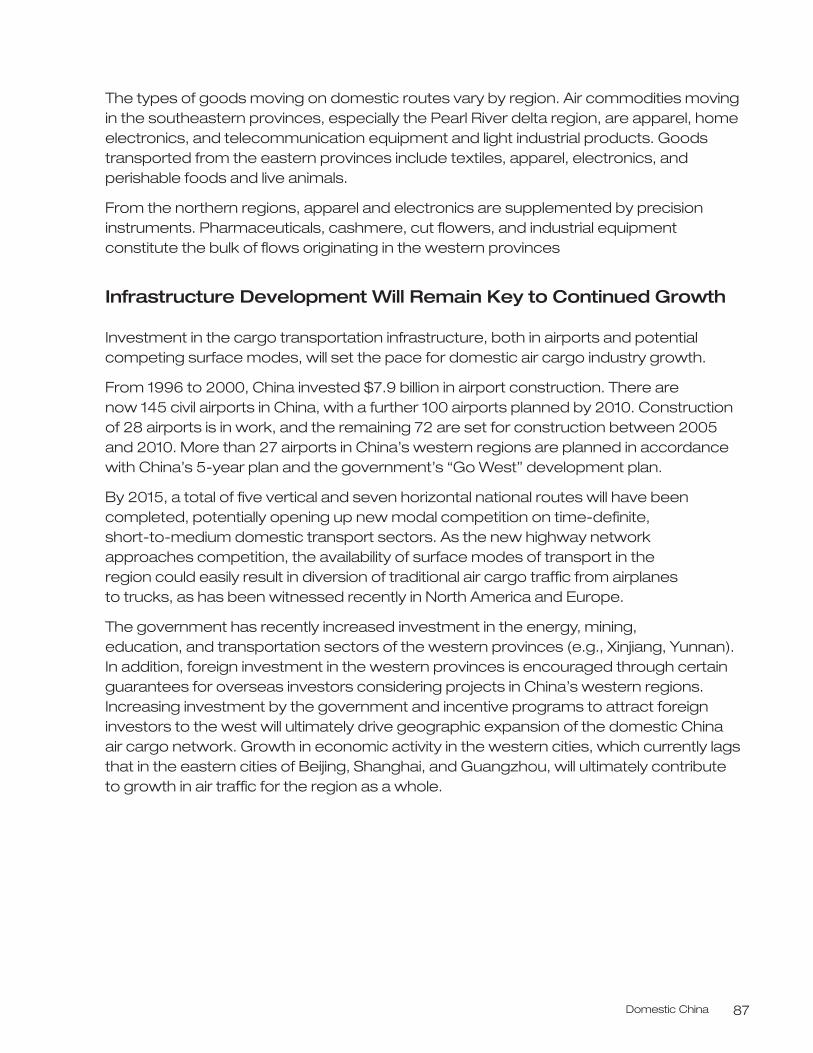
Domestic China 87
The types of goods moving on domestic routes vary by region. Air commodities movingin the southeastern provinces, especially the Pearl River delta region, are apparel, homeelectronics, and telecommunication equipment and light industrial products. Goodstransported from the eastern provinces include textiles, apparel, electronics, andperishable foods and live animals.
From the northern regions, apparel and electronics are supplemented by precisioninstruments. Pharmaceuticals, cashmere, cut flowers, and industrial equipmentconstitute the bulk of flows originating in the western provinces
Infrastructure Development Will Remain Key to Continued Growth
Investment in the cargo transportation infrastructure, both in airports and potentialcompeting surface modes, will set the pace for domestic air cargo industry growth.
From 1996 to 2000, China invested $7.9 billion in airport construction. There are now 145 civil airports in China, with a further 100 airports planned by 2010. Constructionof 28 airports is in work, and the remaining 72 are set for construction between 2005and 2010. More than 27 airports in China’s western regions are planned in accordancewith China’s 5-year plan and the government’s “Go West” development plan.
By 2015, a total of five vertical and seven horizontal national routes will have beencompleted, potentially opening up new modal competition on time-definite, short-to-medium domestic transport sectors. As the new highway network approaches competition, the availability of surface modes of transport in the region could easily result in diversion of traditional air cargo traffic from airplanes to trucks, as has been witnessed recently in North America and Europe.
The government has recently increased investment in the energy, mining, education, and transportation sectors of the western provinces (e.g., Xinjiang, Yunnan).In addition, foreign investment in the western provinces is encouraged through certainguarantees for overseas investors considering projects in China’s western regions.Increasing investment by the government and incentive programs to attract foreigninvestors to the west will ultimately drive geographic expansion of the domestic China air cargo network. Growth in economic activity in the western cities, which currently lagsthat in the eastern cities of Beijing, Shanghai, and Guangzhou, will ultimately contribute to growth in air traffic for the region as a whole.
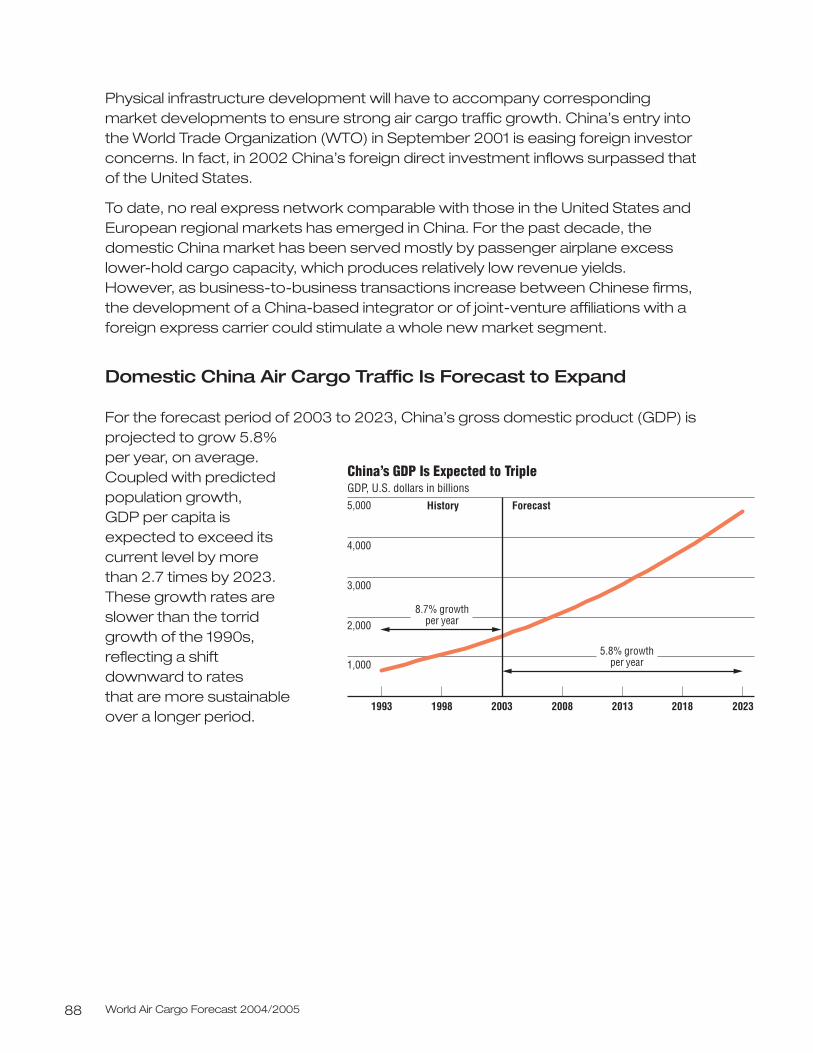
World Air Cargo Forecast 2004/200588
Physical infrastructure development will have to accompany corresponding market developments to ensure strong air cargo traffic growth. China’s entry into the World Trade Organization (WTO) in September 2001 is easing foreign investorconcerns. In fact, in 2002 China’s foreign direct investment inflows surpassed that of the United States.
To date, no real express network comparable with those in the United States andEuropean regional markets has emerged in China. For the past decade, the domestic China market has been served mostly by passenger airplane excess lower-hold cargo capacity, which produces relatively low revenue yields. However, as business-to-business transactions increase between Chinese firms, the development of a China-based integrator or of joint-venture affiliations with aforeign express carrier could stimulate a whole new market segment.
Domestic China Air Cargo Traffic Is Forecast to Expand
For the forecast period of 2003 to 2023, China’s gross domestic product (GDP) isprojected to grow 5.8% per year, on average. Coupled with predictedpopulation growth, GDP per capita is expected to exceed itscurrent level by more than 2.7 times by 2023. These growth rates are slower than the torrid growth of the 1990s, reflecting a shift downward to rates that are more sustainable over a longer period.
China’s GDP Is Expected to Triple GDP, U.S. dollars in billions5,000
4,000
3,000
2,000
2008 2013 2018 2023200319981993
8.7% growthper year
1,0005.8% growth
per year
History Forecast
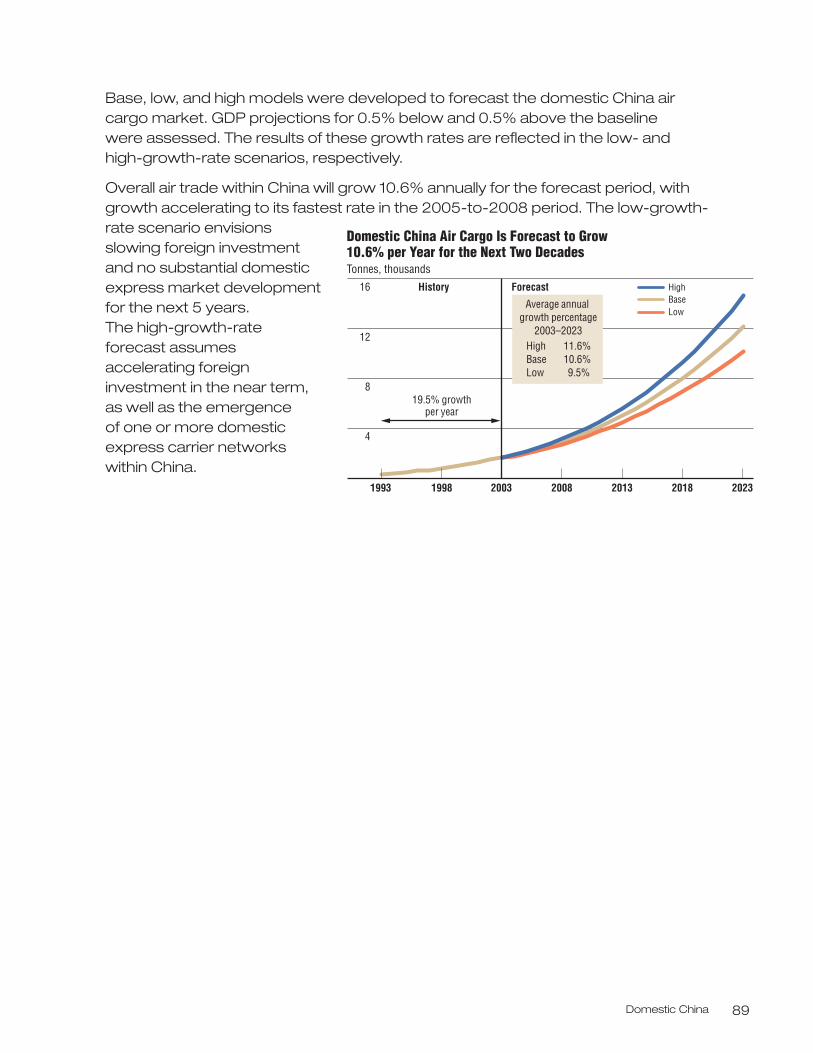
Domestic China 89
Base, low, and high models were developed to forecast the domestic China air cargo market. GDP projections for 0.5% below and 0.5% above the baseline were assessed. The results of these growth rates are reflected in the low- and high-growth-rate scenarios, respectively.
Overall air trade within China will grow 10.6% annually for the forecast period, withgrowth accelerating to its fastest rate in the 2005-to-2008 period. The low-growth-rate scenario envisionsslowing foreign investmentand no substantial domesticexpress market developmentfor the next 5 years. The high-growth-rate forecast assumes accelerating foreigninvestment in the near term, as well as the emergence of one or more domesticexpress carrier networkswithin China.
2013
Domestic China Air Cargo Is Forecast to Grow 10.6% per Year for the Next Two Decades Tonnes, thousands
16
12
8
4
20232018200820031993
HighBaseLow
History Forecast
Average annual growth percentage
2003–2023High 11.6%Base 10.6%Low 9.5%
19.5% growthper year
1998
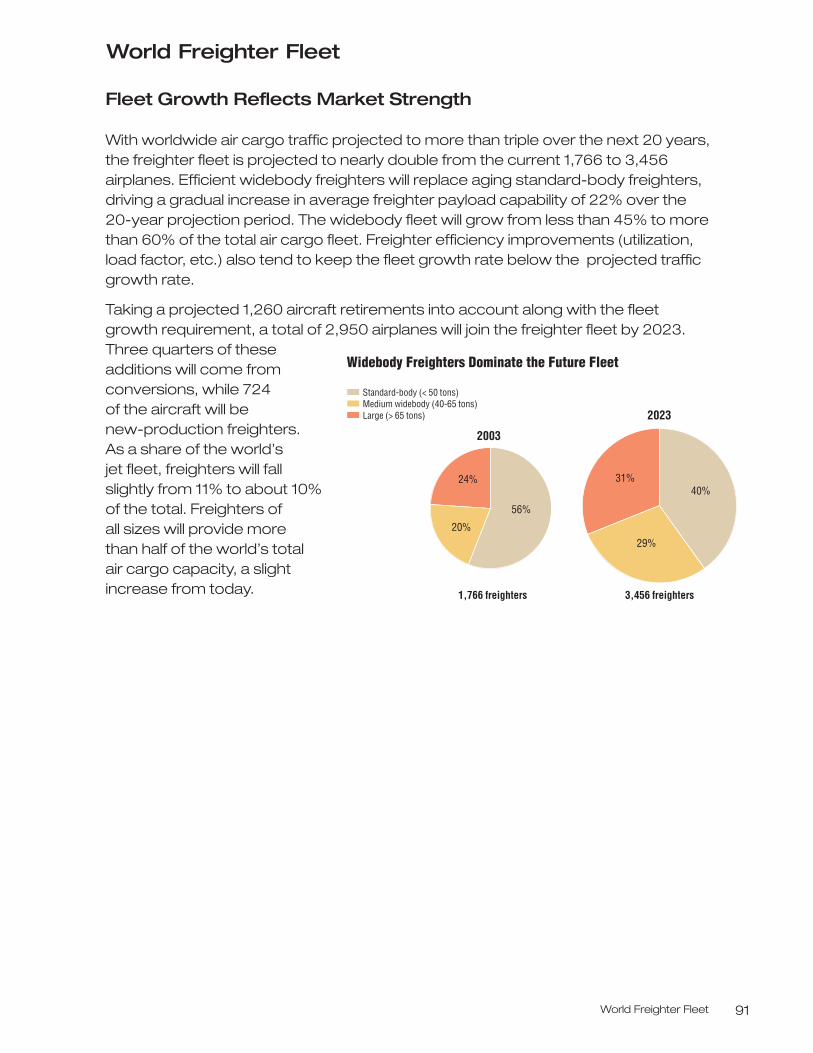
World Freighter Fleet 91
World Freighter Fleet
Fleet Growth Reflects Market Strength
With worldwide air cargo traffic projected to more than triple over the next 20 years,the freighter fleet is projected to nearly double from the current 1,766 to 3,456airplanes. Efficient widebody freighters will replace aging standard-body freighters,driving a gradual increase in average freighter payload capability of 22% over the 20-year projection period. The widebody fleet will grow from less than 45% to morethan 60% of the total air cargo fleet. Freighter efficiency improvements (utilization,load factor, etc.) also tend to keep the fleet growth rate below the projected trafficgrowth rate.
Taking a projected 1,260 aircraft retirements into account along with the fleet growth requirement, a total of 2,950 airplanes will join the freighter fleet by 2023.Three quarters of theseadditions will come fromconversions, while 724 of the aircraft will be new-production freighters. As a share of the world’s jet fleet, freighters will fallslightly from 11% to about 10%of the total. Freighters of all sizes will provide more than half of the world’s total air cargo capacity, a slightincrease from today.
Standard-body (< 50 tons)Medium widebody (40-65 tons)Large (> 65 tons)
3,456 freighters
2023
Widebody Freighters Dominate the Future Fleet
24%
20%
56%
40%
1,766 freighters
2003
31%
29%
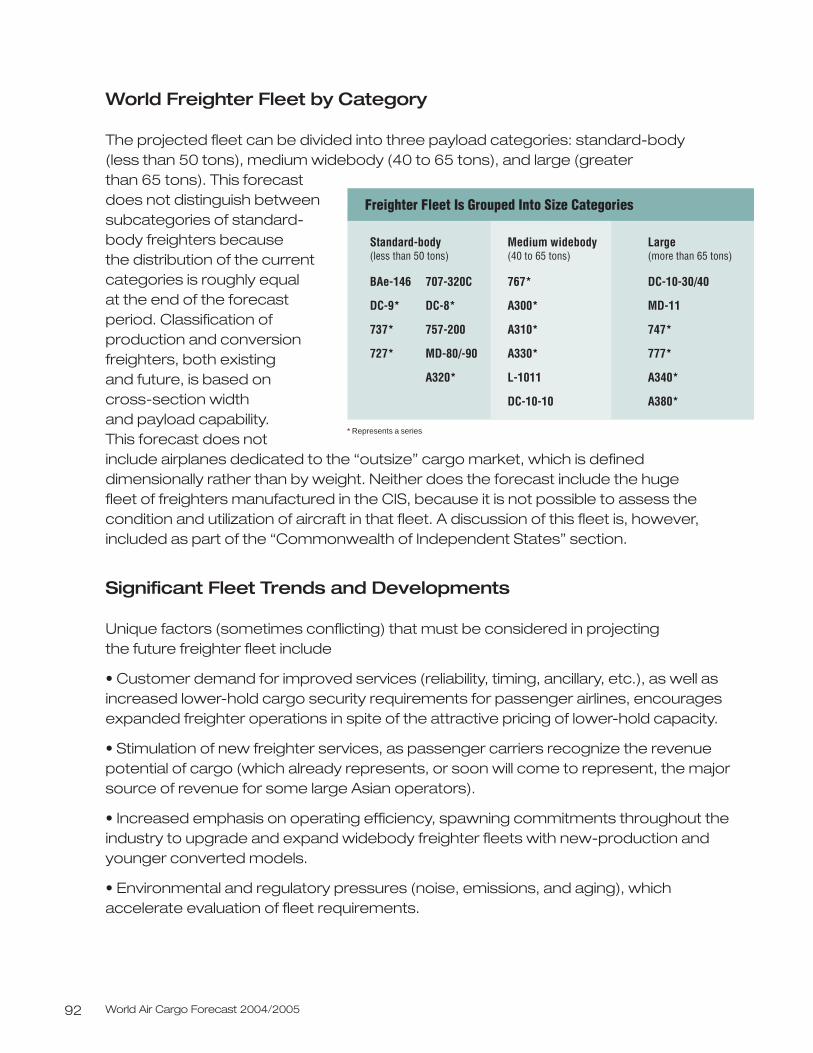
World Air Cargo Forecast 2004/200592
World Freighter Fleet by Category
The projected fleet can be divided into three payload categories: standard-body (less than 50 tons), medium widebody (40 to 65 tons), and large (greater than 65 tons). This forecastdoes not distinguish betweensubcategories of standard-body freighters because the distribution of the currentcategories is roughly equal at the end of the forecastperiod. Classification ofproduction and conversionfreighters, both existing and future, is based on cross-section width and payload capability. This forecast does not include airplanes dedicated to the “outsize” cargo market, which is defineddimensionally rather than by weight. Neither does the forecast include the huge fleet of freighters manufactured in the CIS, because it is not possible to assess thecondition and utilization of aircraft in that fleet. A discussion of this fleet is, however,included as part of the “Commonwealth of Independent States” section.
Significant Fleet Trends and Developments
Unique factors (sometimes conflicting) that must be considered in projecting the future freighter fleet include
• Customer demand for improved services (reliability, timing, ancillary, etc.), as well asincreased lower-hold cargo security requirements for passenger airlines, encouragesexpanded freighter operations in spite of the attractive pricing of lower-hold capacity.
• Stimulation of new freighter services, as passenger carriers recognize the revenuepotential of cargo (which already represents, or soon will come to represent, the majorsource of revenue for some large Asian operators).
• Increased emphasis on operating efficiency, spawning commitments throughout theindustry to upgrade and expand widebody freighter fleets with new-production andyounger converted models.
• Environmental and regulatory pressures (noise, emissions, and aging), whichaccelerate evaluation of fleet requirements.
Freighter Fleet Is Grouped Into Size Categories
Standard-body(less than 50 tons)
707-320C
DC-8*
757-200
MD-80/-90
A320*
BAe-146
DC-9*
737*
727*
Medium widebody(40 to 65 tons)
767*
A300*
A310*
A330*
L-1011
DC-10-10
Large(more than 65 tons)
DC-10-30/40
MD-11
747*
777*
A340*
A380*
* Represents a series
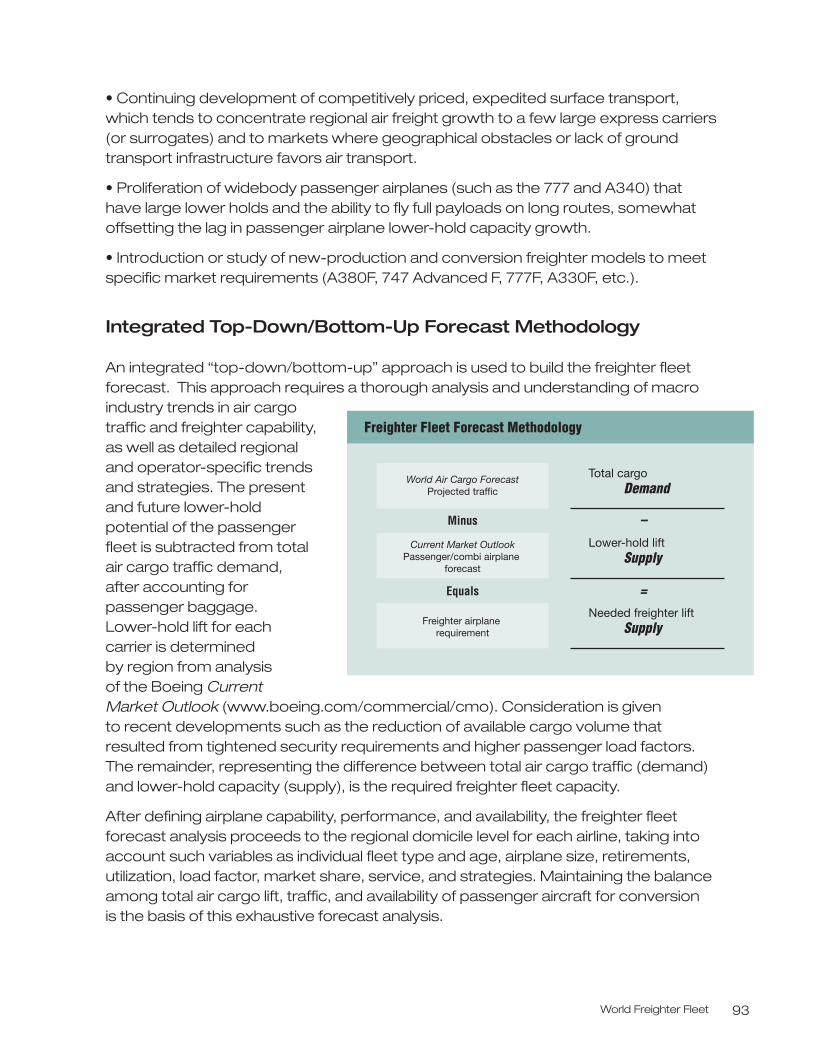
World Freighter Fleet 93
• Continuing development of competitively priced, expedited surface transport, which tends to concentrate regional air freight growth to a few large express carriers(or surrogates) and to markets where geographical obstacles or lack of groundtransport infrastructure favors air transport.
• Proliferation of widebody passenger airplanes (such as the 777 and A340) that have large lower holds and the ability to fly full payloads on long routes, somewhatoffsetting the lag in passenger airplane lower-hold capacity growth.
• Introduction or study of new-production and conversion freighter models to meetspecific market requirements (A380F, 747 Advanced F, 777F, A330F, etc.).
Integrated Top-Down/Bottom-Up Forecast Methodology
An integrated “top-down/bottom-up” approach is used to build the freighter fleetforecast. This approach requires a thorough analysis and understanding of macroindustry trends in air cargotraffic and freighter capability, as well as detailed regional and operator-specific trendsand strategies. The presentand future lower-hold potential of the passenger fleet is subtracted from total air cargo traffic demand, after accounting for passenger baggage. Lower-hold lift for each carrier is determined by region from analysis of the Boeing Current Market Outlook (www.boeing.com/commercial/cmo). Consideration is given to recent developments such as the reduction of available cargo volume that resulted from tightened security requirements and higher passenger load factors. The remainder, representing the difference between total air cargo traffic (demand) and lower-hold capacity (supply), is the required freighter fleet capacity.
After defining airplane capability, performance, and availability, the freighter fleetforecast analysis proceeds to the regional domicile level for each airline, taking intoaccount such variables as individual fleet type and age, airplane size, retirements,utilization, load factor, market share, service, and strategies. Maintaining the balanceamong total air cargo lift, traffic, and availability of passenger aircraft for conversionis the basis of this exhaustive forecast analysis.
Freighter Fleet Forecast Methodology
World Air Cargo Forecast Projected traffic
Current Market Outlook Passenger/combi airplane
forecast
Freighter airplane requirement
Minus
Equals
Total cargo Demand
–
=
Lower-hold lift Supply
Needed freighter lift Supply
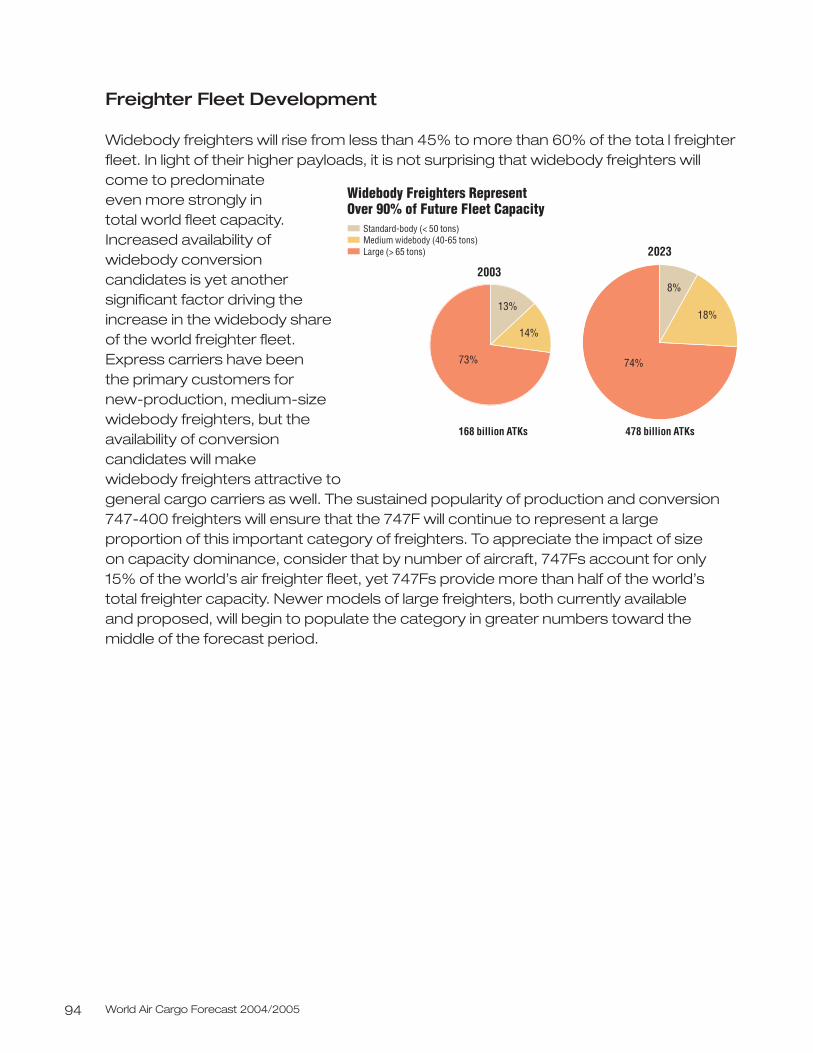
World Air Cargo Forecast 2004/200594
Freighter Fleet Development
Widebody freighters will rise from less than 45% to more than 60% of the tota l freighterfleet. In light of their higher payloads, it is not surprising that widebody freighters willcome to predominate even more strongly in total world fleet capacity. Increased availability ofwidebody conversioncandidates is yet anothersignificant factor driving theincrease in the widebody shareof the world freighter fleet.Express carriers have been the primary customers fornew-production, medium-sizewidebody freighters, but theavailability of conversioncandidates will makewidebody freighters attractive to general cargo carriers as well. The sustained popularity of production and conversion747-400 freighters will ensure that the 747F will continue to represent a largeproportion of this important category of freighters. To appreciate the impact of size on capacity dominance, consider that by number of aircraft, 747Fs account for only 15% of the world’s air freighter fleet, yet 747Fs provide more than half of the world’stotal freighter capacity. Newer models of large freighters, both currently available and proposed, will begin to populate the category in greater numbers toward themiddle of the forecast period.
478 billion ATKs
2023
Widebody Freighters Represent Over 90% of Future Fleet Capacity
168 billion ATKs
2003
Standard-body (< 50 tons)Medium widebody (40-65 tons)Large (> 65 tons)
13%
14%
73%
8%
18%
74%
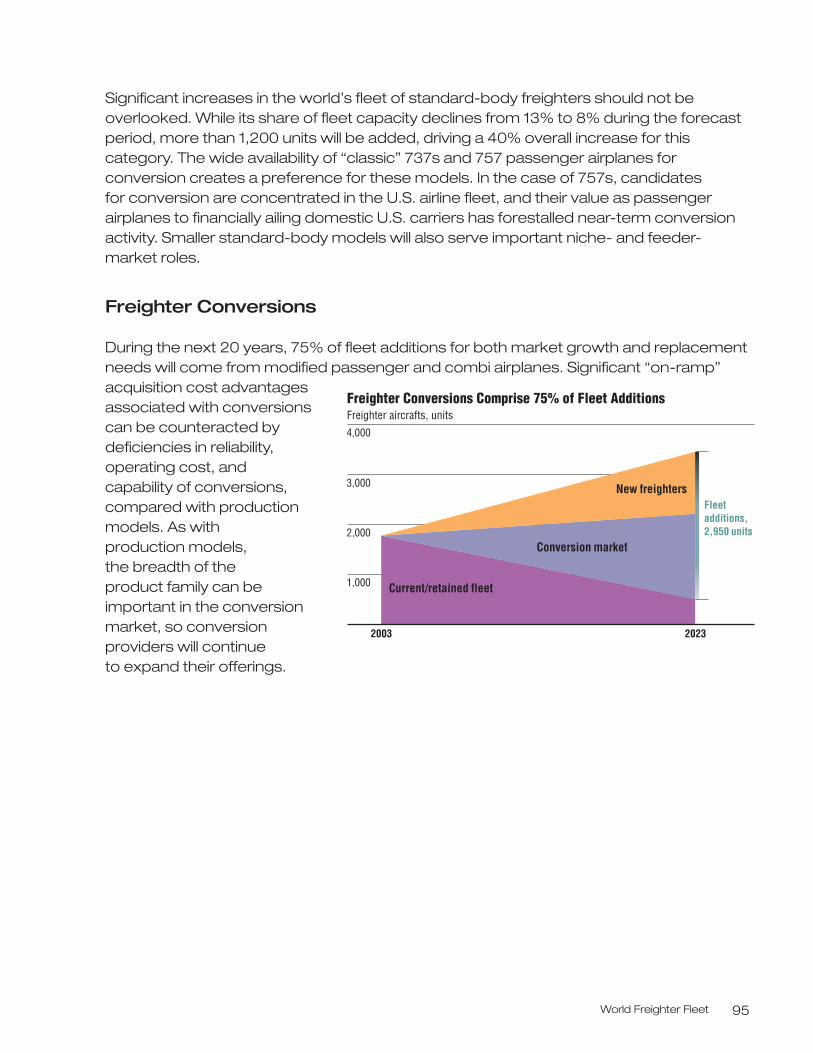
World Freighter Fleet 95
Significant increases in the world’s fleet of standard-body freighters should not beoverlooked. While its share of fleet capacity declines from 13% to 8% during the forecastperiod, more than 1,200 units will be added, driving a 40% overall increase for thiscategory. The wide availability of “classic” 737s and 757 passenger airplanes forconversion creates a preference for these models. In the case of 757s, candidates for conversion are concentrated in the U.S. airline fleet, and their value as passengerairplanes to financially ailing domestic U.S. carriers has forestalled near-term conversionactivity. Smaller standard-body models will also serve important niche- and feeder-market roles.
Freighter Conversions
During the next 20 years, 75% of fleet additions for both market growth and replacementneeds will come from modified passenger and combi airplanes. Significant “on-ramp”acquisition cost advantagesassociated with conversionscan be counteracted bydeficiencies in reliability,operating cost, and capability of conversions,compared with productionmodels. As with production models, the breadth of the product family can beimportant in the conversionmarket, so conversionproviders will continue to expand their offerings.
Fleet additions, 2,950 units
Freighter Conversions Comprise 75% of Fleet AdditionsFreighter aircrafts, units4,000
2,000
3,000
1,000
2003 2023
Current/retained fleet
New freighters
Conversion market
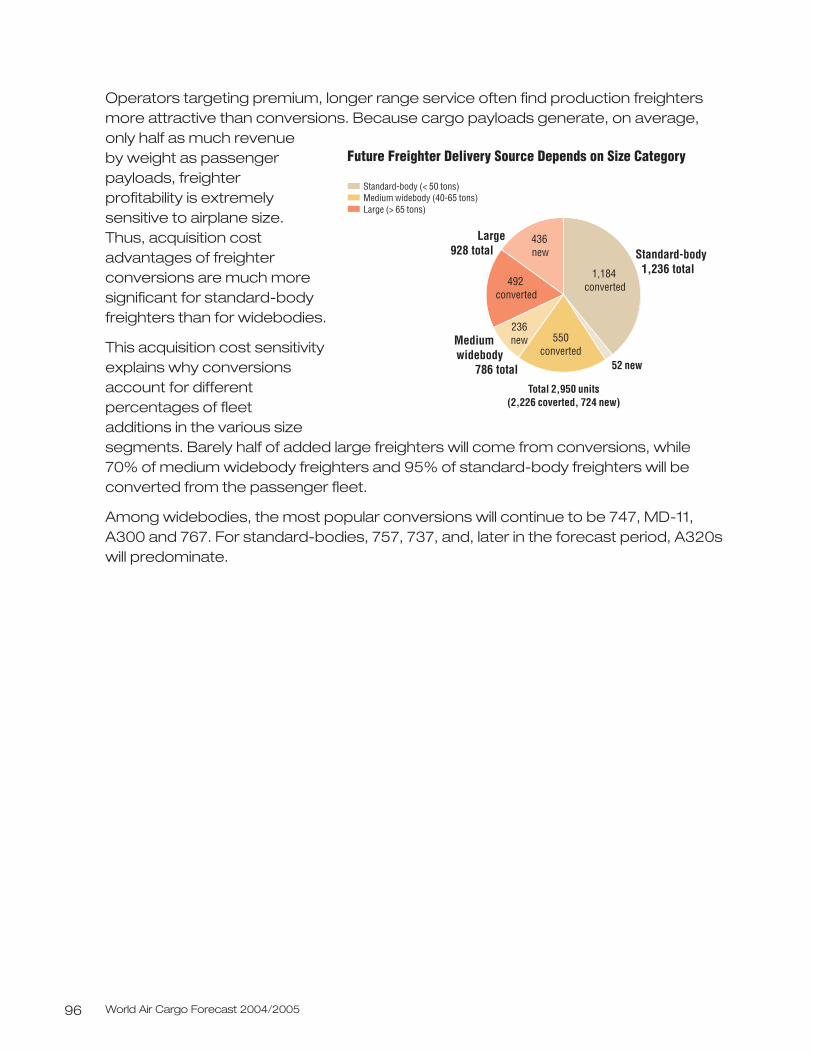
World Air Cargo Forecast 2004/200596
Operators targeting premium, longer range service often find production freightersmore attractive than conversions. Because cargo payloads generate, on average,only half as much revenue by weight as passengerpayloads, freighter profitability is extremelysensitive to airplane size. Thus, acquisition costadvantages of freighterconversions are much moresignificant for standard-bodyfreighters than for widebodies.
This acquisition cost sensitivityexplains why conversionsaccount for differentpercentages of fleet additions in the various sizesegments. Barely half of added large freighters will come from conversions, while 70% of medium widebody freighters and 95% of standard-body freighters will beconverted from the passenger fleet.
Among widebodies, the most popular conversions will continue to be 747, MD-11,A300 and 767. For standard-bodies, 757, 737, and, later in the forecast period, A320swill predominate.
Future Freighter Delivery Source Depends on Size Category
Total 2,950 units(2,226 coverted, 724 new)
Large 928 total
Medium widebody
786 total
Standard-body 1,236 total
436 new
236 new
492 converted
550 converted
52 new
1,184 converted
Standard-body (< 50 tons)Medium widebody (40-65 tons)Large (> 65 tons)
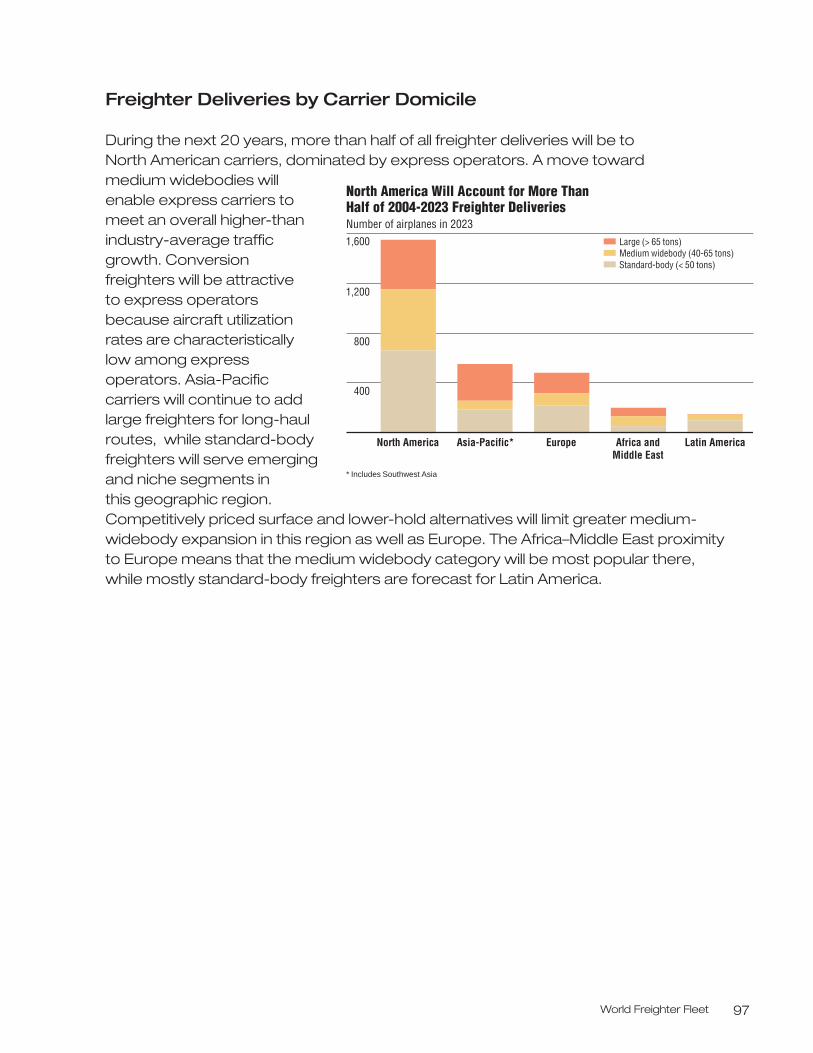
World Freighter Fleet 97
Freighter Deliveries by Carrier Domicile
During the next 20 years, more than half of all freighter deliveries will be to North American carriers, dominated by express operators. A move toward medium widebodies willenable express carriers tomeet an overall higher-thanindustry-average trafficgrowth. Conversion freighters will be attractive to express operators because aircraft utilizationrates are characteristically low among expressoperators. Asia-Pacific carriers will continue to addlarge freighters for long-haulroutes, while standard-bodyfreighters will serve emergingand niche segments in this geographic region.Competitively priced surface and lower-hold alternatives will limit greater medium-widebody expansion in this region as well as Europe. The Africa–Middle East proximityto Europe means that the medium widebody category will be most popular there,while mostly standard-body freighters are forecast for Latin America.
North America Will Account for More Than Half of 2004-2023 Freighter DeliveriesNumber of airplanes in 20231,600
1,200
800
400
North America Asia-Pacific* Africa and Middle East
Latin AmericaEurope
* Includes Southwest Asia
Large (> 65 tons)Medium widebody (40-65 tons)Standard-body (< 50 tons)
Glossary 99
Glossary
Aircraft, crew,
maintenance, and
insurance (ACMI)
Asian economic crisis
Available tonne-
kilometer (ATK)
Bottom-up approach
CAEP
Cargo
European Union
Express
Foreign direct
investment (FDI)
Freight tonne-
kilometer (FTK)
Gross domestic
product (GDP)
Integrated carrier
Package (or “wet”) lease of an airplane that includes the aircraft, crew,
maintenance, and insurance, but excludes fuel.
Major economic downturn lasting throughout 1998 and a portion of 1999.
This downturn was precipitated by the mid-1997 Thai currency collapse
and ultimately adversely impacted most Asian banking, currency, and
investment sectors.
The number of tonnes capable of being carried, multiplied by the number
of kilometers flown.
Analysis technique beginning at the most detailed (micro) level, moving
“up” with less specificity only after considering complex, interrelated
foundational effects.
Committee on Aviation Environmental Protection, an ICAO consultative
body that studies the impact of aviation on the environment.
Freight, express, and airmail are the three components of cargo
used in this document.
A political and economic regional bloc in Europe that currently consists
of the following countries: Austria, Belgium, Cyprus, the Czech Republic,
Denmark, Estonia, Finland, France, Germany, Greece, Hungary, Ireland, Italy,
Latvia, Lithuania, Luxembourg, Malta, the Netherlands, Poland, Portugal,
Slovakia, Slovenia, Spain, Sweden, and the United Kingdom.
Cargo with a guaranteed or time-definite service component. Express carriers
are usually characterized as “integrated” because, in addition to carrying mostly
airport-to-airport, time-definite cargo, they also bring together many other
services, such as door-to-door pickup and delivery.
Investment into a country’s manufacturing or service sector by an entity
domiciled in a different country.
1 tonne of cargo carried 1 kilometer.
The total output of goods and services within a country.
A cargo company providing a complete service offering to its customers,
bringing together pickup, airport-to-airport transport, and delivery, along with
all of the supporting ancillary services. Usually synonymous with a carrier
providing “express” services.
World Air Cargo Forecast 2004/2005100
IATA
ICAO
Just-in-time (JIT)
Less-than-
truckload (LTL)
Linehaul
Load factor
Logistics provider
Maquila or
maquiladora sector
On-ramp
acquisition cost
Outsize cargo
Pacific Rim,
or Pac 12
Pan-European
Positioning traffic
Revenue tonne-
kilometer (RTK)
Road feeder
service (RFS)
Ruble crisis
International Air Transport Association.
International Civil Aviation Organization.
A manufacturing and distribution system that relies on meeting immediate needs,
as opposed to carrying large inventories “just- in- case.”
A term used by motor carriers to designate smaller shipments that are handled
as loose pieces, as opposed to full truckloads.
Point-to-point basic cargo carriage offering minimal additional services.
Revenue tonne-kilometers divided by available tonne-kilometers.
Service company providing the procurement, distribution, maintenance,
and replacement of material and personnel.
Function or sector that describes production by a facility for another party,
who designs the good or service, plans production processes, provides raw
materials, and retains ownership of the goods with attendant tax benefits.
Total costs, including airframe, maintenance, upgrades, and conversion to make
the freighter ready for service.
Freight that is too dimensionally large or heavy for current
widebody freighter airplanes.
The 12 major Asian-Oceania trading countries. They are Australia, Hong Kong,
Indonesia, Japan, Korea, Malaysia, New Zealand, People’s Republic of China, the
Philippines, Singapore, Taiwan, and Thailand.
Across, including all or most, continental European countries.
Transit cargo being positioned for transport to an onward ultimate destination.
Usually used interchangeably with “FTK” but can include passenger weight
for total “revenue.”
Cargo that is transported by surface means (usually by dedicated truck)
on an airway bill (AWB). Carriage can be exclusively between origin and
destination by air or surface.
The massive devaluation in August 1998 primarily caused by lack of foreign
investor confidence in the Russian nation’s ability to service its debt obligations.
Glossary 101
SARS (severe acute
respiratory syndrome)
Sea-air traffic
Technology bubble
Time-deferred services
Time-definite services
Top-down approach
Truck flights
“Wet” lease
Y2K
Yield
Serious, highly communicable virus with flulike symptoms, originating
in southern China, ultimately resulting in hundreds of deaths worldwide.
Because of initial uncertainty surrounding its origin and cause and the
absence of any known cure, passenger air traffic plummeted dramatically
during the first half of 2003, until strict detection and quarantine measures
were implemented. Negative impacts were felt mostly in Hong Kong and
Southeast Asia. With limited passenger service, lower-hold air cargo capacity
was likewise restricted, requiring augmentation by increased freighter service.
Cargo that is transported from origin to destination by sea and air, taking
advantage of the lower cost by ocean ship between seaports and the speed
of air over landmasses to optimize a balance between time and cost.
Portion of the economy that during the mid- to late 1990s resulted in inflated
values relating to the proliferation of increasingly sophisticated information
and telecommunication technologies. The bursting of this “bubble”
(collapsing values) began with the “dot-com” sector in early 2000.
Competitively priced cargo services, compared with those with time
guarantees because of less exacting performance standards; for example,
for a reduced shipping price, delivery might be “deferred” from “next-day”
to second- or third-day after tendering.
Cargo services with a performance guarantee based on time. Often that
includes a refund of all or a portion of the payment made for same service if
the advertised delivery time is not met.
Analysis technique that begins with a broader (macro) perspective,
applying trends and conclusions to more specific situations.
Also known as “road feeder service.” Cargo that is transported by surface
means (usually by dedicated truck) on an airway bill (AWB). Carriage can
be exclusively between origin and destination by surface or also “feed”
airport-to-airport air or surface.
Arrangement that includes all facets of operating an airplane on a carrier’s
behalf, including the airframe, crew, and most, if not all, of the airplane-related
expense items.
Serious “Year 2000” computer compatibility issues.
Airline charges as measured in units of aggregated weight and distance
(e.g., revenue per tonne-kilometer).
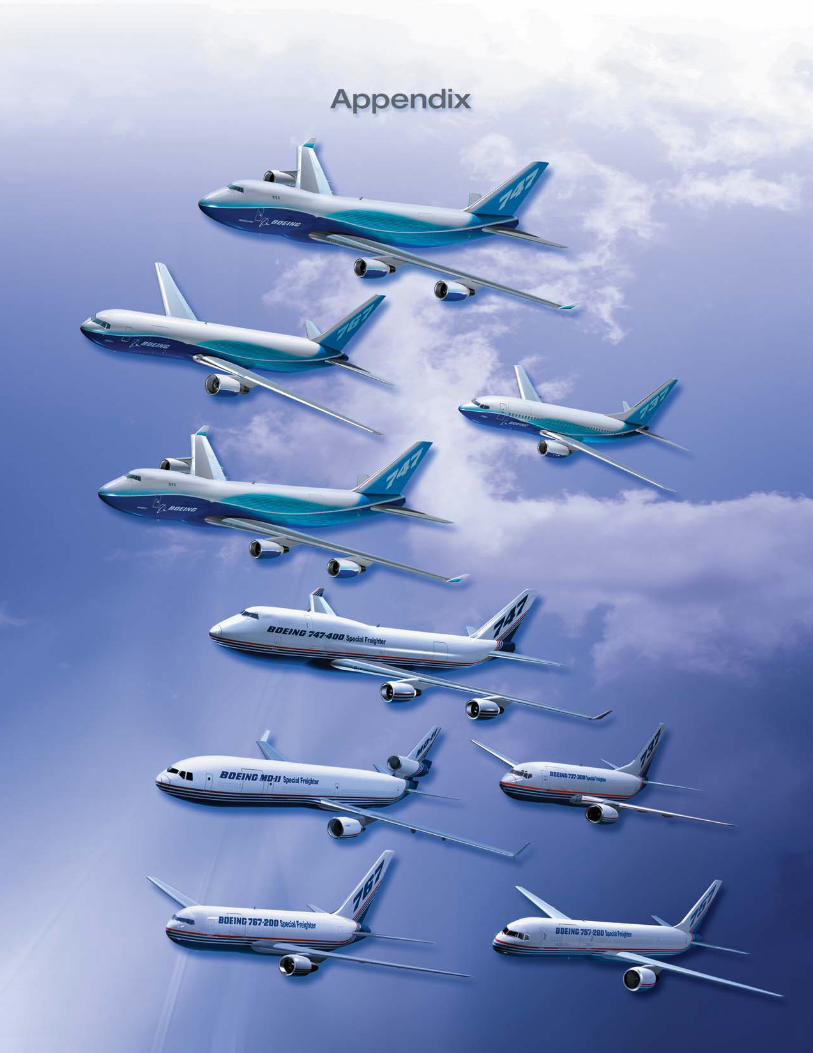
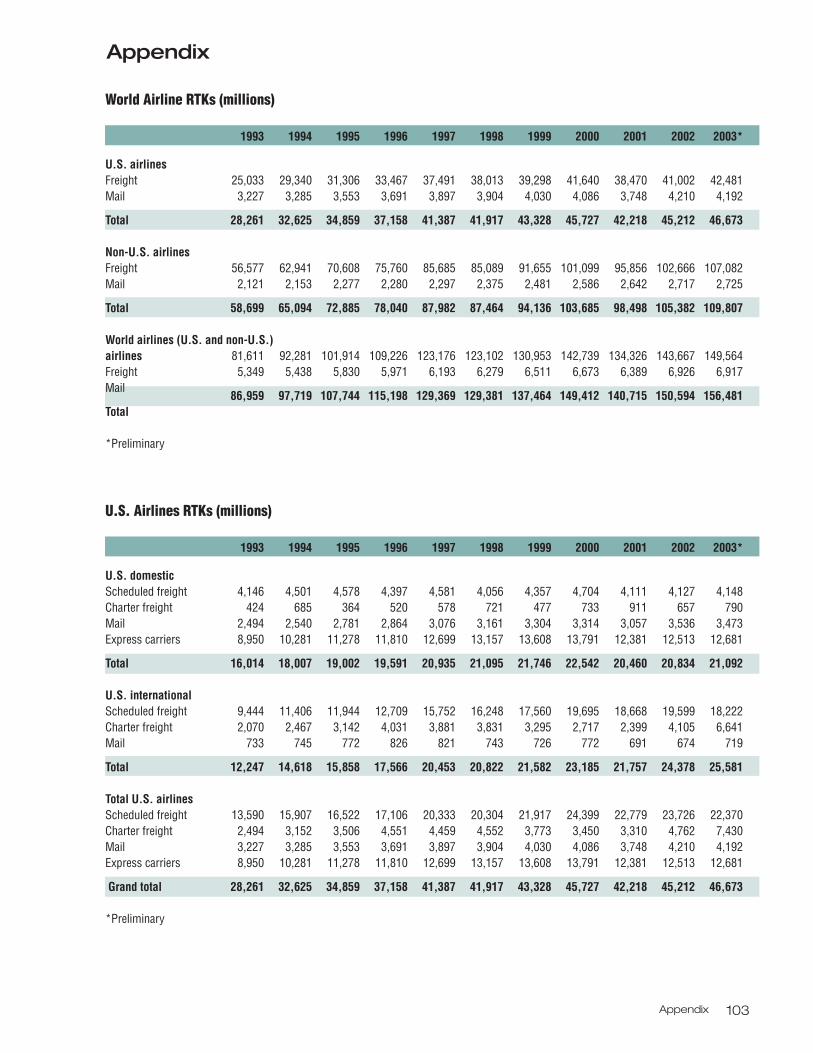
Appendix 103
Appendix
1993 1994 1995 1996 1997 1998 1999 2000 2001 2002 2003*
25,033 29,340 31,306 33,467 37,491 38,013 39,298 41,640 38,470 41,002 42,481 3,227 3,285 3,553 3,691 3,897 3,904 4,030 4,086 3,748 4,210 4,192
28,261 32,625 34,859 37,158 41,387 41,917 43,328 45,727 42,218 45,212 46,673
56,577 62,941 70,608 75,760 85,685 85,089 91,655 101,099 95,856 102,666 107,082 2,121 2,153 2,277 2,280 2,297 2,375 2,481 2,586 2,642 2,717 2,725
58,699 65,094 72,885 78,040 87,982 87,464 94,136 103,685 98,498 105,382 109,807
81,611 92,281 101,914 109,226 123,176 123,102 130,953 142,739 134,326 143,667 149,564 5,349 5,438 5,830 5,971 6,193 6,279 6,511 6,673 6,389 6,926 6,917
86,959 97,719 107,744 115,198 129,369 129,381 137,464 149,412 140,715 150,594 156,481
World Airline RTKs (millions)
U.S. airlinesFreight Mail
Total
Non-U.S. airlinesFreight Mail
Total
World airlines (U.S. and non-U.S.) airlinesFreight Mail
Total
*Preliminary
1993 1994 1995 1996 1997 1998 1999 2000 2001 2002 2003*
4,146 4,501 4,578 4,397 4,581 4,056 4,357 4,704 4,111 4,127 4,148 424 685 364 520 578 721 477 733 911 657 790 2,494 2,540 2,781 2,864 3,076 3,161 3,304 3,314 3,057 3,536 3,473 8,950 10,281 11,278 11,810 12,699 13,157 13,608 13,791 12,381 12,513 12,681
16,014 18,007 19,002 19,591 20,935 21,095 21,746 22,542 20,460 20,834 21,092
9,444 11,406 11,944 12,709 15,752 16,248 17,560 19,695 18,668 19,599 18,222 2,070 2,467 3,142 4,031 3,881 3,831 3,295 2,717 2,399 4,105 6,641 733 745 772 826 821 743 726 772 691 674 719
12,247 14,618 15,858 17,566 20,453 20,822 21,582 23,185 21,757 24,378 25,581
13,590 15,907 16,522 17,106 20,333 20,304 21,917 24,399 22,779 23,726 22,370 2,494 3,152 3,506 4,551 4,459 4,552 3,773 3,450 3,310 4,762 7,430 3,227 3,285 3,553 3,691 3,897 3,904 4,030 4,086 3,748 4,210 4,192 8,950 10,281 11,278 11,810 12,699 13,157 13,608 13,791 12,381 12,513 12,681
28,261 32,625 34,859 37,158 41,387 41,917 43,328 45,727 42,218 45,212 46,673
U.S. Airlines RTKs (millions)
U.S. domesticScheduled freight Charter freight Mail Express carriers
Total
U.S. international Scheduled freight Charter freightMail
Total
Total U.S. airlinesScheduled freight Charter freight Mail Express carriers
Grand total
*Preliminary
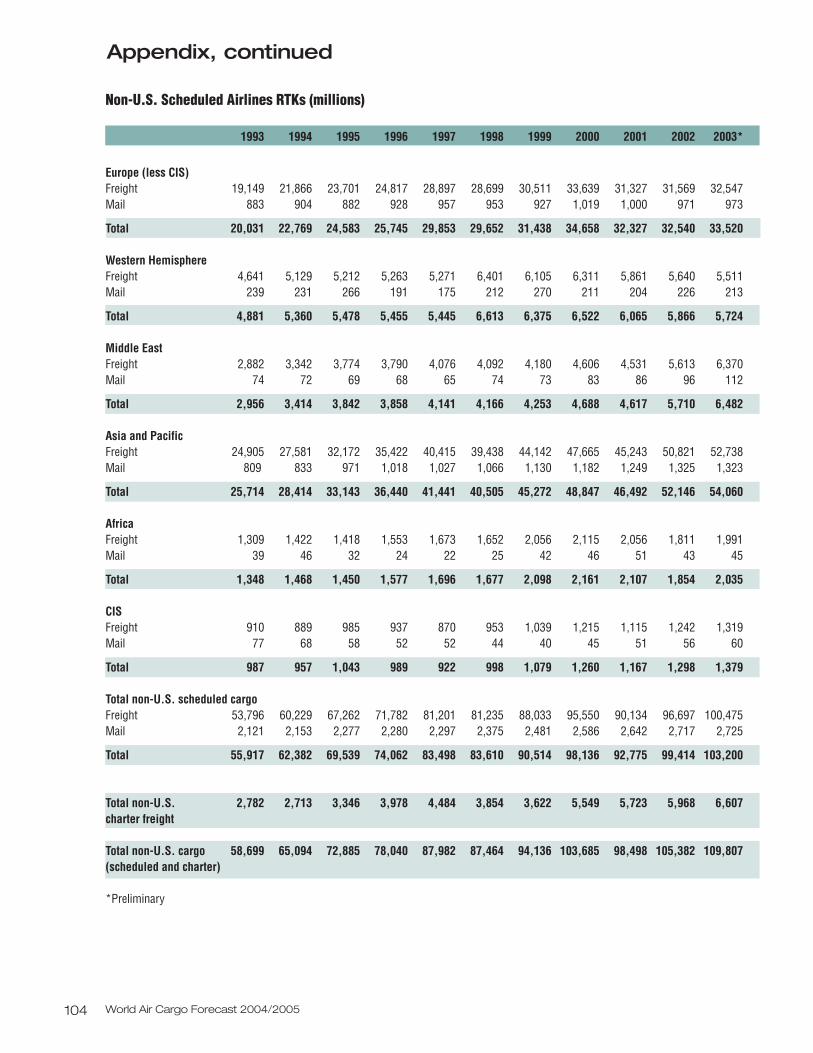
World Air Cargo Forecast 2004/2005104
Appendix, continued
1993 1994 1995 1996 1997 1998 1999 2000 2001 2002 2003*
19,149 21,866 23,701 24,817 28,897 28,699 30,511 33,639 31,327 31,569 32,547 883 904 882 928 957 953 927 1,019 1,000 971 973
20,031 22,769 24,583 25,745 29,853 29,652 31,438 34,658 32,327 32,540 33,520
4,641 5,129 5,212 5,263 5,271 6,401 6,105 6,311 5,861 5,640 5,511 239 231 266 191 175 212 270 211 204 226 213
4,881 5,360 5,478 5,455 5,445 6,613 6,375 6,522 6,065 5,866 5,724
2,882 3,342 3,774 3,790 4,076 4,092 4,180 4,606 4,531 5,613 6,370 74 72 69 68 65 74 73 83 86 96 112
2,956 3,414 3,842 3,858 4,141 4,166 4,253 4,688 4,617 5,710 6,482
24,905 27,581 32,172 35,422 40,415 39,438 44,142 47,665 45,243 50,821 52,738 809 833 971 1,018 1,027 1,066 1,130 1,182 1,249 1,325 1,323
25,714 28,414 33,143 36,440 41,441 40,505 45,272 48,847 46,492 52,146 54,060
1,309 1,422 1,418 1,553 1,673 1,652 2,056 2,115 2,056 1,811 1,991 39 46 32 24 22 25 42 46 51 43 45
1,348 1,468 1,450 1,577 1,696 1,677 2,098 2,161 2,107 1,854 2,035
910 889 985 937 870 953 1,039 1,215 1,115 1,242 1,319 77 68 58 52 52 44 40 45 51 56 60
987 957 1,043 989 922 998 1,079 1,260 1,167 1,298 1,379
53,796 60,229 67,262 71,782 81,201 81,235 88,033 95,550 90,134 96,697 100,475 2,121 2,153 2,277 2,280 2,297 2,375 2,481 2,586 2,642 2,717 2,725
55,917 62,382 69,539 74,062 83,498 83,610 90,514 98,136 92,775 99,414 103,200
2,782 2,713 3,346 3,978 4,484 3,854 3,622 5,549 5,723 5,968 6,607
58,699 65,094 72,885 78,040 87,982 87,464 94,136 103,685 98,498 105,382 109,807
Non-U.S. Scheduled Airlines RTKs (millions)
Europe (less CIS)Freight Mail
Total
Western HemisphereFreight Mail
Total
Middle EastFreight Mail
Total
Asia and Pacific Freight Mail
Total
AfricaFreight Mail
Total
CISFreight Mail
Total
Total non-U.S. scheduled cargoFreight Mail
Total
Total non-U.S. charter freight
Total non-U.S. cargo(scheduled and charter)
*Preliminary
BOEING is a trademark of Boeing Management Company.Copyright 2004 Boeing. All rights reserved.
Printed in U.S.A.2824 9/04
The Boeing CompanyAirline Fleet Revenue AnalysisP.O. Box 3707 MC 21-33Seattle, WA 98124-2207
www.boeing.com