Embed Size (px)
Citation preview

Ford’s Cut History and Bank Erosion Assessment
Report prepared for Environment Bay of Plenty by
Philip Wallace
January 2008

Fords Cut January 2008
i
Table of Contents 1 Introduction ..................................................................................................................2 2 History of Fords Cut.....................................................................................................2 3 Review of Titchmarsh Report.......................................................................................3 4 Current Assessment of Bank Erosion ..........................................................................3 4.1 Current state of banks..........................................................................................3 4.2 Aerial photograph analysis...................................................................................3 4.4 Effect of rediversion flow on bank erosion ...........................................................3 4.5 Effect of high tides and wind waves on bank erosion ..........................................3 4.5 Other factors ........................................................................................................3 4.6 Flood Risk............................................................................................................3 5 Conclusions .................................................................................................................3 References ..........................................................................................................................3 Appendix 1 – Study Brief .....................................................................................................3 Appendix 2 – Photographs...................................................................................................3 Appendix 3 Aerial/Oblique Historic Plan and Photos ..........................................................3

Fords Cut January 2008
2
1 Introduction Ford’s Cut, also known as Ford’s Twin Cut and as the Twin Cuts, is a channel between the lower Kaituna River and Maketu Estuary that was originally excavated during the 1920s. The Brain family, which owns land in the area, has long had concerns about the Cut and the flow through it. To investigate some of these concerns, Environment Bay of Plenty has commissioned this report to
• document the history of Ford’s Cut • review a report prepared by Ross Titchmarsh in 1998 on bank erosion in the Cut,
and • assess the state of the northern bank and the risk to the adjacent land.
(The brief for the work is given in full in Appendix 1).
2 History of Fords Cut The history of Ford’s Cut, and of the lower Kaituna River alignments and works during the 20th century, has been given in various earlier reports, e.g. Wildlands (2007), Titchmarsh (1998), Commission for the Environment (1984). In general, these reports provide a reasonable summary of the history, although some of the details appear to be derived from other of the reports rather than directly corroborated. Nonetheless, from these reports and earlier ones, e.g. Murray (1951), BOPCC (1970), a chronology of events can be derived. Three parallel timelines are presented in Table 1: significant floods, major reports and relevant works. Major events are as follows: 1920s: Ford’s Cut excavated.
The precise date of the excavation has not been determined. Some reports give it as 1922 (e.g. Wildland Consultants, Titchmarsh), but a sketch map presented in Stokes (1980) showing the river channels in 1925 does not show the Cut. Oliver Brain was quoted as saying the Cut was made in 1928 (Bay of Plenty Times, 1 July 1978). Nor is it clear who originally proposed and designed the Cut, although one could infer from the report of Murray (1951) that it was Holmes and Blair-Mason in 1922. According to Wildland Consultants and Titchmarsh, the Cut was made to divert the river back into the Maketu Estuary following the breakout of the river at Te Tumu in 1907 (although it appears that the mouth gradually migrated eastward again over the next twenty years as flow returned again to the Papahikahawai Channel). Note that the Cut actually consists of twin parallel cuts, presumably made due to the limited reach of the excavating machinery. Murray states that it was intended that the channel would scour out naturally, but this never happened: “Works which were completed and which resulted in a temporary marked improvement were: -

Fords Cut January 2008
3
Figure 1 Ford’s Cut Location

Fords Cut January 2008
4
Note (1) Only floods with peak flow greater than 200 m3/s at Te Matai recorder at SH2 are shown (i.e. approximately 5-10 year return period). Flows 1951-1967 according to BOPCC(1970). Slight variations to those now attributed to the floods Table 1 Timeline of Relevant Events

Fords Cut January 2008
5
(a) the excavation of a dual diversion cut known as Ford’s Cut (b) the excavation of six shorter cuts between Ford’s and Canaan’s Landing …
It is noteworthy that the Engineers who advocated these cuts left them smaller than the normal river sections in the expressed hope that increased velocities induced would cause the cuts to scour to their full size. In no case has this scouring taken place…”
Amongst Murray’s recommendations was the removal of the central portion of the Cut. This was never implemented. Between the time of the creation of Ford’s Cut and 1956, the river also flowed into the estuary via the Papahikahawai Channel. c1956: Te Tumu Cut excavated and Ford’s Cut blocked off
The river was permanently diverted out to sea at Te Tumu as a means of lowering river levels upstream, on the recommendations of Acheson (1954). At the same time, the Papahikahawai Channel and Ford’s Cut were both blocked off at their upstream end with a causeway. Presumably the rationale for blocking off these was to maintain full flow in the Te Tumu Cut and ensure that it stayed open (with the possibility also that the Maketu Estuary could eventually be reclaimed for farm land). However, minor flows continued into the Ford’s Cut, via seepage through the causeway, and during spring high tides and floods water spilled across the causeway (Figure 2). According to the submission of a local on the Ford’s Cut consent application (see below), the seepage was as much as 1/7th of the river flow (Wilkinson, 1991). No evidence has been found to substantiate this quantity however. Figure 3 shows seepage flow in 1991.
Figure 2 Ford’s Cut causeway at spring high tide, 1988

Fords Cut January 2008
6
Figure 3 Seepage through causeway into Ford’s Cut 1991 1979: Diversion of Kaituna River adjacent to Ford’s Cut
The first contract works of the Kaituna Catchment Control Scheme began in 1979. Contract K1 included a diversion cut to bypass the loop adjacent to the upstream end of Ford’s Cut. The loop was blocked at its upstream end. (Plan K4230) Contract K1 also included works to construct a stopbank from Ford’s Cut to the Te Tumu mouth along the Kaituna right bank. However at the Ford’s Cut causeway itself the stopbank was not built to the design height until 19951. According to evidence presented by a local to a Planning Tribunal hearing, the Wilkinson (1991) claimed that causeway was topped up in 1974, “drastically” reducing the seepage flow through the causeway. Wildland Consultants (2007) repeat the date of this topping up, but it is possible that this actually refers to the 1979 stopbank works. Regardless, some seepage flow continued until the 1995 works.
1984: Ford’s Cut Stopbanks built
Contract K84/3 saw stopbanks along the southern side of Ford’s Cut constructed. The design level of the stopbank crest was 2.74m RL2, and the banks were typically 1.8m high.
1996: Flow rediverted through Ford’s Cut
Following years of concern about the closure of the river paths to the estuary, and the deteriorating state of the estuary, the Department of Conservation applied for resource consent to redivert flow (via culverts) through the Ford’s Cut. Consent was
1 See, for example, BOPRC Plan K4660 Sheet 1, and Photograph x Appendix x 2 Reduced Level, relative to Moturiki Datum (which is approximately mean sea level, differing by a few cm)

Fords Cut January 2008
7
granted by the Bay of Plenty Regional Council (now also known as Environment Bay of Plenty), but this decision was appealed. After a Planning Tribunal hearing in 1993, the consent was finally confirmed in 1994. Construction of four culverts was completed by 1995. These had flapgates on the downstream end to prevent backflow from the estuary to the river and manually operated sluice gates on the upstream end that could be closed in the event of a river flood. Immediately after completion, the gates remained closed due to legal action taken by the Brain family. However, the gates were opened illegally by unknown members of the public in February 1996 and flow restored. The High Court ruled against the Brain family and allowed the rediversion in May 1996. After this opening of all four gates, two were later temporarily closed, before all four gates were eventually reopened c1997. The sluice gates have since been considered unnecessary and are not used.
3 Review of Titchmarsh Report Ross Titchmarsh was commissioned by the Department of Conservation in 1998 to comment on the effect of the partial rediversion through Ford’s Cut on bank erosion in the Cut. Note that the comments below refer to a draft copy of the report. “2. Background” This section of the Titchmarsh report gives a history of the lower river and estuary alignments and works between 1907 and 1995. As noted above, this is in general a reasonable summary. “3. Modelling of Structure” This summarises modelling work carried out by Titchmarsh in 1991. A fuller description is given in his evidence to the Planning Tribunal Hearing in 1993. The model has been refined since that time by different people, but the software and basic model layout have remained the same.
“4. Erosion of Ford’s Cut”
“4.1 Review of Flow Regimes”
Assumptions and comments made are generally reasonable. The assumption made that the average river flow is 40 m3/s is correct (although in his evidence to the Planning Tribunal, he states that 32 m3/s was used). He states that the diversion structure is designed to pass an average of 100 000 m3 per tidal cycle into Ford’s Cut. This has been borne out by actual gaugings, over one cycle, showing 106 000 m3 in 1996 ((Environment B·O·P, 1996) and 90 000 m3 in 1997 ((Environment B·O·P, 1997), as well as recent modelling showing approximately 105 000 m3 per cycle (Wallace, 2007). The statement that typically the flow in the Cut is between 4 m3/s and 7.3 m3/s is perhaps a bit misleading and not very meaningful however. It would be better to say that under average river flow conditions, the Ford’s Cut flow typically ranges from zero to between 8 m3/s and 12 m3/s twice daily.

Fords Cut January 2008
8
Results from the Titchmarsh model are given in Table A of his report. These give maximum and minimum velocities, water levels and flows for spring tide and neap tide conditions, under three scenarios: pre-1957, 1957-1995 and post 1996 (i.e. before the Te Tumu Cut, after the Te Tumu Cut, and after the rediversion through Ford’s Cut). Peak discharges and velocities in spring and neap tides predicted by the recent modelling also are similar to those given in the Titchmarsh report for the post-structure situation. Also confirmed is that the changes in peak water levels resulting from the rediversion are very small under average river flow conditions. It should be noted that velocities quoted are channel-average, and that there will be variations in the velocities with depth and across the channel. However, in a straight, uniform channel such as this, for design purposes the bank edge velocities could reasonably be approximated by the channel-average velocities. Results quoted for the 1922-1957 period are based on the assumption that the Cut channel dimensions were as surveyed in 1986 (and possibly ignoring the Papahikahawai channel). Without knowing the actual Cut cross-section area (likely to have been smaller as the channel increased in width over time) and that of the Papahikahawai channel, these results cannot be confirmed.
“4.2 Review of Photographs”
See below.
“5. Factors Contributing to the Erosion”
Titchmarsh lists several factors likely to be contributing to the erosion. These are all plausible, as discussed below. “6. Conclusion”
The photographs referred to in Appendix D and E (i.e. of erosion in 1988/1995) of Titchmarsh have not been sighted. Thus evidence for the second point (“The partial re-diversion … has not increased the bank erosion in the area.”) is incomplete. On the basis of the aerial photographs however, the point is plausible. Otherwise the points made in the conclusion are reasonable.
4 Current Assessment of Bank Erosion
4.1 Current state of banks The left bank of the Ford’s Cut channel approximately 1m high and consists of pumicey sandy silt (and therefore of limited cohesion) with some peat deposits evident (Appendix 2, Photo 3). This is much as described in BOPCC (1970). The bank has some covering of toe-toe and gorse, and in places old rock bank protection is evident. The bank is fenced at the top. The bank sits on top of a sand beach which, at the time of the site visit, was in some places becoming vegetated with a grass-like material. The right bank is lined with rock, placed c1997 to protect the stopbank. This in itself indicates that the erosion was occurring and considered sufficient to warrant action. The right bank erosion would have been similar to what continues on the left bank.

Fords Cut January 2008
9
Clear and fresh evidence of bank erosion was observed during a site visit on 19 December 2007 (Appendix 2 photos). Photographs taken in August 2007 show similar erosion. Titchmarsh refers to photographs (not sighted) from 1988, 1995 and 1998 showing erosion.
4.2 Aerial photograph analysis Analysis of aerial photos (Appendix 3) indicates that the channel width has increased over time. However, there is no discernable increase since the 1990s. Table 2 adds to Table B of Titchmarsh, providing channel widths at two locations. (Note that the accuracy of the widths and the channel position is constrained by the photo resolution. The bank positions are also obscured by bank vegetation in some instances, but in general are accurate to ± 1-2m.) Table B of Titchmarsh suggests that the central island started disappearing between 1970 and 1980. The photograph of 1977 indicates that the disappearance started after that date. By 1994, the central island has more or less disappeared, and now the remnants are confined to below water level. Thus, although there have been no cross-section surveys to confirm this, the channel does appear from aerial photographs reasonably stable in recent years. This is consistent with Murray’s 1951 comment that the channel had not scoured out as expected since construction, despite a much larger portion of flow going through it before 1956 than is the case now.
Year
left right total left right total1948 11 13 36 14 13 371959 13 15 38 15 16 401970 18 18 18 181980 20 20 19 191992 20 22 471994 471996 46 47
c2000 43 472003 45 472007 46 47
Ford's Cut width (m)section 2section 1
Sections 1 and 2 at site of 1986 cross-sections, as in Titchmarsh Total includes width of central island for 1948 and 1959 Widths only accurate to photo resolution (approx. ±1-2m) Table 2 Ford’s Cut channel widths
4.4 Effect of rediversion flow on bank erosion Observations made on 19 December, not long after high tide and when the culvert gates were open (Photos 1 and 2 of Appendix 3), showed that the velocity at the left bank water’s edge was low – ranging up to about 0.3m/s. This confirms the low velocities quoted by Titchmarsh. In any case, the waters edge was also generally below the bottom of the bank, and so, under normal conditions at least, there would be negligible chance of any bank erosion caused by the flow.

Fords Cut January 2008
10
Modelling of a river flood of 180 m3/s (around 5 year return period) with normal tides, gives a peak channel velocity of about 0.5m/s, and a peak water level of about 1m RL (about 100mm higher than if there was no flow from the river, but still only at or just above the toe of the bank). Thus even with a moderate flood flow, the diverted flow would probably not result in significant erosion.
4.5 Effect of high tides and wind waves on bank erosion Higher tides and wave action are probably the biggest threats to the banks. From tide tables3 the predicted high tide level at the Maketu mouth on 19 December was 0.74m (above mean sea level at Maketu, a few cm higher than Moturiki Datum). This is about an average high tide. As water was below the toe of the left bank, the daily fluctuations suggested by Titchmarsh would be a lesser contributor to erosion. However, the peak level predicted over the period October-December 2007 was 1.04m, i.e. 0.3m higher. Any possible storm surge has not been considered and so there may have been other times when the actual sea levels, and therefore the levels in the Cut, were higher still. At least the toe of the bank could therefore be under water. If wind-generated waves are also present, the bank would be subject to attack from those. With the limited cohesion and limited vegetation, slumping of the banks could easily result. This would be a more frequent occurrence than flood flows.
4.5 Other factors The bank has now been fenced, reducing the likelihood of stock contributing to the erosion. Nonetheless, there are some locations where the fenceline lies on the channel side of bank erosion (Photo 4 of Appendix 3) and some continued damage from stock is therefore possible. As Titchmarsh says, the salinity of the water in Ford’s Cut before the rediversion meant that limited vegetation would establish. Monitoring done shortly after the rediversion structre was opened indicated that the salinity in the Ford’s Cut had dropped markedly (Environment B·O·P, 1996). Perhaps as a result, some vegetation is now present (gorse, toe-toe, grasses) on the bank, providing some limited protection. Note however, as a toe-toe plant, for example, is undermined, the roots of the toe-toe can bring a clump of bank down with it (Photo 8, Appendix 3). Also, regardless of the water salinity, the relatively exposed coastal environment will always limit the growth of riparian vegetation.
4.6 Flood Risk
The land to the north of Ford’s Cut is not stopbanked and is therefore unprotected from high levels in the Estuary/cut. The top of the bank is around 2m RL while the land behind it is land is typically less than RL 1m (1986 survey data). Lidar data are expected in March 2008 and will provide a better indication of bank and floodplain heights. Recent modelling indicates that, under present day sea levels (i.e. no climate change), 20 year return period flood levels in Ford’s Cut less are than 2m RL and 100 year return period levels are around 2.1m RL. These would be more likely to be events dominated by high sea levels rather than river flooding. Note that the 1962 flood photo shows the area apparently unaffected by floodwaters, but it is possible that with drainage since, the land has subsided.
3 NIWA website http://www.niwa.co.nz/services/tides
Fords Cut January 2008
11
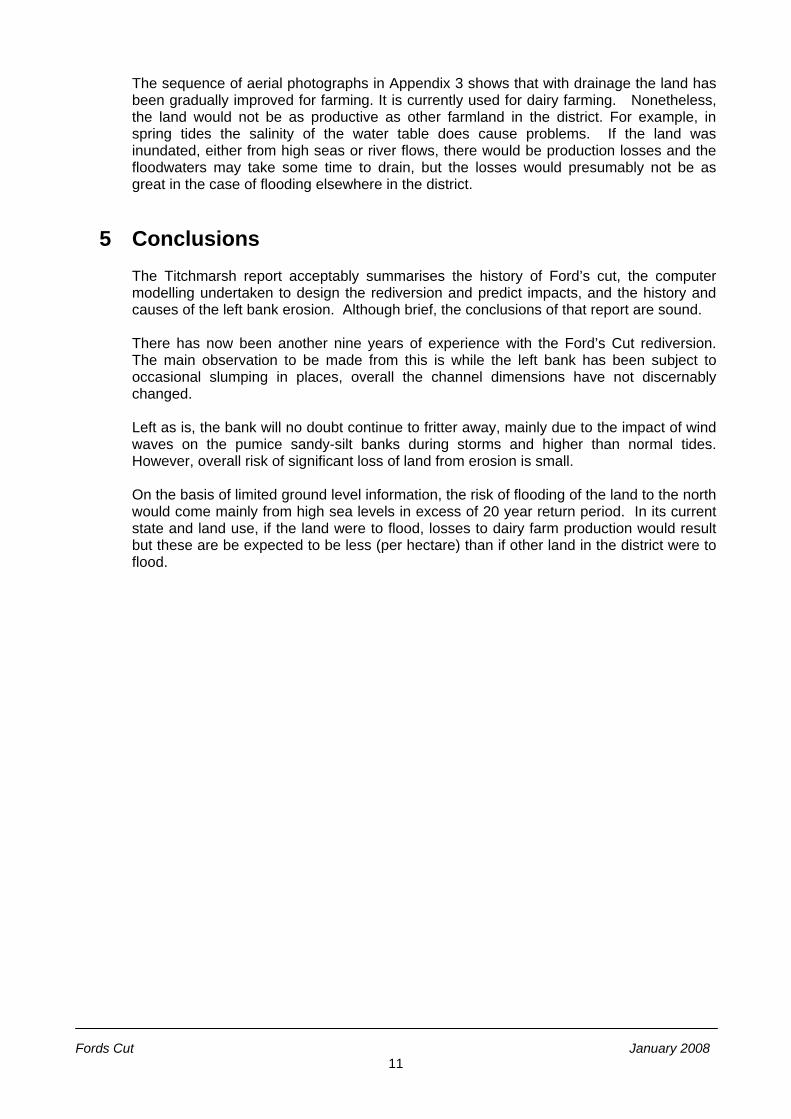
The sequence of aerial photographs in Appendix 3 shows that with drainage the land has been gradually improved for farming. It is currently used for dairy farming. Nonetheless, the land would not be as productive as other farmland in the district. For example, in spring tides the salinity of the water table does cause problems. If the land was inundated, either from high seas or river flows, there would be production losses and the floodwaters may take some time to drain, but the losses would presumably not be as great in the case of flooding elsewhere in the district.
5 Conclusions The Titchmarsh report acceptably summarises the history of Ford’s cut, the computer modelling undertaken to design the rediversion and predict impacts, and the history and causes of the left bank erosion. Although brief, the conclusions of that report are sound. There has now been another nine years of experience with the Ford’s Cut rediversion. The main observation to be made from this is while the left bank has been subject to occasional slumping in places, overall the channel dimensions have not discernably changed. Left as is, the bank will no doubt continue to fritter away, mainly due to the impact of wind waves on the pumice sandy-silt banks during storms and higher than normal tides. However, overall risk of significant loss of land from erosion is small. On the basis of limited ground level information, the risk of flooding of the land to the north would come mainly from high sea levels in excess of 20 year return period. In its current state and land use, if the land were to flood, losses to dairy farm production would result but these are be expected to be less (per hectare) than if other land in the district were to flood.

Fords Cut January 2008
12
References
Bay of Plenty Catchment Commission (1970); Kaituna River Major Scheme.
Commission for the Environment (1984); Maketu Estuary: Environmental Issues and Options. Issues and Options Paper 1984/1, compiled by Philip Tortell.
Environment B·O·P (1996); Impact Report: Re-diversion of the Kaituna River to Maketu Estuary.
Environment Report 96/11, prepared by John McIntosh and Stephen Park. Environment B·O·P (1997); Kaituna Gaugings. File note from Shane Iremonger, 21 August 1997.
File Reference 1370 02 2636. Environment Bay of Plenty (2003); Kaituna Asset Management Plan. Operations Report 2003/09.
Prepared by Philip Wallace. Murray, Andrew (1951); Report on Comprehensive Flood Protection and Drainage Scheme.
Prepared for Kaituna River Board, 31 October 1951. Paterson v Bay of Plenty Regional Council and the Minister of Conservation. Planning Tribunal
TCP 637/91. Bollard J, Decision A 5/94 7 February 1994. Stokes, Evelyn (1980); A History of Tauranga County. Dunmore Press. Titchmarsh, Ross. (1993); Evidence of B. R. Titchmarsh to the Planning Tribunal (TCP 637/91) in
the Matter of the Water and Soil Conservation Act 1967 and in the Matter of an appeal under s25 of the Act between D.C. Paterson and Bay of Plenty Regional Council and the Minister of Conservation.
Titchmarsh, Ross. (1998); Bank Erosion: Ford’s Cut, Maketu. Draft report prepared for
Department of Conservation. Wallace, Philip (2002); Estimate of Cost of Closing Te Tumu Mouth and Rediverting Full Kaituna
Flow Through Maketu Estuary. Report prepared for Environment Bay of Plenty, October 2002.
Wallace, Philip (2007); Rediversion of Kaituna River into Maketu Estuary: Hydraulic Modelling and
Costing. Report prepared for Environment Bay of Plenty, June 2007. Wildlands Consultants (2007); Vegetation and Habitat Types of the Lower Kaituna River, Western
Bay of Plenty. Contract Report 1281, prepared for Environment Bay of Plenty. Wilkinson, B.W. (1991); Submission on Water Right Application No. 2636 by the Minister of
Conservation to divert natural water into Maketu Estuary.

Fords Cut January 2008
13
Appendix 1 – Study Brief

Fords Cut January 2008
14
Appendix 2 – Photographs
19 December 2007 Photo 1 Gates fully open, falling tide, just after high tide Photo 2 Flow in channel

Fords Cut January 2008
15
Photo 3 Left bank material (pen for scale) Photo 4 Erosion extending beyond fenceline

Fords Cut January 2008
16
Photo 5 Isolated older rock protection. Grass-like vegetation establishing on beach. Note debris line indicating recent highwater mark Photo 6

Fords Cut January 2008
17
August 2007 Photo 7 Photo 8 Toe-toe collapsing with bank

Fords Cut January 2008
18
Appendix 3 Aerial/Oblique Historic Plan and Photos
1902 survey, showing the old river loop (blocked off and bypassed in 1979) and the Papahikiwai Channel, prior to Ford’s Cut

Fords Cut January 2008
19
1948 13 November 1959
Fords Cut January 2008
20
1962 (Flood) 1977 (Oblique)

Fords Cut January 2008
21
1988 (Oblique) 15 October 1994 (area to west not flown)

Fords Cut January 2008
22
22 April 1996 c2000/2001

Fords Cut January 2008
23
2003 2007