Embed Size (px)
DESCRIPTION
Forces Driving Wind Power Development. Pat Walsh UW-Madison/Extension Focus on Energy Program. Drivers for Wind Power. Fuel Price Uncertainty Energy Security Federal and State Policies Economic Development Green Power Declining Wind Costs. US Escalating Energy Use. - PowerPoint PPT Presentation
Citation preview

Forces Driving Wind Power Development
Pat WalshUW-Madison/Extension
Focus on Energy Program

Drivers for Wind Power
Fuel Price Uncertainty
Energy Security Federal and State
Policies Economic
Development Green Power Declining Wind Costs
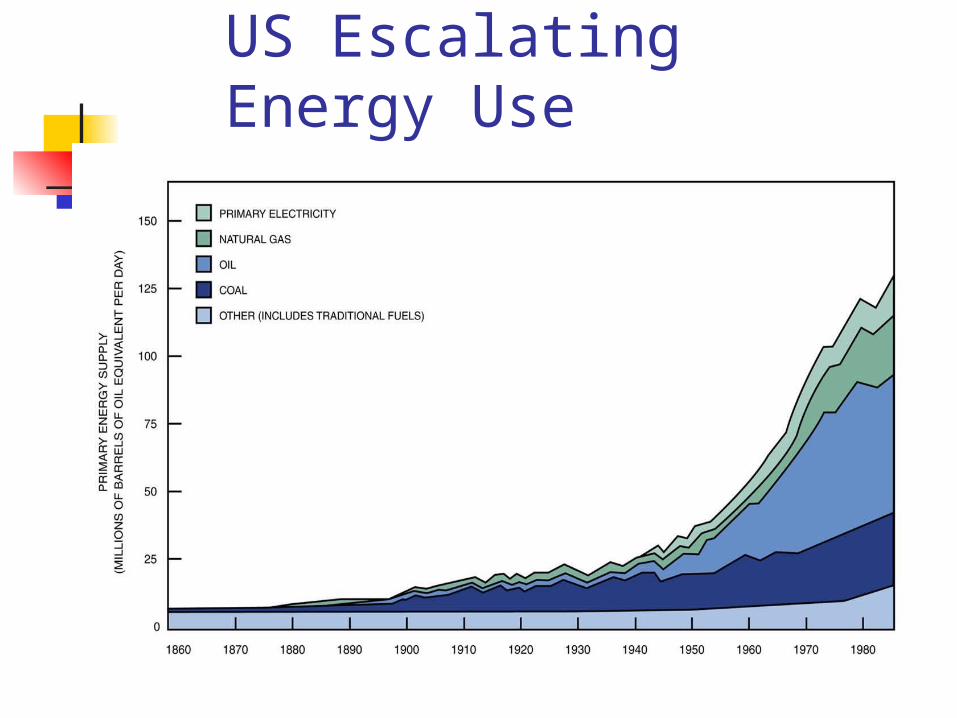
US Escalating Energy Use
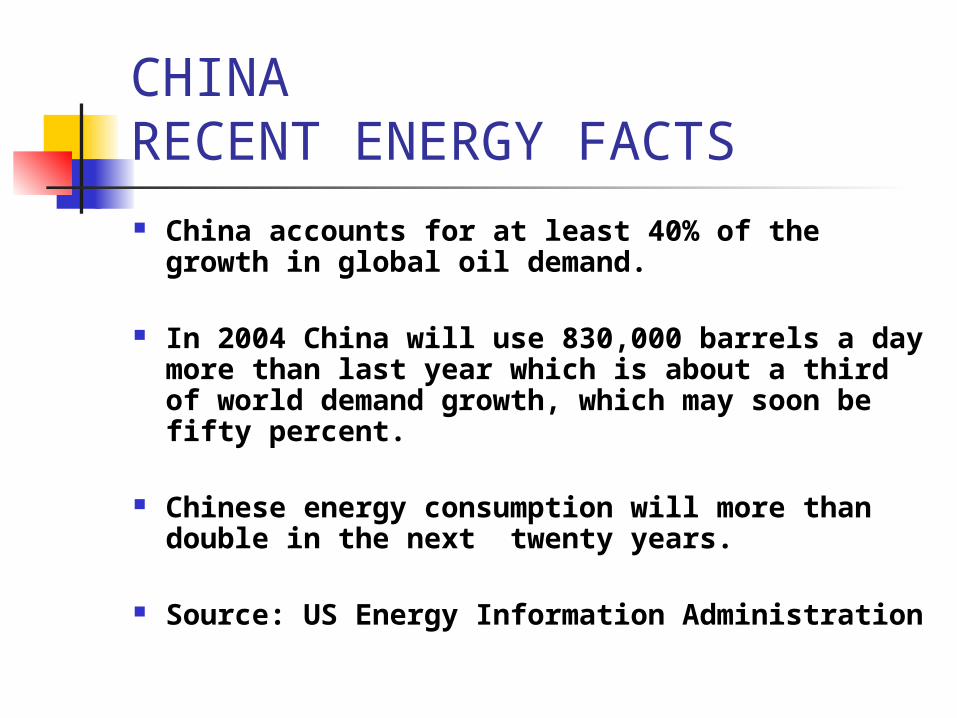
CHINARECENT ENERGY FACTS China accounts for at least 40% of the growth
in global oil demand.
In 2004 China will use 830,000 barrels a day more than last year which is about a third of world demand growth, which may soon be fifty percent.
Chinese energy consumption will more than double in the next twenty years.
Source: US Energy Information Administration

Energy Security Issues Are Growing
Three quarters of the world’s known petroleum reserves are in the Middle East
Most of these are in three countries Saudi Arabia Iran Iraq
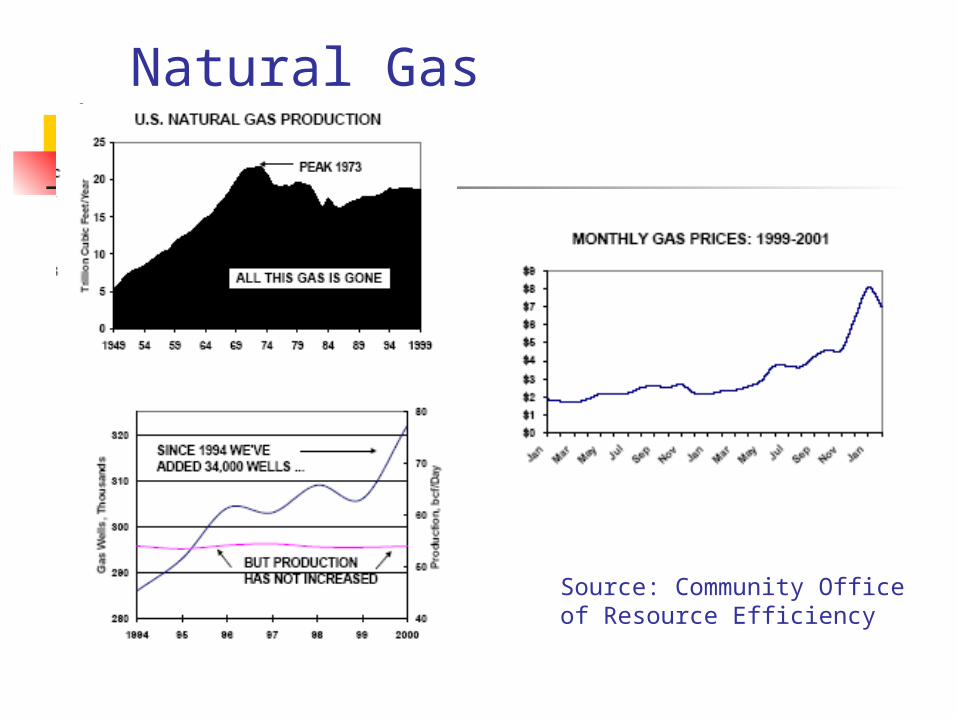
Natural Gas
Source: Community Office of Resource Efficiency
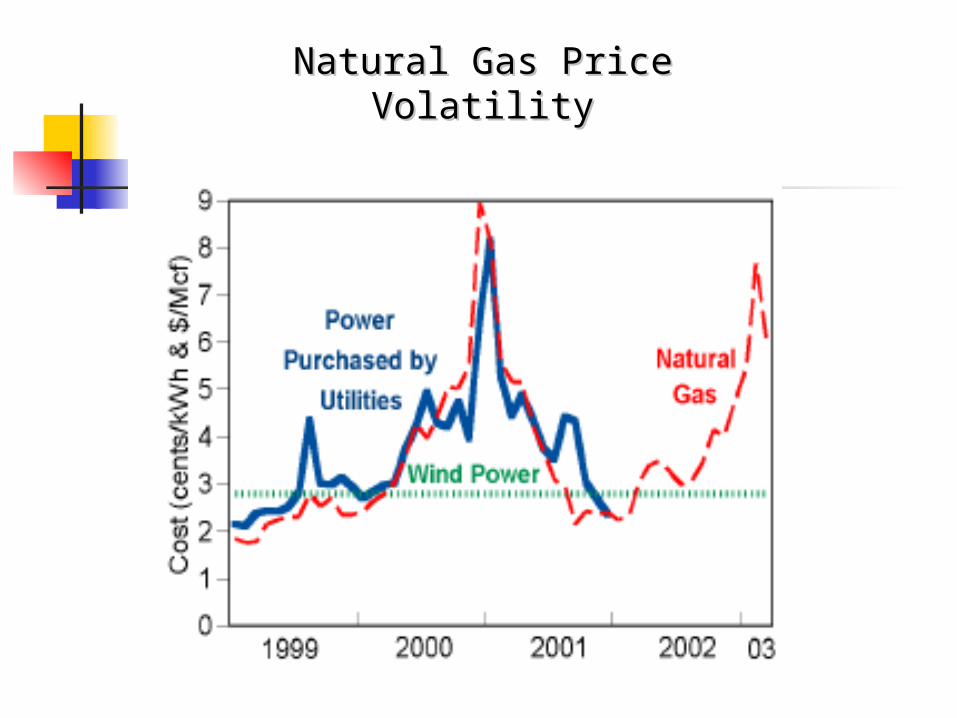
Natural Gas Price VolatilityNatural Gas Price Volatility

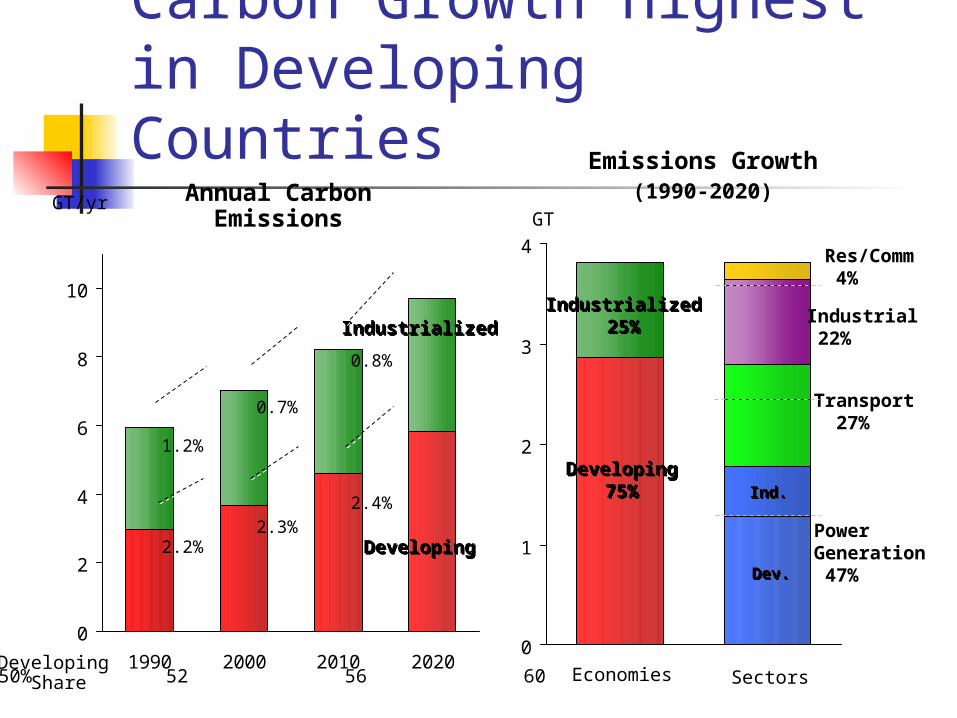
Carbon Growth Highest in Developing Countries
0
2
4
6
8
10
1990 2000 2010 2020
GT/yr
DevelopingDeveloping
IndustrializedIndustrialized
Annual Carbon Emissions
0
1
2
3
4GT
Emissions Growth(1990-2020)
Transport 27%
Power Generation 47%
Res/Comm 4%
Ind.Ind.
Economies Sectors
Developing75%
Developing75%
Industrialized25%
Industrialized25%
Dev.Dev.
Industrial 22%
2.2%
2.4%2.3%
1.2%
0.8%
0.7%
Developing Share 50% 52 56 60
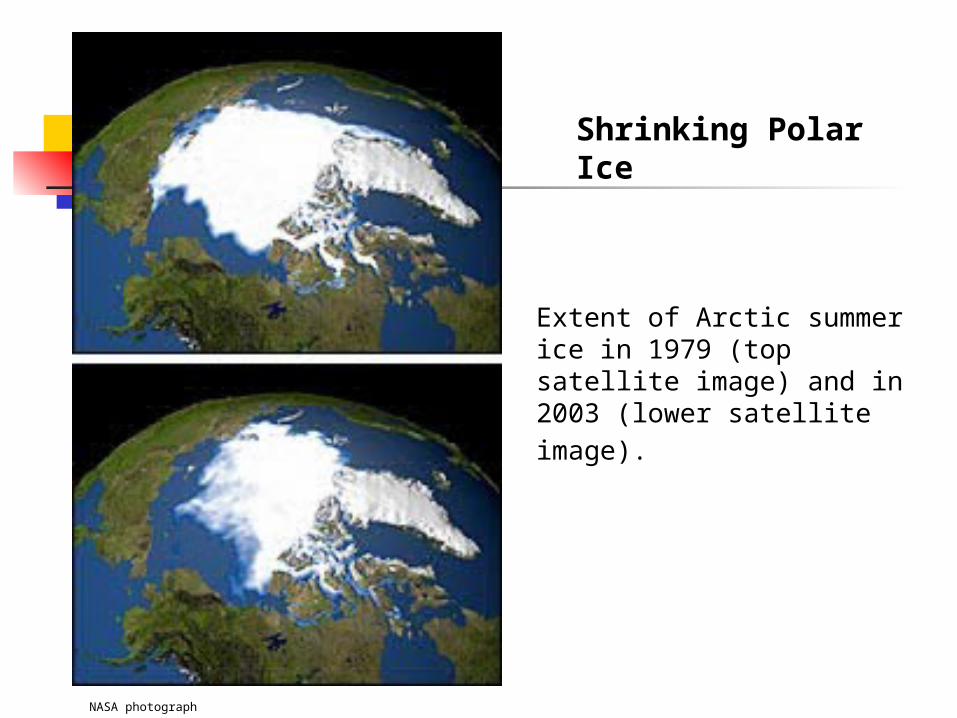
NASA photograph
Extent of Arctic summer ice in 1979 (top satellite image) and in
2003 (lower satellite image).
Shrinking Polar Ice

The Energy Policy Act of 2005Public Law 109-58

Renewable Depreciation Deductions
Businesses can recover investments in solar, wind and geothermal property through depreciation deductions under the Modified Accelerated Cost-Recovery System (MACRS)
For solar, wind and geothermal property placed in service after 1986, the terms are five years.

Renewable Electricity Production Tax Credit Provides a business tax credit of 1.5
cents/kWh, adjusted annually for inflation, for electricity generated by wind, closed-loop biomass and geothermal (1.9 cents/kWh adjusted for 2005)
Electricity generated from open-loop biomass, small irrigation hydroelectric, landfill gas, municipal solid waste resources and hydropower receive half that rate (currently 0.9 cents/kWh).
Available through December 31, 2007 for renewables

Renewable Energy Production Incentive New qualifying renewable energy generation
facilities eligible for annual incentive payments of 1.5 cents/kWh for the first 10 years of operation.
Qualifying facilities must use Solar Wind Geothermal Biomass Landfill gas Livestock refuse Ocean generation technologies (tidal, wave, current and
thermal) Fuel cells using hydrogen derived from eligible biomass
facilities

2005 Wisconsin Act 141
Renewable Portfolio Standard- requires utilities to generate 10% of their power from renewable energy by 2015
Requires state government to use renewable energy 10% by 2007 20% by 2012
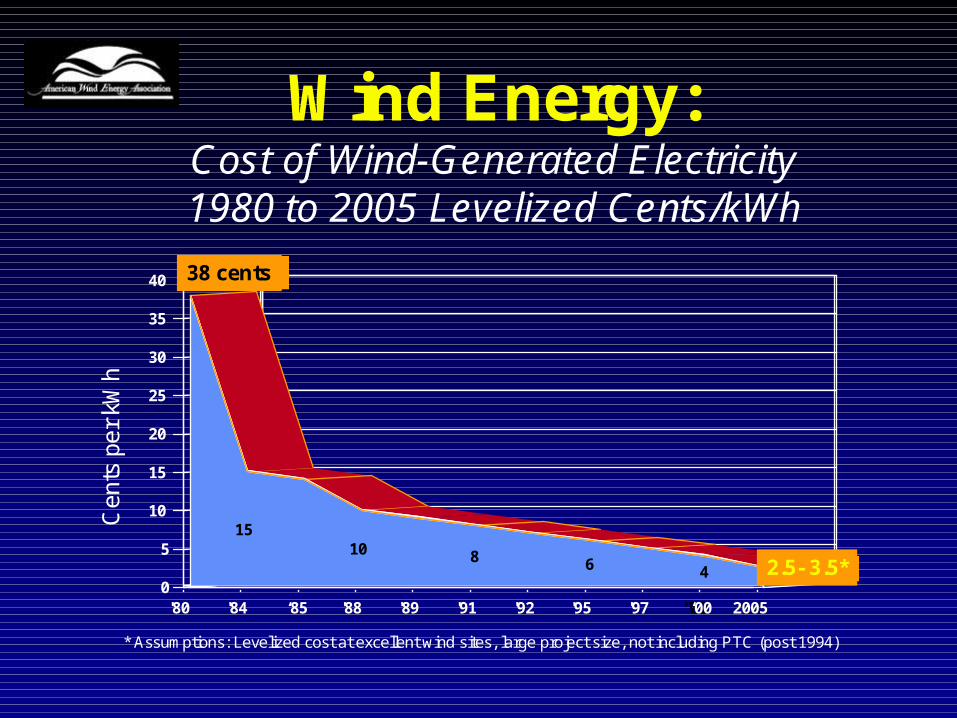
Wind Energy:Cost of Wind-Generated Electricity1980 to 2005 Levelized Cents/kWh
Cen
ts p
er k
Wh
'80 '84 ‘85 '88 '89 '91 '92 '95 '97 ''00 2005
1510 8 6 4 2.5- 3.5*
38 cents
0
5
10
15
20
25
30
35
40
'80 '84 '88 '89 '91 '92 '95 '97 ‘00 2005
* Assumptions: Levelized cost at excellent wind sites, large project size, not including PTC (post 1994)
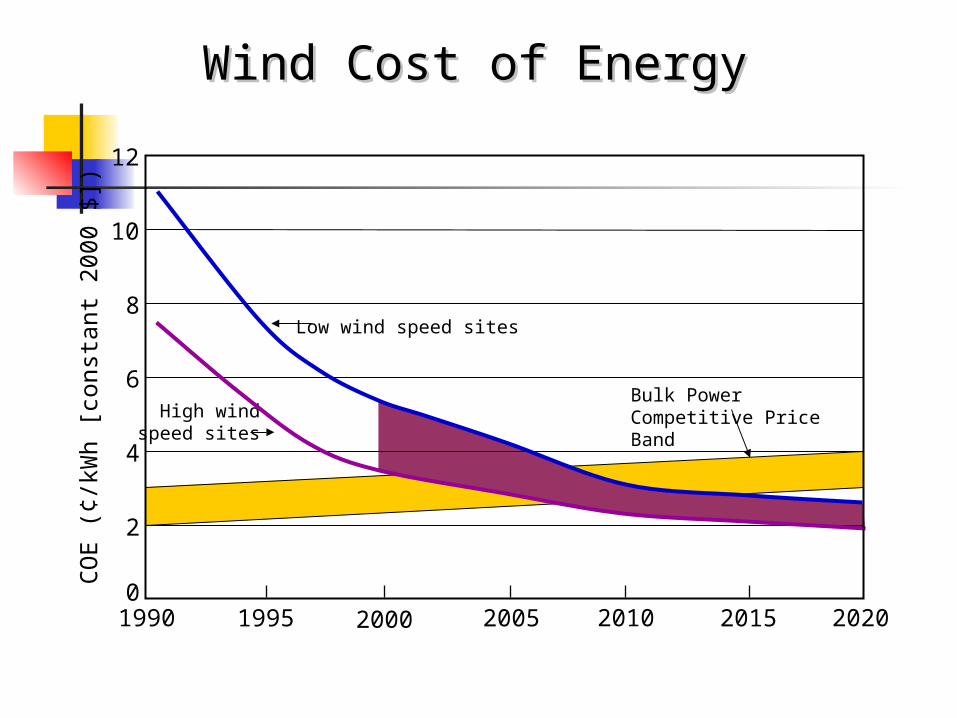
Wind Cost of EnergyWind Cost of Energy
0
2
4
6
8
10
12
1990
CO
E (
¢/kW
h [c
onst
ant
2000
$])
Low wind speed sites
1995 2000 2005 2010 2015 2020
High windspeed sites
Bulk Power Competitive Price Band
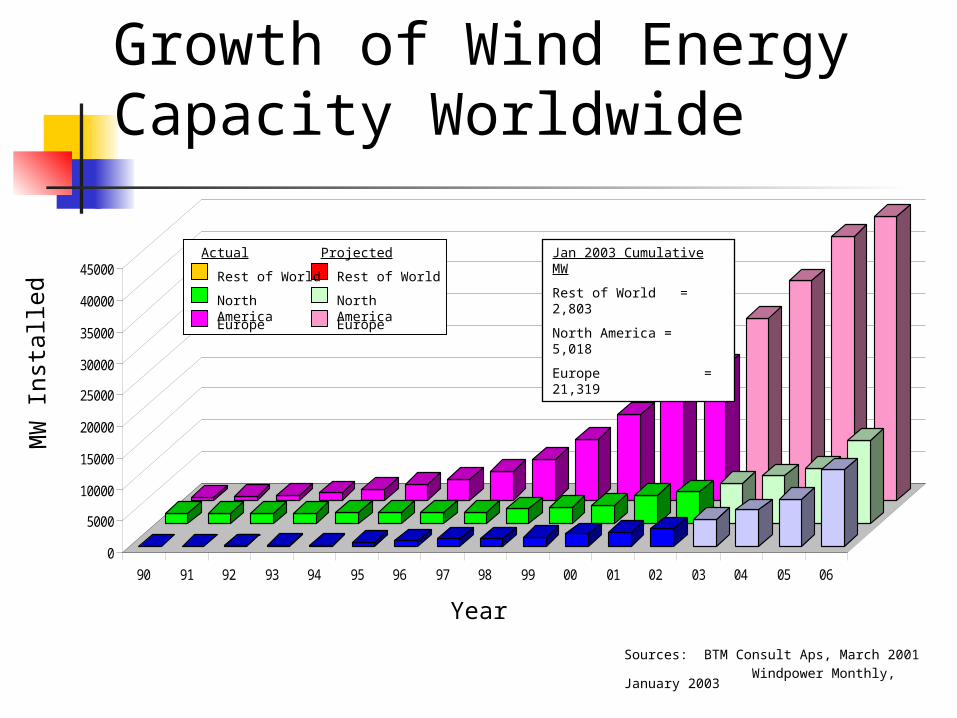
Growth of Wind Energy Capacity Worldwide
0
5000
10000
15000
20000
25000
30000
35000
40000
45000
90 91 92 93 94 95 96 97 98 99 00 01 02 03 04 05 06
MW
Ins
talle
d
Year
Jan 2003 Cumulative MW
Rest of World = 2,803
North America = 5,018
Europe = 21,319
Sources: BTM Consult Aps, March 2001
Windpower Monthly, January 2003
Actual Projected
Rest of World Rest of World
North America North America
Europe Europe
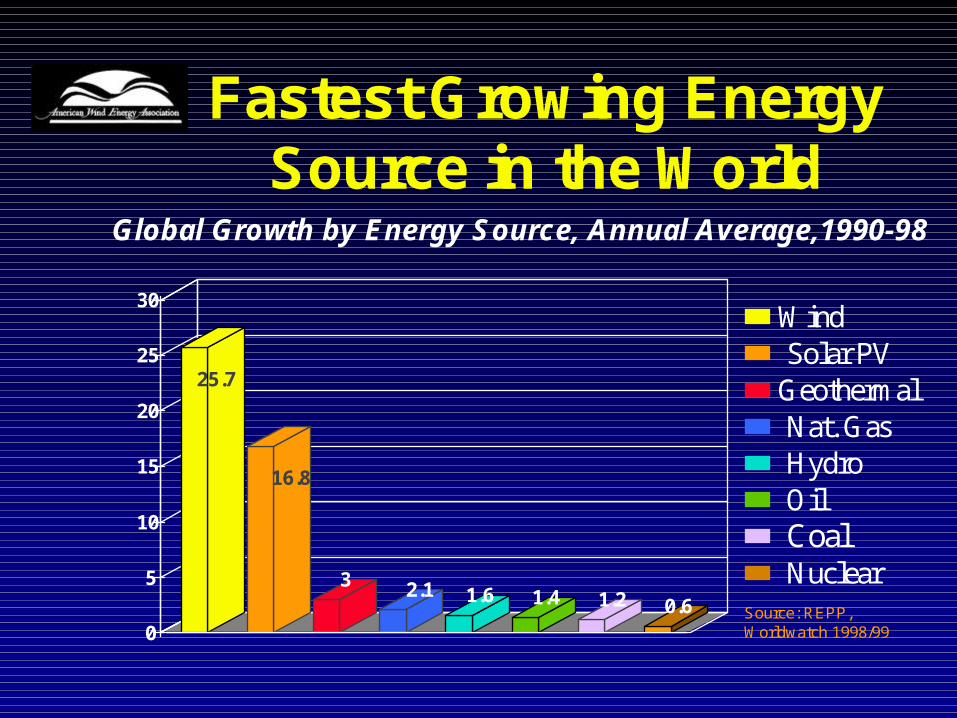
Fastest Growing EnergySource in the World
Global Growth by Energy Source, Annual Average,1990-98
25.7
16.8
3 2.1 1.6 1.4 1.2 0.60
5
10
15
20
25
30
Source: REPP,Worldwatch 1998/99
Nuclear
WindSolar PV
GeothermalNat. GasHydroOilCoal
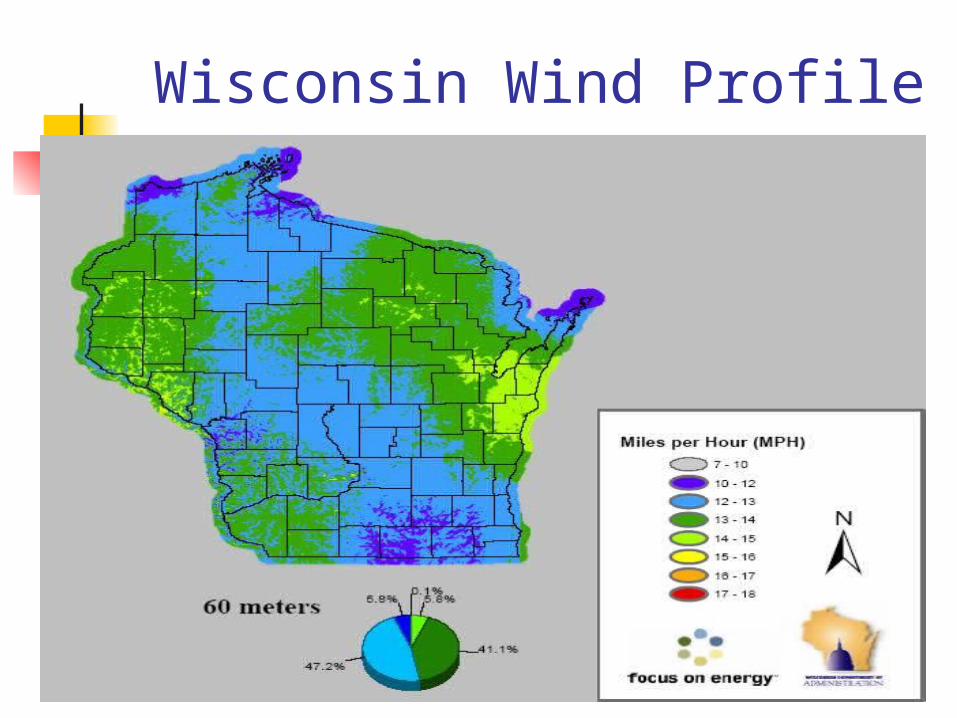
Wisconsin Wind Profile
Conclusion
Many forces driving wind development
Some areas of Northwest Wisconsin may be a good places for wind development
Now is a good time for communities and citizens to learn about this technology