Embed Size (px)
Citation preview

Forced Liquidations, Fire Sales, and the Cost of Illiquidity Richard R. Lindsey & Andrew B. Weisman Q Group October, 18, 2015
This presentation is for information purposes only and should not be used or construed as an offer to sell, a solicitation of an offer to buy, or a recommendation for any security. There is no guarantee that the information supplied is accurate, complete, or timely, nor does it make any warranties with regards to the results obtained from its use. It is not intended to indicate or imply in any manner that current or past results are indicative of future profitability or expectations. As with all investments, there are inherent risks that individuals would need to consider. The views expressed are those of the speaker and do not necessarily reflect the views of others in the Janus organization. This material may not be reproduced in whole or in part in any form, or referred to in any other publication, without express written permission. Janus is a registered trademark of Janus International Holding LLC. © Janus International Holding LLC.
FOR INSTITUTIONAL INVESTOR USE ONLY / NOT FOR PUBLIC VIEWING OR DISTRIBUTION C-0615-93030 08-30-15 399-15-31000 06-15
Once Upon a Time…
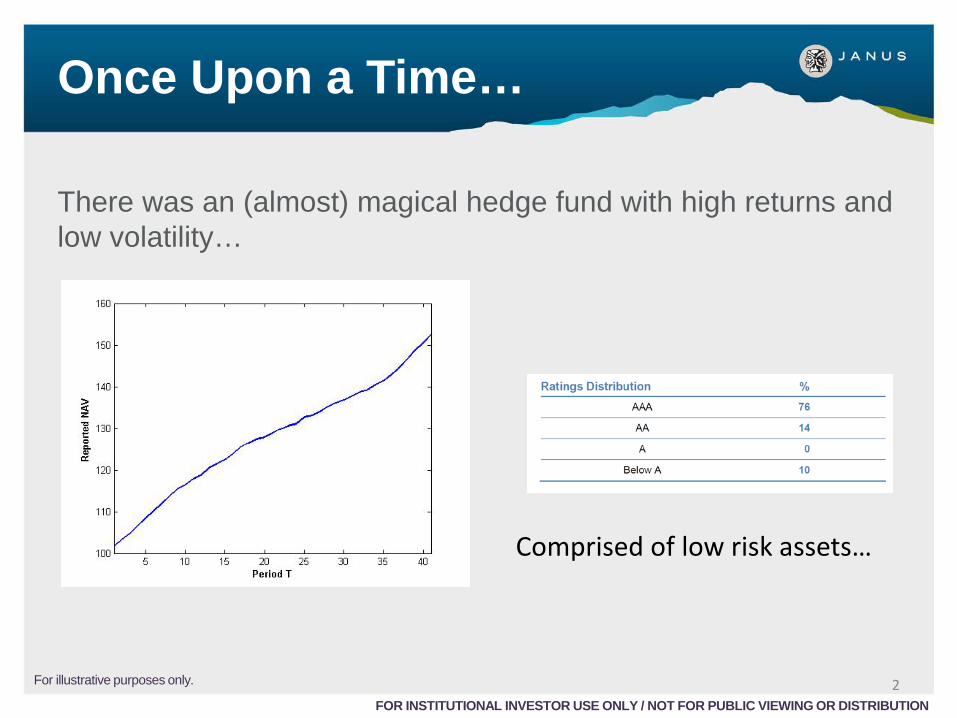
There was an (almost) magical hedge fund with high returns and low volatility…
Comprised of low risk assets…
2 FOR INSTITUTIONAL INVESTOR USE ONLY / NOT FOR PUBLIC VIEWING OR DISTRIBUTION
For illustrative purposes only.

Once Upon a Time…
But subprime mortgage delinquencies grew, and the value of securities held by the fund dropped…
3 FOR INSTITUTIONAL INVESTOR USE ONLY / NOT FOR PUBLIC VIEWING OR DISTRIBUTION
For illustrative purposes only.

Once Upon a Time…
But asset values continued to decline quickly while collateral requirements continued to rise…
4 FOR INSTITUTIONAL INVESTOR USE ONLY / NOT FOR PUBLIC VIEWING OR DISTRIBUTION
For illustrative purposes only.
The Prime Brokers for the fund asked for more cash collateral…
The fund tried to liquidate assets in a declining market to meet the collateral calls…

Once Upon a Time…
The fund failed even though its parent company attempted to stabilize it with a substantial cash injection…
5 FOR INSTITUTIONAL INVESTOR USE ONLY / NOT FOR PUBLIC VIEWING OR DISTRIBUTION
For illustrative purposes only.
Investors were returned 9₵ on the dollar…
And the managers lived happily ever after…

Portfolio Construction
Typical approach is to diversify across securities and strategies, using the common “currencies”
Return Volatility Correlation
6 FOR INSTITUTIONAL INVESTOR USE ONLY / NOT FOR PUBLIC VIEWING OR DISTRIBUTION
Consequences
Looking for low correlation and low volatility Low volatility and correlation often an “accounting artifact” Drawn to securities with limited price discovery
Investors tend to believe in a “liquidity premium” that compensates them for illiquidity

Liquidity in Portfolios
Lo, et al (2003) Add liquidity as additional constraint in mean-variance optimization
Seigel (2008); Leibowitz & Bova (2009)
Consider liquidity in determining portfolio weights
Ang, et al (2011)
Optimal liquidity policy with market frictions
Kinlaw, et al (2013)
Liquidity as a shadow allocation in the portfolio
7 FOR INSTITUTIONAL INVESTOR USE ONLY / NOT FOR PUBLIC VIEWING OR DISTRIBUTION

Serial Correlation & Liquidity
Illiquid portfolios tend to exhibit a high degree of positive serial correlation (Weisman (2003); Getmansky et al (2004))
Methods: Scholes & Williams (1977); Geltner (1993); Getmansky, et al (2004); Bollen & Poole (2008); Anson (2010); Anson (2013)
The Geltner Method:
𝜎 =1 − 𝜌𝑠 1
𝑜𝑜
1 − 𝜌𝑠 1𝑜 𝑜 𝜎𝑜𝑜
Adjust the time series for serial correlation Decode the performance to adjust volatility and correlations
8
FOR INSTITUTIONAL INVESTOR USE ONLY / NOT FOR PUBLIC VIEWING OR DISTRIBUTION

Illiquidity: The Cost is Ignored
Primary Question: Are under-reported volatility and correlation a benign consequence of illiquidity or is there more to it?
9 FOR INSTITUTIONAL INVESTOR USE ONLY / NOT FOR PUBLIC VIEWING OR DISTRIBUTION
What should concern you most as an investor?
We argue that simply adjusting for serial correlation fails to measure or capture the core risk and cost of illiquidity that investors should care about: forced liquidations and “fire sales”

Causes of Illiquidity A mismatch between the funding of an underlying investment and the horizon over which the investment can be sold
Leverage/Financing: (Garleanu & Pedersen (2009); Brunermeier & Pedersen (2009); Office of Financial Research (2013))
– Including swaps, futures, margin
Contractual terms: (Ang & Bollen (2010))
– Gates, lock ups, notice periods
Network factors:(Battacharya, et al (2013); Gennaioli, et al (2012); Boyson, et al (2010); Mitchell, et al (2007); Chen, et al (2012); Schmidt, et al (2013))
– Common service providers (custodians, prime brokers, securities lending counterparties)
– Unanticipated strategy correlation – Common investors
10
FOR INSTITUTIONAL INVESTOR USE ONLY / NOT FOR PUBLIC VIEWING OR DISTRIBUTION

Liquidity & Reality
The true value of the portfolio assumed to follow a discrete Brownian motion:
𝑁𝑡 − 𝑁𝑡−1 = 𝑁𝑡−1𝜇∆𝑡 + 𝑁𝑡−1𝜎𝜀𝑡 ∆𝑡
Illiquidity induces “conservative pricing”
𝑟𝑡𝑜 =λ(𝑁𝑡 − 𝑅𝑡−1)
𝑅𝑡−1
Bayesian process of adjusting some proportion of the distance between prior period’s valuation and what it’s perceived to be worth in the current period (Quan and Quigley (1991))
(One step change) = (Trend Ret) + (Shock)
11 FOR INSTITUTIONAL INVESTOR USE ONLY / NOT FOR PUBLIC VIEWING OR DISTRIBUTION
Liquidity & Reality
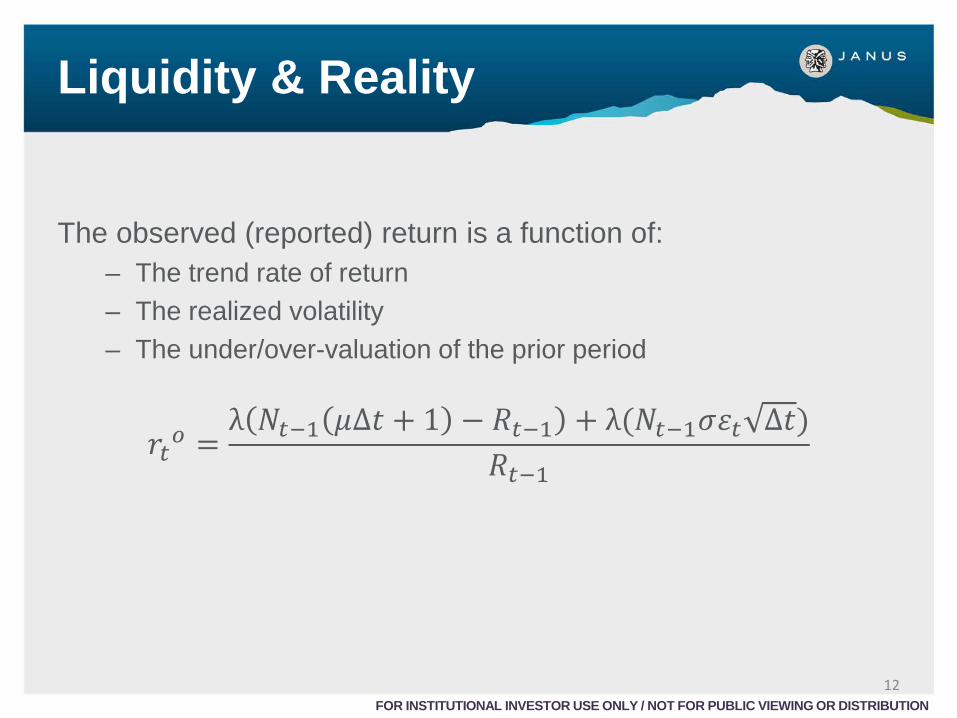
The observed (reported) return is a function of:
– The trend rate of return – The realized volatility – The under/over-valuation of the prior period
𝑟𝑡𝑜 =λ 𝑁𝑡−1 𝜇∆𝑡 + 1 − 𝑅𝑡−1 + λ(𝑁𝑡−1𝜎𝜀𝑡 ∆𝑡)
𝑅𝑡−1
12 FOR INSTITUTIONAL INVESTOR USE ONLY / NOT FOR PUBLIC VIEWING OR DISTRIBUTION

Liquidity & Reality
The expected observed return is:
𝐸[𝑟𝑡𝑜] =
λ(𝑁𝑡−1 − 𝑅𝑡−1) + λ𝑁𝑡−1𝑚∆𝑡𝑅𝑡−1
As λ decreases, portfolio returns become increasingly determined by prior period under/over-valuation; we would expect returns to become increasingly serially correlated. A quick, approximate estimate of λ is obtained from the first order autocorrelation of 𝑟𝑡𝑜
λ ≈ 1 − 𝜌𝑠 1 𝑜 (Not the only method for deriving this prior: common sense “sanity checks” also useful…) 13
FOR INSTITUTIONAL INVESTOR USE ONLY / NOT FOR PUBLIC VIEWING OR DISTRIBUTION

Smoothed Value How are 𝑁𝑡 (true value) and 𝑅𝑡(reported value) related?
This portfolio is hypothetical and used for illustration purposes only.
𝜇 = 5% σ = 25% λ = 0.25
14 FOR INSTITUTIONAL INVESTOR USE ONLY / NOT FOR PUBLIC VIEWING OR DISTRIBUTION

Illiquidity systematically drives under/over-valuation Under-valuation not so critical, over-valuation more of an issue:
Interested third parties will not allow a portfolio valuation to exceed a rational tradable value by more than a “reasonable” margin Prime brokers that extend credit, monitor reported valuations as assets serve as collateral We refer to this margin as the “credibility threshold” (L) L effectively determined by the first interested third party such as Prime Brokers or investors to act; NOT THE MANAGER
15 FOR INSTITUTIONAL INVESTOR USE ONLY / NOT FOR PUBLIC VIEWING OR DISTRIBUTION
Smoothed Value

Smoothed Value
L
16 FOR INSTITUTIONAL INVESTOR USE ONLY / NOT FOR PUBLIC VIEWING OR DISTRIBUTION
This example is hypothetical and used for illustration purposes only.

Smoothed Value
Exceeding the credibility threshold triggers forced behavior (selling) May result in a large single period loss governed by:
The portfolio overvaluation (𝑅𝑡 − 𝑁𝑡) A liquidation penalty (𝑃)
Such losses relatively frequent and tend to be larger than conventional data-dependent methods such as VaR or CVaR The magnitude and frequency (not the timing) are reasonably predictable, and can be priced by formalizing the basic structural dynamics
17
FOR INSTITUTIONAL INVESTOR USE ONLY / NOT FOR PUBLIC VIEWING OR DISTRIBUTION

Barrier Option Framework
Simulate the “true” value of portfolio using discrete BM which is a function of:
Observed volatility Observed trend rate of return The valuation lag which can be estimated using λ ≈ (1 − 𝜌𝑠 1 𝑜)
Calculate the individual period differences between the two processes (true & reported processes) When the difference exceeds the assumed credibility threshold apply a payout equal to the over-reporting and the penalty: (𝑅𝑡 − 𝑁𝑡) + (𝑃) Simulate 100k times and calculate the mean NPV of all the one-year paths (including those which do not cause liquidation) This naturally translates into a “haircut” against the observed return and represents a de facto price for investing in a less liquid portfolio
18 FOR INSTITUTIONAL INVESTOR USE ONLY / NOT FOR PUBLIC VIEWING OR DISTRIBUTION

Option Value: 𝑳 & λ
Option Value = $15.54 Implied Adjusted Return = -9.54%
𝜇 = 6% σ = 12% λ = 0.25 𝑟𝑓 = 2% 𝐿 = 15% 𝑃 = 25%
19 FOR INSTITUTIONAL INVESTOR USE ONLY / NOT FOR PUBLIC VIEWING OR DISTRIBUTION
This example is hypothetical and used for illustration purposes only.

Option Value: 𝐏 & λ
20 FOR INSTITUTIONAL INVESTOR USE ONLY / NOT FOR PUBLIC VIEWING OR DISTRIBUTION
This example is hypothetical and used for illustration purposes only.

Option Value: 𝐏 & 𝑳
21 FOR INSTITUTIONAL INVESTOR USE ONLY / NOT FOR PUBLIC VIEWING OR DISTRIBUTION
This example is hypothetical and used for illustration purposes only.

Option Sensitivities
Model Parameter Direction Option Value (Cost)
Serial Correlation
Liquidation Penalty
Credibility Threshold
Mean Return
Volatility
Interest Rate
Frequency of Mark
22 FOR INSTITUTIONAL INVESTOR USE ONLY / NOT FOR PUBLIC VIEWING OR DISTRIBUTION
Additional Considerations The option value is not a liquidity premium, rather it is the calculated cost of price smoothing an illiquid portfolio when combined with a triggering event, that may result in an abrupt sale into a declining market When the portfolio is illiquid, managers generally do not have the flexibility to avoid these dynamics
23 FOR INSTITUTIONAL INVESTOR USE ONLY / NOT FOR PUBLIC VIEWING OR DISTRIBUTION

Parameter Considerations
In cases of fraud or collapse, transactions in the secondary market for hedge funds have an average discount to NAV of 49.6% (Ramadorai (2008))
JPMorgan (2012)
Hedge funds expected return 5% to 7% Hedge funds expected volatility 7% to 13% Private equity expected returns 9% Private equity expected volatility 34.25%
Are these sufficient returns given the volatility?
24 FOR INSTITUTIONAL INVESTOR USE ONLY / NOT FOR PUBLIC VIEWING OR DISTRIBUTION

Pricing Liquidity in Alternative Investments (Indices)
Measured serial correlation for most of these lie in the 50% to 60% range Managers are typically reflecting less than 50% of the true change in the value of their portfolios Depending on assumptions concerning other parameters, the option value could be quite significant! Example: Emerging Market liquidity option: 13.52% Observed return: 17.3%, Liquidity-adjusted return: 3.78%
25 FOR INSTITUTIONAL INVESTOR USE ONLY / NOT FOR PUBLIC VIEWING OR DISTRIBUTION

Pricing Liquidity in Alternative Investments (Funds) Morningstar- CISDM Hedge Fund Database (contains both live and dead funds)
Eliminated CTAs and Fund of Funds At least 24 months of return history Autocorrelation of 0.01 or higher Eliminate the last 3 months of data for each manager
3,554 hedge funds 𝑟𝑓 = 5% 𝐿 = 15% 𝑃 = 25%
𝜇 = 11.79% 𝜎 = 13.88% 𝜌𝑠(1)𝑜 = .2032
Average Option value was 5.52% Implying an average Liquidity-adjusted mean return of 6.27%
26 FOR INSTITUTIONAL INVESTOR USE ONLY / NOT FOR PUBLIC VIEWING OR DISTRIBUTION

Pricing Liquidity in Alternative Investments (Funds)
27 FOR INSTITUTIONAL INVESTOR USE ONLY / NOT FOR PUBLIC VIEWING OR DISTRIBUTION

Option Values vs Drawdowns
28 FOR INSTITUTIONAL INVESTOR USE ONLY / NOT FOR PUBLIC VIEWING OR DISTRIBUTION
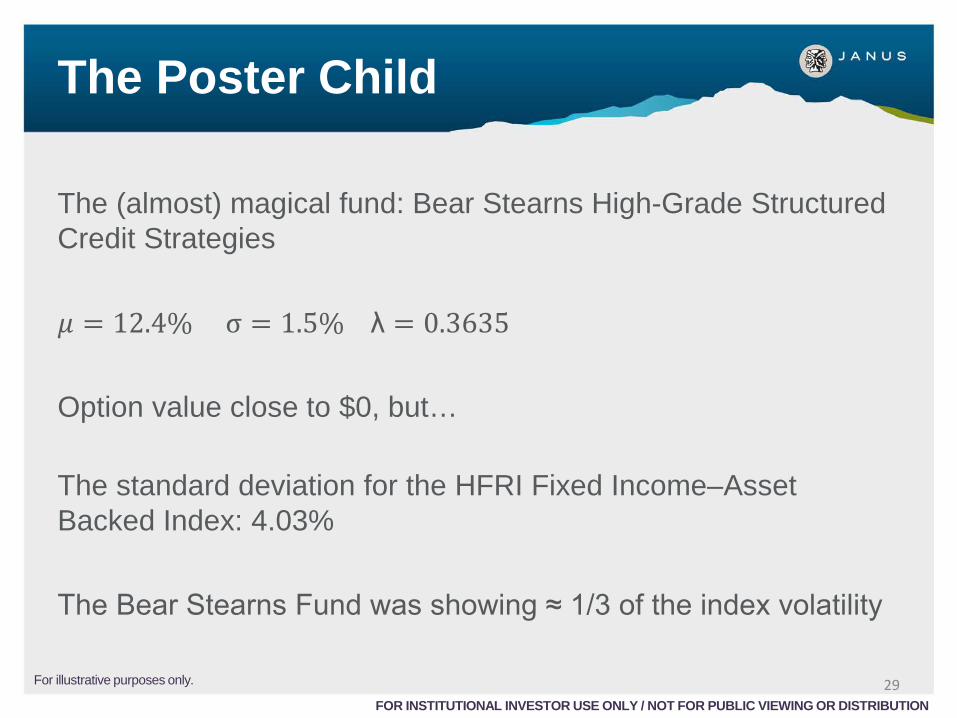
The Poster Child The (almost) magical fund: Bear Stearns High-Grade Structured Credit Strategies 𝜇 = 12.4% σ = 1.5% λ = 0.3635 Option value close to $0, but… The standard deviation for the HFRI Fixed Income–Asset Backed Index: 4.03% The Bear Stearns Fund was showing ≈ 1/3 of the index volatility
29 FOR INSTITUTIONAL INVESTOR USE ONLY / NOT FOR PUBLIC VIEWING OR DISTRIBUTION
For illustrative purposes only.

The Poster Child As the fund’s volatility approached the index volatility, the option cost exploded
30 FOR INSTITUTIONAL INVESTOR USE ONLY / NOT FOR PUBLIC VIEWING OR DISTRIBUTION
For illustrative purposes only.

Summary & Conclusion
Adjusting for serial correlation fails to measure or capture the core risk and cost of illiquidity: forced liquidations and “fire sales” A barrier option model provides a straight-forward method of combining priors about the market to price this core risk
31 FOR INSTITUTIONAL INVESTOR USE ONLY / NOT FOR PUBLIC VIEWING OR DISTRIBUTION

Questions
32