Embed Size (px)
Citation preview

Force detection, center of pressure tracking, and energy harvesting from a piezoelectric knee implant
Mohsen Safaei1, R. Michael Meneghini2, and Steven R. Anton1
1Department of Mechanical Engineering, Tennessee Technological University, Cookeville, TN 38505 USA
2Department of Orthopaedic Surgery, Indiana University School of Medicine, Indianapolis, IN 46202 USA
Abstract
Recent developments in the field of orthopedic materials and procedures have made the total knee
replacement (TKR) an option for people who suffer from knee diseases and injuries. One of the
ongoing debates in this area involves the correlation of postoperative joint functionality to
intraoperative alignment. Due to a lack of in vivo data from the knee joint after surgery, the
establishment of a well-quantified alignment method is hindered. In order to obtain information
about knee function after the operation, the design of a self-powered instrumented knee implant is
proposed in this study. The design consists of a total knee replacement bearing equipped with four
piezoelectric transducers distributed in the medial and lateral compartments. The piezoelectric
transducers are utilized to measure the total axial force applied on the tibial bearing through the
femoral component of the joint, as well as to track the movement in the center of pressure (CoP).
In addition, the generated voltage from the piezoelectrics can be harvested and stored to power
embedded electronics for further signal conditioning and data transmission purposes. Initially,
finite element (FE) analysis is performed on the knee bearing to select the best location of the
transducers with regards to sensing the total force and location of the CoP. A series of
experimental tests are then performed on a fabricated prototype which aim to investigate the
sensing and energy harvesting performance of the device. Piezoelectric force and center of
pressure measurements are compared to actual experimental quantities for twelve different relative
positions of the femoral component and bearing of the knee implant in order to evaluate the
performance of the sensing system. The output voltage of the piezoelectric transducers is
measured across a load resistance to determine the optimum extractable power, and then rectified
and stored in a capacitor to evaluate the realistic energy harvesting ability of the system. The
results show only a small level of error in sensing the force and the location of the CoP.
Additionally, a maximum power of 269.1 μW is achieved with a 175 kΩ optimal resistive load, and
a 4.9 V constant voltage is stored in a 3.3 mF capacitor after 3333 loading cycles. The sensing and
energy harvesting results present the promising potential of this system to be used as an integrated
self-powered instrumented knee implant.
HHS Public AccessAuthor manuscriptSmart Mater Struct. Author manuscript; available in PMC 2019 November 01.
Published in final edited form as:Smart Mater Struct. 2018 November ; 27(11): . doi:10.1088/1361-665X/aad755.
Author M
anuscriptA
uthor Manuscript
Author M
anuscriptA
uthor Manuscript
Keywords
Total knee replacement; piezoelectric sensing; energy harvesting; orthopedic implant; biomedical sensors
1. Introduction
Significant improvements in surgical technologies have made Total Knee Replacement
(TKR) an option for those who suffer from pain or loss of function in the knee. Today,
despite recent developments, only about 80% of patients that undergo TKR are satisfied with
their surgery in terms of pain relief and function for daily activities [1]. It was shown in 1986
that several factors, such as alignment of extremities and prosthetic components, and
ligament tensioning, can cause prosthetic loosening after surgery [2]. Recent studies still
report loosening and instability as some of the major reasons for knee failure a few years
after the operation [3]. Today, an objective and well-accepted measure of knee joint stability
does not exist and better clinical assessments are needed in order to develop such a measure
[4]. There are proven methods for bone alignment and knee implant component position, but
ligament alignment and tensioning is still mostly performed based on the assessment of the
surgeon’s tactile feedback. It has been predicted that about 40% of early knee failures can be
avoided using proper fixation and ligament balancing during surgery [5]. Although the
importance of balance has been proven, the lack of in vivo data has limited the establishment
of a correlation between intra- and postoperative loading condition, and alignment is
currently not well-quantified [6].
In order to predict the functionality of the knee joint after surgery, the use of computational
modeling has been suggested. However, postoperative interactions between articular
geometries, passive ligamentous constrains, and muscle contribution is not well-defined. The
most promoted limitations of current simulations to predict the loading condition of daily
activities are oversimplified passive soft tissue representations and lack of data from joint
balance after surgery [7]. In an effort to obtain postoperative data from knee replacements,
an intelligent remote monitoring system was proposed by Masyib et al. [8]. The system
consisted of a master and slave sensor attached with straps to the top and bottom of the knee
joint to measure the relative flexion between the femur and tibia during daily activities.
Using a modem and GSM network, data can be transmitted to the clinic’s server to evaluate
the progression and regression of the knee based on the attainable degree of flexion. The
data collected with this instrumentation mostly helps physiotherapists track the external
functionality of the knee but it cannot provide postoperative in vivo measurements.
D’lima et al., as one of the pioneering groups working on in-vivo knee force and moment
measurement, presented an instrumented tibial tray using 4 load cells powered by an
external coil around the patient’s knee [9]. The device presented by Heinlein et al. [10] was
the first attempt to develop an in-vivo system capable of six force and moment component
measurements. The device consisted of 6 strain gauges and a telemetry system located in the
stem of a two-piece tibial component with an external coil as the power source, resulting in
an overall thickness increase of the tibial tray of 5 mm. The results of tibiofemoral force
Safaei et al. Page 2
Smart Mater Struct. Author manuscript; available in PMC 2019 November 01.
Author M
anuscriptA
uthor Manuscript
Author M
anuscriptA
uthor Manuscript

measurement obtained postoperatively from implanted devices designed by both D’lima and
Heinlein present a good fit with modeling simulation results for normal function of the knee
[9, 10]. In another study, Crescici et al. [11] presented a new design for an instrumented
polyethylene bearing with 3 magnetoresistive sensors and an embedded wireless data
transmission circuit. This system was inductively powered by an external coil and was
evaluated under sinusoidal input force to verify the measurement system. The obtained
results showed variability in measured data which was speculated to be a result of nonlinear
material behavior and hysteresis effects. The main limitation with the abovementioned knee
sensory systems is the external power source requirement of the devices. This can limit the
application of the system to laboratories and obviate the device to perform continuously at
the patient’s convenience.
Piezoelectric transducers present the potential to be implemented in various sensing and
energy harvesting applications [12, 13]. Several wearable and implantable piezoelectric
energy harvesters have been introduced in the literature in order to provide the required
energy for low-power electronics by harvesting energy from human motion [14, 15]. In
2005, Platt et al. [16] showed that it is feasible to utilize piezoelectric transducers in TKR as
sensors and energy harvesters. More recently, Almouahed et al. [17, 18] suggested utilizing
piezoelectric ceramics in the tibial component of a total knee replacement to measure the
total axial force applied to the bearing and to track the location of the center of pressure
(CoP). Center of pressure is defined as the point of application of the sum of the medial and
lateral forces (i.e. the forces acting in the medial and lateral compartments) acting between
the femoral component and the ultra-high molecular weight (UHMW) polyethylene bearing
of the knee joint. For reference, a schematic of a TKR is illustrated in Figure 1(a). Although
the proposed system can provide self-powered in vivo measurement during normal function
of the joint, the original implant design is modified to implement the sensory system. The
change in the overall dimension and design of the knee implant requires manufacturers and
surgeons to modify their design and surgical techniques, which have been obtained as a
result of several years of experience.
In order to tackle the power source and implant design modification limitations of existing
approaches, a novel design of a TKR bearing with embedded piezoelectric transducers is
proposed in this study. Implanted piezoelectric transducers in the UHMW bearing of the
TKR can provide self-powered sensing ability directly from the bearing as a result of the
applied force through the femoral component [19]. Furthermore, by encapsulating the
piezoelectric transducers inside the existing knee bearing, the original design of the implant
can be preserved. The conceptual design explored in this study aims to provide the ability of
sensing knee loads and transmitting data once per day with the help of the power harvested
from daily activities. In addition, the application of embedded piezoelectrics can be extended
to structural health monitoring (SHM) on the bearing to monitor for loosening, wear, and
fracture in the implant (which will be the focus of our future work). The design consists of
two lead zirconate titanium (PZT) transducers located in each of the medial and lateral
compartments of the UHMW insert (total of four PZTs). First, the arrangement of
piezoelectric transducers inside the bearing is varied and the best arrangement is selected
using finite element (FE) simulation. Next, the ability of the employed PZT elements to
detect the total applied force on the bearing and track the movement of the center of pressure
Safaei et al. Page 3
Smart Mater Struct. Author manuscript; available in PMC 2019 November 01.
Author M
anuscriptA
uthor Manuscript
Author M
anuscriptA
uthor Manuscript
is experimentally investigated through a series of twelve tests that vary the relative position
of the femoral component and UHMW bearing. Finally, the energy harvesting capability of
the design in harvesting power from normal knee function is studied. A series of resistor
sweep tests are first performed to obtain the maximum theoretical harvestable power from
the device. The practical attainable power is then measured using a bridge rectifier and
capacitor circuit.
2. Design
Measuring the quantity of total force and tracking the location of the center of pressure on
the knee bearing surface are the intended sensing functions for the instrumented TKR in this
study. Four piezoelectric transducers, located on the bottom surface of the UHMW bearing,
are employed to measure the force and location quantities. Figure 1(b) shows this
instrumented TKR bearing design with the incorporated piezoelectrics; two piezoelectrics
are placed in each compartment of the bearing (medial and lateral) to ensure measurement of
each compartmental force, thus allowing calculation of the total applied force and the CoP.
In addition to sensing, the piezoelectric transducers are able to harvest energy from the
compression load acting on the bearing during walking. The intended functionality of this
system is to measure the desired quantities and transmit to an external computer once a day,
thus, the amount of energy harvested and stored during the day should be sufficient to power
the sensory system during the sensing operation (which is likely to take less than one
minute).
Due to the importance of axial alignment of the knee joint [2], the compressive axial force
between the femoral and tibial components of the TKR is considered as the main force
component acting on the joint. As a result of the applied force on the bearing, reaction forces
are created on each piezoelectric transducer. By measuring these individual force quantities,
the amount of total axial force on the UHMW component as well as the location of the CoP
can be calculated. Recall, CoP is the average location of contact areas on the bearing in
which the total force is acting. In other words, CoP is the point where the moment of the
total force applied to the bearing is zero. Tracking the movement of the CoP provides
valuable information about medial-lateral and anterior-posterior alignment of the joint, as
well as the contact mechanism of the femoral component and tibial bearing [21]. The
location of the CoP for a bearing with two contact points (CPs) located on the medial and
lateral compartments of the bearing is shown later in Figure 4(a).
3. Finite Element Simulation
3.1. Simulation Setup
Based on the conceptual design shown in Figure 1(b), a FE study is performed in this section
on a knee implant consisting of a femoral component and an instrumented knee bearing with
four embedded piezoelectric transducers. The aim of the FE analysis is to investigate the
effect of the different locations of piezoelectrics (i.e. arrangement of the sensors) inside the
bearing on the sensing performance of the device. Therefore, several patterns of
piezoelectric locations are chosen for the system and the ability of the piezoelectric elements
to measure the total force applied to the bearing and the location of the CoP is studied. The
Safaei et al. Page 4
Smart Mater Struct. Author manuscript; available in PMC 2019 November 01.
Author M
anuscriptA
uthor Manuscript
Author M
anuscriptA
uthor Manuscript
FE analysis is conducted using ANSYS software and the FE model is shown in Figure 2(a).
The model consists of SOLID187 elements (3-D 10-node tetrahedral solid element with
three translational degrees of freedom) for the femoral component and bearing, SOLID227
elements (3-D 10-node coupled-field tetrahedral solid element with five translational,
thermal, and electrical degrees of freedom) for the piezoelectric elements, and CONTA174
and TARGE170 (surface elements with the same geometric characteristics as the solid
elements) for contact surfaces, and contains 384,231 nodes and 256,392 elements. The
element size for PZTs, and bearing and femoral component are 0.6 mm and 1.2 mm,
respectively, with a maximum aspect ratio of 8. The mesh is finely refined on the contact
surfaces and on the corners, and a mesh refinement study is initially conducted to ensure that
the simulation results converged. Frictional boundary conditions are applied between the
femoral component and bearing as well as between the PZTs and bearing with a friction
coefficient of 0.12 [22].
The CAD geometry of the femoral and tibial components is obtained by 3D scanning a real
knee implant, and the bearing is modified in order to accommodate four piezoelectric
transducers. Four 8 mm diameter and 2 mm depth pockets are removed from the bottom
surface of the bearing. Piezoelectric disc transducers with a diameter of 8 mm and thickness
of 2.5 mm are used. The pockets are designed to be shallower than the piezoelectric
transducers in order to ensure full load transmissibility to the PZTs during the tests and,
therefore, maximum sensing capability of the system [19]. The material for the bearing is
chosen to be PLA (polylactic acid) in order to match the material used in the experiment (see
Sec. 4.1). The piezoelectric transducers are 25-layer NCE51 (PZT-5A) PZT stacks (Noliac,
Inc.). The material properties of PLA and the piezoelectric transducers are listed in Table 1.
The piezoelectric transducers are polarized in the y-direction.
Two angular parameters, as shown in Figure 2(b), are defined in order to control the location
of the piezoelectric transducers. The locations of PZT1 and PZT2 are specified with angular
parameters α1 and α2, respectively. The α1 parameter is allowed to take on values of 50°,
90°, and 130°, and the α2 parameter is allowed to take on values of 50°, 70°, 90°, and 130°
in order to investigate twelve different patterns. Note, PZT3 and PZT4 are located in a
symmetric arrangement to PZT1 and PZT2, respectively. A realistic knee loading profile
obtained from OpenSim (an open source biomechanical simulation software) is utilized as
the axial input load (y-direction in Figure 2(a)) of the system [19]. The force profile is
shown in Figure 3. The knee bearing and femoral component are initially center-aligned
based on the geometric centers of the components, and constrained in the x- and z-directions
for all simulations. The bottom face of the piezoelectric transducers is restrained in all
directions. The effective force applied to each PZT and the pressure distribution on the
contact surface of the bearing and femoral component are collected from the transient FE
simulation with an initial timestep of 0.01 sec and 120 steps. The true locations of the
contact areas are obtained from the pressure distribution result on the top surface of the
bearing, and the true location of the CoP is calculated from the average location of the
contact points. The location of the CoP as measured by the four piezoelectric transducers
can be calculated using the equilibrium of moments as follows:
Safaei et al. Page 5
Smart Mater Struct. Author manuscript; available in PMC 2019 November 01.
Author M
anuscriptA
uthor Manuscript
Author M
anuscriptA
uthor Manuscript

xCoP =∑i = 1
4xiFi
FT, (1)
zCoP =∑i = 1
4ziFi
FT, (2)
where xCoP and zCoP are the Cartesian coordinates of the CoP, xi and zi are the coordinates
of ith piezoelectric transducer, Fi is the reaction force on ith transducer, and FT is the total
force applied on the bearing, which is the summation of the individual forces, as given by
FT = ∑i = 1
4Fi . (3)
On the other hand, the true location of the CoP can be calculated as the average location of
the nodal pressures obtained for all of the nodes located on the top surface of the bearing as
follows:
xCoPn =
∑i = 1
Ntxi
nPin
PT, (4)
zCoPn =
∑i = 1
NtzinPi
n
PT, (5)
where xCoPn and zCoP
n are the true location of the CoP obtained from nodal pressure
quantities, xin and zi
n are the coordinates of ith node, Pin is the nodal pressure of ith node, Nt is
the total number of nodes located on the top surface of the bearing, and PT is the total
pressure on the top surface.
3.2. Simulation Results
Results of the FE simulations performed for different angles of α1 and α2 are summarized in
Table 2. Twelve simulations are accomplished and the error in the total force and deviation
Safaei et al. Page 6
Smart Mater Struct. Author manuscript; available in PMC 2019 November 01.
Author M
anuscriptA
uthor Manuscript
Author M
anuscriptA
uthor Manuscript
in the location of the CoP are calculated using Eqs. (1)–(5). It can be seen from the results
that the error in measured total force quantities is zero for all simulations, which indicates
convergence of the FE model. On the other hand, the deviation in the location of the CoP
varies with the change in the angular parameters. Based on the results, the arrangement used
in Simulation 1 with α1=130° and α2=90° demonstrates the minimum deviation in the
measured location of the CoP obtained from the PZTs from the true location obtained from
the pressure distribution on the top surface of the bearing. Figure 4(a) represents the pressure
distribution on the bearing obtained from Simulation 1. For more clarity, the locations of the
two CPs on the compartments of the bearing and of the CoP are shown in this figure as well.
Figure 4(b) shows the exact location of the piezoelectric transducers for this chosen
arrangement (Simulation 1). The maximum total deviation of the location of the CoP for this
arrangement is only 0.32 mm. The chosen arrangement is utilized in the next section to
fabricate a prototype of the device in order to experimentally investigate the sensing and
energy harvesting performance of the suggested system.
4. Experiment
4.1. Fabrication
A prototype of the instrumented TKR bearing is fabricated via 3D printing based on the
design chosen from the FE simulation, shown in Figure 4(b). 3D printing offers the ability to
quickly and easily develop and test prototypes of various designs, therefore, it is selected as
the fabrication method used in this work. Printable UHMW filament is not currently
available on the market, therefore, PLA is chosen. Although the material properties of PLA
are not identical to UHMW, the two materials exhibit similar mechanical behavior under
compressive loading, therefore, PLA is deemed a suitable material for use in this study [25].
Similar to the design used in the FE simulation, four pockets are placed on the bottom
surface of the bearing symmetrically to accommodate the piezoelectric transducers. Pockets
shallower than the PZTs guarantee full force transmissibility to the transducers and
maximum sensing and energy harvesting performance. As described in Sec. 3.1, the
piezoelectric transducers are 25-layer NCE51 (PZT-5A) PZT stacks. Stack geometries can
provide relatively high coupling properties which are optimal for sensing applications.
Additionally, the matched impedance of piezoelectric stacks for optimum energy harvesting
is on the order of hundreds of k Ω (as opposed to M Ω for similar monolithic transducers),
which is appropriate for realistic energy harvesting circuitry [26].
The material properties of the piezoelectric stacks and PLA material have been previously
listed in Table 1. The manufactured knee bearing with incorporated PZTs is shown in Figure
5. It can be seen that an arrangement of grooves is incorporated on the bottom face of the
bearing for routing of the wires soldered to the piezoelectric electrodes and connected to the
data acquisition circuitry. It is necessary to note that in the eventual design of the
instrumented implant, the external leads will be removed and a set of embedded electronics
will be incorporated to perform data acquisition, processing, and transmission, as well as
power storing.
Safaei et al. Page 7
Smart Mater Struct. Author manuscript; available in PMC 2019 November 01.
Author M
anuscriptA
uthor Manuscript
Author M
anuscriptA
uthor Manuscript

4.2. Test Setup
In order to investigate the performance of the integrated bearing and piezoelectric system, a
series of tests is performed on the fabricated prototype. The aim of the experimental tests is
to evaluate the ability of the fabricated system to measure the total axial applied force and
the location of the CoP on the bearing, as well as harvest energy during the loading cycle.
Figure 6(a) shows the overall experimental setup used to test the prototype instrumented
knee bearing, which allows the load to be applied to the bearing through the femoral
component of the TKR. A closer view of the test setup detailing the femoral fixture, the
femoral component, the knee bearing with embedded PZT transducers, and the bearing
fixture is shown in Figure 6(b). Initially, the relative position of the femoral component and
bearing is set to an arbitrary zero position in which the femoral component and the bearing
are visually center-aligned in both medial-lateral and anterior-posterior directions.
The realistic knee loading profile described in Sec. 3.1 is utilized as the axial input load of
the load frame. The generated voltage from the piezoelectrics is collected via two distinct
sets of circuits; one circuit for sensing and two types of circuits for energy harvesting, and
measured using an NI 9215 data acquisition module and a LabVIEW program (National
Instrument Corp.). The sensing circuit is designed to measure the output voltage of each
piezoelectric individually in order to sense the quantity of applied force on each transducer.
The energy harvesting circuits, on the other hand, are designed to extract the maximum
power from all the piezoelectric generators across a load resistance, and to rectify and store
the total generated power from all the piezoelectrics in a single storage device. In practice, in
a real instrumented knee implant, the energy stored via the energy harvesting circuit would
be used to power an embedded sensory circuit that collects, processes, and transmits the
data.
4.2.1. Sensing Tests—In order to measure the force and location of the CoP, the
individual voltage signals from each piezoelectric transducer must be obtained and
processed. To do so, a load resistance of 100 kΩ is placed in parallel with each piezoelectric
element and the voltage signal is measured across the resistor. The circuit diagram utilized
for data collection from each piezoelectric transducer is presented in Figure 7. The voltage
signals are processed with the help of a MATLAB code to obtain the measured force and
location of the CoP. The actual location of the CoP on the bearing surface is obtained from
an image processing code for the recorded contact areas using a medium-range Prescale
pressure sensitive film (Fujifilm Corp.) placed on the interface of the tibial component and
the bearing. Twelve tests are performed on the fabricated bearing to investigate the ability of
the sensory system to measure the force and track the location of the CoP for different
contact locations. For the first six tests (Test 1–6), the translational location of the femoral
component on the bearing is varied in the medial-lateral direction, and for the second six
tests (Test 7–12), the location is varied in the anterior-posterior direction using the bearing
fixture shown in Figure 6(b). The movement directions are shown in Figure 1(a). Different
translational locations are achieved by moving the bearing along the medial-lateral (x) and
anterior-posterior (z) axes in 1.5 mm increments. For Test 1 and Test 7, the bearing and
femoral component are visually center-aligned, and the relative locations for the remainder
of the tests are varied with reference to these two initial locations. The relative location of
Safaei et al. Page 8
Smart Mater Struct. Author manuscript; available in PMC 2019 November 01.
Author M
anuscriptA
uthor Manuscript
Author M
anuscriptA
uthor Manuscript
the femoral component and the bearing for all the sensing tests is listed in Table 3. Note, due
to the curved interface of the femoral component and bearing, it is expected that the
increments in CoP movement will not be equal to the 1.5 mm increments of the knee bearing
movement. In order to calculate the force from the collected voltage signals, the first order
governing equation of a piezoelectric stack connected to a load resistance under low-
frequency uniaxial compression loading is employed [27]:
Cpe f f dV t
dt + V tR = d33
e f f dF tdt , (6)
where V (t) is the generated voltage, F (t) is the applied force on the PZT, R is the resistive
load connected to the PZT, d33e f f is the effective piezoelectric strain coefficient, given by
d33e f f = Nd33, (7)
where N is the number of piezoelectric layers, and d33 is the piezoelectric strain coefficient.
Cpe f f is the effective capacitance of the PZT stack, given as
Cpe f f =
Nε33T Ah , (8)
where ε33T is the dielectric permittivity, A is the cross-sectional area of the stack, and h is the
thickness of each layer. It should be noted that the highest excitation frequency found in the
OpenSim knee load profile is several orders of magnitude less than the fundamental
thickness resonance frequency of the stack, thereby warranting the use of a non-resonant
first-order model. The force quantities measured on each piezoelectric transducer can be
used to calculate the total applied force by simple summation of the four reaction forces, as
presented in Eq. (3). The location of the CoP can then be calculated using the moment
equilibrium equations expressed in Eqs. (1) and (2).
4.2.2. Energy Harvesting Tests—The instrumented bearing proposed in this work
consists of four piezoelectric transducers, therefore, various writing configurations of the
PZTs are possible. The electrical configuration of the PZTs (series vs. parallel vs.
combination of series and parallel) affects the generated voltage and optimal resistive load
for maximum generated power. In piezoelectric energy harvesting systems, the amount of
harvestable power depends on the relative impedance of the load and the piezoelectric
generators, with optimal extracted power occurring when the impedance is matched [28]. In
order to determine the ideal electrical configuration, three unique wiring configurations are
first investigated in this section to determine the most appropriate configuration suitable to
power a low-power wireless biomedical sensing circuit from the literature in terms of
generated voltage level and optimal resistive load. Once the ideal configuration is selected,
the optimum extractable power (theoretical power) from the piezoelectric system is
Safaei et al. Page 9
Smart Mater Struct. Author manuscript; available in PMC 2019 November 01.
Author M
anuscriptA
uthor Manuscript
Author M
anuscriptA
uthor Manuscript

determined through a series of resistor sweep tests. Following this analysis of the maximum
theoretical harvestable power, a second set of experiments is conducted to determine the
practical harvestable power (practical power) through a bridge rectifier and smoothing/
storage capacitor energy harvesting circuit.
First, three combinations of piezoelectric wiring connections are considered, and the
behavior of each case is investigated analytically and numerically to determine the best
configuration. It is necessary to note that the analytical solution is conducted for an arbitrary
harmonic loading condition to obtain a parametric understanding of the ratios of optimum
resistor, optimum power, and peak voltage for each configuration to those of a single PZT
system and for the sake of comparison. Afterward, quantitative results are also developed for
the actual OpenSim load profile using a numerical solution. Figure 8 shows the three
arrangements considered, whereby the PZT transducers are placed in series, parallel, and a
combination of series and parallel (Figure 8(a), (b), and (c), respectively).
For a single piezoelectric transducer under a dynamic load of F(t) and connected in parallel
to a resistor R, the governing electromechanical equation is presented in Eq. (6). For
harmonic excitation, the peak voltage can be obtained from Eq. (6) as
V =jωd33F
1R + jωCp
, (9)
where ω is the frequency of excitation and j is the imaginary unit. Then, the peak power can
be written as P = V2R , and the optimum resistive load to obtain the maximum power can be
calculated from dPdR = 0. As a result, the optimum resistive load (Ropt) is
Ropt = 1jωCp
. (10)
Based on Eqs. (6), (9), and (10), the governing equation, optimum resistor, maximum power,
and peak voltage with the optimum resistor for all three energy harvesting circuits shown in
Figure 8 are developed and listed in Table 4 in comparison with a single PZT connected to a
resistive load. Although the force profile used in this study (OpenSim profile) is not
harmonic, due to the periodic behavior and consistent frequency content of the profile, the
relative ratios of optimum resistor, maximum power, and peak voltage provided in Table 4
(presented in “Harmonic” columns) are valid for the sake of comparison. On the other hand,
substituting the OpenSim force profile and the material properties of PZT stacks, as listed in
Table 1, into Eq. (6), the optimum resistor, maximum power, and peak generated voltage
quantities are also numerically calculated and added to Table 4 for each configuration
(presented in “OpenSim” columns).
A published study on the development of a low-power wireless circuit designed for knee
implants shows a 1.2 V to 3.6 V voltage requirement and an equivalent circuit resistance of
Safaei et al. Page 10
Smart Mater Struct. Author manuscript; available in PMC 2019 November 01.
Author M
anuscriptA
uthor Manuscript
Author M
anuscriptA
uthor Manuscript

about 31 kΩ [29]. Based on the requirements of the aforementioned circuit, the configuration
with all four PZTs connected in parallel to a resistive load is chosen as the ideal arrangement
for the energy harvesting tests in this work.
In order to determine the optimum extractable power (theoretical power) from the
piezoelectrics, the load resistor is swept from 10 kΩ to 1 MΩ and the voltage across the
resistor is measured. Again, the voltage signals are imported into a MATLAB program in
order to process and calculate the average generated power by the piezoelectrics. The
average power is calculated as
Pavg =vrms
2
R , (11)
where, vrms is the RMS voltage given by
vrms = 1T ∫
0
T
v2 t dt , (12)
in which, T is the time period of voltage signal.
While the theoretical power can be obtained using this technique, the practical harvestable
power from the piezoelectric system will be less than the theoretical value due to losses in
the circuitry required to condition the harvested energy for use. In real-world applications,
the generated voltage from the piezoelectric transducers under cyclic loading is in the form
of a time varying signal with a high level of fluctuation, therefore, it needs to be rectified
and stored prior to use. Thus, in addition to the theoretical power circuitry introduced for the
resistor sweep tests, a practical energy harvesting circuit consisting of a basic bridge rectifier
and smoothing/storage capacitor is also used in this work. The circuit diagram for this
energy harvesting circuit is illustrated in Figure 9, where the four piezoelectrics are
connected in parallel to the bridge rectifier (since the mechanical loading on each transducer
is in phase, voltage cancellation is not of concern). The stored energy in the capacitor is
measured using the NI DAQ in terms of the capacitor voltage.
4.3. Test Results
4.3.1. Sensing Test Results—Figure 10(a) presents the total force profile measured
from the piezoelectric transducers along with the actual applied force to the knee bearing
measured by the built-in load cell of the load frame for Test 1 (recall, twelve tests are
conducted, as described previously in Table 3). Note, a 20-point moving average filter has
been applied to the voltage signals to help eliminate measurement noise. Comparing the two
diagrams, it can be seen that the measured force profile matches with the applied force
profile for higher quantities of force. On the other hand, deviations of the measured force
from the actual profile at the beginning and end of the test (where lower force amplitudes
occur) are noticeable. The error in these areas can be partially attributed to low signal-to-
Safaei et al. Page 11
Smart Mater Struct. Author manuscript; available in PMC 2019 November 01.
Author M
anuscriptA
uthor Manuscript
Author M
anuscriptA
uthor Manuscript

noise ratio in the collected data in these regions and the corresponding inaccuracies caused
by filtering the data. Moreover, preliminary tests on the piezoelectric stacks show nonlinear
behavior in the d33coefficient, while a constant coefficient is used for data processing in this
study. This error can be reduced or potentially eliminated by testing in a low-noise
environment, using more precise data acquisition equipment and signal processing
techniques, and applying a variable piezoelectric strain coefficient in the calculation.
Similarly, the force profile is obtained for all of the other tests and the error in measured
peak forces is plotted in Figure 10(b) for all twelve tests. Overall, the error in force sensing
is less than 2.5% of the total force applied to the bearing for all twelve tests.
In addition to force amplitudes, the location of the CoP is analyzed. Figure 11 shows the
measured locations of CPs and CoP from the pressure sensitive films for Test 1. The
measured CoP locations for the six tests with the bearing moved in the x-direction and the
six tests with the bearing moved in the z-direction are compared to the true CoP locations
recorded by the pressure films and plotted in Figure 12(a) and (b), respectively. Comparing
the measured location of the CoP from the piezoelectric sensors with the actual coordinates
obtained from the pressure sensitive films, the deviation in calculated CoP location from the
actual location can be obtained. Note, while the knee bearing is moved along the x- and z-
axis with 1.5 mm increments, movement of the true location of the CoP represents uneven
increments due to the complex contact surfaces of the femoral component and the bearing.
From the two plots, it can be observed that the piezoelectric sensors are able to track the
movement in the location of the CoP for a wide range of bearing and femoral component
relative movement with a small deviation of less than 0.5 mm.
4.3.2. Energy Harvesting Test Results—First, the resistor sweep test is performed
on the piezoelectric system. The average power harvested from the piezoelectrics is plotted
in Figure 13(a) along with the average power calculated analytically using Eqs. (6) and (11).
The diagram shows that the simulation and experimental results are in good agreement. A
maximum extracted power of 269.1 μW is achieved with a 175 kΩ optimal resistive load
experimentally, whereas, the simulation shows a maximum average power of 268.4 μW for
an optimum resistive load of 150 kΩ (as previously presented in Table 4).
Next, in order to determine a better understanding of the amount of practical harvestable
energy, the total voltage signal obtained from the piezoelectrics using the bridge rectifier and
smoothing/storage capacitor is obtained. The test is run for 4,000 s, which is equivalent to
3,333 gait cycles. It is necessary to note that an average of about 10,000 steps (cycles) per
day is reported for a healthy person [30, 31]. However, considering the reduced level of
activity in patients after knee surgery, a reduced number of steps (gait cycles) per day is
expected during the recovery period, therefore, 3,333 gait cycles can be considered a
reasonable representation of the total daily number of steps for a patient after undergoing a
knee replacement procedure. Figure 13(b) shows the capacitor voltage diagram versus time.
Although the piezoelectric transducers were continuously charging the capacitor, it can be
seen that the voltage reaches the steady state quantity of 4.9 V after about 3000 s. The
constant voltage of the capacitor represents the maximum voltage generated from the
piezoelectric transducers after the bridge rectifier (which includes losses in the diodes) and
accounts for self-discharge in the capacitor as well as loading from the data acquisition
Safaei et al. Page 12
Smart Mater Struct. Author manuscript; available in PMC 2019 November 01.
Author M
anuscriptA
uthor Manuscript
Author M
anuscriptA
uthor Manuscript

system. It should be noted that the amount of voltage loss in the circuit can be decreased
using more ideal components such as low-loss diode bridges and thin film batteries or
supercapacitors. The total energy stored in the capacitor after 3000 cycles is calculated from
Figure 13(b) as 40 mJ (13.3 μW average power). It has been reported that an embedded low-
power data processing and transmission system designed for orthopedic implants consumes
45 μW and 3.2 mW in data collecting and transmission modes, respectively [29]. As a result,
the amount of power stored in the capacitor is sufficient for 9 min of sensing and data
processing, and 5 sec of data transmitting. Considering the target function of the
instrumented implant developed in this work (harvesting throughout the day and sensing/
data transmitting once per day), these results show promising potential of embedded PZTs to
supply power to a low power force measuring and telemetry system for knee implants. Note,
the power rectified and stored in the capacitor is about 20 times less than the maximum
power obtained from the piezoelectric harvesters using the resistor sweep tests (theoretical
power). Therefore, using more advanced electronics with impedance matching capability,
the energy harvesting efficiency of the system can be improved and the duty cycle of sensing
and energy harvesting system can be reduced.
5. Conclusion
A novel design of an instrumented knee implant with four embedded piezoelectric
transducers for sensing force magnitude and tracking center of pressure (CoP), as well as
energy harvesting for self-powered operation is proposed in this study. A duty cycle
operation is considered for the device whereby energy is harvested from daily activities and
then used at the end of the day to power the sensing and data transmission electronics. First,
the best arrangement of piezoelectric transducers is selected via finite element (FE) analysis
with regard to the sensing performance of the device in detecting force magnitude and CoP
location. Next, a 3D printed prototype of the device with the chosen sensor configuration is
fabricated and employed in a series of experimental tests. Using a load frame, a realistic
knee compression load profile is applied on the instrumented bearing via the femoral
component of an actual knee implant. Sensing and energy harvesting tests are conducted
individually with different electrical circuits. The sensing ability of the device is studied by
processing the individual generated voltage signals from the piezoelectric transducers
measured across simple load resistors. The total applied force and the location of the CoP
are measured by the piezoelectrics and compared to the true quantities obtained from the
load frame and pressure sensitive films placed on the top surface of the bearing. Two circuits
are considered for the energy harvesting tests, both of which place all four PZTs in parallel.
First, the optimum theoretical harvestable power is determined by a resistor sweep circuit
where a simple load resistor is placed across the piezoelectrics. Next, a voltage rectifier and
storage capacitor circuit is employed to obtain the practical harvestable power from the
PZTs. The sensing results showed an error of less than 2.5% in force sensing and a deviation
of less than 0.5 mm in tracking the location of the CoP when the relative positions of the
femoral component and bearing are varied. The resistor sweep tests showed that with an
optimum load, an average power of up to 269.1 μW (theoretical power) can be harvested
from the piezoelectric transducers. In addition, the average rectified and stored power
(practical power) was found to be 13.3 μW and was shown to be sufficient to power a
Safaei et al. Page 13
Smart Mater Struct. Author manuscript; available in PMC 2019 November 01.
Author M
anuscriptA
uthor Manuscript
Author M
anuscriptA
uthor Manuscript

biomedical sensing and data transmission circuit from the literature with a low duty cycle.
The promising sensing and energy harvesting results obtained in this study show the
potential of the instrumented knee implant to be employed as a self-powered knee sensory
system.
Acknowledgments
Research reported in this publication was supported by the National Institute of Arthritis And Musculoskeletal And Skin Diseases of the National Institutes of Health under Award Number R15AR068663. The content is solely the responsibility of the authors and does not necessarily represent the official views of the National Institutes of Health.
References
1. Bourne RB, et al., Patient satisfaction after total knee arthroplasty: who is satisfied and who is not? Clinical Orthopaedics and Related Research®, 2010 468(1): p. 57–63. [PubMed: 19844772]
2. Dorr LD and Boiardo RA, Technical considerations in total knee arthroplasty. Clinical orthopaedics and related research, 1986 205: p. 5–11.
3. Sharkey PF, et al., Why are total knee arthroplasties failing today—has anything changed after 10 years? The Journal of arthroplasty, 2014 29(9): p. 1774–1778. [PubMed: 25007726]
4. Abulhasan JF, et al., An Extensive Evaluation of Different Knee Stability Assessment Measures: A Systematic Review. Journal of Functional Morphology and Kinesiology, 2016 1(2): p. 209–229.
5. Fehring TK, et al., Early failures in total knee arthroplasty. Clinical orthopaedics and related research, 2001 392: p. 315–318.
6. Meneghini RM, et al., Can Intraoperative Sensors Determine the “Target” Ligament Balance? Early Outcomes in Total Knee Arthroplasty. The Journal of arthroplasty, 2016 31(10): p. 2181–2187. [PubMed: 27155997]
7. Banks SA, What Postoperative Outcome Measures Link Joint Stability to Patient Satisfaction? Journal of the American Academy of Orthopaedic Surgeons, 2017 25: p. S40–S43. [PubMed: 27941555]
8. Msayib Y, et al., An Intelligent Remote Monitoring System for Total Knee Arthroplasty Patients. Journal of Medical Systems, 2017 41(6): p. 90. [PubMed: 28421308]
9. Morris BA, et al., E-Knee: Evolution of the electronic knee prosthesis. The Journal of Bone & Joint Surgery, 2001 83(2 suppl 1): p. S62–66.
10. Heinlein B, et al., Design, calibration and pre-clinical testing of an instrumented tibial tray. Journal of biomechanics, 2007 40: p. 4–10.
11. Crescini D, Sardini E, and Serpelloni M, Design and test of an autonomous sensor for force measurements in human knee implants. Sensors and Actuators A: Physical, 2011 166(1): p. 1–8.
12. Anton SR and Sodano HA, A review of power harvesting using piezoelectric materials (2003–2006). Smart Materials and Structures, 2007 16(3): p. R1–R21.
13. Shaikh FK and Zeadally S, Energy harvesting in wireless sensor networks: A comprehensive review. Renewable and Sustainable Energy Reviews, 2016 55: p. 1041–1054.
14. Ansari M and Karami MA, Experimental investigation of fan-folded piezoelectric energy harvesters for powering pacemakers. Smart Materials and Structures, 2017 26(6): p. 065001. [PubMed: 29674807]
15. Zhang M, et al., A hybrid fibers based wearable fabric piezoelectric nanogenerator for energy harvesting application. Nano Energy, 2015 13: p. 298–305.
16. Platt SR, Farritor S, and Haider H, On low-frequency electric power generation with PZT ceramics. Mechatronics, IEEE/ASME Transactions on, 2005 10(2): p. 240–252.
17. Almouahed S, et al., Design and evaluation of instrumented smart knee implant. IEEE Transactions on Biomedical Engineering, 2011 58(4): p. 971–982. [PubMed: 20639169]
18. Almouahed S, et al. Optimization of an instrumented knee implant prototype according to in-vivo use requirements in 2013 IEEE Point-of-Care Healthcare Technologies (PHT) 2013.
Safaei et al. Page 14
Smart Mater Struct. Author manuscript; available in PMC 2019 November 01.
Author M
anuscriptA
uthor Manuscript
Author M
anuscriptA
uthor Manuscript

19. Safaei M, Meneghini RM, and Anton SR, Energy Harvesting and Sensing with Embedded Piezoelectric Ceramics in Knee Implants. IEEE/ASME Transactions on Mechatronics, 2018 32(2): p. 864–874.
20. http://delcore.org/.
21. Kaufman KR, et al., Instrumented implant for measuring tibiofemoral forces. Journal of biomechanics, 1996 29(5): p. 667–671. [PubMed: 8707796]
22. Kurtz SM, UHMWPE biomaterials handbook: ultra high molecular weight polyethylene in total joint replacement and medical devices 3 ed. 2015: William Andrew.
23. Anderson C, et al. USING INTRAOPERATIVE SENSORS TO DEFINE INTRA-ARTICULAR LOADING PATTERNS DURING TOTAL KNEE ARTHROPLASTY. in Orthopaedic Proceedings 2018 The British Editorial Society of Bone & Joint Surgery.
24. http://www.noliac.com/.
25. Ponder RI, Safaei M, and Anton SR. Development of Surrogate Biomedical Knee Implants for Validation of Embedded Smart Sensors. in ASME 2017 Conference on Smart Materials, Adaptive Structures and Intelligent Systems 2017 American Society of Mechanical Engineers.
26. Safaei M, Meneghini RM, and Anton SR, Parametric analysis of electromechanical and fatigue performance of total knee replacement bearing with embedded piezoelectric transducers. Smart Materials and Structures, 2017 26(9): p. 094002. [PubMed: 29225424]
27. Hoummadi E, Safaei M, and Anton SR. Design, analysis, and fabrication of a piezoelectric force plate. in SPIE Smart Structures and Materials+ Nondestructive Evaluation and Health Monitoring 2017 International Society for Optics and Photonics.
28. Anton SR, Piezoelectric Conversion, in Materials for Sustainable Energy Applications: Conversion, Storage, Transmission, and Consumption, Moya X and Munoz-Rojas D, Editors. 2016, Pan Stanford Singapore p. 205–276.
29. Chen H, et al., Low-power circuits for the wireless ligament balance measurement system in TKA. Analog Integrated Circuits and Signal Processing, 2012 72(2): p. 293–302.
30. Bohannon RW, Number of pedometer-assessed steps taken per day by adults: a descriptive meta-analysis. Physical Therapy, 2007.
31. Seedhom B and Wallbridge N, Walking activities and wear of prostheses. Annals of the Rheumatic Diseases, 1985 44(12): p. 838–843. [PubMed: 4083940]
Safaei et al. Page 15
Smart Mater Struct. Author manuscript; available in PMC 2019 November 01.
Author M
anuscriptA
uthor Manuscript
Author M
anuscriptA
uthor Manuscript
Figure 1. Schematic of (a) total knee replacement (right knee) [20], and (b) UHMW bearing with four
embedded piezoelectric transducers.
Safaei et al. Page 16
Smart Mater Struct. Author manuscript; available in PMC 2019 November 01.
Author M
anuscriptA
uthor Manuscript
Author M
anuscriptA
uthor Manuscript
Figure 2. (a) FE model of femoral component and instrumented bearing, and (b) angular parameters
defined for FE analysis.
Safaei et al. Page 17
Smart Mater Struct. Author manuscript; available in PMC 2019 November 01.
Author M
anuscriptA
uthor Manuscript
Author M
anuscriptA
uthor Manuscript
Figure 3. Realistic knee load profile obtained from OpenSim.
Safaei et al. Page 18
Smart Mater Struct. Author manuscript; available in PMC 2019 November 01.
Author M
anuscriptA
uthor Manuscript
Author M
anuscriptA
uthor Manuscript
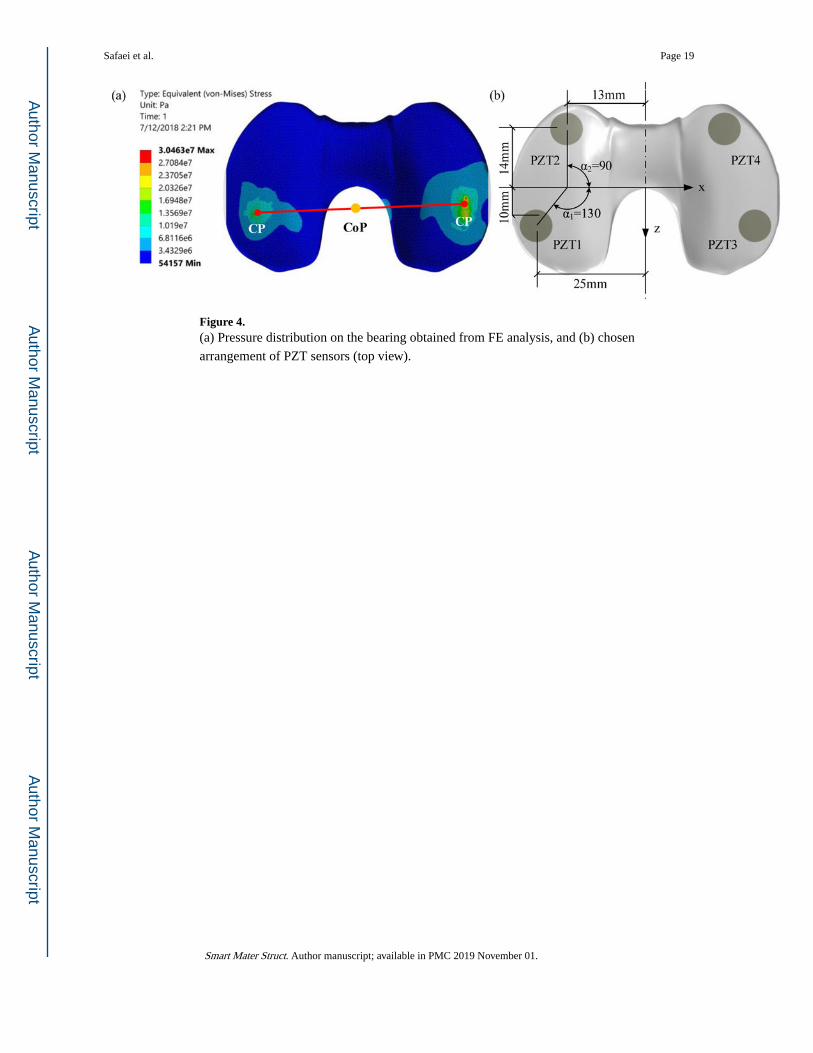
Figure 4. (a) Pressure distribution on the bearing obtained from FE analysis, and (b) chosen
arrangement of PZT sensors (top view).
Safaei et al. Page 19
Smart Mater Struct. Author manuscript; available in PMC 2019 November 01.
Author M
anuscriptA
uthor Manuscript
Author M
anuscriptA
uthor Manuscript

Figure 5. Fabricated instrumented knee bearing equipped with four piezoelectric stacks (a) top view,
and (b) bottom view.
Safaei et al. Page 20
Smart Mater Struct. Author manuscript; available in PMC 2019 November 01.
Author M
anuscriptA
uthor Manuscript
Author M
anuscriptA
uthor Manuscript
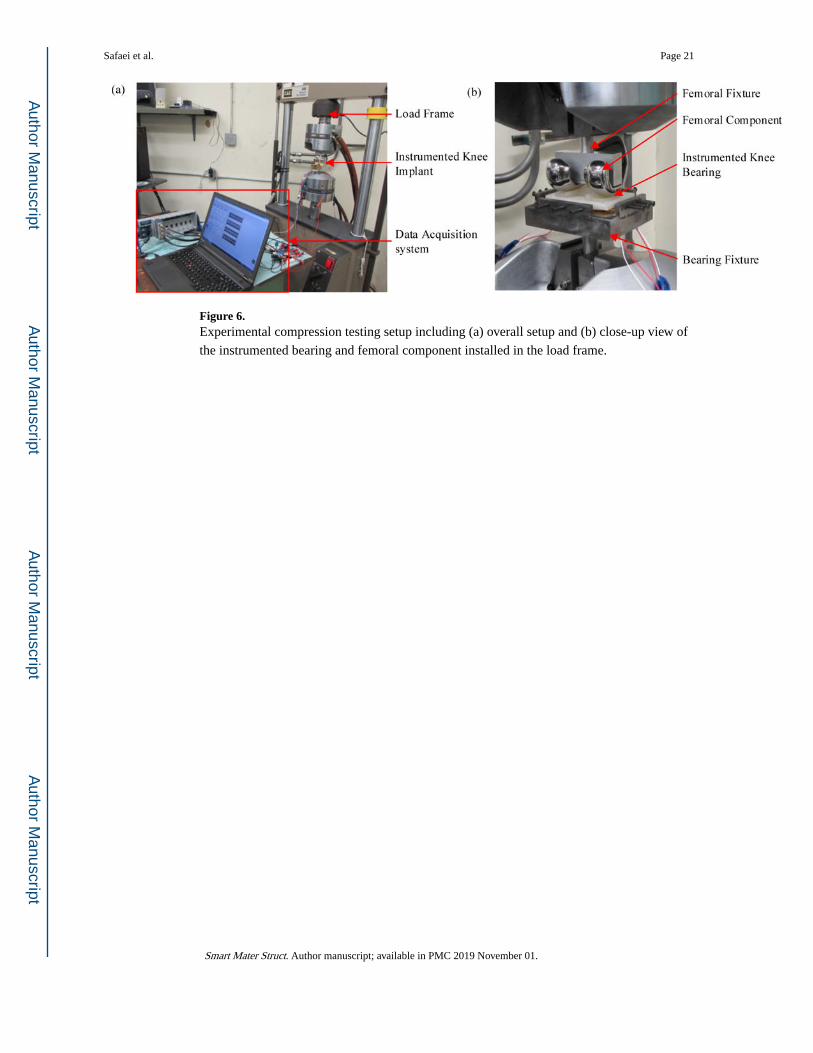
Figure 6. Experimental compression testing setup including (a) overall setup and (b) close-up view of
the instrumented bearing and femoral component installed in the load frame.
Safaei et al. Page 21
Smart Mater Struct. Author manuscript; available in PMC 2019 November 01.
Author M
anuscriptA
uthor Manuscript
Author M
anuscriptA
uthor Manuscript

Figure 7. Schematic diagram of sensing circuit.
Safaei et al. Page 22
Smart Mater Struct. Author manuscript; available in PMC 2019 November 01.
Author M
anuscriptA
uthor Manuscript
Author M
anuscriptA
uthor Manuscript
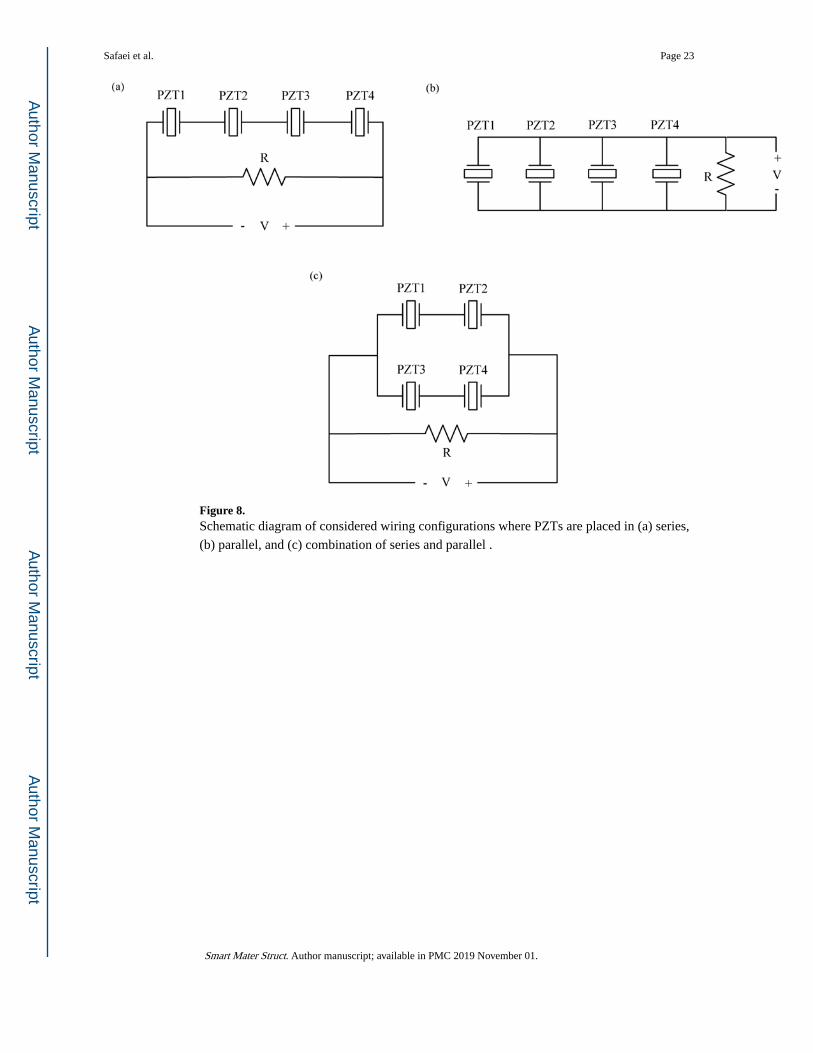
Figure 8. Schematic diagram of considered wiring configurations where PZTs are placed in (a) series,
(b) parallel, and (c) combination of series and parallel .
Safaei et al. Page 23
Smart Mater Struct. Author manuscript; available in PMC 2019 November 01.
Author M
anuscriptA
uthor Manuscript
Author M
anuscriptA
uthor Manuscript
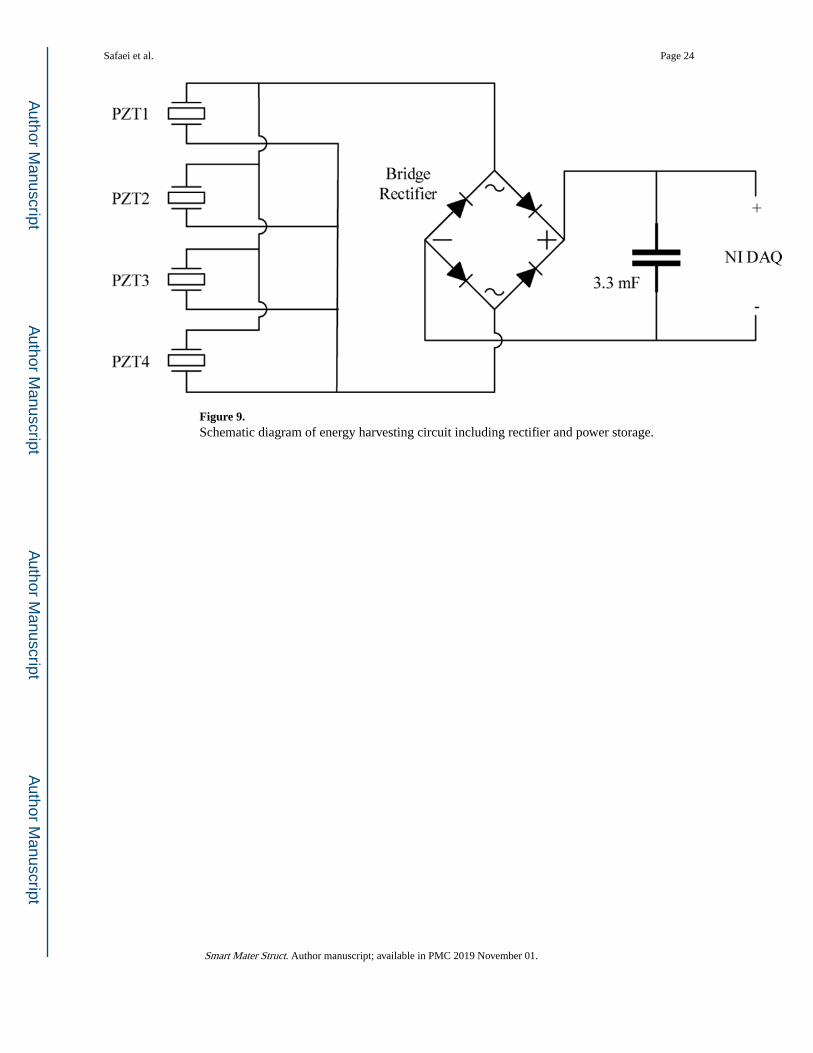
Figure 9. Schematic diagram of energy harvesting circuit including rectifier and power storage.
Safaei et al. Page 24
Smart Mater Struct. Author manuscript; available in PMC 2019 November 01.
Author M
anuscriptA
uthor Manuscript
Author M
anuscriptA
uthor Manuscript

Figure 10. (a) Comparison of measured and true total applied force profile for test 1, and (b) error in
measured total force for 12 experiments.
Safaei et al. Page 25
Smart Mater Struct. Author manuscript; available in PMC 2019 November 01.
Author M
anuscriptA
uthor Manuscript
Author M
anuscriptA
uthor Manuscript
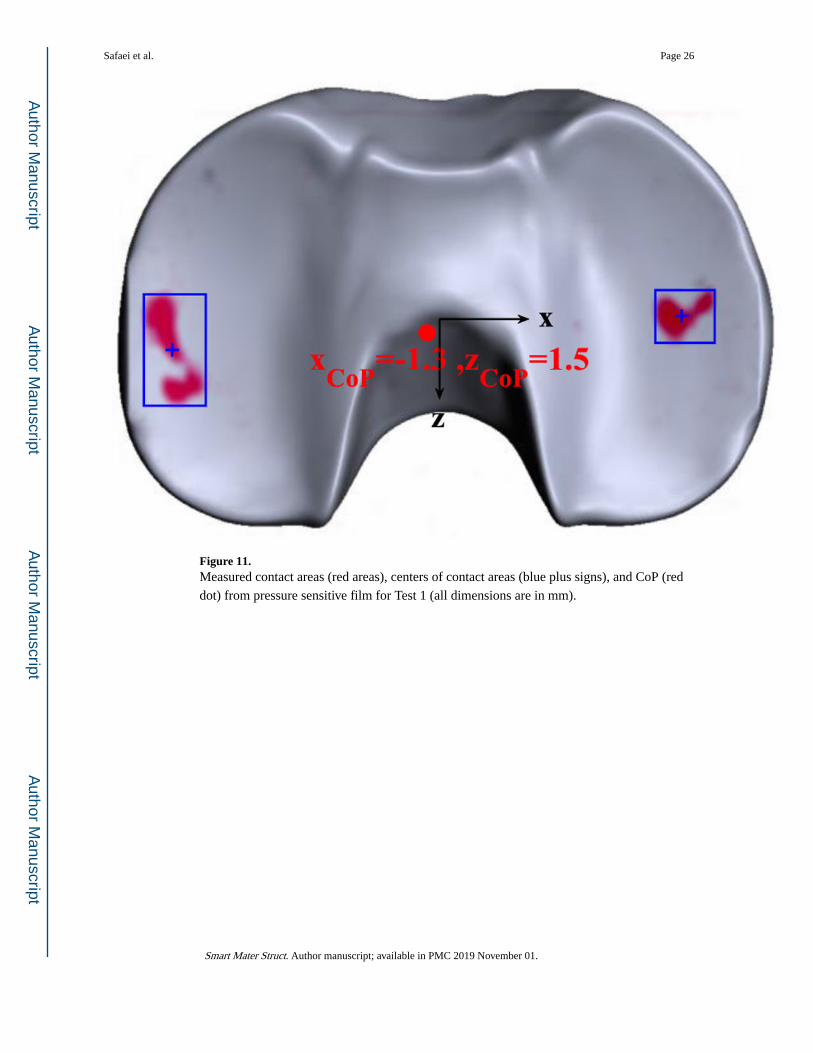
Figure 11. Measured contact areas (red areas), centers of contact areas (blue plus signs), and CoP (red
dot) from pressure sensitive film for Test 1 (all dimensions are in mm).
Safaei et al. Page 26
Smart Mater Struct. Author manuscript; available in PMC 2019 November 01.
Author M
anuscriptA
uthor Manuscript
Author M
anuscriptA
uthor Manuscript

Figure 12. Comparison of measured locations of CoP by PZTs and true locations from pressure
sensitive films for (a) Tests 1–6 when the bearing is moved in x-direction, and (b) Tests 7–12
when the bearing is moved in z-direction.
Safaei et al. Page 27
Smart Mater Struct. Author manuscript; available in PMC 2019 November 01.
Author M
anuscriptA
uthor Manuscript
Author M
anuscriptA
uthor Manuscript

Figure 13. Energy harvesting results showing (a) average power vs. resistive load, and (b) voltage on
3.3 mF storage capacitor vs. time.
Safaei et al. Page 28
Smart Mater Struct. Author manuscript; available in PMC 2019 November 01.
Author M
anuscriptA
uthor Manuscript
Author M
anuscriptA
uthor Manuscript

Author M
anuscriptA
uthor Manuscript
Author M
anuscriptA
uthor Manuscript
Safaei et al. Page 29
Table 1.
Material properties for PLA and piezoelectric materials.
Material Properties PLA Bearing [23] NCE51 (PZT-5A)Piezoelectric [24]
Young’s modulus [GPa] 3.5 52
Poisson’s Ratio 0.42 0.35
Density [kg/m3] 1240 7850
Piezoelectric Constant, d33 [pC/N] ___ 443×10−12
Piezoelectric Constant, d31 [pC/N] ___ −180×10−12
Piezoelectric Constant, d15 [pC/N] ___ 590×10−12
Relative Permittivity, ε33T /ε0
___ 1900
Smart Mater Struct. Author manuscript; available in PMC 2019 November 01.

Author M
anuscriptA
uthor Manuscript
Author M
anuscriptA
uthor Manuscript
Safaei et al. Page 30
Table 2.
Simulation parameters and results.
Simulation No. Angle α1 Angle α2Error in Total
ForceDeviation in x
(mm)Deviation in z
(mm)Total Deviation
(mm)
1 130.00 90.00 0.00% 0.26 0.19 0.32
2 90.00 90.00 0.00% 0.86 0.44 0.97
3 70.00 90.00 0.00% 0.89 0.65 1.10
4 50.00 90.00 0.00% 1.06 1.01 1.46
5 130.00 50.00 0.00% 0.67 0.79 1.04
6 90.00 50.00 0.00% 0.85 1.23 1.49
7 70.00 50.00 0.00% 1.34 0.15 1.35
8 50.00 50.00 0.00% 1.39 0.01 1.39
9 130.00 130.00 0.00% 0.76 0.08 0.76
10 90.00 130.00 0.00% 0.85 0.91 1.25
11 70.00 130.00 0.00% 1.10 2.10 2.37
12 50.00 130.00 0.00% 1.09 2.90 3.10
Smart Mater Struct. Author manuscript; available in PMC 2019 November 01.

Author M
anuscriptA
uthor Manuscript
Author M
anuscriptA
uthor Manuscript
Safaei et al. Page 31
Table 3.
The relative location of femoral component and bearing for the sensing tests.
Test No.Relative location in mm
Test No.Relative location in mm
x-direction z-direction x-direction z-direction
Test 1 0 0 Test 7 0 0
Test 2 −1.5 0 Test 8 0 −1.5
Test 3 −3 0 Test 9 0 −3
Test 4 −4.5 0 Test 10 0 −4.5
Test 5 +1.5 0 Test 11 0 +1.5
Test 6 +3 0 Test 12 0 +3
Smart Mater Struct. Author manuscript; available in PMC 2019 November 01.

Author M
anuscriptA
uthor Manuscript
Author M
anuscriptA
uthor Manuscript
Safaei et al. Page 32
Table 4.
Characteristics of electrical circuits for various wiring configurations of PZTs.
Configuration Governing EquationOptimum Resistor Maximum Power Peak Voltage
Harmonic Opensim Harmonic OpenSim Harmonic OpenSim
Single PZT CpdV t
dt + V tR = d33
dF tdt Ropt 600 kΩ P 0.067 mW Vp 6V
PZTs in series CpdV t
dt + 4V tR = d33
dF tdt 4Ropt 2400 kΩ 4P 0.268 mW 4Vp 24V
PZTs inparallel
4CpdV t
dt + V tR = d33
dF tdt
Ropt4
150 kΩ 4P 0.268 mW Vp 6V
Combinationof series andParallel PZTs
2CpdV t
dt + 2V tR = d33
dF tdt Ropt 600 kΩ 4P 0.268 mW 2Vp 12V
Smart Mater Struct. Author manuscript; available in PMC 2019 November 01.
