Embed Size (px)
Citation preview

Forages, Grazing, and Supplementation – Making it Work
65th UF/IFAS Beef Cattle Short CourseGainesville, FL
Kim Mullenix, Ph.D.Assistant Professor/Extension Specialist
Beef Cattle SystemsAuburn University
May 5, 2016
Shifting the Focus to Efficiency
Prevatt, UF/IFAS RCREC, 2016

Focus on Efficiency“You Can’t Manage What You Don’t Measure”
• Defined: Inputs needed to produced the desired output
• Tangible factors that can be tracked over time
Common Cow Measures• Cow body condition
score
• Reproductive efficiency– lbs weaning weight per
cow exposed
• Feed efficiency– Feed-to-gain ratio– Residual feed intake

Measures of Forage Production Efficiency
Forage Production (lb per acre)
Grazing days per year
Pounds of beef production per acre

Forages and Grazing ManagementImproving Productivity – Amount of Quality Forage
Produced Per Unit Land Area
• Fertility
• Pasture Stand Health Indicators
• Variety Selection

Fertility An Input Cost with a Measurable Return
0
100
200
300
400
500
600
Apr
-11
Jul-1
1O
ct-1
1Ja
n-12
Apr
-12
Jul-1
2O
ct-1
2Ja
n-13
Apr
-13
Jul-1
3O
ct-1
3Ja
n-14
Apr
-14
Jul-1
4O
ct-1
4Ja
n-15
Apr
-15
Jul-1
5O
ct-1
5
$ pe
r ton
UreaTSPKCl
Five Year Trend, indexmundi.com

Relationship between fertility and forage production (lb DM/acre)
02000400060008000
10000120001400016000
50 100 200 400
Bah
iagr
ass
Dry
Mat
ter Y
ield
(lb
DM
/acr
e)
Nitrogen application rate (lb N/acre)
Burton et al,, 1997
• What is an economical rate?
• Balance of N-P-K needs
• Greater return of nutrients in grazed ecosystems vs. hay production

Fertility – Grazed Ecosystems
Up to 70% of nutrients consumed may be
returned to the pasture system
N, P, and K
N and K– urineN and P – dung
Haynes and Williams, 1993; Mathews et al., 1996; Franzluebbers et al., 2004

FertilityHow Does it Improve Efficiency?
0
1000
2000
3000
4000
5000
6000
7000
2010 2011
Her
bage
Acc
umul
atio
n, lb
DM
/acr
e
ArgentinePensacolaTifton 9UF Riata
Vendramini et al., 2013
- 55 lb N/acre
- Spring vs. fall growth
- Grazed every 4 wk – 50% greater herbage accumulation
When combined with improved grazing methods, low rates of fertility
are beneficial for the forage production system

Forages and Grazing ManagementImproving Productivity – Amount of Quality Forage
Produced Per Unit Land Area
• Fertility
• Pasture Stand Health Indicators
• Variety Selection

Pasture Stand Health
• Measure of desirable forage production in the current system
• Take a walk, or stop and smell the roses!
• Actual vs. perceived

Evaluate:
1. What is the forage base I am working with?
2. What is the percent of desirable species in the stand?• Grass• Legumes• Weeds• Bare ground
3. Based on this, what can be done to improve the stand?
Pasture Stand Health Checklist

Pasture Stand Health How Does it Improve Efficiency?
Visual appraisal
Start with soils
Secondary FactorsIdentifies pastures that need renovation, rest,
etc. – increasing potential pounds of forage per acre produced
Forages and Grazing ManagementImproving Productivity – Amount of Quality Forage
Produced Per Unit Land Area
• Fertility
• Pasture Stand Health Indicators
• Variety Selection

Variety Selection• Understand the forage
base and how this relates to your production goals• 30 cows vs. 1,000 cows
• Desirable forage characteristics:– Yield, nutritive value,
persistence, disease resistance, cold tolerance
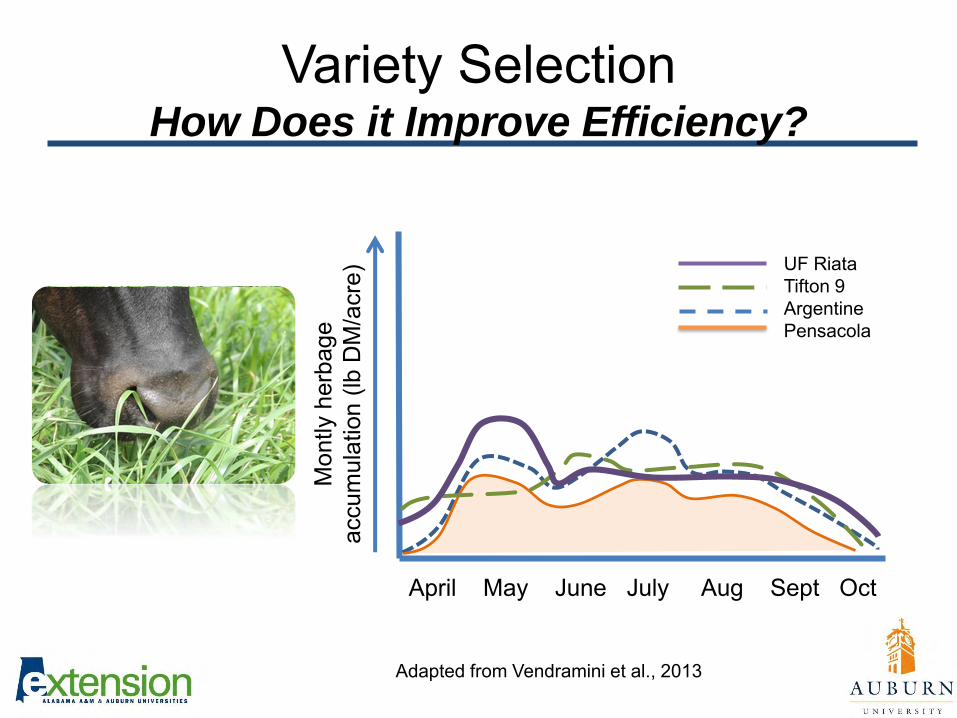
Variety Selection How Does it Improve Efficiency?
April May June July Aug Sept Oct
UF RiataTifton 9ArgentinePensacola
Adapted from Vendramini et al., 2013
Mon
tlyhe
rbag
e ac
cum
ulat
ion
(lbD
M/a
cre)

Variety SelectionHow Does it Improve Efficiency?
• Limpograss(Hemarthria sp.)– UF/IFAS
release of two new varieties since 2014
• KenHy and GibTuck
YearLimpograss
hybrid 2012 2013
DM Yield (tons/acre/year)1 4.0 b 4.8 a
KenHy (4F) 5.2 a 5.8 aGibTuck (10) 5.7 a 5.1 a
32 4.1 b 3.5 b34 4.1b 2.5 b
Floralta 4.8 ab 3.6 b
Source: Wallau et al., in review; Gainesville, FL
Ability to increase pounds of forage production per acre
Growth distribution

Forages and Grazing ManagementImproving Grazing Season Length – More Grazing Days
Per Year, Less Hay Feeding Days
• Stocking Rate – Number of Animals Per Unit Land Area
• Alternative Systems – Grazing Days Per Unit Land Area

Forage Supply
Animal Demand
Stocking rate is a “supply and demand” relationship
Time
*This is where other grazing management considerations come into play (i.e. grazing frequency, grazing method, time on paddock)

What we need to know:
• Forage Supply – Plant Considerations– Forage mass– % Forage Utilization– Number of Acres to be Grazed

What we need to know:
• Forage Demand – Animal Considerations– Average weight of animals to be grazed– Dry matter consumed per animal (% of body
weight per day)– Number of animals

What we need to know:
• Time – Days on Pasture

*Assume 27 lb DM (65% TDN, 14% CP) per day for 1,200 lb cow producing 20 lbmilk/day (2.25% of BW)Assume 4 lb DM per day for growing calf (average 1.5% BW across grazing season) –Boggs et al. (1980)
Dry, pregnant cows (1,200 pounds)
Warm-season forage system
180 grazing days
Fall-calving
Forage Production, Use, and Stocking Rate are Related
Forage SupplyAnimal Demand
TimeStocking rate can be a reflection of
how well the forage program is working for you

Forages and Grazing ManagementImproving Grazing Season Length – More Grazing Days
Per Year, Less Hay Feeding Days
• Stocking Rate – Number of Animals Per Unit Land Area
• Alternative Systems – Grazing Days Per Unit Land Area

Limpograss• 2012 and 2013• Cut to 8 inch height in
August• Fertilized with 45 or 90
lb N/acre – No N effect• Increasing herbage
mass with length of stockpiling period - 8, 12, or 16 wk
• Nutritive value – 50 to 58% TDN, 4% CP
0
1000
2000
3000
4000
5000
6000
7000
8000
1 10 4F FloraltaH
erba
ge a
ccum
ulat
ion
(lbD
M p
er a
cre)
Line
*
Source: Wallau et al., 2015

Bahiagrass
900
2500
4500
6500
Her
bage
acc
umul
atio
n (lb
DM
/acr
e)
Source: Evers et al., 2004

Bermudagrass
• Tifton 85 • Forage mass
– 4,700 lb DM/acre– 50 lb N/acre sufficient
• Nutritive value• Animal performance
– Maintained BCS of 5 until Jan.
Sampling Date CP, % TDN, %
Early-Nov 17 73Late-Nov 12 64
Dec 11 58Early-Jan 11 53Late-Jan 10 53Average 12 60
Table 1. Nutritive value of stockpiled Tifton 85 bermudagrass receiving different rates of N
fertilization.
Source: Holland et al., 2014

Economics
Holland et al., 2014

Measures of Forage Production Efficiency
Forage Production (lb per acre)
Grazing days per year
Pounds of beef production per acre
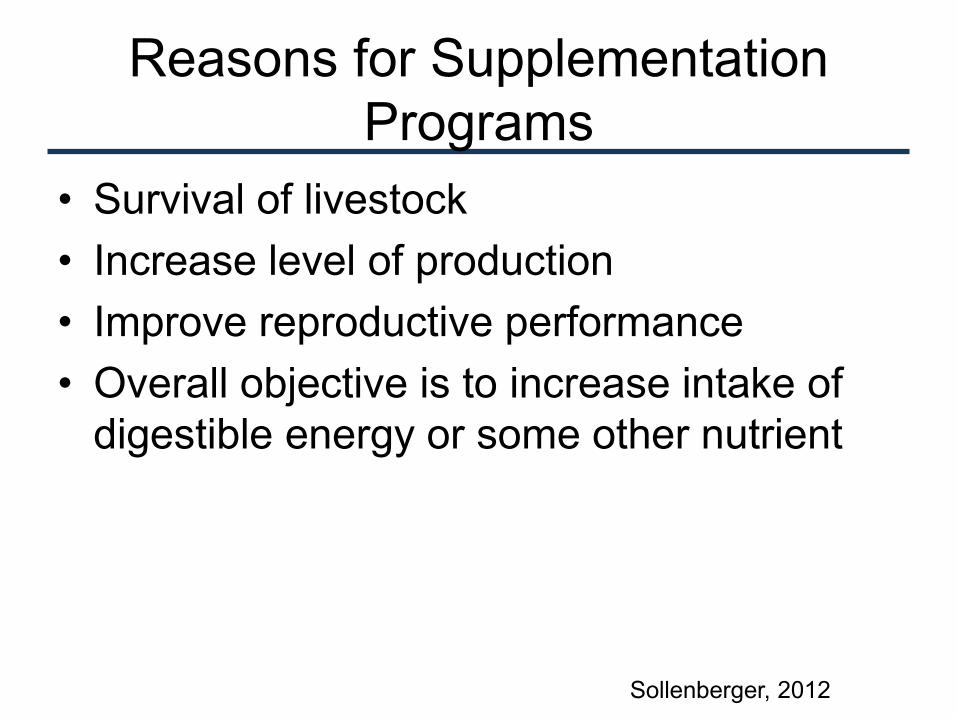
Reasons for Supplementation Programs
• Survival of livestock• Increase level of production• Improve reproductive performance• Overall objective is to increase intake of
digestible energy or some other nutrient
Sollenberger, 2012

0
2
4
6
8
10
12
14
16
18
1 2 3 4 5 6 7 8 9 10 11 12
Poun
ds o
f TD
N p
er d
ay
(lb/d
ay)
Peak milk production
Weaning
Oct Nov Dec Jan Feb Mar Apr May Jun Jul Aug Sept
Months Since
Calving
Strategic SupplementationDetermine nutrient requirements
1,200 lbcow
Fall calving system

Strategic SupplementationEstimate the amount of nutrients received from the forage
base
0
1
2
3
4
5
6
01020304050607080
Oct 24 Nov 28 Dec 13 Jan 16
% li
gnin
% d
iges
tibili
ty
IVDMD PED PDNDF ADL
0
1
2
3
4
5
6
7
01020304050607080
Nov 11 Nov 25 Jan 7 Jan 21
% li
gnin
% d
iges
tibili
ty
IVDMD PED PDNDF ADL
20132012
Stockpiled Tifton 85 bermudagrass
Source: Sechler, 2016

0
2
4
6
8
10
12
14
16
18
1 2 3 4 5 6 7 8 9 10 11 12
Poun
ds o
f TD
N p
er d
ay
(lb/d
ay)
Peak milk production
Weaning
Stockpiled limpograss
Oct Nov Dec Jan Feb Mar Apr May Jun Jul Aug Sept
Strategic SupplementationDetermine where deficiencies exist
1,200 lbcow
Stockpiled limpograss
8 to 10 wkaccumulation
50 to 59% TDN

Sources TDN, % CP, % $/ton $/pound TDNSoybean hulls 78 12 130 0.09Corn gluten feed
85 25 150 0.10
Dried distiller’s grains w/ solubles
85 30 220 0.13
Whole cottonseed
90 24 245 0.15
Corn 90 8 175 0.10
Alabama Weekly Feedstuff/Production Cost Report, May 2, 2016
Strategic SupplementationEstimating needs on a cost per pound of nutrient
basis

Measures of Forage Production Efficiency
Forage Production (lb per acre)
Grazing days per year
Pounds of beef production per acre

Forages and Grazing ManagementImproving Productivity – Amount of Quality Forage
Produced Per Unit Land Area
• Fertility– Nutrient returned vs. applied
• Pasture Stand Health Indicators– Visual assessment and renovation
• Variety Selection– Incorporation of improved varieties based on
production goals

Forages and Grazing ManagementImproving Grazing Season Length – More Grazing Days
Per Year, Less Hay Feeding Days
• Stocking Rate – Number of Animals Per Unit Land Area– Insight into the current forage production
program
• Alternative Systems – Grazing Days Per Unit Land Area– Intensifying use of an area to improve
efficiency

Final Thoughts
Nutrition
Reproduction
Health
Genetics
Economics
Forages
Efficiency

For more information, visit:
@ACESBeef
facebook.com/alabamabeefsystems
Website
www.alabamabeefsystems.comwww.secattleadvisor.com