Embed Size (px)
Citation preview

http://bit.ly/AS2019Slides - The code, slides and file you will need to load in the App (link below)
http://bit.ly/AS2019App - App (remember this requires the data in the zip file above)
For this workshop you
will need:

Agile Analytics:Using R Shiny to develop data analytics tools
Analytics Summit 2019 Eduardo Contreras Cortes

Motivation
Time Time
Time Time
SELECTED ITEMS FROM THE AGILE MANIFESTIO (http://agilemanifesto.org/principles.html):
Our highest priority is to satisfy the customer through early
and continuous delivery of valuable software
Welcome changing requirements, even late in
development. Agile processes harness change for the
customer's competitive advantage
Working software is the primary measure of progress
Simplicity--the art of maximizing the amount of work not
done--is essential

Motivation
Time Time
Time
Time Time
Time Time
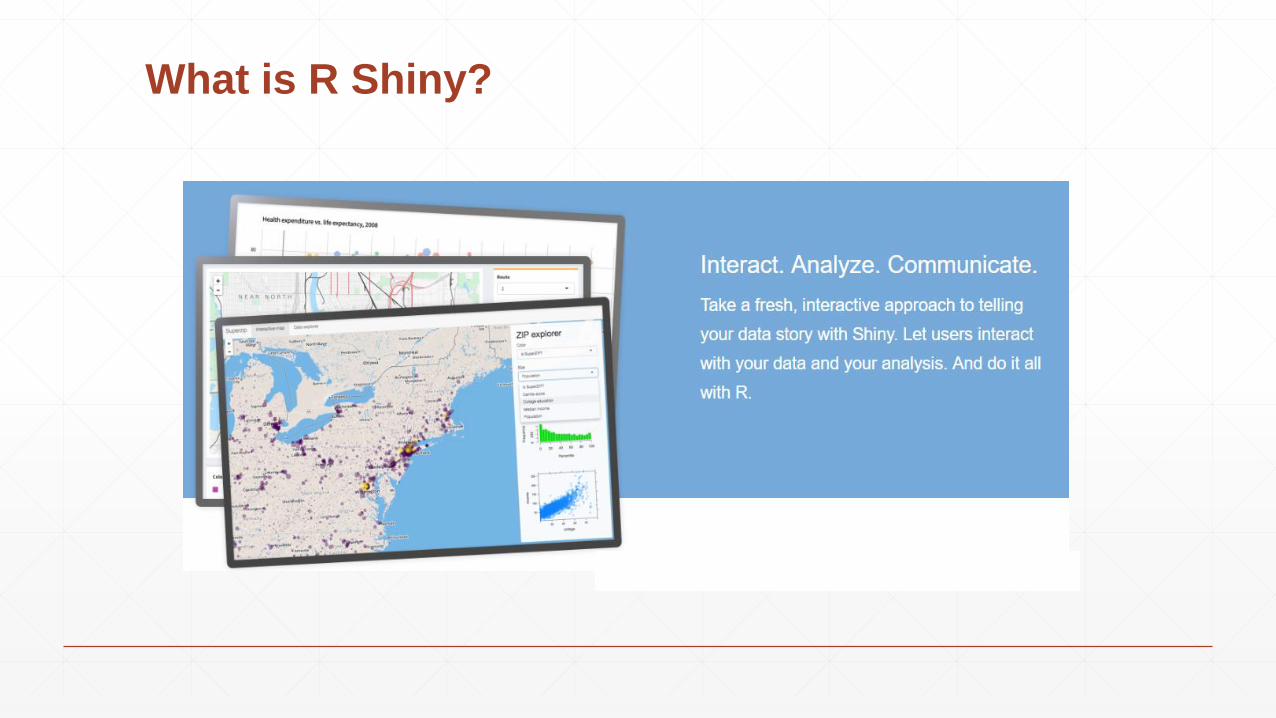
What is R Shiny?
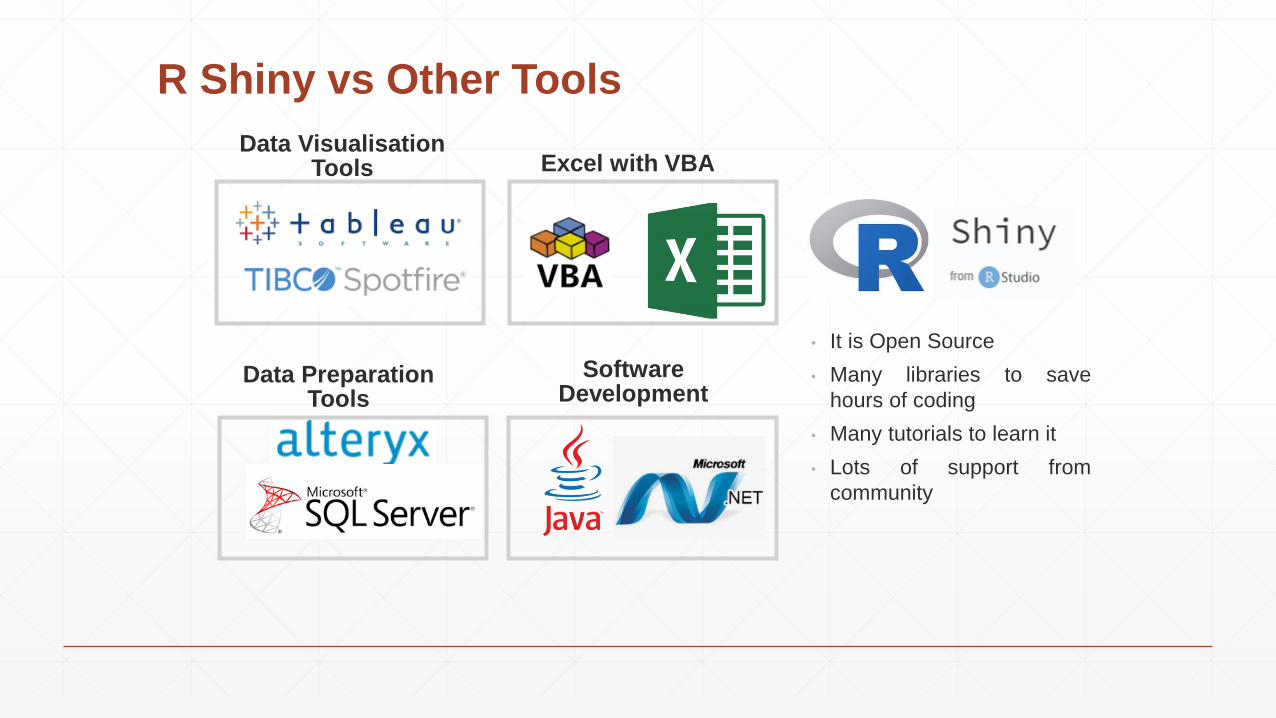
R Shiny vs Other Tools
Data Visualisation Tools
Data Preparation Tools
Excel with VBA
• It is Open Source
• Many libraries to save
hours of coding
• Many tutorials to learn it
• Lots of support from
community
Software Development

R vs Python

What will be covered?
• Load data from Excel
• Output data in a Table
• Plot data and filter source
• Calculate a logistic regression
• Download the model

What do you need to use R Shiny?
• R and R Studio
• Shiny libraries
• Other useful libraries
• Plotly: Interactive Graphics
• DT: Data tables outputs
• Dplyr and Tidyr: Data Transformations
• Smbinning: Produce summary statistics

Play time
• Lets give it a try to the app!
http://bit.ly/AS2019App
• And to download the code and this
slides
http://bit.ly/AS2019Slides

Lets explore the App
• Load the Excel File
• Explore the dataset
• Plot only “Married” customers
• Calculate the logistic regression
• Download the Results

How does it works?
• It has two main components
• The User Interface (UI)
• The Server

The basics
• We will use Shinydashboard, makes it easy to
use Shiny
• Lets Run the App by opening the UI.R file and
click in Run APP

The basics
• The dashboard has three parts: header, sidebar
and body

Basic DashboardAdding content to the Sidebar

Basic DashboardAdding content to the Body

And the last step…Adding the Header

All events triggered are in the Server File

And you can link to other files as a way to organise your code better

Where to learn more…• R programming
https://www.coursera.org/learn/r-programming
• Free Shiny Interactive Tutorial
https://www.datacamp.com/courses/building-web-applications-in-r-with-shiny
• More tricks of Shinydashboard and actions
https://rstudio.github.io/shinydashboard/structure.html
http://shiny.rstudio.com/gallery/widget-gallery.html
• Gallery of plots with code
https://plot.ly/r/
• Useful data transformations with Dplyr and Tidyr
https://dplyr.tidyverse.org/
https://blog.rstudio.com/2014/07/22/introducing-tidyr/
• Deploying your app to the web
• https://www.shinyapps.io/

Thanks!
Eduardo Contreras Cortes
https://www.linkedin.com/in/eduardocontrerasc/
@edco_one