Embed Size (px)
Citation preview

Annual Report 2009For the year ended March 31, 2009

Financial HighlightsITOCHU Techno-Solutions Corporation and Subsidiaries
Billions of Yen Millions of U.S. Dollars
2007 2008 2009 2009
For the Years Ended March 31:
Net sales ¥294.4 ¥319.3 ¥307.3 $3,127.0
Operating income 25.5 25.0 21.7 220.7
Net income 14.0 15.4 12.9 131.7
As of March 31:
Total assets 214.9 218.1 227.5 2.314.8
Total equity 140.5 145.7 147.8 1.503.9
Financial Ratios (%):
Return on equity (ROE) 11.0 10.8 8.8 —
Return on assets (ROA) 7.1 7.1 5.8 —
Per Share Data (Yen/U.S. Dollars):
Basic net income ¥225.90 ¥232.70 ¥199.21 $2.03
Cash dividends 70.00 80.00 80.00 0.81
Note: 1. U.S. dollar amounts represent translations of Japanese yen amounts at the rate of ¥98.26=US$1, the approximate rate of exchange as of March 31, 2009. 2. Owing to the October 1, 2006 merger with the former CRC Solutions Corp., pre-merger figures are based on those of former ITOCHU TECHNO SCIENCE
Corporation.
Cautionary Note Concerning Forward-Looking StatementsStatements made in this annual report with respect to CTC’s plans, strategies and beliefs, and other statements that are not historical facts are forward-looking statements about the future performance of CTC based on management's as-sumptions and beliefs in light of information currently available to it, and involve certain risks and uncertainties.
Net Sales(Billions of Yen)
0
70.0
140.0
210.0
280.0
350.0
226.8 239.0
294.4319.3
2005 2006 2007 2008
Total Assets and Total Equity(Billions of Yen)
Return on Equity (ROE) and Return on Assets (ROA)(%)
Net Income(Billions of Yen)
2005 2006 2007 2008
10.911.5
14.015.4
0
6.0
3.0
9.0
12.0
15.0
2005 2006 2007 20080
100.0
50.0
150.0
200.0
250.0
160.8178.1
214.9
105.3 115.7140.5
218.1
145.7
Total Assets Total Equity
2005 2006 2007 2008
307.3
2009 2009
12.9
2009
227.5
147.8
2009
ROE ROA
0
6.0
3.0
9.0
12.0
15.0
6.6 6.8 7.1 7.15.8
10.4 10.4 11.0 10.88.8
Contents 1 Message from the President
4 Special Feature: The Operating Infrastructure That Underpins CTC’s Growth
11 Corporate Governance
12 Corporate Social Responsibility (CSR)
13 Six-Year Consolidated Financial Summary
15 Management’s Discussion and Analysis of Results and Financial Condition
17 Financial Statements and Notes
36 Corporate Data
37 Board of Directors
38 Corporate Organization
39 Stock Information

Yoichi Okuda, President & CEO
• The service business steadily expanded in both sales and orders received
• Order backlog at year-end was highest since our shares went public, refl ecting rising orders for long-term projects, mainly in our service business
• Gross profi t margin achieved a record high due to the increasing proportion occupied by the service business
• Achieved record highs on a six-month basis for all measures of profi t in the second half by rigorously reining in unprofi table projects and controlling SG&A expenses
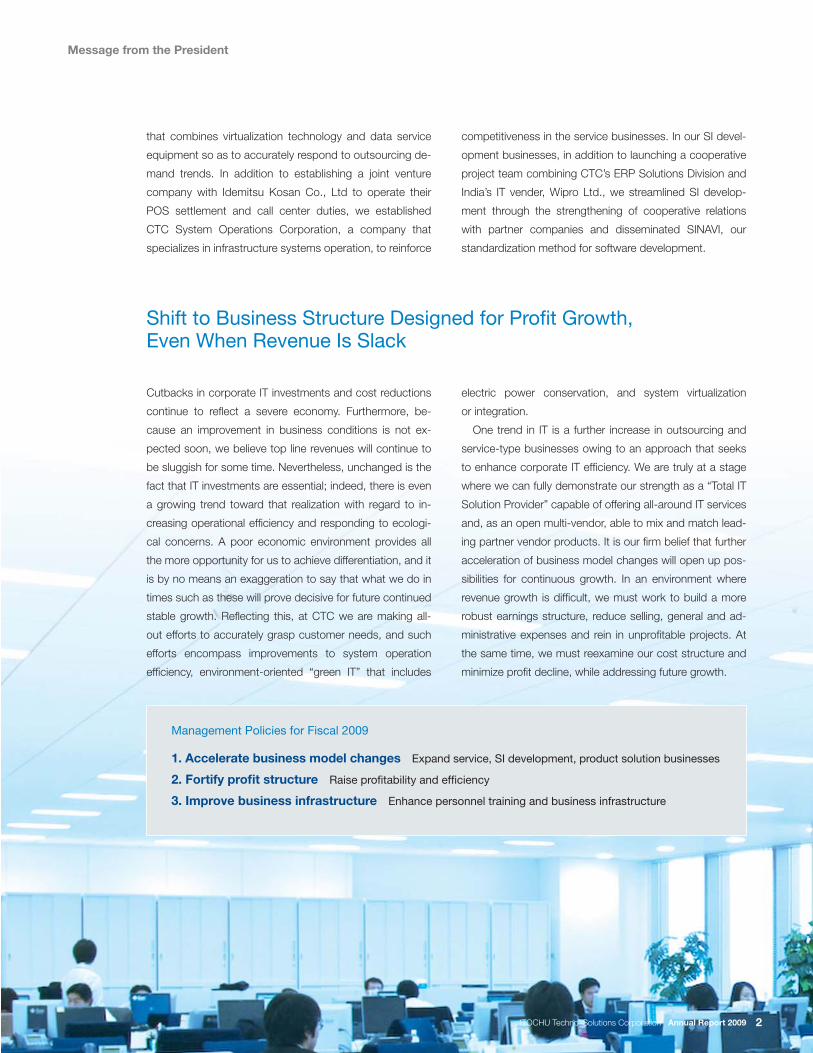
Through our endeavors under the slo-gan of “evolution,” fi scal 2008—despite being witness to a once-in-a-century fi nancial crisis—proved to be a mile-stone year in which we steadily ad-vanced toward a next-generation business model in each business area. Moving forward, “change” will be our keyword to achieve further growth in fi scal 2009.
1ITOCHU Techno–Solutions Corporation Annual Report 2009
Message from the President
Fiscal 2008 Highlights
With the global economy in the midst of such severe diffi -
culties, fi scal 2008 ended March 31, 2009 proved to be
extremely adverse for the Company, with revenue and prof-
its declining, mainly due to shrinking product sales. Despite
this environment, business model changes progressed
steadily, thanks to allocation of resources to the service
and SI development businesses. With relatively high profi t-
ability, service businesses that had the potential to provide
a stable revenue base grew favorably, allowing us to record
our highest ever gross profi t margin. At the same time, an
increase in long-term projects helped us expand backlog
to a record high at year-end.
As a concrete measure taken to expand the service busi-
ness, we commenced operations at “Mejirozaka Data
Center,” our fi fth data center. We also aimed to increase
sales of TechnoCUVIC, a fl exible, shared hosting service
Business Model Changes Are Progressing Steadily
Evolving Our Business Model
0
100.0
200.0
300.0
400.0
10.0
12.0
14.0
16.0
18.0
20.0
22.0
24.0
26.0
28.0
FY2004 FY2005 FY2006 FY2007 FY2008
78.5(35%)
30.5(13%)
117.8(52%)
76.5(32%)
42.1(18%)
120.3(50%)
105.3(36%)
55.0(19%)
133.9(45%)
128.0(40%)
69.4(22%)
121.8(38%)
134.9(44%)
67.1(22%)
105.1(34%)
23.7%24.5% 24.2%
25.2%26.1%
(Billions of Yen) (%)Merger with CRC
(Oct. 2006)
Service SI/Development Product Gross profit margin
2ITOCHU Techno–Solutions Corporation Annual Report 2009
Message from the President
Cutbacks in corporate IT investments and cost reductions
continue to refl ect a severe economy. Furthermore, be-
cause an improvement in business conditions is not ex-
pected soon, we believe top line revenues will continue to
be sluggish for some time. Nevertheless, unchanged is the
fact that IT investments are essential; indeed, there is even
a growing trend toward that realization with regard to in-
creasing operational effi ciency and responding to ecologi-
cal concerns. A poor economic environment provides all
the more opportunity for us to achieve differentiation, and it
is by no means an exaggeration to say that what we do in
times such as these will prove decisive for future continued
stable growth. Refl ecting this, at CTC we are making all-
out efforts to accurately grasp customer needs, and such
efforts encompass improvements to system operation
effi ciency, environment-oriented “green IT” that includes
Shift to Business Structure Designed for Profi t Growth, Even When Revenue Is Slack
electric power conservation, and system virtualization
or integration.
One trend in IT is a further increase in outsourcing and
service-type businesses owing to an approach that seeks
to enhance corporate IT effi ciency. We are truly at a stage
where we can fully demonstrate our strength as a “Total IT
Solution Provider” capable of offering all-around IT services
and, as an open multi-vendor, able to mix and match lead-
ing partner vendor products. It is our fi rm belief that further
acceleration of business model changes will open up pos-
sibilities for continuous growth. In an environment where
revenue growth is diffi cult, we must work to build a more
robust earnings structure, reduce selling, general and ad-
ministrative expenses and rein in unprofi table projects. At
the same time, we must reexamine our cost structure and
minimize profi t decline, while addressing future growth.
that combines virtualization technology and data service
equipment so as to accurately respond to outsourcing de-
mand trends. In addition to establishing a joint venture
company with Idemitsu Kosan Co., Ltd to operate their
POS settlement and call center duties, we established
CTC System Operations Corporation, a company that
specializes in infrastructure systems operation, to reinforce
competitiveness in the service businesses. In our SI devel-
opment businesses, in addition to launching a cooperative
project team combining CTC’s ERP Solutions Division and
India’s IT vender, Wipro Ltd., we streamlined SI develop-
ment through the strengthening of cooperative relations
with partner companies and disseminated SINAVI, our
standardization method for software development.
1. Accelerate business model changes Expand service, SI development, product solution businesses
2. Fortify profi t structure Raise profi tability and effi ciency
3. Improve business infrastructure Enhance personnel training and business infrastructure
Management Policies for Fiscal 2009
2ITOCHU Techno–Solutions Corporation Annual Report 2009

09年3月
3ITOCHU Techno–Solutions Corporation Annual Report 2009
Business areas Overall trends Promising areas/Key points
TelecomsAlthough large-scale projects are decreasing, expansion to target such new technology fi elds as NGN and WiMAX
FinanceDespite restrained investments in IT, expectations are for sales to be on par with previous year, partly due to the booking of large-scale development projects
ManufacturingFocus mainly on product sales, although demand in the automo-bile, semiconductor, electronic appliance and other sectors is ex-pected to remain weak
Transportation/Distribution
Anticipate increase in projects for general trading companies and convenience stores
Public Utilities SectorAnticipate expansion through increased demand owing to eco-nomic revitalization policies and booking of large-scale public works development projects
Business Outlook for Fiscal 2009
One specifi c business development that we have undertak-
en is the strengthening of service businesses that utilize
data centers. We will expand sales of our outsourcing busi-
nesses by creating a service menu that leverages the
Group’s collective strengths, covering operation and main-
tenance and the constructing of infrastructure. Specifi cally,
we will demonstrate our strengths in services that combine
SaaS and ASP with data center services, such as
TechnoCUVIC, an “IT Integrated Backbone Service” that
couples data center functions with virtualization technology.
Next, in the SI business, by taking such measures as
working closely with Wipro Ltd. of India in the ERP busi-
ness, we will strengthen our initiatives in backbone systems,
and will also intensively cultivate our fi elds of expertise,
including CRM, BI and DWH. At the same time, we will
Aiming for a Business Model That Works in Any Environment
promote SI business-related consulting services through
our new Solutions Business Promotion Department.
Beyond that, in products and solutions we aim to ac-
quire business opportunities that take advantage of the lat-
est trends in technology such as integration, virtualization
and cloud computing. To that end, we will build stronger
relations with infl uential vendors and upgrade and expand
our solutions lineup.
Amid the current economic environment, it is our goal to
be chosen as a partner by more customers and to secure a
reputation as a “leading company in the IT service industry.”
Yoichi Okuda
President & CEO
3ITOCHU Techno–Solutions Corporation Annual Report 2009
* Outlook as of beginning of the fi scal year ending March 31, 2010
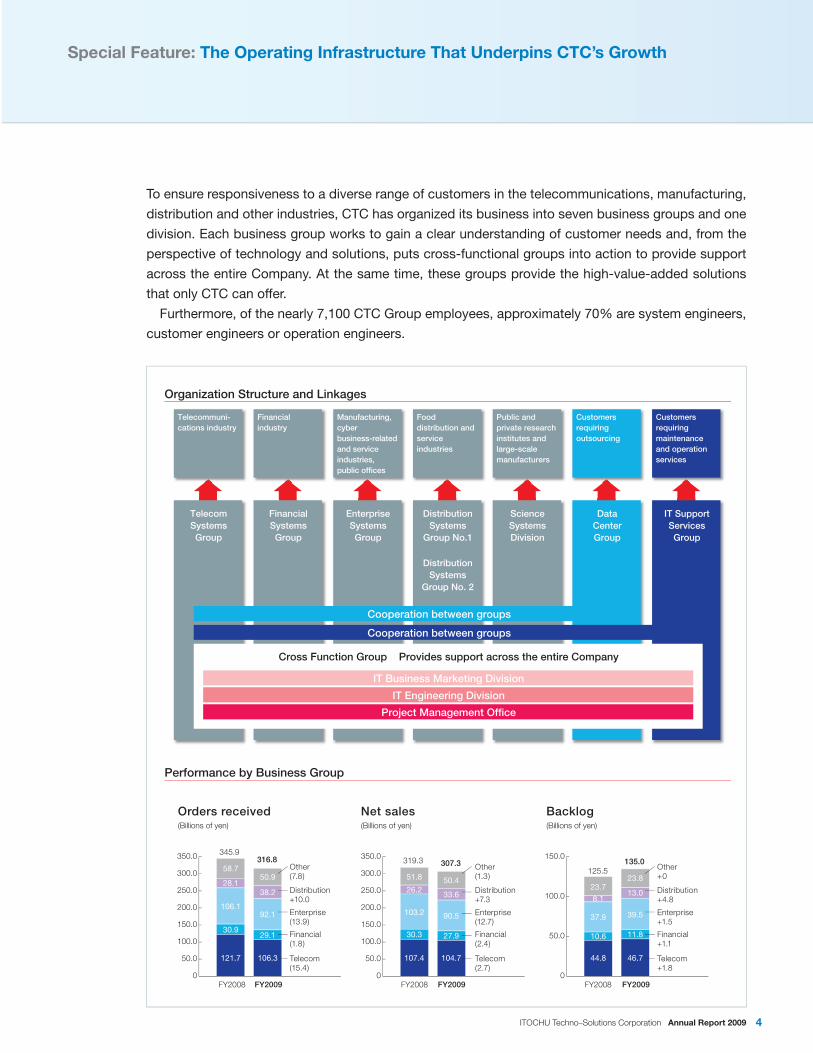
Organization Structure and Linkages
Performance by Business Group
Project Management Office
IT Engineering Division
IT Business Marketing Division
Cooperation between groups
Cooperation between groups
TelecomSystemsGroup
FinancialSystemsGroup
EnterpriseSystemsGroup
DistributionSystems
Group No.1
DistributionSystems
Group No. 2
ScienceSystemsDivision
DataCenterGroup
IT SupportServicesGroup
Cross Function Group Provides support across the entire Company
Telecommuni-cations industry
Financialindustry
Manufacturing, cyber business-related and service industries, public offices
Fooddistribution and serviceindustries
Public and private research institutes and large-scalemanufacturers
Customersrequiringoutsourcing
Customersrequiringmaintenanceand operation services
Orders received(Billions of yen)
Net sales(Billions of yen)
Backlog(Billions of yen)
FY2008 FY2009 FY2008 FY2009 FY2008 FY2009
345.9316.8 319.3 307.3
125.5135.0
0
50.0
100.0
150.0
200.0
250.0
300.0
350.0
0
50.0
100.0
150.0
200.0
250.0
300.0
350.0
0
50.0
100.0
150.0Other(7.8)
Distribution+10.0
Financial(1.8)
Telecom(15.4)
Enterprise(13.9)
Other(1.3)
Distribution+7.3
Financial(2.4)
Telecom(2.7)
Enterprise(12.7)
Other+0
Distribution+4.8
Financial+1.1
Telecom+1.8
Enterprise+1.5
44.8
10.6
37.9
8.1
23.7
46.7107.4
30.3
103.2
26.2
51.8
104.7
27.9
90.5
33.6
50.4
121.7
30.9
106.1
28.1
58.7
106.3
29.1
92.1
38.2
50.9
11.8
39.5
13.0
23.8
4ITOCHU Techno–Solutions Corporation Annual Report 2009
Special Feature: The Operating Infrastructure That Underpins CTC’s Growth
To ensure responsiveness to a diverse range of customers in the telecommunications, manufacturing,
distribution and other industries, CTC has organized its business into seven business groups and one
division. Each business group works to gain a clear understanding of customer needs and, from the
perspective of technology and solutions, puts cross-functional groups into action to provide support
across the entire Company. At the same time, these groups provide the high-value-added solutions
that only CTC can offer.
Furthermore, of the nearly 7,100 CTC Group employees, approximately 70% are system engineers,
customer engineers or operation engineers.

5ITOCHU Techno–Solutions Corporation Annual Report 2009
The Telecom Systems Group is engaged in business primar-ily with such telecommunications carriers and related com-panies as the NTT Group, KDDI Group and Softbank Group. The Telecom Systems Group proposes and constructs sys-tems based on network and server technologies, accumu-lated over many years, which are the core of the Internet. The Group meets the demands for the development of high-ly complex, mission-critical systems, including large-scale networks and databases, high-volume transaction systems and load-balanced processing. Specifi cally, the Group’s
strengths lie in adopting and customizing advanced over-seas technologies and offering them to customers. These technologies are used in such next-generation network-related businesses as cloud networking, NGN and WiMAX. Recently, the Group commenced a new business that sup-ports the construction and operation of systems for mobile virtual network operators (MVNO) wishing to provide original wireless services with wireless communications equipment leased from mobile network operators. It is also involved in providing solutions that streamline distribution by utilizing GPS information.
The Telecom Systems Group has rolled out a telematics service that makes fur-ther use of its original wireless commu-nications technology. Telematics is a real-time information control technology that combines such mobile platforms as automobiles with telecommunication systems. The Group commenced this new service by taking advantage of its experience in the wireless communica-tions market and joining it with U.S.-based Telargo Inc.’s telematics service. For example, for distribution applications, the service consists of a special terminal with wireless communications and global positioning system (GPS) functions mounted on a commercial vehicle. The vehicle’s preferred routing will be provided from the service’s control center based on traffi c conditions, and appro-priate personnel and operational details are provided based on vehicle location data and order information. In addition, this system provides drivers with instructions on energy-effi cient driving and other relevant information with the aim of improving operational effi ciency and reducing transportation costs. Using this service, vehicle allocation and distribution plans can be optimized based on collected data and its analysis, rather than relying on the personal judgment of vehicle dispatchers, a common practice in the past. There are over 60,000 trucking companies operating approximately nine million trucks in Japan’s distribution industry alone, and, given the potential of such systems if used effectively in other industries, the telematics service is expected to exhibit high growth.
Development of Telematics Service Business through Partnership with Telargo Inc.
Telecom Systems Group Employees: 650 (approx.)
CASESTUDY
CTC delivered an access gateway system and peripheral equipment featuring Wi-Fi WIN for a service initiated by KDDI in June 2009. Wi-Fi WIN is an Internet service available via au mobile phones that utilizes household wireless LAN and fi xed broadband lines. CTC, selected as a vendor for the construction of this infrastructure, provided a total solution that covers development, construction and maintenance support for peripheral equipment, primarily for the ac-cess gateway system based on the ST40 platform of Starent Network, Corp., a CTC business partner. The Group has consistently demonstrated its capabilities in the construction of systems for mobile phones. It has a portfolio of experience in support of KDDI—from starting up IP-related services to systems development, construction, maintenance and operation—that has earned high ratings in the areas of integration capabilities and construction know-how in a multivendor environment. It was this expertise that ensured our selection as the ven-dor for this new service.
Delivery of Access Gateway System for KDDI’s Wi-Fi WIN Service
Telematics service
Human resources
VehiclesInternal
operations
Externaloperations
Various types of equipment
Internal operations External operations
Business applications (ERP, SCM, etc.) Mobile Asset Management
Internal External
CTC HPC consulting services
Verification center facility
Computing resources
System A
ALM
System B
Portfoliomanagement
System C
Riskmanagement
System D
New product management
(R&D environment)
Financial HPC Lab
Grid computing resources are provided and billed for on a monthly basis
Financial library High-speed network Grid middleware
6ITOCHU Techno–Solutions Corporation Annual Report 2009
Special Feature: The Operating Infrastructure That Underpins CTC’s Growth
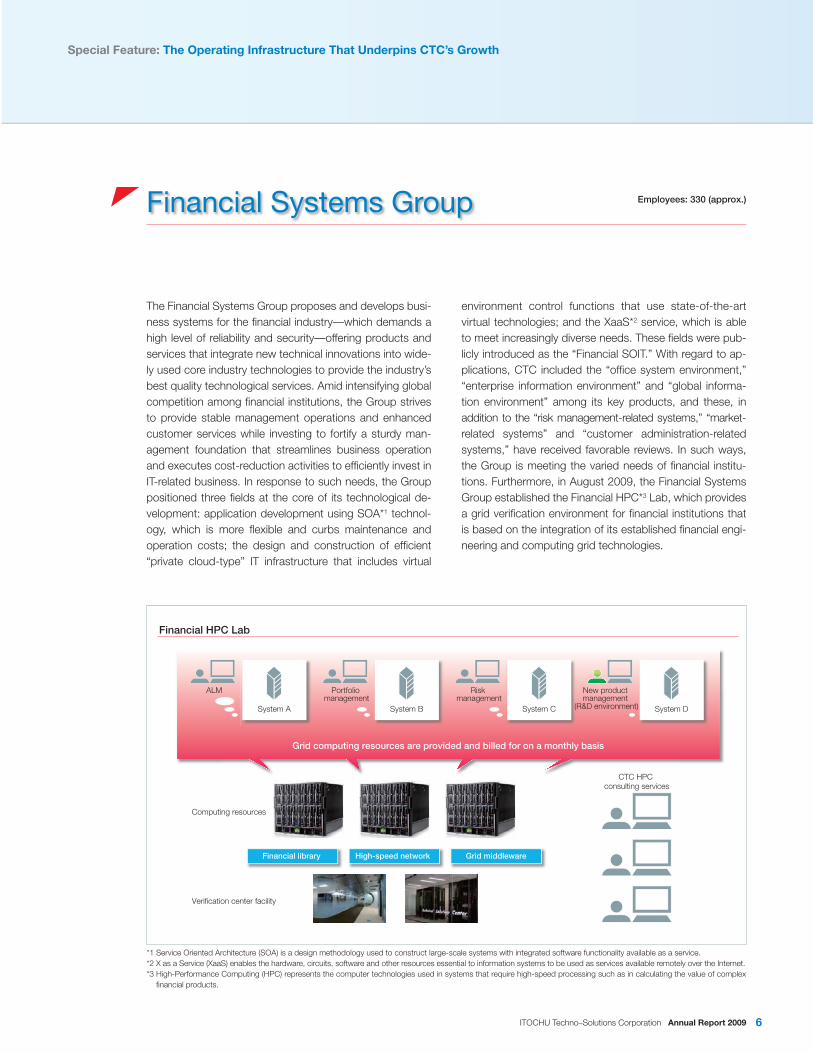
The Financial Systems Group proposes and develops busi-ness systems for the fi nancial industry—which demands a high level of reliability and security—offering products and services that integrate new technical innovations into wide-ly used core industry technologies to provide the industry’s best quality technological services. Amid intensifying global competition among fi nancial institutions, the Group strives to provide stable management operations and enhanced customer services while investing to fortify a sturdy man-agement foundation that streamlines business operation and executes cost-reduction activities to effi ciently invest in IT-related business. In response to such needs, the Group positioned three fi elds at the core of its technological de-velopment: application development using SOA*1 technol-ogy, which is more fl exible and curbs maintenance and operation costs; the design and construction of effi cient “private cloud-type” IT infrastructure that includes virtual
environment control functions that use state-of-the-art virtual technologies; and the XaaS*2 service, which is able to meet increasingly diverse needs. These fi elds were pub-licly introduced as the “Financial SOIT.” With regard to ap-plications, CTC included the “offi ce system environment,” “enterprise information environment” and “global informa-tion environment” among its key products, and these, in addition to the “risk management-related systems,” “market-related systems” and “customer administration-related systems,” have received favorable reviews. In such ways, the Group is meeting the varied needs of fi nancial institu-tions. Furthermore, in August 2009, the Financial Systems Group established the Financial HPC*3 Lab, which provides a grid verifi cation environment for fi nancial institutions that is based on the integration of its established fi nancial engi-neering and computing grid technologies.
Financial Systems Group Employees: 330 (approx.)
*1 Service Oriented Architecture (SOA) is a design methodology used to construct large-scale systems with integrated software functionality available as a service.*2 X as a Service (XaaS) enables the hardware, circuits, software and other resources essential to information systems to be used as services available remotely over the Internet.*3 High-Performance Computing (HPC) represents the computer technologies used in systems that require high-speed processing such as in calculating the value of complex
fi nancial products.

7ITOCHU Techno–Solutions Corporation Annual Report 2009
The Enterprise Systems Group provides high-value-added solutions to a wide range of customers spanning nearly 2,000 organizations in fi elds that include manufacturing, the cyber business, distribution, transportation, services, government and academia. These solutions extend from specialized and sophisticated services, such as business strategy proposals and consulting, to infrastructure con-struction, system development and operation and mainte-nance services. In response to growing security, as well as convenience, productivity and other offi ce environment is-sues, the Group offers its capabilities in the construction of
information infrastructure, particularly with regard to the in-troduction of thin client systems. It also provides content management solutions that leverage know-how introduced at CTC, and CRM/DWH solutions. The Group is currently rolling out digital signage solutions for marketing use and other large-scale infrastructure utilizing virtualization tech-nology. Digital signage solutions transmit data and images on a timely basis to displays installed in transportation fa-cilities, stores and other locations, and they even track customer movements.
Enterprise Systems Group Employees: 1,000 (approx.)
The CMS Cloud Service for Municipalities provides content management systems using Software as a Service (SaaS). To improve convenience for various local residents, including senior citizens, the disabled and foreign resi-dents, the Enterprise Systems Group offers CMS via the Internet with functionality based on the Japan Industrial Standard “Guidelines for older persons and persons with disabilities” (JIS X 834-3) that encompasses text-reading software, color management and other functions. Because municipalities are able to use CMS simply by paying a monthly usage fee—in other words, customers no longer have to own the software and related hardware—website operation costs can be kept down.
Using SaaS to Provide Content Management Systems That Reduce the Operation Management Costs of Home Pages for Municipalities
CASESTUDY
For Kanto Auto Works, Ltd., the Enterprise Systems Group constructed, using advanced system integration, an integrated companywide IT infrastructure that serves as a common infrastructure for all internal applications. Incorporating virtualization technology, the infrastructure integrates the entire company by consolidating 102 serv-ers and hierarchical storage management. The Group achieved a 40% cost reduction through server and storage integration, constructed a remotely situated disaster site for storage of backup data and standardized operational work throughout the company.
Constructing a Common IT Infrastructure throughout the Company That Integrates Servers, Storage and Operation

8ITOCHU Techno–Solutions Corporation Annual Report 2009
The distribution systems groups provide a total service over the IT lifecycle—from consulting to procurement, de-velopment and launch—through operation and mainte-nance support, to specifi c customers, particularly those in the food product, distribution and service industries. The Groups constructed and launched a store management system for convenience stores and mission-critical sys-tems, such as corporate management and data analysis
systems for the wholesale industry, which includes general trading companies and food product companies. As a ser-vice partner of SAP Japan, the Groups also focused on the ERP system development business. In order to lower risk during systems migration and reduce downtime when up-grading SAP systems, the Groups provide original solutions and construct high-quality setups by leveraging its offshore development capabilities.
Special Feature: The Operating Infrastructure That Underpins CTC’s Growth
Distribution Systems Groups No. 1 and No. 2 Employees: 430 and230 (approx.)
To accommodate the growth of electronic money-based settlement services, such as Suica, Edy and NTT DoCoMo’s iD, provided at FamilyMart, a convenience store chain that provides 24/7 service through approxi-mately 7,600 shops nationwide, the Groups constructed a system that was compliant with internal controls there-by creating a more robust infrastructure. Against this backdrop, in January 2009, the Groups successfully completed a massive, almost year-long upgrade of a mission-critical system that supports FamilyMart store op-erations. The Groups provided support for the FamilyMart system for its entire lifecycle, from formulating the plan to constructing the system, testing, systems migration and operation and maintenance.
Successful Completion of Large-Scale, Year-Long, Around-the-Clock System Upgrade
CASESTUDY
Store management system
Optic-fibercircuit
Sales data, orders,customer information
Ordering
Vendor B
Headquarters of FamilyMartCentral control by large system
Store StoreStore
Vendor A Vendor C
Management analysis data, ticket service
9ITOCHU Techno–Solutions Corporation Annual Report 2009
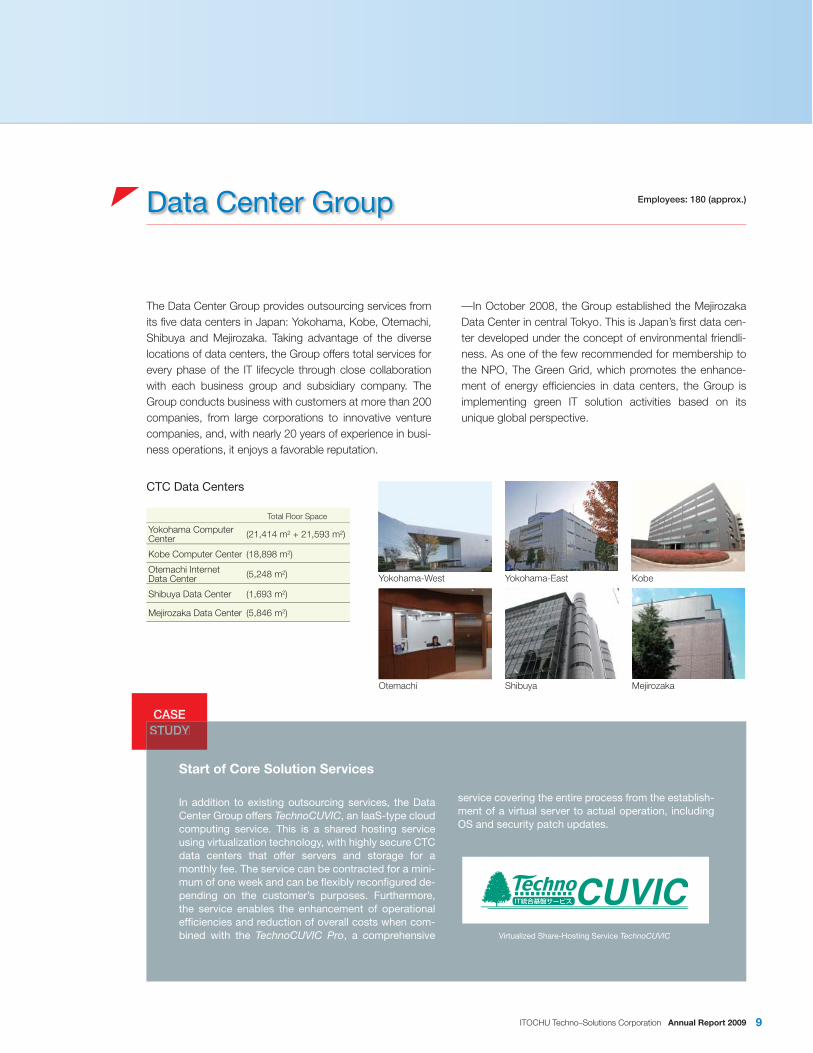
The Data Center Group provides outsourcing services from its fi ve data centers in Japan: Yokohama, Kobe, Otemachi, Shibuya and Mejirozaka. Taking advantage of the diverse locations of data centers, the Group offers total services for every phase of the IT lifecycle through close collaboration with each business group and subsidiary company. The Group conducts business with customers at more than 200 companies, from large corporations to innovative venture companies, and, with nearly 20 years of experience in busi-ness operations, it enjoys a favorable reputation.
—In October 2008, the Group established the Mejirozaka Data Center in central Tokyo. This is Japan’s fi rst data cen-ter developed under the concept of environmental friendli-ness. As one of the few recommended for membership to the NPO, The Green Grid, which promotes the enhance-ment of energy effi ciencies in data centers, the Group is implementing green IT solution activities based on its unique global perspective.
Data Center Group Employees: 180 (approx.)
In addition to existing outsourcing services, the Data Center Group offers TechnoCUVIC, an IaaS-type cloud computing service. This is a shared hosting service using virtualization technology, with highly secure CTC data centers that offer servers and storage for a monthly fee. The service can be contracted for a mini-mum of one week and can be fl exibly reconfi gured de-pending on the customer’s purposes. Furthermore, the service enables the enhancement of operational effi ciencies and reduction of overall costs when com-bined with the TechnoCUVIC Pro, a comprehensive
CASESTUDY
CTC Data Centers
Virtualized Share-Hosting Service TechnoCUVIC
Start of Core Solution Services
service covering the entire process from the establish-ment of a virtual server to actual operation, including OS and security patch updates.
Otemachi
Yokohama-West
Mejirozaka
Kobe
Shibuya
Yokohama-East
Total Floor Space
Yokohama Computer Center (21,414 m2 + 21,593 m2)
Kobe Computer Center (18,898 m2)
Otemachi Internet Data Center (5,248 m2)
Shibuya Data Center (1,693 m2)
Mejirozaka Data Center (5,846 m2)

10ITOCHU Techno–Solutions Corporation Annual Report 2009
Special Feature: The Operating Infrastructure That Underpins CTC’s Growth
For public- and private-sector research institutions and large manufacturers, the Science & Engineering Systems Division provides advanced, specialized, high-value-added services and solutions that are based on computational science. For the construction industry, it provides such so-lutions as soil and rock analysis, seismic analysis and bridge structure analysis. The Division also offers consult-ing, systems development and operation services in the area of renewable energy, including wind and solar power, as well as joint operation and management and demand
forecasts for existing energy sources. In the manufacturing fi eld as well, as a pioneer in CAE technology, it provides total solutions that cover everything from various types of application software to technical support and consulting services. In October 2009, CTC strengthened its efforts, becoming the fi rst company in Japan to initiate an ASP-type service providing information (primarily to construction operators) that combines weather information, which it had already been providing for many years, and emergency earthquake alerts.
Science & Engineering Systems Division Employees: 200 (approx.)
Against the backdrop of increasing corporate efforts to reduce CO2 emissions in order to prevent global warming, Universal Shipbuilding Corporation, one of Japan’s leading shipbuilding companies, developed Sea-Navi® to enable fuel cost reductions through the selection of optimal sea shipping routes. Since project commencement in 2005, the Science & Engineering Systems Division has cooperated with Universal Shipbuilding Corporation, leveraging its technologies in geosciences, architectural analysis, meteorological information analysis and system development fi elds. As a result of running simulations, it was realized that sub-stantial fuel cost reduction benefi ts could be achieved. Universal Shipbuilding and the Division will continue to cooperate with a view toward practical use in the future.
Development of Navigational Support System “Sea-Navi®” for Universal Shipbuilding That Brings Together Scientifi c Know-How
CASESTUDY
CTC will offer EQ+, the fi rst ASP-type service in Japan to transmit both emergency earthquake alerts and weather information, primarily to construction operators. The transmission of emergency information concerning natural disasters combined with earthquake alerts allows for the centralized management of disaster risk at construction sites where disasters are an everyday concern. In recent years, construction operators have been asked to con-tribute to local communities by rushing to sites when disaster strikes to swiftly perform emergency recovery and promptly restore lifelines. Through this service, CTC supports the reduction of construction site disasters and helps construction operators fulfi ll their social mission.
Offering Japan’s First ASP-Type Business Continuity Planning (BCP) Support System for Times of Disaster
Display screen for maritime weather data and recommended course search results

11ITOCHU Techno–Solutions Corporation Annual Report 2009
Election and Dismissal
Board of Directors12 Directors
(Including one outside director)
Board of Corporate AuditorsFour Corporate Auditors
(Including three outside auditors)
Management Committee(President’s advisory institution)
Audit Division Independent Auditor
General Meeting of Shareholders
President and CEO
Election and Dismissal
Election and Dismissal
Monitoring and Auditing
Independent Audit
Election and Dismissal
Corporate Governance System
Corporate Governance
Basic Stance on Corporate GovernanceThe CTC Group’s basic stance on corporate governance is ground-ed in the overarching philosophy of “Challenging Tomorrow’s Changes.” This represents the execution of a clear mission and ac-cepting the ongoing challenge of achieving our vision founded on a fi rm sense of values. In this way, we at CTC endeavor to implement our philosophy of changing society for the better through business activities. It is based on this corporate philosophy that we are fur-ther enhancing management transparency and fairness and striv-ing to reinforce corporate governance.
Corporate Governance System and StructureThe Board of Directors, which consists of 12 members, including one outside director, convened meetings on a total of 18 occasions during the previous fi scal year. The Board of Directors makes deci-sions on important management-related issues and supervises the execution of duties by directors in accordance with various laws, the Company’s Articles of Incorporation, General Meeting of Shareholders’ resolutions, Board of Directors’ regulations, CTC’s corporate philosophy and the Group Code of Conduct. The Board of Corporate Auditors is composed of four members, three of whom are appointed from outside the Group. In the previ-ous fi scal year, the Board of Corporate Auditors met on 11 occa-sions. Within the limits of their legal authority, Corporate Auditors cooperate with the Audit Division and Independent Auditor and au-dit the execution of duties by directors for appropriateness. Furthermore, CTC has adopted an executive offi cer system. This system is intended to delegate authority and responsibility for busi-nesses in specifi c fi elds and encourage quick decision making. Executive offi cers perform their duties within a defi ned scope of au-thority and in accordance with the instructions of the representative director. Directors responsible for the execution of specifi c duties hold the concurrent position of executive offi cer.
Internal Control and Risk Management SystemsIn an effort to enhance the effi cacy of its corporate governance systems, CTC places considerable emphasis on developing a ro-bust structure that encompasses compliance, risk management and internal control. Internal control is indispensable for the survival and continuous development of a company, and we believe that it should be inte-grated into our daily work. On this basis, CTC has promoted the
framework of a system required by law, and in 2006 we formulated our “Basic Policy on the Internal Control System” and established the Internal Control Preparation Committee, which, after fi scal 2008, became known as the Internal Control Committee. Based on the Corporate Law of Japan, the system of internal control assures the appropriateness of operations, with the Corporate Planning Department tasked as the principal authority to conduct oversight and review, with the results being reported to the Internal Control Committee. A framework exists whereby upon de-termination of points for improvement, approval for their implemen-tation from the Board of Directors is obtained. The “Basic Policy on the Internal Control System” also undergoes a review by the Board of Directors once every year. The CTC Group’s compliance system includes the “CSR Committee,” an advisory institution to the President (Management Committee) that plans, implements and makes judgments on com-pliance, and the CSR and Security Team as a unit for supervision. A committee meeting is held fi ve times a year, and non-scheduled meetings are also held as necessary. Decisions made at committee meetings are reported to the Management Committee meeting held twice a year. In addition, for each business group, administra-tion unit and subsidiary company, we assigned an “Ethics and Compliance Leader” who provides communication and education on and implementation of compliance-related matters and who also monitors the compliance status at his or her unit or company. Furthermore, in order to disseminate information and enlighten workers regarding compliance issues, we conduct compliance ed-ucation as part of our employee training, and we also refer to com-pliance matters in our personnel evaluations. Based on this education, we require each employee of the CTC Group to submit a statement concerning the observance of ethics, compliance and information security once a year. By doing so, we help to prevent the occurrence of accidents and, in case an accident does occur, we appropriately respond to it and take countermeasures. The Company has established various internal committees and a control division, in addition to the Risk Control Committee, to re-spond to diverse risks. In addition, we have created various man-agement regulations, business continuity plans, investment standards, credit limits and a reporting and supervisory structure, and established necessary risk management systems and man-agement methods to control risks throughout the Group.

12ITOCHU Techno–Solutions Corporation Annual Report 2009
Promotion of CSR
Corporate Social Responsibility (CSR)
Stakeholder RelationsIn the course of pursuing their business activities, companies estab-lish and maintain relationships with various stakeholders. As part of its efforts to contribute to the creation of a sustainable society, the CTC Group works to maintain and develop good relationships with its stakeholders. The environment can be considered an important stakeholder as well. We are proactively working to “do whatever it takes” to address such global issues as global warming, the depletion of resources and the destruction of eco-systems.
Efforts for the Reliable Promotion of CSRThe CTC Group launched a CSR Project Team comprised of each business group and major subsidiary company’s planning and ad-ministration manager as a CSR Promotion Manager. CSR promo-tion managers control the implementation of action plans and conduct discussions about CSR promotion at monthly CSR Project Meetings. Each activity is reported to the CSR Committee on a regular basis and reviewed at CSR Committee meetings. Each business group and subsidiary company established a specifi c CSR Action Plan in accordance with its business descrip-tion and strives to enhance its CSR activities by following a plan-do-check-action (PDCA) cycle. Action Plans mainly target the reduction of environmental burden created in the business opera-tion process as well as the achievement of CSR objectives at each business group and subsidiary company.
Our Stance and Issues Related to the EnvironmentThe use of information technology reduces the unproductive move-ment of people and things by increasing effi ciency, thus enabling the reduction of environmental burden in society as a whole. Given this, the CTC Group will aim to improve the global environment through its business activities, including the improvement of cus-tomers’ work effi ciency and making proposals on power-saving equipment. On the other hand, even in the information service industry, we cannot avoid affecting the environment through our business oper-ations. In particular, data centers that support customers’ systems consume large quantities of electric power. Therefore, the CTC Group endeavors to reduce its consumption of electricity.
Environmental Management SystemWe established the CSR Management System based on an envi-ronmental policy that complies with our corporate philosophy. Environmental concerns are discussed at CSR Committee meet-ings, and decisions are put into practice mainly by the environmen-tal control manager, along with environmental managers and eco-leaders at each business group and subsidiary company. The CTC Group is also steadily promoting acquisition of ISO14001 Certifi cation. During fi scal 2008, the Aoyama Offi ce, Kudan Offi ce, Kudan Minami Offi ce and Shinkiba Logistics Center acquired certifi cation, adding to the existing seven certifi ed offi ces.
Approach to Local CommunitiesThe CTC Group includes “social development” as part of its corpo-rate philosophy, and beginning with participation in the local com-munity as a company that is an integral member of society, we believe that it is our social responsibility to conduct—and to pro-mote enthusiastically—activities that contribute to society. For example, we participated in the “Walk the World” charity event to help eliminate starvation; conducted Mt. Fuji beautifi cation activities as part of the MOTTAINAI campaign; and performed Lake Biwa cleaning activities on Lake Biwa Day (July 1st). These and other activities increase opportunities for the active participation of our employees. Furthermore, we continue to offer support to NPOs such as the Family House, which provides accommodations for seriously ill chil-dren and their families, as well as the Guide Dog & Service Dogs Association of Japan, which nurtures these care-providing animals.
CSR Policy
The Society That the CTC Group Aims for and Our Role The CTC Group is a group of companies supporting and improving the information infrastructure systems that serve society. Up to this point, we have been contributing to the establishment and development of an information society by providing custom-ers with technology products and services. From now on, we will assiduously strive to understand how the information society of the future will be formed and, through com-munication with various stakeholders, including customers, we will work to develop information infrastructure systems to better contribute to this future with the intention of creating a society where all people can enjoy the benefi ts of IT. In this way, passing on a sustainable society to the next generation through the power of IT is the corporate social responsibility of the CTC Group.
DivisionDivision Division
DepartmentDepartment Department
Directors of each business group
Planning and Administration Manager (CSR Promotion Manager)
CSR Committeemembers
CSR Committee
ReportingSupporting
andChecking

13ITOCHU Techno–Solutions Corporation Annual Report 2009
Billions of Yen
2004 2005 2006 2007 2008 2009
For the Years Ended March 31:
Net sales ¥ 266.2 ¥ 226.8 ¥ 239.0 ¥ 294.4 ¥ 319.3 ¥ 307.3
Gross profit 57.0 53.7 58.5 71.4 80.4 80.3
Selling, general and administrative expenses 39.6 36.6 39.0 45.9 55.4 58.6
Operating income 17.3 17.1 19.5 25.5 25.0 21.7
Income before income taxes and minority interests 17.5 19.2 20.0 24.0 25.3 21.5
Net income 9.8 10.9 11.5 14.0 15.4 12.9
As of March 31:
Total assets 168.8 160.8 178.1 214.9 218.1 227.5
Total equity 104.0 105.3 115.7 140.5 145.7 147.8
Cash Flows:
Cash flows from operating activities 21.6 14.2 7.9 24.3 10.5 11.3
Cash flows from investing activities 0.2 (4.9) (1.8) (15.7) 3.6 (13.8)
Cash flows from financing activities (6.5) (10.2) (3.3) (3.9) (10.1) (11.1)
Financial Ratios:
Gross profit margin (%) 21.4% 23.7% 24.5% 24.2% 25.2% 26.1%
Operating income margin (%) 6.5 7.5 8.2 8.7 7.8 7.1
Equity ratio (%) 61.6 65.5 64.9 65.1 66.6 64.7
Return on equity (ROE) (%)*1 9.5 10.4 10.4 11.0 10.8 8.8
Return on assets (ROA) (%)*2 5.7 6.6 6.8 7.1 7.1 5.8
Yen
Per Share Data:
Basic net income ¥ 160.26 ¥ 182.88 ¥ 197.87 ¥ 225.90 ¥ 232.70 ¥ 199.21
Shareholders’ equity 1,733.47 1,819.34 2,007.88 2,093.52 2,207.44 2,299.63
Cash dividends applicable to the year 26.00 30.00 60.00 70.00 80.00 80.00
Note: Owing to the October 1, 2006, merger with the former CRC Solutions Corp., pre-merger figures are based on those of former ITOCHU TECHNO SCIENCE Corporation.
*1 ROE = Net income / Average total shareholders’ equity (which is based on total shareholders’ equity at the beginning and end of the year) x100.*2 ROA = Net income / Average total assets (which is based on total assets at the beginning and end of the year) x100.
Six-Year Consolidated Financial SummaryITOCHU Techno-Solutions Corporation and Subsidiaries

14ITOCHU Techno–Solutions Corporation Annual Report 2009
0
70
140
210
280
350
Net Sales
226.8 239.0
294.4
2005 2006 2007 2008
(Billions of Yen)
Telecommunications and broadcastingElectronicsManufacturing (excluding electronics)Information services
319.3
2009
307.3
Public sectorCommerce and transportationFinance and insuranceOthers
0
6
12
18
24
30
Operating Income
2005 2006 2007 2008
(Billions of Yen)
17.119.5
25.5 25.0
2009
0
6
3
9
12
15
0
10
5
15
20
25
Net Income and Return on Equity (ROE)
2005 2006 2007 2008
(Billions of Yen)(%)
Net incomeROE
10.911.5
14.0
10.4 10.4 11.0
15.4
10.8
2009
12.9
8.8
0
100
50
150
200
250
0
4
2
6
8
10
Total Assets and Return on Aseets (ROA)(Billions of Yen)
Total assetsROA
(%)
160.8178.1
214.9
6.6 6.87.1
2005 2006 2007 2008
218.1
7.1
2009
227.5
5.8
0
60
30
90
120
150
0
30
15
45
60
75
Total Equity and Equity Ratio(Billions of Yen)
Total equityEquity ratio
(%)
105.3
140.5
2005 2006 2007 2008
145.7
2009
147.8
-20
-10
0
10
20
30
Cash Flows
2007 2008
(Billions of Yen)
Cash flows from operating activitiesCash flows from investing activitiesCash flows from financing activities
-15.7
-3.9
24.3
10.5
3.6
-10.1
2009
11.3
-13.8-11.1
0
40
20
60
80
Cash Dividends per Share(Yen)
2005 2006 2007 2008
30
6070
80
2009
80
21.7
65.5 64.964.7115.7 65.1 66.6

15ITOCHU Techno–Solutions Corporation Annual Report 2009
Consolidated Business Performance
In fi scal 2008, ended March 31, 2009, in the telecommunica-
tions industry, CTC moved aggressively in response to system
development projects related to next-generation network busi-
ness, including NGNs and WiMAX, and to projects that demon-
strated increased data traffi c. CTC also commenced a new
business that supports the construction and operation of sys-
tems for mobile virtual network operators (MVNO) wishing to
provide original wireless services with wireless communications
equipment leased from mobile network operators. In the fi nan-
cial industry, amid a general trend of restrained investment, we
focused on projects involving the construction of market and
risk management systems centered on large fi nancial institu-
tions as well as projects involving call centers. In the manufac-
turing and distribution industries, we concentrated on business
that integrates large-scale infrastructure using virtualization
technologies, reconstructed infrastructure systems and
expanded our information management and analysis system
and operating services. In the public sector, our consulting
business steadily expanded its portfolio with seismic analysis
services for such large structures as nuclear facilities and for
our new energy business, which includes wind power and solar
energy. We also made good progress in our business opera-
tions aimed at the central government and municipalities.
As a result, consolidated net sales in fi scal 2008 slipped
3.8% compared with the previous fi scal year, to ¥307.3 billion.
This was attributable to a downturn in hardware sales, primarily
servers, in the wake of investment restraints resulting from
declining corporate performance and infrastructure investments
having run their course. By business segment, sales in the
System segment dropped 5% to ¥234.2 billion due mainly to
decreased product sales and fewer large-scale development
projects. Operating income fell 24.1% to ¥10.2 billion on the
back of declining revenues and rising expenses. In the Support
segment, thanks to business stability and the operation of a
new data center, sales rose 0.6% to ¥73.0 billion and operating
income increased 0.1% to ¥24.6 billion.
Gross profi t on sales decreased ¥0.1 billion, or 0.2%, to
¥80.3 billion due mainly to decreased revenue. As a result of
increased earnings from Service segment expansion and suc-
cessful business growth from emphasizing higher added value,
the gross profi t margin improved 0.9 of a percentage point,
from 25.2% to 26.1%, which is a new record.
Selling, general and administrative expenses increased ¥3.2
billion, or 5.8%, to ¥58.6 billion, primarily owing to higher costs
from an increased number of employees, especially new col-
lege graduates, and the reconstructing of internal systems.
With an improved gross profi t margin failing to absorb the
higher expenses associated with efforts to fortify CTC’s busi-
ness foundation, operating income dropped ¥3.3 billion, or
13.3%, to ¥21.7 billion. The operating income ratio declined
0.7 of a percentage point, from 7.8% to 7.1%.
The CTC Group posted other expenses totaling ¥0.2 billion,
compared with other income, net, totaling ¥0.3 billion in the pre-
vious fi scal year. Such contributions as the net gain on sales of
investment securities were offset by a decrease of equity in earn-
ings of associated companies, as well as increases in the loss on
equity in earnings of limited partnerships, loss on sales of invest-
ment securities and loss on retirement of long-term assets.
As a result of these factors, income before income taxes
and minority interests decreased ¥3.8 billion, or 14.9%, to
¥21.5 billion.
Total income taxes (corporate taxes, inhabitants’ taxes and
adjustments for corporate and other taxes) decreased ¥1.3 bil-
lion from the previous fi scal year, or 13.7%, to ¥8.5 billion.
Minority interests in net income totaled ¥0.9 billion, an increase of
¥54 million, or 149.8%, compared with the previous fi scal year.
As a result of the aforementioned, net income declined ¥2.5
billion, or 16.1%, to ¥12.9 billion.
Financial Position
As of March 31, 2009, consolidated total assets amounted to
¥227.5 billion, an increase of ¥9.4 billion, or 4.3%, from the end
of the previous fi scal year.
Management’s Discussion and Analysis of Results and Financial Condition

16ITOCHU Techno–Solutions Corporation Annual Report 2009
Total current assets were ¥173.4 billion, a drop of ¥4.6 bil-
lion, or 2.6%, year on year. This was attributable to a ¥36.0 bil-
lion fall in securities, mainly commercial paper, that offset a 17.2
billion increase in cash and cash equivalents, a ¥2.8 billion
increase in inventories and a ¥6.7 billion pickup in money deposits.
Total non-current assets—the sum of net property and
equipment and total investments and other assets—amounted
to ¥54.1 billion, an increase of ¥14.0 billion, or 35.0%. This was
primarily due to a ¥17.4 billion increase in property and equip-
ment stemming from the purchase of land and buildings for a
new data center in Mejirozaka and existing data centers in
Yokohama and Kobe, which overshadowed the ¥2.9 billion
decrease in total investments and other assets due to slacken-
ing market growth.
Total liabilities were ¥79.7 billion, an increase of ¥7.3 billion,
or 10.1% year on year, mainly due to an ¥8.6 billion jump in
lease obligations.
Total equity was ¥147.8 billion, an increase of ¥2.1 billion, or
1.4%, year on year, mainly due to a ¥2.8 billion surge in share-
holders’ equity resulting from strong earnings. In addition,
because the increase in total assets exceeded the increase in
shareholders’ equity, the equity ratio declined 1.9 percentage
points, from 66.6% to 64.7%.
Cash Flows
During fi scal 2008, cash and cash equivalents decreased ¥13.7
billion from the previous fi scal year to ¥57.2 billion.
Net cash provided by operating activities totaled ¥11.3 bil-
lion. Major components were net outfl ows of ¥3.4 billion for trade
receivables and payables and a ¥2.8 billion increase in invento-
ries, as well as such infl ows as ¥21.5 billion in income before
income taxes and minority interests and ¥4.5 billion in deprecia-
tion and amortization. Compared with the previous fi scal year,
net cash provided by operating activities increased ¥0.8 billion.
Major factors contributing to this change included the ¥3.8 billion
decrease in income before income taxes and minority interests, a
¥1.5 billion increase in spending on inventories, a ¥1.4 billion
surge in depreciation and amortization and a ¥4.4 billion net
decrease in spending on trade receivables and payables.
Net cash used in investing activities amounted to ¥13.8 bil-
lion. This was primarily due to purchases of property and equip-
ment totaling ¥13.5 billion. For comparison purposes, net cash
used in investing activities showed a ¥17.4 billion negative turn-
around from cash provided year on year due mainly to a ¥10.9
billion increase in purchases of property and equipment, which
offset a ¥3.0 billion decline in purchases of intangible assets, as
well as an ¥8.9 billion decrease in proceeds from deposits other
than cash equivalents.
Net cash used in fi nancing activities amounted to ¥11.1 bil-
lion. Major components included repurchases of treasury stock
totaling ¥5.0 billion and dividend payments totaling ¥5.2 billion.
Compared with the previous fi scal year, net cash used in fi nanc-
ing activities rose ¥1.0 billion due primarily to the repayment of
long-term lease obligations totaling ¥0.9 billion.
Return to Shareholders
The CTC Group recognizes returning profi ts to shareholders as
a preeminent management issue. In line with this principle, the
Company works to secure stable dividend payments and con-
stantly improve dividend levels, while optimizing the balance
between its business performance, internal reserves and the
actual amount distributed to shareholders. The Company shall,
in principle, pay out interim and year-end dividends every year.
Year-end dividends are subject to resolutions made by the
General Meeting of Shareholders, while interim dividends are
subject to resolutions made by the Board of Directors.
For the fi scal year under review, the Company resolved to
pay out a full-year cash dividend of ¥80 per share of common
stock, of which ¥40 was paid out as an interim dividend, with
due consideration given to its fi nancial position and business
performance. As a result, the consolidated payout ratio
improved from 34.4% in the previous fi scal year to 40.2%.

17ITOCHU Techno–Solutions Corporation Annual Report 2009
Consolidated Balance SheetsITOCHU Techno-Solutions Corporation and Subsidiaries
March 31, 2008 and 2009
Thousands of U.S. Dollars Millions of Yen (Note 1)
ASSETS 2008 2009 2009
CURRENT ASSETS:
Cash and cash equivalents (Note 15) ¥ 70,977 ¥ 57,238 $ 582,518
Short-term investments (Note 3) 1,529 3,192 32,491
Receivables:
Trade 63,918 64,791 659,386
Associated companies 224 82 831
Other (Note 12) 1,574 3,660 37,251
Allowance for doubtful receivables (124) (16) (167)
Inventories (Note 5) 21,434 24,232 246,616
Deferred tax assets (Note 10) 6,979 7,060 71,850
Prepaid expenses and other current assets 11,538 13,166 133,989
Total current assets 178,049 173,405 1,764,765
PROPERTY AND EQUIPMENT:
Land (Note 15) 1,698 6,391 65,046
Buildings and structures (Note 15) 13,033 20,955 213,260
Furniture and fixtures (Note 15) 7,297 7,908 80,479
Lease assets — 7,133 72,590
Total 22,028 42,387 431,375
Accumulated depreciation (7,697) (10,700) (108,898)
Net property and equipment 14,331 31,687 322,477
INVESTMENTS AND OTHER ASSETS:
Investment securities (Note 4) 5,346 3,424 34,841
Investments in and advances to associated companies 986 932 9,487
Software (Note 6) 5,999 5,319 54,135
Leasehold deposits 6,984 7,193 73,205
Prepaid pension cost (Note 7) 2,653 2,202 22,413
Deferred tax assets (Note 10) 520 1,563 15,904
Other assets (Note 6) 3,224 1,731 17,612
Total investments and other assets 25,712 22,364 227,597
TOTAL ¥218,092 ¥227,456 $2,314,839
See notes to consolidated financial statements.

18ITOCHU Techno–Solutions Corporation Annual Report 2009
Thousands of U.S. Dollars Millions of Yen (Note 1)
LIABILITIES AND EQUITY 2008 2009 2009
CURRENT LIABILITIES:
Current portion of long-term lease obligations ¥ — ¥ 2,340 $ 23,811
Payables:
Trade (Note 15) 28,728 26,163 266,259
Associated companies 189 99 1,005
Other 8,072 7,224 73,523
Income taxes payable 7,649 7,305 74,349
Accrued expenses 7,494 6,262 63,734
Unearned income 15,673 16,871 171,694
Other current liabilities 3,476 6,344 64,563
Total current liabilities 71,281 72,608 738,938
LONG-TERM LIABILITIES:
Long-term lease obligations — 6,214 63,241
Long-term accounts payable 369 273 2,774
Liability for retirement benefits (Note 7) 266 294 2,990
Deferred tax liabilities (Note 10) 149 82 837
Other long-term liabilities 315 216 2,203
Total long-term liabilities 1,099 7,079 72,045
COMMITMENTS AND CONTINGENT LIABILITIES
(Notes 12, 13 and 14)
EQUITY (Notes 8 and 17):
Common stock—authorized, 246,000,000 shares;
issued, 67,000,000 shares in 2008
and 66,000,000 shares in 2009 21,764 21,764 221,490
Capital surplus 33,076 33,076 336,617
Retained earnings 94,100 98,132 998,702
Net unrealized gain on available-for-sale securities 768 175 1,782
Deferred loss on derivatives under hedge accounting (7) (2) (18)
Foreign currency translation adjustments (1) (94) (959)
Treasury stock—at cost, 1,234,897 shares in 2008
and 1,970,165 shares in 2009 (4,527) (5,806) (59,093)
Total 145,173 147,245 1,498,521
Minority interests 539 524 5,335
Total equity 145,712 147,769 1,503,856
TOTAL ¥218,092 ¥227,456 $2,314,839

19ITOCHU Techno–Solutions Corporation Annual Report 2009
Consolidated Statements of IncomeITOCHU Techno-Solutions Corporation and Subsidiaries
Years Ended March 31, 2008 and 2009
Thousands of U.S. Dollars Millions of Yen (Note 1)
2008 2009 2009
NET SALES (Note 15) ¥319,290 ¥307,254 $3,126,952
COST OF SALES (Notes 7, 12 and 15) 238,870 226,970 2,309,894
Gross profit 80,420 80,284 817,058
SELLING, GENERAL AND ADMINISTRATIVE EXPENSES
(Notes 7, 11 and 12) 55,406 58,596 596,338
Operating income 25,014 21,688 220,720
OTHER INCOME (EXPENSES):
Interest and dividend—net 467 406 4,128
Equity in earnings (losses) of limited partnership 95 (301) (3,065)
Equity in earnings of associated companies 239 71 721
Gain on sales of investment securities—net 124 248 2,528
Gain on sales of investment securities of associated companies 107 — —
Loss on write-down of investment securities (840) (347) (3,527)
Other—net 75 (255) (2,601)
Other income (expenses)—net 267 (178) (1,816)
INCOME BEFORE INCOME TAXES AND MINORITY INTERESTS 25,281 21,510 218,904
INCOME TAXES (Note 10):
Current 10,010 9,261 94,249
Deferred (185) (778) (7,921)
Total income taxes 9,825 8,483 86,328
MINORITY INTERESTS IN NET INCOME 36 91 921
NET INCOME ¥ 15,420 ¥ 12,936 $ 131,655
Yen U.S. Dollars
2008 2009 2009
PER SHARE OF COMMON STOCK (Notes 2.p and 16):
Basic net income ¥232.70 ¥199.21 $2.03
Diluted net income 232.67 — —
Cash dividends applicable to the year 80.00 80.00 0.81
Diluted net income per share for the year ended March 31, 2009 is not disclosed because it is anti-dilutive.
See notes to consolidated financial statements.

20ITOCHU Techno–Solutions Corporation Annual Report 2009
Consolidated Statements of Changes in EquityITOCHU Techno-Solutions Corporation and Subsidiaries
Years Ended March 31, 2008 and 2009
Thousands Millions of Yen
OutstandingNumber ofShares ofCommon
StockCommon
StockCapitalSurplus
RetainedEarnings
NetUnrealized Gain (Loss)
on Available-for-sale
Securities
DeferredGain
(Loss) on Derivatives
under Hedge Accounting
Foreign Currency
Translation Adjustments
Treasury Stock Total
Minority Interests
Total Equity
BALANCE, APRIL 1, 2007 66,838 ¥21,764 ¥34,258 ¥87,217 ¥781 ¥ 6 ¥ 30 ¥ (4,129) ¥139,927 ¥564 ¥140,491Net income 15,420 15,420 15,420Appropriations—Cash dividends,
¥80.00 per share (5,332) (5,332) (5,332)Repurchase of treasury stock (1,141) (4,977) (4,977) (4,977)Sale of treasury stock 68 17 (2) 220 235 235
Cancellation of 1,300,000 shares of treasury stock (1,199) (3,160) 4,359
Decrease of retained earnings due to the exclusion of associated company (51) (51) (51)
Other 8 8 8Net change in the year (13) (13) (31) (57) (25) (82)
BALANCE, MARCH 31, 2008 65,765 ¥21,764 ¥33,076 ¥94,100 ¥768 ¥ (7) ¥ (1) ¥ (4,527) ¥145,173 ¥539 ¥145,712Net income 12,936 12,936 12,936Appropriations—Cash dividends,
¥80.00 per share (5,232) (5,232) (5,232)Repurchase of treasury stock (1,743) (4,973) (4,973) (4,973)Sale of treasury stock 8 (7) 29 22 22
Cancellation of 1,000,000 shares of treasury stock (3,665) 3,665
Net change in the year (593) 5 (93) (681) (15) (696)BALANCE, MARCH 31, 2009 64,030 ¥21,764 ¥33,076 ¥98,132 ¥175 ¥ (2) ¥(94) ¥(5,806) ¥147,245 ¥524 ¥147,769
Thousands of U.S. Dollars (Note 1)
CommonStock
CapitalSurplus
RetainedEarnings
NetUnrealized Gain (Loss)
on Available-for-sale
Securities
DeferredGain
(Loss) on Derivatives
under Hedge Accounting
Foreign Currency
Translation Adjustments
Treasury Stock Total
Minority Interests
Total Equity
BALANCE, MARCH 31, 2008 $221,490 $336,617 $957,662 $7,818 $ (74) $ (9) $(46,068) $1,477,436 $5,487 $1,482,923Net income 131,655 131,655 131,655Appropriations—Cash dividends,
$0.81 per share (53,245) (53,245) (53,245)Repurchase of treasury stock (50,616) (50,616) (50,616)Sale of treasury stock (71) 292 221 221
Cancellation of 1,000,000 shares of treasury stock (37,299) 37,299
Net change in the year (6,036) 56 (950) (6,930) (152) (7,082)BALANCE, MARCH 31, 2009 $221,490 $336,617 $998,702 $1,782 $(18) $(959) $(59,093) $1,498,521 $5,335 $1,503,856
See notes to consolidated financial statements.
21ITOCHU Techno–Solutions Corporation Annual Report 2009
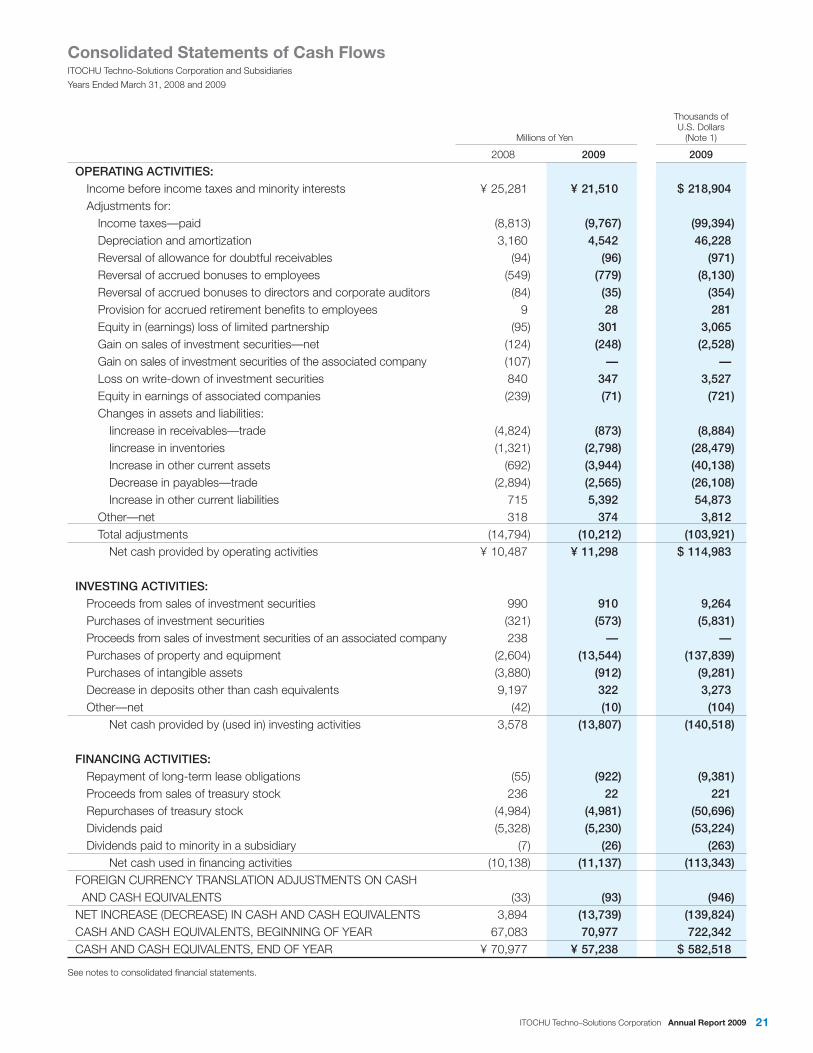
Consolidated Statements of Cash FlowsITOCHU Techno-Solutions Corporation and Subsidiaries
Years Ended March 31, 2008 and 2009
Thousands of U.S. Dollars Millions of Yen (Note 1)
2008 2009 2009
OPERATING ACTIVITIES: Income before income taxes and minority interests ¥ 25,281 ¥ 21,510 $ 218,904 Adjustments for: Income taxes—paid (8,813) (9,767) (99,394) Depreciation and amortization 3,160 4,542 46,228 Reversal of allowance for doubtful receivables (94) (96) (971) Reversal of accrued bonuses to employees (549) (779) (8,130) Reversal of accrued bonuses to directors and corporate auditors (84) (35) (354) Provision for accrued retirement benefits to employees 9 28 281 Equity in (earnings) loss of limited partnership (95) 301 3,065 Gain on sales of investment securities—net (124) (248) (2,528) Gain on sales of investment securities of the associated company (107) — — Loss on write-down of investment securities 840 347 3,527 Equity in earnings of associated companies (239) (71) (721) Changes in assets and liabilities: Iincrease in receivables—trade (4,824) (873) (8,884) Iincrease in inventories (1,321) (2,798) (28,479) Increase in other current assets (692) (3,944) (40,138) Decrease in payables—trade (2,894) (2,565) (26,108) Increase in other current liabilities 715 5,392 54,873 Other—net 318 374 3,812 Total adjustments (14,794) (10,212) (103,921) Net cash provided by operating activities ¥ 10,487 ¥ 11,298 $ 114,983
INVESTING ACTIVITIES: Proceeds from sales of investment securities 990 910 9,264 Purchases of investment securities (321) (573) (5,831) Proceeds from sales of investment securities of an associated company 238 — — Purchases of property and equipment (2,604) (13,544) (137,839) Purchases of intangible assets (3,880) (912) (9,281) Decrease in deposits other than cash equivalents 9,197 322 3,273 Other—net (42) (10) (104) Net cash provided by (used in) investing activities 3,578 (13,807) (140,518)
FINANCING ACTIVITIES: Repayment of long-term lease obligations (55) (922) (9,381) Proceeds from sales of treasury stock 236 22 221 Repurchases of treasury stock (4,984) (4,981) (50,696) Dividends paid (5,328) (5,230) (53,224) Dividends paid to minority in a subsidiary (7) (26) (263) Net cash used in financing activities (10,138) (11,137) (113,343) FOREIGN CURRENCY TRANSLATION ADJUSTMENTS ON CASH AND CASH EQUIVALENTS (33) (93) (946) NET INCREASE (DECREASE) IN CASH AND CASH EQUIVALENTS 3,894 (13,739) (139,824) CASH AND CASH EQUIVALENTS, BEGINNING OF YEAR 67,083 70,977 722,342 CASH AND CASH EQUIVALENTS, END OF YEAR ¥ 70,977 ¥ 57,238 $ 582,518
See notes to consolidated financial statements.

22ITOCHU Techno–Solutions Corporation Annual Report 2009
Notes to Consolidated Financial StatementsITOCHU Techno-Solutions Corporation and Subsidiaries
Years Ended March 31, 2008 and 2009
The accompanying consolidated financial statements have been prepared
in accordance with the provisions set forth in the Japanese Financial Instru-
ments and Exchange Act and its related accounting regulations, and in
conformity with accounting principles generally accepted in Japan (“Japa-
nese GAAP”), which are different in certain respects as to application and
disclosure requirements of International Financial Reporting Standards.
In preparing these consolidated financial statements, certain reclassifi-
cations and rearrangements have been made to the consolidated financial
statements issued domestically in order to present them in a form which is
more familiar to readers outside Japan. In addition, certain reclassifications
have been made in the 2008 financial statements to conform to the classifi-
cations used in 2009.
The consolidated financial statements are stated in Japanese yen, the
currency of the country in which ITOCHU Techno-Solutions Corporation
(the “Company”) is incorporated and operates. The translations of Japa-
nese yen amounts into U.S. dollar amounts are included solely for the con-
venience of readers outside Japan and have been made at the rate of
¥98.26 to $1, the rate of exchange as of March 31, 2009. Such translations
should not be construed as representation that the Japanese yen amounts
could be converted into U.S. dollars at that or any other rate.
1. BASIS OF PRESENTING CONSOLIDATED FINANCIAL STATEMENTS
a. Consolidation—The consolidated financial statements as of March 31,
2009 include the accounts of the Company and its 12 (13 in 2008) subsid-
iaries (together, the “Group”).
Those companies over which the Company, directly or indirectly, is able
to exercise control over operations are fully consolidated.
Investments in 4 (4 in 2008) associated companies are accounted for
by the equity method.
All significant intercompany balances and transactions have been elimi-
nated in consolidation. All material unrealized profit included in assets
resulting from transactions within the Group is eliminated.
b. Cash Equivalents—Cash equivalents are short-term investments that
are readily convertible into cash and that are exposed to insignificant risk of
changes in value.
Cash equivalents include time deposits, certificate of deposits, com-
mercial paper, bond funds and money deposited to Cash Management
System operated by ITOCHU Corporation, the parent of the Company, all
of which mature or become due within three months of the date of
acquisition.
c. Inventories—Prior to April 1, 2008, inventories were stated at cost on
the specific identification basis, except for certain merchandise inventories
which were stated at cost determined by the moving-average method. In
July 2006, the Accounting Standards Board of Japan (the “ASBJ”) issued
ASBJ Statement No. 9, “Accounting Standard for Measurement of Invento-
ries.” This standard requires that inventories held for sale in the ordinary
course of business be measured at the lower of cost or net selling value,
which is defined as the selling price less additional estimated manufacturing
costs and estimated direct selling expenses. The replacement cost may be
used in place of the net selling value, if appropriate. The standard was
effective for the fiscal years beginning on or after April 1, 2008 with early
adoption permitted.
The Group applied the new accounting standard for measurement of
inventories effective April 1, 2008. In addition, effective April 1, 2008, the
Group changed its inventory costing from the specific identification method
to the moving-average method since the moving-average method provides
better matching of revenue and expenses given the diversity of the Group’s
products and the renewal of backbone systems by the Group. The effect of
this change was not material.
Supplies for maintenance service are carried at cost less accumulated
amortization, which is calculated by the straight-line method over 5 years of
the estimated useful lives.
d. Investment Securities—Investment securities are classified as avail-
able-for-sale securities and are reported at fair value, with unrealized gains
and losses, net of applicable taxes, reported in a separate component of
equity. The cost of securities sold is determined by the moving-average
cost method.
Non-marketable securities are stated at cost determined by the
moving-average method.
Investments in limited partnership are accounted for by the equity
method.
For other than temporary declines in fair value, investment securities
are reduced to net realizable value by a charge to income.
e. Property and Equipment—Property and equipment are stated at cost.
Depreciation of property and equipment is computed by the declining-
balance method at rates based on the estimated useful lives of the assets,
while the straight-line method is applied to property and equipment of the
datacenter business, buildings acquired after April 1, 1998 (excluding facili-
ties incidental to buildings) and lease assets. The range of useful lives is
from 15 to 41 years for buildings and structures, and from 5 to 15 years for
furniture and fixtures. The useful lives for lease assets are the terms of the
respective leases.
f. Intangible Assets—Intangible assets are carried at cost less accumu-
lated amortization, which is calculated by the straight-line method. Amorti-
zation of software is calculated by the straight-line method over 5 years of
the estimated useful lives while the amortization of software for sales is cal-
culated based on the expected sales quantities (or amortized over 3 years if
the calculated amounts is greater than above method).
g. Long-lived Assets—The Group reviews its long-lived assets for impair-
ment whenever events or changes in circumstances indicate that the carry-
ing amount of an asset or asset group may not be recoverable. An impair-
ment loss would be recognized if the carrying amount of an asset or asset
group exceeds the sum of the undiscounted future cash flows expected to
result from the continued use and eventual disposition of the asset or asset
group. The impairment loss would be measured as the amount by which
the carrying amount of the asset exceeds its recoverable amount, which is
the higher of the discounted cash flows from the continued use and even-
tual disposition of the asset or the net selling price at disposition.
h. Retirement and Pension Plans—For employee retirement and pension
plan, the Company and certain subsidiaries participate in the “ITOCHU
Group Kosei-Nenkin Kikin,” which is a defined benefit, contributory pension
fund, and also have a cash-balance type of defined benefit, non- contributory
2. SUMMARY OF SIGNIFICANT ACCOUNTING POLICIES
23ITOCHU Techno–Solutions Corporation Annual Report 2009
pension fund or unfunded benefit plans. After the merger with CRC Solu-
tions Corp. (“CRC”), on October 1, 2006, the Company assumed its retire-
ment and pension plans. CRC and certain consolidated subsidiaries had a
cash-balance type of defined benefit, non-contributory pension fund and a
defined contribution pension plan. On October 1, 2007, the Company
merged both of the respective retirement and pension plans and revised
their retirement benefit rules. Consequently, prior service cost (decrease of
liability) of ¥1,767 million arose, and operating income and income before
income taxes and minority interests increased by ¥132 million in the consol-
idated financial statements for the fiscal year ended March 31, 2008.
The liability for employees’ retirement benefits is provided at the
amount based on the projected benefit obligation and plan assets at the
balance sheet date. An actuarial adjustment is charged to income by the
straight-line method over the following 10 years (which are within the aver-
age remaining years of service of the employees). And unrecognized prior
service cost is charged to income by the straight-line method over the 10
years (which are within the average remaining years of service of the
employees).
Retirement allowances for directors and corporate auditors are
recorded to state the liability at the amount that would be required if all
directors and corporate auditors retired at each balance sheet date. Pursu-
ant to the approval at the annual general meeting of the Company’s share-
holders held on June 22, 2006, the Company decided to terminate the
retirement benefits plan to directors and corporate auditors. The accrued
retirement benefits to directors and corporate auditors will be paid at their
retirement and are included in long-term accounts payable in 2008 and
2009.
i. Research and Development Costs—Research and development costs
are charged to income as incurred.
j. Leases—In March 2007, the ASBJ issued ASBJ Statement No. 13,
“Accounting Standard for Lease Transactions,” which revised the previous
accounting standard for lease transactions issued in June 1993. The
revised accounting standard for lease transactions is effective for fiscal
years beginning on or after April 1, 2008 with early adoption permitted for
fiscal years beginning on or after April 1, 2007.
Under the previous accounting standard, finance leases that deem to
transfer ownership of the leased property to the lessee were to be capital-
ized. However, other finance leases were permitted to be accounted for as
operating lease transactions if certain “as if capitalized” information is dis-
closed in the note to the lessee’s financial statements. The revised account-
ing standard requires that all finance lease transactions should be capital-
ized to recognize lease assets and lease obligations in the balance sheet. In
addition, the revised accounting standard permits leases which existed at
the transition date and do not transfer ownership of the leased property to
the lessee to be accounted for as operating lease transactions.
The Group applied the revised accounting standard effective April 1,
2008. In addition, the Company accounted for leases which existed at the
transition date and do not transfer ownership of the leased property to the
lessee as operating lease transactions. The effect of this change was not
material.
All other leases are accounted for as operating leases.
k. Bonuses to Directors and Corporate Auditors—Bonuses to direc-
tors and corporate auditors are accrued at the year end to which such
bonuses are attributable.
l. Income Taxes—The provision for income taxes is computed based on
the pretax income included in the consolidated statements of income. The
asset and liability approach is used to recognize deferred tax assets and lia-
bilities for the expected future tax consequences of temporary differences
between the carrying amounts and the tax bases of assets and liabilities.
Deferred taxes are measured by applying currently enacted tax laws to the
temporary differences.
m. Foreign Currency Transactions—All short-term and long-term mone-
tary receivables and payables denominated in foreign currencies are trans-
lated into Japanese yen at the exchange rates at the balance sheet date.
The foreign exchange gains and losses from translation are recognized in
the consolidated statements of income to the extent that they are not
hedged by forward exchange contracts.
n. Foreign Currency Financial Statements—The balance sheet
accounts of consolidated foreign subsidiaries are translated into Japanese
yen at the current exchange rate as of the balance sheet date except for
equity, which is translated at the historical rate.
Differences arising from such translation are shown as “Foreign cur-
rency translation adjustments” in a separate component of equity.
Revenue and expense accounts of consolidated foreign subsidiaries
are translated into Japanese yen at the average exchange rate.
o. Derivatives and Hedging Activities—The Group uses derivative finan-
cial instruments to manage its exposures to fluctuations in foreign
exchange. Foreign exchange forward contracts are utilized by the Group to
reduce foreign currency exchange risks. The Group does not enter into
derivatives for trading or speculative purposes.
All derivatives are recognized as either assets or liabilities and mea-
sured at fair value with gains or losses on derivative transactions recognized
in the consolidated statements of income. If derivatives qualify for hedge
accounting because of high correlation and effectiveness between the
hedging instruments and the hedged items, gains or losses on derivatives
are deferred until the maturity of the hedged transactions.
Foreign currency forward contracts are utilized to hedge foreign cur-
rency exposures in procurement of merchandise from overseas suppliers.
Trade payables denominated in foreign currencies are translated at the con-
tracted rates if the forward contracts qualify for hedge accounting.
p. Per Share Information—Basic net income per share is computed by
dividing net income available to common shareholders by the weighted-
average number of common shares outstanding for the period, retroactively
adjusted for stock splits.
Diluted net income per share reflects the potential dilution that could
occur if securities were exercised into common stock in 2008. Diluted net
income per share is not disclosed in 2009 because it is anti-dilutive.
Cash dividends per share presented in the accompanying consolidated
statements of income are dividends applicable to the respective years
including dividends to be paid after the end of the year.
q. New Accounting Pronouncements
Business Combination—On December 26, 2008, the ASBJ issued a
revised accounting standard for business combinations, ASBJ Statement
No. 21, “Accounting Standard for Business Combinations.” Major account-
ing changes under the revised accounting standard are as follows:
(1) The current accounting standard for business combinations allows com-
panies to apply the pooling of interests method of accounting when cer-
tain specific criteria are met such that the business combination is
Notes to Consolidated Financial Statements

24ITOCHU Techno–Solutions Corporation Annual Report 2009
essentially regarded as a uniting-of-interests. The revised standard
requires to account for such business combination by the purchase
method and the pooling of interests method of accounting is no longer
allowed.
(2) The current accounting standard requires the research and development
costs to be charged to income as incurred. Under the revised standard,
in-process research and development (IPR&D) acquired in the business
combination is capitalized as an intangible asset.
(3) The current accounting standard requires a bargain purchase gain (neg-
ative goodwill) to be systematically amortized within 20 years. Under the
revised standard, the acquirer recognizes a bargain purchase gain in
profit or loss on the acquisition date after reassessing whether it has
correctly identified all of the assets acquired and all of the liabilities
assumed with a review of such procedures used.
This standard is applicable to business combinations undertaken on or
after April 1, 2010 with early adoption permitted for fiscal years beginning
on or after April 1, 2009.
Asset Retirement Obligations—On March 31, 2008, the ASBJ published
a new accounting standard for asset retirement obligations, ASBJ State-
ment No. 18 “Accounting Standard for Asset Retirement Obligations” and
ASBJ Guidance No. 21 “Guidance on Accounting Standard for Asset
Retirement Obligations.” Under this accounting standard, an asset retire-
ment obligation is defined as a legal obligation imposed either by law or
contract that results from the acquisition, construction, development and
the normal operation of a tangible fixed asset and is associated with the
retirement of such tangible fixed asset. The asset retirement obligation is
recognized as the sum of the discounted cash flows required for the future
asset retirement and is recorded in the period in which the obligation is
incurred if a reasonable estimate can be made. If a reasonable estimate of
the asset retirement obligation cannot be made in the period the asset
retirement obligation is incurred, the liability should be recognized when a
reasonable estimate of the asset retirement obligation can be made. Upon
initial recognition of a liability for an asset retirement obligation, an asset
retirement cost is capitalized by increasing the carrying amount of the
related fixed asset by the amount of the liability. The asset retirement cost is
subsequently allocated to expense through depreciation over the remaining
useful life of the asset. Over time, the liability is accreted to its present value
each period. Any subsequent revisions to the timing or the amount of the
original estimate of undiscounted cash flows are reflected as an increase or
a decrease in the carrying amount of the liability and the capitalized amount
of the related asset retirement cost. This standard is effective for fiscal years
beginning on or after April 1, 2010 with early adoption permitted for fiscal
years beginning on or before March 31, 2010.
Construction Contract—Under current Japanese GAAP, either the com-
pleted-contract method or the percentage-of-completion method is permit-
ted to account for construction contracts. In December 2007, the ASBJ
issued a new accounting standard for construction contracts. Under this
new accounting standard, the construction revenue and construction costs
should be recognized by the percentage-of-completion method, if the out-
come of a construction contract can be estimated reliably. When total con-
struction revenue, total construction costs and the stage of completion of
the contract at the balance sheet date can be reliably measured, the out-
come of a construction contract can be estimated reliably. If the outcome of
a construction contract cannot be reliably estimated, the completed-
contract method must be applied. When it is probable that total construc-
tion costs will exceed total construction revenue, an estimated loss on the
contract should be immediately recognized by providing for loss on con-
struction contracts. This standard is applicable to construction contracts
and software development contracts and effective for fiscal years beginning
on or after April 1, 2009 with early adoption permitted for fiscal years begin-
ning on or before March 31, 2009 but after December 27, 2007.
4. INVESTMENT SECURITIES
Investment securities as of March 31, 2008 and 2009 consisted of the following:
Millions of YenThousands ofU.S. Dollars
2008 2009 2009Non-current: Marketable equity securities ¥2,572 ¥1,265 $12,874 Non-marketable equity securities 1,609 1,221 12,423 Investment in limited partnership 1,165 938 9,544Total ¥5,346 ¥3,424 $34,841
3. SHORT-TERM INVESTMENTS
Short-term investments as of March 31, 2008 and 2009 consisted of the following:
Millions of YenThousands ofU.S. Dollars
2008 2009 2009Time deposits ¥ 200 ¥2,185 $22,242Deposits other than cash equivalents 1,329 1,007 10,249Total ¥1,529 ¥3,192 $32,491

25ITOCHU Techno–Solutions Corporation Annual Report 2009
The carrying amounts and aggregate fair values of investment securities as of March 31, 2008 and 2009 were as follows:
Millions of Yen
CostUnrealized
GainsUnrealized
LossesFair
Value
March 31, 2008Securities classified as available-for-sale equity securities ¥1,408 ¥1,183 ¥ 19 ¥2,572March 31, 2009Securities classified as available-for-sale equity securities 1,072 299 106 1,265
Thousands of U.S. Dollars
CostUnrealized
GainsUnrealized
LossesFair
Value
March 31, 2009Securities classified as available-for-sale equity securities $10,908 $3,042 $1,076 $12,874
Available-for-sale securities whose fair value is not readily determinable as of March 31, 2008 and 2009 were as follows:
Carrying Amount
Millions of YenThousands ofU.S. Dollars
2008 2009 2009
Available-for-sale: Equity securities ¥1,609 ¥1,221 $12,423 Investment in limited partnership 1,165 938 9,544Total ¥2,774 ¥2,159 $21,967
Proceeds from sales of available-for-sale securities for the years ended
March 31, 2008 and 2009 were ¥180 million and ¥910 million ($9,264
thousand), respectively. Gross realized gains on these sales for the years
ended March 31, 2008 and 2009, were ¥138 million and ¥360 million
($3,663 thousand), respectively. Gross realized losses on these sales for
the years ended March 31, 2008 and 2009, were ¥13 million and ¥112 mil-
lion ($1,135 thousand), respectively.
5. INVENTORIES
Inventories as of March 31, 2008 and 2009 consisted of the following:
Millions of YenThousands ofU.S. Dollars
2008 2009 2009Merchandise ¥10,594 ¥10,632 $108,204Work in process 5,470 8,249 83,953Supplies for maintenance service 5,370 5,351 54,459Total ¥21,434 ¥24,232 $246,616
The Group has severance payment plans for employees, directors and cor-
porate auditors.
As noted in the significant accounting policy, the Company and certain
consolidated subsidiaries have defined benefit plans; the Group contribu-
tory pension fund, a cash-balance type of defined benefit, non-contributory
pension fund and unfunded benefit plans. In addition, a certain subsidiary
also has defined contribution pension plans. Employees who retire upon
reaching the mandatory age of retirement or by death are entitled to larger
benefits. Benefits determined by the retirement rule are paid primarily from
the Group pension fund with the rest paid by either the cash-balance pen-
sion plan, the Company or certain consolidated subsidiaries.
The liability for retirement benefits for directors and corporate auditors
of the Group for the years ended March 31, 2008 and 2009 was ¥5 million
and ¥6 million ($56 thousand), respectively.
7. RETIREMENT AND PENSION PLANS
The Group reviewed its long-lived assets for impairment as of March 31,
2008 and 2009. As a result, the Group recognized an impairment loss of
¥20 million as other expense for idle telephone rights and ¥29 million ($299
thousand) as other expense for idle telephone rights and software for 2008
and 2009, respectively. The recoverable amount of these impaired assets
was measured at net selling prices at disposition. The Group also recog-
nized an impairment loss of ¥32 million as other expense for idle leased
property in 2008 which represented the remaining lease payments as of
March 31, 2008.
6. LONG-LIVED ASSETS
Notes to Consolidated Financial Statements

26ITOCHU Techno–Solutions Corporation Annual Report 2009
Since May 1, 2006, Japanese companies have been subject to the Com-
panies Act of Japan (the “Companies Act”). The significant provisions in the
Companies Act that affect financial and accounting matters are summa-
rized below:
a. Dividends
Under the Companies Act, companies can pay dividends at any time during
the fiscal year in addition to the year-end dividend upon resolution at the
shareholders meeting. For companies that meet certain criteria such as; (1)
having the Board of Directors, (2) having independent auditors, (3) having
the Board of Corporate Auditors, and (4) the term of service of the directors
is prescribed as one year rather than two years of normal term by its arti-
cles of incorporation, the Board of Directors may declare dividends (except
for dividends in kind) at any time during the fiscal year if the company has
prescribed so in its articles of incorporation. The Company meets all the
above criteria.
Semiannual interim dividends may also be paid once a year upon reso-
lution by the Board of Directors if the articles of incorporation of the com-
pany so stipulate. The Companies Act provides certain limitations on the
amounts available for dividends or the purchase of treasury stock. The limi-
tation is defined as the amount available for distribution to the shareholders,
but the amount of net assets after dividends must be maintained at no less
than ¥3 million.
b. Increases/Decreases and Transfer of Common Stock, Reserve
and Surplus
The Companies Act requires that an amount equal to 10% of dividends
must be appropriated as a legal reserve (a component of retained earnings)
or as additional paid-in capital (a component of capital surplus) depending
on the equity account charged upon the payment of such dividends until
the total of the aggregate amount of legal reserve and additional paid-in
capital equals 25% of the common stock. Under the Companies Act, the
total amount of additional paid-in capital and legal reserve may be reversed
without limitation. The Companies Act also provides that common stock,
legal reserve, additional paid-in capital, other capital surplus and retained
earnings can be transferred among the accounts under certain conditions
upon resolution of the shareholders.
8. EQUITY
The liability for employees’ retirement benefits as of March 31, 2008 and 2009 consisted of the following:
Millions of YenThousands ofU.S. Dollars
2008 2009 2009Projected benefit obligation ¥ 10,622 ¥ 11,234 $ 114,334Fair value of plan assets (11,719) (9,409) (95,761)Unrecognized actuarial loss (3,190) (5,427) (55,230)Unrecognized prior service cost 1,895 1,688 17,178Prepaid pension cost 2,653 2,202 22,413Net liability ¥ 261 ¥ 288 $ 2,934
The components of net periodic retirement benefit costs for the years ended March 31, 2008 and 2009 were as follows:
Millions of YenThousands ofU.S. Dollars
2008 2009 2009Service cost ¥ 933 ¥ 723 $ 7,357Interest cost 212 207 2,109Expected return on plan assets (363) (291) (2,964)Recognized actuarial loss 224 531 5,408Recognized prior service cost (183) (252) (2,564)Premium of defined benefit contributory pension fund 1,169 1,443 14,689Other 439 694 7,060Net periodic benefit costs ¥2,431 ¥3,055 $31,095
Assumptions used for actuarial computation for the years ended March 31, 2008 and 2009 were set forth as follows:
2008 2009
Discount rate 2.0% 2.0%Expected rate of return on plan assets 2.5%–3.0% 2.5%Recognition period of actuarial gain/loss 10 years 10 yearsAmortization period of prior service cost 10 years 10 years

27ITOCHU Techno–Solutions Corporation Annual Report 2009
9. STOCK OPTIONS
Stock options have been approved at the shareholders meetings as an additional benefit for certain directors or officers and key employees. The outstanding
stock options granted were as follows:
StockOption Persons Granted
Number ofOptions Granted Date of Grant
ExercisePrice Exercise Period
2002 Stock 1 director 299,000 shares 2002.9.02 ¥3,504 From July 1, 2004 to June 30, 2007Option 5 directors of subsidiaries ($36)
153 employees of the Company
and subsidiaries2003 Stock 1 director 2,294 shares 2003.8.01 ¥2,300 From October 1, 2006 to July 31, 2007Option 2 officers ($23)
13 employees 1 director of subsidiary
1 employee of subsidiary2004 Stock 7 directors 11,842 shares 2004.8.02 ¥2,700 From October 1, 2006 to July 31, 2008Option 2 corporate auditors ($27)
9 officers 44 employees
10 directors of subsidiaries1 corporate auditor of subsidiary4 employees of subsidiaries
2005 Stock 7 directors 19,282 shares 2005.8.01 ¥3,220 From October 1, 2006 to July 31, 2009Option 1 corporate auditor ($33)
7 officers 45 employees
8 directors of subsidiaries1 corporate auditor of subsidiary4 officers of subsidiaries3 employees of subsidiaries
c. Treasury Stock and Treasury Stock Acquisition Rights
The Companies Act also provides for companies to purchase treasury
stock and dispose of such treasury stock by resolution of the Board of
Directors. The amount of treasury stock purchased cannot exceed the
amount available for distribution to the shareholders which is determined by
specific formula. Under the Companies Act, stock acquisition rights, which
were previously presented as a liability, are now presented as a separate
component of equity. The Companies Act also provides that companies
can purchase both treasury stock acquisition rights and treasury stock.
Such treasury stock acquisition rights are presented as a separate compo-
nent of equity or deducted directly from stock acquisition rights.
Notes to Consolidated Financial Statements
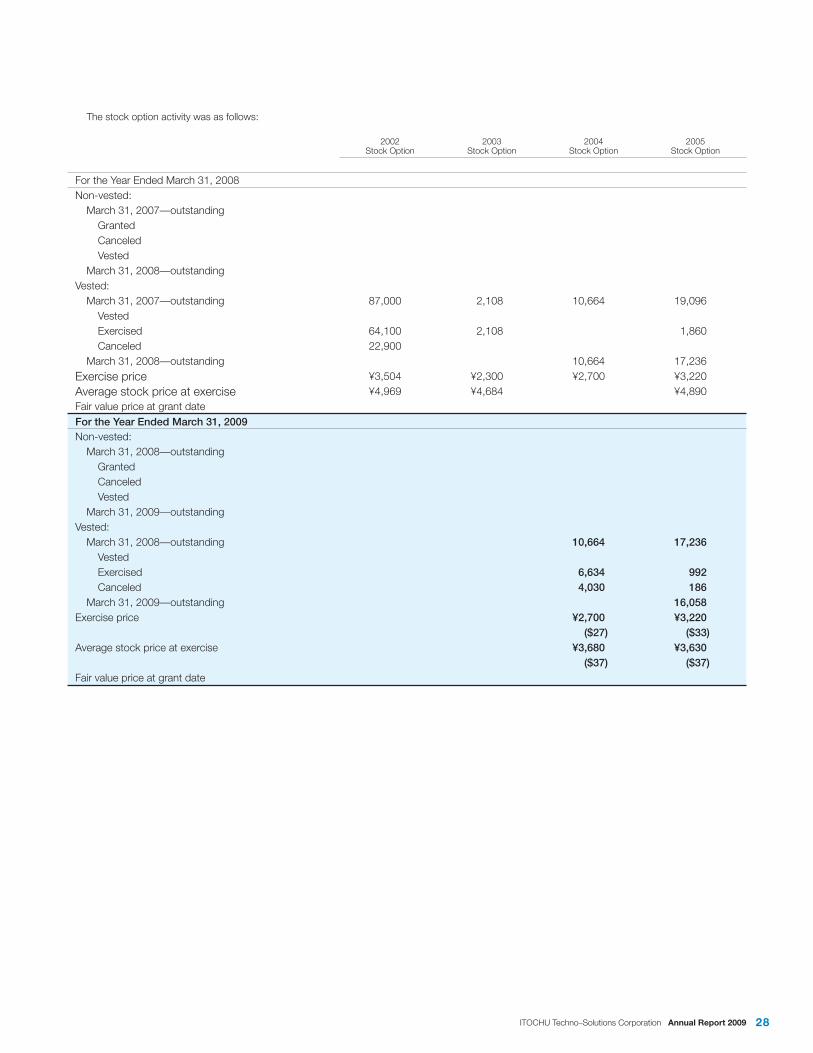
28ITOCHU Techno–Solutions Corporation Annual Report 2009
The stock option activity was as follows:
2002Stock Option
2003Stock Option
2004Stock Option
2005Stock Option
For the Year Ended March 31, 2008Non-vested: March 31, 2007—outstanding Granted Canceled Vested March 31, 2008—outstandingVested: March 31, 2007—outstanding 87,000 2,108 10,664 19,096 Vested Exercised 64,100 2,108 1,860 Canceled 22,900 March 31, 2008—outstanding 10,664 17,236Exercise price ¥3,504 ¥2,300 ¥2,700 ¥3,220Average stock price at exercise ¥4,969 ¥4,684 ¥4,890Fair value price at grant dateFor the Year Ended March 31, 2009Non-vested: March 31, 2008—outstanding Granted Canceled Vested March 31, 2009—outstandingVested: March 31, 2008—outstanding 10,664 17,236 Vested Exercised 6,634 992 Canceled 4,030 186 March 31, 2009—outstanding 16,058Exercise price ¥2,700 ¥3,220
($27) ($33)Average stock price at exercise ¥3,680 ¥3,630
($37) ($37)Fair value price at grant date

29ITOCHU Techno–Solutions Corporation Annual Report 2009
The Company and its domestic subsidiaries are subject to Japanese
national and local income taxes which, in the aggregate, resulted in a nor-
mal effective statutory tax rate of approximately 41% for the years ended
March 31, 2008 and 2009.
10. INCOME TAXES
The tax effects of significant temporary differences and tax loss carry-
forwards which resulted in deferred tax assets and liabilities as of March 31,
2008 and 2009 were as follows:
Millions of YenThousands ofU.S. Dollars
2008 2009 2009Current: Deferred tax assets: Loss on write-down of inventories ¥ 2,995 ¥ 3,473 $ 35,342 Accrued bonuses to employees 2,691 2,364 24,056 Accrued enterprise taxes 637 668 6,802 Accrued other expenses 518 507 5,158 Other 595 420 4,282 Less valuation allowance (452) (362) (3,691) Total 6,984 7,070 71,949Charges to offset against deferred tax liabilities (5) (10) (99)Net deferred tax assets—current ¥ 6,979 ¥ 7,060 $ 71,850Deferred tax liabilities: Consolidation adjustment of allowance for doubtful accounts ¥ 5 ¥ 10 $ 99Charges to offset against deferred tax assets (5) (10) (99)Net deferred tax liabilities—current
Non-current: Deferred tax assets: Loss on write-down of investment securities ¥ 555 ¥ 590 $ 6,004 Tax loss carryforwards 81 79 801 Depreciation 1,086 1,604 16,322 Equity in losses of limited partnership 129 211 2,114 Accrued retirement benefits 193 200 2,038 Unrealized gain of tangible assets 367 350 3,566 Other 200 142 1,447 Less valuation allowance (705) (734) (7,466) Total 1,906 2,442 24,856Charges to offset against deferred tax liabilities (1,386) (879) (8,952)Net deferred tax assets—non-current ¥ 520 ¥ 1,563 $ 15,904Deferred tax liabilities: Net unrealized gain on available-for-sale securities ¥ 428 ¥ 21 $ 221 Long-term prepaid pension expenses 1,088 903 9,192 Other 19 37 376Charges to offset against deferred tax assets (1,386) (879) (8,952)Net deferred tax liabilities—non-current ¥ 149 ¥ 82 $ 837
Notes to Consolidated Financial Statements
A reconciliation between the normal effective statutory tax rates and the actual effective tax rates reflected in the accompanying consolidated statement of
income for the year ended March 31, 2008 is as follows:
2008
Normal effective statutory tax rate 41.0%Expenses not deductible for income tax purposes 1.2Tax credit (0.3)Equity in earnings of associated companies (0.3)Decrease in valuation allowance (1.1)Other—net (1.6)Actual effective tax rate 38.9%

30ITOCHU Techno–Solutions Corporation Annual Report 2009
A reconciliation between the normal effective statutory tax rate and the
actual effective tax rate for the year ended March 31, 2009 was excluded,
because the difference was not more than 5% of the normal effective statu-
tory tax rate.
As of March 31, 2009, certain subsidiaries have tax loss carryforwards
aggregating approximately ¥192 million ($1,953 thousand) which are avail-
able for offset against taxable income of such subsidiaries in future years.
These tax loss carryforwards, if not utilized, will expire as follows:
Year Ending March 31 Millions of YenThousands ofU.S. Dollars
After 2015 ¥192 $1,953Total ¥192 $1,953
The Group leases certain machinery, computer equipment, office space
and other assets.
Total rental expenses including lease payments for the years ended
March 31, 2008 and 2009 were ¥14,287 million and ¥13,646 million
($138,881 thousand), respectively.
For the year ended March 31, 2008, the Company recorded an impair-
ment loss of ¥32 million on certain leased property held under finance
leases which do not transfer ownership as an allowance for impairment loss
on leased property, which is included in long-term liabilities—other.
As discussed in Note 2.j, the Company accounts for leases which
existed at the transition date and do not transfer ownership of the leased
property to the lessee as operating lease transactions.
Pro forma information of leased property such as acquisition cost,
accumulated depreciation, accumulated impairment loss, obligation under
finance lease, depreciation expense, interest expense and other information
of finance leases that commenced before March 31, 2008 and do not
transfer ownership of the leased property to the lessee on an “as if capital-
ized” basis for the years ended March 31, 2008 and 2009 was as follows:
12. LEASES
Research and development costs charged to income were ¥695 million and ¥493 million ($5,014 thousand) for the years ended March 31, 2008 and 2009,
respectively.
11. RESEARCH AND DEVELOPMENT COSTS
Millions of Yen
2008 2009Buildings
andStructures
Furnitureand
Fixtures Software Total
Buildingsand
Structures
Furnitureand
Fixtures Software Total
Acquisition cost ¥4,778 ¥8,829 ¥1,949 ¥15,556 ¥4,476 ¥6,034 ¥1,034 ¥11,544Accumulated depreciation 2,411 4,052 935 7,398 2,781 3,302 531 6,614Accumulated impairment loss — 32 — 32 — — — —Net leased property ¥2,367 ¥4,745 ¥1,014 ¥ 8,126 ¥1,695 ¥2,732 ¥ 503 ¥ 4,930
Thousands of U.S. Dollars
2009Buildings
andStructures
Furnitureand
Fixtures Software Total
Acquisition cost $45,557 $61,404 $10,521 $117,482Accumulated depreciation 28,305 33,602 5,398 67,305Net leased property $17,252 $27,802 $ 5,123 $ 50,177
Obligations under finance leases:
Millions of YenThousands ofU.S. Dollars
2008 2009 2009Due within one year ¥2,907 ¥1,988 $20,229Due after one year 5,586 3,252 33,094Total ¥8,493 ¥5,240 $53,323
Allowance for impairment loss on leased property of ¥32 million as of March 31, 2008 was not included in obligations under finance leases.

31ITOCHU Techno–Solutions Corporation Annual Report 2009
Depreciation expense and interest expense, which were not reflected in
the accompanying consolidated statements of income, were computed by
the straight-line method and the interest method, respectively.
The minimum rental commitments under noncancelable operating
leases as of March 31, 2008 and 2009 were as follows:
Millions of YenThousands ofU.S. Dollars
2008 2009 2009Due within one year ¥2,969 ¥2,047 $20,831Due after one year 3,625 2,277 23,177Total ¥6,594 ¥4,324 $44,008
The net investment in lease included in receivables—other are summarized as follows:
Millions of YenThousands ofU.S. Dollars
2009 2009Gross lease receivables ¥2,140 $21,776Unearned interest income 220 2,232Investments in lease ¥1,920 $19,544
Maturities of lease receivables for finance leases that deem to transfer ownership of the leased property to the lessee are as follows:
Millions of YenThousands ofU.S. Dollars
Year Ending March 31 2009 20092010 ¥428 $ 4,3572011 428 4,3572012 417 4,2442013 282 2,8722014 247 2,5132015 and thereafter 338 3,433Total ¥2,140 $21,776
The Group enters into derivative financial instruments (“derivatives”), includ-
ing foreign currency forward contracts to hedge foreign exchange risk
associated with certain assets, liabilities and firm commitments of ordinary
purchase transactions denominated in foreign currencies.
All derivative transactions are entered into to hedge foreign currency
exposures incorporated within its business. Accordingly, foreign currency
risk in these derivatives is basically offset by opposite movements in the
value of hedged assets, liabilities or firm commitments of ordinary purchase
transactions.
Because the counterparties to these derivatives are limited to major
international financial institutions and a general trading company, the Group
does not anticipate any losses arising from credit risk.
Derivative transactions entered into by the Group have been made in
accordance with internal policies which regulate the authorization and credit
limit amount.
Forward exchange contracted amounts which are assigned to associ-
ated assets or liabilities are reflected on the balance sheet at year end.
13. DERIVATIVES
As of March 31, 2009, the Group is contingently liable for guarantees of borrowings by the Group’s employees amounting to ¥300 million ($3,058 thousand).
14. CONTINGENT LIABILITIES
Notes to Consolidated Financial Statements
Depreciation expense, interest expense and other information under finance leases:
Millions of YenThousands ofU.S. Dollars
2008 2009 2009Depreciation expense ¥3,386 ¥2,689 $27,361Interest expense 299 232 2,364Total ¥3,685 ¥2,921 $29,725Lease payments ¥3,644 ¥2,955 $30,073Reversal of allowance for impairment loss on leased property — 32 321Impairment loss 32 — —
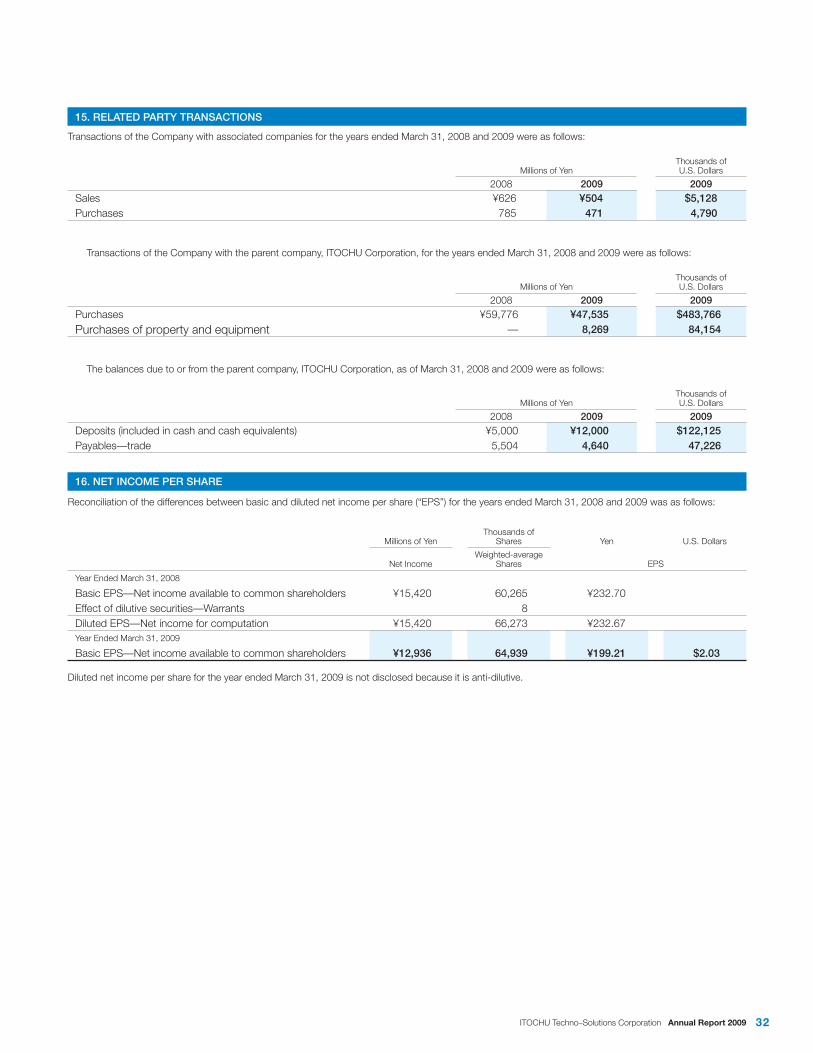
32ITOCHU Techno–Solutions Corporation Annual Report 2009
Transactions of the Company with associated companies for the years ended March 31, 2008 and 2009 were as follows:
Millions of YenThousands ofU.S. Dollars
2008 2009 2009Sales ¥626 ¥504 $5,128Purchases 785 471 4,790
Transactions of the Company with the parent company, ITOCHU Corporation, for the years ended March 31, 2008 and 2009 were as follows:
Millions of YenThousands ofU.S. Dollars
2008 2009 2009Purchases ¥59,776 ¥47,535 $483,766Purchases of property and equipment — 8,269 84,154
The balances due to or from the parent company, ITOCHU Corporation, as of March 31, 2008 and 2009 were as follows:
Millions of YenThousands ofU.S. Dollars
2008 2009 2009Deposits (included in cash and cash equivalents) ¥5,000 ¥12,000 $122,125Payables—trade 5,504 4,640 47,226
15. RELATED PARTY TRANSACTIONS
Reconciliation of the differences between basic and diluted net income per share (“EPS”) for the years ended March 31, 2008 and 2009 was as follows:
Millions of YenThousands of
Shares Yen U.S. Dollars
Net IncomeWeighted-average
Shares EPS
Year Ended March 31, 2008
Basic EPS—Net income available to common shareholders ¥15,420 60,265 ¥232.70Effect of dilutive securities—Warrants 8Diluted EPS—Net income for computation ¥15,420 66,273 ¥232.67Year Ended March 31, 2009
Basic EPS—Net income available to common shareholders ¥12,936 64,939 ¥199.21 $2.03
Diluted net income per share for the year ended March 31, 2009 is not disclosed because it is anti-dilutive.
16. NET INCOME PER SHARE
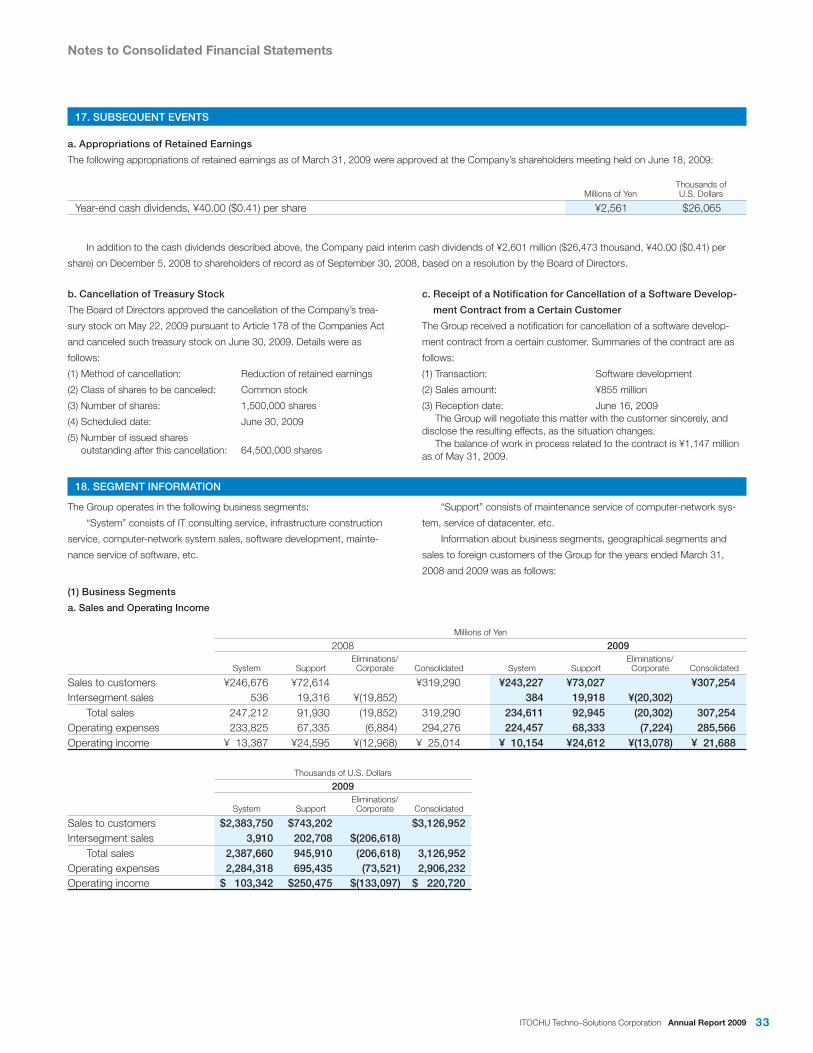
33ITOCHU Techno–Solutions Corporation Annual Report 2009
b. Cancellation of Treasury Stock
The Board of Directors approved the cancellation of the Company’s trea-
sury stock on May 22, 2009 pursuant to Article 178 of the Companies Act
and canceled such treasury stock on June 30, 2009. Details were as
follows:
(1) Method of cancellation: Reduction of retained earnings
(2) Class of shares to be canceled: Common stock
(3) Number of shares: 1,500,000 shares
(4) Scheduled date: June 30, 2009
(5) Number of issued shares outstanding after this cancellation: 64,500,000 shares
c. Receipt of a Notification for Cancellation of a Software Develop-
ment Contract from a Certain Customer
The Group received a notification for cancellation of a software develop-
ment contract from a certain customer. Summaries of the contract are as
follows:
(1) Transaction: Software development
(2) Sales amount: ¥855 million
(3) Reception date: June 16, 2009 The Group will negotiate this matter with the customer sincerely, and disclose the resulting effects, as the situation changes. The balance of work in process related to the contract is ¥1,147 million as of May 31, 2009.
a. Appropriations of Retained Earnings
The following appropriations of retained earnings as of March 31, 2009 were approved at the Company’s shareholders meeting held on June 18, 2009:
Millions of YenThousands ofU.S. Dollars
Year-end cash dividends, ¥40.00 ($0.41) per share ¥2,561 $26,065
In addition to the cash dividends described above, the Company paid interim cash dividends of ¥2,601 million ($26,473 thousand, ¥40.00 ($0.41) per
share) on December 5, 2008 to shareholders of record as of September 30, 2008, based on a resolution by the Board of Directors.
17. SUBSEQUENT EVENTS
Notes to Consolidated Financial Statements
The Group operates in the following business segments:
“System” consists of IT consulting service, infrastructure construction
service, computer-network system sales, software development, mainte-
nance service of software, etc.
“Support” consists of maintenance service of computer-network sys-
tem, service of datacenter, etc.
Information about business segments, geographical segments and
sales to foreign customers of the Group for the years ended March 31,
2008 and 2009 was as follows:
18. SEGMENT INFORMATION
(1) Business Segments
a. Sales and Operating Income
Millions of Yen
2008 2009
System SupportEliminations/Corporate Consolidated System Support
Eliminations/Corporate Consolidated
Sales to customers ¥246,676 ¥72,614 ¥319,290 ¥243,227 ¥73,027 ¥307,254Intersegment sales 536 19,316 ¥(19,852) 384 19,918 ¥(20,302)
Total sales 247,212 91,930 (19,852) 319,290 234,611 92,945 (20,302) 307,254Operating expenses 233,825 67,335 (6,884) 294,276 224,457 68,333 (7,224) 285,566Operating income ¥ 13,387 ¥24,595 ¥(12,968) ¥ 25,014 ¥ 10,154 ¥24,612 ¥(13,078) ¥ 21,688
Thousands of U.S. Dollars
2009
System SupportEliminations/Corporate Consolidated
Sales to customers $2,383,750 $743,202 $3,126,952Intersegment sales 3,910 202,708 $(206,618)
Total sales 2,387,660 945,910 (206,618) 3,126,952Operating expenses 2,284,318 695,435 (73,521) 2,906,232Operating income $ 103,342 $250,475 $(133,097) $ 220,720

34ITOCHU Techno–Solutions Corporation Annual Report 2009
(2) Geographical Segments and Sales to Foreign Customers
Geographical segment information was not presented since aggregate
sales and assets of the Company and its domestic subsidiaries were more
than 90% of the consolidated net sales and assets for the years ended
March 31, 2008 and 2009
Sales to foreign customers were not presented since sales to foreign
customers were less than 10% of the consolidated sales for the years
ended March 31, 2008 and 2009.
b. Total Assets, Depreciation, Impairment Loss and Capital Expenditures
Millions of Yen
2008 2009
System SupportEliminations/Corporate Consolidated System Support
Eliminations/Corporate Consolidated
Total assets ¥86,515 ¥35,371 ¥96,206 ¥218,092 ¥91,099 ¥53,712 ¥82,645 ¥227,456Depreciation 646 662 1,852 3,160 534 1,703 2,305 4,542Impairment loss 5 2 45 52 10 5 14 29Capital expenditures 371 1,734 4,253 6,358 998 20,086 416 21,500
Thousands of U.S. Dollars
2009
System SupportEliminations/Corporate Consolidated
Total assets $927,120 $546,632 $841,087 $2,314,839Depreciation 5,432 17,330 23,466 46,228Impairment loss 100 57 142 299Capital expenditures 10,153 204,416 4,237 218,806
Notes: 1. Corporate operating expenses consist primarily of administrative expenses of the Company, which were not allocated to business segments. Corporate operating expenses for the years ended March 31, 2008 and 2009 were ¥14,358 million and ¥14,860 million ($151,231 thousand), respectively.
2. Corporate assets consist primarily of cash and cash equivalents, investment securities and administrative assets of the Company. Corporate assets as of March 31, 2008 and 2009 were ¥101,804 million and ¥88,960 million ($905,350 thousand), respectively.
35ITOCHU Techno–Solutions Corporation Annual Report 2009
Independent Auditors’ Report
36ITOCHU Techno–Solutions Corporation Annual Report 2009
Company NameITOCHU Techno-Solutions Corporation (CTC*)*CTC= Challenging Tomorrow’s Changes (Core principle)
Head Offi ceKasumigaseki Bldg., 3-2-5, Kasumigaseki, Chiyoda-ku, Tokyo 100-6080, JapanPhone: +81-3-6203-5000URL: http://www.ctc-g.co.jp/
EstablishedApril 1, 1972
Paid-in Capital¥21,763 million
Business LinesSales, maintenance and support of computers and network systems; commissioned software development; informationprocessing services; information services related to science and engineering; support; other.
Number of Employees7,095 (CTC Group Total, as of April 1, 2009)
Main Suppliers & Sales PerformanceSun Microsystems Executive Partner (No. 1 partner in Japan)
Cisco Systems Cisco Systems Gold Partner (No. 2 vendor in Japan)
Oracle Grid Award 2009
Certifi ed Advantage Partner
Advanced Certifi ed Support Partner
EMC EMC Velocity Signature Partner (No. 1 Unit Sales at CLARiX in Japan)
Avaya Platinum Partner (No. 1 vendor in Japan)
Hewlett-Packard Hewlett-Packard Premier Enterprise Business Partner (No.1 vendor in Japan)
NetApp Star Partner (No. 1 vendor in Japan)
Symantec Symantec Major Reseller (Availability No. 1 vendor in Japan)
HITACHI HITACHI Business Partner (No. 1 vendor in Japan of Hitachi Storage Solutions)Received the JP1 Technical Award for three consecutive years
Consolidated SubsidiariesCompany Paid-in Capital Main Business Activities
CTC TECHNOLOGY CORPORATION ¥ 450 million Maintenance and System management services, Support services on system and network, System construction services, IT-related training
CRC Systems Corp. ¥ 200 million Telecommunications and broadcasting operation services, software development services, solution services, centering on system operations management services
CTCSP CORPORATION ¥ 200 million Sales of network and security-related equipment, storage devices and packaged software, and provision of related services
CTC LABORATORY SYSTEMS CORPORATION ¥ 300 million Hardware for the pharmaceutical, chemical and food product industries, software sales and support, agency for fee-based services
CTC SYSTEM OPERATIONS Corporation ¥ 100 million System operation services
CRC Facilities Corp. ¥ 100 million Building facility operations management activities for computer centers (Yoko-hama, Kobe, Otemachi, Shibuya, Mejirozaka)
CTC BUSINESS SERVICE CORPORATION ¥ 100 million Various business functions (human resources, administration) entrusted by CTC Group companies, as well as planning, producing and maintaining web content, and planning and producing advertising materials
First Contact Corporation ¥ 50 million Contact center operations, helpdesk services, IT training, planning and imple-mentation of IT training
Asahi Business Solutions Corp. ¥ 110 million Overall system development, maintenance, operation and IT consulting
Accudata Research Institute Inc. NT$ 78.81 million Overall system development
Two other companies (one in Japan, one overseas)
Associated Companies Accounted for by the Equity MethodCompany Paid-in Capital Main Business Activities
i Business Partners Corporation ¥ 60 million Gas station system support, offi ce outsourcing service
ITOCHU Technology Ventures, Inc. ¥ 100 million Operation of investment funds for venture companies
IHI Scube Co., Ltd. ¥ 260 million System development
One other overseas company
CTC Group Companies
Corporate Data
ITOCHU Techno-Solutions Corporation
2006 October • ITOCHU TECHNO-SCIENCE Corporation and CRC Solutions Corp. merged to form ITOCHU Techno-Solutions Corporation.
2007 January • Established the Osaki Development Center in Osaki, Shinagawa-ku, Tokyo.
2008 July • Established CTC SYSTEM OPERATIONS Corporation as a consolidated subsidary
2008 October • Established the Mejirozaka Data Center in Bunkyo-ku, Tokyo
Corporate History

37ITOCHU Techno–Solutions Corporation Annual Report 2009
Directors and Auditors Executive Offi cers
President & CEO
Director
Director
Director
Director
Director
Director
Director
Director
Director
Director
Director
Corporate Auditor
Corporate Auditor
Corporate Auditor
Corporate Auditor
Yoichi Okuda
Tohru Nakano
Shigeki Nishiyama
Kyoji Ohnishi
Yoshinori Warashina
Yasuo Kanematsu
Shinichiro Sakuraba
Masaaki Matsuzawa
Akira Saitoh
Takatoshi Matsumoto
Takahiro Susaki
Tomohito Arai
Masao Kasama
Hiroshi Shibata
Kosuke Hayashi
Shuji Ikeda
Managing Executive Officer
Managing Executive Officer
Executive Officer
Executive Officer
Executive Officer
Executive Officer
Executive Officer
Executive Officer
Executive Officer
Executive Officer
Executive Officer
Executive Officer
Executive Officer
Executive Officer
Executive Officer
Executive Officer
Executive Officer
Executive Officer
Executive Officer
Executive Officer
Executive Officer
Executive Officer
Executive Officer
Yoichi Okugi
Shigemitsu Takatori
Tadataka Okubo
Ryuji Nishimura
Toru Shobuda
Yoshimichi Miura
Katsuyuki Shirota
Ryouji Yokoyama
Yasuhiko Terada
Yasuhide Masanishi
Hiroaki Okamatsu
Seiji Suzuki
Hisashi Eda
Takahiro Tani
Nobuyuki Nambu
Eiji Haraguchi
Kazunobu Moriyama
Mitsuaki Kato
Hiroyuki Tamura
Hiroshi Iimuro
Tomohiko Sumi
Toshiyuki Awai
Takanori Minatohara
*1
*2
*2
*3
*3
*4
*4
*4
*4
*1 Representative Director
*2 Executive Vice President
*3 Senior Managing Officerr
*4 Managing Executive Officer
Board of DirectorsAs of June 18, 2009

38ITOCHU Techno–Solutions Corporation Annual Report 2009
Corporate OrganizationAs of April 1, 2009
Telecom Systems Division No. 1
Telecom Systems Division No. 2
Telecom Systems Division No. 3
Telecom Systems Planning Division
Financial Systems Division No. 1
Financial Systems Division No. 2
Financial Systems Advanced IT Planning Division
Enterprise Business Division No. 1
Enterprise Business Division No. 2
Central & Western Region Business Division
Solution Business Promotion Division
Enterprise Engineering Division
DC Sales Division
DC Services & Engineering Division
DC Planning & Administration Division
Distribution Systems Division No. 1
Distribution Systems Division No. 5
Distribution Systems Division No. 2
Distribution Systems Division No. 3
Science & Engineering Systems Division
Management Services Sales Division
Software Support Services Division
IT Support Service Planning Division
IT Business Marketing Division
IT Engineering Division
Sales Administration & Operation Division
Finance & Accounting Division
Human Resources Management & General Affairs Division
Business Support Division
Corporate Planning Division
Audit Division
Telecom Systems Group
Financial Systems Group
Enterprise Systems Group
Data Center Group
Distribution Systems Group No.1
IT Support Services Group
Cross Function Group
Corporate Administration Group
General Meetingof Shareholders
Board of Directors
President & CEO
Board ofCorporate Auditors
Management Committee
CSRCommittee
Distribution Systems Division No. 4
Enterprise Business Division No. 3
Project Management Offi ce
Distribution Systems Group No.2
Telecom Systems Project Administration Division

39ITOCHU Techno–Solutions Corporation Annual Report 2009
Other entities 1.49%
Foreign entities, etc. 1.22%
Securities companies 0.21%
Financial institutions 0.27%
Individuals, others 96.81%
Individuals, others 16.11%
Foreign entities, etc. 16.07%
Financial institutions 13.93%
Securities companies 0.45%
Other entities 53.44%
Common Stock
Authorized 246,000,000 sharesIssued (As of June 30, 2009) 64,500,000 shares(On June 30, 2009, Common stock issued and outstanding decreased 1,500,000 shares, compared with March 31, 2009, owing to the extinguishment of treasury stock.)
Number of Shareholders 20,594
Major ShareholdersNumber of Shares (%)
1. ITOCHU Corporation 33,665,400 51.01
2. CBNY-ORBIS SICAV 4,644,810 7.04
3. Japan Trustee Services Bank, Ltd. (Trust Account 4G) 1,985,500 3.01
4. The Master Trust Bank of Japan, Ltd. (Trust Account) 1,637,200 2.48
5. Japan Trustee Services Bank, Ltd. (Trust Account) 1,616,600 2.45
6. Japan Trustee Services Bank, Ltd. (Trust Account 4) 1,584,000 2.40
7. CTC Employee Shareholding Association 820,768 1.24
8. CBNY-Orbis Funds 766,148 1.16 9. Trust & Custody Services Bank, Ltd. as trustee for Mizuho Bank, Ltd.
Retirement Benefi t Trust Account re-entrusted by Mizuho Trust and Banking Co., Ltd.420,546 0.64
10. CREDIT SUISSE SEC (EUROPE) LTD PB SEC INT NON-TR CLT 363,000 0.55
Note: Additionally, as of June 30, 2009 the Company holds 470,225 shares of treasury stock.
Volume of tradingStock Price
18,000,0006,000
(Yen) (Shares)
5,000
3,000
2,000
1,000
4,000
0
15,000,000
9,000,000
3,000,000
12,000,000
6,000,000
02007/4 5 6 7 8 9 10 11 12 5 6 72 3 2 2009/32008/4 8 9 10 11 121 1
Stock Prices / Trading Volume Trends
Stock InformationAs of March 31, 2009
Breakdown by Number of Owners Ownership by Percentage Shareholding

http://www.ctc-g.co.jp/