Embed Size (px)
Citation preview

Cabcharge Australia Limited Annual Financial Report and its Controlled Entitities Year Ended 30 June 2016
Page 1
FOR THE YEAR ENDED 30 JUNE 2016
CABCHARGE AUSTRALIA LIMITED ABN 99 001 958 390 APPENDIX 4E Preliminary Final Report Financial year ended 30 June 2016
Results for announcement to the market Extracts from this report for announcement to the market $A’000 Revenues Down -10.2% to 168,808 Statutory net profit after tax attributable to members
Down -45.0% to 25,616
Dividends (distributions)
Amount per share
Franked amount per share
Final dividend
(Current period) (Previous period)
10.0 ¢ 10.0 ¢
10.0 ¢ 10.0 ¢
Interim dividend
(Current period) (Previous period)
10.0 ¢ 10.0 ¢
10.0 ¢ 10.0 ¢
Record date for determining entitlements to the dividend
30 September 2016
Date the final dividend is payable
31 October 2016
Sheila Lines Chief Financial Officer
Date: 26 August 2016
For
per
sona
l use
onl
y

Operating and Financial Review
Page 2
Business Overview
Cabcharge operates Taxi Networks and provides an alternative payment system to cash for the Taxi Industry in Australia. The Company provides Taxi Network services to Taxi Operators and Drivers in Sydney, Melbourne, Adelaide, Newcastle, regional Victoria and NSW, and the Northern Territory. Network services include taxi booking services, full taxi fit-outs and repairs, vehicle financing and insurance, as well as Driver training and education. Payment services offer taxi Passengers a convenient, fast and secure method for cashless fare payments via electronic terminals for which Cabcharge earns a service fee. The Company also holds a 49% investment in a route, school and charter bus services company in Australia, ComfortDelGro Cabcharge Pty Ltd (CDC), as well as a 49% investment in CityFleet Networks Ltd (CFN), a provider of account, booking and dispatch services for taxis and private hire vehicles, as well as coach services in the UK. In the Consolidated Financial Statements, equity accounting standards are applied to both investments. Strategy
We have upheld our focus on transforming Cabcharge and throughout the last 2 years we have remained committed to 5 strategic tasks:
Integrating Networks Committing to a Key Brand Linking Bookings and Payments Supporting our Merchant Partners Looking after our Customers
We recognise the substantial opportunity for growth in personal transport in Australia in the midst of changing industry dynamics. We start from a position of strength and experience, and are determined to leverage Cabcharge’s unique capabilities to generate competitive advantage. At the same time, we continue to assess how technology and regulation – old and new – giving participants more choices. There are more ways to book and pay for personal transport than ever before and we are executing on a program of work designed to close gaps in our offerings to Passengers and Drivers. Above all, we know that to capture the tail winds of a growing market, in terms of both trips and electronic transactions, we must evolve and invest. During FY16 we have continued to make strong progress on our 5 strategic priorities. To integrate networks we have restructured our workforce, consolidated contact centres and further advanced our technology standardisation across dispatch and phone systems. Committing to a key brand resulted in our FY16 rebrand of Newcastle Taxis to 13Cabs, with operations in Adelaide, Melbourne and Newcastle now aligned under common branding. Bookings and payments have been linked through our own apps as well as some of our Merchant Partners. In and with the support of our Merchant Partners we have substantially concluded a program of technology refreshment encompassing nearly every taxi in Australia involving the installation of a new FAREWAYplus device and updated pinpad - supporting a better payment experience for Drivers and Passengers alike. The momentum achieved on the first 4 of our strategic tasks enables us to do more of what matters most – looking after our customers. We are intent on delivering certainty of service for people who book taxis and we are using technology to assist our Drivers and Passengers to connect. Drivers can now call Passengers on approach to help them find each other, a feature which has greatly enhanced certainty of service for both Passengers and Drivers. Over the last 12 months various Government announcements have cleared much of the remaining regulatory uncertainty overhanging our industry and have enabled us to set our future strategy with confidence. Within an overarching purpose of ‘Connecting You with
For
per
sona
l use
onl
y

Operating and Financial Review
Page 3
People and Places’, our 5 year vision is to be Australia’s leading personal transport business and to become the first choice for personal and corporate Passengers, the preferred network and payment partner for Drivers and the employer of choice in the personal transport sector. Material Business Risks
The Board reviews material business risks on a regular basis, and those risks that have the potential to impact the Company’s future financial prospects and strategic imperatives are set out below, together with mitigating actions to minimise those risks. The risks outlined below are in no particular order and do not include common risks that affect all companies, such as key person risk. Nor do they include general economic risks such as significant changes in economic growth, inflation, interest rates, consumer sentiment and business confidence that could have a material impact on the future performance of the Company.
Strategic Risk Nature of Risk Actions / plans to mitigate Regulatory changes
Cabcharge operates in industries that are subject to State and Territory regulation and control. In addition to the price control imposed on service fees in Victoria, New South Wales and Western Australia, other Taxi Regulators may impose limits on the level of service fees able to be charged to Cabcharge customers thereby potentially impacting revenue and earnings. Taxi Regulators may also change rules around required standards and quality control aspects of Taxi Networks. Taxi Regulators may also affect the value of taxi plate licences through setting supply of new taxi plate licences and setting rates for government leased taxi plate licences. In addition, changes in taxi regulation, including establishing a regulatory environment for non-taxi transport can indirectly affect the value of taxi plate licences. Taxi Regulators may also restrict the supply of taxi plate licences which limits growth opportunities for the taxi industry.
Work with Taxi Regulators on issues affecting the Taxi Industry. Advocate for and deliver standards and controls that result in maintaining or improving the standards of customer service and safety that are essential to transport user confidence.
Changes to competitive landscape / Changes to IT
Continued emergence of new competitors in personal transport who offer alternative service and payment methods, both within
Be at the forefront of Taxi Network app development and integrate bookings and payments.
For
per
sona
l use
onl
y

Operating and Financial Review
Page 4
environment
and outside the regulatory framework, or subject to less stringent regulation. Potential loss of business if the Company fails to keep pace with technological change with respect to network operations, bookings and payments.
Continue investment in technology as reflected by the Cabcharge payments gateway and switch, FAREWAYplus and upgrades to the 13CABS and Silver Service taxi apps
Asset impairments In line with accounting standards, Cabcharge periodically tests the carrying value for certain assets recognised in the Consolidated Statement of Financial Position. This process involves considering the operational results and future outlook of each asset as well as the valuation assumptions utilised (for example discount rates and currency). Should these underlying assumptions change, there may be potential for a non-cash impairment to reflect the revised asset valuation.
Continued regular monitoring of asset growth profiles, operating environments and other valuation assumptions.
For
per
sona
l use
onl
y
Operating and Financial Review
Page 5
Financial and Operational Analysis
Result Overview
StatutoryBasis:
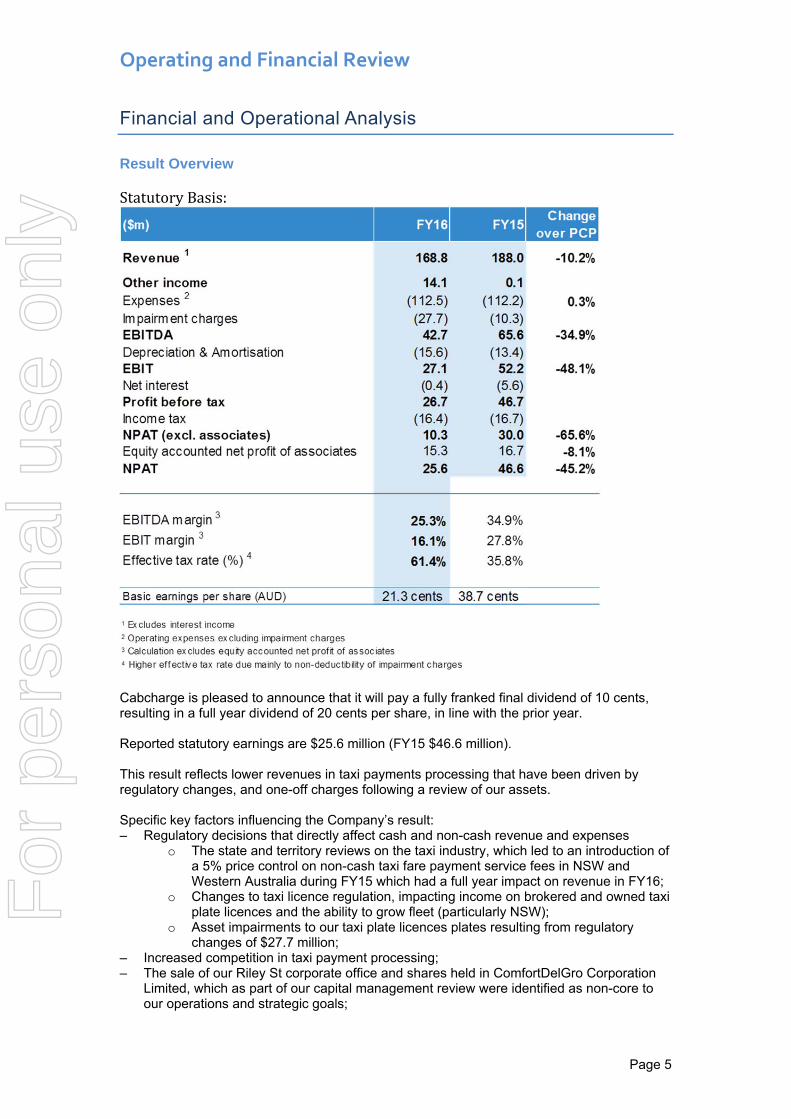
Cabcharge is pleased to announce that it will pay a fully franked final dividend of 10 cents, resulting in a full year dividend of 20 cents per share, in line with the prior year. Reported statutory earnings are $25.6 million (FY15 $46.6 million). This result reflects lower revenues in taxi payments processing that have been driven by regulatory changes, and one-off charges following a review of our assets. Specific key factors influencing the Company’s result: ‒ Regulatory decisions that directly affect cash and non-cash revenue and expenses
o The state and territory reviews on the taxi industry, which led to an introduction of a 5% price control on non-cash taxi fare payment service fees in NSW and Western Australia during FY15 which had a full year impact on revenue in FY16;
o Changes to taxi licence regulation, impacting income on brokered and owned taxi plate licences and the ability to grow fleet (particularly NSW);
o Asset impairments to our taxi plate licences plates resulting from regulatory changes of $27.7 million;
‒ Increased competition in taxi payment processing; ‒ The sale of our Riley St corporate office and shares held in ComfortDelGro Corporation
Limited, which as part of our capital management review were identified as non-core to our operations and strategic goals;
For
per
sona
l use
onl
y

Operating and Financial Review
Page 6
‒ Our continuing investment in reshaping our business model and capabilities to set a strong platform for future growth across our key activities.
Underlying basis excluding significant items:
Underlying earnings have shown resilience in light significant regulatory change and a challenging operating environment, resulting in an underlying EBITDA of $58.6 million (FY15: $75.9 million) and underlying NPAT of $43.6 million (FY15: $56.9 million).
($m) FY16 FY15 Change
over PCP
Revenue 1 168.8 188.0 -10.2%
Other income 2 0.0 0.1
Expenses 3 (110.2) (112.2) -1.8%
Impairment Charges 4 0.0 0.0 EBITDA 58.6 75.9 -22.8%
Depreciation & Amortisation 5 (13.9) (13.4)EBIT 44.7 62.5 -28.5%
Net interest 6 (4.9) (5.6)Profit before tax 39.8 56.9
Income tax 7 (11.5) (16.7)NPAT (excl. associates) 28.3 40.2 -29.7%Equity accounted net profit of associates 15.3 16.7 -8.1%NPAT 43.6 56.9 -23.5%
EBITDA margin 834.7% 40.4%
EBIT margin 826.5% 33.2%
Effective tax rate (%) 9 28.9% 29.3%
Basic earnings per share (AUD) 36.2 cents 47.2 cents
1 Excludes interest income2 Excludes $14.1 million gain on sale of Riley Street3 Excludes $2.3 million in employee separation costs4 Excludes non-cash impairment charges on taxi plate licences in FY16 and on CFN in FY155 Excludes $1.7 million accelerated amortisation on NSW wheel chair accessible taxi plate licences6 Excludes$4.5 million gain on sale of shares in ComfortDelGro Corporation Limited 7 Excludes tax effect of gains on sale of Riley Street and shares in ComfortDelGro Corporation Limited 8 Calculation excludes equity accounted net profit of associates9 Lower effective tax rate due mainly to exclusion of non-deductibility of impairment charges
For
per
sona
l use
onl
y

Operating and Financial Review
Page 7
Revenue and Turnover
Revenue declined 10.2%, or $19.2 million to $168.8 million (FY15: $188.0 million), driven by the full year impact of regulatory changes. Revenue is primarily generated by the following categories:
‐ Taxi Payments – processing of non-cash taxi payments; ‐ Taxi Services – including network service fees, brokered and owned taxi plate
licence income, vehicle financing and insurance lease income, and other taxi related services income; and
‐ Other revenue – includes bus operator income in South Australia and third party payments income
Taxi Payments Taxi Payment services provide taxi Passengers with fast and secure cashless fare payments via electronic terminals. Taxi Payments revenue of $62.4 million declined 17.7% from the prior year (FY15: $75.9 million). This has largely been driven by the full year impact of regulatory changes to limit service fees on non-cash taxi payments to 5% in NSW (12 December 2014) and Western Australia (24 February 2015). As a result of the regulatory changes the effective service fee rate has decreased from 6.8% in FY15 to 5.7% in FY16. These changes followed the regulatory imposition of a 5% price control to non-cash taxi payments in Victoria in FY14. During FY16 the Australian Capital Territory and South Australia announced their intentions to limit service fees on non-cash taxi payments to 5%. In August 2016, Queensland announced a 5% price control to non-cash taxi payments to occur in 2017. With this announcement, Cabcharge can move forward with greater certainty regarding the regulatory landscape in Australia. Despite media focus on the industry disruption from ridesharing, the value of taxi fares processed, by Cabcharge, has grown at a compound annual growth rate (“CAGR”) of 2.9% over the past 5 years.
For
per
sona
l use
onl
y

Operating and Financial Review
Page 8
The value of taxi fares processed in FY16 fell marginally; this is partly due to a reduction in Cabcharge account usage. Almost half of the decline in taxi fares processed was driven by lower Cabcharge volumes in states that are affected by the slowdown in the resources sector, Western Australia, South Australia and Queensland. The customer account base remains consistent, with the decline primarily visible on single use product volumes. Our increased investment in account management capabilities has improved our understanding of the product feature enhancements our account customers most value. In FY16 we issued new and improved Fastcards to 80% of our customer base with the remaining customers to be completed in FY17. In FY17 we will also offer new single use products which allow customers to independently configure usage rules, something our customers have asked for. CabchargeAccountFaresProcessed‐$millions
Non Cabcharge account volumes declined 1.5%. Cabcharge recognises that the hand held terminal segment, in which Cabcharge has not competed, took share from in-taxi fixed terminal processed payments. In Victoria in FY16 we gave back some of the market share gains achieved in FY15 and in Queensland fares processed reduced both as a result of economic conditions in the state and increased competition from hand held terminal providers. Cabcharge is currently trialling its hand held terminal offering and will roll out a competitive product in FY17 to grow market share and re-establish growth of fares processed.
‐
20
40
60
80
100
120
Fastcard
Singleuse
Fastcard
Singleuse
Fastcard
Singleuse
Fastcard
Singleuse
Fastcard
Singleuse
Fastcard
Singleuse
Fastcard
Singleuse
Fastcard
Singleuse
NSW VIC QLD WA SA ACT NT TAS
FY15 FY16
For
per
sona
l use
onl
y

Operating and Financial Review
Page 9
Total Taxi Fares Processed by State and Territory - $ millions
Taxi Network Services Total Taxi Network Services revenue of $91.9 million declined 3.1% from the prior year (FY15: $94.8 million). Taxi Network Services Revenue - $ millions
The largest contribution to Taxi Services revenue has been Network Subscription Fees which is a function of the Group’s taxi network affiliated fleet size. Network Subscription Fees revenue of $57.9 million increased 4.6% from the prior year (FY15: $55.3 million) driven by the increase in the fleet size.
For
per
sona
l use
onl
y

Operating and Financial Review
Page 10
Total Fleet
At the end of FY16 there were 7,448 cars on our networks, equivalent to fleet growth of 189 cars or 2.6%. This is a strong result, particularly in light of the fact that the NSW government shrunk the pool of available taxi plate licences by as much as 190 during FY16. Nevertheless, we have maintained ongoing momentum behind fleet growth as evidenced by the fact that in Sydney at the end of 1H16 we had 52 licences on the shelf that were not leased out to taxi operators. This situation has turned around. All our licences, managed and owned, are now leased out and we have a waiting list for more reflecting early signs of a change in sentiment for the industry supported by a notable increase in the number of Drivers joining our Sydney network. Fleet has grown at a CAGR of 5.2% over the past 5 years. In addition, we have a further 176 wheelchair accessible taxis in Sydney that are members of other networks but attached to our Sydney dispatch system as the result of us contracting with the NSW Government to coordinate booking services for Wheelchair Accessible Taxis to ensure the maximum efficiency and usage of these vehicles and the best possible service for Passengers with disabilities across Sydney. Our bureau service model where we provide 13CABS brand association and contact centre services directly to other taxi networks and in some cases, operators, has been a major contributor to fleet growth and also the geographic reach of our taxi network services, particularly into regional Victoria and the Northern Territory. This model is attractive, offering smaller taxi organisations the benefits of scale and simplification of operations. Cabcharge-owned taxi networks lease taxi plate licences from owners and then lease these taxi plate licences to taxi operators, with a small service fee added. While provision of this service does not generate significant margin for the Company, acting as an intermediary in the taxi plate licence market is an important service for the industry. Cabcharge took the decision to lower taxi plate licences fees to our operators, improving their economic position to compete in the new regulatory environment. The continued economic strength of the taxi industry, and all its participants, is essential for growth in our key metrics of fleet and taxi fares processed. Consequently, Brokered taxi plate licence income in FY16 was 9.6% or $2.4 million lower at $22.7 million (FY15: $25.1 million). However, offsetting the impact of this reduction, Brokered taxi plate licence costs also fell 10.7% or $2.6 million to $21.4 million in FY16 (FY15: $24.0 million).
Owned Taxi Plate Licence Income Owned taxi plate licence income relates to income on the taxi plate licence portfolio the Company acquired historically. In total, income on owned taxi plate licences for FY16 was $6.9 million (FY15: $8.2 million). The current annual yield on our taxi plate licence portfolio is approximately $5 million.
For
per
sona
l use
onl
y
Operating and Financial Review
Page 11
Other taxi related services income decreased from $7.3 million in FY15 to $5.3 million in FY16 due to the focus of Cabcharge technicians on FAREWAYplus equipment installations and away from third party billable technical services in FY16. Vehicle financing and insurance lease income decreased by $1.1 million to $6.0 million in FY16 reflecting reduced financing demand in the NSW market due to regulatory uncertainty in that market. As a result, our loans to operators reduced $7.5 million over FY16. The annualised income on current levels of financing activity is approximately $5.2 million. The partially mitigating saving in Cabcharge finance costs is included in the reduction of Finance costs.
Other Revenue Other revenue decreased from $9.1 million in FY15 to $7.6 million in FY16. Payments consulting income from third-parties was $0.5 million and Cabcharge account late fees $0.2M lower in FY16 than in prior year. The largest component of other revenue is bus operator income in South Australia of $2.1 million (FY15 $2.2 million).
Other income Other income increased to $14.1 million in FY16 (FY15: $0.01 million) due to the gain on sale of the Riley Street corporate office in Sydney. The sale of this property for $18.1 million resulted from our capital management review aimed at driving ongoing balance sheet efficiency.
Expenses Total operating expenses (excluding accelerated amortisation and impairment charges on taxi plate licences in FY16 and impairment charges on investments in associates in FY15) increased 0.8% to $126.5 million (FY15: $125.6 million). This is a strong result given the investment in a strategic change program to build capabilities and strong foundations for future growth. We have invested to pursue our strategic objectives that include increasing the size of the taxi fleet, establishing a uniform national taxi networks operating model, developing applications that link bookings and payments, deploying in-vehicle technology to support payments efficiency and enhancing the customer experience for Drivers and Passengers. New rates negotiated with taxi networks following the introduction of government price controls on taxi payments resulted in a $4.4 million decrease in processing fees to taxi networks in FY16 to $10.1 million. In FY15, the decrease in processing fees paid to taxi networks was $4.2 million, bringing the total annualised reduction in expenses to $8.6 million, versus the $7 million forecast in 1H15. As noted under Taxi Network Service revenue, Brokered taxi plate licence costs vary with Brokered taxi plate licence income. Brokered taxi plate licence costs were $21.4 million (FY15: 24 million). Other taxi related costs were $12.6 million (FY15: 11.8 million). The increase is driven by the cost of installing equipment in taxis converting to our Bureau services, which supports fleet growth. Employee benefit expenses in FY16 included $2.3 million in employee separation costs. Excluding separation costs, employee benefit expenses increased $1.1 million or 2.9%. The Company has been focused on building the organisational structure and adding the capabilities required to compete and grow in the changing personal transport market. Including the appointment of a Chief Technology Officer for the first time in July 2016, 56% of key management personnel and their direct reports have joined the Company in the last two years. The employee separation costs incurred during FY16 represent a one-off charge to
For
per
sona
l use
onl
y

Operating and Financial Review
Page 12
achieve this organisational transformation. We will continue to invest in the necessary skills and capabilities as required to achieve our strategic objectives. General and administration expenses increased 12.3% to $15.8 million [FY15: $14 million) primarily due to a $2 million increase in marketing and advertising investment to $4.6 million in FY16. Marketing activities in the year included the launch of App Payments supported by an online, direct response campaign to existing customers and new audiences already using competitor booking apps. Our sponsorship of the GWS Giants AFL team was rebranded to 13CABS and the Fastest Cabbie campaign was launched, an initiative that saw two taxi Drivers compete in the televised 13CABS AFL Grand Final Sprint. Silver Service unveiled its first ever integrated marketing campaign in Sydney launching radio, billboard, CBD lift media and a social influencer promotion across digital channels. A uniform brand positioning for Cabcharge and the Taxi Networks was developed that will become the framework for future corporate and brand initiatives. Transaction processing expenses decreased $0.6 million to $4.0 million (FY15: $4.6 million) due to lower volumes for Cabcharge FASTeTICKET and improved control procedures for FASTeTICKET validation. Lease back expense in FY17, following the sale of Riley Street for $18.2 million, will be approximately $0.9 million. Depreciation and amortisation expense increased $2.2 million to $15.7 in FY16 (FY15: $13.4 million) primarily due to $1.7 million in accelerated amortisation on New South Wales wheel chair accessible taxi plate licences arising from regulatory changes announced in December 2015. Cabcharge has recorded non-cash impairment charges of $27.7 million in FY16 relating to its national portfolio of taxi plate licences. The impairment charges reflect recent regulatory changes in many of the states which have issued taxi plate licences which we hold. In FY15 Cabcharge recorded a non-cash impairment against the carrying value of its associate interest in CFN of $10.3 million. Other expenses increased $2.1 million to $7 million in FY16 (FY15: $4.9 million) primarily due to changes to our credit provisioning policies that resulted in an increase of $1.5 million to our credit provisions for taxi operator receivables. Finance income increased $4 million to $5.5 million (FY15: $1.5 million) due to gain on the sale of shares in ComfortDelGro in December 2015. These shares were deemed to be non-core to operations and strategy following completion our capital management review aimed at driving ongoing balance sheet efficiency. Finance costs declined $1.1 million to $5.9 million (FY15: $7.1 million) due to lower average loan balances over the period. The Group’s 61.4% effective tax rate (FY15: 35.4%) is higher than the 30% statutory tax rate primarily due to the non-deductibility of impairment charges against taxi plate licences in FY16 and investments in associates in FY15 for tax purposes.
For
per
sona
l use
onl
y

Operating and Financial Review
Page 13
Investments in Associates
ComfortDelGro Cabcharge
CityFleet Network
Cabcharge holds a 49% investment in ComfortDelGro Cabcharge Pty Ltd (CDC), Australia’s largest private bus operator. CDC provides route and school bus services in Sydney, the Hunter Valley and Queanbeyan in New South Wales, and in Melbourne, Geelong and Ballarat in Victoria. As at 30 June 2016 the carrying value of Cabcharge’s investment in CDC was $251.8 million compared to $237.2 million as at 30 June 2015. Cabcharge also holds a 49% interest in CityFleet Network (CFN) in the UK, which provides account, booking and dispatch services for taxis and private hire vehicles in London, Liverpool, Edinburgh and Aberdeen, and coach services in London. The equity accounted net profit contribution from Associates, CDC and CFN, was $14.5 million and $0.8 million, respectively. Combined, this was a decrease of $1.3 million to $15.3 million in FY16 (FY15: $16.7 million). The net profit contribution from CDC of $14.5 million (FY15: $15.2 million) included a $0.8 million gain on sale of a property asset and $0.3 million of increased credit provisions relating to prior year services provided. Lower fuel prices resulted in lower fuel reimbursement income in New South Wales and Victoria, partly offset by growth in Region 4 and Hunter Valley bus services. The net profit contribution from CFN of $0.8 million (FY15: $1.5 million) was $0.5 million lower due to the closure costs of ComCab Birmingham, which had been loss making for a number of years. CFN continues to operate in London, Aberdeen, Liverpool and Edinburgh with combined revenue of $115.6 million (FY15: $114.6 million).
For
per
sona
l use
onl
y

Operating and Financial Review
Page 14
At 30 June 2016 we determined that there were no changes to CFN’s underlying performance that required impairment charges. The carrying value of the associate interest in CFN at 30 June 2016 was $44.8 million, including $14 million of surplus cash. We continue to carefully monitor the carrying value of CFN in relation to operational results and future outlook as well as current discount rates and currency exchange rates.
Net Profit The major components of the Company’s change in Net profit after tax in FY16 can be seen in the accompanying chart, both on a statutory basis and on an underlying basis. NPAT Statutory - $ millions
NPAT underlying - $ millions
Statutory basic and diluted earnings per share were 21.3 cents (2015: 38.7 cents). Underlying basic and diluted earnings per share were 36.2 cents (2015: 47.2 cents).
For
per
sona
l use
onl
y

Operating and Financial Review
Page 15
Balance Sheet
The Company’s net assets as at 30 June 2016 decreased to $388.9 million from $393.0 million at 30 June 2015. This decrease is derived principally from $25.6 million FY16 Net profit after tax (which includes $27.7 million in non-cash taxi plate licence impairment charges), less $24.1 million in dividends paid during the year, $3 million decrease in share of associates’ foreign currency translation differences, and a $3.3 million transfer out of other comprehensive income of fair value of available-for-sale financial assets, net of tax. During the year, management continued to reduce total borrowings, which stood at $109.7 million at 30 June 2016, $18.5 million lower than a year prior (30 June 2015:$128.2 million). The net debt to equity ratio was 24.9% at 30 June 2016 (30 June 2015: 26.6%). The available liquidity at 30 June 2016 was $107 million (30 June 2015: $100.9 million), consisting of $13 million in cash (2015: $23.9 million) and $94 million (2015: $77 million) in unused facilities. Management continues to take a prudent approach to gearing while ensuring the Company invests in the competitive position of its products and therefore shareholder value. In August 2016, the Company entered into agreements with its lending banks to extend its current finance facility term for a further two years from 1 July 2017 to 1 July 2019. We have also also taken advantage of the low base interest rate environment to enter into new medium term interest rate swaps at a lower rate. The Company has also reduced finance facility limits from $200 million to $160 million given an extended period of operating significantly within our credit facility levels and recognising the commitment fee cost of unutilised lines of credit. As a result of these negotiations and lower loan levels we expect our finance costs will be lower in FY17 and we now have certainty over pricing of finance facilities for the three years to 1 July 2019.
($m) 2016 2015
Cash and cash equivalents 13.0 23.8 Other current assets 82.6 76.9 Investments in associates 296.6 284.3 Property, plant and equipment 40.2 39.0 Taxi plate licences 41.2 70.9 Other non-current assets 57.0 61.9 Total assets 530.6 556.8
Loans and borrowings 109.7 128.2 Other liabilities 32.0 35.6 Total liabilities 141.7 163.8
Total net assets 388.9 393.0
Net Debt/Equity 24.9% 26.6%
Ungeared return on Australian taxi related services* 21.4% 20.4%
Ungeared return on investments in associates (excl. impairment) 6.0% 6.0%
* NPAT excluding associates' profit, impairment, interest expense Net assets excluding bank loan and investments in associates
For
per
sona
l use
onl
y
Operating and Financial Review
Page 16
Cash Flow
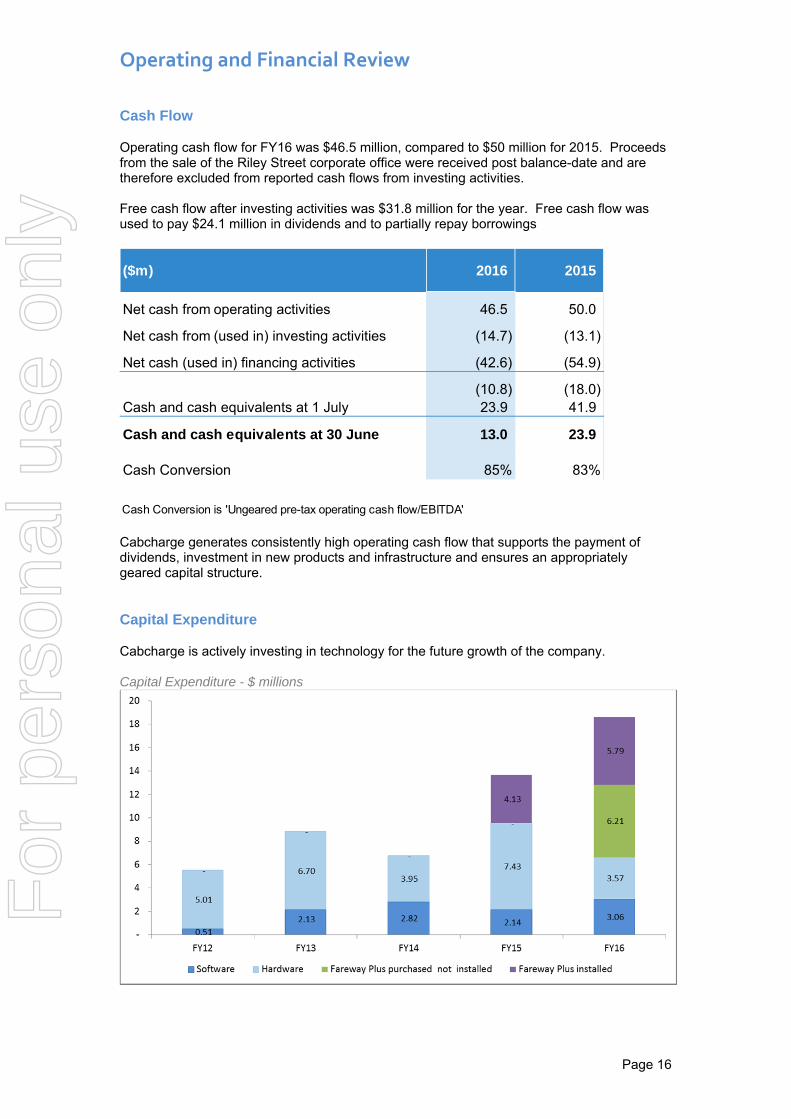
Operating cash flow for FY16 was $46.5 million, compared to $50 million for 2015. Proceeds from the sale of the Riley Street corporate office were received post balance-date and are therefore excluded from reported cash flows from investing activities. Free cash flow after investing activities was $31.8 million for the year. Free cash flow was used to pay $24.1 million in dividends and to partially repay borrowings
Cabcharge generates consistently high operating cash flow that supports the payment of dividends, investment in new products and infrastructure and ensures an appropriately geared capital structure. Capital Expenditure
Cabcharge is actively investing in technology for the future growth of the company. Capital Expenditure - $ millions
($m) 2016 2015
Net cash from operating activities 46.5 50.0
Net cash from (used in) investing activities (14.7) (13.1)
Net cash (used in) financing activities (42.6) (54.9)
(10.8) (18.0)Cash and cash equivalents at 1 July 23.9 41.9
Cash and cash equivalents at 30 June 13.0 23.9
Cash Conversion 85% 83%
Cash Conversion is 'Ungeared pre-tax operating cash flow/EBITDA'
For
per
sona
l use
onl
y

Operating and Financial Review
Page 17
Investments in property, plant and equipment were $9.8 million in FY2016 (FY15: $11.6 million) reflecting the rollout of FAREWAYplus, a new telephone system to improve customer service, and essential repairs to our key site in Alexandria, Sydney. In addition, $5.8 million of FAREWAYplus equipment not yet installed was purchased in FY16. Ongoing software development including linking payments in apps and the ability for Drivers to call Passengers resulted from $3 million investment in development of intellectual property (FY15: $2.1 million). The Company also acquired Dandenong Taxis for $1.9 million in the first half of the 2016 financial year. Dividends
The Board has declared a fully franked final dividend of 10 cents per share, with a record date of 30 September 2016 and a payment date of 31 October 2016. This brings the full year dividend for FY16 to 20 cents per share fully franked, consistent with FY15. Major Operational Developments Following the capital management review, Cabcharge undertook a sale of its investment in listed shares in ComfortDelGro Corporation Limited and the Riley Street site in Darlinghurst which currently houses Cabcharge’s corporate offices. We have entered into a two-year lease with two six-month options to renew at the Riley Street site. Lease expense from FY17 will be approximately $1 million per annum for the duration of the lease. Within the next 3 years we will transition our corporate office and payments expertise to our Alexandria site which currently houses our Sydney taxi network operations. Unifying the majority of our Sydney workforce onto a single site is part of a strategy that reflects efficient balance sheet management and is consistent with our strategic task of linking bookings and payments. Further, we will achieve a range of efficiencies as a result of decreased travel time and duplication of activities across sites, increased interaction between staff, and bringing more of our workforce into closer contact with our taxi operators, Drivers and Passengers. The move will culminate our cultural transformation in Sydney, providing the strongest physical evidence that we are no longer a siloed company. Cabcharge recognises the importance of customer service for Passengers and for Driver welfare. We have implemented several initiatives to improve the customer experience for Passengers including: linking bookings to payments improving app functionality facilitating direct contact between Passengers and Drivers prior to pick-up while
preserving the privacy of both Passenger and Driver mobile numbers consolidating our brands and changing dispatch rules to incentivise Drivers to complete a
booked pick-up service. Regulatory change has provided opportunities as well as impediments. As a result of the legalisation of ridesharing, the Company is now able to offer network branded services for private hire in the new lightly regulated pre-booked market. Additionally, Cabcharge is now able to train Drivers for taxi networks in NSW. Training our own Drivers allows us to focus on the aspects of service quality that matter to Passengers and to increase the supply of Drivers. We have invested further in our Driver services teams to enhance the ongoing support we offer to Drivers, including monitoring performance with respect to our updated service standards which are designed to provide more certainty and quality of service for Passengers. We continue to support our Merchant Network partners via the completion of a major investment and upgrade of in-taxi fixed equipment with the roll-out of FAREWAYplus. We also recognise the importance of meeting Driver needs, many of whom prefer handheld terminals. Accordingly, we will be launching our own hand held terminal offering in selected markets during FY17.
For
per
sona
l use
onl
y
Operating and Financial Review
Page 18
We estimate the size of taxi fares processed through cards, excluding our Cabcharge account products, to be $3.0 billion of which our current share with our network payments terminal business model is 25%. The opportunity to grow market share through the hand held terminal product launch is significant. Linking bookings to payments remains a key strategy in securing taxi fares processed volumes. In FY16 we launched the service in our own taxi networks and provided payments processing support for one of our merchant taxi network partners for their apps linking bookings to payments. While volumes remain a small percentage of overall bookings, this channel is growing and is essential to position the Company for the future. Following the Australian Competition and Consumer Commission approval of the iHail service in March 2016, we will be providing payments processing support for iHail in FY17. There is an untapped opportunity in linking bookings to payments for bookings taken through our call centres. While booking via app is growing, bookings through call centres remain the dominant form that customers choose when interacting with our taxi networks. Outlook
The personal transport industry is large and growing and our underlying business metrics remain strong. While we saw a modest decline in taxi fares processed in FY16, we continue to invest in initiatives that will strengthen our position within the taxi payments market such as launching a hand held terminal product, improving Cabcharge products, and linking bookings to payments. Our taxi networks fleet continues to grow. In FY17 we will continue to improve the value proposition of our taxi networks for Passengers, operators and Drivers. Our first priority is to provide taxi Passengers with an industry-leading booking and trip experience to increase usage of our taxi industry partners’ services. We will continue to aggressively explore new business models, particularly in the pre-booked transport sector. The industries in which Cabcharge operates have always been competitive. We welcome increased competition as it is increasing the penetration of personal transport services as a proportion of the overall transport market. It is the change in service fee, far more than competition from new or existing market entrants, that has affected our FY16 results. With the conclusion of major regulatory reviews at the Federal, state and territory level we have a much stronger view on what the future will look like and have set our strategy accordingly to maximise our participation in the expanding market. We are focused on delivering for our customers. Our balance sheet is well placed to support this strategy and we aim to continue to reward our shareholders with a fully franked dividend.
For
per
sona
l use
onl
y

Directors’ Report
Page 19
DIRECTORS’ REPORT
Your Directors present their report on the Consolidated Financial Statements of the consolidated entity consisting of Cabcharge Australia Limited (Company or Cabcharge) and the entities it controls (Group) for the financial year ended 30 June 2016.
1. DIRECTORS The Directors of the Company in office at any time during or since the end of the financial year unless otherwise stated, are as follows: Russell Balding, AO Chairman & Director Andrew Skelton Director Donnald McMichael Director Richard Millen Director Stephen Stanley Director Trudy Vonhoff Director Neill Ford Deputy Chairman & Director – ceased 18 November 2015
Russell Balding, AO Chairman, Member of the Board since 6 July 2011 Special responsibilities – Member of the Audit & Risk Committee and Corporate Governance Committee Russell Balding was appointed Chairman of the Board in May 2014. Mr Balding is also the Deputy Chairman of Destination NSW and Racing NSW; a director of ComfortDelgro Cabcharge Pty Ltd, CityFleet Networks Ltd (UK) and The Trust Company (Sydney Airport) Limited. Mr Balding previously chaired the Visitor Economy Taskforce, established by the NSW Government to develop a tourism and events strategy to double overnight visitor expenditure to NSW by 2020. Russell has had a long and distinguished managerial career having held senior executive positions in a number of major organisations covering a diverse range of operational areas including transport, tourism, media and aviation all of which have required extensive government, stakeholder, community and customer interaction. Previously, Mr Balding has also served on the Boards of NSW Business Chamber Limited, ThoroughVision Pty Ltd (TVN), Tourism NSW and the Transport and Tourism Advisory Board. He was Chief Executive Officer of Sydney Airport Corporation Limited from 2006 to 2011, Managing Director of the Australian Broadcasting Corporation (ABC) from 2002 to 2006 and prior to that ABC’s Director of Funding, Finance and Support Services. Mr Balding was also the Director of Finance of the NSW Roads and Traffic Authority. He is a past State President and currently a Fellow of CPA Australia, and a member of the Australian Institute of Company Directors. Directorships of other listed public companies held at any time during the three years to 30 June 2016 – The Trust Company (Sydney Airport) Limited in its capacity as responsible entity of the Sydney Airport Trust 1.
Andrew Skelton Chief Executive Officer and Managing Director, Member of the Board since 10 December 2014 Andrew Skelton commenced as Chief Executive Officer in June 2014 and was appointed Managing Director in December 2014. Prior to this, Andrew was the Group Corporate Counsel and Company Secretary from December 2011 and Chief Operating Officer of Black Cabs Combined from 2005 to
For
per
sona
l use
onl
y

Directors’ Report
Page 20
2011. Before joining the Group in 2000, Andrew was a mergers and acquisitions lawyer at K&L Gates in Melbourne. Andrew holds an MBA, Bachelor of Law, Bachelor of Commerce and a Graduate Diploma of Applied Corporate Governance. Directorships of other listed public companies held at any time during the three years to 30 June 2016 – nil.
Donnald McMichael Non-Executive Director, Member of the Board since 25 June 1996 Special responsibilities – Member of the Corporate Governance Committee Donnald McMichael is Chief Executive Officer of Noah’s Ark Foundation and was the former Chairman of Aerial Taxi Co-Op Society Limited, and former director of Yellow Cabs (Canberra) Pty Ltd and the Fundraising Institute of Australia (ACT). Mr McMichael is a member of the Australian Institute of Management and Australian Society of Association Executives, and an Associate of the Australian Institute of Company Directors. Directorships of other listed public companies held at any time during the three years to 30 June 2016 – nil.
Richard Millen Non-Executive Director, Member of the Board since 4 June 2014 Special responsibilities – Chairman of the Audit & Risk Committee Richard Millen has extensive experience in transactions, corporate finance and accounting. Mr Millen spent over 30 years with PricewaterhouseCoopers and led its first Corporate Finance practice and subsequently the national Advisory practice of the firm. Mr Millen has a strong background in corporate responsibility, having led PricewaterhouseCoopers’ internal Corporate Responsibility agenda in Australia from 2005 to 2011, and globally from 2007 to 2010. Mr Millen is also a Director of Australia for UNHCR. Mr Millen holds a MA Hons Jurisprudence (Law) from Oxford University and is a member of the Institute of Chartered Accountants in Australia and New Zealand. Directorships of other listed public companies held at any time during the three years to 30 June 2016 – nil.
Stephen Stanley Non-Executive Director, Member of the Board since 21 August 2015 Special responsibilities – Chairman of the Corporate Governance Committee Stephen Stanley was Director of Strategy & Corporate Development at Toll Holdings for 13 years. Stephen joined Toll in its early years of growth when it was a small domestic transport company and in line with his responsibility of strategy and mergers and acquisition, Toll acquired and integrated around 100 businesses both domestically and internationally, transforming Toll from a successful domestic operator to a leading global logistics company. Prior to joining Toll, Stephen took a role with the Mayne Nickless Group in 1988. Stephen progressed in operational roles and was promoted to General Manager of a business unit and then to the CEO position of the Logistics Group in 1996. Stephen successfully re-positioned and consolidated the various business units to grow the Division under a single strategic and operational framework.
For
per
sona
l use
onl
y

Directors’ Report
Page 21
Stephen has extensive transport and logistics experience at operational and senior executive roles both domestically and internationally, with strong joint venture board experience in representing Toll on numerous boards. Stephen has a Bachelor of Business in Accounting from RMIT University and is a graduate of the Australian Institute of Company Directors. Directorships of other listed public companies held at any time during the three years to 30 June 2016 – nil.
Trudy Vonhoff Non-Executive Director, Member of the Board since 21 August 2015 Special responsibilities – Member of the Audit & Risk Committee Trudy Vonhoff is currently a director of Ruralco Holdings Limited, AMP Bank Limited and Tennis NSW Limited and she is a member of the three organisations’ Audit & Risk Committees. Trudy also chairs the Nomination and Remuneration Committee at Ruralco Holdings, the Audit and Risk Committees for AMP Bank, and the Audit and Risk Committee at Tennis NSW.. Trudy has had over 30 years experience in financial services having held executive positions with AMP and Westpac. Her executive roles included finance, risk and strategy and leading the technology and operations functions and the retail, commercial and rural banking businesses. Trudy has a Bachelor of Business from Queensland University of Technology, an MBA from University of Technology Sydney, and is a graduate of the Australian Institute of Company Directors. Directorships of other listed public companies held at any time during the three years to 30 June 2016 – Ruralco Holdings Limited.
2. EXECUTIVE TEAM
Andrew Skelton Chief Executive Officer and Managing Director Andrew Skelton commenced as Chief Executive Officer in June 2014 and was appointed Managing Director in December 2014. Prior to this, Andrew was the Group Corporate Counsel and Company Secretary from December 2011 and Chief Operating Officer of Black Cabs Combined from 2005 to 2011. Before joining the Group in 2000, Andrew was a mergers and acquisitions lawyer at K&L Gates in Melbourne. Andrew holds an MBA, Bachelor of Law, Bachelor of Commerce and a Graduate Diploma of Applied Corporate Governance.
Sheila Lines Chief Financial Officer Sheila Lines commenced as Chief Financial Officer on 13 July 2015. Sheila joined Cabcharge from BPAY where she was the Chief Financial Officer since 2013. Prior to BPAY, Sheila was the Chief Financial Officer and then Chief Executive Officer of KeyTech Limited based in Bermuda. Sheila has held several senior financial roles and has been an Independent Non-Executive Director of Butterfield Bank where she served as the Chair of the Audit Committee and Chair of the IT Committee. Sheila has a Bachelor of Laws from the University of London, is a Fellow of the Institute of Chartered Accountants in England and Wales and is a member of the Institute of Chartered Accountants in Australia and New Zealand.
For
per
sona
l use
onl
y
Directors’ Report
Page 22
Adrian Lucchese General Counsel and Company Secretary Adrian Lucchese commenced at Cabcharge on 20 October 2014. Adrian began his career with Blake Dawson Waldron (now Ashurst) in 1988 and has held a number of senior management roles including Group General Counsel and Company Secretary of George Weston Foods Limited where, amongst other things, he was responsible for many of the improvements to its competition compliance program. From August 2011 to October 2014, Adrian was Company Secretary of AMP Capital Holdings Limited where he contributed to many governance, structural and business improvement initiatives. Adrian holds Bachelor degrees in both Science and Laws from the University of Sydney and a Master of Laws from the University of Sydney.
Stuart Overell Chief Operating Officer, Taxi Services Stuart Overell commenced as Chief Operating Officer, Taxi Services in November 2014. Prior to this Stuart was Chief Operating Officer for Black Cabs Combined from December 2011, Operations Manager from January 2010 and IT Manager from 2007. Before joining the Group, Stuart was IT Manager for the multi-national manufacturing company Feltex Carpets. Stuart is an Executive Councillor for the Victorian Taxi Association, holds a Bachelor of Computing (Business Systems) from Monash University and is a graduate of the Royal Military College Duntroon.
Fred Lukabyo Chief Operating Officer Fred Lukabyo commenced as Chief Operating Officer in November 2014. From 2002 Fred was Chief Operating Officer, Taxi Services. Prior to this, Fred was responsible for Customer Operations in Australia, New Zealand and Fiji at Tyco International. Fred had previously worked in the Deluxe Red and Yellow Cabs Group as Communications Centre Manager until 1999. Fred holds an Australian Graduate School of Management (AGSM) MBA awarded jointly from the University of New South Wales and University of Sydney, a Bachelor of Business from the University of Technology, Sydney and is a Tier One qualified Insurance Broker.
John D’Arcy Head of Payments John D’Arcy commenced as Head of Payments in November 2014. From May 2007 John was Group General Manager. Prior to that John worked for Ausdata-JBA an Australian systems integrator specialising in Banking, Retail and Hospitality products. John held a variety of positions at Ausdata-JBA from Developer through to Managing Director. John also held a Diploma in Programming Technology. Sadly John passed away on Monday 21 December 2015 after many years of loyal and passionate contribution to Cabcharge. John was instrumental in building many of the platforms that put Cabcharge in a position of strength. In recent times John initiated some of the key projects that are helping transform Cabcharge today. John is greatly missed by his work friends and colleagues.
3. PRINCIPAL ACTIVITIES The Group is primarily involved in taxi related services as well as having a significant interest in the provision of route, school and bus services through its interest in an associate. There were no significant changes in the nature of the activities of the Group during the year.
For
per
sona
l use
onl
y
Directors’ Report
Page 23
4. DIVIDENDS Dividends paid or declared for payment since the end of the previous financial year are as follows:
The 2016 final dividend was declared after the end of the financial year and is payable on 31 October 2016 with a record date of 30 September 2016.
5. OPERATING AND FINANCIAL REVIEW The Operating and Financial Review of the Group for the year ended 30 June 2016 is set out on pages 2 to 18.
6. SIGNIFICANT CHANGES IN THE STATE OF AFFAIRS In the opinion of the Directors, there were no significant changes in the state of affairs of the consolidated entity during the financial year not otherwise disclosed in this report or the Consolidated Financial Statements.
7. EVENTS SUBSEQUENT TO REPORTING DATE Dividends The Directors have declared a final dividend of 10 cents per share (fully franked) scheduled to be paid on 31 October 2016. The record date to determine entitlement to dividend is 30 September 2016. Bank Facility In August 2016, the Company entered into agreements with its lending banks to extend its current finance facility term for a further two years from 1 July 2017 to 1 July 2019. The Company also reduced the finance facility limits from $200 million to $160 million given an extended period of operating significantly within our credit facility levels and recognising the commitment fee cost of unutilised lines of credit. Taxi plate licences in Victoria On 23 August 2016 Victoria State Government announced that all taxi licencing requirements will be removed effective early 2018. The Group has recognised the impairment charge to reduce the carrying amount of all taxi plate licences in Victoria to zero. Other than the matters above, there have been no events subsequent to the reporting date that would have had a material impact on the Group's financial statements as at 30 June 2016.
8. LIKELY DEVELOPMENTS The 2017 financial year is anticipated to see governments in Queensland, South Australia, Northern Territory and the Australian Capital Territory imposing price controls on non-cash taxi payments at the rate of 5% including GST with an impact on taxi service fee income in those markets. Our strategies are designed to help offset the impact of these regulatory changes by driving volume increases in fares processed through improved Cabcharge payment products, an additional distribution channel, and an increase in payments linked with bookings.
Date paid or scheduled Type
In respect of the prior year
29 October 2015 Final 10.0 12,043
In respect of the current year29 April 2016 Interim 10.0 12,043 31 October 2016 Final 10.0 12,043
Cents per share Paid or declared $000
For
per
sona
l use
onl
y

Directors’ Report
Page 24
We anticipate extending our track record of growing fleet through the continued evolution of our services and a sustained focus on Passenger outcomes. Further brand consolidation will support these efforts. Opportunities for growth should arise through a combination of contracting bureau services with other taxi networks, taxi operators choosing to expand their own fleets under the umbrella of lighter regulatory regimes across the nation, and possibly acquisition. As updated regulatory regimes pertaining to personal transport take hold around Australia, we expect a shifting in the regulatory burden on taxi networks although the details of some regulatory updates remain unclear. Overall we expect the balance of regulatory changes over the next 12 months to improve growth opportunities for taxi industry participants with some incremental levelling of the playing field in personal transport generally. In particular, the ability to train and induct Drivers to our own standards in Victoria will see a better value proposition delivered to our affiliated taxi operators and an increase in our service capabilities for Passengers.
9. ENVIRONMENTAL REGULATION The Group’s operations are not subject to any particular and significant environmental regulations under a law of the Commonwealth or of a State or Territory.
10. DIRECTORS’ INTEREST IN SHARES
The relevant interest of each Director in the share capital of the Company at the date of this report is as follows:
Director Note Direct interest shares Indirect interest shares TotalRussell Balding, AO 40,000 40,000
Donnald McMichael 1 500 15,530 16,030
Richard Millen 2 35,000 35,000
Andrew Skelton 6,861 6,861
Stephen Stanley 3 80,000 80,000
Trudy Vonhoff 10,000 10,000
187,891
1. 12,500 fully paid ordinary shares held by Gracious Investments Pty Ltd atf Donren Holdings Superannuation Fund and 3,030 CABSRU (a self funding instalment warrant issued by RBS) held by Gracious Investments Pty Ltd atf Donren Holdings Superannuation Fund.
2. 35,000 fully paid ordinary shares held by Navigator Australia Limited as custodian for an MLC Wrap Platform as nominee for the Millen Superannuation Fund.
3. 80,000 fully paid ordinary shares held by Esjay Pty Ltd atf The Stanley Family Trust.
11. REMUNERATION REPORT The Remuneration Report which is set out on pages 27 to 44 and forms part of this Directors’ Report, has been audited as required by Section 308(3C) of the Corporation Act 2001.
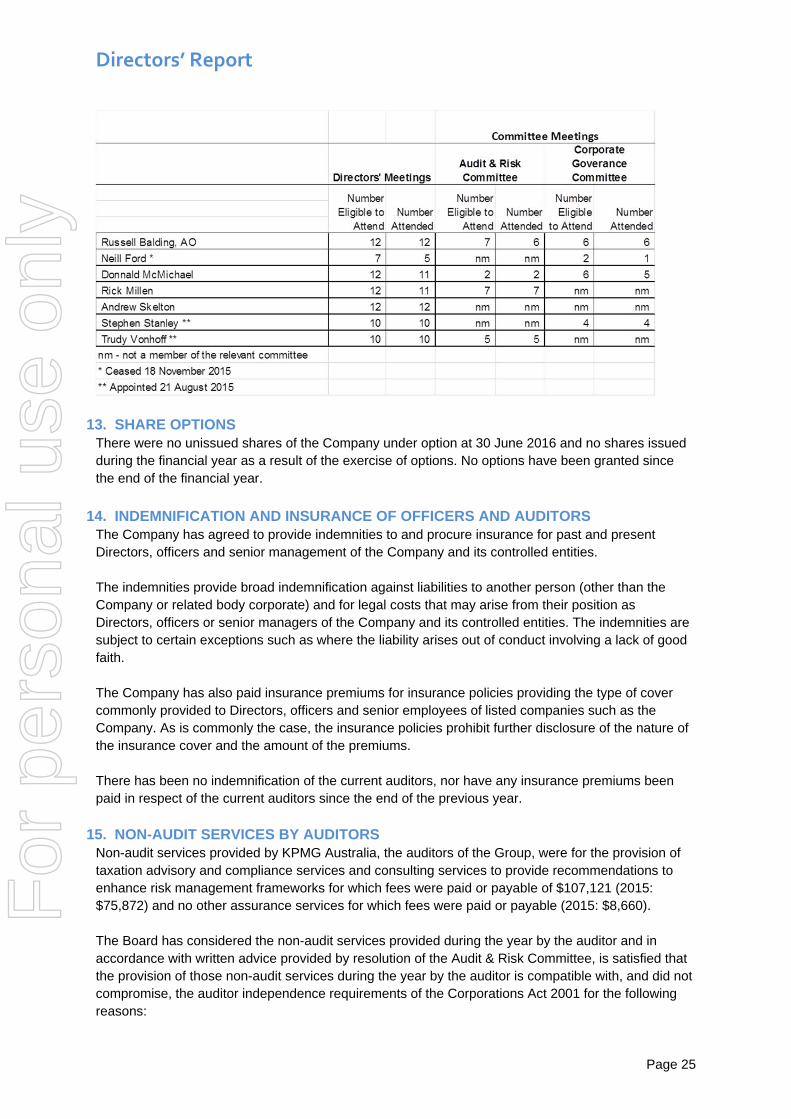
12. DIRECTORS’ MEETINGS The number of Directors’ Meetings which Directors were eligible to attend (including Committee Meetings) and the number attended by each Director during the reporting period were: F
or p
erso
nal u
se o
nly
Directors’ Report
Page 25
13. SHARE OPTIONS There were no unissued shares of the Company under option at 30 June 2016 and no shares issued during the financial year as a result of the exercise of options. No options have been granted since the end of the financial year.
14. INDEMNIFICATION AND INSURANCE OF OFFICERS AND AUDITORS
The Company has agreed to provide indemnities to and procure insurance for past and present Directors, officers and senior management of the Company and its controlled entities. The indemnities provide broad indemnification against liabilities to another person (other than the Company or related body corporate) and for legal costs that may arise from their position as Directors, officers or senior managers of the Company and its controlled entities. The indemnities are subject to certain exceptions such as where the liability arises out of conduct involving a lack of good faith. The Company has also paid insurance premiums for insurance policies providing the type of cover commonly provided to Directors, officers and senior employees of listed companies such as the Company. As is commonly the case, the insurance policies prohibit further disclosure of the nature of the insurance cover and the amount of the premiums. There has been no indemnification of the current auditors, nor have any insurance premiums been paid in respect of the current auditors since the end of the previous year.
15. NON-AUDIT SERVICES BY AUDITORS Non-audit services provided by KPMG Australia, the auditors of the Group, were for the provision of taxation advisory and compliance services and consulting services to provide recommendations to enhance risk management frameworks for which fees were paid or payable of $107,121 (2015: $75,872) and no other assurance services for which fees were paid or payable (2015: $8,660). The Board has considered the non-audit services provided during the year by the auditor and in accordance with written advice provided by resolution of the Audit & Risk Committee, is satisfied that the provision of those non-audit services during the year by the auditor is compatible with, and did not compromise, the auditor independence requirements of the Corporations Act 2001 for the following reasons:
For
per
sona
l use
onl
y
Directors’ Report
Page 26
all non-audit services were subject to the corporate governance procedures adopted by the Company and have been reviewed by the Audit & Risk Committee to ensure they do not impact the integrity and objectivity of the auditor; and
the non-audit services provided do not undermine the general principles relating to auditor independence as set out in APES 110 Code of Ethics for Professional Accountants, as they did not involve reviewing or auditing the auditor’s own work, acting in a management or decision making capacity for the Company, acting as an advocate for the Company or jointly sharing risks and rewards.
Details of the amounts paid to the auditor of the Group, KPMG Australia, and its related practices for audit and non-audit services provided during the year are set out in note 26 of the Consolidated Financial Statements.
16. PROCEEDING ON BEHALF OF THE COMPANY No person has applied to the court under section 237 of the Corporation Act 2001 for leave to bring proceedings on behalf of the Company, or to intervene in any proceedings to which the Company is a party, for the purpose of taking responsibility on behalf of the Company for all or part of those proceedings. No proceedings have been brought or intervened in on behalf of the Company with leave of a court under section 237 of the Corporation Act 2001.
17. LEAD AUDITOR’S INDEPENDENCE DECLARATION
The lead auditor’s independence declaration is set out on page 45 and forms part of the Directors' Report for the financial year ended 30 June 2016.
18. ROUNDING OFF Cabcharge is a company of the kind referred to in ASIC Corporation Instrument 2016/191 (Rounding in Financial/Directors’ Reports) and in accordance with that Instrument, amounts in the Consolidated Financial Statements and the Directors’ Report have been rounded off to the nearest thousand dollars, unless otherwise stated. This Directors’ Report has been signed in accordance with a resolution of the Directors
Russell Balding, AO Chairman
Andrew Skelton Managing Director Sydney 26 August 2016
For
per
sona
l use
onl
y

Remuneration Report
Page 27
Directors' report - Remuneration report (Unaudited) Letter from the Chairman of the Corporate Governance Committee Dear Shareholders On behalf of the Board, we are pleased to present our Remuneration Report for the year ended 30 June 2016 (FY16). For the Corporate Governance Committee, FY16 was a year for continuing the progress that Cabcharge has made in governance and remuneration in its pursuit of best practice governance. From an operational business perspective, the Company is undergoing a transformational process as it navigates the challenges of regulatory change, increased competition and disruptive technologies. Throughout this period, the role of the Corporate Governance Committee has been to critically evaluate the governance and remuneration structures and processes in place at Cabcharge to ensure that they align, support and encourage the business strategy and enhance the culture for success within our business. Cabcharge’s remuneration framework is designed to align executive interests with long-term shareholder value, and reward our senior people for individual and corporate performance against a range of financial and strategic achievements The development of a robust remuneration framework that is responsive to changes in the business environment and market expectations is a continuous process. Accordingly, as well as delivering on the changes to the Company’s remuneration structure which were noted in last year’s Remuneration Report, the Corporate Governance Committee also oversaw a number of additional improvements in FY16 . Key highlights in relation to remuneration in FY16 include the: - External benchmarking of the CEO remuneration pay and structure to similarly sized Australian based listed entities.
The benchmark resulted in no adjustment for the fixed pay element for FY16 and an increase in short term and long term at risk performance pay.
- Review of short-term incentive (STI) performance measures and weightings for the CEO and KMP to reflect a greater weighting to financial performance and alignment to the current strategic priorities of the Company, including greater use of transparent, group-wide performance measures for all senior executives;
- Review of the long term incentive (LTI) performance measure and structure resulting in an inclusion of a return on equity performance measure for assessing senior executives’ long-term incentive awards, designed to align executive and shareholder interests and enhance management’s focus on profitability and capital efficiency
- Review and appropriate amendment of the Board and Corporate Governance Charters specifically in reference to remuneration and nomination responsibility;
- Review of the NED fees which resolved in no increase in FY16; and
- Introduction of a minimum shareholding requirement for non-executive directors compared to fee value to create further alignment with our shareholders by requiring non-executive directors to have meaningful shareholdings in the Company.
The Corporate Governance Committee considers that progress has been made during FY16 and is committed to continuing its focus on Cabcharge’s remuneration framework to be responsive, robust and reflective of current market practices and expectations. The Committee anticipates making a number of additional changes to the remuneration framework, in the financial year ending 30 June 2017 (FY17). Details regarding anticipated changes for FY17 are set out on page 29 of this Remuneration Report. Yours faithfully
Stephen Stanley Chairman of the Corporate Governance Committee
For
per
sona
l use
onl
y

Remuneration Report
Page 28
Cabcharge Remuneration Report for the financial year ending 30 June 2016
Contents
1. Overview
A. Who is covered by this report
B. Realised remuneration
C. Future remuneration strategy - FY17 and beyond
2. Remuneration governance
3. Senior executive remuneration arrangements
A. Remuneration principles and link to Company strategy
B. Remuneration structure
C. Detail of remuneration elements and incentive plans
D. Executive contracts
4. Senior executive remuneration outcomes for FY16
A. STI performance and outcomes
B. LTI performance and outcomes
C. Total executive remuneration in FY16
D. LTI awards held by executives
5. Non-executive director fee arrangements
6. Additional disclosures relating to share capital
7. Transactions with key management personnel and their related parties
This Remuneration Report for the year ended 30 June 2016 outlines the remuneration arrangements of the Company in
accordance with the requirements of the Corporations Act 2001 (the Act) and its regulations. Accordingly, the information in
sections 1 to 7 has been audited as required by section 308(3C) of the Act.
For
per
sona
l use
onl
y
Remuneration Report
Page 29
1. Overview
1A. Who is covered by this report
This report covers all Key Management Personnel (KMP) of Cabcharge Australia. The KMP have authority and responsibility
for planning, directing and controlling the activities of the Company, either directly or indirectly, and include the senior
executives set out in the table below, and all non-executive directors set out in the table 8.
Table 1: KMP included in this report
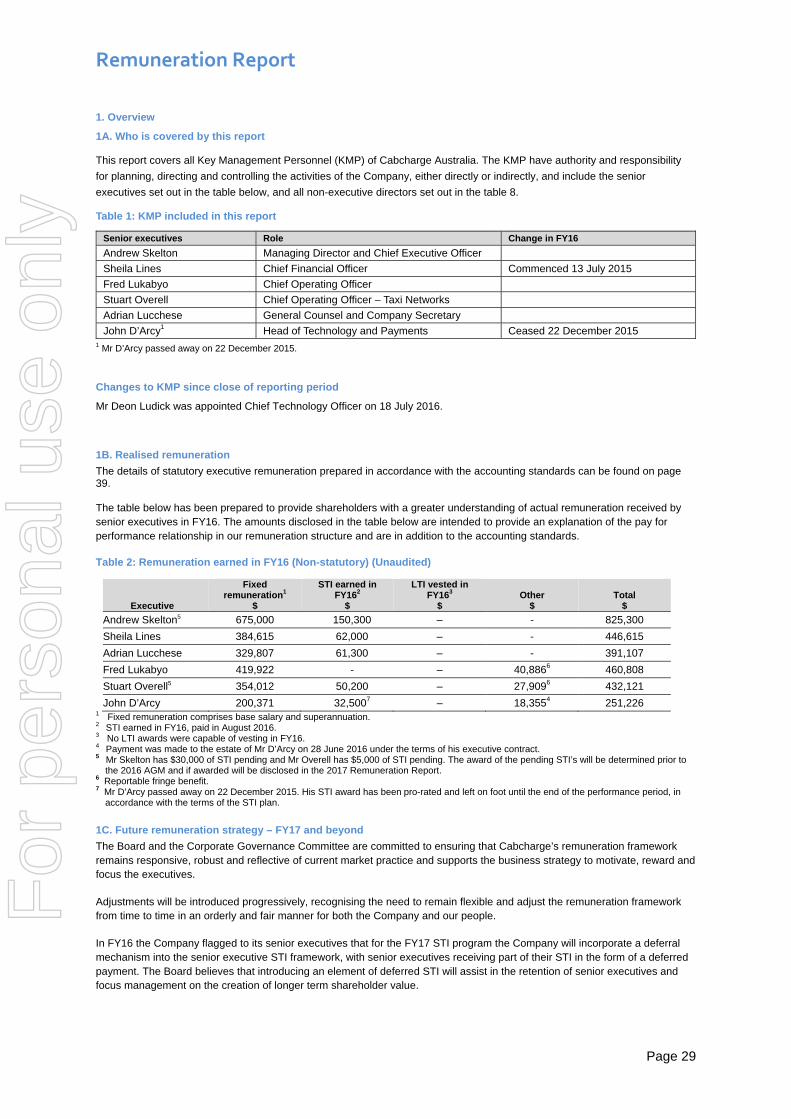
Senior executives Role Change in FY16
Andrew Skelton Managing Director and Chief Executive Officer
Sheila Lines Chief Financial Officer Commenced 13 July 2015
Fred Lukabyo Chief Operating Officer
Stuart Overell Chief Operating Officer – Taxi Networks
Adrian Lucchese General Counsel and Company Secretary
John D’Arcy1 Head of Technology and Payments Ceased 22 December 2015 1 Mr D’Arcy passed away on 22 December 2015.
Changes to KMP since close of reporting period
Mr Deon Ludick was appointed Chief Technology Officer on 18 July 2016.
1B. Realised remuneration
The details of statutory executive remuneration prepared in accordance with the accounting standards can be found on page 39. The table below has been prepared to provide shareholders with a greater understanding of actual remuneration received by senior executives in FY16. The amounts disclosed in the table below are intended to provide an explanation of the pay for performance relationship in our remuneration structure and are in addition to the accounting standards. Table 2: Remuneration earned in FY16 (Non-statutory) (Unaudited)
Executive
Fixed remuneration1
$
STI earned in FY162
$
LTI vested in FY163
$ Other
$ Total
$
Andrew Skelton5 675,000 150,300 – - 825,300
Sheila Lines 384,615 62,000 – - 446,615
Adrian Lucchese 329,807 61,300 – - 391,107
Fred Lukabyo 419,922 - – 40,8866 460,808
Stuart Overell5 354,012 50,200 – 27,9096 432,121
John D’Arcy 200,371 32,5007 – 18,3554 251,226 1 Fixed remuneration comprises base salary and superannuation. 2 STI earned in FY16, paid in August 2016. 3 No LTI awards were capable of vesting in FY16. 4 Payment was made to the estate of Mr D’Arcy on 28 June 2016 under the terms of his executive contract. 5 Mr Skelton has $30,000 of STI pending and Mr Overell has $5,000 of STI pending. The award of the pending STI’s will be determined prior to
the 2016 AGM and if awarded will be disclosed in the 2017 Remuneration Report. 6 Reportable fringe benefit. 7 Mr D’Arcy passed away on 22 December 2015. His STI award has been pro-rated and left on foot until the end of the performance period, in
accordance with the terms of the STI plan.
1C. Future remuneration strategy – FY17 and beyond
The Board and the Corporate Governance Committee are committed to ensuring that Cabcharge’s remuneration framework remains responsive, robust and reflective of current market practice and supports the business strategy to motivate, reward and focus the executives.
Adjustments will be introduced progressively, recognising the need to remain flexible and adjust the remuneration framework from time to time in an orderly and fair manner for both the Company and our people.
In FY16 the Company flagged to its senior executives that for the FY17 STI program the Company will incorporate a deferral mechanism into the senior executive STI framework, with senior executives receiving part of their STI in the form of a deferred payment. The Board believes that introducing an element of deferred STI will assist in the retention of senior executives and focus management on the creation of longer term shareholder value.
For
per
sona
l use
onl
y

Remuneration Report
Page 30
2. Remuneration governance
This section describes the roles of the Board, Corporate Governance Committee, management and external advisors when making remuneration decisions, and sets out an overview of the principles and policies that underpin the Company’s remuneration framework.
The following diagram illustrates the process for how remuneration decisions are made:
Use of remuneration consultants
In FY16, the CGC appointed Guerdon Associates as adviser to assist with the implementation of the return on equity (ROE) performance measure used in the Company’s LTI plan and benchmarking for CEO remuneration. Guerdon Associates were engaged by and reported to the CGC. Guerdon Associates did not provide a remuneration recommendation as defined by the Corporations Act in FY16.
Board
‐ Ensures remuneration is fair and competitive, and supports the Company's strategic and operational goals.
‐ Approves remuneration structures after consideration of recommendations from the CGC
‐ Approves remuneration policy for NEDs, CEO and other senior executives after consideration of recommendations from the CGC
Corporate Governance Committee (CGC)
‐ Comprises at least 3 members appointed by the Board
‐Must have an independent chair and a majority of independent directors
‐ Proposes remuneration for NEDs and CEO to the Board
‐ Undertakes an annual remuneration review
‐ Sets performance conditions
‐ Cabcharge CGC met 6 times in FY16
For more detail on Cabcharge charters and policies, see:
https://www.cabcharge.com.au/corporategovernance/default.aspx
External remuneration consultants and advisors
‐ Engaged and appointed by the Board or CGC
‐ Advises the CGC and management to ensure that the Company is fully informed when making decisions
‐Mandatory disclosure requirements apply to use of remuneration consultants under Corporations Act 2001
Management
‐ CEO proposes remuneration for direct reports to the CGC, including individual performance outcome recommendations for the financial year
‐ CEO not present when his remuneration is discussed
For
per
sona
l use
onl
y
Remuneration Report
Page 31
3. Executive remuneration arrangements
3A. Remuneration principles and link to Company strategy
The Company has adopted the following principles to guide its remuneration strategy to:
• align to the business strategy to encourage opportunities to be pursued and executives rewarded accordingly for the
creation of long-term shareholder value;
• be supported by a governance framework;
• provide that senior executive and NED remuneration is balanced and market competitive in order to recruit, motivate,
reward and retain skilled senior executives and directors;
• align the interests of senior executives with the long-term interests of the Company and its shareholders with the use of
performance-based remuneration;
• set short and long-term incentive performance hurdles that are challenging and linked to the creation of sustainable
shareholder returns; and
• ensure any termination benefits are justified and appropriate.
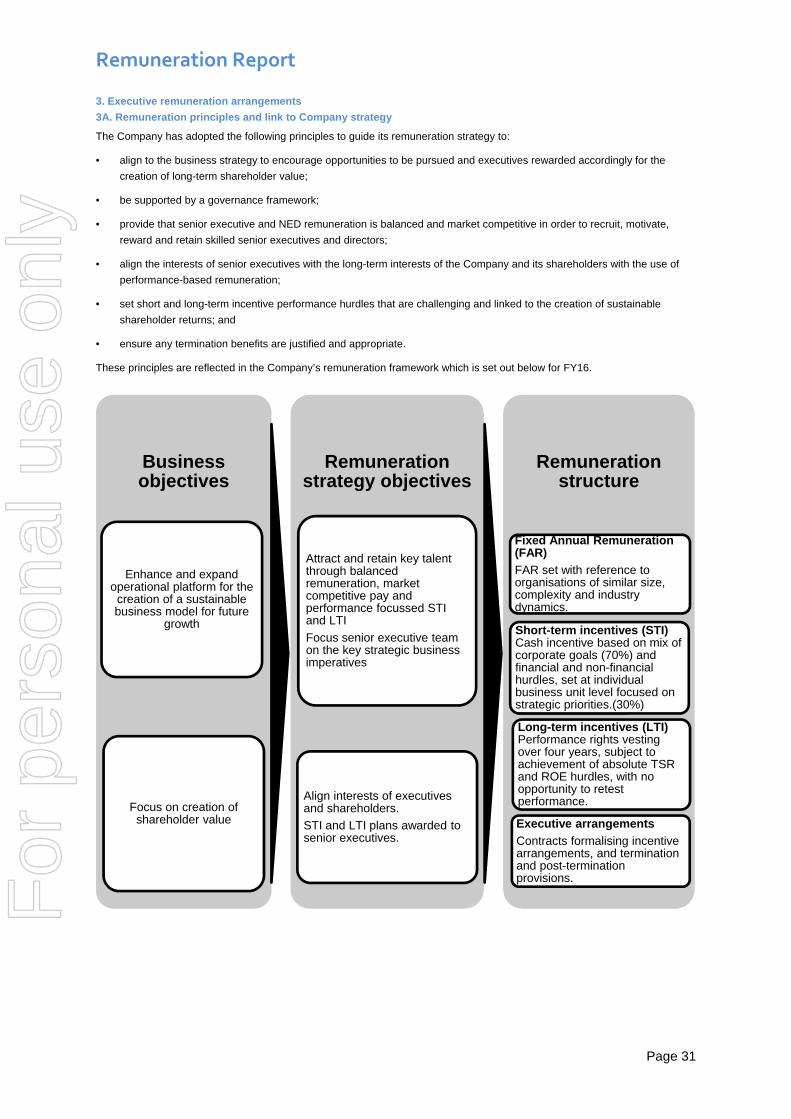
These principles are reflected in the Company’s remuneration framework which is set out below for FY16.
Business objectives
Enhance and expand operational platform for the
creation of a sustainable business model for future
growth
Focus on creation of shareholder value
Remuneration strategy objectives
Attract and retain key talent through balanced remuneration, market competitive pay and performance focussed STI and LTI
Focus senior executive team on the key strategic business imperatives
Align interests of executives and shareholders.
STI and LTI plans awarded to senior executives.
Remuneration structure
Executive arrangements
Contracts formalising incentive arrangements, and termination and post-termination provisions.
Fixed Annual Remuneration (FAR)
FAR set with reference to organisations of similar size, complexity and industry dynamics.
Short-term incentives (STI)Cash incentive based on mix of corporate goals (70%) and financial and non-financial hurdles, set at individual business unit level focused on strategic priorities.(30%)
Long-term incentives (LTI) Performance rights vesting over four years, subject to achievement of absolute TSR and ROE hurdles, with no opportunity to retest performance.
For
per
sona
l use
onl
y

Remuneration Report
Page 32
3B. Remuneration structure
The Company aims to reward senior executives with a level and mix of remuneration appropriate to their position,
responsibilities and performance. The overall level of remuneration for each senior executive is intended to be market
competitive for the purposes of recruiting and retaining skilled executives.
In FY16, the executive remuneration framework consisted of fixed remuneration (FAR) and “at risk” remuneration (STI and LTI),
with the mix of remuneration intended to reflect the strategic direction and current business strategy of the Company.
The Board and the CGC regularly review the structure and mix of remuneration at the Company, with a view to making
adjustments where it is appropriate to support the strategic objectives of the business. This has driven the introduction of STI
and LTI Plans that allow for setting the “at risk” remuneration components for the CEO and senior executives. The Board and
CGC are committed to continuing this process and intend to keep the matter under review, with the intention of making further
changes to the remuneration mix in an orderly and fair manner over time.
In FY16, remuneration benchmarking was undertaken for the CEO with reference to selected Australian companies of a
comparable size.
The following graphs summarise the CEO and other senior executives’ remuneration mix for FY16.
* Average for senior executives who have transitioned to revised executive contracts “STI” in the diagrams above corresponds to the relevant senior executive’s maximum STI opportunity, not their STI outcomes for FY16. “LTI” is based on the maximum LTI opportunity granted to senior executives in respect of FY16.
3C. Detail of remuneration elements and incentive plans
Fixed Annual Remuneration (FAR)
Details regarding FAR are set out below.
What is FAR?
FAR is comprised of salary and other benefits provided to a senior executive on an ongoing basis, such as superannuation contributions.
How is FAR determined?
FAR is reviewed on an annual basis and executive contracts do not include any guaranteed FAR increases.
When reviewing FAR for senior executives a number of factors are considered, including the individuals’ skills and experience relevant to their roles, and internal and external factors.
The Company’s policy is to regularly review the remuneration structure and to competitively position FAR with reference to Australian listed companies of a similar to that of Cabcharge.
52.9% 23.5% 23.5%
CEO
FAR STI LTI
Fixed At Risk
65.6% 17.2% 17.2%
Other executives*
FAR STI LTI
Fixed At Risk
For
per
sona
l use
onl
y
Remuneration Report
Page 33
STI
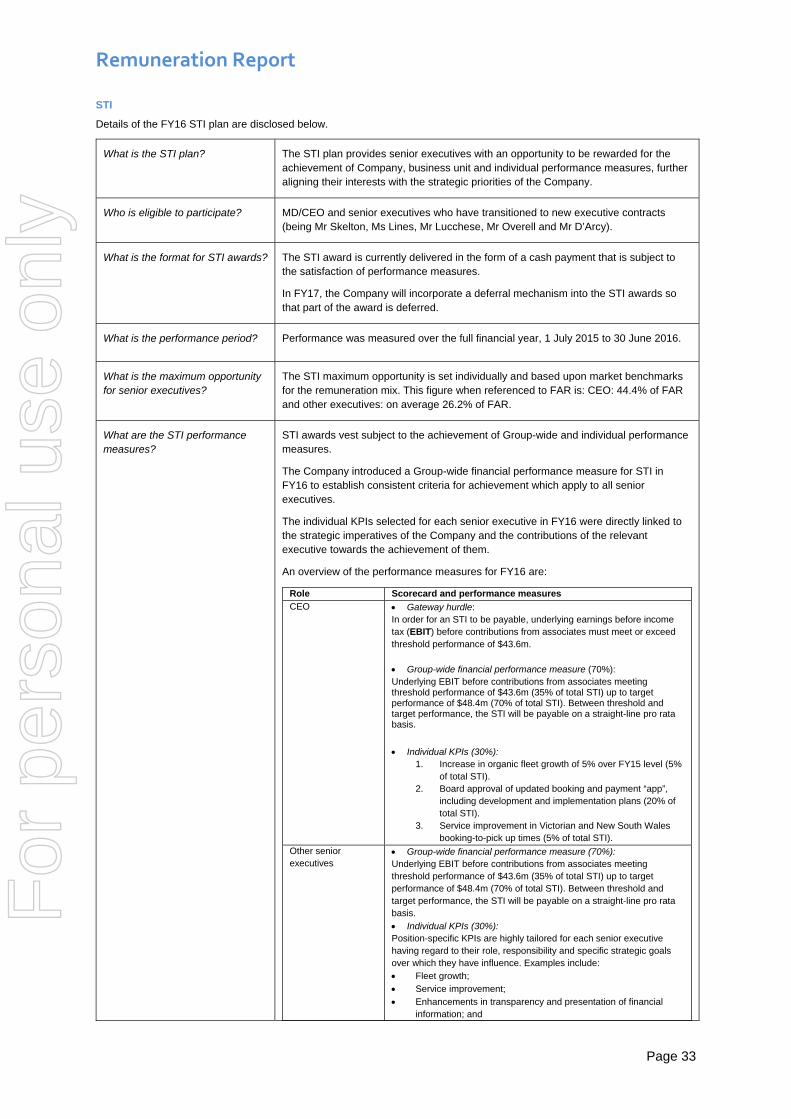
Details of the FY16 STI plan are disclosed below.
What is the STI plan? The STI plan provides senior executives with an opportunity to be rewarded for the achievement of Company, business unit and individual performance measures, further aligning their interests with the strategic priorities of the Company.
Who is eligible to participate? MD/CEO and senior executives who have transitioned to new executive contracts (being Mr Skelton, Ms Lines, Mr Lucchese, Mr Overell and Mr D’Arcy).
What is the format for STI awards? The STI award is currently delivered in the form of a cash payment that is subject to the satisfaction of performance measures.
In FY17, the Company will incorporate a deferral mechanism into the STI awards so that part of the award is deferred.
What is the performance period? Performance was measured over the full financial year, 1 July 2015 to 30 June 2016.
What is the maximum opportunity for senior executives?
The STI maximum opportunity is set individually and based upon market benchmarks for the remuneration mix. This figure when referenced to FAR is: CEO: 44.4% of FAR and other executives: on average 26.2% of FAR.
What are the STI performance measures?
STI awards vest subject to the achievement of Group-wide and individual performance measures.
The Company introduced a Group-wide financial performance measure for STI in FY16 to establish consistent criteria for achievement which apply to all senior executives.
The individual KPIs selected for each senior executive in FY16 were directly linked to the strategic imperatives of the Company and the contributions of the relevant executive towards the achievement of them.
An overview of the performance measures for FY16 are:
Role Scorecard and performance measures CEO Gateway hurdle:
In order for an STI to be payable, underlying earnings before income tax (EBIT) before contributions from associates must meet or exceed threshold performance of $43.6m. Group-wide financial performance measure (70%): Underlying EBIT before contributions from associates meeting threshold performance of $43.6m (35% of total STI) up to target performance of $48.4m (70% of total STI). Between threshold and target performance, the STI will be payable on a straight-line pro rata basis.
Individual KPIs (30%): 1. Increase in organic fleet growth of 5% over FY15 level (5%
of total STI). 2. Board approval of updated booking and payment “app”,
including development and implementation plans (20% of total STI).
3. Service improvement in Victorian and New South Wales booking-to-pick up times (5% of total STI).
Other senior executives
Group-wide financial performance measure (70%): Underlying EBIT before contributions from associates meeting threshold performance of $43.6m (35% of total STI) up to target performance of $48.4m (70% of total STI). Between threshold and target performance, the STI will be payable on a straight-line pro rata basis. Individual KPIs (30%): Position-specific KPIs are highly tailored for each senior executive having regard to their role, responsibility and specific strategic goals over which they have influence. Examples include: Fleet growth; Service improvement; Enhancements in transparency and presentation of financial
information; and
For
per
sona
l use
onl
y

Remuneration Report
Page 34
Implement and maintain an effective framework to support the roll-out of FAREWAYplus.
Details regarding the STI outcomes for FY16, based on achievement of the performance measures outlined above, are set out in section 4 of this Remuneration Report.
How is performance tested? On an annual basis after the end of the performance period, the Corporate Governance Committee considers the CEO’s performance against the performance measures set for the year and provides a recommendation of the STI to be paid (if any) to the Board for approval. The Board may approve, amend or reject the recommendation.
During that time, the CEO considers each senior executive’s performance against the performance measures set for the year and, in consultation with the Corporate Governance Committee, determines the STI to be paid (if any) to each senior executive.
What happens on a change of control or other significant events?
If a change of control occurs before the end of the performance period, the Board will determine how STI awards will be dealt with. If a change of control occurs before the Board makes a determination, a pro rata amount of the STI award based on the proportion of the performance period that has elapsed at the time of the change of control will be paid.
The Board has the discretion to vary the terms of STI awards so that senior executives are not unfairly advantaged (or disadvantaged) by factors outside their control. Any variations will be disclosed and explained in the Remuneration Report.
Does the plan provide for clawback?
Cabcharge has a clawback mechanism in place, which allows for the repayment of STI awards in cases involving fraud, dishonesty, breach of obligations (including a material misstatement of financial information), or any other omissions that result in an STI outcome The Board may use its discretion to ensure that no unfair benefit is obtained, subject to applicable laws.
What happens on termination of employment?
Where employment ends prior to the end of the performance period by reason of resignation, fraudulent or dishonest conduct, or termination for cause (including gross misconduct), any entitlement to the STI award will be forfeited at termination of employment.
Where employment ends for any other reason, a pro-rata portion of the STI award will remain on foot and will be tested at the end of the original performance period.
The Board retains the discretion to vary the treatment set out above based on the specific circumstances surrounding the termination of employment.
LTI
Details of the FY16 LTI plan are disclosed below.
What is the LTI Plan? The LTI plan is offered to senior executives as a performance incentive, providing them with an opportunity to share in the long-term growth of Cabcharge and enhancing their alignment with the long-term interests of the Company’s shareholders.
Who is eligible to participate? LTI awards are made to the CEO and senior executives who are able to have a positive impact on the Company's performance against the relevant long-term performance measures.
In FY16, the Company offered LTI awards to the CEO and 4 other senior executives (being Ms Lines, Mr Lucchese, Mr Overell and Mr D’Arcy).
What is the format for LTI awards? LTI awards are delivered in the form of rights which are granted to senior executives for nil consideration.
LTI awards are granted annually and are subject to a four-year performance period.
Rights will vest at the end of the performance period, subject to the satisfaction of the performance measures set out below. There is no retesting of performance.
For
per
sona
l use
onl
y

Remuneration Report
Page 35
On vesting, each right converts into one ordinary share (or if determined by the Board into the equivalent cash value). Any rights which do not vest immediately lapse.
What is the performance period? The performance period for the FY16 LTI commenced on 1 July 2015 and will end on 30 June 2019.
Subject to the satisfaction of relevant performance measures, the FY16 award under the plan will vest following testing of the performance measures, which is anticipated to occur after the FY2019 full year results announcement in or around September 2019.
What is the maximum opportunity
for senior executives?
The maximum LTI opportunity is set individually and based upon market benchmarks for the remuneration mix. This figure when compared to FAR is: CEO: 44.4% of FAR and other executives: on average 26.2% of FAR.
The number of rights granted to each senior executive is determined by dividing their
maximum LTI opportunity by the face value of Cabcharge shares at the time of award
(determined using the 5-day volume weighted average price immediately preceding
the performance period). No discount is made for dividends foregone nor for
performance or other considerations.
What are the LTI performance
measures?
The FY16 award is split into two tranches, each subject to separate performance
measures which are independent and tested separately at the end of the performance
period:
Tranche one (67% of the total LTI award) will vest subject to the achievement of
an absolute total shareholder return target by the Company (TSR Hurdle); and
Tranche two (33% of the total LTI award) will vest subject to the achievement of a
return on equity target by the Company (ROE Hurdle).
These measures are considered challenging and were chosen as they reflect the
Company's focus on increasing shareholder value, profitability and capital efficiency.
Further details regarding the performance measures applicable to the FY16 award are
set out below.
Tranche one: TSR Hurdle - 67% of the FY16 award
The TSR Hurdle measures the change in the Company’s share price, including dividends paid, over the performance period. The absolute TSR performance target is set at a level above average historical long-term market returns to ensure vesting will occur only if our shareholders experience superior returns.
Absolute TSR was selected as an LTI performance measure for the following reasons:
TSR ensures any reward for senior executives is possible only if our shareholders
experience superior returns;
The measure minimises the effects of market cycles that might create large
fluctuations in peer group company performance when a relative TSR measure is
used.
TSR performance will be monitored by an independent external adviser at 30 June
each year.
At the end of the performance period, vesting of tranche one will be determined by the
Board in accordance with the following schedule.
Absolute TSR (67% of the total grant value)
Performance outcome % of award that will vest
Less than 9% return p.a. 0%
Equal to 9% return p.a. 30%
For
per
sona
l use
onl
y

Remuneration Report
Page 36
Between 9% return p.a. and 11% return p.a. Straight-line vesting between 30% and 100% of the award
11% return p.a. or more 100%
Tranche two: ROE Hurdle – 33% of the FY16 award
Tranche two will vest subject to the achievement of a ROE multiple of the Company’s
weighted average cost of capital (WACC) over the performance period. ROE is based
on statutory net profit after tax divided by average equity. WACC will be determined by
an independent external adviser and the calculation will be retrospectively disclosed in
the Remuneration Report following the end of each performance period. The ROE
Hurdle requires minimum threshold performance of ROE being at least 1.4 times
WACC before any vesting will occur.
ROE was selected as it is meaningful to participants and shareholders, it aligns
executive interests with the shareholder experience and will enhance management’s
focus on profitability and capital efficiency which is important for the Company in this
next stage of its growth.
At the end of the performance period, vesting of tranche two will be determined by the
Board in accordance with the following schedule.
ROE (33% of the total grant value)
Performance outcome % of award that will vest
Below ROE of 1.4 times WACC 0%
ROE of 1.4 times WACC 30%
ROE between 1.4 times and 1.75 times WACC
Straight-line vesting between 30% and 100% of the award
ROE of 1.75 times WACC or higher 100%
What happens on a change of
control or other significant events?
Where a change of control event occurs, the Board has discretion to determine the
proportion of LTI awards to vest and may have regard to the executive’s tenure, the
proportion of the performance period that has elapsed, the extent to which the
performance conditions have been satisfied at the time of the change of control and
the interests of the Company’s shareholders.
If a change of control occurs before the Board exercises its discretion, a pro-rata
number of unvested LTI awards will vest based on the extent which the performance
conditions are satisfied (or are estimated to have been satisfied) and the proportion of
the performance period that has elapsed at the time of the change of control.
The Board may adjust the terms of LTI awards in exceptional situations where participants may be unfairly advantaged (or disadvantaged) by external factors outside of their control. The Board in all circumstances will ensure any variation takes into account the purpose of the LTI plan and achievement against the relevant performance conditions up until the relevant time. Any variations will be disclosed and explained in the Remuneration Report.
What happens on termination of
employment?
Where employment ends prior to the end of the performance period due to resignation, termination for cause or poor performance, unvested LTI awards will lapse.
Where the employment ends for any other reason, unvested LTI awards will continue on-foot and be tested at the end of the original performance period against the relevant
For
per
sona
l use
onl
y

Remuneration Report
Page 37
performance conditions. However, the Board has an overriding discretion to apply another treatment if it deems it appropriate.
Does the plan provide for
clawback
Cabcharge has a clawback mechanism in place, which allows for the lapsing and/or
clawback of LTI awards. In cases involving fraud, dishonesty, breach of obligations
(including a material misstatement of financial information), or any other act or
omission that result in an LTI outcome. The Board may use its discretion to ensure that
no unfair benefit is obtained by a participant, subject to applicable laws.
3D. Executive contracts
Remuneration arrangements for senior executives are formalised in employment agreements. During FY15, the Company undertook a process of standardising and implementing contemporary executive service agreements, terms and conditions.
Table 3: Executive contractual terms
Executive Contract term Notice Period
CEO Ongoing Executive: 12 months Company: 12 months
Other executives Ongoing Executive: 6 months Company: 6 months
4. Executive remuneration outcomes for FY16
The external benchmarking of the CEO remuneration pay and structure to similarly sized Australian based listed entities resulted in no adjustment to the fixed pay element for FY16 and an increase in the at risk (short term and long term) remuneration (representing increases of 4.5% and 11.4% respectively of total potential remuneration).
For FY16 there was no external benchmarking conducted for the KMP with no or minimal changes to their fixed or at risk remuneration.
4A. STI performance and outcomes
As outlined in section 3B above, 70% of the CEO and other executive’s STI was subject to achievement of financial
performance with payment outcome on a pro-rata basis above a threshold hurdle. Upon reaching the financial hurdle of an
underlying EBIT of $43.6m the individual STI strategic criteria are then available to be assessed for achievement.
Performance for FY16 against the individual senior executive STI criteria was assessed by the CEO with recommendations
presented to the Corporate Governance Committee (CGC). The CGC also assessed the performance of the CEO with
reference to the STI criteria and made recommendations to the Board. The Board considered the material provided, including
the CGC recommendations and the financial audited year-end results and determined that the reported underlying EBIT had
reached the financial hurdle.
As noted in the OFR, the Statutory EBIT was $27.1m and the reported underlying EBIT for FY16 at $44.7m. This underlying
EBIT excludes significant items, inclusive of non-cash impairments, property gains on sale of Riley Street, gain on sale of
shares, separation costs and accelerated amortisation on licence plates.
The Board noted that in its review and deliberations that the significant items had impacted the statutory EBIT, and used its
discretion when setting the underlying EBIT figure in respect to the STI determination. It was determined that the financial
hurdle applicable for the FY16 STI calculation’s was $43.6m which is slightly below the above reported underlying EBIT.
Consequently, the strategic criteria were then available for achievement. The Board was satisfied that the recommendations
received were delivered and the applicable value payable. The Board wishes to note that it also utilised its discretion to reserve
50% of the amount attributable to the deliverable in the “app” development for the CEO and the COO. Once the full intent of
the deliverable is achieved, payment of the remaining 50% will be made.
Specifically, in respect of the CEO STI Board approved payment:
Financial Target Payable 35% Target 70%
Fleet Increase 2.6% Target 5%
For
per
sona
l use
onl
y

Remuneration Report
Page 38
“App” development 10% Target 20% (50% of Target reserved)
Service improvement 2.5% Target 5%
For the other executive refer to Table 4 for the respective percentages and values payable as approved by the Board.
Table 4: FY16 STI award outcomes
The individual STI outcomes for each senior executive are detailed in the table below.
Senior executive1 Maximum FY16 STI
opportunity2 FY16 STI paid % of maximum STI
opportunity achieved % of maximum STI
opportunity forfeited
Mr Andrew Skelton3 $300,000 150,300 50.1 49.9
Ms Sheila Lines $100,000 62,000 62.0 38.0
Mr Adrian Lucchese $100,000 61,300 61.3 38.7
Mr Stuart Overell3 $100,000 50,200 50.2 49.8
Mr John D’Arcy4 $100,000 32,500 32.5 67.5
1 Mr Lukabyo did not participate in the FY16 STI plan. 2 The minimum FY16 STI value is nil. 3 Mr Skelton has $30,000 of STI pending and Mr Overell has $5000 of STI pending. The award of the pending STI’s will be determined prior to
the 2016 AGM and if awarded will be disclosed in the 2017 Remuneration Report.
4 Mr D’Arcy passed away on 22 December 2015. His STI award has been pro-rated and left on foot until the end of the performance period, in accordance with the terms of the STI plan.
4B. LTI performance and outcomes
The LTI plan has been in operation since FY15 and the first awards granted under the LTI Plan are due for assessment in or
around September 2018. The current performance of the Company for FY16 is described in table 5 below.
Snapshot of Company performance
Table 5: Performance outcomes for the last five years
FY16 FY15 FY14 FY13 FY12
Profit after tax ($m) 25.6 46.5 56.1 60.6 60.0
EBIT before contributions from Associates 27.1 52.2 61.2 66.9 67.3
Dividends paid ($m) 24.1 24.1 32.5 43.4 44.6
Closing share price at 30 June1 3.19 3.66 4.04 4.03 5.00
Annual turnover2 through Cabcharge Payment System ($m)
1,156 1,194 1,119 1,058 1,051 1 Opening share price in FY12 was $5.15.
2 Turnover through Cabcharge payment system comprises total taxi fare processed and the service fee.
The Board has the discretion to make payment to senior executives in lieu of notice.
Executive contracts do not include any guaranteed FAR increases. The treatment of STI and LTI awards on cessation of
employment is detailed in the STI and LTI plan tables in section 3C above.
For
per
sona
l use
onl
y
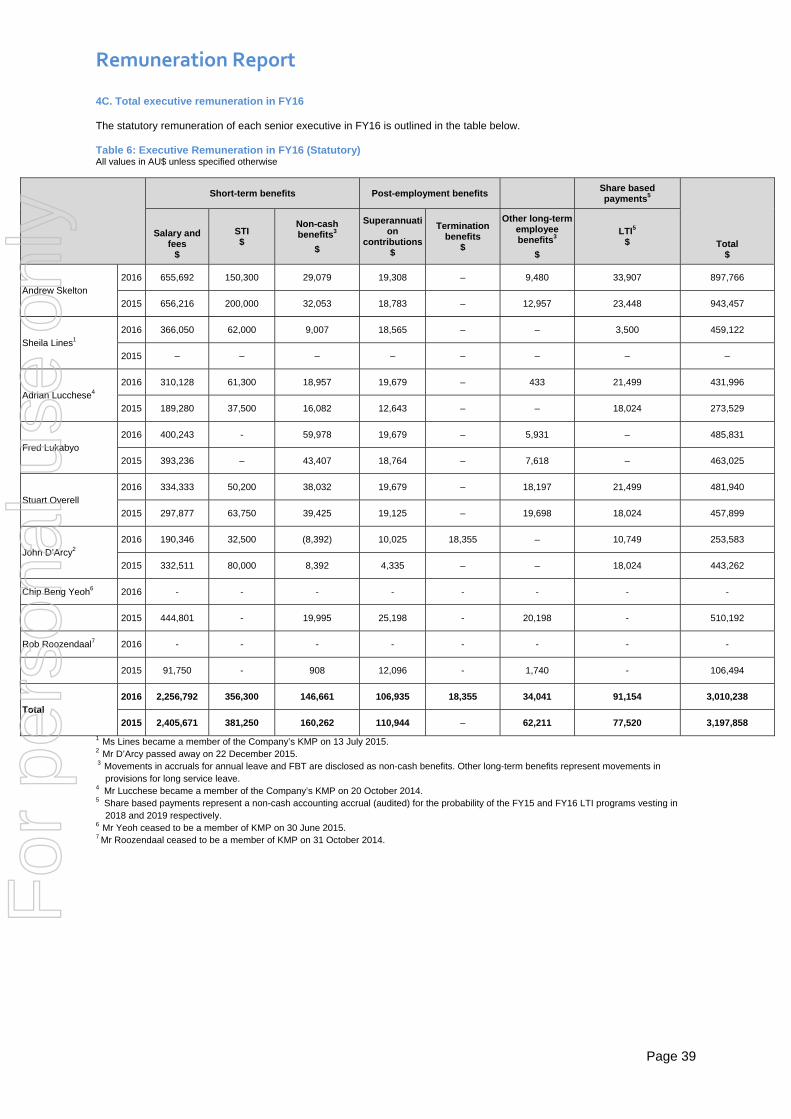
Remuneration Report
Page 39
4C. Total executive remuneration in FY16 The statutory remuneration of each senior executive in FY16 is outlined in the table below. Table 6: Executive Remuneration in FY16 (Statutory) All values in AU$ unless specified otherwise
Short-term benefits Post-employment benefits Share based payments5
Total $
Salary and fees
$
STI $
Non-cash benefits3
$
Superannuation
contributions$
Termination benefits
$
Other long-term employee benefits3
$
LTI5 $
Andrew Skelton
2016 655,692 150,300 29,079 19,308 – 9,480 33,907 897,766
2015 656,216 200,000 32,053 18,783 – 12,957 23,448 943,457
Sheila Lines1
2016 366,050 62,000 9,007 18,565 – – 3,500 459,122
2015 – – – – – – – –
Adrian Lucchese4
2016 310,128 61,300 18,957 19,679 – 433 21,499 431,996
2015 189,280 37,500 16,082 12,643 – – 18,024 273,529
Fred Lukabyo
2016 400,243 - 59,978 19,679 – 5,931 – 485,831
2015 393,236 – 43,407 18,764 – 7,618 – 463,025
Stuart Overell
2016 334,333 50,200 38,032 19,679 – 18,197 21,499 481,940
2015 297,877 63,750 39,425 19,125 – 19,698 18,024 457,899
John D’Arcy2
2016 190,346 32,500 (8,392) 10,025 18,355 – 10,749 253,583
2015 332,511 80,000 8,392 4,335 – – 18,024 443,262
Chip Beng Yeoh6 2016 - - - - - - - -
2015 444,801 - 19,995 25,198 - 20,198 - 510,192
Rob Roozendaal7 2016 - - - - - - - -
2015 91,750 - 908 12,096 - 1,740 - 106,494
Total
2016 2,256,792 356,300 146,661 106,935 18,355 34,041 91,154 3,010,238
2015 2,405,671 381,250 160,262 110,944 – 62,211 77,520 3,197,858
1 Ms Lines became a member of the Company’s KMP on 13 July 2015. 2 Mr D’Arcy passed away on 22 December 2015. 3 Movements in accruals for annual leave and FBT are disclosed as non-cash benefits. Other long-term benefits represent movements in
provisions for long service leave. 4 Mr Lucchese became a member of the Company’s KMP on 20 October 2014. 5 Share based payments represent a non-cash accounting accrual (audited) for the probability of the FY15 and FY16 LTI programs vesting in
2018 and 2019 respectively. 6 Mr Yeoh ceased to be a member of KMP on 30 June 2015. 7 Mr Roozendaal ceased to be a member of KMP on 31 October 2014.
For
per
sona
l use
onl
y
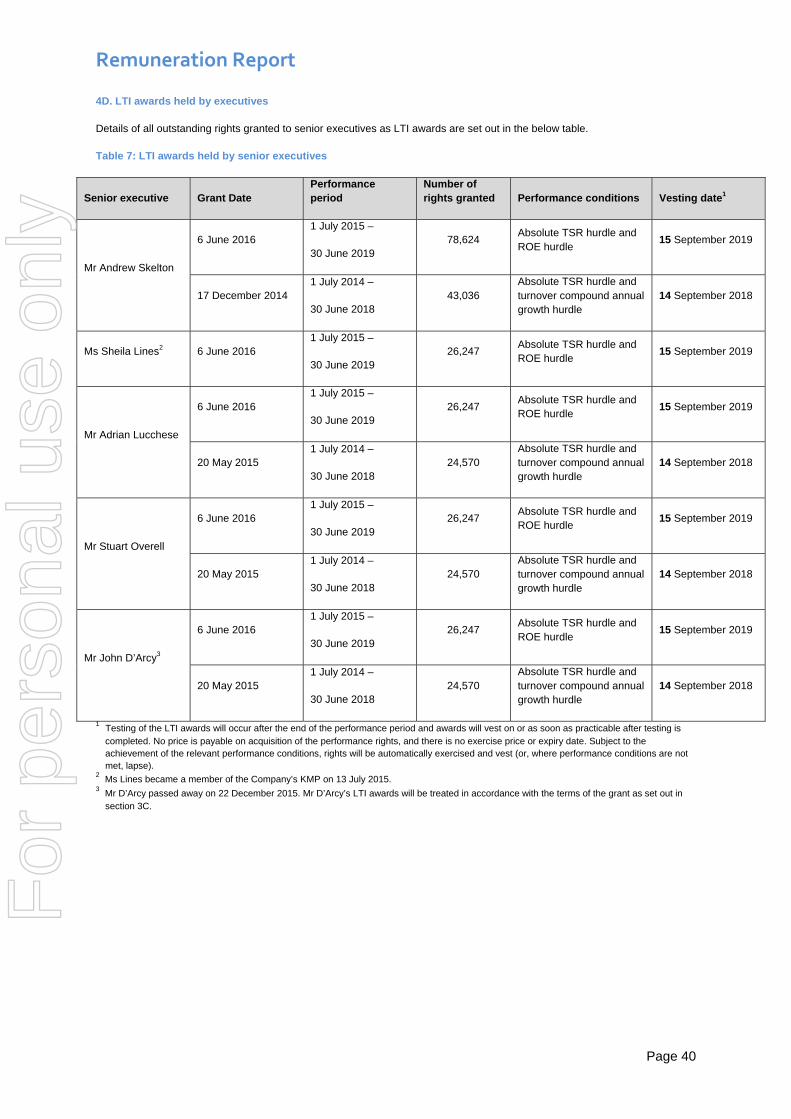
Remuneration Report
Page 40
4D. LTI awards held by executives
Details of all outstanding rights granted to senior executives as LTI awards are set out in the below table.
Table 7: LTI awards held by senior executives
Senior executive Grant Date Performance period
Number of rights granted Performance conditions Vesting date1
Mr Andrew Skelton
6 June 2016 1 July 2015 –
30 June 2019 78,624
Absolute TSR hurdle and ROE hurdle
15 September 2019
17 December 2014 1 July 2014 –
30 June 2018 43,036
Absolute TSR hurdle and turnover compound annual growth hurdle
14 September 2018
Ms Sheila Lines2 6 June 2016 1 July 2015 –
30 June 2019 26,247
Absolute TSR hurdle and ROE hurdle
15 September 2019
Mr Adrian Lucchese
6 June 2016 1 July 2015 –
30 June 2019 26,247
Absolute TSR hurdle and ROE hurdle
15 September 2019
20 May 2015 1 July 2014 –
30 June 2018 24,570
Absolute TSR hurdle and turnover compound annual growth hurdle
14 September 2018
Mr Stuart Overell
6 June 2016 1 July 2015 –
30 June 2019 26,247
Absolute TSR hurdle and ROE hurdle
15 September 2019
20 May 2015 1 July 2014 –
30 June 2018 24,570
Absolute TSR hurdle and turnover compound annual growth hurdle
14 September 2018
Mr John D’Arcy3
6 June 2016 1 July 2015 –
30 June 2019 26,247
Absolute TSR hurdle and ROE hurdle
15 September 2019
20 May 2015 1 July 2014 –
30 June 2018 24,570
Absolute TSR hurdle and turnover compound annual growth hurdle
14 September 2018
1 Testing of the LTI awards will occur after the end of the performance period and awards will vest on or as soon as practicable after testing is completed. No price is payable on acquisition of the performance rights, and there is no exercise price or expiry date. Subject to the achievement of the relevant performance conditions, rights will be automatically exercised and vest (or, where performance conditions are not met, lapse).
2 Ms Lines became a member of the Company’s KMP on 13 July 2015.
3 Mr D’Arcy passed away on 22 December 2015. Mr D’Arcy’s LTI awards will be treated in accordance with the terms of the grant as set out in section 3C.
For
per
sona
l use
onl
y
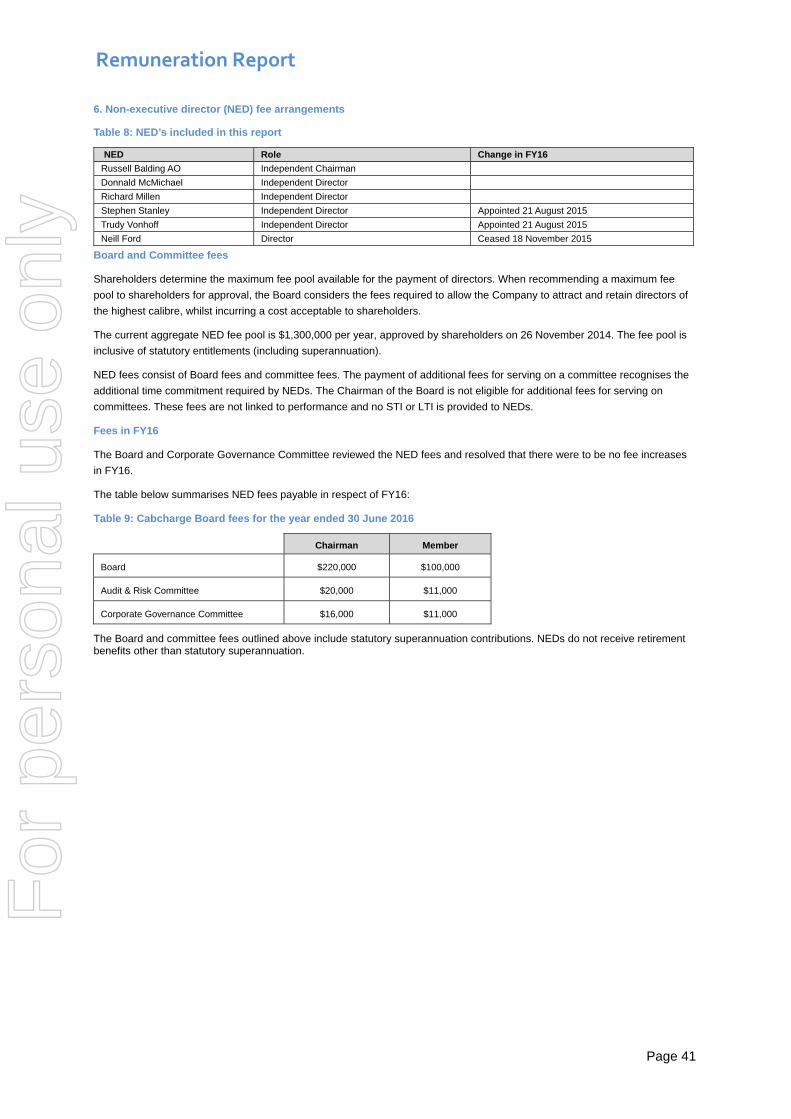
Remuneration Report
Page 41
6. Non-executive director (NED) fee arrangements
Table 8: NED’s included in this report
NED Role Change in FY16
Russell Balding AO Independent Chairman
Donnald McMichael Independent Director
Richard Millen Independent Director
Stephen Stanley Independent Director Appointed 21 August 2015
Trudy Vonhoff Independent Director Appointed 21 August 2015
Neill Ford Director Ceased 18 November 2015
Board and Committee fees
Shareholders determine the maximum fee pool available for the payment of directors. When recommending a maximum fee
pool to shareholders for approval, the Board considers the fees required to allow the Company to attract and retain directors of
the highest calibre, whilst incurring a cost acceptable to shareholders.
The current aggregate NED fee pool is $1,300,000 per year, approved by shareholders on 26 November 2014. The fee pool is
inclusive of statutory entitlements (including superannuation).
NED fees consist of Board fees and committee fees. The payment of additional fees for serving on a committee recognises the
additional time commitment required by NEDs. The Chairman of the Board is not eligible for additional fees for serving on
committees. These fees are not linked to performance and no STI or LTI is provided to NEDs.
Fees in FY16
The Board and Corporate Governance Committee reviewed the NED fees and resolved that there were to be no fee increases
in FY16.
The table below summarises NED fees payable in respect of FY16:
Table 9: Cabcharge Board fees for the year ended 30 June 2016
Chairman Member
Board $220,000 $100,000
Audit & Risk Committee $20,000 $11,000
Corporate Governance Committee $16,000 $11,000
The Board and committee fees outlined above include statutory superannuation contributions. NEDs do not receive retirement benefits other than statutory superannuation.
For
per
sona
l use
onl
y

Remuneration Report
Page 42
Statutory disclosure in respect of NED remuneration
The following table includes statutory disclosure relating to NED remuneration in FY16 and FY15.
Table 10: Statutory disclosure – NED fees
Short-term benefits Post-employment
benefits
Total ($)
Salary and fees ($)
Superannuation contributions
($)
Mr Russell Balding
2016 200,692 19,308 220,000
2015 201,217 18,783 220,000
Mr Donnald McMichael
2016 106,930 10,158 117,088
2015 113,119 10,700 123,819
Mr Richard Millen
2016 85,589 34,411 120,000
2015 80,800 36,977 117,777
Mr Stephen Stanley
2016 87,855 8,346 96,201
2015 - - -
Ms Trudy Vonhoff
2016 85,026 8,078 93,104
2015 - - -
Mr Neill Ford1
2016 42,283 4,024 46,307
2015 110,502 10,498 121,000
Mr Rod Gilmour
2016 - - -
2015 36,113 6,357 42,470
Mr Ian Armstrong
2016 - - -
2015 27,157 12,842 39,999
Mr Philip Franet
2016 - - -
2015 9,284 882 10,166
Total fees for NEDs
2016 608,375 84,325 692,7002
2015 578,192 97,039 675,231
1 Mr Ford retired as a NED on 18 November 2015.
2 This represents 53.3% of the pool approved by shareholders.
For
per
sona
l use
onl
y

Remuneration Report
Page 43
7. Additional disclosures relating to share capital
Shares
The relevant interest of each KMP (and their related parties) in the share capital of the Company for the year to 30 June 2016 is detailed in the table below.
Table 11: Shareholdings of KMP and their related parties
Balance 1 July 2015 Received as remuneration Net other change Balance 30 June 2016
Direct
interest shares
Indirect interest shares
Direct interest shares
Indirect interest shares
Direct interest shares
Indirect interest shares
Direct interest shares
Indirect interest shares
Senior executives
Andrew Skelton 6,861 – – – - – 6,861 –
Sheila Lines – – – – – – – –
Adrian Lucchese
– – – – – – – –
Fred Lukabyo 2,450 – – – – – 2,450 –
Stuart Overell – – – – – – – –
John D’Arcy3 – – – – – – – –
Non-executive directors
Russel Balding 15,000 – – – 25,000 – 40,000 –
Donnald McMichael1 500 15,530 – – – – 500 15,530
Richard Millen4 – - – – – 35,000 – 35,000
Stephen Stanley5
– - – – – 80,000 – 80,000
Trudy Vonhoff - – – – 10,000 – 10,000 –
Neill Ford2 – – – – – – – –
1 12,500 fully paid ordinary shares held by Gracious Investments Pty Ltd atf Donren Holdings Superannuation Fund and 3,030 CABSRU (a self-funding instalment warrant issued by RBS) held by Gracious Investments Pty Ltd atf Donren Holdings Superannuation Fund.
2 Shareholdings for Mr Ford are presented as at the date he retired as a NED, being 18 November 2015.
3 Shareholdings for Mr D’Arcy are presented at the date he passed away, being 22 December 2015.
4 35,000 fully paid ordinary shares held by Navigator Australia Limited as custodian for an MLC Wrap Platform as nominee for the Millen Superannuation Fund.
5 80,000 fully paid ordinary shares held by Esjay Pty Ltd atf The Stanley Family Trust.
For
per
sona
l use
onl
y

Remuneration Report
Page 44
Rights
The table below details the rights granted to KMP as part of their remuneration. All rights granted relate to the LTI plan.
Table 12: Rights granted as part of remuneration to the Company executives
Senior executive1
Balance at 1 July 2015
Granted as remunerati
on2
Value of rights
granted
Net other change
Vested Value of rights vested
Lapsed Balance at
30 June 2016
Andrew Skelton 43,036 78,624
300,000
– –
– – 121,660
Sheila Lines – 26,247
100,000 –
– –
– 26,247
Adrian Lucchese 24,570 26,247
100,000
– –
– – 50,817
Stuart Overell
24,570 26,247
100,000 –
– –
– 50,817
John D’Arcy 24,570 26,247
100,000 –
– -–
– 50,817
1 No other members of the Company’s KMP received performance rights (or options) as part of their remuneration in FY16. 2 For performance rights granted to Mr Skelton, Ms Lines, Mr Lucchese, Mr Overell and Mr D’Arcy on 6 June 2016, the fair value of performance rights is $261,341. The fair value has been calculated by an independent advisor as at the date of grant, using a Black-Scholes option pricing technique for the return on equity rights and a Monte Carlo simulation model for the total shareholder return rights.
8. Transactions with key management personnel and their related parties
Loans to KMP and their related parties
No loans were made guaranteed or secured to KMP or any of their related parties.
There were no transactions between the Group and any KMP (or their related parties) other than those within the normal
employee, customer or supplier relationship on terms no more favourable than arms’ length. These transactions were trivial or
domestic in nature and information about them would not adversely affect investment decisions by shareholders, or the
discharge of accountability by KMP.
For
per
sona
l use
onl
y

KPMG, an Australian partnership and a member firm of the KPMG network of independent member firms affiliated with KPMG International Cooperative (“KPMG International”), a Swiss entity.
Liability limited by a scheme approved under Profession Standards Legislation.
Lead Auditor’s Independence Declaration under Section 307C of the Corporations Act 2001
To: the directors of Cabcharge Australia Limited
I declare that, to the best of my knowledge and belief, in relation to the audit for the financial year ended 30 June 2016 there have been:
(i) no contraventions of the auditor independence requirements as set out in the Corporations Act 2001 in relation to the audit; and
(ii) no contraventions of any applicable code of professional conduct in relation to the audit
KPMG
Julie Cleary Partner Sydney 26 August 2016
KPM_INI_01
PAR_SIG_01 PAR_NAM_01 PAR_POS_01 PAR_DAT_01 PAR_CIT_01
For
per
sona
l use
onl
y
Cabcharge Australia Limited Annual Financial Report and its Controlled Entitities Year Ended 30 June 2016
Page 46
Consolidated Financial Statements
TableofContentsCONSOLIDATED STATEMENT OF COMPREHENSIVE INCOME .......................................... 48
CONSOLIDATED STATEMENT OF FINANCIAL POSITION ..................................................... 49
CONSOLIDATED STATEMENT OF CASH FLOWS .................................................................... 50
CONSOLIDATED STATEMENT OF CHANGES IN EQUITY ..................................................... 51
NOTES TO THE CONSOLIDATED FINANCIAL STATEMENTS ............................................... 52
1. Reporting entity ....................................................................................................................... 52
2. Basis of preparation ............................................................................................................... 52
3. Revenue & Turnover .............................................................................................................. 54
4. Expenses ................................................................................................................................. 55
5. Finance income and cost ...................................................................................................... 55
6. Income tax expense ............................................................................................................... 56
7. Trade and other receivables ................................................................................................. 57
8. Inventories ............................................................................................................................... 59
9. Financial assets ...................................................................................................................... 59
10. Business combination ........................................................................................................ 60
11. Associated companies ....................................................................................................... 60
12. Property, plant and equipment ......................................................................................... 64
13. Deferred tax assets and liabilities .................................................................................... 65
14. Taxi plate licences .............................................................................................................. 66
15. Goodwill ............................................................................................................................... 68
16. Intellectual property ............................................................................................................ 70
17. Trade and other payables ................................................................................................. 71
18. Loans and borrowings ....................................................................................................... 72
19. Employee benefits .............................................................................................................. 73
20. Share capital and Reserves .............................................................................................. 73
21. Dividends ............................................................................................................................. 75
22. Earnings per share (EPS) ................................................................................................. 76
23. Dividend franking balance ................................................................................................. 76
24. Parent entity disclosures ................................................................................................... 77
25. Deed of Cross Guarantee ................................................................................................. 78
For
per
sona
l use
onl
y

Cabcharge Australia Limited Annual Financial Report and its Controlled Entitities Year Ended 30 June 2016
Page 47
26. Related Party and Key Management Personnel (KMP) disclosures .......................... 79
27. Remuneration of auditors .................................................................................................. 80
28. Particulars relating to controlled entities ......................................................................... 81
29. Capital expenditure commitments ................................................................................... 82
30. Notes to the Consolidated Statement of Cash Flows ................................................... 82
31. Financial instruments and financial risk management .................................................. 83
32. Operating segment ............................................................................................................. 88
33. Share-based payment ....................................................................................................... 89
34. Subsequent event .............................................................................................................. 90
DIRECTORS’ DECLARATION ................................................................................................................... 92
INDEPENDENT AUDITOR’S REPORT ...................................................................................................... 93
F
or p
erso
nal u
se o
nly
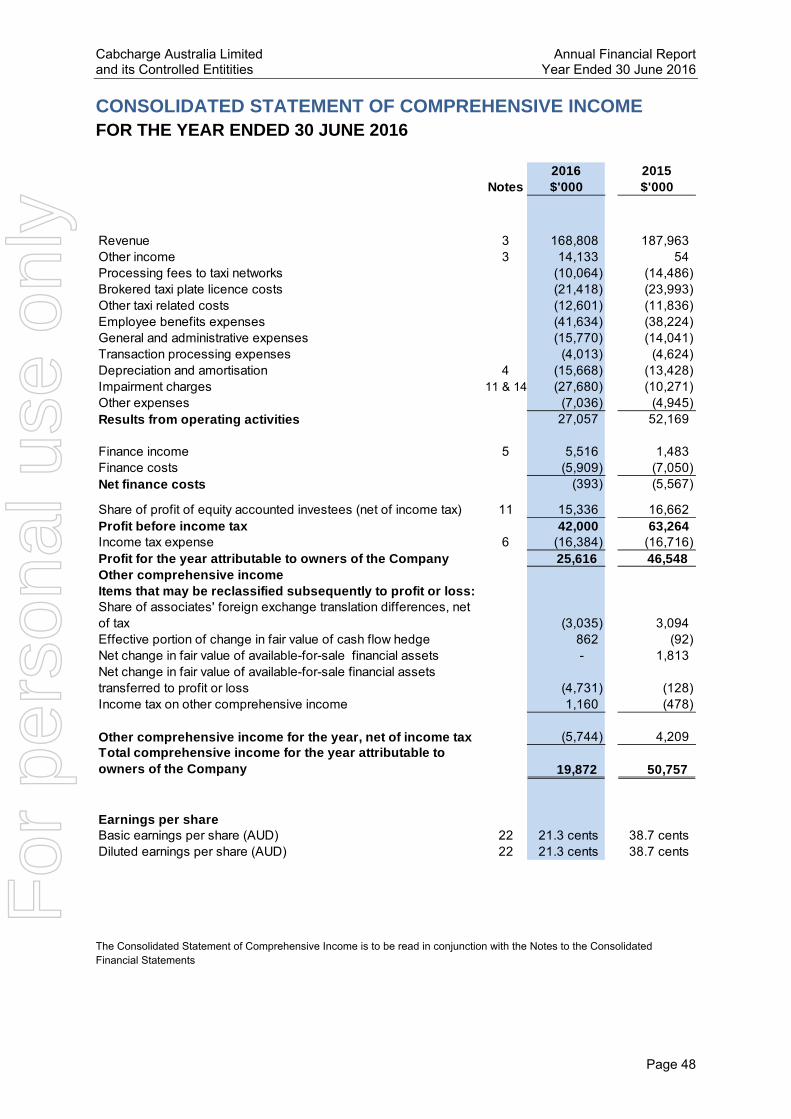
Cabcharge Australia Limited Annual Financial Report and its Controlled Entitities Year Ended 30 June 2016
Page 48
CONSOLIDATED STATEMENT OF COMPREHENSIVE INCOME FOR THE YEAR ENDED 30 JUNE 2016
The Consolidated Statement of Comprehensive Income is to be read in conjunction with the Notes to the Consolidated Financial Statements
2016 2015Notes $'000 $'000
Revenue 3 168,808 187,963 Other income 3 14,133 54 Processing fees to taxi networks (10,064) (14,486) Brokered taxi plate licence costs (21,418) (23,993) Other taxi related costs (12,601) (11,836) Employee benefits expenses (41,634) (38,224) General and administrative expenses (15,770) (14,041) Transaction processing expenses (4,013) (4,624) Depreciation and amortisation 4 (15,668) (13,428) Impairment charges 11 & 14 (27,680) (10,271) Other expenses (7,036) (4,945) Results from operating activities 27,057 52,169
Finance income 5 5,516 1,483 Finance costs (5,909) (7,050) Net finance costs (393) (5,567)
Share of profit of equity accounted investees (net of income tax) 11 15,336 16,662 Profit before income tax 42,000 63,264 Income tax expense 6 (16,384) (16,716) Profit for the year attributable to owners of the Company 25,616 46,548 Other comprehensive incomeItems that may be reclassified subsequently to profit or loss:Share of associates' foreign exchange translation differences, net of tax (3,035) 3,094 Effective portion of change in fair value of cash flow hedge 862 (92) Net change in fair value of available-for-sale financial assets - 1,813 Net change in fair value of available-for-sale financial assets transferred to profit or loss (4,731) (128) Income tax on other comprehensive income 1,160 (478)
Other comprehensive income for the year, net of income tax (5,744) 4,209 Total comprehensive income for the year attributable to owners of the Company 19,872 50,757
Earnings per shareBasic earnings per share (AUD) 22 21.3 cents 38.7 cents Diluted earnings per share (AUD) 22 21.3 cents 38.7 cents
For
per
sona
l use
onl
y

Cabcharge Australia Limited Annual Financial Report and its Controlled Entitities Year Ended 30 June 2016
Page 49
CONSOLIDATED STATEMENT OF FINANCIAL POSITION AS AT 30 JUNE 2016
The Consolidated Statement of Financial Position is to be read in conjunction with the Notes to the Consolidated Financial Statements
2016 2015Notes $'000 $'000
CURRENT ASSETSCash and cash equivalents 30 13,039 23,856 Trade and other receivables 7 78,477 69,086 Inventories 8 1,321 4,098 Other current assets 2,808 3,665 TOTAL CURRENT ASSETS 95,645 100,705
NON-CURRENT ASSETSTrade and other receivables 7 4,198 7,344 Advances to associates 26 18,812 18,812 Financial assets 9 1,839 7,911 Investments in associates accounted for using the equity method 11 296,593 284,292 Property, plant and equipment 12 40,233 39,025 Net deferred tax assets 13 4,819 3,630 Taxi plate licences 14 41,241 70,920 Goodwill 15 15,249 15,032 Intellectual property 16 11,981 9,131 TOTAL NON-CURRENT ASSETS 434,965 456,097 TOTAL ASSETS 530,610 556,802
CURRENT LIABILITIESTrade and other payables 17 23,126 28,005 Loans and borrowings 18 3,663 5,199 Interest rate swaps 123 985 Current tax liabilities 4,051 1,453 Employee benefits 19 4,095 4,298 TOTAL CURRENT LIABILITIES 35,058 39,940
NON-CURRENT LIABILITIESLoans and borrowings 18 106,000 123,000 Employee benefits 19 640 827 TOTAL NON-CURRENT LIABILITIES 106,640 123,827 TOTAL LIABILITIES 141,698 163,767 NET ASSETS 388,912 393,035
EQUITYShare capital 20 138,325 138,325 Reserves 20 (4,885) 768 Retained earnings 255,472 253,942 TOTAL EQUITY ATTRIBUTABLE TO EQUITY HOLDERS OF CABCHARGE AUSTRALIA LIMITED 388,912 393,035 F
or p
erso
nal u
se o
nly

Cabcharge Australia Limited Annual Financial Report and its Controlled Entitities Year Ended 30 June 2016
Page 50
CONSOLIDATED STATEMENT OF CASH FLOWS FOR THE YEAR ENDED 30 JUNE 2016
The Consolidated Statement of Cash Flows is to be read in conjunction with the Notes to the Consolidated Financial Statements
2016 2015Notes $'000 $'000
Cash flows from operating activitiesReceipts from customers and others 1,278,069 1,324,138 Payments to suppliers, licensees and employees (1,213,337) (1,247,198) Dividends received 232 316 Interest received 1,023 1,482 Finance costs paid (5,544) (7,373) Income tax paid (13,917) (21,352)
Net cash provided by operating activities 30 46,526 50,013
Cash flows from investing activitiesPurchase of property, plant and equipment (9,779) (11,558) Purchase of eftpos equipment (not yet installed) (5,791) - Payments for development of intellectual property (3,059) (2,136) Payments for other investments - (100) Advances to associates - (7,840)
Repayment from associates - 7,840
Acquisition of Dandenong Taxis, net of cash acquired (1,932) - Proceeds from sale of investments 5,834 275 Proceeds from sale of property, plant and equipment 6 458
(14,721) (13,061)
Cash flows from financing activitiesProceeds from borrowings 25,781 10,102 Repayment of borrowings (44,317) (40,968) Dividends paid 21 (24,086) (24,086)
Net cash (used in) financing activities (42,622) (54,952)
Net (decrease) in cash and cash equivalents (10,817) (18,000)
Cash and cash equivalents at 1 July 23,856 41,856
Cash and cash equivalents at 30 June 30 13,039 23,856
Net cash (used in) investing activities
For
per
sona
l use
onl
y

Cabcharge Australia Limited Annual Financial Report and its Controlled Entitities Year Ended 30 June 2016
Page 51
CONSOLIDATED STATEMENT OF CHANGES IN EQUITY FOR THE YEAR ENDED 30 JUNE 2016
The Consolidated Statement of Changes in Equity is to be read in conjunction with the Notes to the Consolidated Financial Statements
Notes
Share capital$'000
Reserves$'000
Retained earnings
$'000
Total equity$'000
Balance at 1 July 2014 138,325 (3,519) 231,480 366,286 Total comprehensive income for the yearProfit for the year - - 46,548 46,548 Other comprehensive income - Share of associates' foreign exchange translation differences, net of tax - 3,094 - 3,094 Effective portion of change in fair value of cash flow hedge, net of tax - (64) - (64) Net change in fair value of available-for-sale financial assets, net of tax - 1,269 - 1,269 Net change in fair value of available-for-sale financial assets transferred to profit or loss, net of tax - (90) - (90) Total other comprehensive income - 4,209 - 4,209 Total comprehensive income for the year - 4,209 46,548 50,757 Transactions with owners, recorded directly in equityContributions by and distributions to ownersShare-based payments - 78 - 78 Dividends to equity holders 21 - - (24,086) (24,086) Total contributions by and distributions to owners - 78 (24,086) (24,008) Total transactions with owners - 78 (24,086) (24,008) Balance at 30 June 2015 138,325 768 253,942 393,035
Balance at 1 July 2015 138,325 768 253,942 393,035 Total comprehensive income for the yearProfit for the year - - 25,616 25,616 Other comprehensive income - - - Share of associates' foreign exchange translation differences, net of tax - (3,035) - (3,035) Effective portion of change in fair value of cash flow hedge, net of tax - 603 - 603 Net change in fair value of available-for-sale financial assets, net of tax - - - - Net change in fair value of available-for-sale financial assets transferred to profit or loss, net of tax - (3,312) - (3,312) Total other comprehensive income - (5,744) - (5,744) Total comprehensive income for the year - (5,744) 25,616 19,872 Transactions with owners, recorded directly in equityContributions by and distributions to ownersShare-based payments - 91 - 91 Dividends to equity holders 21 - - (24,086) (24,086) Total contributions by and distributions to owners - 91 (24,086) (23,995) Total transactions with owners - 91 (24,086) (23,995) Balance at 30 June 2016 138,325 (4,885) 255,472 388,912
For
per
sona
l use
onl
y

Cabcharge Australia Limited Annual Financial Report and its Controlled Entitities Year Ended 30 June 2016
Page 52
NOTES TO THE CONSOLIDATED FINANCIAL STATEMENTS FOR THE YEAR ENDED 30 JUNE 2016
1. Reporting entity Cabcharge Australia Limited (the "Company") is a company domiciled in Australia. The address of the Company's registered office is 152-162 Riley Street, East Sydney. The Consolidated Financial Statements of the Group as at and for the year ended 30 June 2016 comprise the Company and its subsidiaries (together referred to as the "Group") and the Group's interests in associates. The Group is a for-profit entity and primarily is involved in taxi related services and route, school and charter bus services (through its interest in an associate).
2. Basis of preparation a) Statement of compliance
The Consolidated Financial Statements are general purpose financial statements which have been prepared in accordance with Australian Accounting Standards (AASBs) adopted by the Australian Accounting Standards Board (AASB) and the Corporations Act 2001. The Consolidated Financial statements comply with International Financial Reporting Standards (IFRSs) adopted by the International Accounting Standards Board (IASB). The Consolidated Financial Statements were authorised for issue by the Board of Directors on 26 August 2016.
b) Basis of measurement
The Consolidated Financial Statements have been prepared on the historical cost basis except for available-for-sale financial assets (listed entities) and derivative financial instruments, which are measured at fair value.
c) Functional and presentation currency These Consolidated Financial Statements are presented in Australian dollars, which is the Company's functional currency and the functional currency of the majority of the Group entities. The Company is of a kind referred to in ASIC Corporation Instrument 2016/191 (Rounding in Financial/Directors’ Reports) and in accordance with that Instrument, amounts in the Consolidated Financial Statements and the Directors’ Report have been rounded off to the nearest thousand dollars, unless otherwise stated.
d) Foreign currency transactions Transactions in foreign currencies are translated to the respective functional currencies of Group entities at exchange rates at the dates of the transactions.
e) Use of estimates and judgements The preparation of Consolidated Financial Statements requires management to make judgements, estimates and assumptions that affect the application of accounting policies and the reported amounts of assets, liabilities, income and expenses. Actual results may differ from these estimates. Estimates and underlying assumptions are reviewed on an ongoing basis. Revisions to accounting estimates are recognised in the period in which the estimate is revised and in any future periods affected.
For
per
sona
l use
onl
y

Cabcharge Australia Limited Annual Financial Report and its Controlled Entitities Year Ended 30 June 2016
Page 53
In particular, information about significant areas of estimation uncertainty and critical judgements in applying accounting policies that have the most significant effect on the amount recognised in the Consolidated Financial Statements are described in the following notes: Note 3 Revenue Note 11 Associated companies Note 14 Taxi plate licences Note 15 Goodwill Note 16 Intellectual Property
f) Transactions eliminated on consolidation
Intra-group balances, and any unrealised income and expenses arising from intra-group transactions, are eliminated in preparing the Consolidated Financial Statements. Unrealised gains arising from transactions with equity accounted investees are eliminated against the investment to the extent of the Group's interest in the investee. Unrealised losses are eliminated in the same way as unrealised gains, but only to the extent that there is no evidence of impairment. Gains and losses are recognised when the contributed assets are consumed or sold by the equity accounted investees or, if not consumed or sold by the equity accounted investee, when the Group's interest in such entities is disposed of.
g) New standards and interpretations not yet adopted A number of new accounting standards and interpretations have been published that are not mandatory for 30 June 2016 reporting period and have not been early adopted by the Group. The Group’s assessment of the impact of these new standards and interpretations is set out below: AASB 9 Financial Instruments AASB 9, published in July 2014, replaces the existing guidance in AASB 139 Financial Instruments: Recognition and Measurement. AASB 9 includes revised guidance on the classification and measurement of financial instruments, including a new expected credit loss model for calculating impairment on financial assets, and the new general hedge accounting requirements. It also carries forward the guidance on recognition and derecognition of financial instruments from AASB 139. AASB 9 is effective for annual reporting periods beginning on or after 1 January 2018, with early adoption permitted. AASB 15 Revenue from Contracts with Customers AASB 15 establishes a comprehensive framework for determining whether, how much and when revenue is recognised. It replaces existing revenue recognition guidance, including AASB 118 Revenue and AASB 111 Construction Contracts. AASB 15 is effective for annual reporting periods beginning on or after 1 January 2018, with early adoption permitted. AASB 16 Leases AASB 16 removes the classification of leases as either operational leases or finance leases. AASB 16 is effective for annual reporting periods beginning on or after 1 January 2019, with early adoption permitted. The application of AASB 9, AASB15 and AASB 16 could potentially have an impact on the Consolidated Financial Statements; however the extent of any impact has not yet been determined.
For
per
sona
l use
onl
y
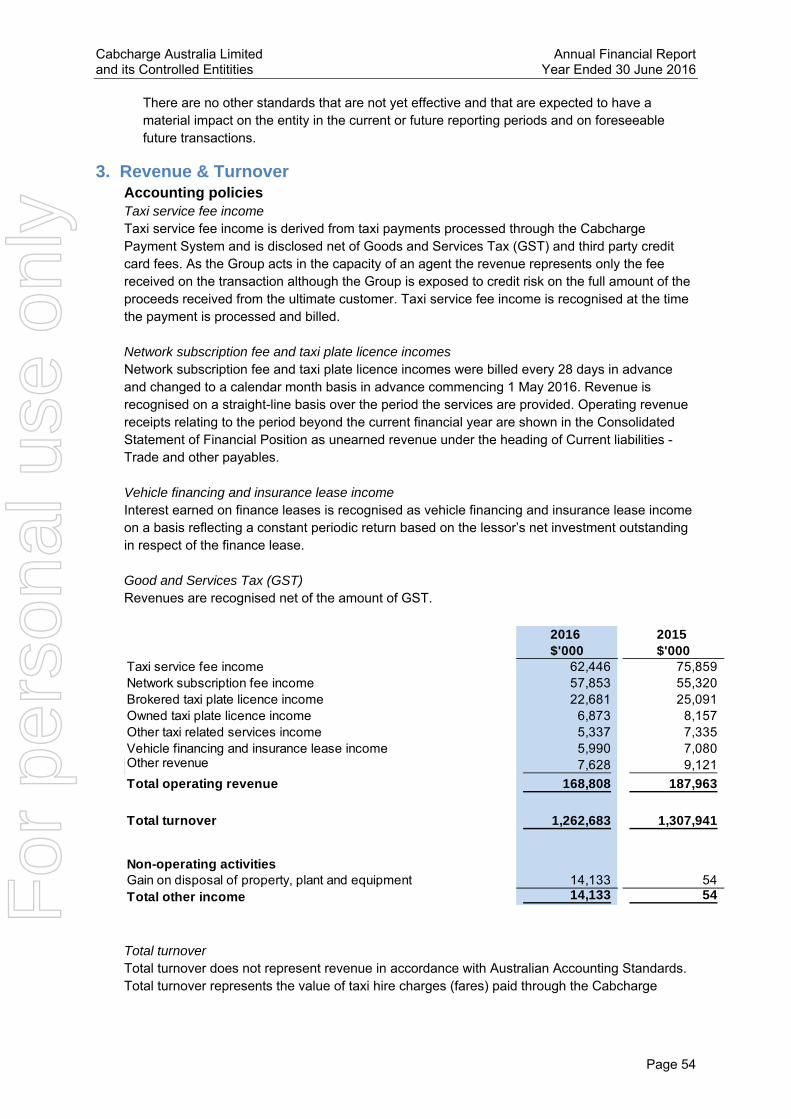
Cabcharge Australia Limited Annual Financial Report and its Controlled Entitities Year Ended 30 June 2016
Page 54
There are no other standards that are not yet effective and that are expected to have a material impact on the entity in the current or future reporting periods and on foreseeable future transactions.
3. Revenue & Turnover Accounting policies Taxi service fee income Taxi service fee income is derived from taxi payments processed through the Cabcharge Payment System and is disclosed net of Goods and Services Tax (GST) and third party credit card fees. As the Group acts in the capacity of an agent the revenue represents only the fee received on the transaction although the Group is exposed to credit risk on the full amount of the proceeds received from the ultimate customer. Taxi service fee income is recognised at the time the payment is processed and billed. Network subscription fee and taxi plate licence incomes Network subscription fee and taxi plate licence incomes were billed every 28 days in advance and changed to a calendar month basis in advance commencing 1 May 2016. Revenue is recognised on a straight-line basis over the period the services are provided. Operating revenue receipts relating to the period beyond the current financial year are shown in the Consolidated Statement of Financial Position as unearned revenue under the heading of Current liabilities - Trade and other payables. Vehicle financing and insurance lease income Interest earned on finance leases is recognised as vehicle financing and insurance lease income on a basis reflecting a constant periodic return based on the lessor’s net investment outstanding in respect of the finance lease. Good and Services Tax (GST) Revenues are recognised net of the amount of GST.
Total turnover Total turnover does not represent revenue in accordance with Australian Accounting Standards. Total turnover represents the value of taxi hire charges (fares) paid through the Cabcharge
2016 2015$'000 $'000
Taxi service fee income 62,446 75,859 Network subscription fee income 57,853 55,320 Brokered taxi plate licence income 22,681 25,091 Owned taxi plate licence income 6,873 8,157 Other taxi related services income 5,337 7,335 Vehicle financing and insurance lease income 5,990 7,080 Other revenue 7,628 9,121
Total operating revenue 168,808 187,963
Total turnover 1,262,683 1,307,941
Non-operating activitiesGain on disposal of property, plant and equipment 14,133 54 Total other income 14,133 54 F
or p
erso
nal u
se o
nly

Cabcharge Australia Limited Annual Financial Report and its Controlled Entitities Year Ended 30 June 2016
Page 55
Payment System plus Cabcharge's taxi service fee plus the Group’s revenue from other sources. Cabcharge's credit risk is based on turnover rather than revenue.
4. Expenses Accounting policies Depreciation Items of property (excluding freehold land), plant and equipment are depreciated at rates based upon their expected useful lives using the straight-line method. Leased assets are depreciated over the shorter of the lease term and their useful lives. The estimated useful lives of each major class of asset for the current and comparative periods are:
Buildings 40 to 99 years Furniture, fittings, plant and equipment 3 to 8 years EFTPOS Equipment 4 to 6 years
Depreciation methods, useful lives and residual values are reassessed at each reporting date.
Amortisation Items of intellectual property and finite life taxi plate licences are amortised at rates based upon their estimated useful lives using the straight-line method, and this amortisation is recognised in profit or loss.
The estimated useful lives for current and comparative periods are as follows: Customer contracts 5 to 8 years Capitalised development costs 4 to 6 years Finite life taxi plate licences 10 to 50 years
Amortisation methods, useful lives and residual values are reviewed at each reporting date and adjusted if appropriate.
5. Finance income and cost Accounting policies Finance income comprises interest income on funds invested (including available-for-sale financial assets), foreign currency gains, gains on the disposal of available-for-sale financial assets, gains on hedging instruments that are recognised in profit or loss and reclassifications of
2016 2015$'000 $'000
Profit before related income tax includes the following expenses:Depreciation of property, plant and equipment 11,785 10,344 Amortisation of intangibles 3,883 3,084
Total depreciation and amortisation 15,668 13,428
Employee benefits expense
Included in total employee benefits expense are:
Contributions to defined contribution / accumulation type superannuation funds 2,892 2,758 Share-based payment expenses 91 78
For
per
sona
l use
onl
y

Cabcharge Australia Limited Annual Financial Report and its Controlled Entitities Year Ended 30 June 2016
Page 56
amounts previously recognised in other comprehensive income. Interest income is recognised as it accrues in profit or loss, using the effective interest method. Finance cost comprises interest expense on borrowings, unwinding of the discount on provisions, foreign currency losses, impairment losses recognised on financial assets, losses on hedging instruments that are recognised in profit or loss and reclassifications of amounts previously recognised in other comprehensive income. All borrowing costs are recognised in profit or loss using the effective interest method.
6. Income tax expense Accounting policies Income tax expense comprises current and deferred tax. Income tax expense is recognised in profit or loss except to the extent that it relates to a business combination or items recognised directly in equity or in other comprehensive income. Current tax is the expected tax payable on the taxable income for the year, using tax rates enacted or substantively enacted at the reporting date, and any adjustment to tax payable in respect of previous years.
a) Recognised in the Consolidated Statement of Comprehensive Income
2016 2015$'000 $'000
Net gain on disposal of available-for-sale financial assets 4,493 - Interest Income 1,023 1,483
Total finance income 5,516 1,483
2016 2015$'000 $'000
Current income tax expense Current year 18,327 16,958 Adjustment for prior years (524) (485)
17,803 16,473
Deferred tax expenseOrigination and reversal of temporary differences (1,419) 243
Total income tax expense in the Consolidated Statement of Comprehensive Income 16,384 16,716
Cabcharge Australia Limited and its wholly owned Australian resident subsidiaries form a tax consolidated group. The current tax rate applicable to the group is 30%.
For
per
sona
l use
onl
y
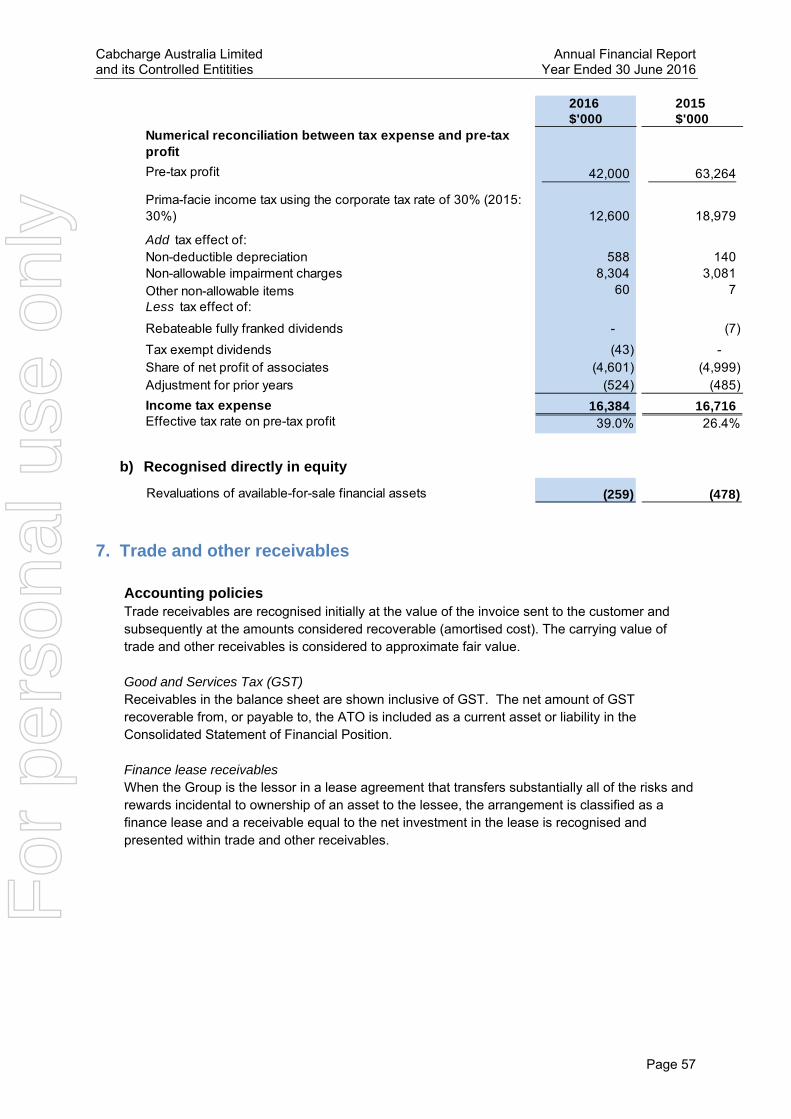
Cabcharge Australia Limited Annual Financial Report and its Controlled Entitities Year Ended 30 June 2016
Page 57
b) Recognised directly in equity
7. Trade and other receivables Accounting policies Trade receivables are recognised initially at the value of the invoice sent to the customer and subsequently at the amounts considered recoverable (amortised cost). The carrying value of trade and other receivables is considered to approximate fair value. Good and Services Tax (GST) Receivables in the balance sheet are shown inclusive of GST. The net amount of GST recoverable from, or payable to, the ATO is included as a current asset or liability in the Consolidated Statement of Financial Position. Finance lease receivables When the Group is the lessor in a lease agreement that transfers substantially all of the risks and rewards incidental to ownership of an asset to the lessee, the arrangement is classified as a finance lease and a receivable equal to the net investment in the lease is recognised and presented within trade and other receivables.
2016 2015$'000 $'000
Numerical reconciliation between tax expense and pre-tax profit
Pre-tax profit 42,000 63,264
Prima-facie income tax using the corporate tax rate of 30% (2015: 30%) 12,600 18,979
Add tax effect of:Non-deductible depreciation 588 140 Non-allowable impairment charges 8,304 3,081 Other non-allowable items 60 7 Less tax effect of:
Rebateable fully franked dividends - (7)
Tax exempt dividends (43) - Share of net profit of associates (4,601) (4,999) Adjustment for prior years (524) (485)
Income tax expense 16,384 16,716 Effective tax rate on pre-tax profit 39.0% 26.4%
Revaluations of available-for-sale financial assets (259) (478)
For
per
sona
l use
onl
y

Cabcharge Australia Limited Annual Financial Report and its Controlled Entitities Year Ended 30 June 2016
Page 58
Movement in allowance for impairment
Impaired receivables are those receivables for which a specific doubtful debt provision has been recognised. Receivables that are past due but not impaired are those receivables the Directors believe to be fully recoverable and as a result, have not recognised any amount in the allowance for impairment for them.
Ageing of trade receivables
For additional information in relating to credit risk, see Note 31.
2016 2015$'000 $'000
CurrentTrade receivables 49,842 50,790 Accumulated impairment losses (2,387) (914) Finance lease receivables 5,067 7,742
Other receivables 25,955 11,468
78,477 69,086
Non-currentFinance lease receivables 4,198 6,884
Other receivables - 460
4,198 7,344
Balance at the beginning of the year (914) (914) Doubtful debts (recognised) (3,395) (506) Amount written off as uncollectable 1,922 506 Balance at the end of the year (2,387) (914)
GrossImpairm
ent Net GrossImpairm
ent Net$'000 $'000 $'000 $'000 $'000 $'000
Not past due 41,895 (6) 41,889 44,298 (20) 44,278 Past due 1 - 30 days 4,748 (39) 4,709 4,705 (47) 4,658 Past due 31 - 60 days 1,038 (181) 857 956 (191) 765 Past due 61 - 90 days 383 (383) - 459 (321) 138 Past due over 90 days 1,778 (1,778) - 372 (335) 37
49,842 (2,387) 47,455 50,790 (914) 49,876
2016 year 2015 year
For
per
sona
l use
onl
y

Cabcharge Australia Limited Annual Financial Report and its Controlled Entitities Year Ended 30 June 2016
Page 59
Finance leases of the Group are receivable as follows:
There have been no unguaranteed residual values. No lease payments are considered uncollectable at the reporting date. No credit terms have been re-negotiated with customers.Collateral is held in the case of finance lease receivables, where the Group holds a lien over the leased asset. The market value of such collateral is not expected to vary materially from the net investment value of the finance lease receivables. There has been no change in credit risk policies during the financial year.
8. Inventories Accounting policies Inventories are measured at the lower of cost and net realisable value. Costs are assigned on a first-in, first-out basis and include direct materials and the cost of purchase. Net realisable value is the estimated selling price in the ordinary course of business, less the estimated costs of completion and selling expenses.
9. Financial assets Accounting policies Available-for-sale listed investments are recognised initially and subsequently at market price. Unrealised gains and losses arising from changes in market price are recognised in other comprehensive income and presented in the fair value reserve in equity. When an investment is derecognised, the cumulative gain or loss in equity is transferred to profit or loss. Available-for-sale unlisted investments are recognised initially and subsequently at cost as the fair value of these securities cannot be measured reliably. The carrying amount of available-for-sale for unlisted investments is considered to approximate fair value. These unlisted investments are primarily investments in unrelated taxi network operations where the shareholding held by the Group is not sufficient to demonstrate significant influence. The Group has no intention to dispose of these unlisted investments in the foreseeable future.
Future minimum
lease payments Interest
Present value of minimum
lease payments
Future minimum
lease payments Interest
Present value of minimum
lease payments
$'000 $'000 $'000 $'000 $'000 $'000
Less than one year 5,752 685 5,067 8,924 1,182 7,742 Between one and five years 4,600 402 4,198 7,633 749 6,884
10,352 1,087 9,265 16,557 1,931 14,626
20152016
2016 2015$'000 $'000
Motor vehicles - at cost - 78 Parts, safety cameras and sundries - at cost 1,321 4,020
1,321 4,098
For
per
sona
l use
onl
y
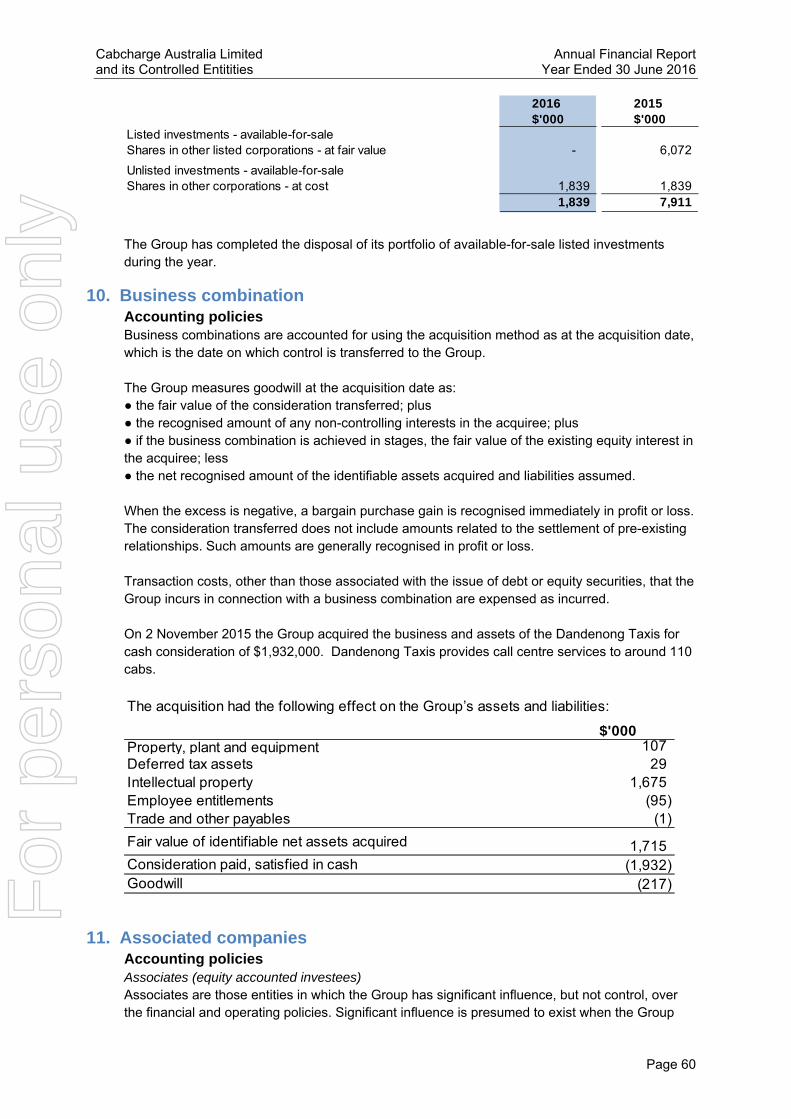
Cabcharge Australia Limited Annual Financial Report and its Controlled Entitities Year Ended 30 June 2016
Page 60
The Group has completed the disposal of its portfolio of available-for-sale listed investments during the year.
10. Business combination Accounting policies Business combinations are accounted for using the acquisition method as at the acquisition date, which is the date on which control is transferred to the Group. The Group measures goodwill at the acquisition date as: ● the fair value of the consideration transferred; plus ● the recognised amount of any non-controlling interests in the acquiree; plus ● if the business combination is achieved in stages, the fair value of the existing equity interest in the acquiree; less ● the net recognised amount of the identifiable assets acquired and liabilities assumed. When the excess is negative, a bargain purchase gain is recognised immediately in profit or loss. The consideration transferred does not include amounts related to the settlement of pre-existing relationships. Such amounts are generally recognised in profit or loss. Transaction costs, other than those associated with the issue of debt or equity securities, that the Group incurs in connection with a business combination are expensed as incurred. On 2 November 2015 the Group acquired the business and assets of the Dandenong Taxis for cash consideration of $1,932,000. Dandenong Taxis provides call centre services to around 110 cabs.
11. Associated companies Accounting policies Associates (equity accounted investees) Associates are those entities in which the Group has significant influence, but not control, over the financial and operating policies. Significant influence is presumed to exist when the Group
2016 2015$'000 $'000
Listed investments - available-for-sale Shares in other listed corporations - at fair value - 6,072
Unlisted investments - available-for-sale Shares in other corporations - at cost 1,839 1,839
1,839 7,911
The acquisition had the following effect on the Group’s assets and liabilities:
$'000Property, plant and equipment 107 Deferred tax assets 29 Intellectual property 1,675 Employee entitlements (95) Trade and other payables (1)
Fair value of identifiable net assets acquired 1,715 Consideration paid, satisfied in cash (1,932) Goodwill (217) F
or p
erso
nal u
se o
nly
Cabcharge Australia Limited Annual Financial Report and its Controlled Entitities Year Ended 30 June 2016
Page 61
holds between 20 and 50 percent of the voting power of another entity. Investments in associates are accounted for using the equity method (equity accounted investees) and are initially recognised at cost. The Consolidated Financial Statements include the Group's share of the profit or loss and other comprehensive income of equity accounted investees, after adjustments to align the accounting policies with those of the Group, from the date that significant influence commences until the date that significant influence ceases. When the Group's share of losses exceeds its interest in an equity accounted investee, the carrying amount of that interest (including any long-term investments) is reduced to nil and the recognition of further losses is discontinued except to the extent that the Group has an obligation or has made payments on behalf of the investee. The financial statements or management accounts of associates are used by the Group to apply the equity method. Reporting dates of the associate vary from that of the Group, but management accounts for the period to the Group's balance date are used for equity accounting. Where there has been a change recognised directly in an associate's other comprehensive income, the Group recognises its share of any changes and discloses this in Other Comprehensive Income in the Consolidated Statement of Comprehensive Income. Foreign operations The income and expenses of foreign operations are translated to Australian dollars at average exchange rates in the month of the transactions. Foreign currency differences are recognised in other comprehensive income and presented in the foreign currency translation reserve in equity (FCTR). When a foreign operation is disposed of in its entirety or partially such that control, significant influence or joint control is lost, the cumulative amount in the translation reserve related to that foreign operation is reclassified to profit or loss as part of the gain or loss on disposal. If the Group disposes of part of its interest in a subsidiary but retains control, then the relevant proportion of the cumulative amount is reattributed to non-controlling interest. When the Group disposes of only part of an associate or joint venture while retaining significant influence or joint control, the relevant proportion of the cumulative amount is reclassified to profit or loss. Foreign exchange gains and losses arising from a monetary item receivable from or payable to a foreign operation, the settlement of which is neither planned nor likely in the foreseeable future, are considered to form part of a net investment in a foreign operation and are recognised directly in other comprehensive income and presented in the FCTR in equity (refer Note 20e). Impairment testing At each balance date, the Group reviews the carrying amounts of its associated companies to determine whether there is any indication that those assets have suffered any impairment loss. If any such indication exists, the recoverable amount of the asset is estimated in order to determine the extent of the impairment loss (if any). Where it is not possible to estimate the recoverable amount of an individual asset, the Group estimates the recoverable amount of the cash-generating unit to which the asset belongs. Recoverable amount is the higher of fair value less costs to sell and value in use. In assessing value in use, the estimated future cash flows are discounted to their present value using a pre-tax discount rate that is appropriate for the currency generated by the cash-generating unit and reflects current market assessments of the time value of money.
For
per
sona
l use
onl
y

Cabcharge Australia Limited Annual Financial Report and its Controlled Entitities Year Ended 30 June 2016
Page 62
If the recoverable amount of an asset (or cash-generating unit) is estimated to be less than its carrying amount, the carrying amount of the asset (cash-generating unit) is reduced to its recoverable amount. An impairment loss is recognised immediately in profit or loss. Where an impairment loss subsequently reverses, the carrying amount of the asset (cash-generating unit) is increased to the revised estimate of its recoverable amount, but so that the increased carrying amount does not exceed the carrying amount that would have been determined had no impairment loss been recognised for the asset (cash-generating unit) in prior years. A reversal of an impairment loss is recognised immediately in profit or loss.
a) Movements during the year in equity accounted investment in associated
companies
b) Equity accounted profits of associates are broken down as follows:
2016 2015 2016 2015
% % $'000 $'000
Route, school and charter bus services Australia 31 December 49 49 251,786 237,286
Taxi related services, bus & coach services
United Kingdom 31 December 49 49 44,807 47,006
296,593 284,292
Carrying amount of investment
ComfortDelGro Cabcharge Pty Ltd
CityFleet Networks Ltd
Reporting PeriodPrincipal ActivitiesCountry of
IncorporationOwnership
InterestName
2016 2015$'000 $'000
Balance at beginning of the financial year 284,292 274,807
Share of associates' profit after income tax
- ComfortDelGro Cabcharge Pty Ltd 14,500 15,213
- CityFleet Networks Ltd 836 1,449
Foreign exchange translation differences
- CityFleet Networks Ltd (3,035) 3,094
Impairment- CityFleet Networks Ltd - (10,271)
Balance at end of the financial year 296,593 284,292
2016 2015$'000 $'000
Share of associates' profit before income tax expense
- ComfortDelGro Cabcharge Pty Ltd 20,955 21,319 - CityFleet Networks Ltd 972 1,844
- ComfortDelGro Cabcharge Pty Ltd (6,455) (6,106) - CityFleet Networks Ltd (136) (395)
Share of associates' profit after income tax 15,336 16,662
Share of associates' income tax expense
For
per
sona
l use
onl
y
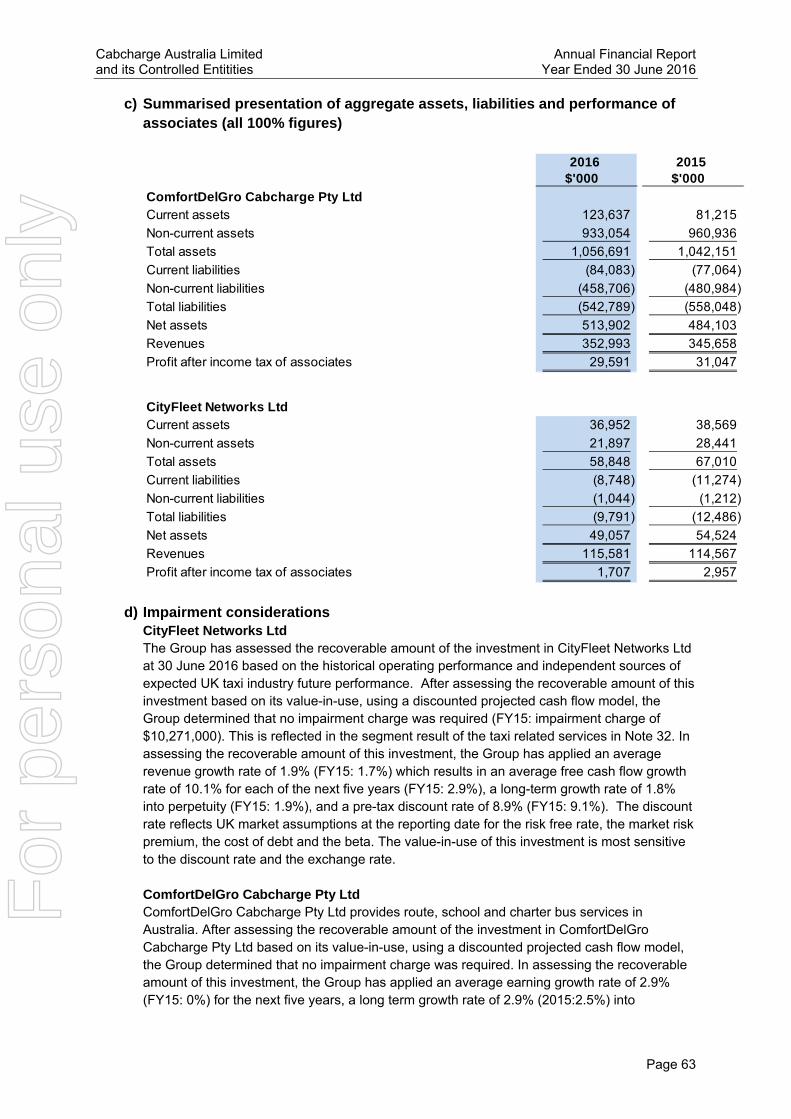
Cabcharge Australia Limited Annual Financial Report and its Controlled Entitities Year Ended 30 June 2016
Page 63
c) Summarised presentation of aggregate assets, liabilities and performance of associates (all 100% figures)
d) Impairment considerations CityFleet Networks Ltd The Group has assessed the recoverable amount of the investment in CityFleet Networks Ltd at 30 June 2016 based on the historical operating performance and independent sources of expected UK taxi industry future performance. After assessing the recoverable amount of this investment based on its value-in-use, using a discounted projected cash flow model, the Group determined that no impairment charge was required (FY15: impairment charge of $10,271,000). This is reflected in the segment result of the taxi related services in Note 32. In assessing the recoverable amount of this investment, the Group has applied an average revenue growth rate of 1.9% (FY15: 1.7%) which results in an average free cash flow growth rate of 10.1% for each of the next five years (FY15: 2.9%), a long-term growth rate of 1.8% into perpetuity (FY15: 1.9%), and a pre-tax discount rate of 8.9% (FY15: 9.1%). The discount rate reflects UK market assumptions at the reporting date for the risk free rate, the market risk premium, the cost of debt and the beta. The value-in-use of this investment is most sensitive to the discount rate and the exchange rate. ComfortDelGro Cabcharge Pty Ltd ComfortDelGro Cabcharge Pty Ltd provides route, school and charter bus services in Australia. After assessing the recoverable amount of the investment in ComfortDelGro Cabcharge Pty Ltd based on its value-in-use, using a discounted projected cash flow model, the Group determined that no impairment charge was required. In assessing the recoverable amount of this investment, the Group has applied an average earning growth rate of 2.9% (FY15: 0%) for the next five years, a long term growth rate of 2.9% (2015:2.5%) into
2016 2015$'000 $'000
ComfortDelGro Cabcharge Pty LtdCurrent assets 123,637 81,215
Non-current assets 933,054 960,936
Total assets 1,056,691 1,042,151
Current liabilities (84,083) (77,064)
Non-current liabilities (458,706) (480,984)
Total liabilities (542,789) (558,048)
Net assets 513,902 484,103
Revenues 352,993 345,658
Profit after income tax of associates 29,591 31,047
CityFleet Networks Ltd Current assets 36,952 38,569
Non-current assets 21,897 28,441
Total assets 58,848 67,010
Current liabilities (8,748) (11,274)
Non-current liabilities (1,044) (1,212)
Total liabilities (9,791) (12,486)
Net assets 49,057 54,524
Revenues 115,581 114,567
Profit after income tax of associates 1,707 2,957
For
per
sona
l use
onl
y

Cabcharge Australia Limited Annual Financial Report and its Controlled Entitities Year Ended 30 June 2016
Page 64
perpetuity and a pre-tax discount rate of 10.4% (2015: 8.4%) This long term growth rate reflects the general estimated long term Australian economic growth and the discount rate is based on Australian market assumptions for the risk free rate, the market risk premium, the cost of debt and the beta.
12. Property, plant and equipment Accounting policies Items of property, plant and equipment are measured at cost less accumulated depreciation and accumulated impairment losses. Cost includes expenditure that is directly attributable to the acquisition of the item. Gains and losses on disposal of an item of property, plant and equipment are determined by comparing the proceeds from disposal with the carrying amount of property, plant and equipment and are recognised net within other income/other expense in profit or loss. When revalued assets are sold, the amounts included in the revaluation reserve are transferred to retained earnings. Subsequent costs are included in the asset's carrying amount or recognised as a separate asset, as appropriate, only when it is probable that future economic benefits associated with the item will flow to the Group and the cost of the item can be measured reliably. All other repairs and maintenance are charged to the profit or loss during the financial period in which they are incurred.
Land & building
s
Furniture, fittings,
plant and equipment
Eftpos equipme
nt Total
$'000 $'000 $'000 $'000
2016 year:
CostOpening balance 17,691 43,970 25,057 86,718
Additions - 4,049 11,521 15,570
Additions through acquisition - 106 - 106
Reclassification 240 1,744 - 1,984
Disposals (4,314) (643) (2,514) (7,471)
Closing balance 13,617 49,226 34,064 96,907
Accumulated depreciationOpening balance (3,728) (29,382) (14,583) (47,693)
Depreciation expense (258) (7,140) (4,387) (11,785)
Reclassification - (480) - (480)
Disposals 570 451 2,263 3,284
Closing balance (3,416) (36,551) (16,707) (56,674)
Net Book ValueOpening balance 13,963 14,588 10,474 39,025
Closing balance 10,201 12,675 17,357 40,233
For
per
sona
l use
onl
y

Cabcharge Australia Limited Annual Financial Report and its Controlled Entitities Year Ended 30 June 2016
Page 65
13. Deferred tax assets and liabilities Accounting policies Deferred tax is recognised in respect of temporary differences between the carrying amounts of assets and liabilities for financial reporting purposes and the amounts used for taxation purposes. Deferred tax is not recognised for: temporary differences on the initial recognition of assets or liabilities in a transaction that is
not a business combination and that affects neither accounting nor taxable profit or loss; temporary differences relating to investments in subsidiaries and associates to the extent
that the Group is able to control the timing or reversal of the temporary differences and it is probable that they will not reverse in the foreseeable future; and
taxable temporary differences arising on the initial recognition of goodwill.
Deferred tax is measured at the tax rates that are expected to be applied to temporary differences when they reverse, using tax rates enacted or substantively enacted at the reporting date. Deferred tax assets and liabilities are offset only if certain criteria are met. Deferred tax assets and liabilities are offset if there is a legally enforceable right to offset current tax liabilities and assets, and they relate to income taxes levied by the same tax authority on the same taxable entity, or on different tax entities, but they intend to settle current tax liabilities and assets on a net basis or their tax assets and liabilities will be realised simultaneously. Deferred tax assets are recognised to the extent that it is probable that future tax profits will be available against which deductible temporary differences can be utilised. Deferred tax assets are
Land & building
s
Furniture, fittings,
plant and equipment
Eftpos equipme
nt Total
$'000 $'000 $'000 $'000
2015 year:
CostOpening balance 17,686 41,398 16,627 75,711
Additions 5 3,123 8,430 11,558
Disposals (551) (551)
Closing balance 17,691 43,970 25,057 86,718
Accumulated depreciationOpening balance (3,482) (23,053) (10,911) (37,446)
Depreciation expense (246) (6,426) (3,672) (10,344)
Disposals 97 97
Closing balance (3,728) (29,382) (14,583) (47,693)
Net Book ValueOpening balance 14,204 18,345 5,716 38,265
Closing balance 13,963 14,588 10,474 39,025
For
per
sona
l use
onl
y

Cabcharge Australia Limited Annual Financial Report and its Controlled Entitities Year Ended 30 June 2016
Page 66
reviewed at each reporting date and are reduced to the extent that it is no longer probable that the related tax benefit will be realised. The amount of benefits brought to account or which may be realised in the future is based on the assumption that no adverse change will occur in income taxation legislation and the anticipation that the Group will derive sufficient future assessable income to enable the benefit to be realised and comply with the conditions of deductibility imposed by the law. Recognised deferred tax assets and liabilities and the movements in these balances are set out below:
14. Taxi plate licences Accounting policies Taxi and other licences acquired separately are reported at cost less accumulated amortisation and impairment losses. Taxi and other licences with finite useful lives are amortised on a straight-line basis over their estimated useful lives between 10 to 50 years in current and comparative periods depending on the licence. Taxi and other licences with indefinite useful lives are not amortised. Such assets are tested for impairment in accordance with the policy. Impairment testing Taxi plate licences with indefinite useful lives are tested for impairment annually, and whenever there is any indication that the asset may be impaired.
Opening balance
Charged to income
Charged to equity
Acquisitions
Closing balance
$'000 $'000 $'000 $'000 $'0002016 year:
Accumulated impairment losses - receivables 313 1 - - 314 Provision for employee entitlements 1,537 (117) - 29 1,449 Accruals 173 48 - - 221 Tax losses 1,570 - - - 1,570
Interest rate derivatives 295 - (259) - 36
Intangible assets 1,890 - - - 1,890 Prepayments (416) 68 - - (348) Revaluations of available-for-sale financial assets (1,411) 1,419 - - 8 Other taxable temporary differences (321) - - - (321)
3,630 1,419 (259) 29 4,819
2015 year:
Accumulated impairment losses - receivables 274 39 - - 313 Provision for employee entitlements 1,631 (94) - - 1,537 Accruals 158 15 - - 173 Tax losses 1,612 (42) - - 1,570
Interest rate derivatives 268 - 27 - 295
Intangible assets 1,890 - - - 1,890 Prepayments (255) (161) - - (416) Revaluations of available-for-sale financial assets (906) - (505) - (1,411) Other taxable temporary differences (321) - - - (321)
4,351 (243) (478) - 3,630
For
per
sona
l use
onl
y

Cabcharge Australia Limited Annual Financial Report and its Controlled Entitities Year Ended 30 June 2016
Page 67
Recoverable amount is the higher of fair value less costs to sell and value in use. In assessing value in use, the estimated future cash flows are discounted to their present value using a pre-tax discount rate that reflects current market assessments of the time value of money. If the recoverable amount of an asset (or cash-generating unit) is estimated to be less than its carrying amount, the carrying amount of the asset (cash-generating unit) is reduced to its recoverable amount. An impairment loss is recognised immediately in profit or loss. Where an impairment loss subsequently reverses, the carrying amount of the asset (cash-generating unit) is increased to the revised estimate of its recoverable amount, but so that the increased carrying amount does not exceed the carrying amount that would have been determined had no impairment loss been recognised for the asset (cash-generating unit) in prior years. A reversal of an impairment loss is recognised immediately in profit or loss.
a) Composition and movement
50 year renewable 10 year Total
$'000 $'000 $'000 $'000
2016 year:
CostOpening balance 65,045 5,600 3,319 73,964 Additions - - - -
Impairment (27,680) - - (27,680)
Disposals - - - -
Closing balance 37,365 5,600 3,319 46,284
Accumulated amortisationOpening balance - (1,630) (1,414) (3,044) Amortisation expense - (1,999) (1,999)
Disposals - - -
Closing balance - (3,629) (1,414) (5,043)
Net book valueOpening balance 65,045 3,970 1,905 70,920 Closing balance 37,365 1,971 1,905 41,241
Finite life Indefinite
life
For
per
sona
l use
onl
y

Cabcharge Australia Limited Annual Financial Report and its Controlled Entitities Year Ended 30 June 2016
Page 68
e) Impairment considerations
After assessing the recoverable amount of indefinite life taxi plate licences based on value-in-use, using a discounted projected cash flow model, the Group determined that impairment charge of $27,680,000 was required (FY15: nil). In assessing the recoverable amount of such licences, the Group has applied average earning growth forecasts of between -3.0% to 2.2% (2015: between 1.5% to 2.5%) for each of the next five years, long term growth rates of 2.35% (2015: 2.5%) into perpetuity and a pre-tax discount rate of 11.8% (2015: 8.3%). This long term growth rate reflects the general estimated long term Australian economic growth and the discount rate is based on Australian market assumptions for the risk free rate, the market risk premium, the cost of debt and the beta.
15. Goodwill Accounting policies Goodwill arising on the acquisition of a subsidiary is included in intangible assets. For the measurement of goodwill at initial recognition, see Note 10. Goodwill is subsequently measured at cost less accumulated impairment losses. In respect of equity accounted investees, the carrying amount of goodwill is included in the carrying amount of the investment. For the purpose of impairment testing, goodwill is allocated to each of the Group’s cash-generating units expected to benefit from the synergies of the combination. Cash-generating units to which goodwill has been allocated are tested for impairment annually, or more frequently when there is an indication that the unit may be impaired. If the recoverable amount of the cash-generating unit is less than the carrying amount of the unit, the impairment loss is allocated first to reduce the carrying amount of any goodwill allocated to the unit and then to the other assets of the unit pro-rata on the basis of the carrying amount of each asset in the unit. An impairment loss recognised for goodwill is not reversed in a subsequent period.
50 year renewable 10 year Total
$'000 $'000 $'000 $'000
2015 year:
CostOpening balance 65,045 5,600 3,319 73,964 Additions - - - -
Disposals - - - -
Closing balance 65,045 5,600 3,319 73,964
Accumulated amortisationOpening balance - (1,536) (1,045) (2,581) Amortisation expense - (94) (369) (463)
Disposals - - - -
Closing balance - (1,630) (1,414) (3,044)
Net book valueOpening balance 65,045 4,064 2,274 71,383 Closing balance 65,045 3,970 1,905 70,920
Indefinite
life
Finite life
For
per
sona
l use
onl
y

Cabcharge Australia Limited Annual Financial Report and its Controlled Entitities Year Ended 30 June 2016
Page 69
On disposal of a subsidiary, the attributable amount of goodwill is included in the determination of the profit or loss on disposal. Impairment testing Goodwill is tested for impairment annually, and whenever there is any indication that the asset may be impaired. Recoverable amount is the higher of fair value less costs to sell and value in use. In assessing value in use, the estimated future cash flows are discounted to their present value using a pre-tax discount rate that reflects current market assessments of the time value of money. If the recoverable amount of an asset (or cash-generating unit) is estimated to be less than its carrying amount, the carrying amount of the asset (cash-generating unit) is reduced to its recoverable amount. An impairment loss is recognised immediately in profit or loss. An impairment loss in respect of goodwill is not reversed.
Impairment considerations Goodwill is allocated to the Group’s Cash Generating Units (CGU) as set out below and assessment of the recoverable amount for each CGU has been performed on a value-in-use basis using discounted cash flow projections. To determine value-in-use, free cash flows have been projected for five years based on actual operating results for the current year (between -18.7% to 9.7% annual growth) plus a long term growth rate of 2.35% after 5 years. A pre-tax discount rate of 10.4% was applied in determining recoverable amount. This long term growth rate reflects the general estimated long term Australian economic growth and the discount rate is based on Australian market assumptions for the risk free rate, the market risk premium, the cost of debt, the risk of the specific CGU and the beta. For the purpose of impairment testing, goodwill is allocated to groups of CGU, according to business operation and / or geography of operation, which represent the lowest level at which the goodwill is monitored for internal management purposes.
For more information about the goodwill additions through acquisition, see Note 10.
2016 2015 2016 2015$'000 $'000 $'000 $'000
Cabcharge Australia Limited CAB 5,405 5,405 - - Combined Communications Network CCN 3,572 3,572 - - Black Cabs Combined BCC 6,272 6,055 - -
15,249 15,032 - -
Impairment lossCarrying valueCGU
CAB CCN BCC Total
$'000 $'000 $'000 $'000
2016 year:
CostOpening balance 5,405 3,572 6,055 15,032 Additions through acquisition - - 217 217
Closing balance 5,405 3,572 6,272 15,249 For
per
sona
l use
onl
y
Cabcharge Australia Limited Annual Financial Report and its Controlled Entitities Year Ended 30 June 2016
Page 70
16. Intellectual property Accounting policies Intangible assets acquired in a business combination Intangible assets acquired in a business combination primarily relating to customer contracts, trademarks and brand names are identified and recognised separately from goodwill where they satisfy the definition of an intangible asset and their fair values can be measured reliably. The cost of such intangible assets is their fair value at the acquisition date. Trademarks and brand names are considered to have indefinite useful lives and such assets are tested for impairment in accordance with the policy below.
Capitalised development costs Development activities involve a plan or design for the production of new or substantially improved products and processes. Development expenditure is capitalised only if development costs can be measured reliably, the product or process is technically and commercially feasible, future economic benefits are probable, and the Group intends to and has sufficient resources to complete development and to use or sell the asset. The expenditure capitalised includes the cost of materials, direct labour, borrowing and overhead costs that are directly attributable to preparing the asset for its intended use. Other development expenditure is recognised in profit or loss when incurred. Capitalised development expenditure is measured at cost less accumulated amortisation and impairment losses. Impairment testing Intangible assets with indefinite useful lives are tested for impairment annually, and whenever there is any indication that the asset may be impaired. Recoverable amount is the higher of fair value less costs to sell and value in use. In assessing value in use, the estimated future cash flows are discounted to their present value using a pre-tax discount rate that reflects current market assessments of the time value of money. If the recoverable amount of an asset (or cash-generating unit) is estimated to be less than its carrying amount, the carrying amount of the asset (cash-generating unit) is reduced to its recoverable amount. An impairment loss is recognised immediately in profit or loss. Where an impairment loss subsequently reverses, the carrying amount of the asset (cash-generating unit) is increased to the revised estimate of its recoverable amount, but so that the increased carrying amount does not exceed the carrying amount that would have been determined had no impairment loss been recognised for the asset (cash-generating unit) in prior years. A reversal of an impairment loss is recognised immediately in profit or loss.
Impairment considerations The recoverable amount of trademarks and brand names was estimated based on the present value of the future cash flows expected to be derived from the usage of trademarks and brand names, using pre-tax discount rate of 10.4%, an average growth rate of 2.35% over the next five years and long term growth rate of 2.35%.
For
per
sona
l use
onl
y
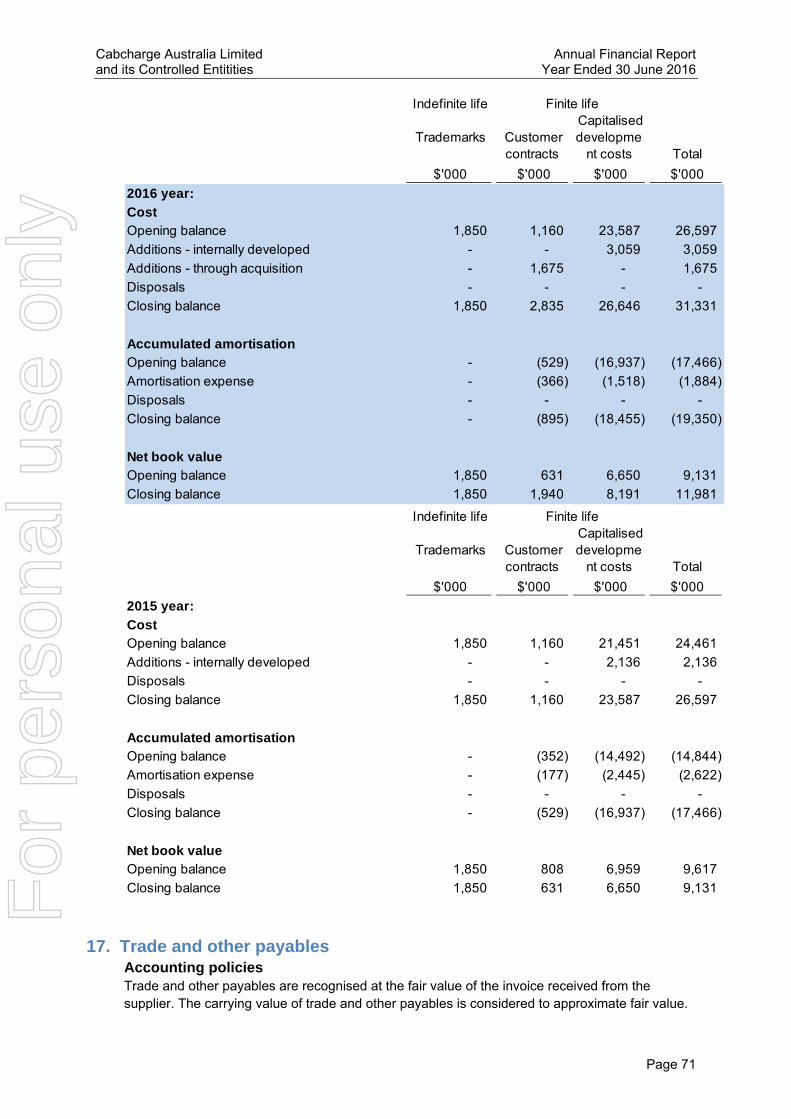
Cabcharge Australia Limited Annual Financial Report and its Controlled Entitities Year Ended 30 June 2016
Page 71
17. Trade and other payables Accounting policies Trade and other payables are recognised at the fair value of the invoice received from the supplier. The carrying value of trade and other payables is considered to approximate fair value.
Indefinite life
Trademarks Customer contracts
Capitalised developme
nt costs Total
$'000 $'000 $'000 $'000
2016 year:
CostOpening balance 1,850 1,160 23,587 26,597
Additions - internally developed - - 3,059 3,059
Additions - through acquisition - 1,675 - 1,675
Disposals - - - -
Closing balance 1,850 2,835 26,646 31,331
Accumulated amortisationOpening balance - (529) (16,937) (17,466)
Amortisation expense - (366) (1,518) (1,884)
Disposals - - - -
Closing balance - (895) (18,455) (19,350)
Net book valueOpening balance 1,850 631 6,650 9,131
Closing balance 1,850 1,940 8,191 11,981
Finite life
Indefinite life
Trademarks Customer contracts
Capitalised developme
nt costs Total
$'000 $'000 $'000 $'000
2015 year:
CostOpening balance 1,850 1,160 21,451 24,461
Additions - internally developed - - 2,136 2,136
Disposals - - - -
Closing balance 1,850 1,160 23,587 26,597
Accumulated amortisationOpening balance - (352) (14,492) (14,844)
Amortisation expense - (177) (2,445) (2,622)
Disposals - - - -
Closing balance - (529) (16,937) (17,466)
Net book valueOpening balance 1,850 808 6,959 9,617
Closing balance 1,850 631 6,650 9,131
Finite life
For
per
sona
l use
onl
y

Cabcharge Australia Limited Annual Financial Report and its Controlled Entitities Year Ended 30 June 2016
Page 72
Good and Services Tax (GST) Payables in the balance sheet are shown inclusive of GST.
For more information about the Group’s exposure to liquidity risk, see Note 31.
18. Loans and borrowings Accounting policies Loans and borrowings are recognised initially at fair value, being the consideration received, less directly attributable transaction costs, with subsequent measurement at amortised cost using the effective interest rate method.
a) Composition
b) Disclosure in the Consolidated Statement of Financial
Position
The unsecured loans are at-call and bear variable interest rates at 2%. All bank borrowings are denominated in Australian dollars. The bank borrowings are secured by a registered first mortgage over all commercial properties and first registered charge over the fixed and floating assets of the Group. The bank borrowing facility is a revolving facility and is reviewed annually with the bank. The total bank borrowing of $106m as at 30 June 2016 is repayable in the 2018 financial year. Bank borrowings bear interest at rates from 3.35% to 3.7%. In August 2016, the Company entered into agreements with its lending banks to extend its current finance facility term for a further two years from 1 July 2017 to 1 July 2019. The Company also reduced the finance facility limits from $200 million to $160 million given an extended period of operating significantly within our credit facility levels and recognising the commitment fee cost of unutilised lines of credit. For more information about the Group’s exposure to interest rate and liquidity risk, see Note 31.
2016 2015$'000 $'000
Trade payables 9,486 11,233 Other payables and accruals 9,090 12,357 Unearned revenue 4,550 4,415
23,126 28,005
2016 2015
$'000 $'000Unsecured loans 3,663 5,199 Bank borrowings 106,000 123,000
109,663 128,199
Current liability 3,663 5,199
Non-current liability 106,000 123,000
109,663 128,199
For
per
sona
l use
onl
y
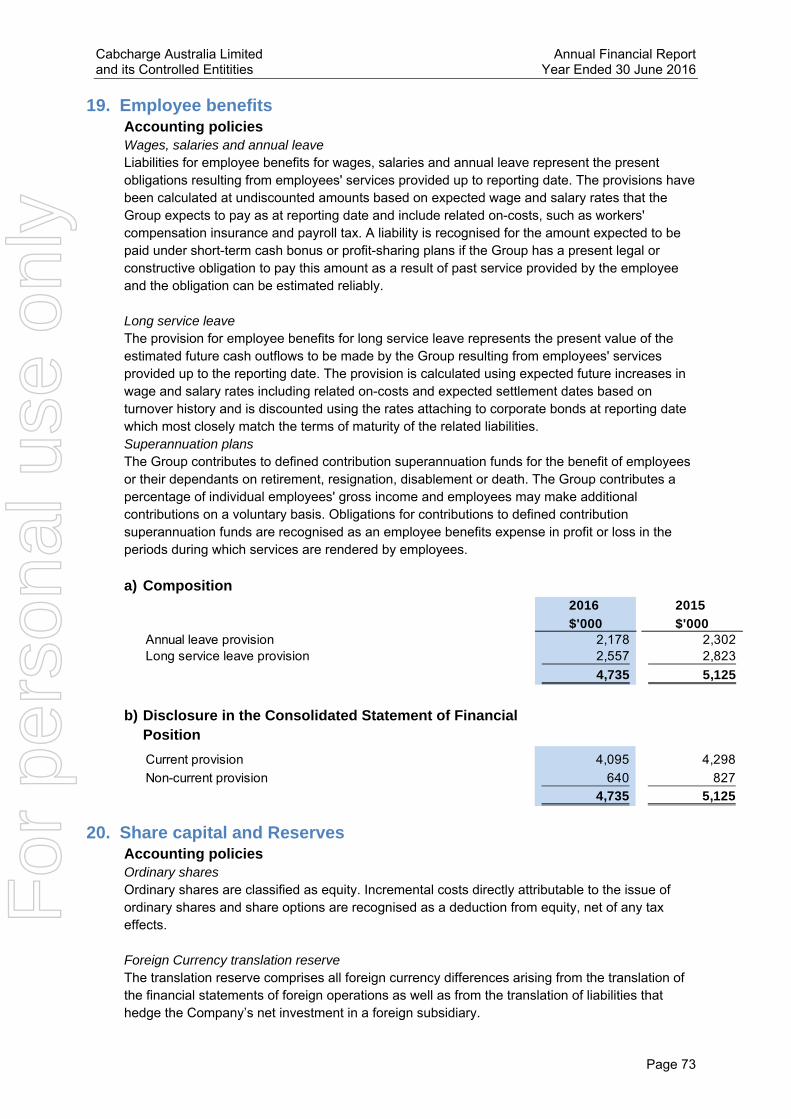
Cabcharge Australia Limited Annual Financial Report and its Controlled Entitities Year Ended 30 June 2016
Page 73
19. Employee benefits Accounting policies Wages, salaries and annual leave Liabilities for employee benefits for wages, salaries and annual leave represent the present obligations resulting from employees' services provided up to reporting date. The provisions have been calculated at undiscounted amounts based on expected wage and salary rates that the Group expects to pay as at reporting date and include related on-costs, such as workers' compensation insurance and payroll tax. A liability is recognised for the amount expected to be paid under short-term cash bonus or profit-sharing plans if the Group has a present legal or constructive obligation to pay this amount as a result of past service provided by the employee and the obligation can be estimated reliably. Long service leave The provision for employee benefits for long service leave represents the present value of the estimated future cash outflows to be made by the Group resulting from employees' services provided up to the reporting date. The provision is calculated using expected future increases in wage and salary rates including related on-costs and expected settlement dates based on turnover history and is discounted using the rates attaching to corporate bonds at reporting date which most closely match the terms of maturity of the related liabilities. Superannuation plans The Group contributes to defined contribution superannuation funds for the benefit of employees or their dependants on retirement, resignation, disablement or death. The Group contributes a percentage of individual employees' gross income and employees may make additional contributions on a voluntary basis. Obligations for contributions to defined contribution superannuation funds are recognised as an employee benefits expense in profit or loss in the periods during which services are rendered by employees.
a) Composition
b) Disclosure in the Consolidated Statement of Financial
Position
20. Share capital and Reserves Accounting policies Ordinary shares Ordinary shares are classified as equity. Incremental costs directly attributable to the issue of ordinary shares and share options are recognised as a deduction from equity, net of any tax effects. Foreign Currency translation reserve The translation reserve comprises all foreign currency differences arising from the translation of the financial statements of foreign operations as well as from the translation of liabilities that hedge the Company’s net investment in a foreign subsidiary.
2016 2015
$'000 $'000Annual leave provision 2,178 2,302 Long service leave provision 2,557 2,823
4,735 5,125
Current provision 4,095 4,298
Non-current provision 640 827
4,735 5,125
For
per
sona
l use
onl
y

Cabcharge Australia Limited Annual Financial Report and its Controlled Entitities Year Ended 30 June 2016
Page 74
Hedging reserve The hedging reserve comprises the effective portion of the cumulative net change in the fair value of cash flow hedging instruments related to hedged transactions that have not yet occurred. Fair value reserve The fair value reserve comprises the cumulative net change in the fair value of available-for-sale financial assets until the investment is derecognised or impaired. Employee Compensation Reserve The fair value of LTI plans granted is recognised in the employee compensation reserve over the vesting period.
a) Composition and movement in issued capital (number of shares)
b) Composition and movement in share capital (dollars)
c) Options over unissued shares No options were granted during the year and there were no options outstanding at the end of the financial year. Performance rights were awarded during the year and they may be converted into ordinary shares, subject to Board’s discretion.
d) Terms and conditions applicable to ordinary shares Holders of ordinary shares are entitled to receive dividends as declared from time to time and are entitled to one vote per share at shareholders' meetings. In the event of winding up of the Company, ordinary shareholders rank after all other shareholders and creditors and are fully entitled to any proceeds of liquidation. The Company does not have authorised capital or par value in respect of its issued shares. All issued shares are fully paid.
2016 2015(number) (number)
Composition of issued capitalFully paid ordinary shares 120,430,683 120,430,683
2016 2015
$'000 $'000
Composition of share capital
Fully paid ordinary shares 138,325 138,325
For
per
sona
l use
onl
y

Cabcharge Australia Limited Annual Financial Report and its Controlled Entitities Year Ended 30 June 2016
Page 75
e) Composition and movement in reserves
21. Dividends Accounting policies Dividends Dividends are recognised as a liability in the period in which they are declared.
The following fully franked dividends were paid, franked at a tax rate of 30%.
Dividends cents per share - paid / payable
The final 10 cents per share fully franked dividend was declared after balance date and has not been provided for. It is scheduled for payment on 31 October 2016. The declaration and
Foreign currency
translation reserve
Hedging reserve
Capital reserve
Fair value reserve
Employee compensation reserve Total
$'000 $'000 $'000 $'000 $'000 $'000
2016 year:Opening balance (1,010) (689) (914) 3,303 78 768 Net change in fair value of available-for-sale financial assets, net of tax - - - - - -
Net change in fair value of available-for-sale financial assets transfered to profit or loss, net of tax - - - (3,312) - (3,312) Effective portion of change in fair value of cash flow hedge - 603 - - - 603 Share of associates' change in reserve, net of tax (3,035) - - - - (3,035) Share-based payments - - - - 91 91
Closing balance (4,045) (86) (914) (9) 169 (4,885)
2015 year:Opening balance (4,104) (625) (914) 2,124 - (3,519) Net change in fair value of available-for-sale financial assets, net of tax - - - 1,269 - 1,269
Net change in fair value of available-for-sale financial assets transfered to profit or loss, net of tax - - - (90) - (90) Effective portion of change in fair value of cash flow hedge - (64) - - (64) Share of associates' change in reserve, net of tax 3,094 - - - - 3,094 Share-based payments - - - - 78 78
Closing balance (1,010) (689) (914) 3,303 78 768
2016 2015
$'000 $'000 2016 year interim - 10.0 cents per share 12,043 - 2015 year final - 10.0 cents per share 12,043 - 2015 year interim - 10.0 cents per share - 12,043 2014 year final - 10.0 cents per share - 12,043
Total dividends paid 24,086 24,086
2016 2015
Interim 10.00 10.00
Final 10.00 10.00
Total 20.00 20.00
For
per
sona
l use
onl
y

Cabcharge Australia Limited Annual Financial Report and its Controlled Entitities Year Ended 30 June 2016
Page 76
subsequent payment of dividends has no income tax consequences to the Company. The financial effect of these dividends has not been brought to account in the financial statements for the financial year ended 30 June 2016 and will be recognised in subsequent financial statements.
22. Earnings per share (EPS) Accounting policies Basic earnings per share (EPS) is calculated by dividing the profit attributable to equity holders for the reporting period by the weighted average number of ordinary shares outstanding during the period. Diluted EPS is calculated by dividing the profit attributable to equity holders for the reporting period by the weighted average number of ordinary shares outstanding including dilutive potential ordinary shares.
23. Dividend franking balance
The above available amounts are based on the balance of the dividend franking account at year-end adjusted for: (a) franking credits that will arise from the payment of the current tax liabilities; (b) franking debits that will arise from the payment of dividends recognised as a liability at the
year-end; (c) franking credits that will arise from the receipt of dividends recognised as receivables by the
tax consolidated group at the year-end; and (d) franking credits that the entity may be prevented from distributing in subsequent years.
The ability to utilise the franking credits is dependent upon there being sufficient available profits to declare dividends. The impact on the dividend franking account of dividends proposed after the balance sheet date but not recognised as a liability is to reduce it by $5,161,000 (2015: $5,161,000). In accordance with the tax consolidation legislation, the Company as the head
2016 2015Consolidated profit attributable to ordinary shareholders of the Company (in thousands of AUD) 25,616 46,548
Weighted average number of fully paid ordinary shares outstanding during the year used in calculation of basic EPS (in thousands of shares) 120,431 120,431
Any potential dilution in Cabcharge’s earnings per share which might arise following the exercise of the LTI awards is immaterial given the number of existing shares on issue.
2016 2015
Basic EPS 21.3 cents 38.7 centsDiluted EPS 21.3 cents 38.7 cents
2016 2015
$'000 $'000 Balance at the end of the financial year including franking credits arising from income tax payable in respect of the financial year.
78,126 71,841
For
per
sona
l use
onl
y

Cabcharge Australia Limited Annual Financial Report and its Controlled Entitities Year Ended 30 June 2016
Page 77
entity in the tax consolidated group has also assumed the benefit of $78,126,000 (2015: $71,841,000) franking credits.
24. Parent entity disclosures As at, and throughout, the financial year ended 30 June 2016 the parent entity of the Group was Cabcharge Australia Limited.
Parent entity financial guarantees The Company's policy is to provide financial guarantees only to wholly-owned subsidiaries and associates. An associate of the Company (ComfortDelGro Cabcharge Pty Ltd) has a secured loan facility of $8.4 million provided by an unrelated financial institution. The Company has guaranteed the loan to the extent of its 49% ownership interest in the associate. The fair value of financial guarantee contract is estimated to be zero based on the Directors' assessment of the probability of a default event.
Parent entity capital expenditure commitments The Company has not entered into any contracts to purchase plant and equipment for which amounts have not been provided as at 30 June 2016 (2015: nil).
Parent entity guarantees in respect of the debts of its subsidiaries The parent entity has entered into a Deed of Cross Guarantee with the effect that the Company guarantees debts in respect of certain subsidiaries.
2016 2015
$'000 $'000
Result of the parent entity
Profit for the year 32,814 39,785
Other comprehensive income (1,161) 1,166
Total comprehensive income for the year 31,653 40,951
Parent Entity
Financial position of parent entity at year end
Current assets 86,461 83,640
Non-current assets 445,229 458,541
Total assets 531,690 542,181
Current liabilities 7,982 6,867
Non-current liabilities 247,774 264,886
Total liabilities 255,756 271,753
Total equity of the parent entity comprising of:
Share capital 138,325 138,325
Reserves 168 3,390
Retained earnings 137,441 128,713
Total equity 275,934 270,428
For
per
sona
l use
onl
y
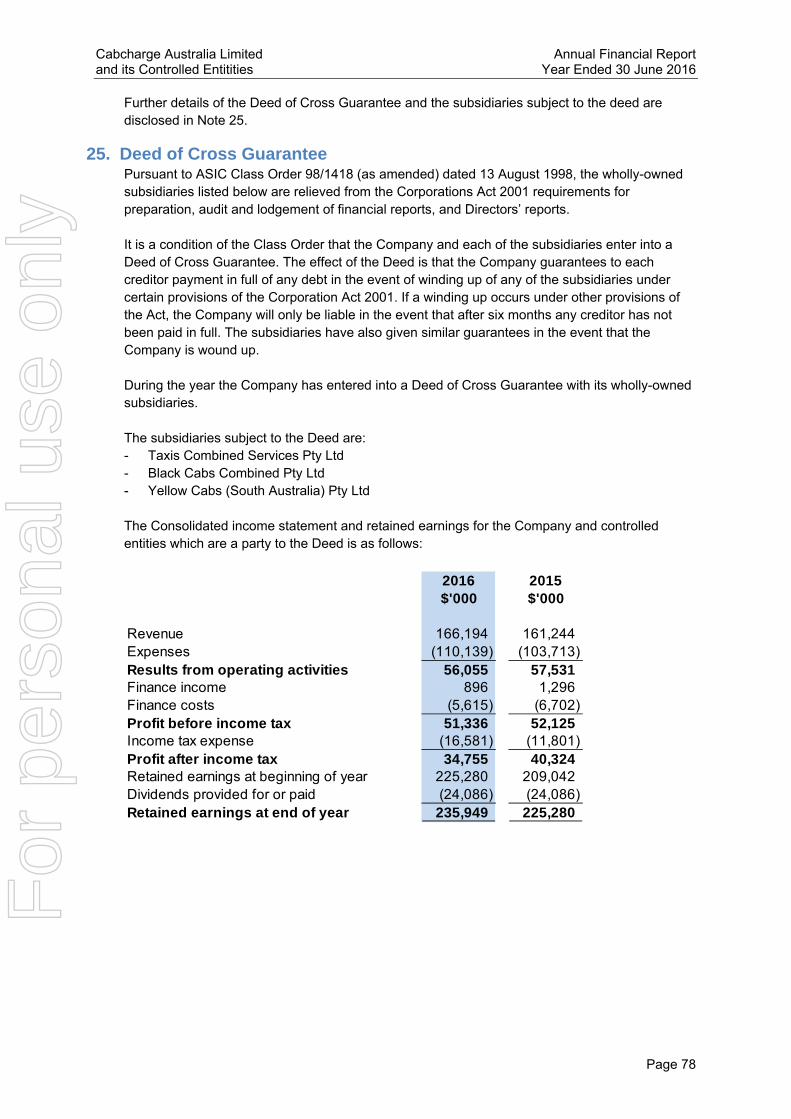
Cabcharge Australia Limited Annual Financial Report and its Controlled Entitities Year Ended 30 June 2016
Page 78
Further details of the Deed of Cross Guarantee and the subsidiaries subject to the deed are disclosed in Note 25.
25. Deed of Cross Guarantee Pursuant to ASIC Class Order 98/1418 (as amended) dated 13 August 1998, the wholly-owned subsidiaries listed below are relieved from the Corporations Act 2001 requirements for preparation, audit and lodgement of financial reports, and Directors’ reports. It is a condition of the Class Order that the Company and each of the subsidiaries enter into a Deed of Cross Guarantee. The effect of the Deed is that the Company guarantees to each creditor payment in full of any debt in the event of winding up of any of the subsidiaries under certain provisions of the Corporation Act 2001. If a winding up occurs under other provisions of the Act, the Company will only be liable in the event that after six months any creditor has not been paid in full. The subsidiaries have also given similar guarantees in the event that the Company is wound up. During the year the Company has entered into a Deed of Cross Guarantee with its wholly-owned subsidiaries. The subsidiaries subject to the Deed are: - Taxis Combined Services Pty Ltd - Black Cabs Combined Pty Ltd - Yellow Cabs (South Australia) Pty Ltd The Consolidated income statement and retained earnings for the Company and controlled entities which are a party to the Deed is as follows:
2016 2015$'000 $'000
Revenue 166,194 161,244 Expenses (110,139) (103,713) Results from operating activities 56,055 57,531 Finance income 896 1,296 Finance costs (5,615) (6,702) Profit before income tax 51,336 52,125 Income tax expense (16,581) (11,801) Profit after income tax 34,755 40,324 Retained earnings at beginning of year 225,280 209,042 Dividends provided for or paid (24,086) (24,086) Retained earnings at end of year 235,949 225,280
For
per
sona
l use
onl
y

Cabcharge Australia Limited Annual Financial Report and its Controlled Entitities Year Ended 30 June 2016
Page 79
The Consolidated financial position for the Company and controlled entities which are a party to the Deed is as follows:
26. Related Party and Key Management Personnel (KMP) disclosures Apart from the details disclosed in this note, no key management personnel (KMP) have entered into a material contract with the Company or the Group since the end of the previous financial year and there are no material contracts involving key management personnel interests existing at year end.
2016 2015$'000 $'000
CURRENT ASSETSCash and cash equivalents 9,192 19,731 Trade and other receivables 61,515 48,257 Inventories 1,213 1,556 Other current assets 982 1,177 TOTAL CURRENT ASSETS 72,902 70,721
NON-CURRENT ASSETSTrade and other receivables 1,140 2,388 Advances to associates 18,812 18,812 Investments 363,522 369,644 Property, plant and equipment 30,849 29,455 Net deferred tax assets 1,611 359 Taxi plate licences 25,736 43,987 Goodwill 14,392 14,175 Intellectual property 6,131 5,341 TOTAL NON-CURRENT ASSETS 462,193 484,161 TOTAL ASSETS 535,095 554,882
CURRENT LIABILITIESTrade and other payables 20,534 32,902 Interest rate swaps 123 985 Current tax liabilities 4,103 1,506 Employee benefits 3,390 3,505 TOTAL CURRENT LIABILITIES 28,150 38,898
NON-CURRENT LIABILITIESNon-interest bearing liabilities 25,582 25,582 Loans and borrowings 106,000 123,000 Employee benefits 520 688 TOTAL NON-CURRENT LIABILITIES 132,102 149,270 TOTAL LIABILITIES 160,252 188,168 NET ASSETS 374,843 366,714
EQUITYShare capital 138,325 138,325 Reserves 569 3,109 Retained earnings 235,949 225,280 TOTAL EQUITY 374,843 366,714
For
per
sona
l use
onl
y

Cabcharge Australia Limited Annual Financial Report and its Controlled Entitities Year Ended 30 June 2016
Page 80
a) KMP compensation (including Non-Executive Directors)
The Company has taken advantage of the relief provided by Corporations Act Regulation 2M.3.03 and has transferred the detailed remuneration disclosures to the Directors' Report. The relevant information can be found in the Remuneration Report within the Directors' Report.
b) Loans to Directors and other KMP
No loans are made to Directors or other KMP.
c) Transactions with Directors and other KMP The Group has no transactions with related parties in the reporting period.
d) Other related party transactions
(i) The shareholders in CDC have loaned funds to CDC, in amounts pro-rata to their
respective shareholdings, for bus acquisitions and other capital expenditures. The amount receivable by the Group is $18,812,086 reflecting 49% of the total shareholder loans. The shareholder loans shall be repaid after external bank borrowings are repaid.
27. Remuneration of auditors
2016 2015
$ $Short-term employee benefits - salary, fees, non-cash benefits and cash bonus 3,011,828 3,611,374 Post-employment benefits - superannuation 191,260 207,983 Other long-term benefits 34,041 62,211 Termination benefits 18,355 -
Share-based payment expense 91,154 77,520
3,346,638 3,959,088
Relationship 2016 2015Related parties $ $ComfortDelGro Cabcharge Pty Ltd (CDC) Associate (i) 18,812,086 18,812,086
Nature of transacti
on
2016 2015$ $
Audit servicesAuditors of the Company - KPMG Australia
Audit and review of financial reports 349,000 358,300 Other regulatory services 65,600 14,200
Audit and review of financial reports 75,000 50,000
Other servicesAuditors of the Company - KPMG Australia
Taxation services 107,121 75,872 Other assurance services - 8,660
Others 236,282 75,520 833,003 582,552
Other auditors
Other auditors
For
per
sona
l use
onl
y

Cabcharge Australia Limited Annual Financial Report and its Controlled Entitities Year Ended 30 June 2016
Page 81
28. Particulars relating to controlled entities
Group Interest %
Group Interest %
2016 2015
135466 Pty Ltd 100 100
ABC Radio Taxi Pty Ltd 100 100
Access Communications Net Pty Ltd 100 100
Arrow Taxi Services Pty Ltd 100 100
Austaxi Group Pty Ltd 100 100
Black Cabs Combined Car Sales Pty Ltd 100 100
Black Cabs Combined Pty Ltd 100 100
Cab Access Pty Ltd 100 100
Cabcharge (Investments) Pty Ltd 100 100
Carbodies Australia Pty Ltd 100 100
Combined Communications Network Pty Ltd 100 100
EFT Solutions Pty Ltd 100 100
Enterprise Speech Recognition Pty Ltd 100 100
Go Taxis Pty Ltd 100 100
Helpline Australia Pty Ltd 100 100
Mact Franchise Pty Ltd 100 100
Mact Network Pty Ltd 100 100
Mact Rental Pty Ltd 100 100
Maxi Taxi (Australia) Pty Ltd 100 100
Melbourne Taxi Cab Service Pty Ltd 100 100
Newcastle Taxis Pty Ltd 100 100
North Suburban Taxis (Vic) Pty Ltd 100 100
Silver Service (Victoria) Pty Ltd 100 100
Silver Service Taxis Pty Ltd 100 100
South Western Cabs (Radio Room) Pty Ltd 100 100
Taxi Data Australia Pty Ltd 58 58
Taxi Services Management (Newcastle) Pty Ltd 100 100
TaxiProp Pty Ltd 100 100
Taxis Australia Pty Ltd 58 58
Taxis Combined Services (Vic) Pty Ltd 100 100
Taxis Combined Services Pty Ltd 100 100
Taxitech Pty Ltd 100 100
TCS Communications (Vic) Pty Ltd - 100
Thirteen Hundred Pty Ltd 100 100
Voci Asia Pacific Pty Ltd 100 100
Yellow Cabs of Sydney Pty Ltd 100 100
Yellow Cabs South Australia Pty Ltd 100 100
Yellow Cabs Victoria Pty Ltd 100 100
Cabcharge (Europe) Ltd 100 100
Cabcharge International Limited - 100
Cabcharge New Zealand Limited 100 100
Cabcharge North America Ltd 93 93
For
per
sona
l use
onl
y
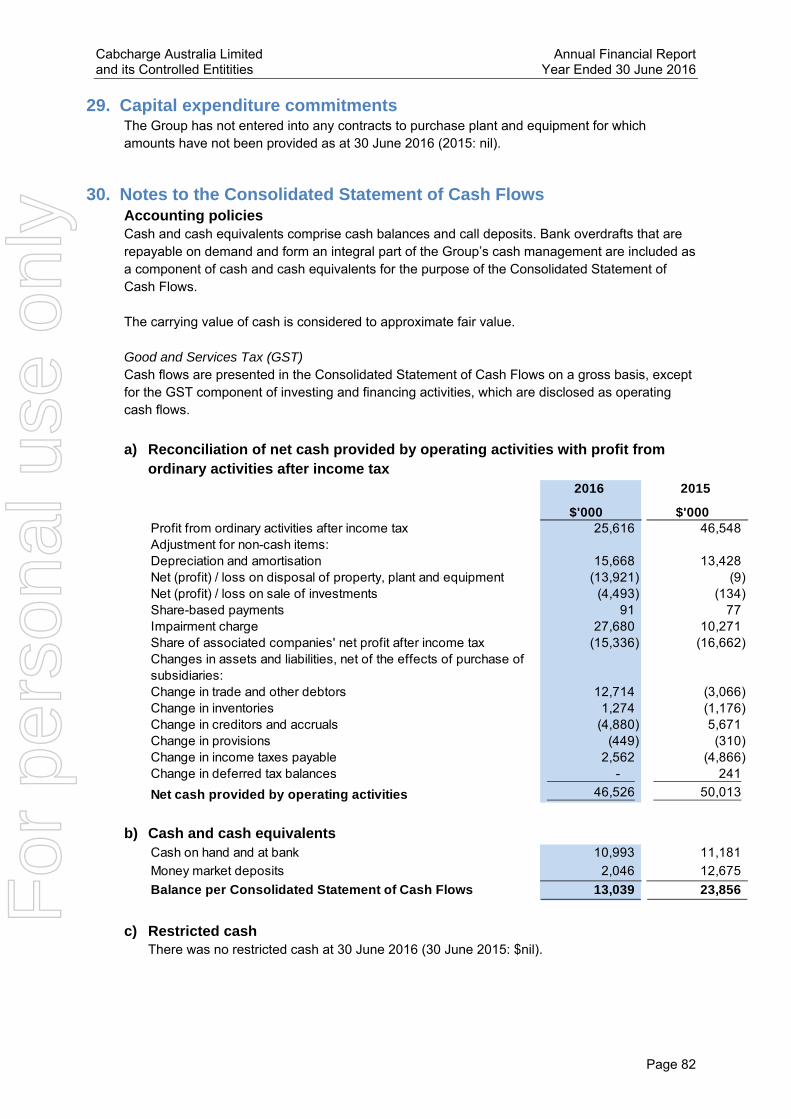
Cabcharge Australia Limited Annual Financial Report and its Controlled Entitities Year Ended 30 June 2016
Page 82
29. Capital expenditure commitments The Group has not entered into any contracts to purchase plant and equipment for which amounts have not been provided as at 30 June 2016 (2015: nil).
30. Notes to the Consolidated Statement of Cash Flows Accounting policies Cash and cash equivalents comprise cash balances and call deposits. Bank overdrafts that are repayable on demand and form an integral part of the Group’s cash management are included as a component of cash and cash equivalents for the purpose of the Consolidated Statement of Cash Flows. The carrying value of cash is considered to approximate fair value. Good and Services Tax (GST) Cash flows are presented in the Consolidated Statement of Cash Flows on a gross basis, except for the GST component of investing and financing activities, which are disclosed as operating cash flows.
a) Reconciliation of net cash provided by operating activities with profit from
ordinary activities after income tax
b) Cash and cash equivalents
c) Restricted cash There was no restricted cash at 30 June 2016 (30 June 2015: $nil).
2016 2015
$'000 $'000 Profit from ordinary activities after income tax 25,616 46,548 Adjustment for non-cash items:Depreciation and amortisation 15,668 13,428 Net (profit) / loss on disposal of property, plant and equipment (13,921) (9) Net (profit) / loss on sale of investments (4,493) (134) Share-based payments 91 77 Impairment charge 27,680 10,271 Share of associated companies' net profit after income tax (15,336) (16,662) Changes in assets and liabilities, net of the effects of purchase of subsidiaries:Change in trade and other debtors 12,714 (3,066) Change in inventories 1,274 (1,176) Change in creditors and accruals (4,880) 5,671 Change in provisions (449) (310) Change in income taxes payable 2,562 (4,866) Change in deferred tax balances - 241
Net cash provided by operating activities 46,526 50,013
Cash on hand and at bank 10,993 11,181
Money market deposits 2,046 12,675
Balance per Consolidated Statement of Cash Flows 13,039 23,856 For
per
sona
l use
onl
y
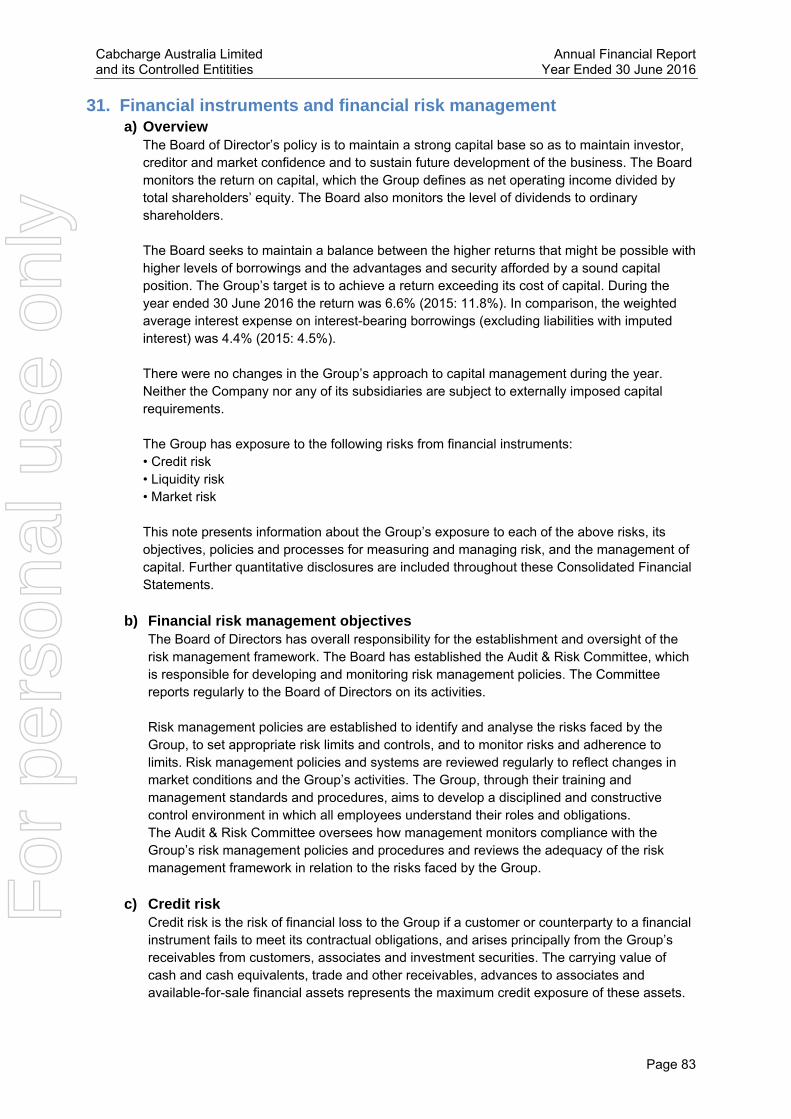
Cabcharge Australia Limited Annual Financial Report and its Controlled Entitities Year Ended 30 June 2016
Page 83
31. Financial instruments and financial risk management a) Overview
The Board of Director’s policy is to maintain a strong capital base so as to maintain investor, creditor and market confidence and to sustain future development of the business. The Board monitors the return on capital, which the Group defines as net operating income divided by total shareholders’ equity. The Board also monitors the level of dividends to ordinary shareholders. The Board seeks to maintain a balance between the higher returns that might be possible with higher levels of borrowings and the advantages and security afforded by a sound capital position. The Group’s target is to achieve a return exceeding its cost of capital. During the year ended 30 June 2016 the return was 6.6% (2015: 11.8%). In comparison, the weighted average interest expense on interest-bearing borrowings (excluding liabilities with imputed interest) was 4.4% (2015: 4.5%). There were no changes in the Group’s approach to capital management during the year. Neither the Company nor any of its subsidiaries are subject to externally imposed capital requirements. The Group has exposure to the following risks from financial instruments: • Credit risk • Liquidity risk • Market risk This note presents information about the Group’s exposure to each of the above risks, its objectives, policies and processes for measuring and managing risk, and the management of capital. Further quantitative disclosures are included throughout these Consolidated Financial Statements.
b) Financial risk management objectives The Board of Directors has overall responsibility for the establishment and oversight of the risk management framework. The Board has established the Audit & Risk Committee, which is responsible for developing and monitoring risk management policies. The Committee reports regularly to the Board of Directors on its activities. Risk management policies are established to identify and analyse the risks faced by the Group, to set appropriate risk limits and controls, and to monitor risks and adherence to limits. Risk management policies and systems are reviewed regularly to reflect changes in market conditions and the Group’s activities. The Group, through their training and management standards and procedures, aims to develop a disciplined and constructive control environment in which all employees understand their roles and obligations. The Audit & Risk Committee oversees how management monitors compliance with the Group’s risk management policies and procedures and reviews the adequacy of the risk management framework in relation to the risks faced by the Group.
c) Credit risk Credit risk is the risk of financial loss to the Group if a customer or counterparty to a financial instrument fails to meet its contractual obligations, and arises principally from the Group’s receivables from customers, associates and investment securities. The carrying value of cash and cash equivalents, trade and other receivables, advances to associates and available-for-sale financial assets represents the maximum credit exposure of these assets.
For
per
sona
l use
onl
y

Cabcharge Australia Limited Annual Financial Report and its Controlled Entitities Year Ended 30 June 2016
Page 84
Trade and other receivables The Group’s exposure to credit risk is influenced mainly by the individual characteristics of each customer. The Group minimises concentration of credit risk in relation to trade accounts receivable by undertaking transactions with a large number of customers. However, all the customers are concentrated in Australia. Credit risk in trade receivables is managed in the following ways: - The Audit & Risk Committee has established a credit policy under which each new
customer is analysed individually for creditworthiness before the Group’s standard payment and delivery terms and conditions are offered;
- Payment terms are 28 days; - A risk assessment process is used for customers over 90 days; and - Cash or bank guarantee is obtained where appropriate.
The Group assumes the credit risk for the full value of taxi fares settled through the Cabcharge Payment System (see Note 3).
The Group has established an allowance for impairment that represents their estimate of incurred losses in respect of trade and other receivables and investments. An allowance has been made for estimated irrecoverable amounts from billings. The main component of this allowance is a collective loss component established for groups of similar assets in respect of losses that have been incurred but not yet identified. The collective loss allowance is determined based on historical data of payment statistics for similar financial assets.
Investments The Group limits its exposure to credit risk by investing in liquid securities, unlisted companies which are related to taxi business and having deposits with financial institutions. The investment in unlisted companies was $1,839,000 as at 30 June 2016 (refer Note 9).
Financial Guarantee The Company's policy is to provide financial guarantees only to wholly-owned subsidiaries and associates. An associate of the Company (ComfortDelGro Cabcharge Pty Ltd) has a secured loan facility of $8.4 million provided by an unrelated financial institution. The Company has guaranteed the loan to the extent of its 49% ownership interest in the associate. The fair value of financial guarantee contract is estimated to be zero based on the Directors' assessment of the probability of a default event.
d) Liquidity risk Liquidity risk is the risk that the Group will not be able to meet its financial obligations as they fall due. The Group’s approach to managing liquidity is to ensure, as far as possible, that it will always have sufficient liquidity to meet its liabilities when due, under both normal and stressed conditions, without incurring unacceptable losses or risking damage to the Group’s reputation. The Group undertakes the following activities to ensure that there will be sufficient funds available to meet obligations: - Prepare budgeted annual and monthly cash flows; - Monitor actual cash flows on a daily basis and compare to liquidity requirements; - Maintain sufficient cash on demand to meet 8 weeks of operational expenses; - Maintain standby money market and commercial overdraft facilities; and
For
per
sona
l use
onl
y
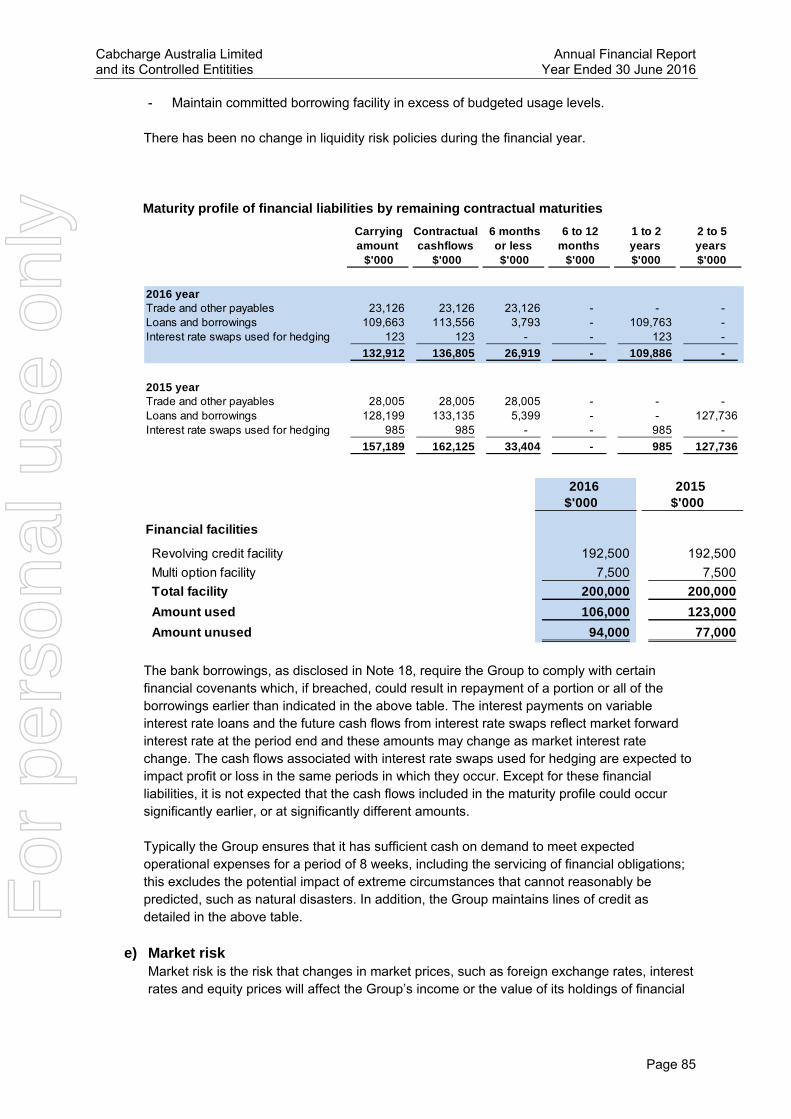
Cabcharge Australia Limited Annual Financial Report and its Controlled Entitities Year Ended 30 June 2016
Page 85
- Maintain committed borrowing facility in excess of budgeted usage levels.
There has been no change in liquidity risk policies during the financial year. Maturity profile of financial liabilities by remaining contractual maturities
The bank borrowings, as disclosed in Note 18, require the Group to comply with certain financial covenants which, if breached, could result in repayment of a portion or all of the borrowings earlier than indicated in the above table. The interest payments on variable interest rate loans and the future cash flows from interest rate swaps reflect market forward interest rate at the period end and these amounts may change as market interest rate change. The cash flows associated with interest rate swaps used for hedging are expected to impact profit or loss in the same periods in which they occur. Except for these financial liabilities, it is not expected that the cash flows included in the maturity profile could occur significantly earlier, or at significantly different amounts. Typically the Group ensures that it has sufficient cash on demand to meet expected operational expenses for a period of 8 weeks, including the servicing of financial obligations; this excludes the potential impact of extreme circumstances that cannot reasonably be predicted, such as natural disasters. In addition, the Group maintains lines of credit as detailed in the above table.
e) Market risk Market risk is the risk that changes in market prices, such as foreign exchange rates, interest rates and equity prices will affect the Group’s income or the value of its holdings of financial
Carrying amount
Contractual cashflows
6 months or less
6 to 12 months
1 to 2 years
2 to 5 years
$'000 $'000 $'000 $'000 $'000 $'000
2016 yearTrade and other payables 23,126 23,126 23,126 - - - Loans and borrowings 109,663 113,556 3,793 - 109,763 - Interest rate swaps used for hedging 123 123 - - 123 -
132,912 136,805 26,919 - 109,886 -
2015 yearTrade and other payables 28,005 28,005 28,005 - - - Loans and borrowings 128,199 133,135 5,399 - - 127,736 Interest rate swaps used for hedging 985 985 - - 985 -
157,189 162,125 33,404 - 985 127,736
2016 2015$'000 $'000
Financial facilities
Revolving credit facility 192,500 192,500
Multi option facility 7,500 7,500
Total facility 200,000 200,000
Amount used 106,000 123,000
Amount unused 94,000 77,000
For
per
sona
l use
onl
y
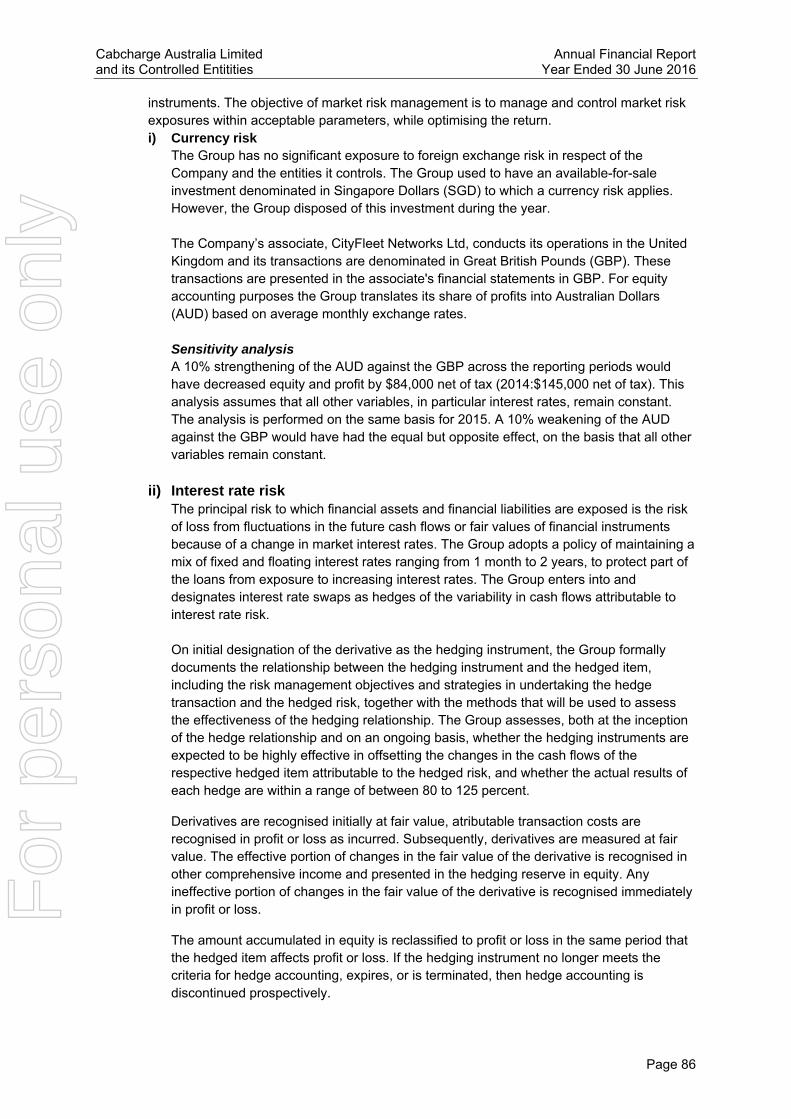
Cabcharge Australia Limited Annual Financial Report and its Controlled Entitities Year Ended 30 June 2016
Page 86
instruments. The objective of market risk management is to manage and control market risk exposures within acceptable parameters, while optimising the return. i) Currency risk
The Group has no significant exposure to foreign exchange risk in respect of the Company and the entities it controls. The Group used to have an available-for-sale investment denominated in Singapore Dollars (SGD) to which a currency risk applies. However, the Group disposed of this investment during the year. The Company’s associate, CityFleet Networks Ltd, conducts its operations in the United Kingdom and its transactions are denominated in Great British Pounds (GBP). These transactions are presented in the associate's financial statements in GBP. For equity accounting purposes the Group translates its share of profits into Australian Dollars (AUD) based on average monthly exchange rates. Sensitivity analysis A 10% strengthening of the AUD against the GBP across the reporting periods would have decreased equity and profit by $84,000 net of tax (2014:$145,000 net of tax). This analysis assumes that all other variables, in particular interest rates, remain constant. The analysis is performed on the same basis for 2015. A 10% weakening of the AUD against the GBP would have had the equal but opposite effect, on the basis that all other variables remain constant.
ii) Interest rate risk The principal risk to which financial assets and financial liabilities are exposed is the risk of loss from fluctuations in the future cash flows or fair values of financial instruments because of a change in market interest rates. The Group adopts a policy of maintaining a mix of fixed and floating interest rates ranging from 1 month to 2 years, to protect part of the loans from exposure to increasing interest rates. The Group enters into and designates interest rate swaps as hedges of the variability in cash flows attributable to interest rate risk. On initial designation of the derivative as the hedging instrument, the Group formally documents the relationship between the hedging instrument and the hedged item, including the risk management objectives and strategies in undertaking the hedge transaction and the hedged risk, together with the methods that will be used to assess the effectiveness of the hedging relationship. The Group assesses, both at the inception of the hedge relationship and on an ongoing basis, whether the hedging instruments are expected to be highly effective in offsetting the changes in the cash flows of the respective hedged item attributable to the hedged risk, and whether the actual results of each hedge are within a range of between 80 to 125 percent.
Derivatives are recognised initially at fair value, atributable transaction costs are recognised in profit or loss as incurred. Subsequently, derivatives are measured at fair value. The effective portion of changes in the fair value of the derivative is recognised in other comprehensive income and presented in the hedging reserve in equity. Any ineffective portion of changes in the fair value of the derivative is recognised immediately in profit or loss.
The amount accumulated in equity is reclassified to profit or loss in the same period that the hedged item affects profit or loss. If the hedging instrument no longer meets the criteria for hedge accounting, expires, or is terminated, then hedge accounting is discontinued prospectively.
For
per
sona
l use
onl
y
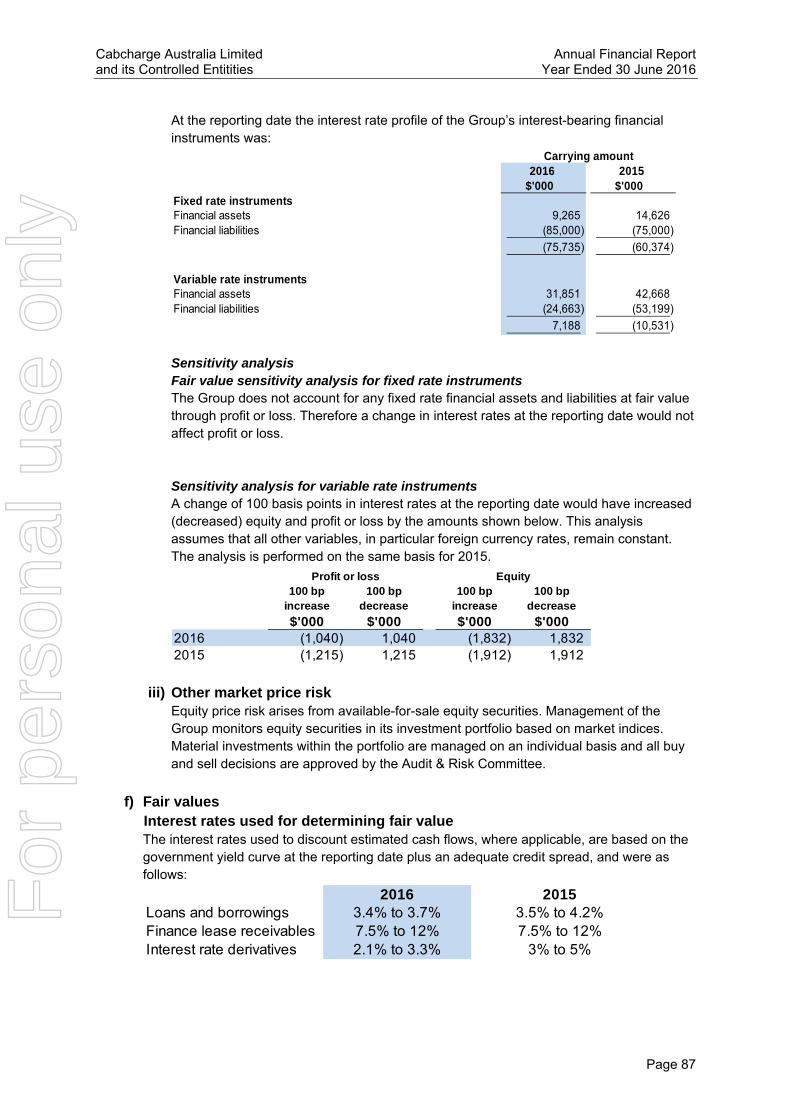
Cabcharge Australia Limited Annual Financial Report and its Controlled Entitities Year Ended 30 June 2016
Page 87
At the reporting date the interest rate profile of the Group’s interest-bearing financial instruments was:
Sensitivity analysis Fair value sensitivity analysis for fixed rate instruments The Group does not account for any fixed rate financial assets and liabilities at fair value through profit or loss. Therefore a change in interest rates at the reporting date would not affect profit or loss. Sensitivity analysis for variable rate instruments A change of 100 basis points in interest rates at the reporting date would have increased (decreased) equity and profit or loss by the amounts shown below. This analysis assumes that all other variables, in particular foreign currency rates, remain constant. The analysis is performed on the same basis for 2015.
iii) Other market price risk Equity price risk arises from available-for-sale equity securities. Management of the Group monitors equity securities in its investment portfolio based on market indices. Material investments within the portfolio are managed on an individual basis and all buy and sell decisions are approved by the Audit & Risk Committee.
f) Fair values
Interest rates used for determining fair value The interest rates used to discount estimated cash flows, where applicable, are based on the government yield curve at the reporting date plus an adequate credit spread, and were as follows:
2016 2015$'000 $'000
Fixed rate instrumentsFinancial assets 9,265 14,626 Financial liabilities (85,000) (75,000)
(75,735) (60,374)
Variable rate instrumentsFinancial assets 31,851 42,668 Financial liabilities (24,663) (53,199)
7,188 (10,531)
Carrying amount
100 bp increase
100 bp decrease
100 bp increase
100 bp decrease
$'000 $'000 $'000 $'0002016 (1,040) 1,040 (1,832) 1,832 2015 (1,215) 1,215 (1,912) 1,912
Profit or loss Equity
Loans and borrowingsFinance lease receivablesInterest rate derivatives
20163.4% to 3.7%7.5% to 12%2.1% to 3.3%
20153.5% to 4.2%7.5% to 12%
3% to 5%
For
per
sona
l use
onl
y

Cabcharge Australia Limited Annual Financial Report and its Controlled Entitities Year Ended 30 June 2016
Page 88
Fair value hierarchy The table below analyses financial instruments carried at fair value, by valuation method. The fair value of interest rate swaps is based on independent market valuations. Fair values reflect the credit risk of the instrument and include adjustments to take account of the credit risk of the Group entity and counterparty when appropriate
The different levels have been defined as follows: • Level 1: quoted prices (unadjusted) in active markets for identical assets or liabilities • Level 2: inputs other than quoted prices included within Level 1 that are observable for the asset or liability, either directly (i.e., as prices) or indirectly (i.e., derived from prices)
• Level 3: inputs for the asset or liability that are not based on observable market data (unobservable inputs)
There have been no transfers between levels for the year ended 30 June 2016.
32. Operating segment Accounting policies An operating segment is a component of the Group that engages in business activities from which it may earn revenues and incur expenses, including revenues and expenses that relate to transactions with any of the Group’s other components. All operating segments’ operating results are regularly reviewed by the Group’s CEO to make decisions about resources to be allocated to the segment and assess its performance, and for which discrete financial information is available. Segment results that are reported to the CEO include items directly attributable to a segment as well as those that can be allocated on a reasonable basis. Segment capital expenditure is the total cost incurred during the period to acquire property, plant and equipment, and intangible assets other than goodwill. The Group operates predominantly in one business and geographic segment being the provision of taxi related services in Australia and through an equity accounted associate in the UK. An associate company which is equity accounted by Cabcharge operates in a different business segment - being the provision of route, school and charter bus services in Australia.
Level 1 Level 2 Level 3 Total$'000 $'000 $'000 $'000
30 June 2016Listed investments - available-for-sale financial assets - - - - Interest rate swap used for hedging - (123) - (123)
- (123) - (123)
30 June 2015Listed investments - available-for-sale financial assets 6,072 - - 6,072 Interest rate swap used for hedging - (985) - (985)
6,072 (985) - 5,087
For
per
sona
l use
onl
y

Cabcharge Australia Limited Annual Financial Report and its Controlled Entitities Year Ended 30 June 2016
Page 89
33. Share-based payment Accounting policies Long Term Incentives (LTI) The Group has provided LTI awards to the CEO and other executives and granted them annually in the form of Rights. The grant-date fair value of equity-settled share-based payment awards granted to employees is generally recognised as an expense, with a corresponding increase in equity, over the vesting period of the awards. The amount recognised as an expense is adjusted to reflect the number of awards for which the related service and non-market performance conditions are expected to be met, such that the amount ultimately recognised is based on the number of awards that meet the related service and non-market performance conditions at the vesting date. Details of the operation of LTI awards are outlined in the Remuneration Report from page 34 to 37. The total share-based payment expense for the year was $91,154 (FY15:$77,422).
a) Fair value
The fair value of the awards as at the valuation date is set out in the following table:
2016 2015 2016 2015 2016 2015$'000 $'000 $'000 $'000 $'000 $'000
RevenueExternal revenue 168,808 187,963 - - 168,808 187,963
ResultReported result 27,057 52,169 - - 27,057 52,169
836 1,449 14,500 15,213 15,336 16,662 Segment result 27,893 53,618 14,500 15,213 42,393 68,831 Net finance costs (393) (5,567) Income tax expense (16,384) (16,716) Profit for the period 25,616 46,548
Other disclosuresSegment assets, excluding investments accounted for using the equity method 234,017 272,510 - - 234,017 272,510
44,807 47,006 251,786 237,286 296,593 284,292 Segment liabilities 141,698 164,077 - - 141,698 164,077 Depreciation and amortisation 15,668 13,428 - - 15,668 13,428 Impairment charges 27,680 10,271 - - 27,680 10,271
Other-investments accounted for using the equity method
Taxi related services Bus & coach services Consolidated
Share of net profit of associates
Grant date/employees entitled
Number
of Rights Vesting conditions
Valuation
methodology
Fair
Value
Expected
vesting date
Performance
Period
2016 year
122,408
Absolute Total Shareholder
Return (market condition)*
Monte Carlo
simulation 0.80$
61,204
Strategic Milestone (non‐
market condition)* Black Scholes 2.67$
Total number of Rights 183,612
Rights granted to CEO and key
management personnel
On 6 June 2016
15 September
2019
1 July 2015 to
30 June 2019
For
per
sona
l use
onl
y

Cabcharge Australia Limited Annual Financial Report and its Controlled Entitities Year Ended 30 June 2016
Page 90
* Details of the operation of LTI awards are outlined in the Remuneration Report from page
34 to 37.
b) Key assumptions
The key assumptions adopted for valuation of the awards are summarised in the following table:
c) Reconciliation The reconciliation of outstanding rights is shown the following table:
34. Subsequent event Dividends The Directors have declared a final dividend of 10 cents per share (fully franked) scheduled to be paid on 31 October 2016. The record date to determine entitlement to dividend is 30 September 2016. Bank Facility In August 2016, the Company entered into agreements with its lending banks to extend its current finance facility term for a further two years from 1 July 2017 to 1 July 2019. The Company also reduced the finance facility limits from $200 million to $160 million given an extended period
Grant date/employees entitled
Number
of Rights Vesting conditions
Valuation
methodology
Fair
Value
Expected
vesting date
Performance
Period
2015 year
28,834
Absolute Total Shareholder
Return (market condition)*
Monte Carlo
simulation 1.56$
14,202
Strategic Milestone (non‐
market condition)* Binomial tree 3.43$
49,386
Absolute Total Shareholder
Return (market condition)*
Monte Carlo
simulation 2.30$
24,324
Strategic Milestone (non‐
market condition)* Binomial tree 4.21$
Total number of Rights 116,746
1 July 2014 to
30 June 2018
1 July 2014 to
30 June 2018
15 September
2018
15 September
2018
Rights granted to CEO
On 17 December 2014
Rights granted to key
management personnel
On 20 May 2015
6 June 2016
17 December
2014
20 May
2015
Share price at grant date 3.22$ 4.22$ 4.82$
Expected life 4 years 3.7 years 3.3 years
Expected volatility 35% 30% 30%
Dividend yield 5.9% 5.5% 4.1%
Risk‐free interest rate 1.53% 2.25% 2.14%
20152016
Performance Rights reconciliation 2016 2015
Rights outstanding as at 1 July 116,746 ‐
Rights granted 183,612 116,746
Rights forfeited ‐ ‐
Rights lapsed ‐ ‐
Rights exercised ‐ ‐
Rights outstanding as at 30 June 300,358 116,746
Rights exercisable as at 30 June ‐ ‐
Number of Rights
For
per
sona
l use
onl
y

Cabcharge Australia Limited Annual Financial Report and its Controlled Entitities Year Ended 30 June 2016
Page 91
of operating significantly within our credit facility levels and recognising the commitment fee cost of unutilised lines of credit. Taxi plate licences in Victoria On 23 August 2016 Victoria State Government announced that all taxi licencing requirements will be removed effective early 2018. The Group has recognised the impairment charge to reduce the carrying amount of all taxi plate licences in Victoria to zero. Other than the matters above, there have been no events subsequent to the reporting date that would have had a material impact on the Group's financial statements as at 30 June 2016.
For
per
sona
l use
onl
y

Cabcharge Australia Limited Annual Financial Report and its Controlled Entitities Year Ended 30 June 2016
Page 92
DIRECTORS’DECLARATION
1. In accordance with a resolution of the Directors of Cabcharge Australia Limited (Company), we
declare that
a. in the opinion of the Directors, the Consolidated Financial Statements and Notes set out
on page 48 to 91, and the Remuneration Report in the Directors’ Report, set out on page
27 to 44, are in accordance with the Corporation Act 2001, including:
i. giving a true and fair view of the Group's financial position at 30 June 2016 and of the
performance for the financial year ended on that date; and
ii. complying with Australian Accounting Standards and the Corporations Regulations
2001;
b. in the opinion of the Directors, there are reasonable grounds to believe that the
Company and the controlled entities identified which are a party to the Deed as identified
in Note 25 will be able to meet any obligations or liabilities to which they are or may
become subject to by virtue of the Deed of Cross Guarantee between the Company and
those group entities pursuant to ASIC Class Order 98/1418.
c. the Directors have been given the declarations required to be made in accordance with
Section 295A of the Corporations Act 2001 from the Chief Executive Officer and Chief
Financial Officer for the financial year ended 30 June 2016.
Note 2(a) confirms that the financial statement also comply with International Financial Reporting
Standards as issued by the International Accounting Standards Board.
Signed in accordance with the resolution of the Directors.
Russell Balding, AO
Chairman
Andrew Skelton
Managing Director
Dated at Sydney this 26 day of August 2016.
For
per
sona
l use
onl
y

KPMG, an Australian partnership and a member firm of the KPMG network of independent member firms affiliated with KPMG International Cooperative (“KPMG International”), a Swiss entity.
Liability limited by a scheme approved under Profession Standards Legislation.
Independent auditor’s report to the members of Cabcharge Australia Limited
Report on the financial report We have audited the accompanying financial report of Cabcharge Australia Limited (the Company), which comprises the consolidated statement of financial position as at 30 June 2016, and consolidated statement of comprehensive income, consolidated statement of changes in equity and consolidated statement of cash flows for the year ended on that date, notes 1 to 34 comprising a summary of significant accounting policies and other explanatory information and the directors’ declaration of the company and the Group comprising the company and the entities it controlled at the year’s end or from time to time during the financial year.
Directors’ responsibility for the financial report
The directors of the company are responsible for the preparation of the financial report that gives a true and fair view in accordance with Australian Accounting Standards and the Corporations Act 2001 and for such internal control as the directors determine is necessary to enable the preparation of the financial report that is free from material misstatement whether due to fraud or error. In note 2a, the directors also state, in accordance with Australian Accounting Standard AASB 101 Presentation of Financial Statements, that the financial statements of the Group comply with International Financial Reporting Standards.
Auditor’s responsibility
Our responsibility is to express an opinion on the financial report based on our audit. We conducted our audit in accordance with Australian Auditing Standards. These Auditing Standards require that we comply with relevant ethical requirements relating to audit engagements and plan and perform the audit to obtain reasonable assurance whether the financial report is free from material misstatement.
An audit involves performing procedures to obtain audit evidence about the amounts and disclosures in the financial report. The procedures selected depend on the auditor’s judgement, including the assessment of the risks of material misstatement of the financial report, whether due to fraud or error. In making those risk assessments, the auditor considers internal control relevant to the entity’s preparation of the financial report that gives a true and fair view in order to design audit procedures that are appropriate in the circumstances, but not for the purpose of expressing an opinion on the effectiveness of the entity’s internal control. An audit also includes evaluating the appropriateness of accounting policies used and the reasonableness of accounting estimates made by the directors, as well as evaluating the overall presentation of the financial report.
We performed the procedures to assess whether in all material respects the financial report presents fairly, in accordance with the Corporations Act 2001 and Australian Accounting Standards, a true and fair view which is consistent with our understanding of the Group’s financial position and of its performance.
We believe that the audit evidence we have obtained is sufficient and appropriate to provide a basis for our audit opinion.
Independence
In conducting our audit, we have complied with the independence requirements of the Corporations Act 2001.
For
per
sona
l use
onl
y

Auditor’s opinion In our opinion:
(a) the financial report of the Group is in accordance with the Corporations Act 2001, including:
(i) giving a true and fair view of the Group’s financial position as at 30 June 2016 and of its performance for the year ended on that date; and
(ii) complying with Australian Accounting Standards and the Corporations Regulations 2001.
(b) the financial report also complies with International Financial Reporting Standards as disclosed in note 2(a).
Report on the remuneration report We have audited the Remuneration Report included in 27 to 44 of the directors’ report for the year ended 30 June 2016. The directors of the company are responsible for the preparation and presentation of the remuneration report in accordance with Section 300A of the Corporations Act 2001. Our responsibility is to express an opinion on the remuneration report, based on our audit conducted in accordance with auditing standards.
Auditor’s opinion
In our opinion, the remuneration report of Cabcharge Australia Limited for the year ended 30 June 2016, complies with Section 300A of the Corporations Act 2001.
KPMG
Julie Cleary Partner
Sydney
26 August 2016
For
per
sona
l use
onl
y