Embed Size (px)
Citation preview

Financial Report to Shareholders
WESTPORT FUEL SYSTEMS 1750 West 75th Avenue, Suite 101 Vancouver, BC, Canada V6P 6G2 604-718-2000 wfsinc.com
For the three months endedMarch 31, 2018
Q1 2018

FORWARD LOOKING STATEMENTS This MD&A contains forward-looking statements that are based on the beliefs of management and reflects our current expectationsas contemplated under the safe harbor provisions of Section 21E of the United States Securities Act of 1934, as amended. Suchstatements include but are not limited to statements regarding the orders or demand for our products, our investments, cash andcapital requirements, the intentions of partners and potential customers, the performance of our products, our future marketopportunities, availability of funding and funding requirements, our estimates and assumptions used in our accounting policies,our accruals, including warranty accruals, our financial condition, timing of when we will adopt or meet certain accounting andregulatory standards and the alignment of our business segments. These statements are neither promises nor guarantees but involveknown and unknown risks and uncertainties that may cause our actual results, levels of activity, performance or achievements tobe materially different from any future results, levels of activity, performance or achievements expressed in or implied by theseforward looking statements. These risks include risks related to revenue growth, operating results, liquidity, industry and products,general economy, conditions of the capital and debt markets, government or accounting policies and regulations, technologyinnovations, as well as other factors discussed below and elsewhere in this report, including the risk factors contained in theCompany’s most recent AIF filed on SEDAR at www.sedar.com. The forward-looking statements contained in this MD&A arebased upon a number of material factors and assumptions which include, without limitation, market acceptance of our products,merger with Fuel Systems, Cartesian financing, product development delays in contractual commitments, the ability to attract andretain business partners, competition from other technologies, price differential between natural gas and liquefied petroleum gas,unforeseen claims, exposure to factors beyond our control as well as the additional factors referenced in our AIF. Readers shouldnot place undue reliance on any such forward-looking statements, which speak only as of the date they were made. We disclaimany obligation to publicly update or revise such statements to reflect any change in our expectations or in events, conditions orcircumstances on which any such statements may be based or that may affect the likelihood that actual results will differ fromthose set forth in the forward looking statements except as required by applicable legislation.
Management's Discussion and Analysis
1

BASIS OF PRESENTATION This Management’s Discussion and Analysis (“MD&A”) for Westport Fuel Systems Inc. (“Westport Fuel Systems”, the“Company”, “we”, “us”, “our”) for the three months ended March 31, 2018 provides an update to our annual MD&A dated March22, 2018 for the fiscal year ended December 31, 2017. This information is intended to assist readers in analyzing our financialresults and should be read in conjunction with the audited consolidated financial statements, including the accompanying notes,for the fiscal year ended December 31, 2017 and our unaudited condensed consolidated interim financial statements for the threemonths ended March 31, 2018. Our interim condensed consolidated financial statements have been prepared in accordance withgenerally accepted accounting principles in the United States (“U.S. GAAP”). The Company’s reporting currency is the U.S. dollar.This MD&A is dated as of May 10, 2018.
Additional information relating to Westport, including our Annual Information Form (“AIF”) and Form 40-F, is available onSEDAR at www.sedar.com and on EDGAR at www.sec.gov. All financial information is reported in U.S. dollars unless otherwisenoted.
Management's Discussion and Analysis
2
The forward looking statements contained in this document speak only as of the date of this MD&A. Except as required byapplicable legislation, Westport Fuel Systems does not undertake any obligation to release publicly any revisions to these forwardlooking statements to reflect events or circumstances after this MD&A, including the occurrence of unanticipated events. Theforward-looking statements contained in this MD&A are expressly qualified by this cautionary statement.
BUSINESS OVERVIEW AND GENERAL DEVELOPMENTS Westport Fuel Systems is a global company focused on engineering, manufacturing, and supply of alternative fuel systems andcomponents. Our diverse and complete product offering sold under established global brands address a broad range of alternativefuels including liquid petroleum gas (“LPG”) , compressed natural gas (“CNG”) , liquid natural gas (“LNG”), renewable naturalgas (“RNG”) , and hydrogen which have environmental and economic advantages. We supply our products and services througha global network of distributors and numerous Original Engine Manufacture (“OEM”) and delayed OEM (“DOEM”) customersin more than 70 countries. Today our products and services are available for the passenger car and light-, medium- and heavy-duty, HHP, cryogenics, and CNG refueling markets.
We are leveraging our scale, customer base, and global sales and distribution networks to continue growing market share; a strategywe believe will lead to a stronger financial position. In addition to our significant operational competency in well-establishedautomotive markets, our investment in new technologies is expected to drive future growth. Westport Fuel Systems has a trackrecord of innovation, specialized engineering capabilities, and a deep patent portfolio resulting in a strong intellectual propertyposition. We reached a significant milestone during 2017 with the shipment of the first commercial Westport High Pressure DirectInjection 2.0 ("Westport™ HPDI 2.0") components to our European OEM launch partner. Our fully integrated Westport™ HPDI2.0 system matches the “diesel-like” power, torque, and fuel economy benefits of a true compression ignition engine powered bynatural gas, with reduced greenhouse gas emissions, and the capability to run entirely on renewable fuels.
Westport Fuel Systems has a compelling value proposition. We have a wide range of brands and products for diverse applicationsand markets; we offer market-ready solutions for global environmental challenges; and we occupy a premier technology leadershipposition. We are building a sustainable, profitable company that delivers value to customers, shareholders, employees, and theenvironment.
CWI, our 50:50 joint venture with Cummins, Inc. ("Cummins"), had record income before income taxes of $58.3 million in 2017.The tax reform in the United States will significantly benefit CWI for 2018 and future years due to the lower corporate tax rate,despite resulting in a $13.4 million tax charge in 2017 due to a related valuation adjustment to deferred tax assets. As expected,CWI had sequentially lower revenues in Q1 2018; however, the remainder of the year is forecast to return to the profitability levelsrecorded in 2017.

LIQUIDITY AND GOING CONCERN
In connection with preparing financial statements for each annual and interim reporting period Management is required to evaluatewhether there are conditions or events, considered in the aggregate, that raise substantial doubt about the Company’s ability tocontinue as a going concern within one year after the date that the financial statements are issued. This evaluation initially doesnot take into consideration the potential mitigating effect of management’s plans that have not been fully implemented as of thedate that the financial statements are issued. When substantial doubt exists, management evaluates whether the mitigating effectof its plans sufficiently alleviates substantial doubt about the Company’s ability to continue as a going concern. The mitigatingeffect of management’s plans, however, is only considered if both (1) it is probable that the plans will be effectively implementedwithin one year after the date that the financial statements are issued, and (2) it is probable that the plans, when implemented, willmitigate the relevant conditions or events that raise substantial doubt about the entity’s ability to continue as a going concern withinone year after the date that the financial statements are issued. Generally, to be considered probable of being effectively implemented,the plans must have been approved before the date that the financial statements are issued.
At March 31, 2018, the Company's net working capital was $65.3 million including cash and cash equivalents of $55.2 million,and its long-term debt, including the royalty payable, was $72.6 million, of which $14.8 million matures in 2018. The Companyincurred a significant loss from continuing operations of $12.7 million for the three months ended March 31, 2018 ($61.1 millionfor fiscal 2017) and negative cash flows from continuing operating activities of $13.0 million for the three months ended March31, 2018 ($47.4 million for fiscal 2017) and has accumulated a deficit of $981.1 million since inception. In the course of 2017,the Company completed significant non-core asset sales and a capital increase, which allowed repayment of long-term debtotherwise coming due in 2017, and increased the Company’s cash available to fund future operations. The Company continuesto work towards its goals of increasing revenues and reducing expenditures, which Management expects will improve results fromoperations and operating cash flows in 2018. In particular, with the HPDI 2.0 product now in production, management expectsthat the engineering and development spend and the associated capital expenditures on this product will decrease significantly in2018 and this reduction will, itself, improve cash flows. In addition, the Company continues to examine non-core assets to determinewhether it is in the best interest of the Company to monetize these assets in the next year or continue to hold or invest in theseassets.
Management believes that the cash on hand at March 31, 2018 and the improvements to the operations expected for 2018 willprovide the cash flow necessary to fund operations over the next year to May 11, 2019. The ability of the Company to continueas a going concern beyond one year will be dependent on the Company’s ability to generate positive results from operations andcash flows or on its ability to raise additional financings to fund future operations. If, as a result of future events, the Companywas to determine it was no longer able to continue as a going concern, significant adjustments would be required to the carryingvalue of its assets and liabilities in the accompanying financial statements and the adjustments could be material.
Management's Discussion and Analysis
3
Operating Segments
Effective January 2018, commensurate with the commercial launch of Westport HPDI 2.0™, the Company restructured its businesssegments to allow for further integration of product offerings. The Westport HPDI 2.0™ product line and all other technologyrelated activities previously reported under the Corporate & Technology segment have been combined with the Automotive businesssegment and renamed Transportation. Under the new organization structure, the Company manages and report the results of its business through three segments:Transportation, the CWI Joint Venture, and Corporate. This change reflects the manner in which operating decisions and assessingbusiness performance is currently managed by the Chief Operating Decision Maker ("CODM"). All comparative figures presentedhave been revised to reflect this change. The financial information for the Company’s business segments evaluated by the CODM includes the results of CWI as if theywere consolidated, which is consistent with the way the Company manages its business segments. As CWI is accounted for underthe equity method of accounting, an adjustment is reflected in the tables below to reconcile the segment measures to the Company’sconsolidated matters. Transportation Business Segment
Westport Fuel Systems Transportation group designs, manufactures, and sells alternative fuel systems and components fortransportation applications. Our diverse product offerings are sold under established global brands and include a broad range of

alternative fuels which have environmental and economic advantages including: liquefied petroleum gas (“LPG”), compressednatural gas (“CNG”), liquefied natural gas (“LNG”), renewable natural gas (“RNG”), and hydrogen. We supply our products andservices through a global network of distributors and numerous original equipment manufacturers (“OEMs”) and delayed OEMs(“DOEMs”) in more than 70 countries. Today our products and services are available for passenger cars, light-, medium- andheavy-duty trucks, high horsepower, cryogenics, and CNG refueling markets. The Transportation group includes the Westport HPDI 2.0™ product line, technologies such as high efficiency spark ignited(“HESI”) and electronics, current and advanced research and development programs, supply chain, and product planning activities. activities.
Cummins Westport Inc. ("CWI") Joint Venture
CWI, our 50:50 joint venture with Cummins, Inc. ("Cummins"), serves the medium and heavy-duty on-highway engine markets.CWI engines are offered by many OEMs for use in transit, school and shuttle buses, conventional trucks and tractors, and refusecollection trucks, as well as specialty vehicles such as short-haul port drayage trucks and street sweepers. CWI is the leadingsupplier of natural gas engines to the North American medium- and heavy-duty truck and transit bus industries.
All CWI natural gas engines are dedicated 100% natural gas engines. The fuel for CWI engines can be carried in tanks on thevehicle as CNG or LNG. All engines are also capable of operating on up to 100% RNG.
CWI is a Delaware corporation owned 50% by Westport Power Inc. ("WPI"), a wholly-owned subsidiary of Westport Fuel Systems,and 50% by Cummins. The board of directors of CWI is comprised of three representatives from each of Westport Fuel Systemsand Cummins. On February 19, 2012, Westport Fuel Systems, Cummins and CWI entered into a Second Amended and RestatedJoint Venture Agreement (the "Amended JVA") governing the operations of CWI which amended the focus of CWI's future productdevelopment investments to North American markets, including engines for on-road applications between the displacement rangeof 5.9 litres through 12 litres, and to have these engines manufactured in Cummins' North American plants.
The purpose of the joint venture is to engage in the business of developing, marketing and selling spark-ignited natural gas orpropane engines for on-highway use. CWI utilizes Cummins' supply chain, back office systems and distribution and sales networks.The joint venture term is scheduled to end on December 31, 2021.
Corporate Business Segment
The Corporate business segment is responsible for public company activities, corporate oversight and general administrative duties.
Management's Discussion and Analysis
4

SELECTED FINANCIAL INFORMATION The following table sets forth a summary of our financial results for the three months ended March 31, 2018 and March 31, 2017.
Selected Consolidated Statements of Operations Data
Three Months Ended March 31,2018 2017
(expressed in millions of United States dollars, except for per share amounts and shares outstanding)Revenue $ 67.6 $ 60.0Gross margin $ 15.3 $ 17.5GM % 22.6% 29.2%Net loss from continuing operations $ (12.7) $ (12.8)Net income (loss) from discontinued operations $ (1.5) $ 0.3Net loss $ (14.2) $ (12.5)Net loss per share from continuing operations - basic and diluted $ (0.10) $ (0.12)Weighted average basic and diluted shares outstanding 131,689,685 110,171,034
The following table sets forth a summary of our financial position as at March 31, 2018 and December 31, 2017: Selected Balance Sheet Data
March 31, 2018 December 31, 2017(expressed in millions of United States dollars)Cash and short-term investments, including $2.5 million of restricted cash $ 55.2 $ 71.8Total assets 299.5 313.6Debt, including current portion 53.3 54.4Royalty payable, including current portion 19.3 19.0Total liabilities 193.1 195.6Shareholders' equity 106.4 118.0
Management's Discussion and Analysis
5

SELECTED FINANCIAL INFORMATION (continued): The following table sets forth a summary of the financial results of Cummins Westport Inc. ("CWI") for the three months endedMarch 31, 2018, and March 31, 2017. Selected CWI Statements of Operations Data
Three months ended March 31,2018 2017
(expressed in millions of United States dollars)Total revenue $ 52.2 $ 70.7Gross margin $ 13.2 $ 21.8GM % 25.3% 30.8%Net income before income taxes $ 3.3 $ 5.2Income tax expense $ 0.3 $ 1.7Net income $ 3.0 $ 3.5Net income attributable to the Company $ 1.5 $ 1.7
Management's Discussion and Analysis
6

RESULTS FROM OPERATIONS
The following tables summarize results by segment for the three months ended March 31, 2018, compared to the three monthsended March 31, 2017.
The 2017 comparative period has been revised to reflect the change in business segments previously discussed.
Revenue
Total consolidated revenues from continuing operations for the three months ended March 31, 2018 increased by $7.6 million or13% from $60.0 million in 2017 to $67.6 million in 2018.
(expressed in millions of U.S. dollars)
Three Months Ended March 31, Change2018 2017 $ %
Transportation $ 67.6 $ 60.0 7.6 13 %CWI 52.2 70.7 (18.5) (26)%Total segment revenues $ 119.8 $ 130.7 $ (10.9) (8)%Less: equity investees' revenues 52.2 70.7 (18.5) (26)%Total consolidated revenues $ 67.6 $ 60.0 $ 7.6 13 % Transportation revenue for the three months ended March 31, 2018 was $67.6 million compared with $60.0 million for the threemonths ended March 31, 2017. The primary reason for the increase was a 14% increase in the Euro compared to the US dollarand strong sales in the European aftermarket business. The increase in sales from the launch of HPDI 2.0 in the first quarter of2018 was offset by a decrease in service revenue recognized upon completion of research and development milestones in the firstquarter of 2017.
CWI revenue for the three months ended March 31, 2018 was $52.2 million compared $70.7 million for the three months endedMarch 31, 2017, respectively. Unit sales for the three months ended March 31, 2018 were 819 compared to 1,740 for the threemonths ended March 31, 2017. The decrease in unit sales resulted from pre-buy activities in the fourth quarter of 2017 in advanceof the 2018 on-board diagnostic compliant engines. Parts revenue increased from $19.7 million to $23.4 million due to the cumulativeincrease in natural gas engine population in service.
Management's Discussion and Analysis
7

Gross Margin
Total consolidated gross margin for the three months ended March 31, 2018 decreased by $2.2 million or 13% from $17.5 millionin 2016 to $15.3 million for the comparative period in 2017.
The following table presents gross margin by segment for the three months ended March 31, 2018 compared to the three monthsended March 31, 2017: (expressed in millions of U.S. dollars)
Three monthsended March
31, 2018% of
Revenue
Three monthsended March
31, 2017% of
Revenue
Change
$ %Transportation $ 15.3 23% $ 17.5 29% $ (2.2) (13)%CWI 13.2 25% 21.8 31% (8.6) (39)%Total segment gross margin 28.5 24% 39.3 30% (10.8) (27)%Less: equity investees' gross margin 13.2 25% 21.8 31% (8.6) (39)%Total consolidated gross margin $ 15.3 23% $ 17.5 29% $ (2.2) (13)% Transportation gross margin decreased by $2.2 million to $15.3 million, or 23% of revenue, for the three months ended March31, 2018 compared to $17.5 million, or 29% of revenue for the three months ended March 31, 2017. The decrease in gross marginand the gross margin percentage is due to the launch of the HPDI 2.0 business and a decrease in service revenue with the Company'sHPDI 2.0 launch customer.
CWI gross margin decreased by $8.6 million to $13.2 million, or 25% of revenue from $21.8 million or 31% of revenue in theprior year period. The decrease in gross margin and gross margin percentage is due to lower revenues from lower unit sales, offsetslightly by a favorable parts revenue mix compared to the prior year period. For the three months ended March 31, 2018, anunfavorable warranty adjustment of $2.5 million was recorded compared to a favorable warranty adjustment of $2.7 million forthe three months ended March 31, 2017. Excluding the warranty adjustments, gross margin for the three months ended March31, 2018 would have been $15.7 million or 30% of revenue compared to $19.1 million or 27% of revenue for the three monthsended March 31, 2017.
Management's Discussion and Analysis
8

Research and Development Expenses
The following table presents details of research and development (“R&D”) expense by segment, excluding equity investees, forthe three months ended March 31, 2018 compared to the three months ended March 31, 2017:
(expressed in millions of U.S. dollars)
Three months ended March 31, Change2018 2017 $ %
Transportation $ 8.7 $ 11.7 $ (3.0) (26)%Corporate 0.2 0.3 (0.1) (33)%Total research and development $ 8.9 $ 12.0 $ (3.1) (26)% Transportation R&D expenses for the three months ended March 31, 2018 were $8.7 million compared with $11.7 million forthe three months ended March 31, 2017. The decrease of $3.0 million during the first quarter of 2017 was due to completion ofvarious R&D programs and reduction in headcount as the company launched its HPDI 2.0 product in the fourth quarter of 2017.
Corporate R&D expenses for the three months ended March 31, 2018 were $0.2 million, compared to $0.3 million for the threemonths ended March 31, 2017. The Corporate R&D expenses relate to costs associated with protecting the Company’s intellectualproperty; in particular, the costs associated with patenting our innovations and registering our trademarks, and maintaining ourpatent and trademark portfolios..
Management's Discussion and Analysis
9

Selling, General and Administrative Expenses
The following table presents details of selling, general and administrative (“SG&A”) expense by segment, excluding equityinvestees, for the three months ended March 31, 2018 compared to the three months ended March 31, 2017: (expressed in millions of U.S. dollars)
Three months ended March 31, Change2018 2017 $ %
Transportation $ 9.3 $ 10.6 $ (1.3) (12)%Corporate 5.3 4.6 0.7 15 %Total selling, general and administrative $ 14.6 $ 15.2 $ (0.6) (4)% Transportation SG&A expenses for three months ended March 31, 2018 were $9.3 million compared with $10.6 million for thethree months ended March 31, 2017. SG&A expenses decreased despite the appreciation of the Euro and the Canadian dollar by14% and 5%, respectively. The decrease in SG&A expenses is mainly due to restructuring activities that took place during 2017.
Corporate SG&A expenses for the three months ended March 31, 2018 were $5.3 million compared with $4.6 million for thethree months ended March 31, 2017. Corporate SG&A expenses are impacted by fluctuations in the Canadian dollar, whichstrengthened in Q1 2018 compared to Q1 2017. In addition, during the first quarter of 2018, the Company incurred $1.0 millionin legal costs related to the ongoing SEC investigation. These costs were offset by lower stock based compensation during thequarter.
Management's Discussion and Analysis
10

Restructuring costs recognized for the three months ended March 31, 2018 were $0.6 million related to charges from a reductionin workforce in Italy. Restructuring expenses of $1.6 million for the three months ended March 31, 2017 related to reduction inworkforce in Canada and Argentina.
Foreign exchange gains and losses reflect net realized gains and losses on foreign currency transactions and net unrealized gainsand losses on our net U.S. dollar denominated monetary assets and liabilities in our Canadian operations that were mainly composedof cash and cash equivalents, short-term investments, accounts receivable and accounts payable. In addition, the Company hasforeign exchange exposure on Euro denominated monetary assets and liabilities where the functional currency of the subsidiaryis not the Euro. For the three months ended March 31, 2018, we recognized foreign exchange gains of $0.1 million compared toforeign exchange gains of $1.6 million in the comparative period due to movements in the Canadian dollar and Euro relative tothe U.S. dollar. Depreciation and amortization for the three months ended March 31, 2018 was $4.2 million compared with $3.6 million for thethree months ended March 31, 2017. The increase is due to the depreciation of fixed assets related to the HPDI 2.0 business in2018. The amount included in cost of product revenue for the three months ended March 31, 2018 was $1.9 million comparedwith $1.2 million for the 2017 period. Income from investments primarily relates to our 50% interest in CWI, accounted for by the equity method.
(expressed in millions of U.S. dollars)
Three months ended March 31,2018 2017
CWI - 50% interest $ 1.5 $ 1.8
Management's Discussion and Analysis
11
Interest on long-term debt and amortization of discount
(expressed in millions of U.S. dollars)
Three months ended March 31,2018 2017
Canadian debentures - 9% per annum $ — $ 0.8Senior financing facilities 0.2 0.1Convertible note - 9% per annum 0.4 0.4Term loan facility - 9% per quarter 0.5 —Royalty payable and other amortization of discount and interest expense 0.8 1.9Total interest on long-term debt $ 1.9 $ 3.2 Interest on long-term debt and royalty payable for the three months ended March 31, 2018 was $1.9 million compared to $3.2million for the three months ended March 31, 2017. Interest expense has decreased due to lower overall debt owed by the Company.
Income tax expense of $0.9 million for the three months ended March 31, 2018 compares to a recovery of $0.8 million for thethree months ended March 31, 2017.
Discontinued operations As discussed in note 5 to the condensed consolidated interim financial statements, substantially all ofthe former Industrial business segment (excluding the electronics and high pressure product lines) was sold during the secondquarter of 2017. The Company recognized a net gain on sale of assets of $54.9 million during the second quarter of 2017. OnJanuary 1, 2018, the Company exited the portion of the Kitchener, Canada facility related to the discontinued Industrial businesssegment and recorded a lease-exit restructuring obligation of $1.3. The discontinued portion of the facility is 81,609 square feetand the lease terminates in August of 2019.

CAPITAL REQUIREMENTS, RESOURCES AND LIQUIDITY This “Capital Requirements, Resources and Liquidity” section contains certain forward-looking statements. By their nature,forward-looking statements require us to make assumptions and are subject to inherent risks and uncertainties. Readers areencouraged to read the “Forward Looking Statements” and “Basis of Presentation” sections of this MD&A, which discussesforward-looking statements and the “Business Risks and Uncertainties” section of this MD&A and of our AIF.
Our cash, cash equivalent and short-term investments position has decreased by $16.6 million during the first three months of2017 from $71.8 million at December 31, 2017. The decrease is primarily the result of cash used in operations, capital expenditures,and the repayment of certain lines of credit and interest on long-term debt. Cash and cash equivalents consist of guaranteedinvestment certificates, term deposits, bankers acceptances with maturities of 90 days or less when acquired, and restricted cash. While the Company incurred significant recurring losses and negative cash flows for the the first quarter of 2018 and for 2017and prior years, the Company continues to work towards its goals of increasing revenues and reducing expenditures, whichmanagement expects will allow achievement of significantly improved operating cash flows for the remainder of 2018. In particular,with the Westport HPDI 2.0 product now in production, the engineering and development spend and the associated capitalexpenditures on this product will decrease significantly in 2018 and this reduction will improved cash flows. See the BusinessOverview and General Developments section in the MD&A for further discussion on liquidity and going concern.
The Company has sustained net losses since inception, and as at March 31, 2018 has an accumulated deficit of $981.1 million.The Company’s ability to continue as a going concern is dependent on its available cash, its ability to find new sources of financingand its ability to raise cash through the sale of assets while in pursuit of operating profitability. There can be no assurance that theCompany will be successful in achieving its objectives. Management believes that the cash balances available as of March 31,2018, improving profitability and its ability to find new sources of financing, provide sufficient funds for the Company to meetits obligations beyond the next 12 months. The accompanying condensed consolidated interim financial statements do not includeany adjustments that might be necessary if the Company is unable to continue as a going concern.
Management's Discussion and Analysis
12
Cash Flow from Operating Activities
For the three months ended March 31, 2018, our net cash flows used in operating activities of continuing operations was $13.0million, a decrease of $3.8 million from the net cash flows of $16.8 million used in operating activities in the three months endedMarch 31, 2017. The improvement in cash flow is primarily due to improved operations and working capital management.
Cash Flow from Investing Activities
For the three months ended March 31, 2018, our net cash flows used in investing activities of continuing opreations was $0.1compared to cash inflows from continuing investing of $1.8 million for the three months ended March 31, 2017. During the firstquarter of 2018, the Company received $3.6 million related to the holdback from the sale of the APU and Industrial businessesfrom 2017. As a result of low fourth quarter earnings in our CWI Joint Venture, we received no dividends in the three monthsended March 31, 2018 compared to a dividend of $3.8 million in the first quarter of 2017. Capital expenditures increased from$2.2 million in 2017 compared to $3.6 million in 2018.
Cash Flow from Financing Activities
For the three months ended March 31, 2018, our net cash flows used in financing activities from continuing operations was $1.9million compared to net cash used in financing activities of $1.7 million for the three months ended March 31, 2017.
Cash Flow from Discontinued Operations For the three months ended March 31, 2018, our net cash flows from discontinued operations used was $0.5 million due to remainingseverance and other expenses related to the sale of the Auxiliary Power Units and Industrial business in 2017.

CONTRACTUAL OBLIGATIONS AND COMMITMENTS
Carryingamount
Contractual cash flows < 1 year 1 - 3 years 4-5 years > 5 years
Accounts payable and accruedliabilities $ 94.4 $ 94.4 $ 94.4 $ — $ — $ —Long-term debt, principal, (1) 53.3 53.4 7.2 14.9 31.3Long-term debt, interest (1) — 13.0 4.3 7.2 1.5 —Long-term royalty payable (2) 19.3 34.5 6.6 13.8 7.4 6.8Operating lease commitments — 17.3 7.6 7.0 2.3 0.4
$ 167.0 $ 212.6 $ 120.1 $ 42.9 $ 42.5 $ 7.2
(1) For details of our long-term debt, principal and interest, see note 12 in the condensed consolidated interim financial statements.
(2) For additional information on the long term royalty, see note 13 of the condensed consolidated interim financial statements.
Management's Discussion and Analysis
13

SHARES OUTSTANDING For the three months ended March 31, 2018 and March 31, 2017, the weighted average number of shares used in calculating theloss per share was 131,689,685 and 110,171,034, respectively. The Common Shares and Share Units outstanding and exercisableas at the following dates are shown below:
March 31, 2018 May 9, 2018Number Number
Common Shares outstanding 131,724,272 131,731,698Share Units Outstanding 3,461,549 3,454,123 Exercisable 517,754 562,313
Management's Discussion and Analysis
14

CRITICAL ACCOUNTING POLICIES AND ESTIMATES Our condensed consolidated interim financial statements are prepared in accordance with U.S. GAAP, which requires us to makeestimates and assumptions that affect the amounts reported in our consolidated financial statements. Actual amounts may varysignificantly from estimates used. The Company's accounting policies are described in Note 3 of our year ended December 31,2017 annual consolidated financial statements. There have been no significant changes in accounting policies applied to the March31, 2018 interim condensed consolidated financial statements except for the adoption of new accounting standards as discussedin note 4 to our condensed consolidated interim financial statements. Adoption of these new standards did not materially impactthe Company. We have identified several policies as critical to our business operations and in understanding our results of operations.These policies, which require the use of judgment, estimates and assumptions in determining their reported amounts, include ouraccounting of CWI as variable interest entity, warranty liability, revenue recognition, inventories, property, plant and equipment,long-term royalty payable, stock-based compensation, goodwill and intangible assets. The application of these and other accountingpolicies are described in note 3 of our fiscal year ended December 31, 2017 annual consolidated financial statements and our 2017annual Management and Discussion analysis, issued on March 22, 2018.
Management's Discussion and Analysis
15
NEW ACCOUNTING PRONOUNCEMENTS AND DEVELOPMENTS
We discuss new accounting standards which have been issued but not yet adopted, their required date of adoption and/or planneddate to adopt, if earlier, and the anticipated impact that adoption of the standards are expected to have on our financial positionand results of operations in note 4 of the notes to the condensed consolidated interim financial statements.
DISCLOSURE CONTROLS AND PROCEDURES AND INTERNAL CONTROLS OVER FINANCIAL REPORTING
During the three months ended March 31, 2018, there were no changes to our internal control over financial reporting that materiallyaffected, or are reasonably likely to materially affect, our internal controls over financial reporting.
REGULATORY COMPLIANCE
On June 15, 2017, the Enforcement Division of the SEC issued a subpoena to Westport Fuel Systems for information concerningits Weichai Westport Inc. joint venture and compliance with the FCPA and securities laws related to disclosure in SEC filings inconnection with the Westport Fuel Systems operations in China. The SEC Enforcement Division issued a follow up subpoena onFebruary 14, 2018. Westport Fuel Systems is cooperating with these requests and cannot predict the duration, scope or outcomeof the SEC’s investigation. The investigation being conducted by the SEC has required and will continue to require significantresources.
SUMMARY OF QUARTERLY RESULTS Our revenues and operating results can vary significantly from quarter to quarter depending on the timing of product deliveries,product mix, product launch dates, research and development project cycles, timing of related government funding, impairmentcharges, restructuring charges, stock-based compensation awards and foreign exchange impacts. Net income (loss) has and canvary significantly from one quarter to another depending on operating results, gains and losses from investing activities, recognitionof tax benefits and other similar events.

The following table provides summary unaudited consolidated financial data for our last eight quarters: Selected Consolidated Quarterly Operations Data
Three months ended30-
Jun-1630-
Sep-1631-
Dec-1631-Mar-17
30-Jun-17
30-Sep-17
31-Dec-17
31-Mar-18
(expressed in millions of United States dollars except for per shareamounts) (1) (1) (2) (3)
Total revenue $ 37.2 $ 56.1 $ 60.1 $ 60.0 $ 62.1 $ 60.8 $ 64.2 $ 67.6
Cost of product and parts revenue $ 29.1 $ 47.5 $ 47.0 $ 42.5 $ 46.3 $ 45.9 $ 48.2 $ 52.3
Gross margin $ 8.1 $ 8.6 $ 13.1 $ 17.5 $ 15.8 $ 14.9 $ 16.0 $ 15.3
Gross margin percentage 21.8% 15.3% 21.8% 29.2% 25.4% 24.5% 24.9% 22.6%
Net income (loss) from continuing operations $ 3.3 $ (33.8) $ (44.4) $ (12.8) $ (13.4) $ (15.7) $ (19.2) $ (12.7)
Net income (loss) $ 3.7 $ (33.5) $ (43.2) $ (12.5) $ 32.3 $ (15.6) $ (14.2) $ (14.2)
EBITDA (4) $ 9.7 $ (25.7) $ (33.1) $ (6.5) $ (7.5) $ (10.5) $ (12.9) $ (5.5)
Adjusted EBITDA (5) $ (11.5) $ (10.4) $ (10.6) $ (4.1) $ (5.3) $ (5.0) $ (3.5) $ (3.5)
CWI net income attributable to the Company (3) $ 1.5 $ 2.8 $ 0.8 $ 1.8 $ 5.3 $ 5.8 $ (0.4) $ 1.5
Earnings (loss) per share
Basic $ 0.05 $ (0.31) $ (0.43) $ (0.11) $ 0.29 $ (0.12) $ (0.14) $ (0.11)
Diluted $ 0.04 $ (0.31) $ (0.43) $ (0.11) $ 0.26 $ (0.12) $ (0.14) $ (0.11)
(1) Includes the one month period of results from the merger with Fuel Systems and a bargain purchase gain in net loss fromcontinuing operations of $42.9 million for the three months ended June 30, 2016, which was reduced by $7.1 million to $35.8million for the three months ended December 31, 2016.
(2) During the second quarter of 2017, the Company completed the sale of non-core assets from its Industrial business unit andrecognized a gain on sale of assets of $58.3 million.
(3) During the fourth quarter of 2017, CWI recorded a tax charge of $13.4 million due to the US tax reform. This reduced theCompany's income from investments by $6.7 million. Excluding this tax charge, the net loss from continuing operations wouldhave been $12.5 million and the net loss for the period would have been $7.5 million.
(4) The term EBITDA (earnings before interest, taxes, depreciation and amortization) does not have a standardized meaningaccording to U.S. GAAP. See non-GAAP measures for more information.
(5) The term Adjusted EBITDA is not defined under U.S. GAAP and is not a measure of operating income, operating performanceor liquidity presented in accordance with U.S. GAAP. Westport Fuel Systems defines Adjusted EBITDA as EBITDA adjusted foramortization of stock-based compensation, unrealized foreign exchange gain or loss, and non-cash and other adjustments. Seenon-GAAP measures for more information.
Management's Discussion and Analysis
16

Non-GAAP Measures:
We use certain non-GAAP measures to assist in assessing our financial performance. Non-GAAP measures do not have anystandardized meaning prescribed in U.S. GAAP and are therefore unlikely to be comparable to similar measures presented byother companies.
EBITDA
The term EBITDA (earnings before interest, taxes, depreciation and amortization) is a non-GAAP financial measure. The Companydefines EBITDA as net loss from continuing operations before income taxes adjusted for interest expense (net) and depreciationand amortization.
Management believes that EBITDA is an important indicator commonly reported and widely used by investors and analysts as anindicator of the Company’s operating performance. The intent is to provide additional useful information to investors and analystsand such measures do not have any standardized meaning under U.S. GAAP. These measures should not be considered in isolationor as a substitute for measures of performance prepared in accordance with U.S. GAAP. Other issuers may define EBITDAdifferently.
Three months ended30-
Jun-1630-
Sep-1631-
Dec-1631-
Mar-1730-
Jun-1730-
Sep-1731-
Dec-1731-
Mar-18Income (loss) before income taxes from continuing operations $ 3.6 $ (33.6) $ (40.8) $ (13.6) $ (17.3) $ (15.3) $ (19.2) $ (11.8)Interest expense, net (1) 2.6 3.2 4.3 3.4 6.3 0.9 2.5 2.1Depreciation and amortization 3.5 4.7 3.4 3.7 3.5 3.9 3.9 4.2EBITDA $ 9.7 $ (25.7) $ (33.1) $ (6.5) $ (7.5) $ (10.5) $ (12.9) $ (5.5)
(1) Interest expense, net is calculated as interest and other income, net of bank charges and interest on long-term debt and otherpayables and amortization of discount.
EBITDA improved from a loss of $12.9 million for the three months ended December 31, 2017 to a loss of $5.5 million. Thechange is primarily due to lower operating expenses, restructuring costs and higher joint venture income from CWI offset by lowergross margins and a lower foreign exchange gain.
Management's Discussion and Analysis
17

Non-GAAP Measures (continued):
Adjusted EBITDA
The term Adjusted EBITDA is not defined under U.S. GAAP and is not a measure of operating income, operating performanceor liquidity presented in accordance with U.S. GAAP.
Adjusted EBITDA is used by management to review operational progress of its business units and investment programs oversuccessive periods and as a long-term indicator of operational performance since it ties closely to the unit’s ability to generatesustained cash flows.
Westport Fuel Systems defines Adjusted EBITDA as EBITDA from continuing operations adjusted for stock-based compensation,unrealized foreign exchange gain or loss, and non-cash and other adjustments. Adjusted EBITDA has limitations as an analyticaltool, and when assessing the Company’s operating performance, investors should not consider Adjusted EBITDA in isolation, oras a substitute for net loss or other consolidated statement of operations data prepared in accordance with U.S. GAAP. Amongother things, Adjusted EBITDA does not reflect the Company’s actual cash expenditures. Other companies may calculate similarmeasures differently than Westport Fuel Systems, limiting their usefulness as comparative tools. Westport Fuel Systemscompensates for these limitations by relying primarily on its U.S. GAAP results.
Three months ended30-
Jun-1630-
Sep-1631-
Dec-1631-
Mar-1730-
Jun-1730-
Sep-1731-
Dec-1731-
Mar-18EBITDA $ 9.7 $ (25.7) $ (33.1) $ (6.5) $ (7.5) $ (10.5) $ (12.9) $ (5.5)Stock based compensation 2.3 2.9 1.2 1.1 3.1 2.1 0.7 0.3Unrealized foreign exchange (gain) loss 4.1 (7.1) 8.1 (1.6) 1.0 2.5 (1.3) —Asset impairment — — 2.7 — — — 0.6 —Inventory impairment from product line closure — 4.3 1.3 — — — — —Bargain purchase gain (42.9) — 7.1 — — — — —Merger and financing costs 4.5 0.4 — — — — — —Amortization of fair value inventory adjustmentrecorded on acquisition 0.4 1.0 — — — — — —
(Gain) loss on sale of investments 6.3 (3.9) (0.3) — — — — —Restructuring, termination and other exit costs — 17.5 1.5 1.6 (1.6) (0.1) 1.8 0.6CWI US tax adjustment — — — — — — 6.7 —Other 4.1 0.2 0.9 1.3 (0.3) 1.0 0.9 1.1Adjusted EBITDA $ (11.5) $ (10.4) $ (10.6) $ (4.1) $ (5.3) $ (5.0) $ (3.5) $ (3.5)
Management's Discussion and Analysis
18

Condensed Consolidated Interim Financial Statements (unaudited)(Expressed in thousands of United States dollars) WESTPORT FUEL SYSTEMS INC.
For the three months ended March 31, 2018 and 2017
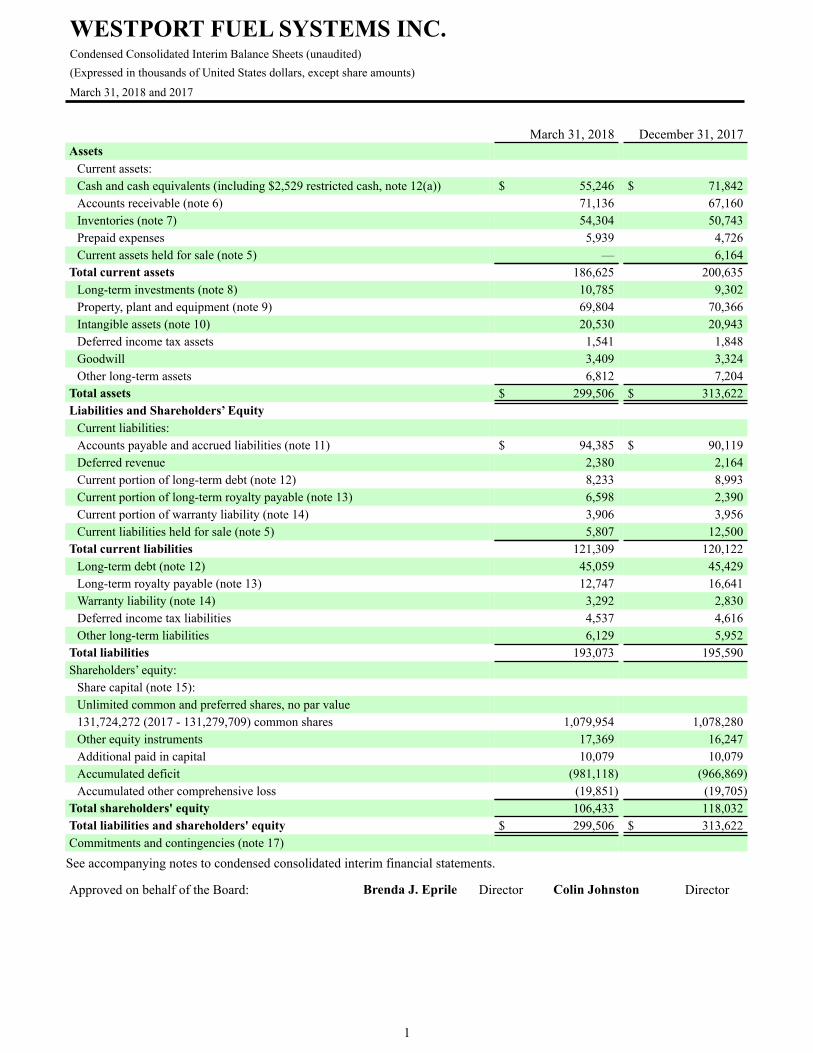
March 31, 2018 December 31, 2017Assets
Current assets:Cash and cash equivalents (including $2,529 restricted cash, note 12(a)) $ 55,246 $ 71,842Accounts receivable (note 6) 71,136 67,160Inventories (note 7) 54,304 50,743Prepaid expenses 5,939 4,726Current assets held for sale (note 5) — 6,164
Total current assets 186,625 200,635Long-term investments (note 8) 10,785 9,302Property, plant and equipment (note 9) 69,804 70,366Intangible assets (note 10) 20,530 20,943Deferred income tax assets 1,541 1,848Goodwill 3,409 3,324Other long-term assets 6,812 7,204
Total assets $ 299,506 $ 313,622Liabilities and Shareholders’ Equity
Current liabilities:Accounts payable and accrued liabilities (note 11) $ 94,385 $ 90,119Deferred revenue 2,380 2,164Current portion of long-term debt (note 12) 8,233 8,993Current portion of long-term royalty payable (note 13) 6,598 2,390Current portion of warranty liability (note 14) 3,906 3,956Current liabilities held for sale (note 5) 5,807 12,500
Total current liabilities 121,309 120,122Long-term debt (note 12) 45,059 45,429Long-term royalty payable (note 13) 12,747 16,641Warranty liability (note 14) 3,292 2,830Deferred income tax liabilities 4,537 4,616Other long-term liabilities 6,129 5,952
Total liabilities 193,073 195,590Shareholders’ equity:
Share capital (note 15):Unlimited common and preferred shares, no par value131,724,272 (2017 - 131,279,709) common shares 1,079,954 1,078,280Other equity instruments 17,369 16,247Additional paid in capital 10,079 10,079Accumulated deficit (981,118) (966,869)Accumulated other comprehensive loss (19,851) (19,705)
Total shareholders' equity 106,433 118,032Total liabilities and shareholders' equity $ 299,506 $ 313,622Commitments and contingencies (note 17)See accompanying notes to condensed consolidated interim financial statements.
Approved on behalf of the Board: Brenda J. Eprile Director Colin Johnston Director
WESTPORT FUEL SYSTEMS INC.Condensed Consolidated Interim Balance Sheets (unaudited)(Expressed in thousands of United States dollars, except share amounts)
March 31, 2018 and 2017
1

Three months ended March 31,2018 2017
Product revenue $ 66,951 $ 56,329Service and other revenue 645 3,694
67,596 60,023Cost of revenue and expenses:
Cost of product revenue 52,278 42,512Research and development 8,863 12,081General and administrative 10,420 10,820Sales and marketing 4,189 4,336Restructuring costs 615 1,574Foreign exchange gain (34) (1,571)Depreciation and amortization 2,328 2,371Loss (gain) on sale of investment and assets 55 (67)
78,714 72,056Loss from operations (11,118) (12,033)
Income from investments accounted for by the equity method 1,469 1,768Interest on long-term debt and amortization of discount (1,905) (3,226)Other expenses (242) (124)Loss before income taxes (11,796) (13,615)Income tax expense (recovery) 904 (790)Net loss from continuing operations (12,700) (12,825)Net income (loss) from discontinued operations (note 5) (1,549) 301Net loss for the period (14,249) (12,524)Other comprehensive income (loss):Cumulative translation adjustment (146) (38)Comprehensive loss $ (14,395) $ (12,562)
Earnings (Loss) per share:From continuing operations - basic and diluted $ (0.10) $ (0.12)From discontinued operations - basic and diluted (0.01) 0.01Net loss - basic and diluted $ (0.11) $ (0.11)Weighted average common shares outstanding:Basic and diluted 131,689,685 110,171,034
See accompanying notes to condensed consolidated interim financial statements.
WESTPORT FUEL SYSTEMS INC.Condensed Consolidated Interim Statements of Operations and Comprehensive Loss (unaudited)(Expressed in thousands of United States dollars, except share and per share amounts) Three months ended March 31, 2018 and 2017
2

CommonShares
Outstanding Share capitalOther equityinstruments
Additional paidin capital
Accumulateddeficit
Accumulatedother
comprehensiveloss
Totalshareholders'
equityJanuary 1, 2017 110,109,092 $ 1,042,410 $ 20,926 $ 10,079 $ (956,890) $ (31,087) $ 85,438Issue of common shares on exercise of shareunits 104,185 628 (628) — — — —Stock-based compensation — — 1,169 — — — 1,169Net loss for the period — — — — (12,524) — (12,524)Other comprehensive loss — — — — — (38) (38)March 31, 2017 110,213,277 $ 1,043,038 $ 21,467 $ 10,079 $ (969,414) $ (31,125) $ 74,045
January 1, 2018 131,279,709 $ 1,078,280 $ 16,247 $ 10,079 $ (966,869) $ (19,705) $ 118,032Issue of common shares on exercise of shareunits 444,563 1,674 (1,674) — — — —Stock-based compensation — — 2,796 — — — 2,796Net loss for the period — — — — (14,249) — (14,249)Other comprehensive income — — — — — (146) (146)March 31, 2018 131,724,272 $ 1,079,954 $ 17,369 $ 10,079 $ (981,118) $ (19,851) $ 106,433
See accompanying notes to condensed consolidated interim financial statements.
WESTPORT FUEL SYSTEMS INC.Condensed Consolidated Interim Statements of Shareholders’ Equity (unaudited)(Expressed in thousands of United States dollars, except share amounts)Three months ended March 31, 2018 and 2017
3

Three months ended March 31,2018 2017
Cash flows from (used in) operating activities:Net loss for the period from continuing operations $ (12,700) $ (12,825)
Items not involving cash:Depreciation and amortization 4,226 3,616Stock-based compensation expense 349 1,169Unrealized foreign exchange gain (34) (1,571)Deferred income tax (904) (790)Income from investments accounted for by the equity method (1,469) (1,768)Accretion of long-term debt 1,905 3,225Inventory write-downs to net realizable value 162 —Change in fair value of derivatives and bad debts expense 459 —Loss on sale of asset or investment 55 —
Restructuring obligations (2,916) 1,574Changes in non-cash operating working capital:
Accounts receivable (4,407) (1,914)Inventories (3,653) (929)Prepaid and other assets (568) (6,688)Accounts payable and accrued liabilities 5,590 1,372Deferred revenue 310 (529)Warranty liability 573 (782)
Net cash used in operating activities of continuing operations (13,022) (16,840)
Net cash from (used in) operating activities of discontinued operations (481) 4,040Cash flows from (used in) investing activities:
Purchase of property, plant and equipment and other assets (3,623) (2,219)Proceeds on sale of investments and assets — 234Dividends received from joint ventures — 3,801Proceeds received from holdback (see note 5) 3,600 —
Net cash from (used in) investing activities of continuing operations (23) 1,816
Net cash used in investing activities of discontinued operations — (142)Cash flows from (used in) financing activities:
Repayment of operating lines of credit and long term facilities (4,777) (15,752)Drawings on operating lines of credit 2,905 14,094
Net cash used in financing activities (1,872) (1,658)Effect of foreign exchange on cash and cash equivalents (1,198) 74Decrease in cash and cash equivalents (16,596) (12,710)Cash and cash equivalents, beginning of period 71,842 60,057Cash and cash equivalents (including $2,529 restricted cash, note 12(a)), end of period $ 55,246 $ 47,347
WESTPORT FUEL SYSTEMS INC.Condensed Consolidated Interim Statements of Cash Flows (unaudited)(Expressed in thousands of United States dollars)Three months ended March 31, 2018 and 2017
4

Three months ended March 31,2018 2017
Supplementary information:Interest paid $ 2,282 $ 1,978
See accompanying notes to condensed consolidated interim financial statements.
WESTPORT FUEL SYSTEMS INC.Condensed Consolidated Statements of Cash Flows (unaudited)(Expressed in thousands of United States dollars) Three months ended March 31, 2018 and 2017
5

1. Company organization and operations
Westport Fuel Systems Inc. (the “Company”) was incorporated under the Business Corporations Act (Alberta) on March 20, 1995.On June 1, 2016, the Company merged with Fuel Systems Solutions, Inc. The Company engineers, manufactures and suppliesalternative fuel systems and components for use in the transportation and industrial markets on a global basis. The Company'scomponents and systems control the pressure and flow of gaseous alternative fuels, such as propane and natural gas used in internalcombustion engines.
2. Liquidity and going concern
In connection with preparing financial statements for each annual and interim reporting period Management is required to evaluatewhether there are conditions or events, considered in the aggregate, that raise substantial doubt about the Company’s ability tocontinue as a going concern within one year after the date that the financial statements are issued. This evaluation initially doesnot take into consideration the potential mitigating effect of management’s plans that have not been fully implemented as of thedate that the financial statements are issued. When substantial doubt exists, management evaluates whether the mitigating effectof its plans sufficiently alleviates substantial doubt about the Company’s ability to continue as a going concern. The mitigatingeffect of management’s plans, however, is only considered if both (1) it is probable that the plans will be effectively implementedwithin one year after the date that the financial statements are issued, and (2) it is probable that the plans, when implemented, willmitigate the relevant conditions or events that raise substantial doubt about the entity’s ability to continue as a going concern withinone year after the date that the financial statements are issued. Generally, to be considered probable of being effectively implemented,the plans must have been approved before the date that the financial statements are issued.
At March 31, 2018, the Company's net working capital was $65,316 including cash and cash equivalents of $55,246, and its long-term debt, including the royalty payable, was $72,637, of which $14,831 matures or is payable in the next twelve months. TheCompany incurred a significant loss from continuing operations of $12,700 for the three months ended March 31, 2018 ($61,106for fiscal 2017) and negative cash flows from continuing operating activities of $13,022 for the three months ended March 31,2018 ($47,457 for fiscal 2017) and has accumulated a deficit of $981,118 since inception. In the course of 2017, the Companycompleted significant non-core asset sales and a capital increase, which allowed repayment of long-term debt otherwise comingdue in 2017, and increased the Company’s cash available to fund future operations. The Company continues to work towards itsgoals of increasing revenues and reducing expenditures, which Management expects will improve results from operations andoperating cash flows in 2018. In particular, with the HPDI 2.0 product now in production, management expects that the engineeringand development spend and the associated capital expenditures on this product will decrease significantly in 2018 and this reductionwill, itself, improve cash flows. In addition, the Company continues to examine non-core assets to determine whether it is in thebest interest of the Company to monetize these assets in the next year or continue to hold or invest in these assets.
Management believes that the cash on hand at March 31, 2018 and the improvements to the operations expected for 2018 willprovide the cash flow necessary to fund operations over the next year to May 31, 2019. The ability of the Company to continueas a going concern beyond one year will be dependent on the Company’s ability to generate positive results from operations andcash flows or on its ability to raise additional financings to fund future operations. If, as a result of future events, the Companywas to determine it was no longer able to continue as a going concern, significant adjustments would be required to the carryingvalue of its assets and liabilities in the accompanying financial statements and the adjustments could be material.
3. Basis of preparation:
(a) Basis of presentation:
These interim financial statements have been prepared in accordance with accounting principles generally accepted in the UnitedStates ("U.S. GAAP").
These interim financial statements do not include all note disclosures required on an annual basis, and therefore, should be readin conjunction with the annual audited consolidated financial statements for the year ended December 31, 2017, filed with theappropriate securities regulatory authorities.
WESTPORT FUEL SYSTEMS INC.Notes to Condensed Consolidated Interim Financial Statements (unaudited)(Expressed in thousands of United States dollars, except share and per share amounts) Three months ended March 31, 2018 and 2017
6

3. Basis of preparation (continued):
In the opinion of management, all adjustments, which include reclassifications and normal recurring adjustments necessary topresent fairly the condensed consolidated balance sheets, condensed consolidated results of operations and comprehensive loss,condensed consolidated statements of shareholders' equity and condensed consolidated cash flows as at March 31, 2018 and forall periods presented, have been recorded. The results of operations for the three months ended March 31, 2018 are not necessarilyindicative of the results for the Company's full year.
(b) Foreign currency translation:
The Company’s functional currency is the Canadian dollar and its reporting currency for its consolidated financial statementpresentation is the United States dollar. The functional currencies for the Company's subsidiaries include the following: UnitedStates, Canadian ("CDN") and Australian dollars, Euro, Argentina Peso, Chinese Renminbi (“RMB”), Swedish Krona, JapaneseYen and Indian Rupee. The Company translates assets and liabilities of non-U.S. dollar functional currency operations using theperiod end exchange rates, shareholders’ equity balances using the weighted average of historical exchange rates, and revenuesand expenses using the monthly average rate for the period, with the resulting exchange differences recognized in othercomprehensive income.
Transactions that are denominated in currencies other than the functional currency of the Company’s operations or its subsidiariesare translated at the rates in effect on the date of the transaction. Foreign currency denominated monetary assets and liabilities aretranslated to the applicable functional currency at the exchange rates in effect on the balance sheet date. Non-monetary assets andliabilities are translated at the historical exchange rate. All foreign exchange gains and losses are recognized in the statement ofoperations, except for the translation gains and losses arising from available-for-sale instruments, which are recorded through othercomprehensive income until realized through disposal or impairment.
Except as otherwise noted, all amounts in these interim financial statements are presented in U.S. dollars. For the periods presented,the Company used the following exchange rates:
Period ended Average for the three months ended
March 31, 2018 December 31, 2017 March 31, 2018 March 31, 2017Canadian dollar 0.78 0.80 0.79 0.75Australian dollar 0.77 0.78 0.79 0.77Euro 1.23 1.20 1.23 1.07Argentina Peso 0.05 0.06 0.05 0.06RMB 0.16 0.15 0.16 0.15Swedish Krona 0.12 0.12 0.12 0.11Japanese Yen 0.01 0.01 0.01 0.01Indian Rupee 0.0154 0.0157 0.0155 0.0149
(c) Cash and cash equivalents:
Cash and cash equivalents includes cash, term deposits, bankers acceptances and guaranteed investment certificates with maturitiesof ninety days or less when acquired. Cash equivalents are considered as held for trading and recorded at fair value with changesin fair value recognized in the consolidated statements of operations. The $2,529 of restricted cash forms part of the security forthe Export Development Canada ("EDC") loan. See note 12 for additional details.
WESTPORT FUEL SYSTEMS INC.Notes to Condensed Consolidated Interim Financial Statements (unaudited)(Expressed in thousands of United States dollars, except share and per share amounts) Three months ended March 31, 2018 and 2017
7

4. Accounting changes:
(a) New accounting pronouncements adopted in 2018:
Revenue:
In May 2014, Financial Accounting Standards Board (“FASB”) issued ASU 2014-09, Revenue From Contracts With Customers(“Topic 606”). Topic 606 removes inconsistencies and weaknesses in revenue accounting requirements, provides a more robustframework for addressing revenue issues, improves comparability of revenue recognition practices across entities, industries,jurisdictions and capital markets, provides more useful information to users of financial statements through improved disclosurerequirements and simplifies the preparation of financial statements by reducing the number of requirements to which an entitymust refer. The guidance in this update supersedes the revenue recognition requirements in Topic 605, Revenue Recognition, andmost industry-specific guidance throughout the Industry Topics of the Accounting Standards Codification. Topic 606 is effectivefor public entities with reporting periods beginning after December 15, 2017. The Company adopted the guidance using themodified retrospective method as at January 1, 2018 with no material impact to the financial statements.
Statement of Cash Flows (Topic 230): Classification of Certain Cash Receipts and Cash Payments:
In August 2016, the FASB issued ASU 2016-15, which provides cash flow classification guidance on eight specific cash flowissues to reduce diversity in practice for which authoritative guidance did not previously exist. ASU 2016-15 is effective for publicentities in annual and interim periods in fiscal years beginning after December 15, 2017. The adoption of this guidance in the firstquarter of 2018 did not result in any material impact to the financial statements.
Income Taxes (Topic 740): Accounting for Income Taxes on Intercompany Transfers:
In October 2016, the FASB issued ASU 2016-16, which requires entities to recognize the income tax consequences of intercompanyasset transfers in the period in which the transfer occurs, with the exception of inventory transfer. ASU 2016-16 is effective forinterim and annual periods beginning after December 15, 2017. The adoption of this guidance in the first quarter of 2018 did notresult in any material impact to the financial statements.
(b) New accounting pronouncements to be adopted in the future:
Leases (Topic 842):
In February 2016, the FASB issued ASU 2016-02, which increases transparency and comparability among organizations byrecognizing lease assets and lease liabilities on the balance sheet and disclosing key information about leasing arrangements. ASU2016-02 is effective for annual and interim periods beginning after December 15, 2018, and interim periods with early adoptionpermitted. The Company's future minimum lease payments at March 31, 2018 under operating leases are disclosed in note 17. TheCompany has not yet evaluated the impact of the adoption of this new standard.
WESTPORT FUEL SYSTEMS INC.Notes to Condensed Consolidated Interim Financial Statements (unaudited)(Expressed in thousands of United States dollars, except share and per share amounts) Three months ended March 31, 2018 and 2017
8

5. Sale of assets:
Substantially all of the former Industrial business segment (excluding the electronics and high pressure product lines) was sold inthe second quarter of 2017, resulting in a net gain of $58,310. The Company had Transition Supply Agreements ("TSA") withthe purchasers to manufacture products on their behalf. The TSA period ended at the end of 2017. On January 1, 2018, theCompany exited the portion of the facility related to the discontinued Industrial business segment and recorded a $1,268 lease-exit restructuring obligation. The lease terminates in August of 2019.
As discussed in note 13, 15% of the net consideration received on these asset sales in the second quarter of 2017 and on receiptof holdback proceeds was paid against the royalty payable due to Cartesian.
The carrying amounts of the major classes of assets and liabilities for the held for sale Industrial business segment at March 31,2018 and December 31, 2017 are shown below:
March 31, 2018 December 31, 2017
Cash $ — $ 5,924Accounts receivable — 7
— 5,931
Property, plant, and equipment — 233— 233
Total assets classified as held for sale $ — $ 6,164
Accounts payable and accrued liabilities $ — $ 7,305Restructuring obligations 1,067 —Income taxes payable 3,448 3,448Other current liabilities — 269
4,515 11,022Deferred income tax liabilities and other liabilities 1,292 1,478Total liabilities classified as held for sale $ 5,807 $ 12,500
WESTPORT FUEL SYSTEMS INC.Notes to Condensed Consolidated Interim Financial Statements (unaudited)(Expressed in thousands of United States dollars, except share and per share amounts) Three months ended March 31, 2018 and 2017
9

5. Sale of assets (continued):
The following table presents financial results of the Industrial business segment which are included in net income from discontinuedoperations for the three months ended March 31, 2018 and three months ended March 31, 2017:
Three months ended March 31,2018 2017
Product and service revenue $ — $ 17,546
Cost of product revenue — 13,246Research and development — 1,176General and administrative 281 1,348Sales and marketing — 949
281 16,719Operating income (loss) from discontinued operations (281) 827
Restructuring cost 1,268 —Other expenses — 240Income (loss) from discontinued operations before income tax (1,549) 587Income tax expense (recovery) — 286Net income (loss) from discontinued operations $ (1,549) $ 301
WESTPORT FUEL SYSTEMS INC.Notes to Condensed Consolidated Interim Financial Statements (unaudited)(Expressed in thousands of United States dollars, except share and per share amounts) Three months ended March 31, 2018 and 2017
10

6. Accounts Receivable:
March 31, 2018 December 31, 2017Customer trade receivables $ 66,533 $ 58,490Holdback receivables 3,125 6,750Other receivables 3,525 4,337Income tax receivable 1,229 1,232Due from related parties (note 8(a)) 718 156Allowance for doubtful accounts (3,994) (3,805)
$ 71,136 $ 67,160
WESTPORT FUEL SYSTEMS INC.Notes to Condensed Consolidated Interim Financial Statements (unaudited)(Expressed in thousands of United States dollars, except share and per share amounts) Three months ended March 31, 2018 and 2017
11
7. Inventories:
March 31, 2018 December 31, 2017Purchased parts $ 39,574 $ 36,054Work-in-process 2,539 2,409Finished goods 11,521 11,587Inventory on consignment 670 693
$ 54,304 $ 50,743
During the three months ended March 31, 2018, the Company recorded write-downs to net realizable value of $162 (three monthsended March 31, 2017 - nil).

8. Long-term investments:
March 31, 2018 December 31, 2017Cummins Westport Inc. (a) $ 8,314 $ 6,799Weichai Westport Inc. 1,824 1,824Other equity-accounted investees 647 679
$ 10,785 $ 9,302
WESTPORT FUEL SYSTEMS INC.Notes to Condensed Consolidated Interim Financial Statements (unaudited)(Expressed in thousands of United States dollars, except share and per share amounts) Three months ended March 31, 2018 and 2017
12
(a) Cummins Westport Inc. ("CWI"):
The Company and Cummins Inc. (“Cummins”) each own 50% of the common shares of CWI. For the three months endedMarch 31, 2018, the Company recognized its share of CWI’s income of $1,517 (three months ended March 31, 2017 - $1,733) inincome from investments accounted for by the equity method.
As of March 31, 2018, the Company has a related party accounts receivable balance of $718 from CWI.
Assets, liabilities, revenue and expenses of CWI are as follows:
March 31, 2018 December 31, 2017Current assets:Cash and short-term investments $ 107,036 $ 91,720Accounts receivable 1,895 10,925
108,931 102,645Long-term assets:Property, plant and equipment 1,217 1,245Deferred income tax assets 27,766 28,096
28,983 29,341Total assets $ 137,914 $ 131,986Current liabilities:Current portion of warranty liability $ 24,084 $ 25,866Current portion of deferred revenue 22,743 22,157Accounts payable and accrued liabilities 19,182 12,603
66,009 60,626Long-term liabilities:Warranty liability 16,253 16,253Deferred revenue 35,933 38,321Other long-term liabilities 3,076 3,175
55,262 57,749Total liabilities $ 121,271 $ 118,375

8. Long-term investments (continued):
(a) Cummins Westport Inc. (continued):
Three months ended March 31,2018 2017
Product revenue $ 28,848 $ 50,998Parts revenue 23,365 19,728
52,213 70,726Cost of revenue and expenses:Cost of product and parts revenue 39,013 48,963Research and development 6,078 10,752General and administrative 561 480Sales and marketing 3,584 5,519Foreign exchange (gain) loss (1) (1)
49,235 65,713Income from operations 2,978 5,013Interest and investment income 349 174Income before income taxes 3,327 5,187
Income tax expense 293 1,722Net income $ 3,034 $ 3,465
WESTPORT FUEL SYSTEMS INC.Notes to Condensed Consolidated Interim Financial Statements (unaudited)(Expressed in thousands of United States dollars, except share and per share amounts) Three months ended March 31, 2018 and 2017
13

9. Property, plant and equipment:
Accumulated Net bookMarch 31, 2018 Cost depreciation valueLand and buildings $ 5,048 $ 1,483 $ 3,565Computer equipment and software 8,451 7,488 963Furniture and fixtures 4,459 3,384 1,075Machinery and equipment 90,801 32,682 58,119Leasehold improvements 13,024 6,942 6,082
$ 121,783 $ 51,979 $ 69,804
Accumulated Net bookDecember 31, 2017 Cost depreciation valueLand and buildings $ 4,947 $ 1,412 $ 3,535Computer equipment and software 7,742 7,438 304Furniture and fixtures 5,844 4,085 1,759Machinery and equipment 91,995 33,543 58,452Leasehold improvements 14,079 7,763 6,316
$ 124,607 $ 54,241 $ 70,366
WESTPORT FUEL SYSTEMS INC.Notes to Condensed Consolidated Interim Financial Statements (unaudited)(Expressed in thousands of United States dollars, except share and per share amounts) Three months ended March 31, 2018 and 2017
14
10. Intangible Assets:
Accumulated Net bookMarch 31, 2018 Cost amortization valueBrands, patents and trademarks $ 22,537 $ 7,535 $ 15,002Technology 5,538 4,297 1,241Customer contracts 13,279 8,998 4,281Other intangibles 360 354 6Total $ 41,714 $ 21,184 $ 20,530
Accumulated Net bookDecember 31, 2017 Cost amortization valuePatents and trademarks $ 22,031 $ 6,995 $ 15,036Technology 5,400 4,059 1,341Customer contracts 12,964 8,404 4,560Other intangibles 351 345 6Total $ 40,746 $ 19,803 $ 20,943

11. Accounts payable and accrued liabilities:
March 31, 2018 December 31, 2017Trade accounts payable $ 67,346 $ 60,705Accrued payroll 19,076 17,188Taxes payable 1,745 511Restructuring obligation 688 2,969Accrued interest 381 1,567Other payables 5,149 7,179
$ 94,385 $ 90,119
WESTPORT FUEL SYSTEMS INC.Notes to Condensed Consolidated Interim Financial Statements (unaudited)(Expressed in thousands of United States dollars, except share and per share amounts) Three months ended March 31, 2018 and 2017
15
12. Long-term debt:
March 31, 2018 December 31, 2017Term loan facility, net of debt issuance costs (a) $ 18,511 $ 18,987Senior financing (b) 11,202 10,901Convertible debt (c) 17,347 17,335Other bank financing (d) 5,156 6,562Capital lease obligations (e) 1,076 637Balance, end of period 53,292 54,422Current portion (8,233) (8,993)Long-term portion $ 45,059 $ 45,429
(a) On December 20, 2017, the Company entered into a loan agreement with EDC for a $20,000 non-revolving term facility(the "Term Facility"). The loan bears interest at 9% plus monitoring fees, payable quarterly, as well as quarterly principal repaymentsover four years. The debt issuance costs related to the Term Facility were netted against the carrying value and are being amortizedover the term using the effective interest rate method.
The loan is secured by share pledges over Westport Power, Inc., Fuel Systems Solutions, Inc., and MTM S.r.L. and 85% of theproceeds received from the holdback related to the sale of APU business (as discussed in note 5). As at March 31, 2018, securityof $2,529 is held as restricted cash. On reaching certain milestones, the Company has the opportunity to reduce the interest rateto 6%.
(b) The €10,000 senior financing facility was renewed on March 24, 2017. The loan bears interest at the 6-month Euriborplus 3.3% and can increase or decrease by 30 basis points based on an annual leverage ratio calculation. Interest is paid semi-annually. The Company has pledged its interest in EMER S.p.A. as a general guarantee for its senior financing. The repaymentsare summarized in the table below, where the last repayment is on December 31, 2022.
(c) On January 11, 2016, the Company entered into a financing agreement ("Tranche 2 Financing") with Cartesian. As partof the agreement, on June 1, 2016, convertible debt was issued in exchange for 9.0% convertible unsecured notes due June 1, 2021,which are convertible into common shares of the Company in whole or in part, at Cartesian's option, at any time following thetwelve month anniversary of the closing at a conversion price of $2.17 per share. Interest is payable annually in arrears on December31 of each year during the term. The convertible debt is held by a related party as Peter Yu, founder and managing partner ofCartesian, became a member of the Board of Directors of the Company in January 2016. Cartesian is secured by an interest in theCompany's HPDI 2.0 intellectual property and a priority interest in the Company's CWI joint venture interest.
(d) Other bank financing consists of various secured and unsecured bank financing arrangements that carry rates of interestranging from 0.75% to 3.8% and have various maturities out to 2022. Security includes a building owned by the Company in theNetherlands, and certain accounts receivable in one of our Italian subsidiaries.

12. Long-term debt (continued):
(e) The Company has capital lease obligations with terms of three to five years at interest rates ranging from 3.1% to 12.0%.
WESTPORT FUEL SYSTEMS INC.Notes to Condensed Consolidated Interim Financial Statements (unaudited)(Expressed in thousands of United States dollars, except share and per share amounts) Three months ended March 31, 2018 and 2017
16
The principal repayment schedule of the senior financings and convertible debt are as follows as at March 31, 2018:
Term loanfacility
Seniorfinancing
ConvertibleDebt
Other bankfinancing
Capital leaseobligations Total
Remainder of 2018 $ 1,270 $ 1,888 $ — $ 3,680 $ 326 $ 7,1642019 3,747 2,025 — 369 222 6,3632020 5,747 2,164 — 369 215 8,4952021 7,747 2,429 17,347 369 181 28,073
2022 and thereafter — 2,696 — 369 132 3,197$ 18,511 $ 11,202 $ 17,347 $ 5,156 $ 1,076 $ 53,292

13. Long-term royalty payable:
On January 11, 2016, the Company entered into a financing agreement with Cartesian to support the Company's global growthinitiatives. The financing agreement immediately provided $17,500 in cash (the “Tranche 1 Financing”). In consideration for thefunds provided to the Company, Cartesian is entitled to royalty payments based on the greater of (i) a percentage of amountsreceived by the Company on select high pressure direct injection systems and CWI joint venture income through 2025 and (ii)stated fixed amounts per annum (subject to adjustment for asset sales). The carrying value is being accreted to the expectedredemption value using the effective interest method, which is approximately 23% per annum. Cartesian is secured by an interestin the Company's HPDI intellectual property and a priority interest in the Company's CWI joint venture interest.
In January 2017, the Company and Cartesian signed a Consent Agreement which allows the Company to sell certain assets inexchange for prepayment of the Cartesian royalty: Cartesian will be paid 15% of the net proceeds from these asset sales to amaximum of $15,000, with this payment being allocated on a non-discounted basis to future years' minimum payments.
Holdback proceeds received from the sale of the Auxiliary Power Unit business and additional Industrial assets in the first quarterof 2018 resulted in royalty repayments to Cartesian of $540 (see note 5 for additional details).
March 31, 2018 December 31, 2017Balance, beginning of period $ 19,031 $ 21,562Accretion expense 854 3,168Repayment (540) (10,935)Prepayment finance charge — 5,236Balance, end of period 19,345 19,031Current portion (6,598) (2,390)Long-term portion $ 12,747 $ 16,641 The minimum repayments including interest are as follows, for the years ended March 31:
2019 $ 6,5982020 6,2262021 7,5582022 6,2022023 1,1622024 and thereafter 6,758
$ 34,504
WESTPORT FUEL SYSTEMS INC.Notes to Condensed Consolidated Interim Financial Statements (unaudited)(Expressed in thousands of United States dollars, except share and per share amounts) Three months ended March 31, 2018 and 2017
17

14. Warranty liability:
A continuity of the warranty liability is as follows:
Three months ended March 31,2018 2017
Balance, beginning of period $ 6,786 $ 12,239Warranty claims paid (890) (758)Warranty accruals 546 287Impact of foreign exchange changes 756 (142)Balance, end of period 7,198 11,626Less: current portion (3,906) (5,872)Long-term portion $ 3,292 $ 5,754
WESTPORT FUEL SYSTEMS INC.Notes to Condensed Consolidated Interim Financial Statements (unaudited)(Expressed in thousands of United States dollars, except share and per share amounts) Three months ended March 31, 2018 and 2017
18
15. Share capital, stock options and other stock-based plans: During the three months ended March 31, 2018, the Company issued 444,563 common shares, net of cancellations, upon exercisesof share units (three months ended March 31, 2017 – 104,185 common shares). The Company issues shares from treasury to satisfystock option and share unit exercises.
(a) Share Units ("Units"):
The value assigned to issued Units and the amounts accrued are recorded as other equity instruments. As Units are exercised orvest and the underlying shares are issued from treasury of the Company, the value is reclassified to share capital. During the three months ended March 31, 2018, the Company recognized $349 (three months ended March 31, 2017 - $1,169) ofstock-based compensation associated with the Westport Omnibus Plan and the former Amended and Restated Unit Plan.
A continuity of the Units issued under the Westport Omnibus Plan and the former Amended and Restated Unit Plan as of March 31,2018 and March 31, 2017 are as follows:
Three months ended March 31, 2018 Three months ended March 31, 2017
Number ofunits
Weightedaverage
grantdate fair
value(CDN $)
Number ofunits
Weightedaverage
grantdate fair
value(CDN $)
Outstanding, beginning of period 4,509,990 $ 6.00 6,664,591 $ 6.75Granted 126,122 3.69 — —Exercised (444,563) 4.87 (104,185) 8.07Forfeited/expired (730,000) 3.62 (111,962) 5.70Outstanding, end of period 3,461,549 $ 5.88 6,448,444 $ 6.75Units outstanding and exercisable, endof period 517,754 $ 6.82 2,309,173 $ 7.32
As at March 31, 2018, $1,537 of compensation cost related to Units awarded has yet to be recognized in results from operationsand will be recognized ratably over the next three quarters.

15. Share capital, stock options and other stock-based plans (continued):
(b) Aggregate intrinsic values:
The aggregate intrinsic value of the Company’s share units at March 31, 2018 as follows:
March 31, 2018(CDN $)
Share units:Outstanding $ 9,865Exercisable 1,476
WESTPORT FUEL SYSTEMS INC.Notes to Condensed Consolidated Interim Financial Statements (unaudited)(Expressed in thousands of United States dollars, except share and per share amounts) Three months ended March 31, 2018 and 2017
19
(c) Stock-based compensation:
Stock-based compensation associated with the Unit plans and the stock option plan is included in operating expenses as follows:
Three months ended March 31,2018 2017
Research and development $ 22 $ 279General and administrative 147 611Sales and marketing 180 279
$ 349 $ 1,169
During the quarter ended March 31, 2018, the Performance Stock Units ("PSUs") that had been conditionally approved werefinalized and granted. As a result, the stock-based compensation of $2,447 related to 730,000 PSUs was reclassified from a liabilityto shareholders' equity.

16. Related party transactions:
The Company enters into related party transactions with the CWI joint venture and Cartesian on convertible debt and the royaltypayable. Refer to note 8(a) for the related party transactions with CWI, and notes 12(c) and 13 for transactions with Cartesian.
WESTPORT FUEL SYSTEMS INC.Notes to Condensed Consolidated Interim Financial Statements (unaudited)(Expressed in thousands of United States dollars, except share and per share amounts) Three months ended March 31, 2018 and 2017
20
17. Commitments and contingencies:
(a) Contractual Commitments
Operating lease commitments represent our future minimum lease payments under leases related primarily to our operating premisesand office equipment:
2018 $ 6,5222019 4,5562020 3,1672021 1,3432022 1,185Thereafter 571
$ 17,344
The Company is a party to a variety of agreements in the ordinary course of business under which it is obligated to indemnify athird party with respect to certain matters. Typically, these obligations arise as a result of contracts for sale of the Company’sproduct to customers where the Company provides indemnification against losses arising from matters such as product liabilities.The potential impact on the Company’s financial results is not subject to reasonable estimation because considerable uncertaintyexists as to whether claims will be made and the final outcome of potential claims. To date, the Company has not incurred significantcosts related to these types of indemnifications.
(b) Contingencies
On June 15, 2017, the Enforcement Division of the SEC issued a subpoena to Westport Fuel Systems for information concerningits Weichai Westport Inc. joint venture and compliance with the U.S. Foreign Corrupt Practices Act ("FCPA") and securities lawsrelated to disclosure in SEC filings in connection with the Westport Fuel Systems operations in China. The SEC EnforcementDivision issued a follow up subpoena on February 14, 2018. Westport Fuel Systems is cooperating with these requests and cannotpredict the duration, scope or outcome of the SEC’s investigation. The investigation being conducted by the SEC has requiredand will continue to require significant resources. The Company is engaged in certain legal actions in the ordinary course of business and believes that the ultimate outcome of theseactions will not have a material adverse effect on our operating results, liquidity or financial position.

18. Segment information:
Effective January 2018, commensurate with the commercial launch of Westport HPDI 2.0™, the Company restructured its businesssegments to allow for further integration of product offerings. The Westport HPDI 2.0™ product line and all other technologyrelated activities previously reported under the Corporate & Technology segment have been combined with the Automotivebusiness segment and renamed Transportation. Under the new organization structure, the Company manages and report the results of its business through three segments:Transportation, the CWI Joint Venture, and Corporate. This change reflects the manner in which operating decisions and assessingbusiness performance is currently managed by the Chief Operating Decision Maker ("CODM"). All comparative figures presentedhave been revised to reflect this change. The financial information for the Company’s business segments evaluated by the CODM includes the results of CWI as if theywere consolidated, which is consistent with the way the Company manages its business segments. As CWI is accounted for underthe equity method of accounting, an adjustment is reflected in the tables below to reconcile the segment measures to the Company’sconsolidated measures. Transportation Business Segment
Westport Fuel Systems Transportation group designs, manufactures, and sells alternative fuel systems and components fortransportation applications. The Company's diverse product offerings are sold under established global brands and include abroad range of alternative fuels which have environmental and economic advantages including: liquefied petroleum gas (“LPG”),compressed natural gas (“CNG”), liquefied natural gas (“LNG”), renewable natural gas (“RNG”), and hydrogen. The Companysupplies its products and services through a global network of distributors and original equipment manufacturers (“OEMs”) inmore than 70 countries. Today the Company's products and services are available for passenger cars, light-, medium- and heavy-duty trucks, high horsepower, cryogenics, and CNG refueling markets. The Transportation group includes the Westport HPDI 2.0™ product line, technologies such as high efficiency spark ignited(“HESI”) and electronics, current and advanced research and development programs, supply chain, and product planning activities.
Cummins Westport Inc. Joint Venture
CWI, the 50:50 joint venture with Cummins, serves the medium and heavy-duty on highway engine markets. CWI engines areoffered by many OEMs for use in transit, school and shuttle buses, conventional trucks and tractors, and refuse collection trucks,as well as specialty vehicles such as short-haul port drayage trucks and street sweepers.
Corporate Segment
The Corporate business segment is responsible for public company activities, corporate oversight and general administrativeduties.
WESTPORT FUEL SYSTEMS INC.Notes to Condensed Consolidated Interim Financial Statements (unaudited)(Expressed in thousands of United States dollars, except share and per share amounts) Three months ended March 31, 2018 and 2017
21

18. Segment information (continued):
Financial information by business segment as follows:
Three months ended March 31,2018 2017
Revenue:Transportation $ 67,596 $ 60,023CWI 52,213 70,726Total segment revenues 119,809 130,749Less: equity investees' revenue (52,213) (70,726)Consolidated revenue from continuing operations $ 67,596 $ 60,023Consolidated revenue from discontinued operations $ — $ 17,546
Three months ended March 31,
2018 2017Operating income (loss):Transportation $ (4,914) $ (7,229)Corporate (5,569) (4,868)Restructuring, termination and other exit costs (615) (1,574)Foreign exchange gain (loss) 34 1,571Gain on sale of investment and assets (55) 67CWI 2,978 5,013Total segment operating loss (8,141) (7,020)Less: equity investees’ operating income (2,978) (5,013)Consolidated operating loss from continuing operations $ (11,119) $ (12,033)Consolidated operating income (loss) from discontinued operations $ (281) $ 827
WESTPORT FUEL SYSTEMS INC.Notes to Condensed Consolidated Interim Financial Statements (unaudited)(Expressed in thousands of United States dollars, except share and per share amounts) Three months ended March 31, 2018 and 2017
22

18. Segment information (continued): It is impracticable for the Company to provide geographical revenue information by individual countries; however, it is practicableto provide it by geographical regions. Revenues are attributable to geographical regions based on location of the Company’scustomers presented as follows:
% of total revenue from continuingoperations
Three months ended March 31,2018 2017
Europe 66% 68%Americas 14% 21%Asia 9% 9%Others 11% 2%
As at March 31, 2018, total long-term investments of $10,240 (December 31, 2017 - $8,756) was allocated to the Corporate segmentand $545 (December 31, 2017 - $546) was allocated to the Transportation segment.
Total assets are allocated as follows:
March 31, 2018 December 31, 2017Transportation $ 273,979 $ 264,865CWI 137,914 147,245Corporate 25,527 42,593
437,420 454,703Add: assets held for sale — 6,164Less: equity investees’ total assets (137,914) (147,245)Total consolidated assets $ 299,506 $ 313,622
WESTPORT FUEL SYSTEMS INC.Notes to Condensed Consolidated Interim Financial Statements (unaudited)(Expressed in thousands of United States dollars, except share and per share amounts) Three months ended March 31, 2018 and 2017
23

19. Financial instruments:
Liquidity risk is the risk that the Company will not be able to meet its financial obligations as they are due. The Company hassustained losses and negative cash flows from operations since inception. At March 31, 2018, the Company has $55,246 of cash,cash equivalents and short-term investments.
The following are the contractual maturities of financial obligations as at March 31, 2018:
Carryingamount
Contractualcash flows < 1 year 1-3 years 4-5 years >5 years
Accounts payable and accrued liabilities $ 94,385 $ 94,385 $ 94,385 $ — $ — $ —Term loan facility (note 12 (a)) 18,511 25,420 3,914 13,116 8,390 —Senior financing (note 12 (b)) 11,202 12,065 2,255 4,598 5,212 —Convertible debt (note 12 (c)) 17,347 22,489 1,187 3,150 18,152 — —Other bank financing (note 12 (d)) 5,156 5,222 3,730 751 741 —Long-term royalty payable (note 13) 19,345 34,504 6,598 13,784 7,364 — 6,758Capital lease obligations (note 12 (e)) 1,076 1,105 343 448 314 —Operating lease commitments — 17,344 7,628 6,961 2,328 427
$ 167,022 $ 212,534 $ 120,040 $ 42,808 $ 42,501 $ 7,185
WESTPORT FUEL SYSTEMS INC.Notes to Condensed Consolidated Interim Financial Statements (unaudited)(Expressed in thousands of United States dollars, except share and per share amounts) Three months ended March 31, 2018 and 2017
24

19. Financial Instruments (continued):
(b) Fair value of financial instruments:
The carrying amounts reported in the condensed consolidated balance sheet for cash and cash equivalents, accounts receivable,accounts payable and accrued liabilities approximate their fair values due to the short-term period to maturity of these instruments.
The Company’s short-term investments are recorded at fair value. The long-term investment represents the Company's interest inWWI, CWI and other investees. CWI is accounted for using the equity method, and WWI is an equity investment without a readilydeterminable fair value and is accounted for at cost.
The carrying value reported in the condensed consolidated balance sheet for obligations under capital lease, which is based upondiscounted cash flows, approximates their fair values.
The carrying value of the Term Facility included in the long-term debt (note 12(a)) approximates its fair values as the loan wasexecuted shortly before the 2017 year end. The carrying value reported in the condensed consolidated balance sheet for seniorfinancing (note 12(b)) approximates its fair values as at March 31, 2018, as the interest rates on the debt is floating and thereforeapproximate the market rates of interest.
The Company categorizes its fair value measurements for items measured at fair value on a recurring basis into three categoriesas follows:
Level 1 – Unadjusted quoted prices in active markets for identical assets or liabilities.
Level 2 – Observable inputs other than Level 1 prices, such as quoted prices for similar assets or liabilities; quotedprices in markets that are not active; or other inputs that are observable or can be corroborated by observablemarket data for substantially the full term of the assets or liabilities.
Level 3 – Inputs for the asset or liability that are not based on observable market data (unobservable inputs). When available, the Company uses quoted market prices to determine fair value and classify such items in Level 1. When necessary,Level 2 valuations are performed based on quoted market prices for similar instruments in active markets and/or model–derivedvaluations with inputs that are observable in active markets. Level 3 valuations are undertaken in the absence of reliable Level 1or Level 2 information.
As at March 31, 2018, cash and cash equivalents and short-term investments are measured at fair value on a recurring basis andare included in Level 1.
WESTPORT FUEL SYSTEMS INC.Notes to Condensed Consolidated Interim Financial Statements (unaudited)(Expressed in thousands of United States dollars, except share and per share amounts) Three months ended March 31, 2018 and 2017
25