Embed Size (px)
Citation preview
Economic policy: Growth and Development
For the Special FC
February 2021
Amir Ullah Khan


India GDP Quarterly Growth Rate Sequentially

India GDP Quarterly Growth Rate (Year on Year)

Expenditure on Health
0
10000
20000
30000
40000
50000
60000
70000
80000
90000
2019-2020 Actuals 2020-2021 Budget Estimates 2020-2021 Revised Estimates 2021-2022 Budget Estimates
Expenditure on Health
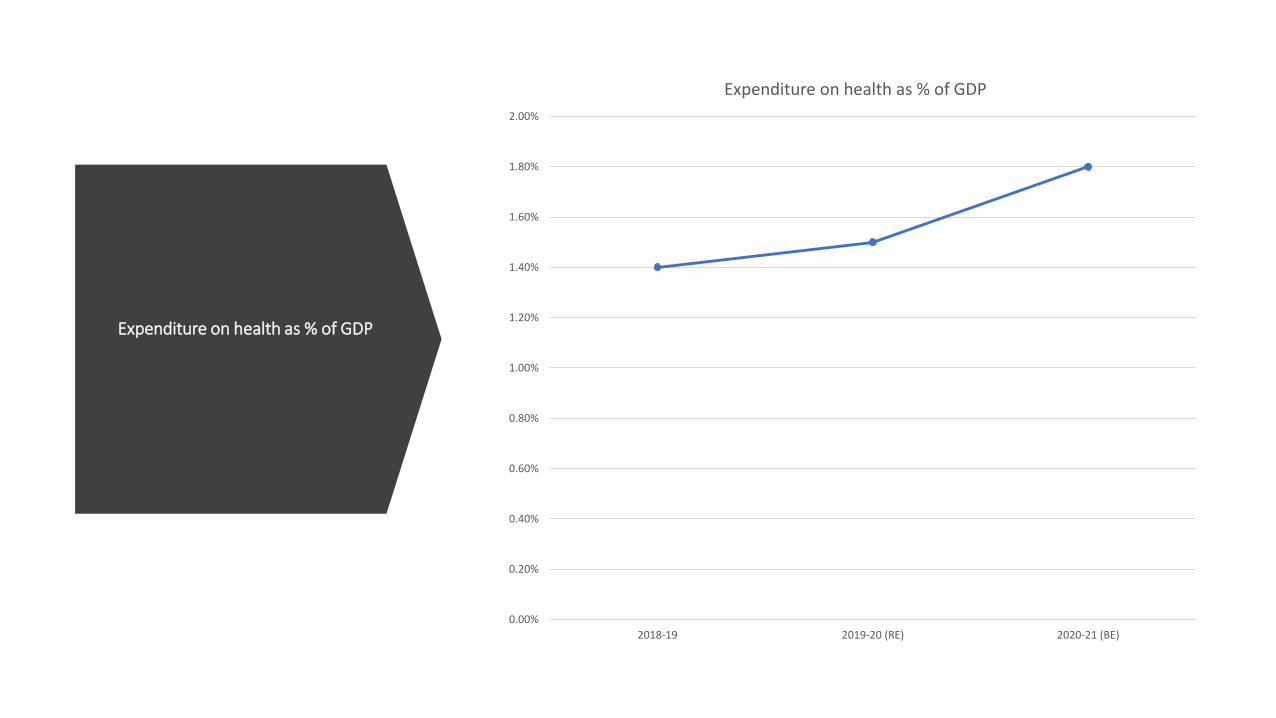
Expenditure on health as % of GDP
0.00%
0.20%
0.40%
0.60%
0.80%
1.00%
1.20%
1.40%
1.60%
1.80%
2.00%
2018-19 2019-20 (RE) 2020-21 (BE)
Expenditure on health as % of GDP
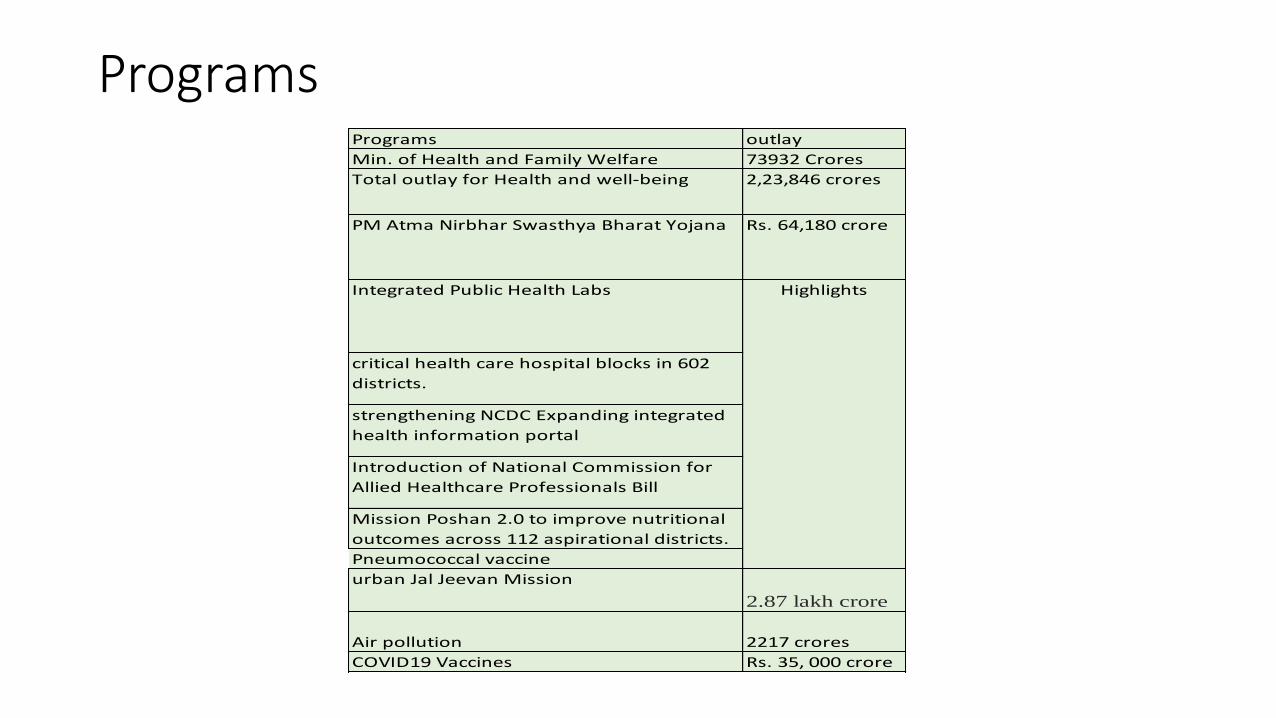
Programs Programs outlay
Min. of Health and Family Welfare 73932 Crores
Total outlay for Health and well-being 2,23,846 crores
PM Atma Nirbhar Swasthya Bharat Yojana Rs. 64,180 crore
Integrated Public Health Labs
critical health care hospital blocks in 602
districts.
strengthening NCDC Expanding integrated
health information portal
Introduction of National Commission for
Allied Healthcare Professionals Bill
Mission Poshan 2.0 to improve nutritional
outcomes across 112 aspirational districts.
Pneumococcal vaccine
urban Jal Jeevan Mission
2.87 lakh crore
Air pollution 2217 crores
COVID19 Vaccines Rs. 35, 000 crore
Highlights
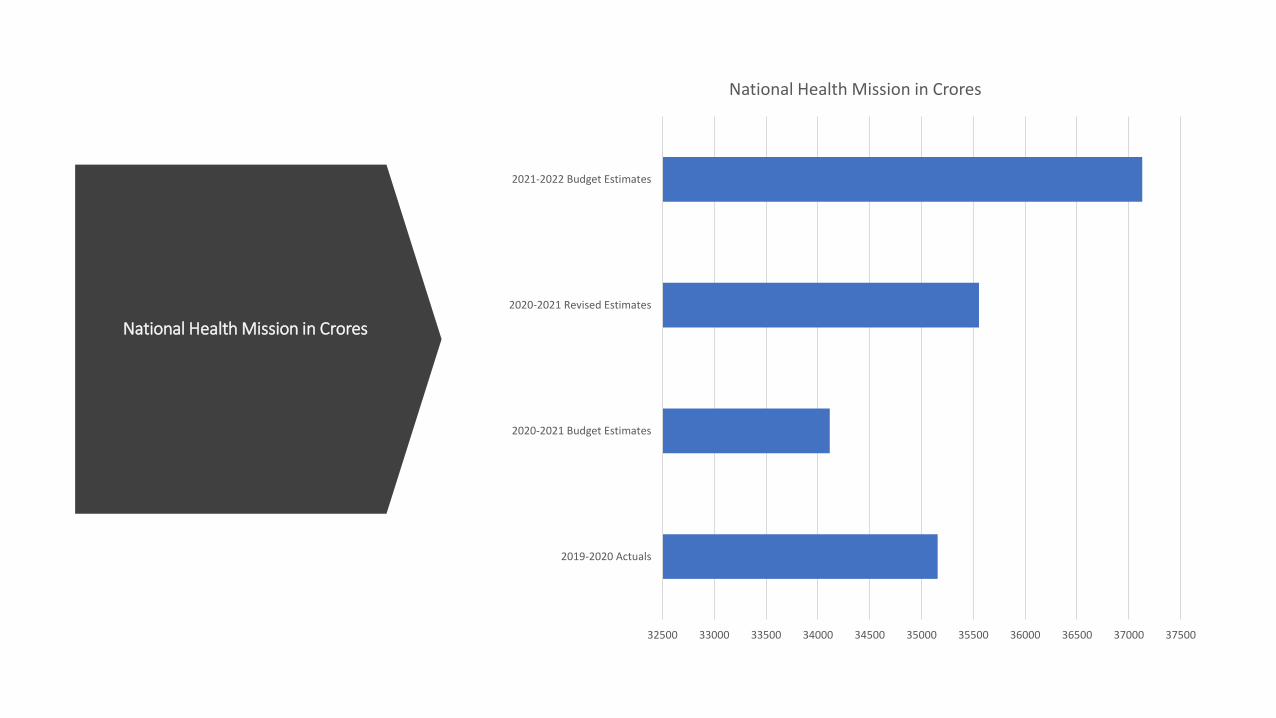
National Health Mission in Crores
32500 33000 33500 34000 34500 35000 35500 36000 36500 37000 37500
2019-2020 Actuals
2020-2021 Budget Estimates
2020-2021 Revised Estimates
2021-2022 Budget Estimates
National Health Mission in Crores

Ministry of Health and Family Welfare Demand for grants in
Crores
0
10000
20000
30000
40000
50000
60000
70000
80000
2019-2020 Actuals 2020-2021 Budget Estimates 2020-2021 Revised Estimates 2021-2022 Budget Estimates
Ministry of Health and Family Welfare DFG
Revenue Capital

Schemes (in Crores)
0
10000
20000
30000
40000
50000
60000
70000
80000
Saksham Anganwadi andPoshan
2.0
Rashtriya Swasthya BimaYojna
Umbrella ICDS National AIDS and STDControl Programme
Pardhan Mantri SwasthyaSuraksha Yojana
Schemes
2019-2020 Actuals 2020-2021 Budget Estimates 2020-2021 Revised Estimates 2021-2022 Budget Estimates
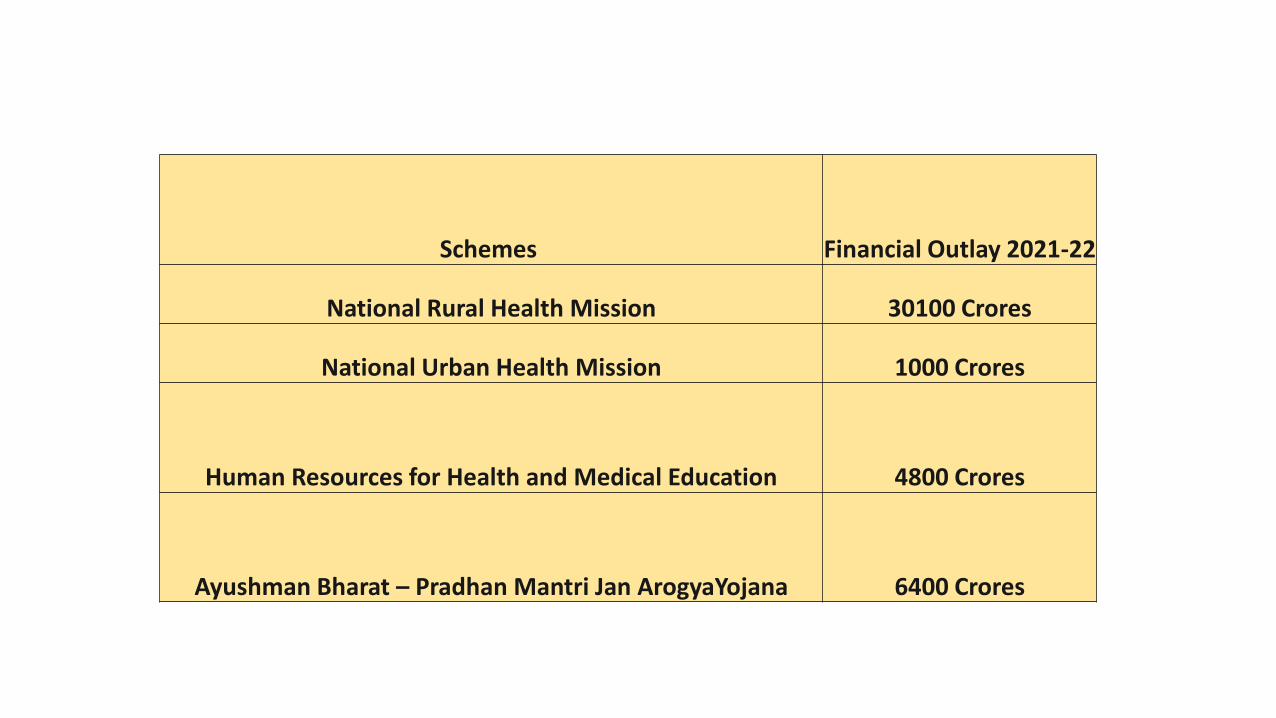
Schemes Financial Outlay 2021-22
National Rural Health Mission 30100 Crores
National Urban Health Mission 1000 Crores
Human Resources for Health and Medical Education 4800 Crores
Ayushman Bharat – Pradhan Mantri Jan ArogyaYojana 6400 Crores

Actual Expenditure and approved outlay for 2019-20 for MoHFW in Crore
0%
10%
20%
30%
40%
50%
60%
70%
80%
90%
100%
2017-18 (BE) 2017-18 (Actual) 2018-19 (BE) 2018-19 (Actual) 2019-20 (BE)
Actual Expenditure and approved outlay for 2019-20 for MoHFW in Crore
Health NHRM Ayush Research NACO

Expenditure on CGHS in Crores
2750
2800
2850
2900
2950
3000
2017-18 2018-19 2019-20 (BE)
Expenditure on CGHS in Crores

State-wise Funds Spent in Micronutrient Supplementation Programmes, Infant and Young Child Feeding (IYCF), Practices,
Nutrition Rehabilitation Centres (NRCs) and Diarrhoea Control
Activties in India in Lakhs
0.00
2000.00
4000.00
6000.00
8000.00
10000.00
12000.00
2009-10 2010-11 2011-12 2012-13 2013-14 2014-15 2015-16 2016-17 2017-18 2018-19*
State-wise Funds Spent in Micronutrient Supplementation Programmes, Infant and Young Child Feeding (IYCF), Practices, Nutrition Rehabilitation
Centres (NRCs) and Diarrhoea Control Activties in India in Lakhs

Funds Sanctioned to
Food and Nutrition
Board in India
0
10
20
30
40
50
60
2017-2018 2018-2019 2019-2020 2020-2021
Funds Sanctioned to Food and Nutrition Board in India (Rs. in Crore)
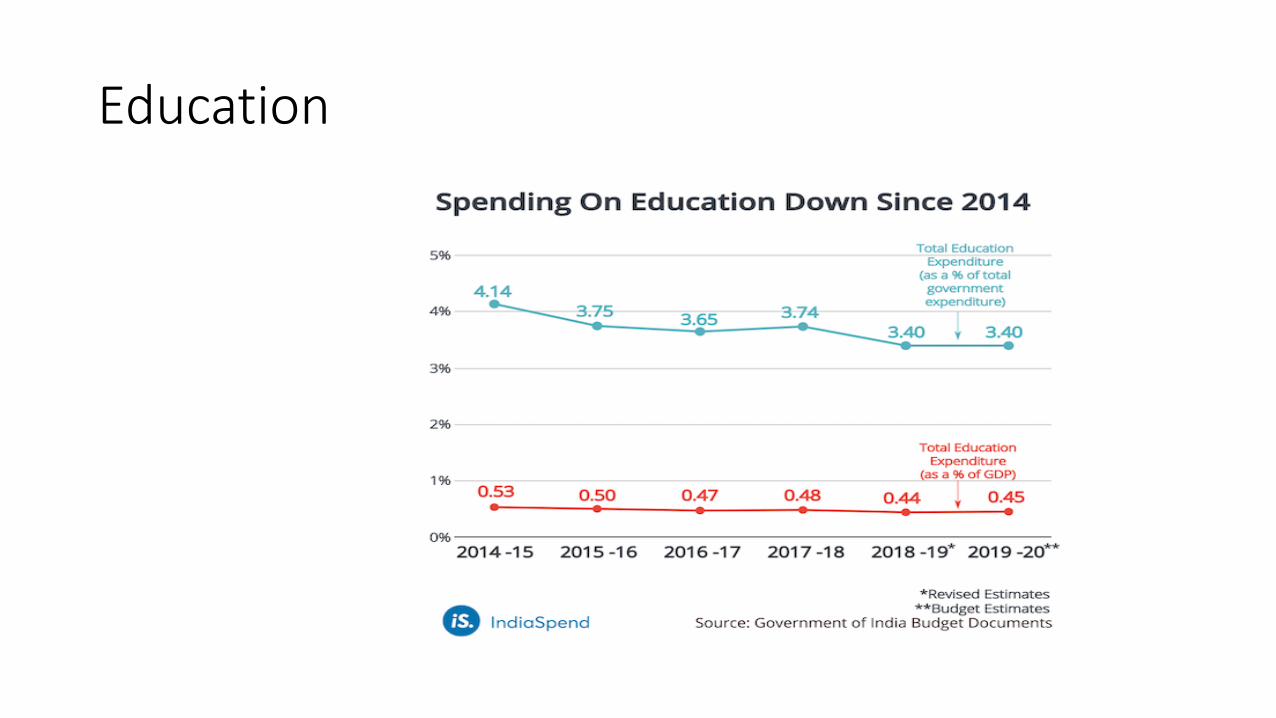
Education
-40
-30
-20
-10
0
10
20
30
40
50
60
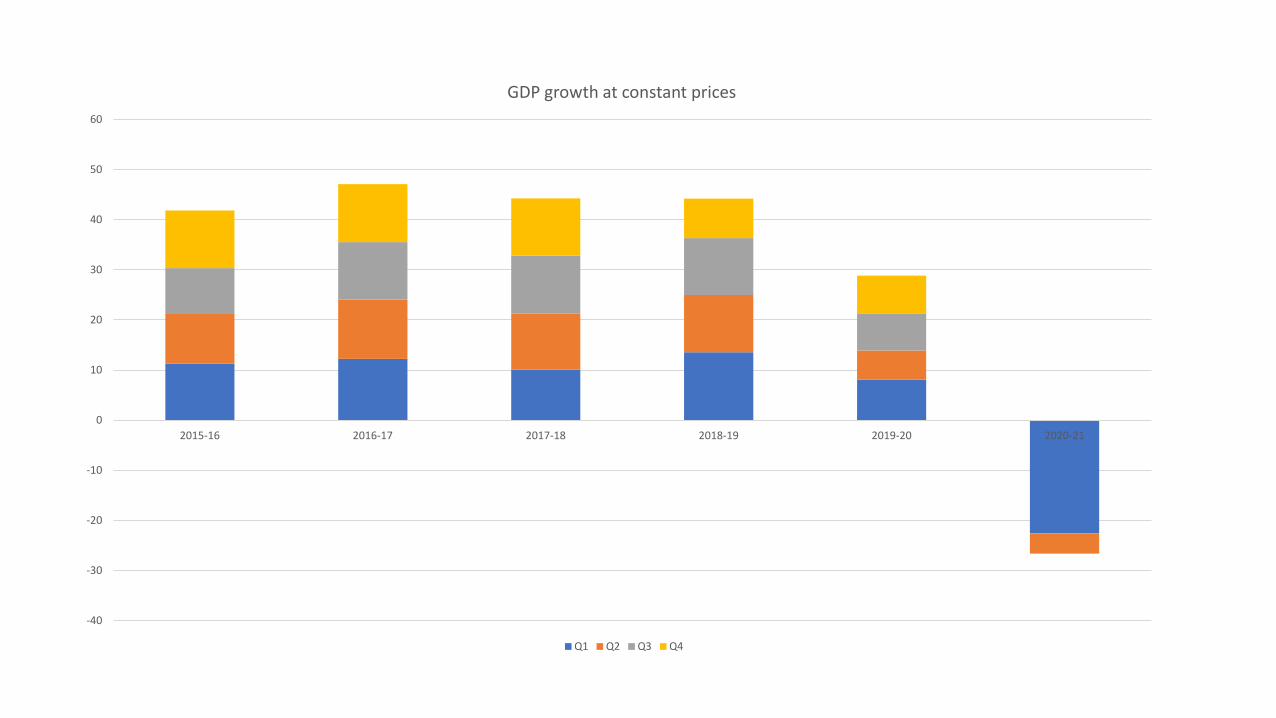
2015-16 2016-17 2017-18 2018-19 2019-20 2020-21
GDP growth at constant prices
Q1 Q2 Q3 Q4
-10
-5
0
5
10
15
20
25
30
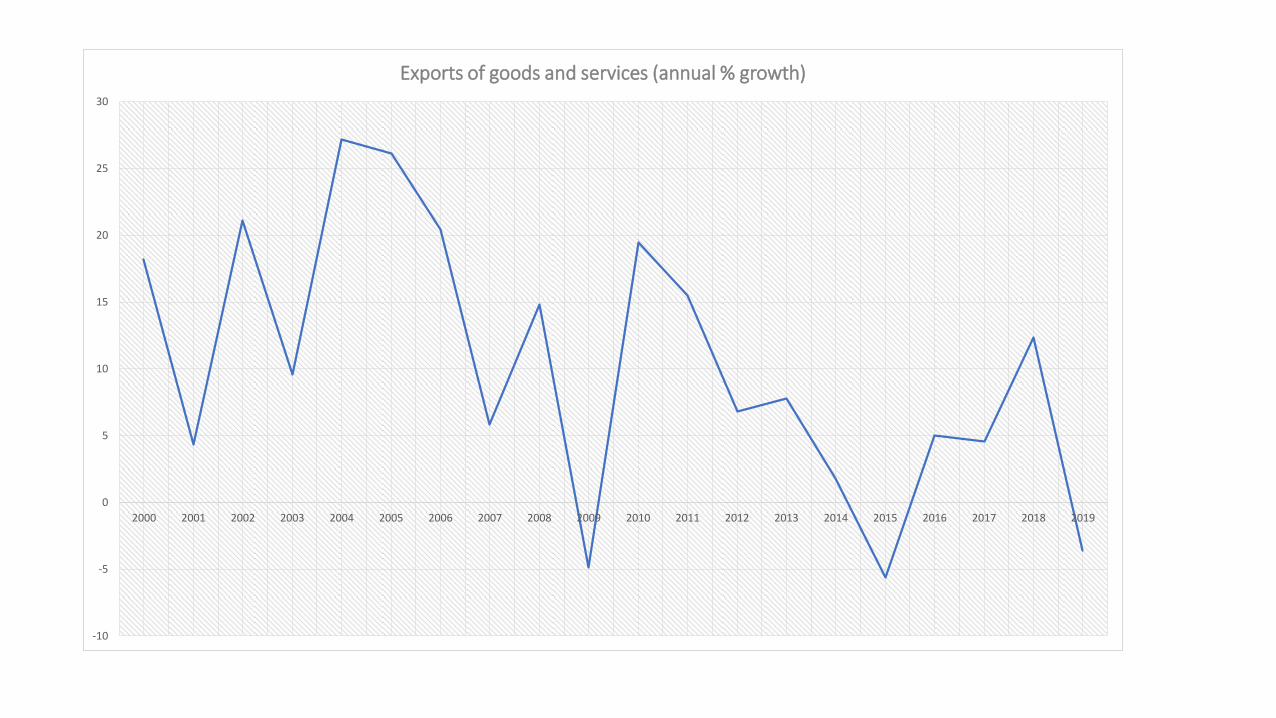
2000 2001 2002 2003 2004 2005 2006 2007 2008 2009 2010 2011 2012 2013 2014 2015 2016 2017 2018 2019
Exports of goods and services (annual % growth)


Poverty and inequality
February 10, 2021 21
Concentration of poverty in states
Per capita incomes – a comparative lens on ‘pattern’
Source: Planning Commission, Data Tables; Economist Intelligence Unit; IMF, World Economic Outlook
$0 $5,000 $10,000 $15,000
Ethiopia
Bihar
Rwanda
Madhya Pradesh
Uttar Pradesh
Assam
Rajasthan
Orissa
West Bengal
Uttarkhand
Andra Pradesh
India
Karnataka
Kerala
Tamil Nadu
Gujarat
Punjab
Maharashtra
Delhi
China
Chandigarh
Brazil

0.0
5.0
10.0
15.0
20.0
25.0
30.0
35.0
40.0
45.0
50.0
An
dh
ra P
rad
esh
Ass
am
Bih
ar
Ch
hat
tisg
arh
Gu
jara
t
Har
yan
a
Him
ach
al P
rad
esh
Jhar
khan
d
Kar
nat
aka
Ke
rala
Mad
hya
Pra
des
h
Mah
aras
htr
a
Ori
ssa
Pu
nja
b
Raj
asth
an
Tam
il
Utt
ar P
rad
esh
Utt
arak
han
d
Wes
t B
en
gal
Ind
ia
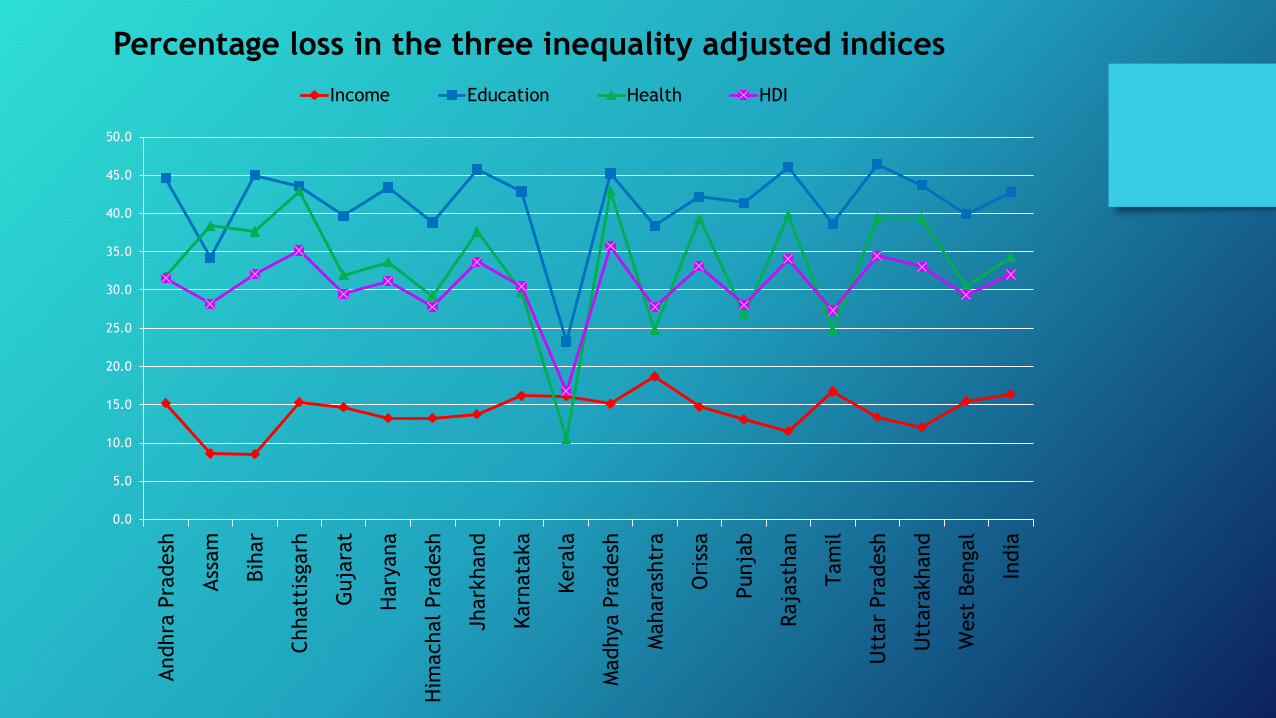
Income Education Health HDI
Percentage loss in the three inequality adjusted indices

Global GDP share
20,494
(24.2%)
13,407
(15.8%)
4,972
(5.9%)
4,000
(4.7%)
2,829
(3.3%)
2,717
(3.2%)
1,868
(2.2%)
1,619
(1.9%)
US
China
Japan
Germany
UK
India
Brazil
Korea
* World GDP: 84,740
Source: IMF Global Outlook, April 2019

The 5 trillion dollar club
• Ambitious?

The 5 trillion dollar club
• Challenges – Scale, Education, Migration, Wages, Trade and exchange rates, Unemployment, Tax revenue, Hunger and …........
SECTORS
Growth and Challenges

INDIA’S TOP 20 COMPANIES BY MARKET CAPITALISATION
1990 2000 2010
Tata Steel Wipro Reliance Industries
ITC Hindustan Unilever ONGC
Tata Motors Infosys Technologies TCS
Century Textiles Reliance Coal India
Hindustan Unilever ITC Infosys Technologies
Mafatlal O N G C SBI
Reliance Industries HCL Technologies NTPC
Grasim Pentamedia Graphics Bharti Airtel
G S F C Zee Entertainment ITC
ACC M T N L ICICI Bank
SIV Industries I O C L Larsen & Toubro
Colgate-Palmolive St Bk of India Wipro
Hindalco H F C L MMTC
Bajaj Holdings Satyam Computer BHEL
Saurashtra Cement Tata Communications NMDC
Uniphos Enterprises Ranbaxy Labs. HDFC Bank
Bombay Dyeing H D F C HDFC
JCT Cipla Indian Oil Corp
Larsen & Toubro NIIT Tata Motors
Nestle India Nirma SAIL
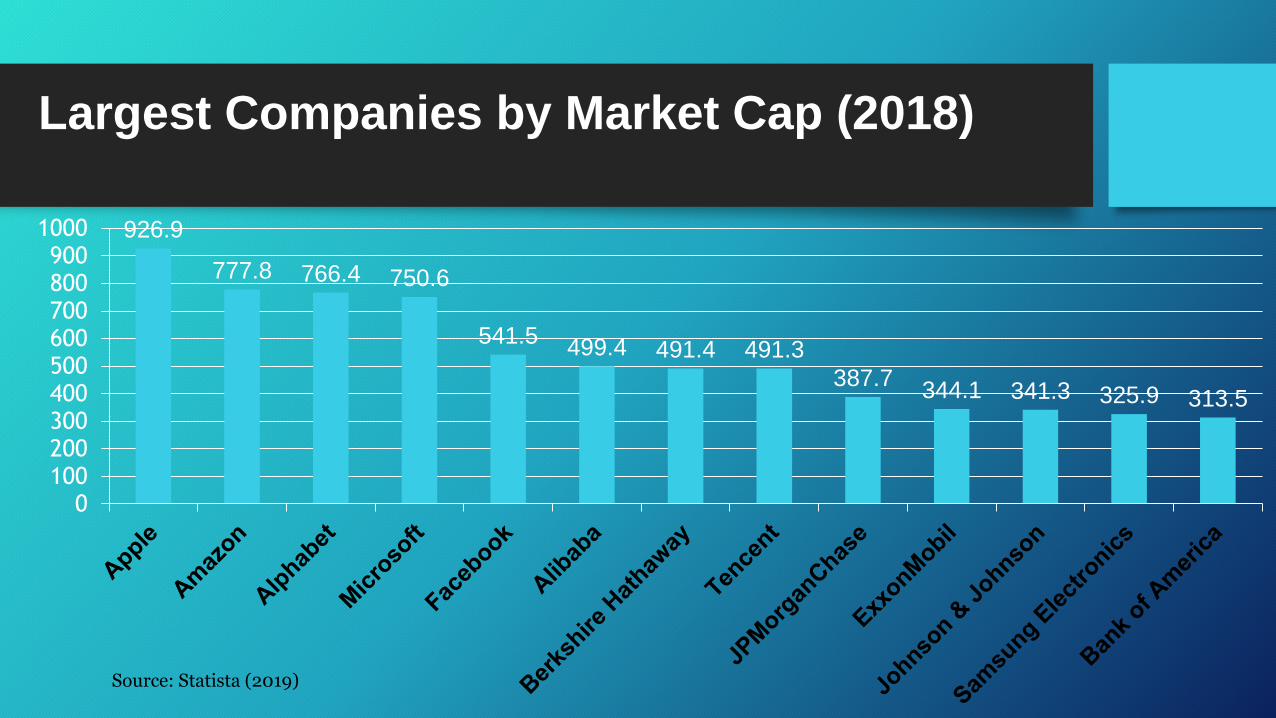
Largest Companies by Market Cap (2018)
926.9
777.8 766.4 750.6
541.5 499.4 491.4 491.3
387.7 344.1 341.3 325.9 313.5
0100200300400500600700800900
1000
Source: Statista (2019)

CORPORATE CONCERNS
• TAX
• INTEREST RATES
• EXCHANGE RATES
• CSR
• LABOUR LAW
• LAND ACQUISITION

Foreign trade timeline post Independence
30
0
5
10
15
20
25
30
35
40
45
50
1950-51 1960-61 1965-66 1970-71 1975-76 1980-81 1985-86 1990-91 1995-96 2000-01 2005-06 2010-11 2011-12 2015-16
X 1
00000 C
RO
RE ₹
Growth of Foreign trade in India
Import Export Total

Exports from India – FY 2018-19 31
Total commodity export USD $330 Billion
Total Services export USD $186.8 Billion
Petroleum Products
Pearl, Precious, Semi
Precious stones
Drug Formulations,
Biologicals
Gold and Other precious metal Jewelry
Iron and Steel
Organic Chemicals
RMG Cotton Incl
accessories
Motor Vehicle / Cars
Electric Machinery & Equipment Products of
Iron and Steel
% OF TOTAL EXPORTS

Export to various regions 32
Asia 49%
America 21%
Africa 9%
Europe 19%
CIS & Baltics 1%
Unspecified Region 1%
EXPORT TO REGIONS
Region Value (in Million
USD)
Asia 160,723.97
America 68,855.04
Africa 28,541.92
Europe 64,380.88
CIS and Baltics 3,467.25
Unspecified region 3,567.09

Tax to GDP ratio
Growth and Challenges

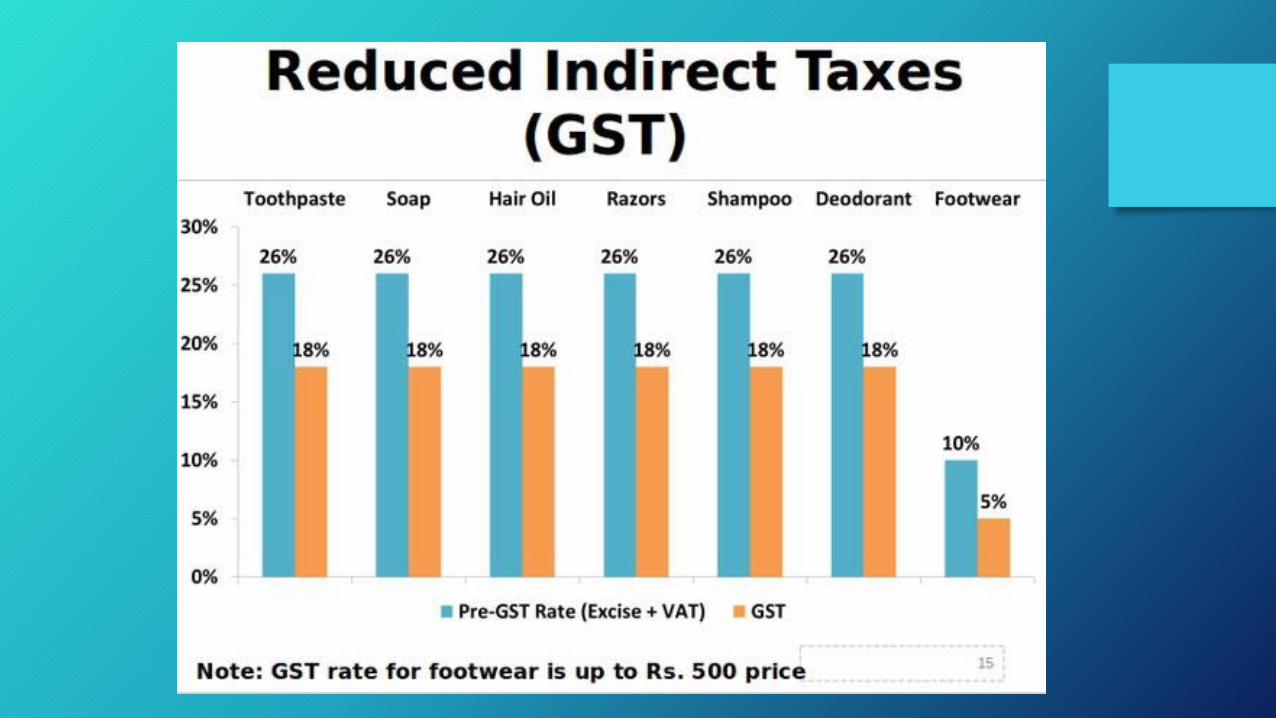
Goods and Services Tax
• One tax slab
• Value added
• Refunds
• Revenue neutral or revenue negative?


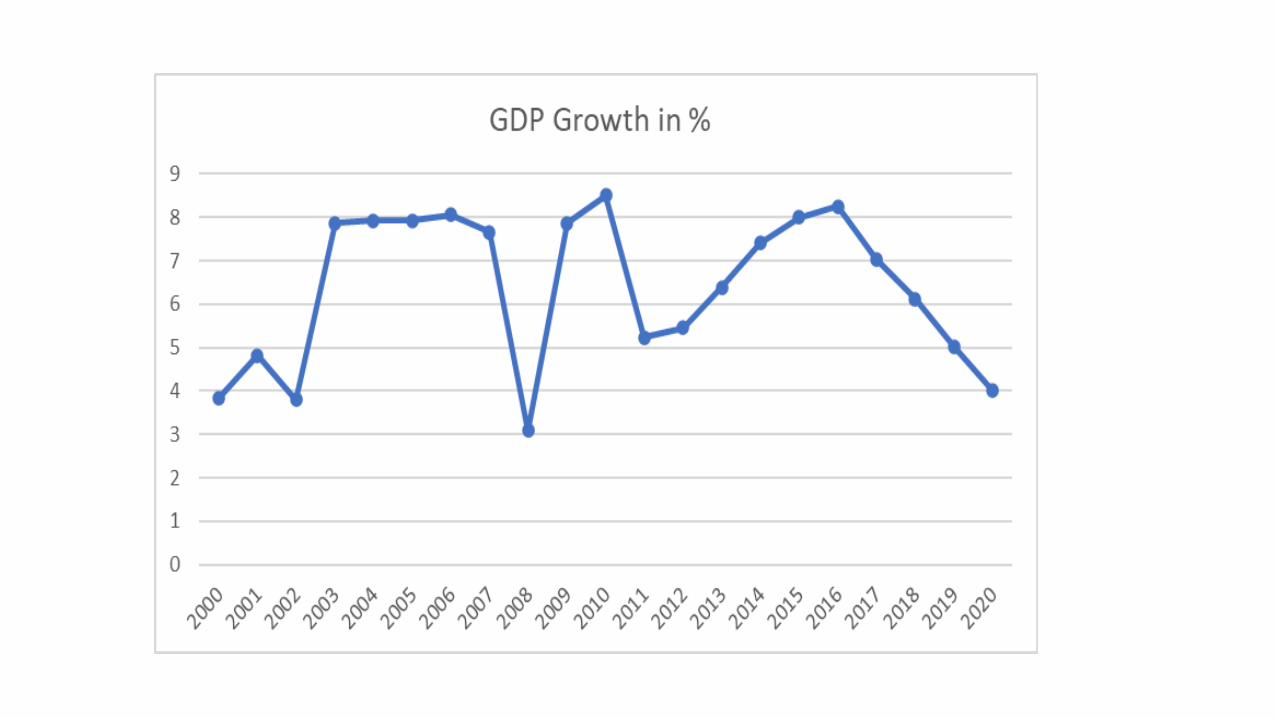
GDP Growth rate in %

GDP Growth Slows down?

0
10
20
30
40
50
60
70
1700 1870 1950 1980 2010 2030 2050
% o
f G
lobal G
DP
Fall and Rise of the Share of Developing Countries in Global
Economic System

Per capita income at constant prices (1950-51=100) India
100
150
200
250
300
350
400
1950 1960 1970 1980 1990 2000

Percentage Share of Industries in GDP in the
Low and Middle Income Countries

Percentage Share of Industries in GDP in China

Percentage Share of Industries in GDP in India
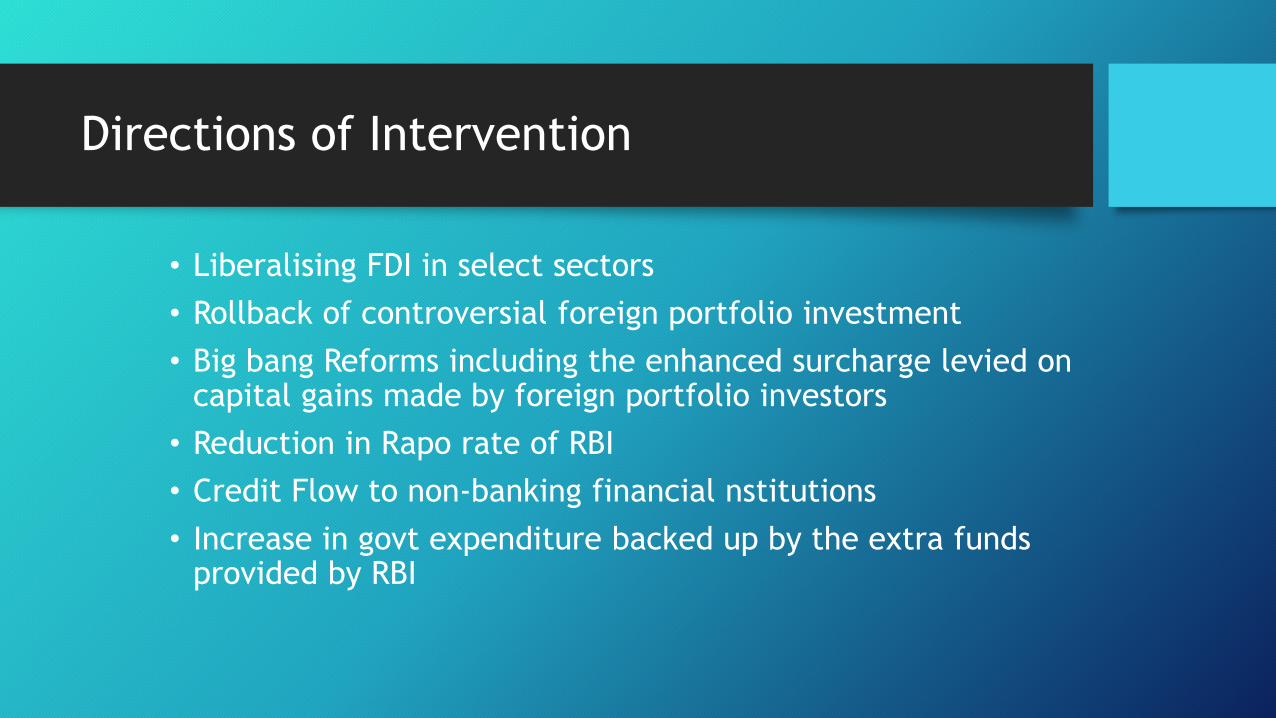
Directions of Intervention
• Liberalising FDI in select sectors
• Rollback of controversial foreign portfolio investment
• Big bang Reforms including the enhanced surcharge levied on capital gains made by foreign portfolio investors
• Reduction in Rapo rate of RBI
• Credit Flow to non-banking financial nstitutions
• Increase in govt expenditure backed up by the extra funds provided by RBI

Middle Income Trap hypothesis Explored
• Current growth driven by 100 million people in upper and middle class
• Phenomenal growth in Automobile, mobile and other items of upper and middle class consumption
• Plateau in the demand of this class
• Sluggish growth in the base of middle class
• Car industry accounting for 7 % of GDP more than housing of 5 %
• Real estate producing vacant houses with 11 million vacant houses in urban areas

Urbanisation
Growth and Challenges

Urban Population %
0
10
20
30
40
50
60
70
80
90
India 1880 China 1920 Indonesia Pakistan Bangladesh Nigeria Ethiopia 1860 Vietnam Phillipines United States

2001
2011 Urban Population… Where is growth happening?
2011

India vs. China
Urbanisation
0
5
10
15
20
25
30
35
40
1950 1960 1970 1980 1990 2000
India
China


Per cent Urban Population and Urban Growth Rates 1901-11
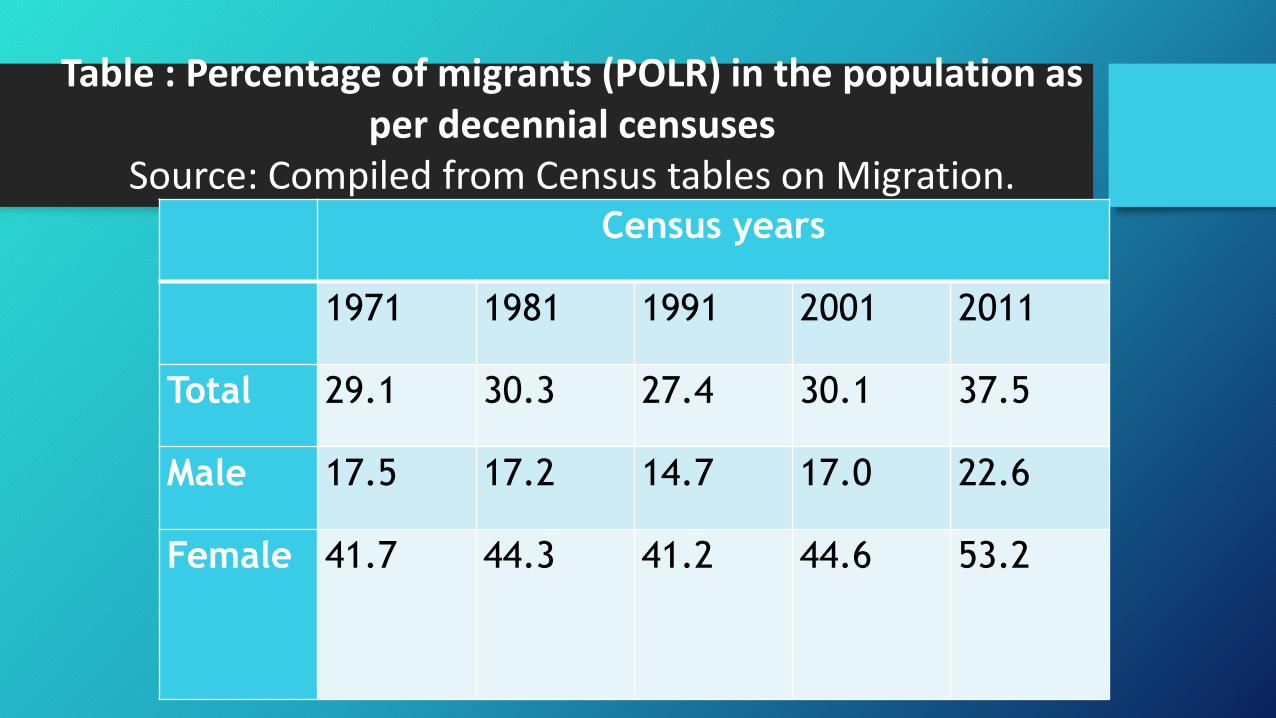
Census years
1971 1981 1991 2001 2011
Total 29.1 30.3 27.4 30.1 37.5
Male 17.5 17.2 14.7 17.0 22.6
Female 41.7 44.3 41.2 44.6 53.2
Table : Percentage of migrants (POLR) in the population as per decennial censuses
Source: Compiled from Census tables on Migration.

Europe Africa Less
Developed
Countries
World
Average
Developed
Countries
Asia South
Central
Asia
India
Percentage of Population in Cities with
Population over 5 million to Total Urban
Population
7.5 9 15 15.5 16 18 23 23.5
Implications of top heavy urban structure: high infrastructural cost, energy
consumption, regional disparity and threat to sustainable development.

Proportion of urban population in different size categories, 1901–2001
0%
25%
50%
75%
100%
1901 1911 1921 1931 1941 1951 1961 1971 1981 1991 2001 2011
Class I Class II Class III Class IV Class V Class VI
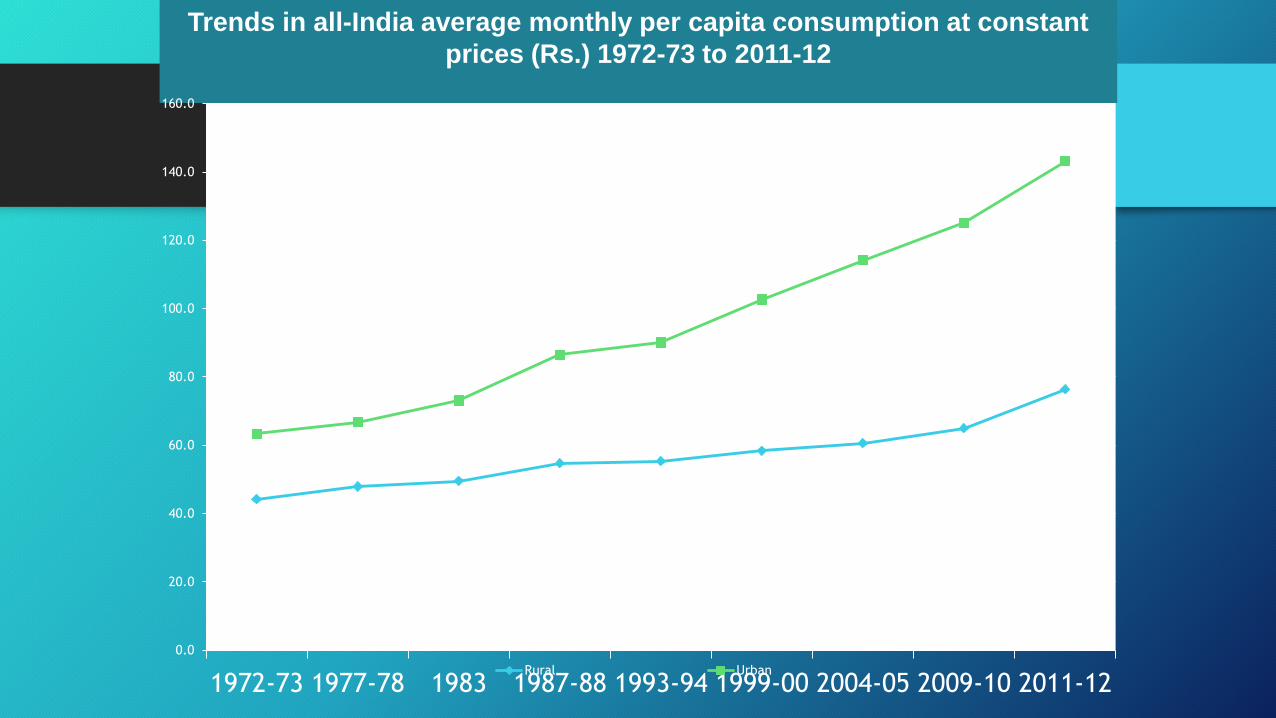
Trends in all-India average monthly per capita consumption at constant
prices (Rs.) 1972-73 to 2011-12
0.0
20.0
40.0
60.0
80.0
100.0
120.0
140.0
160.0
1972-73 1977-78 1983 1987-88 1993-94 1999-00 2004-05 2009-10 2011-12Rural Urban

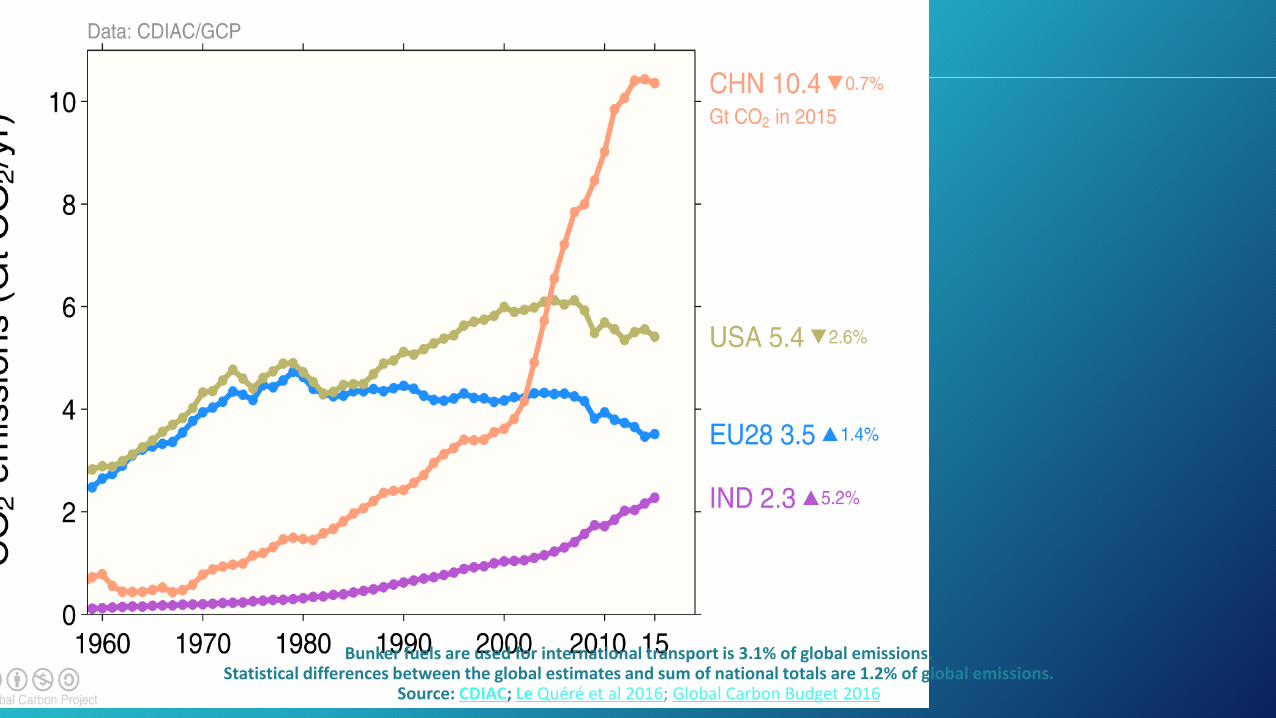
Bunker fuels are used for international transport is 3.1% of global emissions. Statistical differences between the global estimates and sum of national totals are 1.2% of global emissions.
Source: CDIAC; Le Quéré et al 2016; Global Carbon Budget 2016

Empirical Results : Relationship between energy use and PCI & HDI
• Regressing energy consumption on PCI and HDI for 1982 and 2002 using the data for UNDP
• Three categories of countries (a) Below 1,000 KOE
(b) Between 1000 KOE and 3000 KOE and (c) Above 3000 KOE ( 60, 30 and 32 countries respectively)
(c) Relationship strong and positive for low KOE, low for medium an none for high KOE countries
(d) Relation over time remains strong in 2002 but becomes weak for others

Linear Functions relating Level of Urbanization with Per Capita
Income
% U
rban P
opula
tion
Gross National Income (at constant prices of 2005, PPP )


Power Plant Type Cost $/kW-hr
Coal with CCS $0.12-0.13
CC Natural Gas $0.05
CC with CCS $0.075
Nuclear $0.093
Wind onshore $0.059
Wind offshore $0.139
Solar PV $0.063
Solar Thermal $0.165
Geothermal $0.045
Biomass $0.095
Hydro $0.062
COST COMPARISON OF ENERGY SOURCES 2018
Adapted from US DOE2

A Perspective of Policy for Sustainable Development in India
• A strong case for spatially balanced urbanisation permitting increase in emissions for meeting their poverty reduction and other MDG targets. “common but differentiated resp.”
• Erroneous to be complacent about developed countries and India must have self restraining policies and sustainable energy sources
• Change in Life style: A more balanced strategy of urbanisation and shift in energy source like Hydel
• The 12th Plan for distributed urbanisation and development of small towns as in SDG 11.

Unemployment
Growth and Challenges
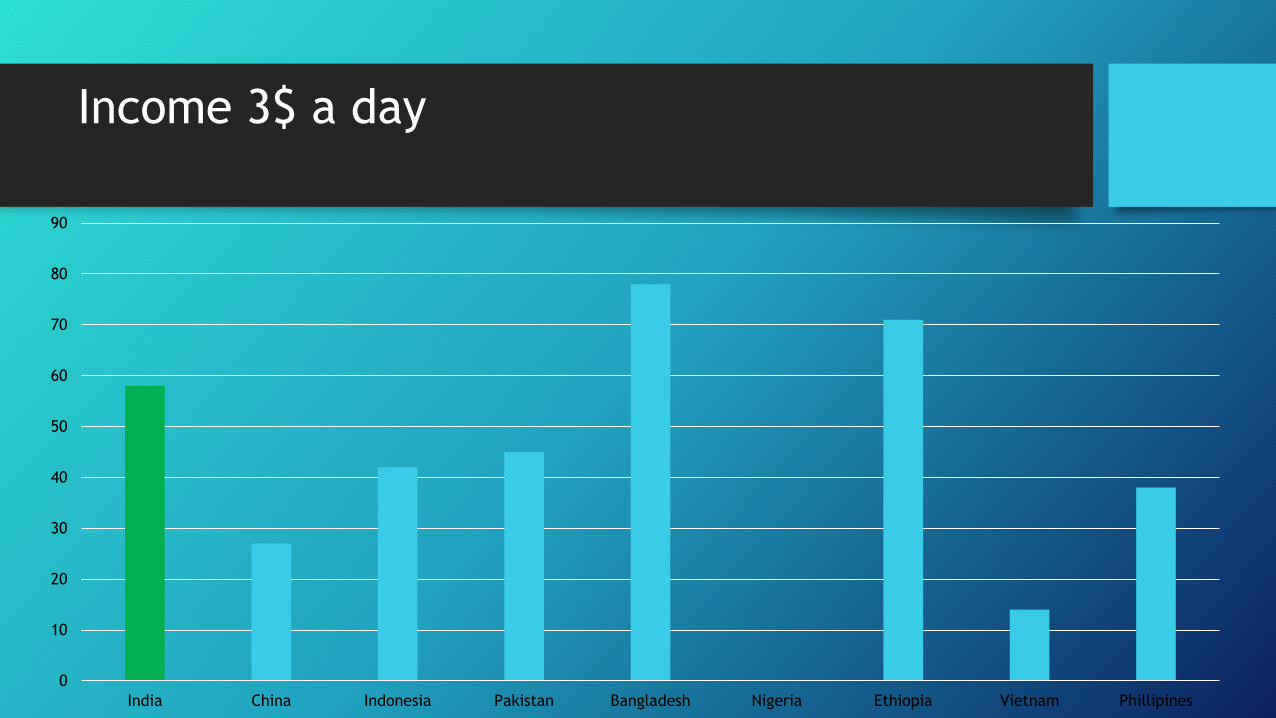
Income 3$ a day
0
10
20
30
40
50
60
70
80
90
India China Indonesia Pakistan Bangladesh Nigeria Ethiopia Vietnam Phillipines

UNEMPLOYMENT

Phillips curve - tradeoff between unemployment and inflation
Consumption demand
• Middle income trap
• Savings rate
• Real growth rate 9%
• Investment to GDP ratio - 39%
• Monetary transmission?

Consumption demand
• Middle income trap
• Savings rate
• Real growth rate 9%
• Investment to GDP ratio - 39%
• Monetary transmission?

Consumption Spending as % of GDP
0
10
20
30
40
50
60
70
80
90
India China Indonesia Pakistan Bangladesh Nigeria Ethiopia Vietnam Phillipines UnitedStates

0
10
20
30
40
50
60
Fuel andLight
Rent Beverages Transport OtherServices
MedicalInstitutional
Durablegoods
Middle class consumption of different items as percent to total consumption
Rural
Metro Cities
Metro cities consuming higher
percentage than towns and villages Rural consuming
higher percentages

SDG Goals
Growth and Challenges


Population growth
Growth and Challenges

Growing India

Population - TFRs of Indian states
Source: Sample Registration System, ORGI, 2014
2.3
1.6 1.7 1.7 1.7 1.7
1.8 1.8 1.8 1.9 1.9
2.1 2.2
2.3 2.3
2.6 2.7
2.8 2.9
3.1
3.4
0.0
0.5
1.0
1.5
2.0
2.5
3.0
3.5
4.0
Tota
l fe
rtilit
y r
ate

Highest and lowest TFRs
• Niger 7.63
• Somalia 6.61
• Mali 6.35
• Chad 6.31
• Angola 6.20
• DR Congo 6.15
• Burundi 6.08
• Uganda 5.91
• Timor-Leste 5.91
• Gambia 5.78
• Hong-Kong 1.20
• Singapore 1.23
• South Korea 1.26
• Moldova 1.27
• Bosnia 1.28
• Portugal 1.28
• Spain 1.32
• Hungary 1.34
• Greece 1.34
Source: World Population Prospects: The 2015 Revision, UN Population Division
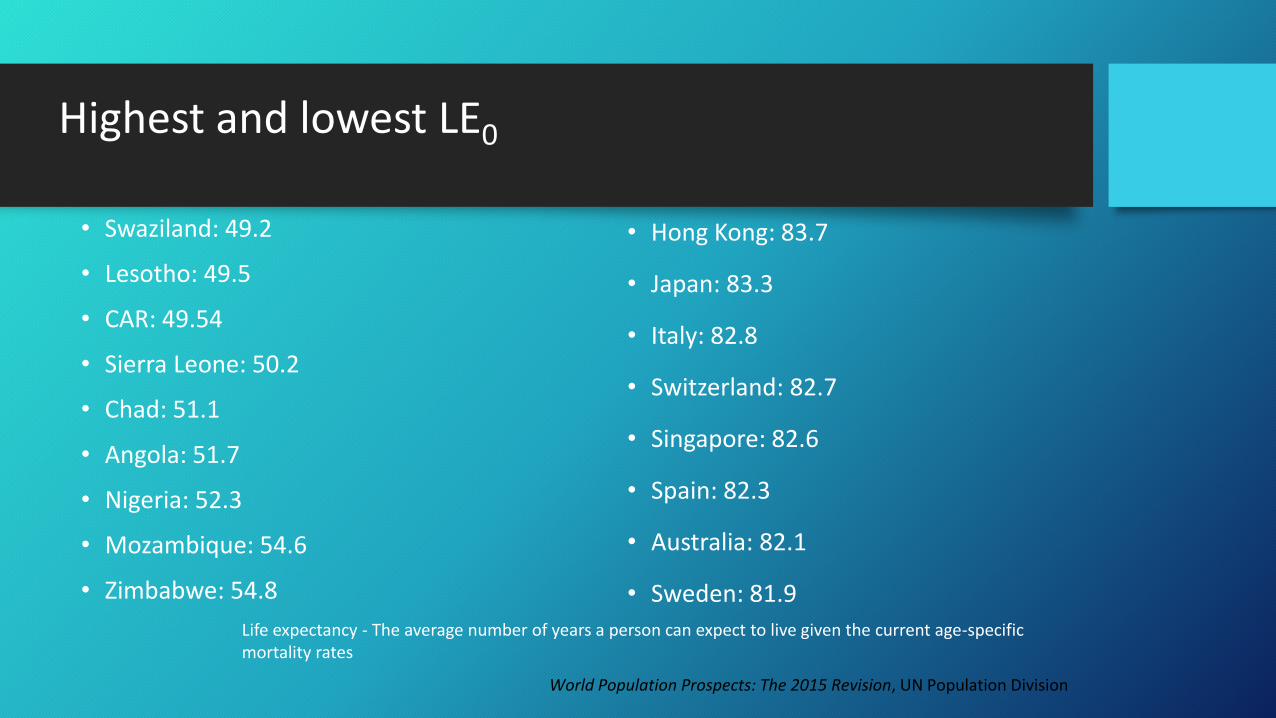
Highest and lowest LE0
• Swaziland: 49.2
• Lesotho: 49.5
• CAR: 49.54
• Sierra Leone: 50.2
• Chad: 51.1
• Angola: 51.7
• Nigeria: 52.3
• Mozambique: 54.6
• Zimbabwe: 54.8
• Hong Kong: 83.7
• Japan: 83.3
• Italy: 82.8
• Switzerland: 82.7
• Singapore: 82.6
• Spain: 82.3
• Australia: 82.1
• Sweden: 81.9
Life expectancy - The average number of years a person can expect to live given the current age-specific mortality rates
World Population Prospects: The 2015 Revision, UN Population Division
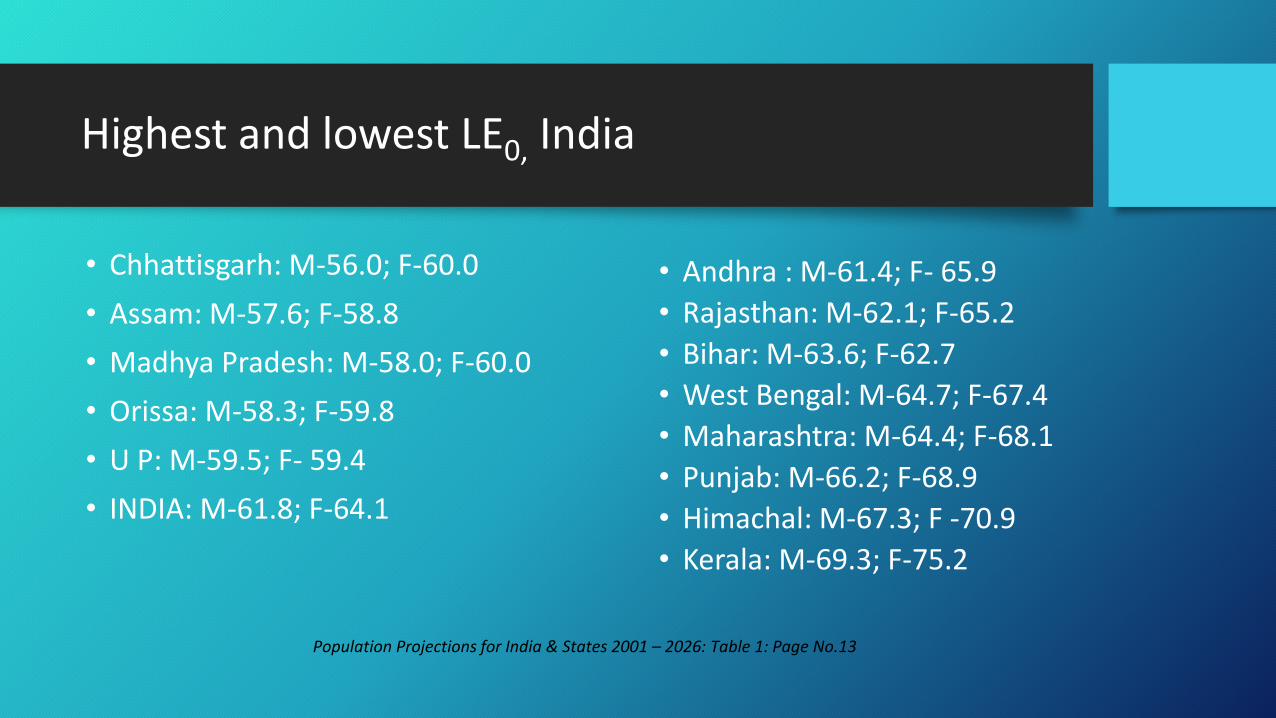
Highest and lowest LE0, India
• Chhattisgarh: M-56.0; F-60.0
• Assam: M-57.6; F-58.8
• Madhya Pradesh: M-58.0; F-60.0
• Orissa: M-58.3; F-59.8
• U P: M-59.5; F- 59.4
• INDIA: M-61.8; F-64.1
• Andhra : M-61.4; F- 65.9
• Rajasthan: M-62.1; F-65.2
• Bihar: M-63.6; F-62.7
• West Bengal: M-64.7; F-67.4
• Maharashtra: M-64.4; F-68.1
• Punjab: M-66.2; F-68.9
• Himachal: M-67.3; F -70.9
• Kerala: M-69.3; F-75.2
Population Projections for India & States 2001 – 2026: Table 1: Page No.13

INEQUALITY
Growth and Challenges

0.0
20.0
40.0
60.0
80.0
100.0
120.0
140.0
160.0
1972-73 1977-78 1983 1987-88 1993-94 1999-00 2004-05 2009-10 2011-12
Rural Urban
Consumption (Rs.) 1972-73 to 2011-12

Poverty and inequality
February 10, 2021 82
Concentration of poverty in states
Per capita incomes – a comparative lens on ‘pattern’
Source: Planning Commission, Data Tables; Economist Intelligence Unit; IMF, World Economic Outlook
$0 $5,000 $10,000 $15,000
Ethiopia
Bihar
Rwanda
Madhya Pradesh
Uttar Pradesh
Assam
Rajasthan
Orissa
West Bengal
Uttarkhand
Andra Pradesh
India
Karnataka
Kerala
Tamil Nadu
Gujarat
Punjab
Maharashtra
Delhi
China
Chandigarh
Brazil
0.0
5.0
10.0
15.0
20.0
25.0
30.0
35.0
40.0
45.0
50.0
Andhra
Pra
desh
Ass
am
Bih
ar
Chhatt
isgarh
Guja
rat
Hary
ana
Him
achal Pra
desh
Jhark
hand
Karn
ata
ka
Kera
la
Madhya P
radesh
Mahara
shtr
a
Ori
ssa
Punja
b
Raja
sthan
Tam
il
Utt
ar
Pra
desh
Utt
ara
khand
West
Bengal
India
Income Education Health HDI
Percentage loss in the three inequality adjusted indices

Healthcare

Public Health Indicators
India
(2006)
Bangladesh
(2007) Proportion of children who are fully
immunized (%) 44 82
Proportion of children who started
breastfeeding within 24 hours (%) 40 89
Proportion of children who receive
Vitamin A supplements (%) 25 88
Proportion of diarrhoea-affected children
treated with ORS (%) 43 85
Proportion of households practising open
defecation (%) 50 7.5

Open Defecation, 2012
Per-capita GDP
(PPP)
% of hohos
practicing OD
India 5,050 48
Sub-Saharan Africa 3,171 25
Low-income countries 1,575 21
Afghanistan 1,892 15
Bangladesh 2,364 3
Vietnam 4,912 2
China 10,771 1

Child Immunization Rates, 2012 (%)
BCG DPT Measles
India 87 72 74
Sub-Saharan Africa 84 77 75
‘Least developed countries’ 84 80 78
Bangladesh 94 95 94
Number of countries doing worse
than India 26 16 25

“Poor health at high cost” (Source: Wikipedia entry on Canada health system)
US UK Canad
a Life expectancy (years) 78 81 81
Infant mortality rate (per
1,000)
6.9 4.8 4.5
Physicians per 1,000 people 2.4 2.5 2.2
Per-cap exp on health (US$) 7,290 2,992 3,895
Health exp as % of GDP 16 8 10
% of health costs paid by
govt
45 82 70

Reforms and Initiatives

Insolvency and Bankruptcy Code

Ayushman Bharat

The Motor Vehicle Act

Foreign Contribution Regulation Act

Swachch Bharat

Make in India

Mudra

Ujjwala

What happened to
• Smart cities
• Bullet trains
• Black money
• 40 Rupees to a dollar
• Jobs
• Land acquisition
• Demon
• Soil cards
• Subsidies
• Tourism
• Start Up India
• Labour law reforms
• Skilling
• Rashtriya Gokul Yojana

Now….
• Fiscal deficit
• Trade deficit
• Private investment
• Foreign investment
• Indian investment abroad
• Manufacturing sector
• Jobs
• Exports
• MSMEs
• Share versus Debt market

The Final frontier

Sex ratio – 1901 to 2011
Source: www.nic.in

Gender

Highest and lowest sex ratios at birth, 2015
• Rwanda: 102
• Sierra Leone: 102
• Togo: 102
• Zimbabwe: 102
• Madagascar: 103
• Kenya: 103
• Malawi: 102
• Burundi: 103
• Mozambique: 103
• China: 116
• Azerbaijan: 116
• Armenia: 114
• Vietnam: 112
• India: 111
• Maldives: 110
• Pakistan: 109
• Singapore: 107
• Sex Ratio - The number of male births per 100 female births • Usually ranges from 103 • May be changed by sex selective abortions
World Population Prospects: The 2015 Revision, UN Population Division

Highest and lowest sex ratios at birth in India
• Punjab: 126
• Haryana: 125
• Gujarat: 118
• Uttar Pradesh: 115
• Delhi: 115
• Rajasthan: 114
• Himachal Pradesh:111
• INDIA: 111
• Assam: 102
• Chhattisgarh: 103
• Andhra Pradesh: 104
• Jharkhand: 104
• West Bengal: 105
• Karnataka: 106
• Tamil Nadu: 107
• Kerala: 108
Population Projections for India & States 2001 – 2026

Highest and lowest LE0, India
• Chhattisgarh: M-56.0; F-60.0
• Assam: M-57.6; F-58.8
• Madhya Pradesh: M-58.0; F-60.0
• Orissa: M-58.3; F-59.8
• U P: M-59.5; F- 59.4
• INDIA: M-61.8; F-64.1
• Andhra : M-61.4; F- 65.9
• Rajasthan: M-62.1; F-65.2
• Bihar: M-63.6; F-62.7
• West Bengal: M-64.7; F-67.4
• Maharashtra: M-64.4; F-68.1
• Punjab: M-66.2; F-68.9
• Himachal: M-67.3; F -70.9
• Kerala: M-69.3; F-75.2
Population Projections for India & States 2001 – 2026: Table 1: Page No.13


![2015 / 16...Southampton FC Stoke City FC Sunderland AFC Swansea City AFC Tottenham Hotspur FC [London ] Watford FC West Bromwich Albion FC West Ham United FC [London ] …](https://img.pdfslide.us/doc/110x75/6147d88ca830d0442101b33e/2015-16-southampton-fc-stoke-city-fc-sunderland-afc-swansea-city-afc-tottenham.jpg)