Embed Size (px)
Citation preview

PIC
K N
PA
Y A
NN
UA
L FINA
NC
IAL S
TATE
ME
NTS
20
21
AU
DIT
ED A
NN
UA
L FI
NA
NC
IAL
STA
TEM
ENTS
FOR
TH
E P
ERIO
D E
ND
ED 2
8 F
EBR
UA
RY
20
21
pick
npay
.com
PICK N PAY STORES LIMITED GROUP 01
Audited Annual Financial Statements 20211
CO
NTE
NTS
01Pick n Pay Stores Limited Group
Directors’ responsibility statement 2
Chief Executive Officer and Chief Finance Officer internal financial control responsibility statement 2
Company Secretary’s certificate 3
Directors’ report 4
Independent auditor’s report 6
Audit, risk and compliance committee report 10
Review of operations 16
Comparable earnings performance 24
Dividend declaration 27
02Group annual financial statements
Statement of comprehensive income 30
Statement of financial position 31
Statement of changes in equity 32
Statement of cash flows 33
Notes to the Group annual financial statements 34
03Company annual financial statements
Statement of comprehensive income 90
Statement of financial position 91
Statement of changes in equity 92
Statement of cash flows 93
Notes to the Company annual financial statements 94
04Additional information
Appendices 102
Analysis of ordinary shareholders 106
Analysis of B shareholders 107
Corporate information 108
These Group and Company annual financial statements have been prepared by the Group’s Finance Division under the supervision of the Chief Finance Officer (CFO), Lerena Olivier, CA(SA).

www.picknpay.com2
Audited Annual Financial Statements 20213
Pick n Pay Stores Limited Group
PICK N PAY STORES LIMITED GROUP 01
DIRECTORS’ RESPONSIBILITY STATEMENT
The directors are responsible for the preparation and fair presentation of the Group annual financial statements and annual financial statements of Pick n Pay Stores Limited (the Company), comprising the statements of financial position at 28 February 2021, and the statements of comprehensive income, changes in equity and cash flows for the period then ended, and the notes to the financial statements which include a summary of significant accounting policies and other explanatory notes, in accordance with International Financial Reporting Standards (IFRS) and the requirements of the Companies Act of South Africa, No 71 of 2008 (Companies Act) and the directors’ report.
The directors are also responsible for such internal control as the directors determine is necessary to enable the preparation of annual financial statements that are free from material misstatement, whether due to fraud or error, and for maintaining adequate accounting records and an effective system of risk management as well as the preparation of the supplementary schedules included in these annual financial statements.
The directors have made an assessment of the ability of the Company and its subsidiaries to continue as going concerns and have no reason to believe that the businesses will not be going concerns in the period ahead.
The auditor is responsible for reporting on whether the Group annual financial statements and annual financial statements of the Company are fairly presented in accordance with the applicable financial reporting framework.
Approval of Group annual financial statements and annual financial statements of the CompanyThe Group annual financial statements and annual financial statements of Pick n Pay Stores Limited, as identified in the first paragraph, were approved by the Board of directors on 20 April 2021 and signed by:
Gareth Ackerman Richard BrasherChairman Chief Executive Officer
In terms of JSE Listings Requirement 3.84(k), the directors, whose names are stated below, hereby confirm that –
a) the annual financial statements set out on pages 30 to 107, fairly present in all material respects the financial position, financial performance and cash flows of the issuer in terms of IFRS;
b) no facts have been omitted or untrue statements made that would make the annual financial statements false or misleading;
c) internal financial controls have been put in place to ensure that material information relating to the Company and its consolidated subsidiaries and associate have been provided to effectively prepare the financial statements of the issuer; and
d) the internal financial controls are adequate and effective and can be relied upon in compiling the annual financial statements. Where we are not satisfied, we have disclosed to the audit committee, and the auditors, the material deficiencies in design and operational effectiveness of the internal financial controls and any fraud that involved directors, and have taken the necessary remedial action.
Richard Brasher Lerena OliverChief Executive Officer Chief Finance Officer
20 April 2021
CHIEF EXECUTIVE OFFICER AND CHIEF FINANCE OFFICER INTERNAL FINANCIAL CONTROL RESPONSIBILITY STATEMENT
Pick n Pay Stores Limited Group
COMPANY SECRETARY’S CERTIFICATE
In my capacity as Company Secretary, I certify that for the period ended 28 February 2021, Pick n Pay Stores Limited has filed all returns and notices as required for a company in terms of section 88(2)(e) of the Companies Act, No 71 of 2008, as amended, and that such returns and notices are, to the best of my belief, true, correct and up to date.
Debra MullerCompany Secretary
20 April 2021
Pick n Pay Stores Limited
www.picknpay.com4
Audited Annual Financial Statements 20215
DIRECTORS’ REPORT
Nature of businessPick n Pay Stores Limited is an investment holding company, which is domiciled and incorporated in the Republic of South Africa and listed on the JSE, the recognised securities exchange in South Africa. The Group comprises subsidiaries and an associate that retail food, clothing, general merchandise, pharmaceuticals and liquor throughout Africa, both on an owned and franchise basis. The Group also acquires and develops strategic retail and distribution sites.
Significant subsidiaries held directly are presented in note 28 of the Group annual financial statements.
Overview of financial results and activitiesRefer to the review of operations on page 16 for an overview of the financial results and activities of the Group.
The Group manages its retail operations on a 52-week trading calendar where the reporting period will always end on a Sunday. To ensure calendar realignment, a 53rd-week of trading is required approximately every six years.
In order to provide useful and transparent comparative information, we have presented our results on a comparable basis by adjusting for the non-comparable effects of IAS 29 Financial Reporting in Hyperinflationary Economies and, in addition have provided further comparable analysis by removing the impact of once-off compensation costs relating to the Group’s severance programmes. Refer to Appendix 2 for further information.
Going concernThe Pick n Pay Group is operating in the unprecedented circumstances created by the global coronavirus (Covid-19) pandemic, with South Africa operating under a National State of Disaster. During the period under review, South Africa was subjected to various stages of lockdown, with Government imposed restrictions on the sale of liquor, tobacco, clothing and general merchandise at different times of the year. Countries in the rest of Africa, in which the Group operates, has implemented similar measures in an attempt to slow down the spread of the virus. Refer to the review of operations on page 16 for information relating to the estimated financial impact of the lockdown on the Group.
The Board of directors (the Board) has performed a formal review of the Company and its subsidiaries’ ability to continue trading as going concerns in the foreseeable future. As part of this review, the Board has given careful consideration to the current Covid-19 pandemic and its impact on the Group. In line with standard governance practice, the Board have made an assessment of the Group’s solvency and liquidity and is satisfied of the Group’s ability to continue as a going concern for the foreseeable future and that the presentation of the annual financial statements on a going concern basis is appropriate.
In accordance with the requirements of the Companies Act, the Group ensures that it complies with the liquidity and solvency requirements for any dividend payment and provision of financial assistance.
Shareholder distributionThe directors have declared a final dividend (dividend 106) of 161.00 cents per share out of income reserves, maintaining the Group’s dividend cover of 1.3 times Comparable Headline Earnings per share. Refer to Appendix 3 for further information on the Group’s Comparable Headline Earnings per share. For further information on the dividend declaration, refer to page 27.
Share capitalAt period end, 6 264 000 shares (2020: 8 485 240 shares) of Pick n Pay Stores Limited were held within the Group in order to settle obligations of share options granted under the Group’s employee share scheme.
In addition, 9 004 500 shares (2020: 7 630 000 shares) of Pick n Pay Stores Limited were held within the Group in order to settle obligations under the Group’s restricted share plan (RSP), previously named the forfeitable share plan (FSP). Dividends in respect of the 2020 RSP awards are deferred until the shares have vested and are paid according to the number of shares that vest on vesting date. Participants of awards prior to 2020 have non-forfeitable rights to the dividends on shares. Refer to note 5 of the Group annual financial statements.
BorrowingsThe Group’s overall level of debt (including bank overdraft and overnight borrowings) increased by R2 297.6 million to R5 282.6 million. The Group has drawn approximately 50% of its available facilities to protect the Group against any short-term market liquidity risks as a result of the Covid-19 pandemic, with all surplus funds invested in high-yield money market accounts. Refer to the review of operations on page 16 for further information on the Group’s net funding position.
Legal proceedingsThe Company and its subsidiaries are not involved, and have not in the 2021 financial period been involved, in any legal or arbitration proceedings which may have or have had a material effect on the financial position of the Group, nor is the Company aware of any such proceedings that are pending or threatened.
PICK N PAY STORES LIMITED GROUP 01
Pick n Pay Stores Limited Group
Special resolutionsOn 4 August 2020, the Company’s shareholders approved the following special resolutions as tabled in the notice to the annual general meeting:
Directors’ fees for the 2021 and 2022 annual financial periodsShareholders approved the directors’ fees.
Provision of financial assistance to related or inter-related companies and othersShareholders resolved, in terms of the provisions of section 45 of the Companies Act, that the Company may from time to time provide direct or indirect financial assistance to any director, prescribed officer, related company, inter-related company or member of a related or inter-related company on such terms and conditions as determined by the Board.
Amendment of Restricted Share Plan (previously named Forfeitable Share Plan)Shareholders approved the amendment of the Rules of the Forfeitable Share Plan to allow for the remuneration committee to vary the entitlement of participants to voting and dividend rights during the vesting period. The Forfeitable Share Plan was renamed to the Restricted Share Plan.
General approval to repurchase Company sharesShareholders resolved that the Company or any of its subsidiaries may acquire issued shares of the Company, upon such terms and conditions and in such amounts as the directors of the Company may determine from time to time.
Acquisition of such shares is subject to the Memorandum of Incorporation of the Company, the provisions of the Companies Act, and the Listings Requirements of JSE, provided further that acquisitions of shares in the Company by the Company and its subsidiaries may not, in the aggregate, exceed in any one financial year 5% of the Company’s issued share capital of the class of repurchased shares.
Directors, prescribed officers and company secretary Refer to note 4 of the Group annual financial statements for a list of directors of the Company for the 2021 financial year.
The non-executive directors listed below retire by rotation and, being eligible, they offer themselves for re-election at the next Annual General Meeting (AGM) on 28 June 2021:
Hugh HermanJeff van Rooyen Audrey MothupiDavid Robins
The director listed below offers himself for election at the next AGM on 28 June 2021:
Pieter Boone (executive), effective 20 April 2021
Richard Brasher will resign as CEO at the end of April 2021, and Pieter Boone will be appointed as CEO and as an executive director on 20 April 2021. Pieter Boone was a prescribed officer up until his date of appointment.
The directors listed below resigned from the Board of directors:
Alex Mathole (effective 4 August 2020)Richard van Rensburg (effective 31 March 2021)
The Company Secretary is Debra Muller.
Directors’ interest in shares Refer to note 4 of the Group annual financial statements and note 8 of the Company annual financial statements for details of the directors’ interest in shares.
Audit, risk and compliance committeeWe draw your attention to the audit, risk and compliance committee report on page 10, where we set out the responsibilities of the committee and how it has discharged these responsibilities during the period.
Gareth Ackerman Richard BrasherChair Chief Executive Officer
20 April 2021
PICK N PAY STORES LIMITED GROUP 01
Audited Annual Financial Statements 20217
www.picknpay.com6
To the shareholders of Pick n Pay Stores Limited
INDEPENDENT AUDITOR’S REPORT
Report on the Audit of the Consolidated and Separate Financial StatementsOpinionWe have audited the consolidated and separate financial statements of Pick n Pay Stores Limited and its subsidiaries (‘the group’) and company set out on pages 30 to 87 and pages 90 to 99, which comprise of the consolidated and separate statements of financial position as at 28 February 2021, the consolidated and separate statements of comprehensive income, the consolidated and separate statements of changes in equity and the consolidated and separate statements of cash flows for the year then ended, and notes to the consolidated and separate financial statements, including a summary of significant accounting policies.
In our opinion, the consolidated and separate financial statements present fairly, in all material respects, the consolidated and separate financial position of the group and company as at 28 February 2021, and its consolidated and separate financial performance and consolidated and separate cash flows for the year then ended in accordance with International Financial Reporting Standards and the requirements of the Companies Act of South Africa.
Basis for Opinion We conducted our audit in accordance with International Standards on Auditing (ISAs). Our responsibilities under those standards are further described in the Auditor’s Responsibilities for the Audit of the consolidated and separate financial statements section of our report. We are independent of the group and company in accordance with the Independent Regulatory Board for Auditors’ Code of Professional Conduct for Registered Auditors (IRBA Code)
and other independence requirements applicable to performing audits of financial statements of the group and company and in South Africa. We have fulfilled our other ethical responsibilities in accordance with the IRBA Code and in accordance with other ethical requirements applicable to performing audits of the group and company and in South Africa. The IRBA Code is consistent with the corresponding sections of the International Ethics Standards Board for Accountants’ International Code of Ethics for Professional Accountants (including International Independence Standards). We believe that the audit evidence we have obtained is sufficient and appropriate to provide a basis for our opinion.
Key Audit MattersKey audit matters are those matters that, in our professional judgement, were of most significance in our audit of the consolidated and separate financial statements of the current period. These matters were addressed in the context of our audit of the consolidated and separate financial statements as a whole, and in forming our opinion thereon, and we do not provide a separate opinion on these matters. For each matter below, our description of how our audit addressed the matter is provided in that context.
We have fulfilled the responsibilities described in the Auditor’s Responsibilities for the Audit of the consolidated and separate financial statements section of our report, including in relation to these matters. Accordingly, our audit included the performance of procedures designed to respond to our assessment of the risks of material misstatement of the consolidated and separate financial statements. The results of our audit procedures, including the procedures performed to address the matters below, provide the basis for our audit opinion on the accompanying consolidated and separate financial statements.
The key audit matters only apply to the audit of the consolidated financial statements.
Key audit matter How the matter was addressed in the audit
Cash Generating Units (CGU) and Goodwill Impairment
Goodwill for the Group has a carrying value of R603.5 million at 28 February 2021 (2020: R444.1 million). Goodwill originated from the purchase of subsidiaries in prior years, and the purchase of individual stores in the current and in prior years.
Management performs a goodwill impairment test annually and applies judgement in determining the assumptions and inputs to calculate the fair value less costs of disposal and value-in-use to be used as the recoverable amount for each cash generating unit (subsidiaries and stores).
In light of Covid-19 related impacts on consumer behaviour and a weakened economy, we focused our attention on the assumptions applied and inputs used by management in forecasting cash flows as well as those used in the calculation of fair value less costs of disposal, including forecast growth rates for the explicit and terminal forecast periods and forecast trading margins. Furthermore, we focused our attention on the assumptions and inputs used in calculating discount rates, including the judgement involved in quantifying a specific risk premium for the increased number of stores to which the goodwill is attributable due to the significant increase in stores purchased compared to prior periods.
The difficult trading environment and deteriorating macro-economic outlook in the current year, the assessment of the reasonableness of assumptions relating to cash flow forecasts required robust dialogue and extensive use of internal valuation specialists in determining what adjustments are reasonable compared to prior periods given that some of the changes in current year performance may be isolated to the impact of lockdown and others to ongoing macro-economic factors. Accordingly, the matter has been considered a key audit matter.
The disclosures required by the standard for goodwill are included in notes 1.6, 1.7 and 9 of the financial statements.
Our procedures relating to the impairment assessment of goodwill recognised on the purchase of stores included, amongst others:
• In conjunction with our internal valuation specialists: » Evaluating the methodology applied by management in determining the fair value less costs of disposal and value in use for cash generating units, with reference to the requirements of accounting standards and our knowledge of the business;
» Evaluating the key assumptions and judgements in management’s forecasts, including the revenue growth rates, trading margins, cost growth rate assumptions, working capital and capital expenditure cash flows, and the weighted average cost of capital used to discount the forecast cash flows, by assessing the reasonableness of key assumptions against historic performance and market information;
» Assessing the discount rates against external market references and recalculating the discount rates used;
» Assessing the assumptions and calculations of fair value less cost of disposal for cash generating units with reference to recent market transactions and to evaluate the reasonableness of management’s assessments.
• Recalculating management’s discounted cash flow models for arithmetical accuracy.
• In conjunction with our internal financial reporting specialists, we assessed the completeness and accuracy of the disclosures relating to the impairment assessments with reference to the requirements of IAS 36 Impairment of Assets.
PICK N PAY STORES LIMITED GROUP 01
Audited Annual Financial Statements 20219
www.picknpay.com8
INDEPENDENT AUDITOR’S REPORT (continued)
Key audit matter How the matter was addressed in the audit
IFRS 16 Leases
The Group’s statement of financial position reflects right-of-use (‘ROU’) assets, net investment in leases, and lease liabilities with carrying values as at 28 February 2021 totalling R10 050.6 million, R2 411.2 million and R16 359.4 million respectively. The right-of-use assets represent 26.6% of the total assets of the group and lease liabilities represent 47.5% of the total liabilities.
The group has numerous property and non-property lease contracts where management are required to make significant judgments in the initial recognition of new leases and for the subsequent measurement of existing ROU assets and lease liabilities.
Lockdown-related trade restrictions arising from efforts by government to curb the Covid-19 pandemic impacted lease contracts in the form of rent concessions and separately resulted in a potential impairment indicator for the cash generating units containing the ROU assets and net investment in leases.
This resulted in a key audit matter in the current year due to the extent of auditor effort and involvement of internal specialists required in the evaluation of managements significant judgements and application of complex accounting principles to the volume and value of lease movements including:
• Recognition of new agreements on the appropriate commencement date;
• Determination and application of inherent borrowing rates impacted by change in market lending rates;
• Establishing the lease term including any renewal options that are reasonably certain to be elected;
• Identification of circumstances classified as contract reassessments or modifications, requiring subsequent remeasurement and the complexity involved in accounting for these frequent events;
• Assessing the impact of Covid-19 with regards to rent concessions; • Assessing the ROU assets and net investment in leases
for impairment and whether the extent of impairment was appropriate (where applicable).
The disclosures required by the standard for these balances and their related transactions are contained in notes 1.6, 1.9, 1.10, 1.17, 11, 12 and 24.
Our procedures, amongst others, included:
• We evaluated management’s policies, processes and controls to identify, capture and account for active leases across the group by obtaining an understanding of the system through discussions with management and assessing it against the requirements of IFRS16.
• For a sample from the approved store opening roster, we compared the commencement date to the IFRS 16 lease database to evaluate the completeness of property leases identified by management and for the accuracy of the commencement dates – accompanied by year on year analytics on revenue, issue of inventory to franchisees, and inventory held per store.
• For a sample of lease contracts, we: » inspected the terms and conditions of the underlying contracts
and evaluated management’s identification of relevant lease terms to determine whether the leases were correctly accounted for in terms of the standard and for the correct lease term;
» inspected the details of the contract to assess the accuracy of management’s determination of the commencement date and the lease end date (considering option periods contained in the contract);
» assessed the accuracy of the discount rates determined by management with reference to entity-specific borrowing rates and external market data with the assistance of our internal quantitative analyst specialists;
» recalculated the lease liabilities, ROU assets, finance costs and depreciation based on the underlying contractual terms;
» reperformed the calculation of the modification and reassessment impacts on the ROU assets and lease liabilities with reference to terms in renewed or amended contracts.
• Evaluating management’s impairment assessments included the procedures and considerations with respect to the assessment of cash generating unit impairment as described in the above KAM and included:
» considering impairment indicators with reference to store profits and the wider economic environment;
» assessing a sample of ROU assets’ impairment in line with IAS 36 by evaluating the recoverable amount of the related cash generating units with reference to recent market transactions; and
» assessing a sample of net investment in lease receivables by recalculating the expected credit loss, assessing the probability of default and loss given default with the assistance of our internal quantitative analyst specialists, and verifying the calculation inputs to source documentation
• Assessing the adequacy of the disclosures made by management with reference to the requirements of IFRS 16, with the assistance of our internal financial reporting specialists where appropriate.
Other Information The directors are responsible for the other information. The other information comprises the information included in the 108-page document titled “Pick n Pay Audited Annual Financial Statements for the period ended 28 February 2021,” which includes the Company Secretary’s certificate, Directors’ report, and the Audit, risk and compliance committee report as required by the Companies Act of South Africa and the Directors’ responsibility statement, Chief Executive Officer and Chief Finance Officer Internal Financial Control Responsibility Statement, Review of operations, Dividend Declaration, Analysis of ordinary shareholders, Analysis of B shareholders, Appendices, and Corporate Information which we obtained prior to the date of this report, and the Integrated Annual Report and Corporate Governance Report, which are expected to be made available to us after that date. Other information does not include the consolidated and separate financial statements and our auditor’s report thereon.
Our opinion on the consolidated and separate financial statements does not cover the other information and we do not express an audit opinion or any form of assurance conclusion thereon.
In connection with our audit of the consolidated and separate financial statements, our responsibility is to read the other information and, in doing so, consider whether the other information is materially inconsistent with the consolidated and separate financial statements or our knowledge obtained in the audit, or otherwise appears to be materially misstated. If, based on the work we have performed, we conclude that there is a material misstatement of this other information, we are required to report that fact. We have nothing to report in this regard.
Responsibilities of the Directors for the Consolidated and Separate Financial Statements The directors are responsible for the preparation and fair presentation of the consolidated and separate financial statements in accordance with International Financial Reporting Standards and the requirements of the Companies Act of South Africa, and for such internal control as the directors determine is necessary to enable the preparation of consolidated and separate financial statements that are free from material misstatement, whether due to fraud or error.
In preparing the consolidated and separate financial statements, the directors are responsible for assessing the group and company’s ability to continue as a going concern, disclosing, as applicable, matters related to going concern and using the going concern basis of accounting unless the directors either intend to liquidate the group and company or to cease operations, or have no realistic alternative but to do so.
Auditor’s Responsibilities for the Audit of the Consolidated and Separate Financial StatementsOur objectives are to obtain reasonable assurance about whether the consolidated and separate financial statements as a whole are free from material misstatement, whether due to fraud or error, and to issue an auditor’s report that includes our opinion. Reasonable assurance is a high level of assurance but is not a guarantee that an audit conducted in accordance with ISAs will always detect a material misstatement when it exists. Misstatements can arise from fraud or error and are considered material if, individually or in the aggregate, they could reasonably be expected to influence the economic decisions of users taken on the basis of these consolidated and separate financial statements.
As part of an audit in accordance with ISAs, we exercise professional judgement and maintain professional scepticism throughout the audit. We also:
• Identify and assess the risks of material misstatement of the consolidated and separate financial statements, whether due to fraud or error, design and perform audit procedures responsive to those risks, and obtain audit evidence that is sufficient and appropriate to provide a basis for our opinion. The risk of not detecting a material misstatement resulting from fraud is higher than for one resulting from error, as fraud may involve collusion, forgery, intentional omissions, misrepresentations, or the override of internal control.
• Obtain an understanding of internal control relevant to the audit in order to design audit procedures that are appropriate in the circumstances, but not for the purpose of expressing an opinion on the effectiveness of the group and company’s internal control.
• Evaluate the appropriateness of accounting policies used and the reasonableness of accounting estimates and related disclosures made by the directors.
• Conclude on the appropriateness of the directors’ use of the going concern basis of accounting and based on the audit evidence obtained, whether a material uncertainty exists related to events or conditions that may cast significant doubt on the group and company’s ability to continue as a going concern. If we conclude that a material uncertainty exists, we are required to draw attention in our auditor’s report to the related disclosures in the consolidated and separate financial statements or, if such disclosures are inadequate, to modify our opinion. Our conclusions are based on the audit evidence obtained up to the date of our auditor’s report. However, future events or conditions may cause the group and/or the company to cease to continue as a going concern.
• Evaluate the overall presentation, structure and content of the consolidated and separate financial statements, including the disclosures, and whether the consolidated and separate financial statements represent the underlying transactions and events in a manner that achieves fair presentation.
• Obtain sufficient appropriate audit evidence regarding the financial information of the entities or business activities within the group to express an opinion on the consolidated and separate financial statements. We are responsible for the direction, supervision and performance of the group audit. We remain solely responsible for our audit opinion.
We communicate with the directors regarding, among other matters, the planned scope and timing of the audit and significant audit findings, including any significant deficiencies in internal control that we identify during our audit.
We also provide the directors with a statement that we have complied with relevant ethical requirements regarding independence, and to communicate with them all relationships and other matters that may reasonably be thought to bear on our independence, and where applicable, actions taken to eliminate threats or safeguards applied.
From the matters communicated with the directors, we determine those matters that were of most significance in the audit of the consolidated and separate financial statements of the current period and are therefore the key audit matters. We describe these matters in our auditor’s report unless law or regulation precludes public disclosure about the matter or when, in extremely rare circumstances, we determine that a matter should not be communicated in our report because the adverse consequences of doing so would reasonably be expected to outweigh the public interest benefits of such communication.
Report on Other Legal and Regulatory Requirements In terms of the IRBA Rule published in Government Gazette Number 39475 dated 4 December 2015, we report that Ernst & Young Inc. has been the auditor of Pick n Pay Stores Limited for 6 years.
Ernst & Young Inc.
Director: Tina Lesley Rookledge Registered AuditorChartered Accountant (SA)
3rd Floor, Waterway House3 Dock Road, V&A WaterfrontCape Town
20 April 2021
PICK N PAY STORES LIMITED GROUP 01
www.picknpay.com10
Audited Annual Financial Statements 202111
Pick n Pay Stores Limited Group
AUDIT, RISK AND COMPLIANCE COMMITTEE REPORT
IntroductionThe committee provides independent oversight of the effectiveness of assurance functions and services, the integrity of external financial reporting, the annual financial statements, and risk governance and compliance.
The Board of directors (the Board) retains the overall responsibility to review and approve the annual financial statements for the Group and the Company, as well as Group-wide risk governance.
The Board acknowledges that it will be exposed to certain risks in order to achieve sustainable growth in the fast-moving consumer goods industry in South Africa and on the rest of the African continent. The Board’s focus on risk and compliance management is aimed at maintaining an appropriate balance between risk and reward, protecting all stakeholders against avoidable risks and mitigating the impact of unavoidable risks.
The Board has delegated to the committee the statutory and regulatory duties arising from the Companies Act, No 71 of 2008 as amended (the Companies Act) and the JSE Listings Requirements, as well as risk governance and compliance. The committee takes responsibility for developing, communicating and monitoring financial and risk management policies and processes across all divisions in the Group and ensures that adequate systems are in place to identify, evaluate and manage key business risks. The committee ensures that it dedicates sufficient time to assurance functions, financial reporting and risk governance and compliance.
The Pick n Pay Group is operating in the unprecedented circumstances created by the global Covid-19 pandemic. South Africa has operated under a National State of Disaster and subject to an extended lockdown for over a year. Countries in the rest of Africa, in which the Group operates, implemented similar lockdown measures in an attempt to slow the spread of the pandemic. As an essential service provider, the Group has embraced its responsibility, with the active participation of the committee, to support consumers with vital access to essential consumer goods during the lockdown, notwithstanding the constrained operating circumstances.
Novel coronavirus pandemic (Covid-19) and its impact on the activities of the committeeThe Covid-19 pandemic and extended lockdown continue to have a significant impact on the economies in which the Group operates. In response to this, and as informed by the committee, the Group has expanded its risk strategy and framework regarding crisis management to specifically address the Covid-19 pandemic. The guidance and amendments to regulations published by the JSE, IFRS and SAICA regarding the Group’s reporting obligations were closely monitored. Internal controls impacted by the pandemic have been assessed, monitored and amended where relevant. In addition, business continuity and disaster recovery plans were assessed and, where necessary, amended.
Composition and activities of the committee A standing statutory committee, it is chaired by an independent non-executive director and comprises only independent non-executive directors. In accordance with the requirements of the Companies Act, members of the committee are appointed annually by the Board for the ensuing financial period and are elected by shareholders at the annual general meeting. Fees paid to committee members are disclosed in the annual Corporate Governance Report available on the Group’s website at www.picknpayinvestor.co.za. Hugh Herman retired from the committee at the close of the 2021 financial period. The committee thanks him for his years of valued service. Independent non-executive director Haroon Bhorat was appointed to the committee by the Board with effect from 1 March 2021 and will be presented to shareholders for election at the 2021 annual general meeting.
The committee meets formally twice a year with the Chair, the Chief Executive Officer, the Chief Finance Officer, the head of the internal audit function, the head of risk and the external auditors in attendance. The committee has the right to invite other Board members, executives and external advisors to attend any meeting. In addition, the committee chair meets with executives, the head of risk and the internal and external auditors whenever necessary. The head of risk and the internal and external auditors have unfettered access to the committee and its members throughout the year. Formal minutes of meetings are made available to members of the committee and are available on request to all members of the Board. The effectiveness of the committee is assessed as part of the annual Board and committee self-evaluation process.
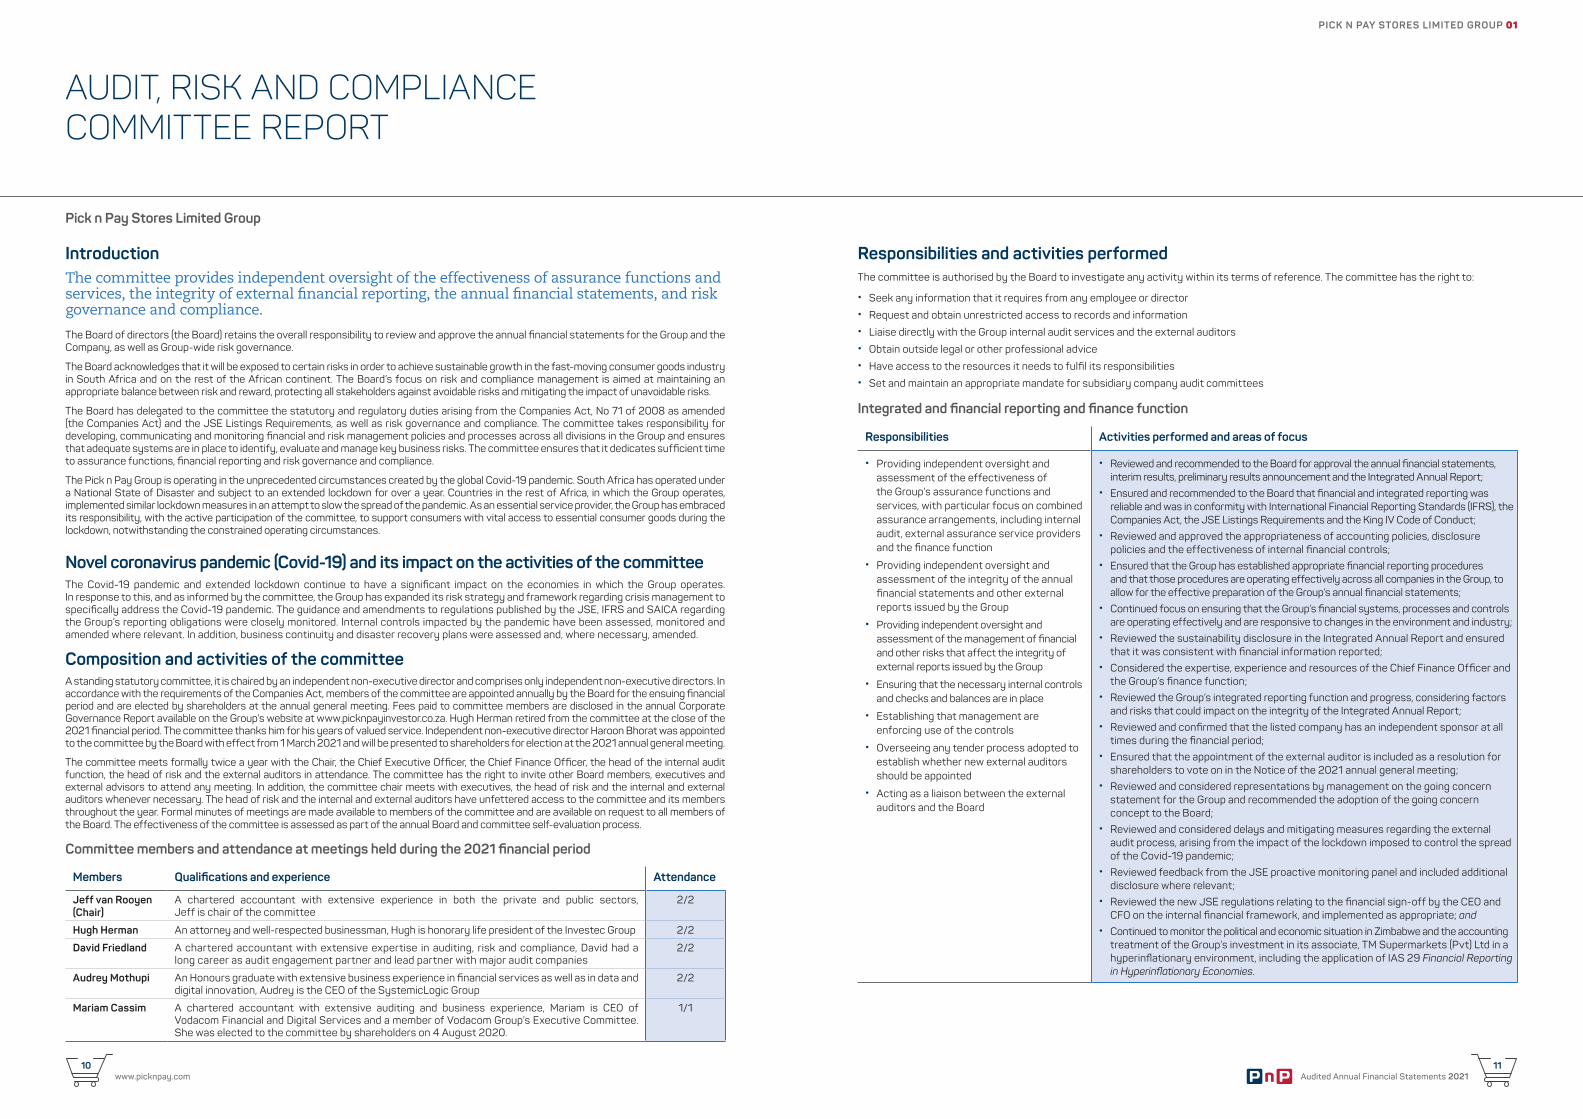
Committee members and attendance at meetings held during the 2021 financial period
Members Qualifications and experience Attendance
Jeff van Rooyen (Chair)
A chartered accountant with extensive experience in both the private and public sectors, Jeff is chair of the committee
2/2
Hugh Herman An attorney and well-respected businessman, Hugh is honorary life president of the Investec Group 2/2
David Friedland A chartered accountant with extensive expertise in auditing, risk and compliance, David had a long career as audit engagement partner and lead partner with major audit companies
2/2
Audrey Mothupi An Honours graduate with extensive business experience in financial services as well as in data and digital innovation, Audrey is the CEO of the SystemicLogic Group
2/2
Mariam Cassim A chartered accountant with extensive auditing and business experience, Mariam is CEO of Vodacom Financial and Digital Services and a member of Vodacom Group’s Executive Committee. She was elected to the committee by shareholders on 4 August 2020.
1/1
Responsibilities and activities performedThe committee is authorised by the Board to investigate any activity within its terms of reference. The committee has the right to:
• Seek any information that it requires from any employee or director • Request and obtain unrestricted access to records and information • Liaise directly with the Group internal audit services and the external auditors • Obtain outside legal or other professional advice • Have access to the resources it needs to fulfil its responsibilities • Set and maintain an appropriate mandate for subsidiary company audit committees
Integrated and financial reporting and finance function
Responsibilities Activities performed and areas of focus
• Providing independent oversight and assessment of the effectiveness of the Group’s assurance functions and services, with particular focus on combined assurance arrangements, including internal audit, external assurance service providers and the finance function
• Providing independent oversight and assessment of the integrity of the annual financial statements and other external reports issued by the Group
• Providing independent oversight and assessment of the management of financial and other risks that affect the integrity of external reports issued by the Group
• Ensuring that the necessary internal controls and checks and balances are in place
• Establishing that management are enforcing use of the controls
• Overseeing any tender process adopted to establish whether new external auditors should be appointed
• Acting as a liaison between the external auditors and the Board
• Reviewed and recommended to the Board for approval the annual financial statements, interim results, preliminary results announcement and the Integrated Annual Report;
• Ensured and recommended to the Board that financial and integrated reporting was reliable and was in conformity with International Financial Reporting Standards (IFRS), the Companies Act, the JSE Listings Requirements and the King IV Code of Conduct;
• Reviewed and approved the appropriateness of accounting policies, disclosure policies and the effectiveness of internal financial controls;
• Ensured that the Group has established appropriate financial reporting procedures and that those procedures are operating effectively across all companies in the Group, to allow for the effective preparation of the Group’s annual financial statements;
• Continued focus on ensuring that the Group’s financial systems, processes and controls are operating effectively and are responsive to changes in the environment and industry;
• Reviewed the sustainability disclosure in the Integrated Annual Report and ensured that it was consistent with financial information reported;
• Considered the expertise, experience and resources of the Chief Finance Officer and the Group’s finance function;
• Reviewed the Group’s integrated reporting function and progress, considering factors and risks that could impact on the integrity of the Integrated Annual Report;
• Reviewed and confirmed that the listed company has an independent sponsor at all times during the financial period;
• Ensured that the appointment of the external auditor is included as a resolution for shareholders to vote on in the Notice of the 2021 annual general meeting;
• Reviewed and considered representations by management on the going concern statement for the Group and recommended the adoption of the going concern concept to the Board;
• Reviewed and considered delays and mitigating measures regarding the external audit process, arising from the impact of the lockdown imposed to control the spread of the Covid-19 pandemic;
• Reviewed feedback from the JSE proactive monitoring panel and included additional disclosure where relevant;
• Reviewed the new JSE regulations relating to the financial sign-off by the CEO and CFO on the internal financial framework, and implemented as appropriate; and
• Continued to monitor the political and economic situation in Zimbabwe and the accounting treatment of the Group’s investment in its associate, TM Supermarkets (Pvt) Ltd in a hyperinflationary environment, including the application of IAS 29 Financial Reporting in Hyperinflationary Economies.
Audited Annual Financial Statements 202113
www.picknpay.com12
PICK N PAY STORES LIMITED GROUP 01
Internal auditA risk-based methodology is used to identify material business risks, which informs aspects of the internal audit plan as part of the Group’s annual combined assurance plan. The internal audit function is independent of business operations and provides assurance on the adequacy and effectiveness of internal controls.
Responsibilities Activities performed and areas of focus
• Reviewing and approving the internal audit charter and audit plans
• Evaluating the independence, effectiveness and performance of the internal audit function and compliance with its mandate
• Reviewing the Group’s system of internal control, including financial controls, ensuring that management is adhering to and continually improving these controls
• Reviewing significant issues raised by the internal audit process
• Reviewing policies and procedures for preventing and detecting fraud
• Reviewed the internal audit coverage plan; • Considered and confirmed the composition, experience, resources, independence
and skills of the internal audit function; • Considered and confirmed that the head of the internal audit function has the
appropriate expertise and experience for the position; • Ensured continued progress in integration with the combined assurance model; • Reviewed the effectiveness of internal financial controls; and • Met separately with the internal auditors to confirm that they received the full
co-operation of management.
External audit Following a tender process, Ernst & Young Inc. (EY) was appointed as external auditor to the Group in July 2015, bringing their tenure to six years.
The committee annually considers whether a tender process should be adopted to establish whether new external auditors should be appointed. The Independent Regulatory Board for Auditors’ (IRBA) rule on mandatory audit firm rotation was taken into consideration. In terms of the rule, the external auditor firm would be rotated in the financial period ended 2026. The committee concluded that a new tender process was not required in the 2022 financial period.
In terms of section 92 of the Companies Act, the designated auditor of a company is required to be rotated after serving as a company’s auditor for five consecutive financial years. Tina Rookledge was appointed as the new designated audit partner for the 2021 financial period, following the prior five-year tenure of Malcolm Rapson as designated audit partner. Tina Rookledge has been assessed to have the necessary competence, ability and independence required for this position.
“The committee confirmed its satisfaction with the performance and level of service rendered by EY during the 2021 financial period.”
Responsibilities Activities performed and areas of focus
• Acting as a liaison between the external auditors and the Board
• Nominating the external auditor for appointment by shareholders
• Determining annually the scope of audit and non-audit services that the external auditors may provide to the Group
• Approving the remuneration of the external auditors and assessing their performance
• Assessing annually the independence of the external auditors
• Ensuring a process is in place for the committee to be informed of any reportable irregularities identified by the external auditor
• Ensured the appointment as external auditor a registered auditor, who, in the opinion of the committee, was independent of the Group and recommended approval for the re-appointment of EY as external auditors;
• Ensured that the re-appointment of the external auditor complied with relevant legislation;
• Assessed the competence of the designated audit partner; • Ensured that the Group’s designated audit partner was rotated during the 2021
financial period, in compliance with section 92 of the Companies Act; • Reviewed IRBA’s rule on the requirements of mandatory audit firm rotation; • Determined the fees to be paid to the external auditor, as well as the terms of
engagement; • Pre-approved non-audit services provided by the external auditors; • Considered and confirmed the independence of the external auditors, taking into
account all non-audit services performed and circumstances known to the committee; • Reviewed the external audit coverage plan to ensure adequate coverage of
critical risk areas and dealt with questions arising from audit activities; • Met with management, independently of the auditors, to discuss issues relevant
to the audit and for purposes of evaluating the quality and effectiveness of the external audit function;
• Evaluated the performance, and reviewed the reports, of the external auditors and ensured that the reporting was reliable, transparent and a fair representation for the use by stakeholders;
• Received and appropriately dealt with any queries relating to the accounting practices of the Group, the content of its financial statements and the internal financial controls of the Group or to any related matter;
• Made submissions to the Board on any matter concerning the Group’s accounting policies, financial controls, records and reporting; and
• Met separately with the external auditors to confirm that full co-operation was received by them from management.
Risk managementThe Chief Finance Officer serves as the Chief Risk Officer for the Group and attends all audit, risk and compliance committee meetings by invitation. The day-to-day responsibility for identifying, evaluating and managing risk remains the responsibility of senior management, who are supported by the risk assurance function. Currently, the combined assurance plan serves as the source for the Group’s top-down risk management programme. These risks are typically strategic and operational, and are quantified by the finance function, where relevant.
Responsibilities Activities performed and areas of focus
• Ensuring that the Group has adequate processes in place to identify, monitor and manage all significant business and financial risk areas
• Assisting management to identify risk areas, and evaluating management in the handling of identified risks
• Ensuring that the Group’s assets are secure • Ensuring that the Group’s information
systems are adequate, secure and function effectively
• Ensuring that the accounting system and controls are adequate and function effectively
• Ensuring that the effectiveness of the internal control measures is continually evaluated
• Ensuring that systems exist that adequately provide for the Group’s conformance with all laws, regulations and codes
• Discharged all risk and compliance committee responsibilities of all the subsidiary companies in the Group;
• Together with head of risk, internal auditors, external auditors and management, reviewed the findings of the financial review committees of the material operating divisions in the Group;
• Ensured that management’s processes and procedures were adequate to identify, assess, manage and monitor enterprise-wide risks;
• Reviewed Internal Audit findings and comments from a risk perspective; • Reviewed Risk report and findings; • Reviewed operational risks, in particular how they were managed; • Met with management to review their progress on identifying and addressing
material risk areas within the business; • The Chair met regularly with key management to keep abreast of emerging issues
which, during the 2021 financial period, included: » The impact of the Covid-19 pandemic; » Continued monitoring of possible corporate governance failures and their implications on risk management and director responsibilities in oversight of management;
» Reviewed the Group’s progress against the implementation of measures to ensure compliance with the Protection of Personal Information Act; and
» The social, political and economic events in South Africa and other countries in Africa in which the Group is operating, or in which the Group is considering operating.
Policy on non-audit servicesAll non-audit services provided by the Group’s external auditors are required to be pre-approved by the committee. The nature and extent of non-audit services provided by the external auditors has been reviewed to ensure that the fees for such services do not become so significant as to call into question their independence. During the period under review, EY received R0.2 million (2020: R0.4 million) equating to 2.2% (2020: 3.6%) of the total audit remuneration relating to agreed-upon procedures. All non-audit services undertaken during the 2021 financial period were approved in accordance with this policy.
Expertise and experience of Chief Finance Officer and finance functionThe committee, together with the lead external audit partner, has considered and confirmed the composition, experience, resources and skills of the finance function. The committee is satisfied that Lerena Olivier has the appropriate expertise and experience for the position of Chief Finance Officer of the Group. In addition, the committee is satisfied that the composition, experience and skills of the finance function meet the Group’s requirements.
AUDIT, RISK AND COMPLIANCE COMMITTEE REPORT (continued)
www.picknpay.com14
Audited Annual Financial Statements 202115
AUDIT, RISK AND COMPLIANCE COMMITTEE REPORT (continued)
Legal requirementsThe committee has complied with all applicable legal, regulatory and other responsibilities for the 2021 financial period.
Effectiveness of the design and implementation of internal financial controlsThe committee has examined the effectiveness of internal financial controls, to assess if there are any significant weaknesses in the design, implementation or execution of internal financial controls that could result in material financial loss, fraud, corruption or error. Through this process no material matter has come to the attention of the committee or the Board that has caused the directors to believe that the Group’s system of internal controls and risk management is not effective and that the internal financial controls do not form a sound basis for the preparation of reliable financial statements. The committee has concluded that the current design of internal financial controls is effective but will continue to be watchful.
The arrangements in place for combined assurance and the committee’s view on its effectivenessThe committee ensured that the combined assurance model addressed all significant risks facing the Group and monitored the relationship between external and internal assurance providers and the Group. The committee concluded that the arrangements in place for combined assurance were effective.
Annual financial statements and going concernFollowing review of the consolidated Group and separate Company annual financial statements for the financial period ended 28 February 2021, the committee is of the opinion that, in all material respects, the financial statements comply with International Financial Reporting Standards and the Companies Act and that they fairly present the financial position of the Group and Company for the 2021 financial period and the results of the operations and cash flows for the period then ended.
The committee reviewed and considered representations by management on the going concern statement for the Group and recommended the adoption of the going concern concept to the Board.
In compliance with the requirements of the King IV Report on Corporate GovernanceTM for South Africa, 2016*, an Integrated Annual Report will be compiled for 2021 in addition to these annual financial statements.
Approval of the audit, risk and compliance committee reportThe committee confirms that it functioned in accordance with its charter for the 2021 financial period and that its report to shareholders was approved by the Board.
Jeff van RooyenChair: Audit, risk and compliance committee
20 April 2021
PICK N PAY STORES LIMITED GROUP 01
15 Audited Annual Financial Statements 2021
* Copyright and trademarks are owned by the Institute of Directors in South Africa NPC and all of its rights are reserved.
PICK N PAY STORES LIMITED GROUP 01
www.picknpay.com16
Audited Annual Financial Statements 202117
Pick n Pay Stores Limited Group
REVIEW OF OPERATIONS
Outstanding performance in extraordinary times
Key financial indicators
52 weeks to28 February 2021
FY21
52 weeks to1 March 20201
FY20%
change
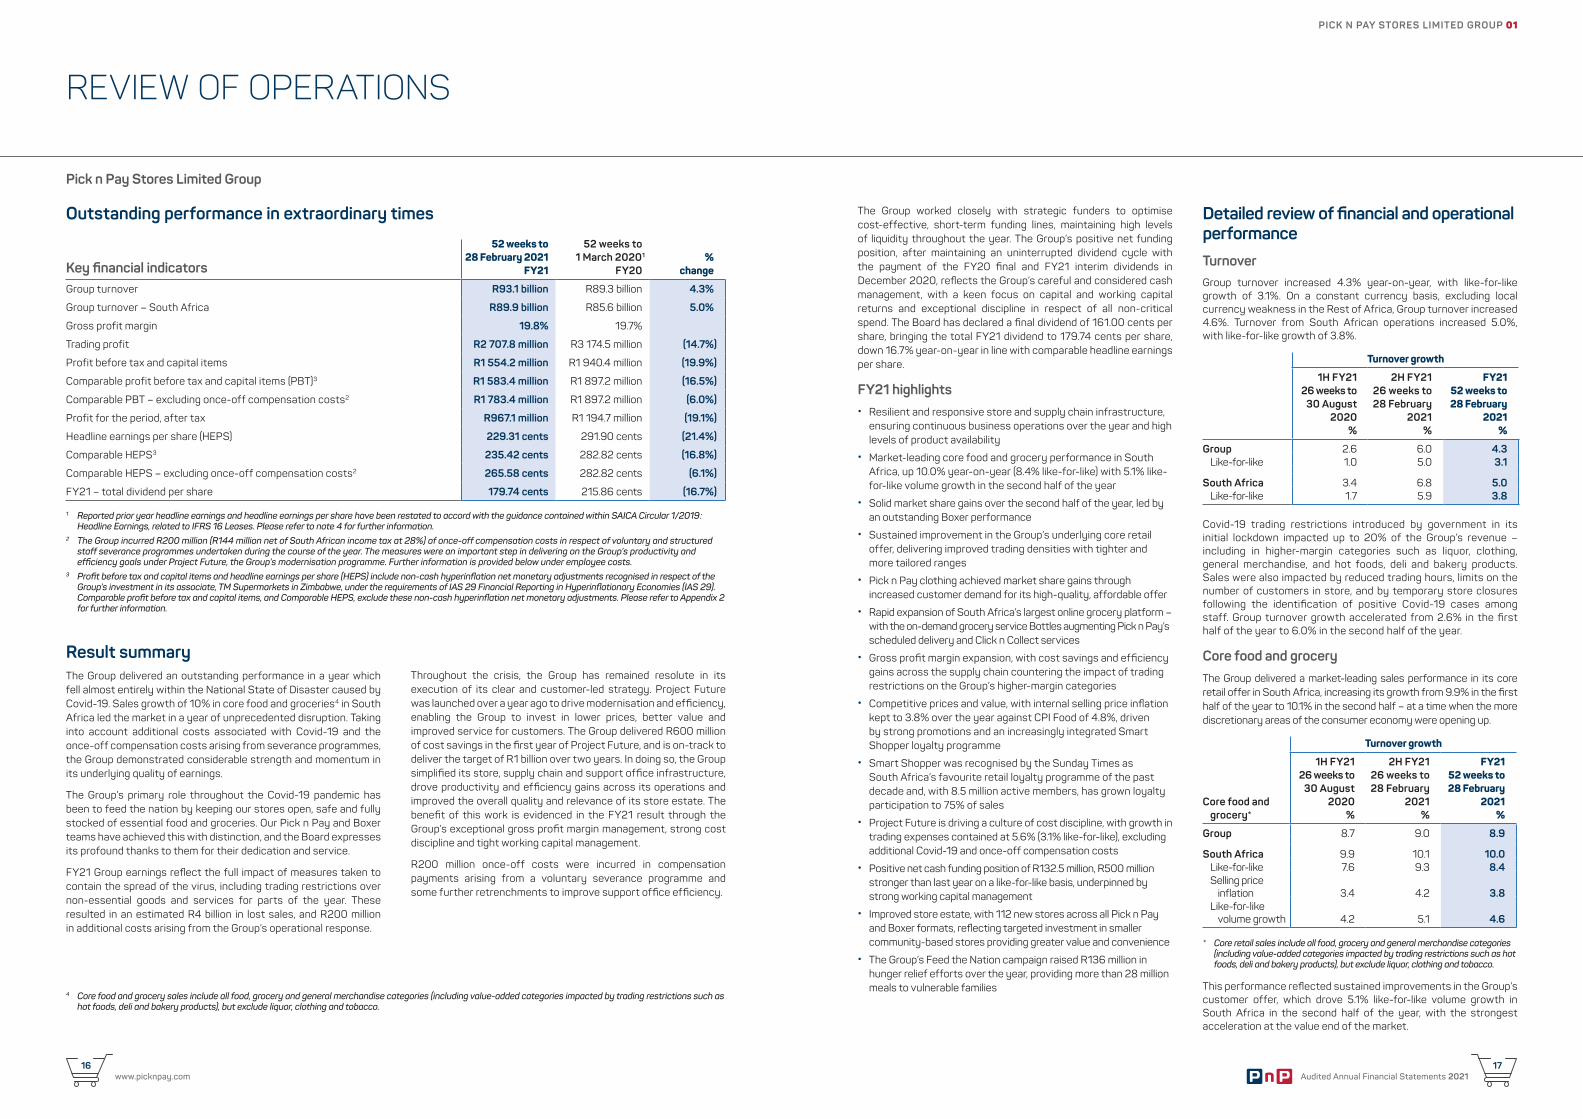
Group turnover R93.1 billion R89.3 billion 4.3%
Group turnover – South Africa R89.9 billion R85.6 billion 5.0%
Gross profit margin 19.8% 19.7%
Trading profit R2 707.8 million R3 174.5 million (14.7%)
Profit before tax and capital items R1 554.2 million R1 940.4 million (19.9%)
Comparable profit before tax and capital items (PBT)3 R1 583.4 million R1 897.2 million (16.5%)
Comparable PBT – excluding once-off compensation costs2 R1 783.4 million R1 897.2 million (6.0%)
Profit for the period, after tax R967.1 million R1 194.7 million (19.1%)
Headline earnings per share (HEPS) 229.31 cents 291.90 cents (21.4%)
Comparable HEPS3 235.42 cents 282.82 cents (16.8%)
Comparable HEPS – excluding once-off compensation costs2 265.58 cents 282.82 cents (6.1%)
FY21 – total dividend per share 179.74 cents 215.86 cents (16.7%)
1 Reported prior year headline earnings and headline earnings per share have been restated to accord with the guidance contained within SAICA Circular 1/2019: Headline Earnings, related to IFRS 16 Leases. Please refer to note 4 for further information.
2 The Group incurred R200 million (R144 million net of South African income tax at 28%) of once-off compensation costs in respect of voluntary and structured staff severance programmes undertaken during the course of the year. The measures were an important step in delivering on the Group’s productivity and efficiency goals under Project Future, the Group’s modernisation programme. Further information is provided below under employee costs.
3 Profit before tax and capital items and headline earnings per share (HEPS) include non-cash hyperinflation net monetary adjustments recognised in respect of the Group’s investment in its associate, TM Supermarkets in Zimbabwe, under the requirements of IAS 29 Financial Reporting in Hyperinflationary Economies (IAS 29). Comparable profit before tax and capital items, and Comparable HEPS, exclude these non-cash hyperinflation net monetary adjustments. Please refer to Appendix 2 for further information.
Result summaryThe Group delivered an outstanding performance in a year which fell almost entirely within the National State of Disaster caused by Covid-19. Sales growth of 10% in core food and groceries4 in South Africa led the market in a year of unprecedented disruption. Taking into account additional costs associated with Covid-19 and the once-off compensation costs arising from severance programmes, the Group demonstrated considerable strength and momentum in its underlying quality of earnings.
The Group’s primary role throughout the Covid-19 pandemic has been to feed the nation by keeping our stores open, safe and fully stocked of essential food and groceries. Our Pick n Pay and Boxer teams have achieved this with distinction, and the Board expresses its profound thanks to them for their dedication and service.
FY21 Group earnings reflect the full impact of measures taken to contain the spread of the virus, including trading restrictions over non-essential goods and services for parts of the year. These resulted in an estimated R4 billion in lost sales, and R200 million in additional costs arising from the Group’s operational response.
Throughout the crisis, the Group has remained resolute in its execution of its clear and customer-led strategy. Project Future was launched over a year ago to drive modernisation and efficiency, enabling the Group to invest in lower prices, better value and improved service for customers. The Group delivered R600 million of cost savings in the first year of Project Future, and is on-track to deliver the target of R1 billion over two years. In doing so, the Group simplified its store, supply chain and support office infrastructure, drove productivity and efficiency gains across its operations and improved the overall quality and relevance of its store estate. The benefit of this work is evidenced in the FY21 result through the Group’s exceptional gross profit margin management, strong cost discipline and tight working capital management.
R200 million once-off costs were incurred in compensation payments arising from a voluntary severance programme and some further retrenchments to improve support office efficiency.
4 Core food and grocery sales include all food, grocery and general merchandise categories (including value-added categories impacted by trading restrictions such as hot foods, deli and bakery products), but exclude liquor, clothing and tobacco.
The Group worked closely with strategic funders to optimise cost-effective, short-term funding lines, maintaining high levels of liquidity throughout the year. The Group’s positive net funding position, after maintaining an uninterrupted dividend cycle with the payment of the FY20 final and FY21 interim dividends in December 2020, reflects the Group’s careful and considered cash management, with a keen focus on capital and working capital returns and exceptional discipline in respect of all non-critical spend. The Board has declared a final dividend of 161.00 cents per share, bringing the total FY21 dividend to 179.74 cents per share, down 16.7% year-on-year in line with comparable headline earnings per share.
FY21 highlights • Resilient and responsive store and supply chain infrastructure,
ensuring continuous business operations over the year and high levels of product availability
• Market-leading core food and grocery performance in South Africa, up 10.0% year-on-year (8.4% like-for-like) with 5.1% like-for-like volume growth in the second half of the year
• Solid market share gains over the second half of the year, led by an outstanding Boxer performance
• Sustained improvement in the Group’s underlying core retail offer, delivering improved trading densities with tighter and more tailored ranges
• Pick n Pay clothing achieved market share gains through increased customer demand for its high-quality, affordable offer
• Rapid expansion of South Africa’s largest online grocery platform – with the on-demand grocery service Bottles augmenting Pick n Pay’s scheduled delivery and Click n Collect services
• Gross profit margin expansion, with cost savings and efficiency gains across the supply chain countering the impact of trading restrictions on the Group’s higher-margin categories
• Competitive prices and value, with internal selling price inflation kept to 3.8% over the year against CPI Food of 4.8%, driven by strong promotions and an increasingly integrated Smart Shopper loyalty programme
• Smart Shopper was recognised by the Sunday Times as South Africa’s favourite retail loyalty programme of the past decade and, with 8.5 million active members, has grown loyalty participation to 75% of sales
• Project Future is driving a culture of cost discipline, with growth in trading expenses contained at 5.6% (3.1% like-for-like), excluding additional Covid-19 and once-off compensation costs
• Positive net cash funding position of R132.5 million, R500 million stronger than last year on a like-for-like basis, underpinned by strong working capital management
• Improved store estate, with 112 new stores across all Pick n Pay and Boxer formats, reflecting targeted investment in smaller community-based stores providing greater value and convenience
• The Group’s Feed the Nation campaign raised R136 million in hunger relief efforts over the year, providing more than 28 million meals to vulnerable families
Detailed review of financial and operational performanceTurnoverGroup turnover increased 4.3% year-on-year, with like-for-like growth of 3.1%. On a constant currency basis, excluding local currency weakness in the Rest of Africa, Group turnover increased 4.6%. Turnover from South African operations increased 5.0%, with like-for-like growth of 3.8%.
Turnover growth
1H FY2126 weeks to
30 August 2020
%
2H FY2126 weeks to28 February
2021%
FY2152 weeks to28 February
2021%
Group 2.6 6.0 4.3Like-for-like 1.0 5.0 3.1
South Africa 3.4 6.8 5.0Like-for-like 1.7 5.9 3.8
Covid-19 trading restrictions introduced by government in its initial lockdown impacted up to 20% of the Group’s revenue – including in higher-margin categories such as liquor, clothing, general merchandise, and hot foods, deli and bakery products. Sales were also impacted by reduced trading hours, limits on the number of customers in store, and by temporary store closures following the identification of positive Covid-19 cases among staff. Group turnover growth accelerated from 2.6% in the first half of the year to 6.0% in the second half of the year.
Core food and groceryThe Group delivered a market-leading sales performance in its core retail offer in South Africa, increasing its growth from 9.9% in the first half of the year to 10.1% in the second half – at a time when the more discretionary areas of the consumer economy were opening up.
Turnover growth
Core food and grocery*
1H FY2126 weeks to
30 August 2020
%
2H FY2126 weeks to28 February
2021%
FY2152 weeks to28 February
2021%
Group 8.7 9.0 8.9
South Africa 9.9 10.1 10.0Like-for-like 7.6 9.3 8.4Selling price
inflation 3.4 4.2 3.8Like-for-like
volume growth 4.2 5.1 4.6
* Core retail sales include all food, grocery and general merchandise categories (including value-added categories impacted by trading restrictions such as hot foods, deli and bakery products), but exclude liquor, clothing and tobacco.
This performance reflected sustained improvements in the Group’s customer offer, which drove 5.1% like-for-like volume growth in South Africa in the second half of the year, with the strongest acceleration at the value end of the market.
PICK N PAY STORES LIMITED GROUP 01
Audited Annual Financial Statements 202119
www.picknpay.com18
REVIEW OF OPERATIONS (continued)
Liquor and tobaccoThe Group’s liquor and tobacco categories were significantly affected by government trading restrictions. The Group lost 209 liquor trading days over FY21 (126 days in the first half and 83 days in the second), with reduced trading hours for all but three weeks of the financial year. The sale of cigarettes and other tobacco products was prohibited between 27 March and 17 August. These combined measures had a profound impact on the Group’s liquor and tobacco sales, with negative growth of 31.0% over the year.
Turnover growth
1H FY2126 weeks to
30 August 2020
%
2H FY2126 weeks to28 February
2021%
FY2152 weeks to28 February
2021%
South AfricaLiquor and
tobacco (47.5) (17.3) (31.0)
To assist recovery of the local wine industry, Pick n Pay has committed to the purchase of at least 25 million bottles of South African wine this year, and will work closely with farmers to grow their sales through the launch of new ranges, strong promotions and more dedicated shelf space. The Group added 35 new liquor stores during the year, and plans to add 40 more in FY22.
ClothingClothing sales were severely impacted by trading restrictions in the first half of the year, with sales prohibited during Level 5 lockdown and subject to continuing restrictions under Level 4. The Group’s clothing sales increased 1.3% year-on-year, with 6.7% growth in the second half of the year.
Turnover growth
1H FY2126 weeks to
30 August 2020
%
2H FY2126 weeks to28 February
2021%
FY2152 weeks to28 February
2021%
South AfricaClothing (4.2) 6.7 1.3
The Group’s clothing division consistently outperformed the overall apparel market over the year, with outstanding performances in its ladieswear, childrenswear and babywear categories. Local sourcing increased close to 40% year-on-year, as the Group developed partnerships with local designers and entrepreneurs to mitigate Covid-19 supply chain disruption, reduce order lead times and improve availability. The Group added 22 clothing stores during the year and will continue to expand its reach through targeted investment in stand-alone clothing stores, additional space in supermarkets, and a growing online offer. The Group plans to expand its online offer in FY22, alongside the addition of a further 30 new clothing stores.
Strong plan, responsive to changing customer needsCustomers have responded to the Covid-19 crisis by shopping less frequently for bigger baskets. They have demonstrated a greater preference for one-stop shopping in stores which offer safety, convenience, a relevant range, consistent availability, and above all low prices and great value.
Lower prices and integrated loyalty
The Group continues to invest efficiency savings into lower prices and greater value for customers. Pick n Pay and Boxer followed a simple and effective programme of deep value promotions this year, including multi-buys and daily deals targeted at the food and grocery product lines most important to our customers.
Pick n Pay extended its value proposition through its personalised Smart Shopper loyalty programme, providing Smart Shoppers with R3.5 billion in savings this year. Everyday low Smart Prices, alongside bi-weekly personalised discounts, have driven loyalty participation to 75% of sales, from 65% last year. The programme has 8.5 million active customers, and provides invaluable information for Pick n Pay and its suppliers. The Smart Shopper programme was recently recognised by the Sunday Times as South Africa’s favourite retail loyalty programme over the past decade.
Notwithstanding cost pressures across the value chain, particularly in the second half of the year, the Group contained its internal selling price inflation in South Africa to 3.8% year-on-year, against CPI Food of 4.8%.
Greater relevance and improved store operations
Pick n Pay completed a comprehensive range review across its segmented Value, Core and Select supermarkets this year, supported by strong and effective collaboration with suppliers and franchise partners. As a result, Pick n Pay removed 4 500 duplicate and uneconomic products, and re-invigorated a number of under-performing categories. Pick n Pay’s product offer is increasingly clear, uncluttered and relevant, enabling improved forecasting, supplier replenishment, reduced waste and higher on-shelf availability.
Boxer remains South Africa’s fastest growing discount retailer, with a tailored range of 3 000 products, and a strong meat offer. It has maintained double-digit sales growth over a number of years by offering unbeatable value and by being highly responsive to the needs of customers.
Leading online offer
Pick n Pay has led online grocery retailing in South Africa for two decades. Its mature grocery platform was able to respond quickly and effectively to meet the surge in demand during the Covid-19 crisis. In addition to expanding its scheduled delivery service, Pick n Pay extended its Click n Collect offer, and repositioned its one-hour liquor delivery partnership with Bottles into an on-demand essential grocery service. The Group’s franchise partners also moved quickly to serve their customers through safe and convenient home deliveries.
Online sales more than doubled over the year, with a 150% increase in active online customers. As a result of consistent levels of availability and good on-time delivery rates, customer satisfaction was up 8.5 percentage points year-on-year. Bottles is the highest-rated mobile app in its category, ahead of any other online grocery delivery service in South Africa.
Pick n Pay Online is available in all major centres across South Africa, operating out of two dedicated online warehouses and more than 140 supermarkets country wide, and provides online customers access to South Africa’s broadest e-commerce grocery range, with over 10 000 products. Building on the tremendous momentum achieved during the year, the Group purchased the Bottles business in the second half of the financial year to drive integration and innovation across our platform.
The combination of a strong and established digital platform, dedicated fulfilment centres and in-store picking, alongside a decade of detailed loyalty data, provides Pick n Pay with a strong position from which to continue to drive innovation in e-commerce in South Africa.
Greater convenience, wider reach
The Group has 1 994 stores across all Pick n Pay and Boxer formats, including 1 172 company-owned stores, 761 franchise stores, and 61 stores operated by our associate in Zimbabwe. The Group opened 112 new stores this year, with a programme to maximise returns through targeted investment in smaller, community-based supermarkets, and a growing clothing and liquor offer.
The Group’s new space growth strategy focuses on increasing its store footprint in the lower-to middle-income communities of South Africa. The Group believes that this area of the South African retail market will deliver the greatest growth over the medium- to long-term, driven by an expanding working-age population, urbanisation, and the ongoing formalisation of the informal market. The Group is under-represented in this area, which provides a strong growth opportunity for its Pick n Pay Value and Boxer supermarkets.
Aligned with this strategy, the Group converted 34 franchise stores into company-owned stores this year – including 22 value supermarkets (13 Boxer and nine Pick n Pay) – providing customers with a revitalised, modern and convenient shopping experience and delivering stronger trade performances and higher investment returns off a significantly reduced and tailored range.
New stores and conversions added 2.3% to the Group’s turnover growth for the period, fully mitigating the impact of Covid-19 restrictions on the construction industry during the year under review. To further improve the overall quality of its store estate, the Group closed 43 stores during the year across all formats, resulting in a turnover contribution from net new stores, including closures, of 1.2%.
The Group curtailed its capital investment programme in the first half of the year, preserving cash and liquidity as the Covid-19 crisis unfolded. As trading operations normalise, the Group looks forward to delivering against a strong store pipeline.
The Group’s hypermarket division has continued to improve its underlying profitability through a platform of targeted promotions, a stronger fresh offer and general merchandise range, and an expanding wholesale offer serving independent traders.
The Group has a strong portfolio of 761 franchise stores across all formats. While it closed and converted a number of franchise stores during the year to improve underlying investment returns, the Group opened 43 new franchise stores, including six supermarkets and 10 market stores, expanding the reach of the Pick n Pay brand into under-served parts of South Africa. The Pick n Pay franchise model remains a highly effective vehicle for emerging retail entrepreneurs to build successful businesses, leveraging the buying, distribution and systems capability of the Pick n Pay Group. The Group plans to open a further 40 franchise stores, across all formats, in FY22. The Board extends its thanks to our franchise partners for their invaluable teamwork throughout the Covid-19 crisis.
Gross profitGross profit increased 4.7% to R18.4 billion, with an expansion in the gross profit margin to 19.8% of turnover. The Group mitigated the severe impact of Covid-19 trading restrictions on its higher margin categories, delivering cost savings, efficiency gains and increased centralisation across its supply chain, while providing greater value for customers. The Group’s effective promotional strategy, including greater personalised value through Pick n Pay’s Smart Shopper programme, is driving underlying volume growth and related increases in supplier incentive income.
Highly effective central distribution channel
The Group’s supply chain team has been highly effective in responding to the Covid-19 crisis, working closely with suppliers and service providers to maintain an uninterrupted supply of goods and services in the face of severe disruption. The Group consistently maintained its on-shelf availability of essential food and groceries at 95% throughout the year, including over key month-end trading periods.
Improved supply chain efficiency and cost control
Pick n Pay delivered further progress in the optimisation of its central supply chain, meeting accelerated cost and efficiency targets under Project Future. Pick n Pay rationalised its distribution centre operational management through the appointment of two functional outsource partners. These strategic partnerships deliver greater skill and efficiency in operations, as well as stability in labour relations across our distribution facilities.
The supply chain team also continues to improve the efficiency of its fleet, with fewer trucks on the road and fewer kilometres travelled despite growing volumes being transported. The improvements in labour productivity and transport efficiency have reduced Pick n Pay’s cost of distribution across both grocery and perishable lines, and have helped to achieve an outstanding reduction in waste and shrink.
Greater levels of centralised supply in Boxer
Boxer made further progress in centralising its supply chain. The opening of its new Polokwane distribution centre in September 2020 took its centralised supply to 55%. As Boxer centralises more of its supply chain, stores increasingly benefit from improvements in forecasting and replenishment, leading to even better on-shelf availability. Boxer’s centralisation strategy has also delivered sustainable gross profit margin improvements for the Group through increases in supplier incentive income, and meaningful working capital improvements.
Greater value and innovation through own brand
The Group’s growing range of Pick n Pay and Boxer own brand products is an important and effective tool in providing customers with trusted quality and greater value. Pick n Pay grew its own brand sales by 12% this year, anchored by a strong performance in edible groceries, with its own brand participation now at 25% of participating categories. To advance its own brand strategy, Pick n Pay has successfully insourced the research and development of its own brand offer within its central commercial and procurement team.
Boxer’s own brand participation now stands at 23% of participating categories. With sustained double-digit sales growth in key value commodity lines, many of its own brand products are performing well ahead of national brands.
The Group remains confident that it can grow its own brand participation to 30% or more over the medium-term, and with greater control over input costs, will deliver further sustainable gross profit margin benefits.
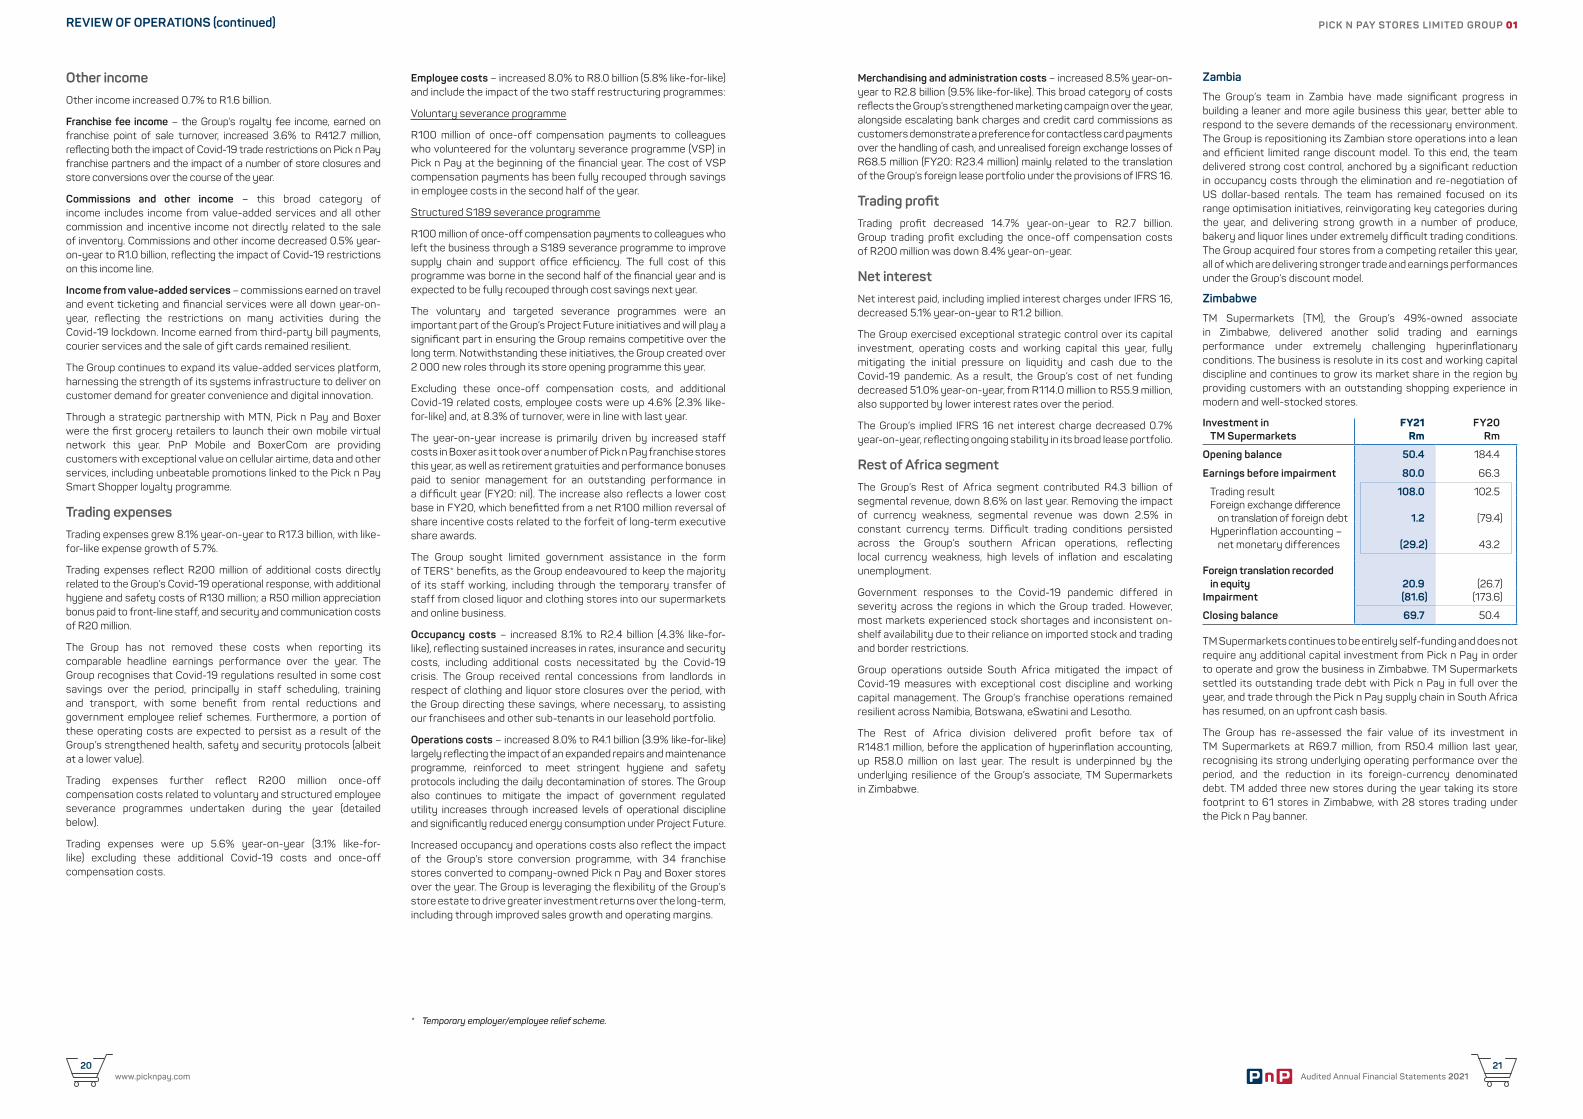
PICK N PAY STORES LIMITED GROUP 01
www.picknpay.com20
Audited Annual Financial Statements 202121
REVIEW OF OPERATIONS (continued)
Other incomeOther income increased 0.7% to R1.6 billion.
Franchise fee income – the Group’s royalty fee income, earned on franchise point of sale turnover, increased 3.6% to R412.7 million, reflecting both the impact of Covid-19 trade restrictions on Pick n Pay franchise partners and the impact of a number of store closures and store conversions over the course of the year.
Commissions and other income – this broad category of income includes income from value-added services and all other commission and incentive income not directly related to the sale of inventory. Commissions and other income decreased 0.5% year-on-year to R1.0 billion, reflecting the impact of Covid-19 restrictions on this income line.
Income from value-added services – commissions earned on travel and event ticketing and financial services were all down year-on-year, reflecting the restrictions on many activities during the Covid-19 lockdown. Income earned from third-party bill payments, courier services and the sale of gift cards remained resilient.
The Group continues to expand its value-added services platform, harnessing the strength of its systems infrastructure to deliver on customer demand for greater convenience and digital innovation.
Through a strategic partnership with MTN, Pick n Pay and Boxer were the first grocery retailers to launch their own mobile virtual network this year. PnP Mobile and BoxerCom are providing customers with exceptional value on cellular airtime, data and other services, including unbeatable promotions linked to the Pick n Pay Smart Shopper loyalty programme.
Trading expensesTrading expenses grew 8.1% year-on-year to R17.3 billion, with like-for-like expense growth of 5.7%.
Trading expenses reflect R200 million of additional costs directly related to the Group’s Covid-19 operational response, with additional hygiene and safety costs of R130 million; a R50 million appreciation bonus paid to front-line staff, and security and communication costs of R20 million.
The Group has not removed these costs when reporting its comparable headline earnings performance over the year. The Group recognises that Covid-19 regulations resulted in some cost savings over the period, principally in staff scheduling, training and transport, with some benefit from rental reductions and government employee relief schemes. Furthermore, a portion of these operating costs are expected to persist as a result of the Group’s strengthened health, safety and security protocols (albeit at a lower value).
Trading expenses further reflect R200 million once-off compensation costs related to voluntary and structured employee severance programmes undertaken during the year (detailed below).
Trading expenses were up 5.6% year-on-year (3.1% like-for-like) excluding these additional Covid-19 costs and once-off compensation costs.
Employee costs – increased 8.0% to R8.0 billion (5.8% like-for-like) and include the impact of the two staff restructuring programmes:
Voluntary severance programme
R100 million of once-off compensation payments to colleagues who volunteered for the voluntary severance programme (VSP) in Pick n Pay at the beginning of the financial year. The cost of VSP compensation payments has been fully recouped through savings in employee costs in the second half of the year.
Structured S189 severance programme
R100 million of once-off compensation payments to colleagues who left the business through a S189 severance programme to improve supply chain and support office efficiency. The full cost of this programme was borne in the second half of the financial year and is expected to be fully recouped through cost savings next year.
The voluntary and targeted severance programmes were an important part of the Group’s Project Future initiatives and will play a significant part in ensuring the Group remains competitive over the long term. Notwithstanding these initiatives, the Group created over 2 000 new roles through its store opening programme this year.
Excluding these once-off compensation costs, and additional Covid-19 related costs, employee costs were up 4.6% (2.3% like-for-like) and, at 8.3% of turnover, were in line with last year.
The year-on-year increase is primarily driven by increased staff costs in Boxer as it took over a number of Pick n Pay franchise stores this year, as well as retirement gratuities and performance bonuses paid to senior management for an outstanding performance in a difficult year (FY20: nil). The increase also reflects a lower cost base in FY20, which benefitted from a net R100 million reversal of share incentive costs related to the forfeit of long-term executive share awards.
The Group sought limited government assistance in the form of TERS* benefits, as the Group endeavoured to keep the majority of its staff working, including through the temporary transfer of staff from closed liquor and clothing stores into our supermarkets and online business.
Occupancy costs – increased 8.1% to R2.4 billion (4.3% like-for-like), reflecting sustained increases in rates, insurance and security costs, including additional costs necessitated by the Covid-19 crisis. The Group received rental concessions from landlords in respect of clothing and liquor store closures over the period, with the Group directing these savings, where necessary, to assisting our franchisees and other sub-tenants in our leasehold portfolio.
Operations costs – increased 8.0% to R4.1 billion (3.9% like-for-like) largely reflecting the impact of an expanded repairs and maintenance programme, reinforced to meet stringent hygiene and safety protocols including the daily decontamination of stores. The Group also continues to mitigate the impact of government regulated utility increases through increased levels of operational discipline and significantly reduced energy consumption under Project Future.
Increased occupancy and operations costs also reflect the impact of the Group’s store conversion programme, with 34 franchise stores converted to company-owned Pick n Pay and Boxer stores over the year. The Group is leveraging the flexibility of the Group’s store estate to drive greater investment returns over the long-term, including through improved sales growth and operating margins.
* Temporary employer/employee relief scheme.
Merchandising and administration costs – increased 8.5% year-on-year to R2.8 billion (9.5% like-for-like). This broad category of costs reflects the Group’s strengthened marketing campaign over the year, alongside escalating bank charges and credit card commissions as customers demonstrate a preference for contactless card payments over the handling of cash, and unrealised foreign exchange losses of R68.5 million (FY20: R23.4 million) mainly related to the translation of the Group’s foreign lease portfolio under the provisions of IFRS 16.
Trading profitTrading profit decreased 14.7% year-on-year to R2.7 billion. Group trading profit excluding the once-off compensation costs of R200 million was down 8.4% year-on-year.
Net interestNet interest paid, including implied interest charges under IFRS 16, decreased 5.1% year-on-year to R1.2 billion.
The Group exercised exceptional strategic control over its capital investment, operating costs and working capital this year, fully mitigating the initial pressure on liquidity and cash due to the Covid-19 pandemic. As a result, the Group’s cost of net funding decreased 51.0% year-on-year, from R114.0 million to R55.9 million, also supported by lower interest rates over the period.
The Group’s implied IFRS 16 net interest charge decreased 0.7% year-on-year, reflecting ongoing stability in its broad lease portfolio.
Rest of Africa segmentThe Group’s Rest of Africa segment contributed R4.3 billion of segmental revenue, down 8.6% on last year. Removing the impact of currency weakness, segmental revenue was down 2.5% in constant currency terms. Difficult trading conditions persisted across the Group’s southern African operations, reflecting local currency weakness, high levels of inflation and escalating unemployment.
Government responses to the Covid-19 pandemic differed in severity across the regions in which the Group traded. However, most markets experienced stock shortages and inconsistent on-shelf availability due to their reliance on imported stock and trading and border restrictions.
Group operations outside South Africa mitigated the impact of Covid-19 measures with exceptional cost discipline and working capital management. The Group’s franchise operations remained resilient across Namibia, Botswana, eSwatini and Lesotho.
The Rest of Africa division delivered profit before tax of R148.1 million, before the application of hyperinflation accounting, up R58.0 million on last year. The result is underpinned by the underlying resilience of the Group’s associate, TM Supermarkets in Zimbabwe.
Zambia
The Group’s team in Zambia have made significant progress in building a leaner and more agile business this year, better able to respond to the severe demands of the recessionary environment. The Group is repositioning its Zambian store operations into a lean and efficient limited range discount model. To this end, the team delivered strong cost control, anchored by a significant reduction in occupancy costs through the elimination and re-negotiation of US dollar-based rentals. The team has remained focused on its range optimisation initiatives, reinvigorating key categories during the year, and delivering strong growth in a number of produce, bakery and liquor lines under extremely difficult trading conditions. The Group acquired four stores from a competing retailer this year, all of which are delivering stronger trade and earnings performances under the Group’s discount model.
Zimbabwe
TM Supermarkets (TM), the Group’s 49%-owned associate in Zimbabwe, delivered another solid trading and earnings performance under extremely challenging hyperinflationary conditions. The business is resolute in its cost and working capital discipline and continues to grow its market share in the region by providing customers with an outstanding shopping experience in modern and well-stocked stores.
Investment in TM Supermarkets
FY21Rm
FY20Rm
Opening balance 50.4 184.4
Earnings before impairment 80.0 66.3
Trading result 108.0 102.5Foreign exchange difference
on translation of foreign debt 1.2 (79.4)Hyperinflation accounting –
net monetary differences (29.2) 43.2
Foreign translation recorded in equity 20.9 (26.7)
Impairment (81.6) (173.6)
Closing balance 69.7 50.4
TM Supermarkets continues to be entirely self-funding and does not require any additional capital investment from Pick n Pay in order to operate and grow the business in Zimbabwe. TM Supermarkets settled its outstanding trade debt with Pick n Pay in full over the year, and trade through the Pick n Pay supply chain in South Africa has resumed, on an upfront cash basis.
The Group has re-assessed the fair value of its investment in TM Supermarkets at R69.7 million, from R50.4 million last year, recognising its strong underlying operating performance over the period, and the reduction in its foreign-currency denominated debt. TM added three new stores during the year taking its store footprint to 61 stores in Zimbabwe, with 28 stores trading under the Pick n Pay banner.
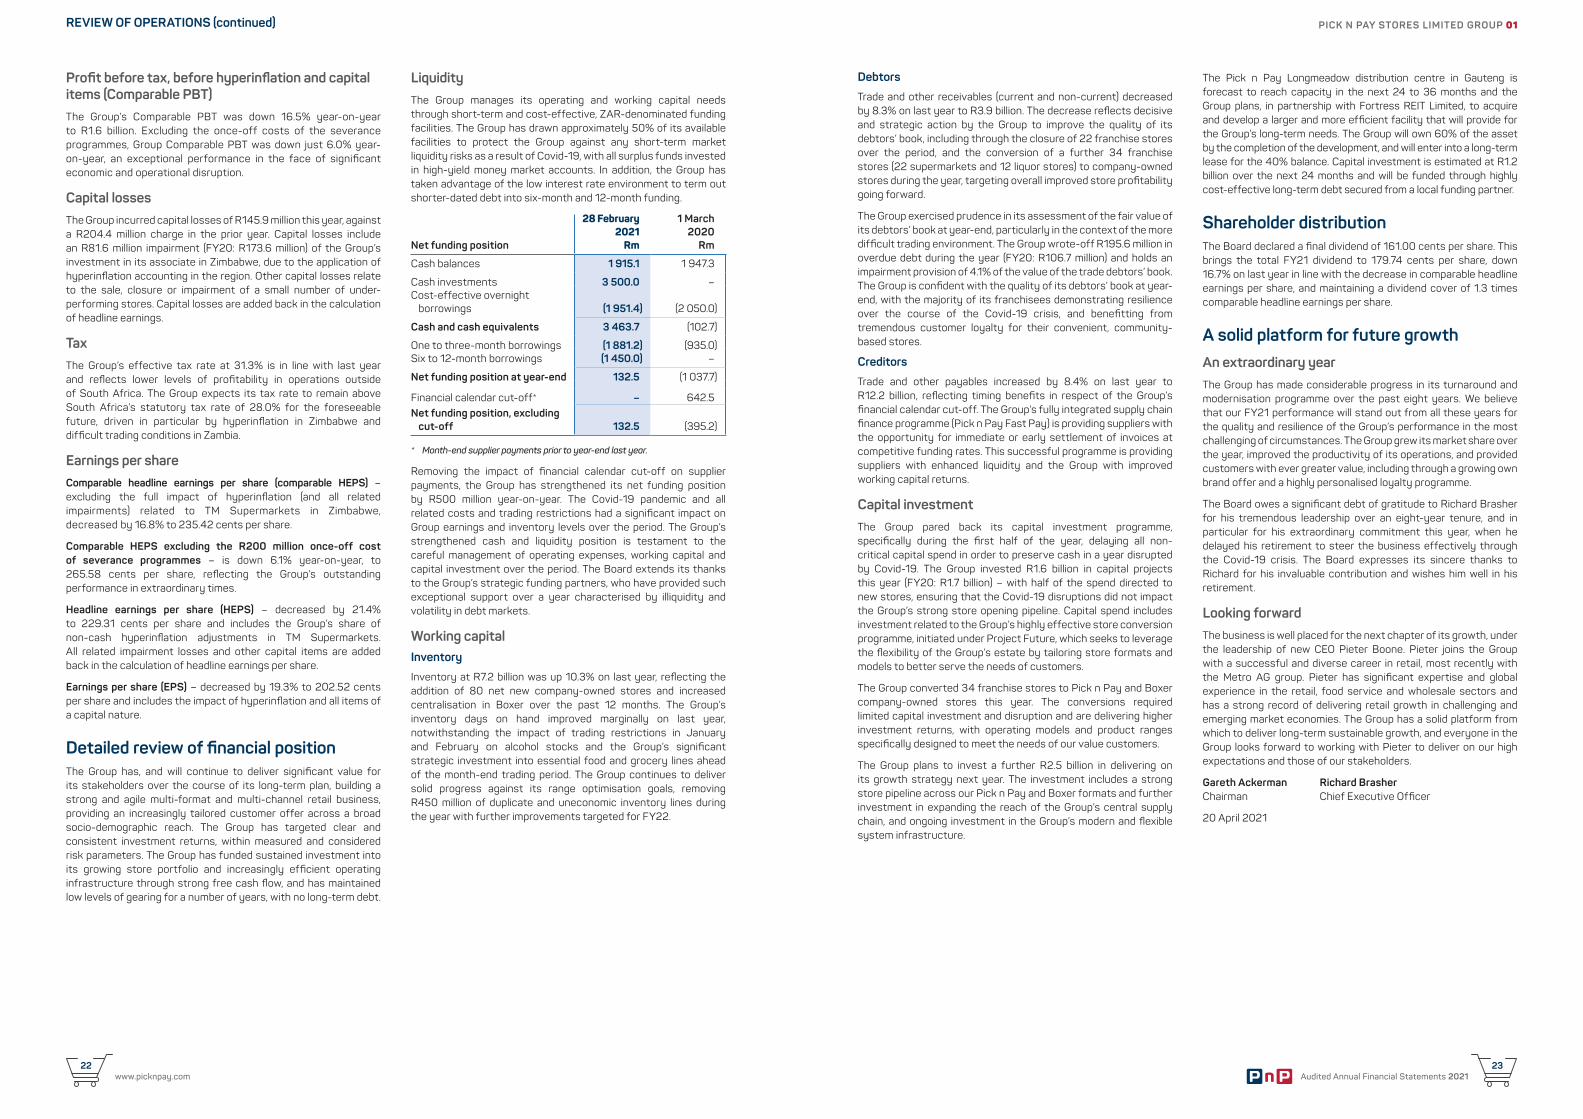
PICK N PAY STORES LIMITED GROUP 01
www.picknpay.com22
Audited Annual Financial Statements 202123
REVIEW OF OPERATIONS (continued)
Profit before tax, before hyperinflation and capital items (Comparable PBT)The Group’s Comparable PBT was down 16.5% year-on-year to R1.6 billion. Excluding the once-off costs of the severance programmes, Group Comparable PBT was down just 6.0% year-on-year, an exceptional performance in the face of significant economic and operational disruption.
Capital lossesThe Group incurred capital losses of R145.9 million this year, against a R204.4 million charge in the prior year. Capital losses include an R81.6 million impairment (FY20: R173.6 million) of the Group’s investment in its associate in Zimbabwe, due to the application of hyperinflation accounting in the region. Other capital losses relate to the sale, closure or impairment of a small number of under-performing stores. Capital losses are added back in the calculation of headline earnings.
TaxThe Group’s effective tax rate at 31.3% is in line with last year and reflects lower levels of profitability in operations outside of South Africa. The Group expects its tax rate to remain above South Africa’s statutory tax rate of 28.0% for the foreseeable future, driven in particular by hyperinflation in Zimbabwe and difficult trading conditions in Zambia.
Earnings per shareComparable headline earnings per share (comparable HEPS) – excluding the full impact of hyperinflation (and all related impairments) related to TM Supermarkets in Zimbabwe, decreased by 16.8% to 235.42 cents per share.
Comparable HEPS excluding the R200 million once-off cost of severance programmes – is down 6.1% year-on-year, to 265.58 cents per share, reflecting the Group’s outstanding performance in extraordinary times.
Headline earnings per share (HEPS) – decreased by 21.4% to 229.31 cents per share and includes the Group’s share of non-cash hyperinflation adjustments in TM Supermarkets. All related impairment losses and other capital items are added back in the calculation of headline earnings per share.
Earnings per share (EPS) – decreased by 19.3% to 202.52 cents per share and includes the impact of hyperinflation and all items of a capital nature.
Detailed review of financial positionThe Group has, and will continue to deliver significant value for its stakeholders over the course of its long-term plan, building a strong and agile multi-format and multi-channel retail business, providing an increasingly tailored customer offer across a broad socio-demographic reach. The Group has targeted clear and consistent investment returns, within measured and considered risk parameters. The Group has funded sustained investment into its growing store portfolio and increasingly efficient operating infrastructure through strong free cash flow, and has maintained low levels of gearing for a number of years, with no long-term debt.
LiquidityThe Group manages its operating and working capital needs through short-term and cost-effective, ZAR-denominated funding facilities. The Group has drawn approximately 50% of its available facilities to protect the Group against any short-term market liquidity risks as a result of Covid-19, with all surplus funds invested in high-yield money market accounts. In addition, the Group has taken advantage of the low interest rate environment to term out shorter-dated debt into six-month and 12-month funding.
Net funding position
28 February2021
Rm
1 March2020
Rm
Cash balances 1 915.1 1 947.3
Cash investments 3 500.0 –Cost-effective overnight
borrowings (1 951.4) (2 050.0)
Cash and cash equivalents 3 463.7 (102.7)
One to three-month borrowings (1 881.2) (935.0)Six to 12-month borrowings (1 450.0) –
Net funding position at year-end 132.5 (1 037.7)
Financial calendar cut-off* – 642.5Net funding position, excluding
cut-off 132.5 (395.2)
* Month-end supplier payments prior to year-end last year.
Removing the impact of financial calendar cut-off on supplier payments, the Group has strengthened its net funding position by R500 million year-on-year. The Covid-19 pandemic and all related costs and trading restrictions had a significant impact on Group earnings and inventory levels over the period. The Group’s strengthened cash and liquidity position is testament to the careful management of operating expenses, working capital and capital investment over the period. The Board extends its thanks to the Group’s strategic funding partners, who have provided such exceptional support over a year characterised by illiquidity and volatility in debt markets.
Working capitalInventory
Inventory at R7.2 billion was up 10.3% on last year, reflecting the addition of 80 net new company-owned stores and increased centralisation in Boxer over the past 12 months. The Group’s inventory days on hand improved marginally on last year, notwithstanding the impact of trading restrictions in January and February on alcohol stocks and the Group’s significant strategic investment into essential food and grocery lines ahead of the month-end trading period. The Group continues to deliver solid progress against its range optimisation goals, removing R450 million of duplicate and uneconomic inventory lines during the year with further improvements targeted for FY22.
Debtors
Trade and other receivables (current and non-current) decreased by 8.3% on last year to R3.9 billion. The decrease reflects decisive and strategic action by the Group to improve the quality of its debtors’ book, including through the closure of 22 franchise stores over the period, and the conversion of a further 34 franchise stores (22 supermarkets and 12 liquor stores) to company-owned stores during the year, targeting overall improved store profitability going forward.
The Group exercised prudence in its assessment of the fair value of its debtors’ book at year-end, particularly in the context of the more difficult trading environment. The Group wrote-off R195.6 million in overdue debt during the year (FY20: R106.7 million) and holds an impairment provision of 4.1% of the value of the trade debtors’ book. The Group is confident with the quality of its debtors’ book at year-end, with the majority of its franchisees demonstrating resilience over the course of the Covid-19 crisis, and benefitting from tremendous customer loyalty for their convenient, community-based stores.
Creditors
Trade and other payables increased by 8.4% on last year to R12.2 billion, reflecting timing benefits in respect of the Group’s financial calendar cut-off. The Group’s fully integrated supply chain finance programme (Pick n Pay Fast Pay) is providing suppliers with the opportunity for immediate or early settlement of invoices at competitive funding rates. This successful programme is providing suppliers with enhanced liquidity and the Group with improved working capital returns.
Capital investmentThe Group pared back its capital investment programme, specifically during the first half of the year, delaying all non-critical capital spend in order to preserve cash in a year disrupted by Covid-19. The Group invested R1.6 billion in capital projects this year (FY20: R1.7 billion) – with half of the spend directed to new stores, ensuring that the Covid-19 disruptions did not impact the Group’s strong store opening pipeline. Capital spend includes investment related to the Group’s highly effective store conversion programme, initiated under Project Future, which seeks to leverage the flexibility of the Group’s estate by tailoring store formats and models to better serve the needs of customers.
The Group converted 34 franchise stores to Pick n Pay and Boxer company-owned stores this year. The conversions required limited capital investment and disruption and are delivering higher investment returns, with operating models and product ranges specifically designed to meet the needs of our value customers.
The Group plans to invest a further R2.5 billion in delivering on its growth strategy next year. The investment includes a strong store pipeline across our Pick n Pay and Boxer formats and further investment in expanding the reach of the Group’s central supply chain, and ongoing investment in the Group’s modern and flexible system infrastructure.
The Pick n Pay Longmeadow distribution centre in Gauteng is forecast to reach capacity in the next 24 to 36 months and the Group plans, in partnership with Fortress REIT Limited, to acquire and develop a larger and more efficient facility that will provide for the Group’s long-term needs. The Group will own 60% of the asset by the completion of the development, and will enter into a long-term lease for the 40% balance. Capital investment is estimated at R1.2 billion over the next 24 months and will be funded through highly cost-effective long-term debt secured from a local funding partner.
Shareholder distribution The Board declared a final dividend of 161.00 cents per share. This brings the total FY21 dividend to 179.74 cents per share, down 16.7% on last year in line with the decrease in comparable headline earnings per share, and maintaining a dividend cover of 1.3 times comparable headline earnings per share.
A solid platform for future growthAn extraordinary yearThe Group has made considerable progress in its turnaround and modernisation programme over the past eight years. We believe that our FY21 performance will stand out from all these years for the quality and resilience of the Group’s performance in the most challenging of circumstances. The Group grew its market share over the year, improved the productivity of its operations, and provided customers with ever greater value, including through a growing own brand offer and a highly personalised loyalty programme.
The Board owes a significant debt of gratitude to Richard Brasher for his tremendous leadership over an eight-year tenure, and in particular for his extraordinary commitment this year, when he delayed his retirement to steer the business effectively through the Covid-19 crisis. The Board expresses its sincere thanks to Richard for his invaluable contribution and wishes him well in his retirement.
Looking forwardThe business is well placed for the next chapter of its growth, under the leadership of new CEO Pieter Boone. Pieter joins the Group with a successful and diverse career in retail, most recently with the Metro AG group. Pieter has significant expertise and global experience in the retail, food service and wholesale sectors and has a strong record of delivering retail growth in challenging and emerging market economies. The Group has a solid platform from which to deliver long-term sustainable growth, and everyone in the Group looks forward to working with Pieter to deliver on our high expectations and those of our stakeholders.
Gareth Ackerman Richard BrasherChairman Chief Executive Officer
20 April 2021
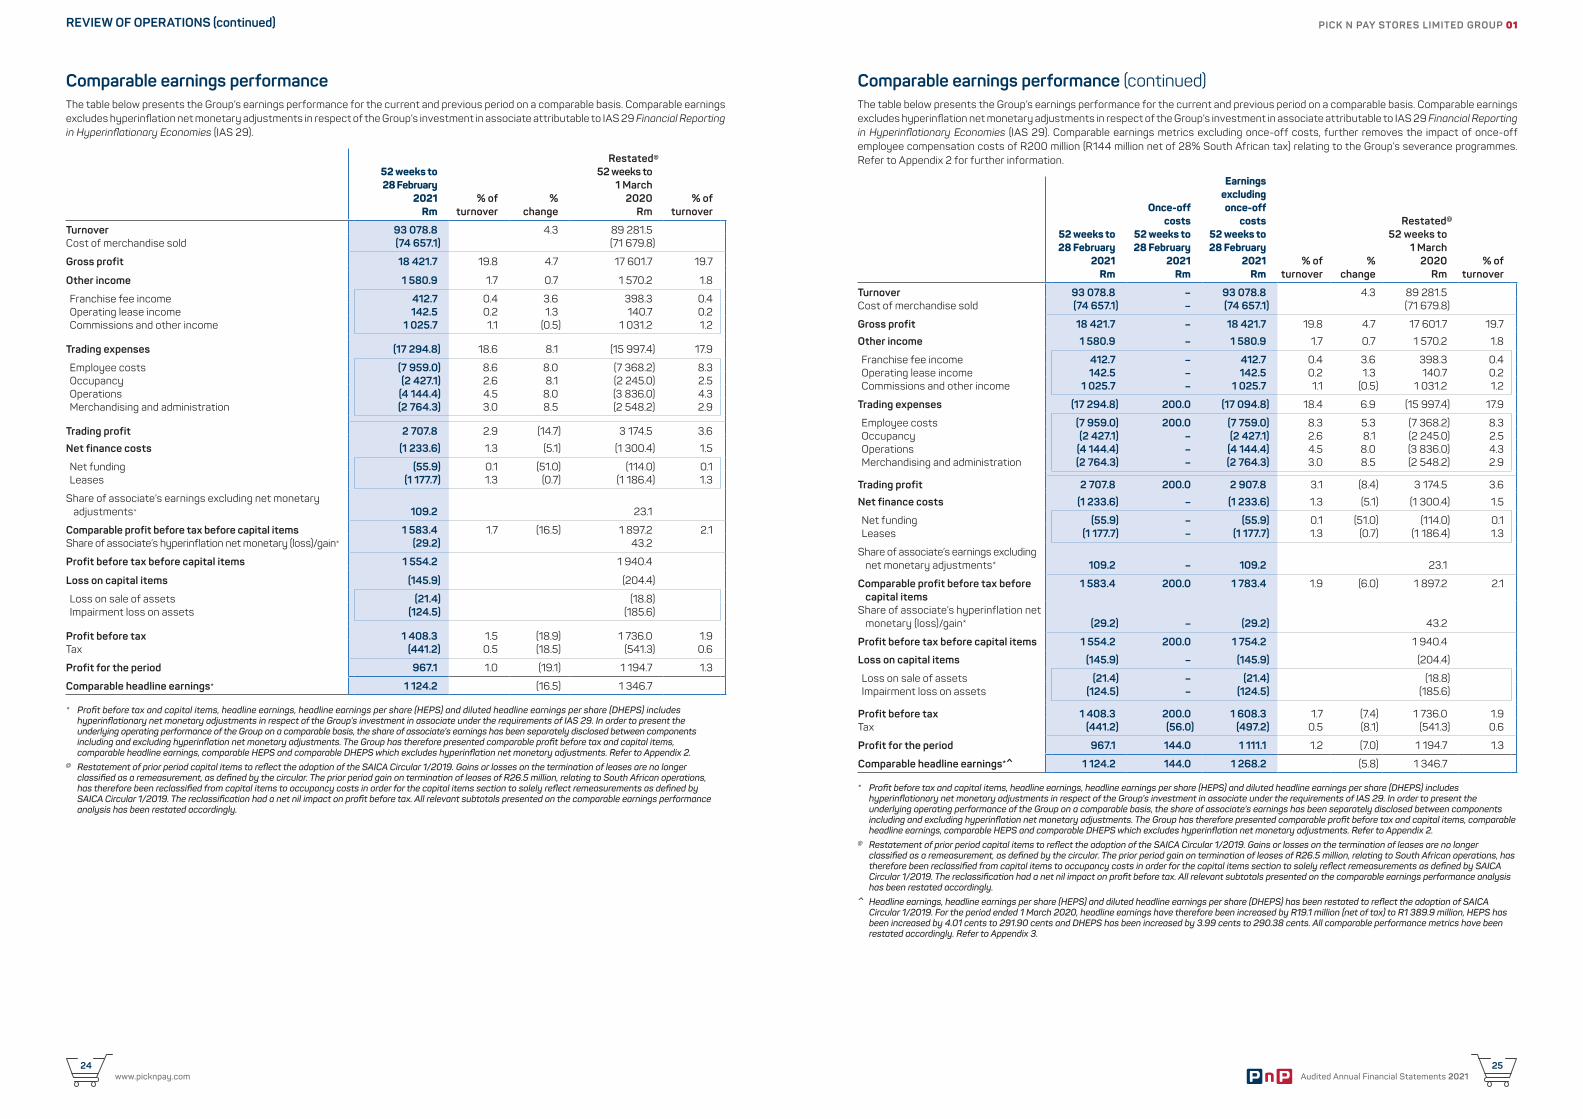
PICK N PAY STORES LIMITED GROUP 01
www.picknpay.com24
Audited Annual Financial Statements 202125
REVIEW OF OPERATIONS (continued)
Comparable earnings performanceThe table below presents the Group’s earnings performance for the current and previous period on a comparable basis. Comparable earnings excludes hyperinflation net monetary adjustments in respect of the Group’s investment in associate attributable to IAS 29 Financial Reporting in Hyperinflationary Economies (IAS 29).
52 weeks to 28 February
2021 Rm
% of turnover
% change
Restated@
52 weeks to 1 March
2020 Rm
% of turnover
Turnover 93 078.8 4.3 89 281.5Cost of merchandise sold (74 657.1) (71 679.8)
Gross profit 18 421.7 19.8 4.7 17 601.7 19.7
Other income 1 580.9 1.7 0.7 1 570.2 1.8
Franchise fee income 412.7 0.4 3.6 398.3 0.4Operating lease income 142.5 0.2 1.3 140.7 0.2Commissions and other income 1 025.7 1.1 (0.5) 1 031.2 1.2
Trading expenses (17 294.8) 18.6 8.1 (15 997.4) 17.9
Employee costs (7 959.0) 8.6 8.0 (7 368.2) 8.3Occupancy (2 427.1) 2.6 8.1 (2 245.0) 2.5Operations (4 144.4) 4.5 8.0 (3 836.0) 4.3Merchandising and administration (2 764.3) 3.0 8.5 (2 548.2) 2.9
Trading profit 2 707.8 2.9 (14.7) 3 174.5 3.6
Net finance costs (1 233.6) 1.3 (5.1) (1 300.4) 1.5
Net funding (55.9) 0.1 (51.0) (114.0) 0.1Leases (1 177.7) 1.3 (0.7) (1 186.4) 1.3
Share of associate’s earnings excluding net monetary adjustments* 109.2 23.1
Comparable profit before tax before capital items 1 583.4 1.7 (16.5) 1 897.2 2.1Share of associate’s hyperinflation net monetary (loss)/gain* (29.2) 43.2
Profit before tax before capital items 1 554.2 1 940.4
Loss on capital items (145.9) (204.4)
Loss on sale of assets (21.4) (18.8)Impairment loss on assets (124.5) (185.6)
Profit before tax 1 408.3 1.5 (18.9) 1 736.0 1.9Tax (441.2) 0.5 (18.5) (541.3) 0.6
Profit for the period 967.1 1.0 (19.1) 1 194.7 1.3
Comparable headline earnings* 1 124.2 (16.5) 1 346.7
* Profit before tax and capital items, headline earnings, headline earnings per share (HEPS) and diluted headline earnings per share (DHEPS) includes hyperinflationary net monetary adjustments in respect of the Group’s investment in associate under the requirements of IAS 29. In order to present the underlying operating performance of the Group on a comparable basis, the share of associate’s earnings has been separately disclosed between components including and excluding hyperinflation net monetary adjustments. The Group has therefore presented comparable profit before tax and capital items, comparable headline earnings, comparable HEPS and comparable DHEPS which excludes hyperinflation net monetary adjustments. Refer to Appendix 2.
@ Restatement of prior period capital items to reflect the adoption of the SAICA Circular 1/2019. Gains or losses on the termination of leases are no longer classified as a remeasurement, as defined by the circular. The prior period gain on termination of leases of R26.5 million, relating to South African operations, has therefore been reclassified from capital items to occupancy costs in order for the capital items section to solely reflect remeasurements as defined by SAICA Circular 1/2019. The reclassification had a net nil impact on profit before tax. All relevant subtotals presented on the comparable earnings performance analysis has been restated accordingly.
Comparable earnings performance (continued)The table below presents the Group’s earnings performance for the current and previous period on a comparable basis. Comparable earnings excludes hyperinflation net monetary adjustments in respect of the Group’s investment in associate attributable to IAS 29 Financial Reporting in Hyperinflationary Economies (IAS 29). Comparable earnings metrics excluding once-off costs, further removes the impact of once-off employee compensation costs of R200 million (R144 million net of 28% South African tax) relating to the Group’s severance programmes. Refer to Appendix 2 for further information.
52 weeks to 28 February
2021 Rm
Once-offcosts
52 weeks to 28 February
2021 Rm
Earningsexcludingonce-off
costs 52 weeks to 28 February
2021 Rm
% of turnover
% change
Restated@
52 weeks to 1 March
2020 Rm
% of turnover
Turnover 93 078.8 – 93 078.8 4.3 89 281.5Cost of merchandise sold (74 657.1) – (74 657.1) (71 679.8)
Gross profit 18 421.7 – 18 421.7 19.8 4.7 17 601.7 19.7
Other income 1 580.9 – 1 580.9 1.7 0.7 1 570.2 1.8
Franchise fee income 412.7 – 412.7 0.4 3.6 398.3 0.4Operating lease income 142.5 – 142.5 0.2 1.3 140.7 0.2Commissions and other income 1 025.7 – 1 025.7 1.1 (0.5) 1 031.2 1.2
Trading expenses (17 294.8) 200.0 (17 094.8) 18.4 6.9 (15 997.4) 17.9
Employee costs (7 959.0) 200.0 (7 759.0) 8.3 5.3 (7 368.2) 8.3Occupancy (2 427.1) – (2 427.1) 2.6 8.1 (2 245.0) 2.5Operations (4 144.4) – (4 144.4) 4.5 8.0 (3 836.0) 4.3Merchandising and administration (2 764.3) – (2 764.3) 3.0 8.5 (2 548.2) 2.9
Trading profit 2 707.8 200.0 2 907.8 3.1 (8.4) 3 174.5 3.6
Net finance costs (1 233.6) – (1 233.6) 1.3 (5.1) (1 300.4) 1.5
Net funding (55.9) – (55.9) 0.1 (51.0) (114.0) 0.1Leases (1 177.7) – (1 177.7) 1.3 (0.7) (1 186.4) 1.3
Share of associate’s earnings excluding net monetary adjustments* 109.2 – 109.2 23.1
Comparable profit before tax before capital items
1 583.4 200.0 1 783.4 1.9 (6.0) 1 897.2 2.1
Share of associate’s hyperinflation net monetary (loss)/gain* (29.2) – (29.2) 43.2
Profit before tax before capital items 1 554.2 200.0 1 754.2 1 940.4
Loss on capital items (145.9) – (145.9) (204.4)
Loss on sale of assets (21.4) – (21.4) (18.8)Impairment loss on assets (124.5) – (124.5) (185.6)
Profit before tax 1 408.3 200.0 1 608.3 1.7 (7.4) 1 736.0 1.9Tax (441.2) (56.0) (497.2) 0.5 (8.1) (541.3) 0.6
Profit for the period 967.1 144.0 1 111.1 1.2 (7.0) 1 194.7 1.3
Comparable headline earnings*^ 1 124.2 144.0 1 268.2 (5.8) 1 346.7
* Profit before tax and capital items, headline earnings, headline earnings per share (HEPS) and diluted headline earnings per share (DHEPS) includes hyperinflationary net monetary adjustments in respect of the Group’s investment in associate under the requirements of IAS 29. In order to present the underlying operating performance of the Group on a comparable basis, the share of associate’s earnings has been separately disclosed between components including and excluding hyperinflation net monetary adjustments. The Group has therefore presented comparable profit before tax and capital items, comparable headline earnings, comparable HEPS and comparable DHEPS which excludes hyperinflation net monetary adjustments. Refer to Appendix 2.
@ Restatement of prior period capital items to reflect the adoption of the SAICA Circular 1/2019. Gains or losses on the termination of leases are no longer classified as a remeasurement, as defined by the circular. The prior period gain on termination of leases of R26.5 million, relating to South African operations, has therefore been reclassified from capital items to occupancy costs in order for the capital items section to solely reflect remeasurements as defined by SAICA Circular 1/2019. The reclassification had a net nil impact on profit before tax. All relevant subtotals presented on the comparable earnings performance analysis has been restated accordingly.
^ Headline earnings, headline earnings per share (HEPS) and diluted headline earnings per share (DHEPS) has been restated to reflect the adoption of SAICA Circular 1/2019. For the period ended 1 March 2020, headline earnings have therefore been increased by R19.1 million (net of tax) to R1 389.9 million, HEPS has been increased by 4.01 cents to 291.90 cents and DHEPS has been increased by 3.99 cents to 290.38 cents. All comparable performance metrics have been restated accordingly. Refer to Appendix 3.
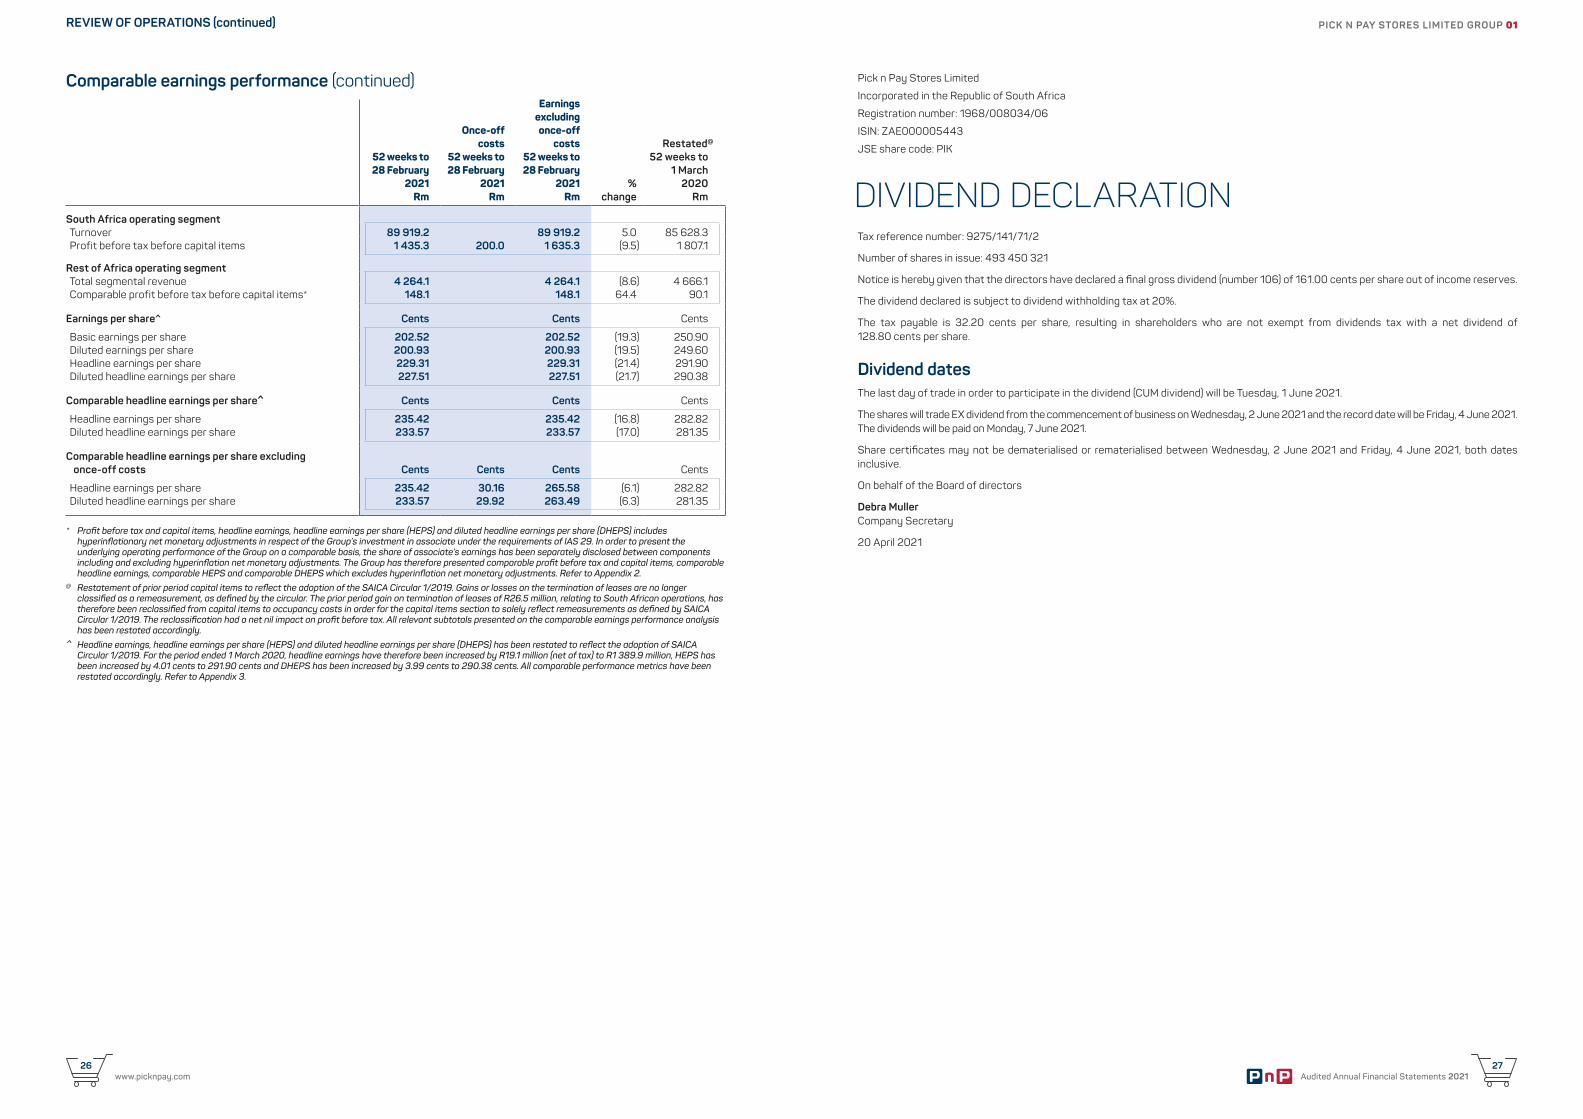
PICK N PAY STORES LIMITED GROUP 01
Audited Annual Financial Statements 202127
www.picknpay.com26
Comparable earnings performance (continued)
52 weeks to 28 February
2021 Rm
Once-offcosts
52 weeks to 28 February
2021 Rm
Earningsexcludingonce-off
costs 52 weeks to 28 February
2021 Rm
% change
Restated@
52 weeks to 1 March
2020 Rm
South Africa operating segmentTurnover 89 919.2 89 919.2 5.0 85 628.3Profit before tax before capital items 1 435.3 200.0 1 635.3 (9.5) 1 807.1
Rest of Africa operating segmentTotal segmental revenue 4 264.1 4 264.1 (8.6) 4 666.1 Comparable profit before tax before capital items* 148.1 148.1 64.4 90.1
Earnings per share^ Cents Cents Cents
Basic earnings per share 202.52 202.52 (19.3) 250.90 Diluted earnings per share 200.93 200.93 (19.5) 249.60 Headline earnings per share 229.31 229.31 (21.4) 291.90 Diluted headline earnings per share 227.51 227.51 (21.7) 290.38
Comparable headline earnings per share^ Cents Cents Cents
Headline earnings per share 235.42 235.42 (16.8) 282.82Diluted headline earnings per share 233.57 233.57 (17.0) 281.35
Comparable headline earnings per share excluding once-off costs Cents Cents Cents Cents
Headline earnings per share 235.42 30.16 265.58 (6.1) 282.82Diluted headline earnings per share 233.57 29.92 263.49 (6.3) 281.35
* Profit before tax and capital items, headline earnings, headline earnings per share (HEPS) and diluted headline earnings per share (DHEPS) includes hyperinflationary net monetary adjustments in respect of the Group’s investment in associate under the requirements of IAS 29. In order to present the underlying operating performance of the Group on a comparable basis, the share of associate’s earnings has been separately disclosed between components including and excluding hyperinflation net monetary adjustments. The Group has therefore presented comparable profit before tax and capital items, comparable headline earnings, comparable HEPS and comparable DHEPS which excludes hyperinflation net monetary adjustments. Refer to Appendix 2.
@ Restatement of prior period capital items to reflect the adoption of the SAICA Circular 1/2019. Gains or losses on the termination of leases are no longer classified as a remeasurement, as defined by the circular. The prior period gain on termination of leases of R26.5 million, relating to South African operations, has therefore been reclassified from capital items to occupancy costs in order for the capital items section to solely reflect remeasurements as defined by SAICA Circular 1/2019. The reclassification had a net nil impact on profit before tax. All relevant subtotals presented on the comparable earnings performance analysis has been restated accordingly.
^ Headline earnings, headline earnings per share (HEPS) and diluted headline earnings per share (DHEPS) has been restated to reflect the adoption of SAICA Circular 1/2019. For the period ended 1 March 2020, headline earnings have therefore been increased by R19.1 million (net of tax) to R1 389.9 million, HEPS has been increased by 4.01 cents to 291.90 cents and DHEPS has been increased by 3.99 cents to 290.38 cents. All comparable performance metrics have been restated accordingly. Refer to Appendix 3.
REVIEW OF OPERATIONS (continued)
DIVIDEND DECLARATION
Pick n Pay Stores Limited
Incorporated in the Republic of South Africa
Registration number: 1968/008034/06
ISIN: ZAE000005443
JSE share code: PIK
Tax reference number: 9275/141/71/2
Number of shares in issue: 493 450 321
Notice is hereby given that the directors have declared a final gross dividend (number 106) of 161.00 cents per share out of income reserves.
The dividend declared is subject to dividend withholding tax at 20%.
The tax payable is 32.20 cents per share, resulting in shareholders who are not exempt from dividends tax with a net dividend of 128.80 cents per share.
Dividend datesThe last day of trade in order to participate in the dividend (CUM dividend) will be Tuesday, 1 June 2021.
The shares will trade EX dividend from the commencement of business on Wednesday, 2 June 2021 and the record date will be Friday, 4 June 2021. The dividends will be paid on Monday, 7 June 2021.
Share certificates may not be dematerialised or rematerialised between Wednesday, 2 June 2021 and Friday, 4 June 2021, both dates inclusive.
On behalf of the Board of directors
Debra MullerCompany Secretary
20 April 2021

Audited Annual Financial Statements 202129
02
GR
OU
P A
NN
UA
L FI
NA
NC
IAL
STA
TEM
ENTS
30Statement of comprehensive income
31Statement of financial position
32Statement of changes in equity
33Statement of cash flows
34Notes to the Group annual financial statements
Audited Annual Financial Statements 202129
www.picknpay.com28
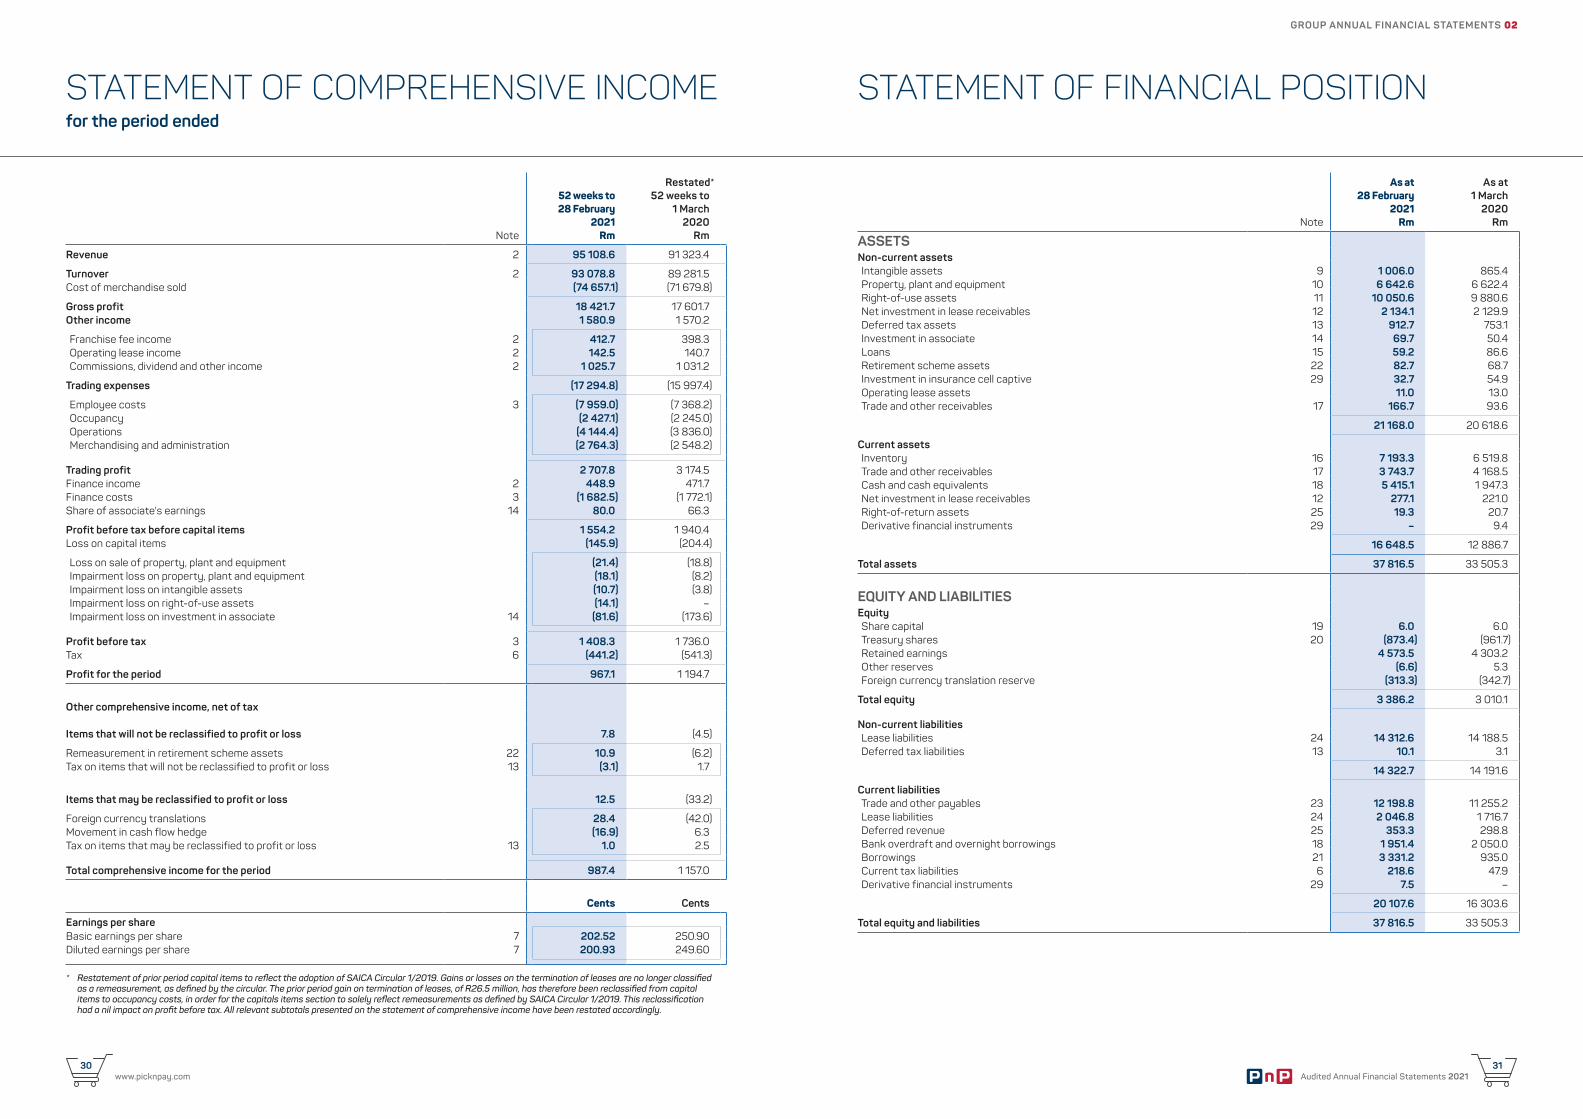
www.picknpay.com30
Audited Annual Financial Statements 202131
GROUP ANNUAL FINANCIAL STATEMENTS 02
STATEMENT OF FINANCIAL POSITIONSTATEMENT OF COMPREHENSIVE INCOMEfor the period ended
Note
52 weeks to 28 February
2021 Rm
Restated* 52 weeks to
1 March 2020
Rm
Revenue 2 95 108.6 91 323.4
Turnover 2 93 078.8 89 281.5 Cost of merchandise sold (74 657.1) (71 679.8)
Gross profit 18 421.7 17 601.7 Other income 1 580.9 1 570.2
Franchise fee income 2 412.7 398.3 Operating lease income 2 142.5 140.7 Commissions, dividend and other income 2 1 025.7 1 031.2
Trading expenses (17 294.8) (15 997.4)
Employee costs 3 (7 959.0) (7 368.2)Occupancy (2 427.1) (2 245.0)Operations (4 144.4) (3 836.0)Merchandising and administration (2 764.3) (2 548.2)
Trading profit 2 707.8 3 174.5 Finance income 2 448.9 471.7 Finance costs 3 (1 682.5) (1 772.1)Share of associate's earnings 14 80.0 66.3
Profit before tax before capital items 1 554.2 1 940.4 Loss on capital items (145.9) (204.4)
Loss on sale of property, plant and equipment (21.4) (18.8)Impairment loss on property, plant and equipment (18.1) (8.2)Impairment loss on intangible assets (10.7) (3.8)Impairment loss on right-of-use assets (14.1) – Impairment loss on investment in associate 14 (81.6) (173.6)
Profit before tax 3 1 408.3 1 736.0 Tax 6 (441.2) (541.3)
Profit for the period 967.1 1 194.7
Other comprehensive income, net of tax
Items that will not be reclassified to profit or loss 7.8 (4.5)
Remeasurement in retirement scheme assets 22 10.9 (6.2)Tax on items that will not be reclassified to profit or loss 13 (3.1) 1.7
Items that may be reclassified to profit or loss 12.5 (33.2)
Foreign currency translations 28.4 (42.0)Movement in cash flow hedge (16.9) 6.3 Tax on items that may be reclassified to profit or loss 13 1.0 2.5
Total comprehensive income for the period 987.4 1 157.0
Cents Cents
Earnings per share Basic earnings per share 7 202.52 250.90 Diluted earnings per share 7 200.93 249.60
* Restatement of prior period capital items to reflect the adoption of SAICA Circular 1/2019. Gains or losses on the termination of leases are no longer classified as a remeasurement, as defined by the circular. The prior period gain on termination of leases, of R26.5 million, has therefore been reclassified from capital items to occupancy costs, in order for the capitals items section to solely reflect remeasurements as defined by SAICA Circular 1/2019. This reclassification had a nil impact on profit before tax. All relevant subtotals presented on the statement of comprehensive income have been restated accordingly.
Note
As at 28 February
2021 Rm
As at 1 March
2020 Rm
ASSETSNon-current assetsIntangible assets 9 1 006.0 865.4 Property, plant and equipment 10 6 642.6 6 622.4 Right-of-use assets 11 10 050.6 9 880.6 Net investment in lease receivables 12 2 134.1 2 129.9 Deferred tax assets 13 912.7 753.1 Investment in associate 14 69.7 50.4 Loans 15 59.2 86.6 Retirement scheme assets 22 82.7 68.7 Investment in insurance cell captive 29 32.7 54.9 Operating lease assets 11.0 13.0 Trade and other receivables 17 166.7 93.6
21 168.0 20 618.6
Current assetsInventory 16 7 193.3 6 519.8 Trade and other receivables 17 3 743.7 4 168.5 Cash and cash equivalents 18 5 415.1 1 947.3 Net investment in lease receivables 12 277.1 221.0 Right-of-return assets 25 19.3 20.7 Derivative financial instruments 29 – 9.4
16 648.5 12 886.7
Total assets 37 816.5 33 505.3
EQUITY AND LIABILITIESEquityShare capital 19 6.0 6.0 Treasury shares 20 (873.4) (961.7) Retained earnings 4 573.5 4 303.2 Other reserves (6.6) 5.3 Foreign currency translation reserve (313.3) (342.7)
Total equity 3 386.2 3 010.1
Non-current liabilitiesLease liabilities 24 14 312.6 14 188.5 Deferred tax liabilities 13 10.1 3.1
14 322.7 14 191.6
Current liabilitiesTrade and other payables 23 12 198.8 11 255.2 Lease liabilities 24 2 046.8 1 716.7 Deferred revenue 25 353.3 298.8 Bank overdraft and overnight borrowings 18 1 951.4 2 050.0 Borrowings 21 3 331.2 935.0 Current tax liabilities 6 218.6 47.9 Derivative financial instruments 29 7.5 –
20 107.6 16 303.6
Total equity and liabilities 37 816.5 33 505.3
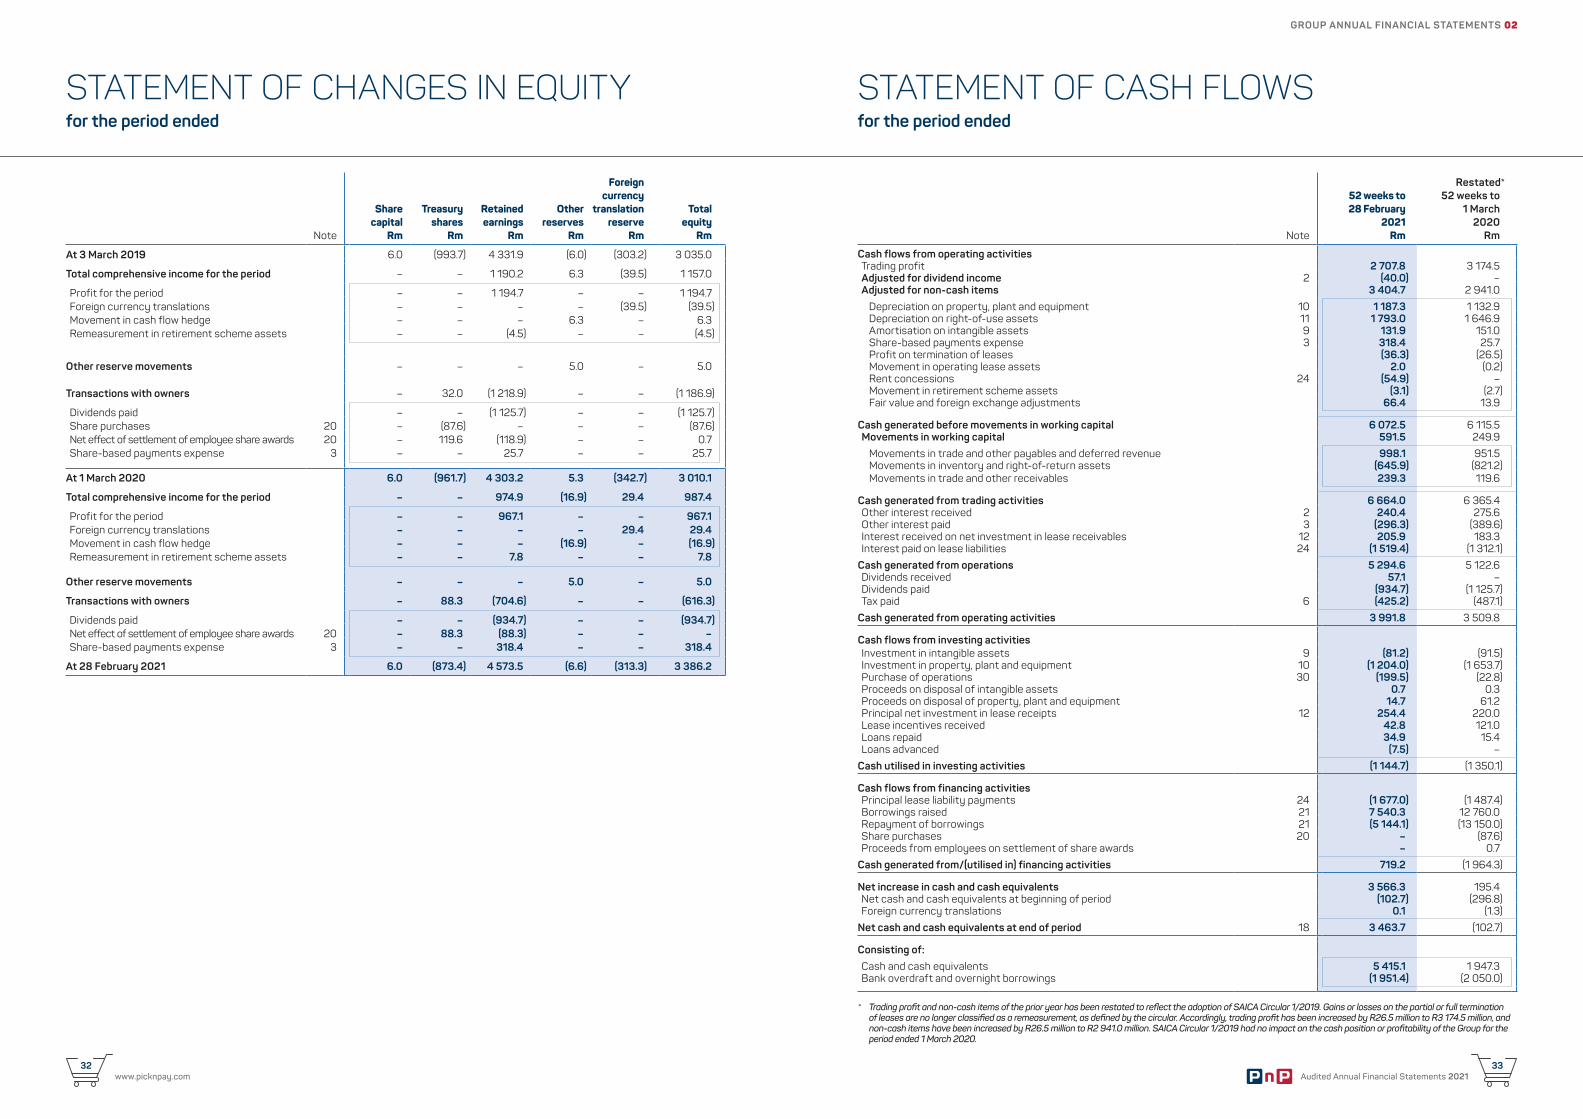
Audited Annual Financial Statements 202133
STATEMENT OF CASH FLOWSfor the period ended
STATEMENT OF CHANGES IN EQUITYfor the period ended
Note
52 weeks to 28 February
2021 Rm
Restated* 52 weeks to
1 March 2020
Rm
Cash flows from operating activitiesTrading profit 2 707.8 3 174.5 Adjusted for dividend income 2 (40.0) –Adjusted for non-cash items 3 404.7 2 941.0
Depreciation on property, plant and equipment 10 1 187.3 1 132.9 Depreciation on right-of-use assets 11 1 793.0 1 646.9 Amortisation on intangible assets 9 131.9 151.0 Share-based payments expense 3 318.4 25.7 Profit on termination of leases (36.3) (26.5) Movement in operating lease assets 2.0 (0.2) Rent concessions 24 (54.9) – Movement in retirement scheme assets (3.1) (2.7) Fair value and foreign exchange adjustments 66.4 13.9
Cash generated before movements in working capital 6 072.5 6 115.5 Movements in working capital 591.5 249.9
Movements in trade and other payables and deferred revenue 998.1 951.5 Movements in inventory and right-of-return assets (645.9) (821.2) Movements in trade and other receivables 239.3 119.6
Cash generated from trading activities 6 664.0 6 365.4 Other interest received 2 240.4 275.6 Other interest paid 3 (296.3) (389.6) Interest received on net investment in lease receivables 12 205.9 183.3 Interest paid on lease liabilities 24 (1 519.4) (1 312.1)
Cash generated from operations 5 294.6 5 122.6 Dividends received 57.1 – Dividends paid (934.7) (1 125.7) Tax paid 6 (425.2) (487.1)
Cash generated from operating activities 3 991.8 3 509.8
Cash flows from investing activitiesInvestment in intangible assets 9 (81.2) (91.5) Investment in property, plant and equipment 10 (1 204.0) (1 653.7) Purchase of operations 30 (199.5) (22.8) Proceeds on disposal of intangible assets 0.7 0.3 Proceeds on disposal of property, plant and equipment 14.7 61.2 Principal net investment in lease receipts 12 254.4 220.0 Lease incentives received 42.8 121.0 Loans repaid 34.9 15.4 Loans advanced (7.5) –
Cash utilised in investing activities (1 144.7) (1 350.1)
Cash flows from financing activitiesPrincipal lease liability payments 24 (1 677.0) (1 487.4) Borrowings raised 21 7 540.3 12 760.0 Repayment of borrowings 21 (5 144.1) (13 150.0) Share purchases 20 – (87.6) Proceeds from employees on settlement of share awards – 0.7
Cash generated from/(utilised in) financing activities 719.2 (1 964.3)
Net increase in cash and cash equivalents 3 566.3 195.4 Net cash and cash equivalents at beginning of period (102.7) (296.8) Foreign currency translations 0.1 (1.3)
Net cash and cash equivalents at end of period 18 3 463.7 (102.7)
Consisting of:
Cash and cash equivalents 5 415.1 1 947.3 Bank overdraft and overnight borrowings (1 951.4) (2 050.0)
* Trading profit and non-cash items of the prior year has been restated to reflect the adoption of SAICA Circular 1/2019. Gains or losses on the partial or full termination of leases are no longer classified as a remeasurement, as defined by the circular. Accordingly, trading profit has been increased by R26.5 million to R3 174.5 million, and non-cash items have been increased by R26.5 million to R2 941.0 million. SAICA Circular 1/2019 had no impact on the cash position or profitability of the Group for the period ended 1 March 2020.
Note
Sharecapital
Rm
Treasuryshares
Rm
Retainedearnings
Rm
Otherreserves
Rm
Foreigncurrency
translationreserve
Rm
Totalequity
Rm
At 3 March 2019 6.0 (993.7) 4 331.9 (6.0) (303.2) 3 035.0
Total comprehensive income for the period – – 1 190.2 6.3 (39.5) 1 157.0
Profit for the period – – 1 194.7 – – 1 194.7 Foreign currency translations – – – – (39.5) (39.5) Movement in cash flow hedge – – – 6.3 – 6.3 Remeasurement in retirement scheme assets – – (4.5) – – (4.5)
Other reserve movements – – – 5.0 – 5.0
Transactions with owners – 32.0 (1 218.9) – – (1 186.9)
Dividends paid – – (1 125.7) – – (1 125.7) Share purchases 20 – (87.6) – – – (87.6) Net effect of settlement of employee share awards 20 – 119.6 (118.9) – – 0.7 Share-based payments expense 3 – – 25.7 – – 25.7
At 1 March 2020 6.0 (961.7) 4 303.2 5.3 (342.7) 3 010.1
Total comprehensive income for the period – – 974.9 (16.9) 29.4 987.4
Profit for the period – – 967.1 – – 967.1 Foreign currency translations – – – – 29.4 29.4 Movement in cash flow hedge – – – (16.9) – (16.9) Remeasurement in retirement scheme assets – – 7.8 – – 7.8
Other reserve movements – – – 5.0 – 5.0
Transactions with owners – 88.3 (704.6) – – (616.3)
Dividends paid – – (934.7) – – (934.7) Net effect of settlement of employee share awards 20 – 88.3 (88.3) – – – Share-based payments expense 3 – – 318.4 – – 318.4
At 28 February 2021 6.0 (873.4) 4 573.5 (6.6) (313.3) 3 386.2
GROUP ANNUAL FINANCIAL STATEMENTS 02
www.picknpay.com32
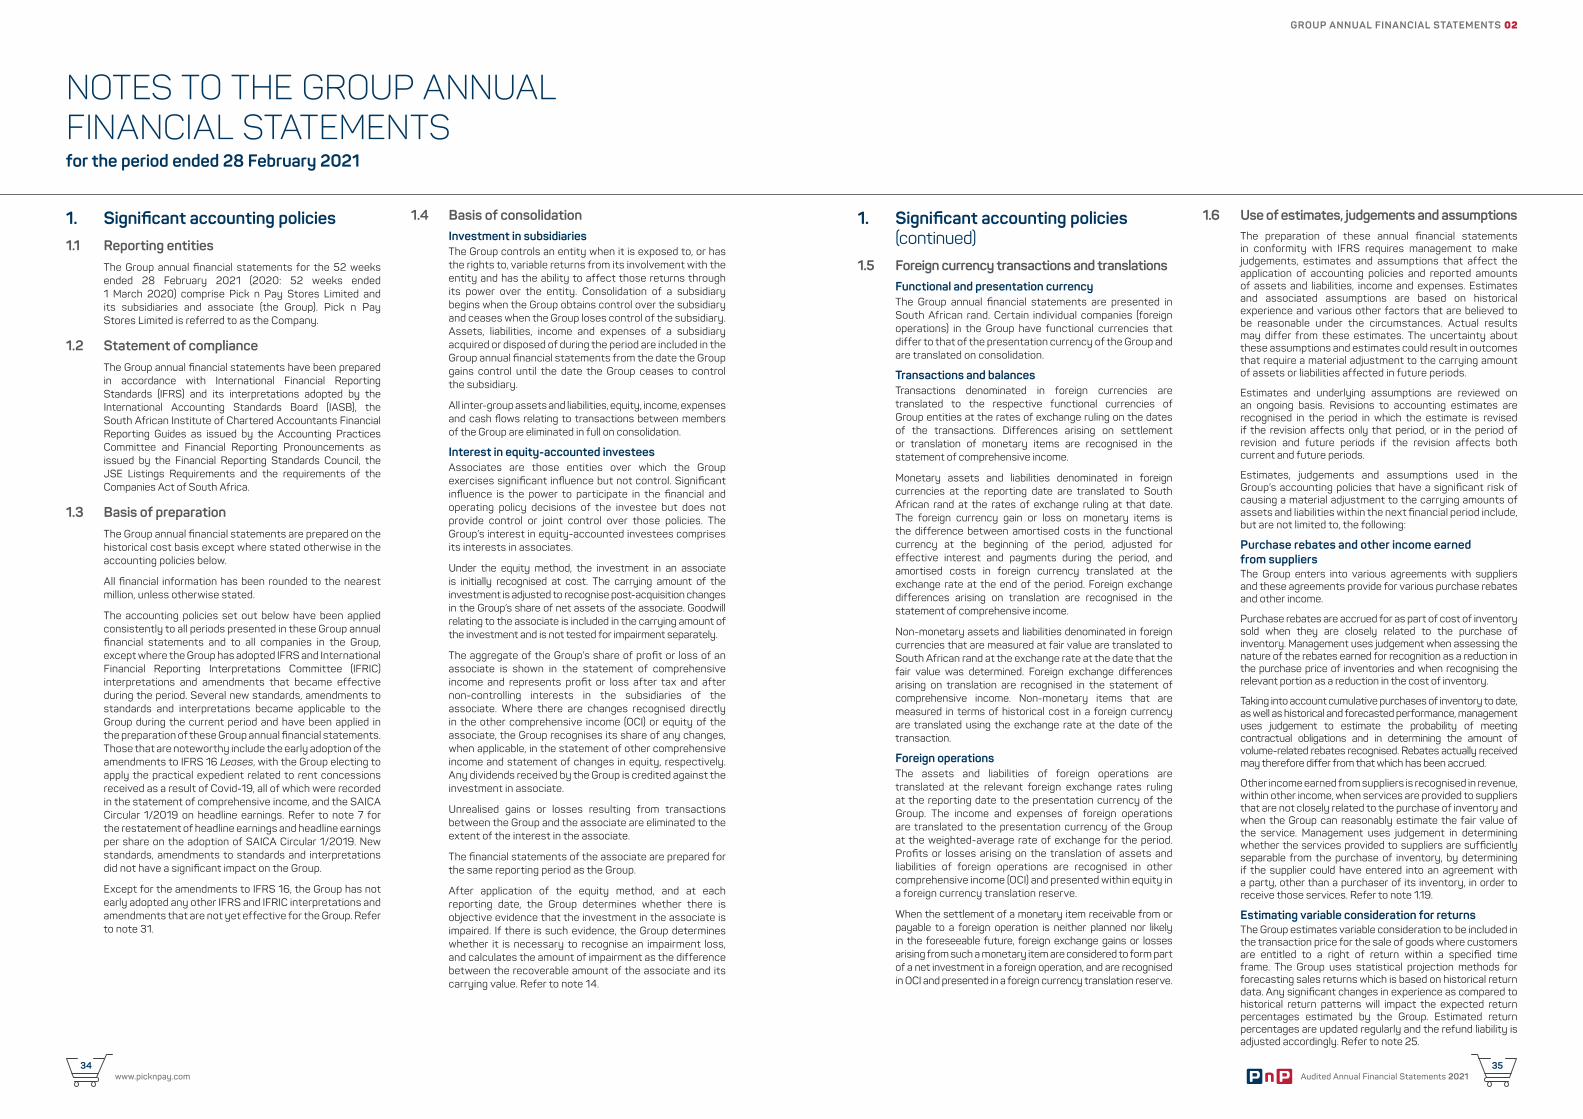
Audited Annual Financial Statements 202135
NOTES TO THE GROUP ANNUAL FINANCIAL STATEMENTSfor the period ended 28 February 2021
1. Significant accounting policies 1.1 Reporting entities
The Group annual financial statements for the 52 weeks ended 28 February 2021 (2020: 52 weeks ended 1 March 2020) comprise Pick n Pay Stores Limited and its subsidiaries and associate (the Group). Pick n Pay Stores Limited is referred to as the Company.
1.2 Statement of complianceThe Group annual financial statements have been prepared in accordance with International Financial Reporting Standards (IFRS) and its interpretations adopted by the International Accounting Standards Board (IASB), the South African Institute of Chartered Accountants Financial Reporting Guides as issued by the Accounting Practices Committee and Financial Reporting Pronouncements as issued by the Financial Reporting Standards Council, the JSE Listings Requirements and the requirements of the Companies Act of South Africa.
1.3 Basis of preparationThe Group annual financial statements are prepared on the historical cost basis except where stated otherwise in the accounting policies below.
All financial information has been rounded to the nearest million, unless otherwise stated.
The accounting policies set out below have been applied consistently to all periods presented in these Group annual financial statements and to all companies in the Group, except where the Group has adopted IFRS and International Financial Reporting Interpretations Committee (IFRIC) interpretations and amendments that became effective during the period. Several new standards, amendments to standards and interpretations became applicable to the Group during the current period and have been applied in the preparation of these Group annual financial statements. Those that are noteworthy include the early adoption of the amendments to IFRS 16 Leases, with the Group electing to apply the practical expedient related to rent concessions received as a result of Covid-19, all of which were recorded in the statement of comprehensive income, and the SAICA Circular 1/2019 on headline earnings. Refer to note 7 for the restatement of headline earnings and headline earnings per share on the adoption of SAICA Circular 1/2019. New standards, amendments to standards and interpretations did not have a significant impact on the Group.
Except for the amendments to IFRS 16, the Group has not early adopted any other IFRS and IFRIC interpretations and amendments that are not yet effective for the Group. Refer to note 31.
1.4 Basis of consolidationInvestment in subsidiariesThe Group controls an entity when it is exposed to, or has the rights to, variable returns from its involvement with the entity and has the ability to affect those returns through its power over the entity. Consolidation of a subsidiary begins when the Group obtains control over the subsidiary and ceases when the Group loses control of the subsidiary. Assets, liabilities, income and expenses of a subsidiary acquired or disposed of during the period are included in the Group annual financial statements from the date the Group gains control until the date the Group ceases to control the subsidiary.
All inter-group assets and liabilities, equity, income, expenses and cash flows relating to transactions between members of the Group are eliminated in full on consolidation.
Interest in equity-accounted investeesAssociates are those entities over which the Group exercises significant influence but not control. Significant influence is the power to participate in the financial and operating policy decisions of the investee but does not provide control or joint control over those policies. The Group’s interest in equity-accounted investees comprises its interests in associates.
Under the equity method, the investment in an associate is initially recognised at cost. The carrying amount of the investment is adjusted to recognise post-acquisition changes in the Group’s share of net assets of the associate. Goodwill relating to the associate is included in the carrying amount of the investment and is not tested for impairment separately.
The aggregate of the Group’s share of profit or loss of an associate is shown in the statement of comprehensive income and represents profit or loss after tax and after non-controlling interests in the subsidiaries of the associate. Where there are changes recognised directly in the other comprehensive income (OCI) or equity of the associate, the Group recognises its share of any changes, when applicable, in the statement of other comprehensive income and statement of changes in equity, respectively. Any dividends received by the Group is credited against the investment in associate.
Unrealised gains or losses resulting from transactions between the Group and the associate are eliminated to the extent of the interest in the associate.
The financial statements of the associate are prepared for the same reporting period as the Group.
After application of the equity method, and at each reporting date, the Group determines whether there is objective evidence that the investment in the associate is impaired. If there is such evidence, the Group determines whether it is necessary to recognise an impairment loss, and calculates the amount of impairment as the difference between the recoverable amount of the associate and its carrying value. Refer to note 14.
1. Significant accounting policies (continued)
1.5 Foreign currency transactions and translationsFunctional and presentation currencyThe Group annual financial statements are presented in South African rand. Certain individual companies (foreign operations) in the Group have functional currencies that differ to that of the presentation currency of the Group and are translated on consolidation.
Transactions and balancesTransactions denominated in foreign currencies are translated to the respective functional currencies of Group entities at the rates of exchange ruling on the dates of the transactions. Differences arising on settlement or translation of monetary items are recognised in the statement of comprehensive income.
Monetary assets and liabilities denominated in foreign currencies at the reporting date are translated to South African rand at the rates of exchange ruling at that date. The foreign currency gain or loss on monetary items is the difference between amortised costs in the functional currency at the beginning of the period, adjusted for effective interest and payments during the period, and amortised costs in foreign currency translated at the exchange rate at the end of the period. Foreign exchange differences arising on translation are recognised in the statement of comprehensive income.
Non-monetary assets and liabilities denominated in foreign currencies that are measured at fair value are translated to South African rand at the exchange rate at the date that the fair value was determined. Foreign exchange differences arising on translation are recognised in the statement of comprehensive income. Non-monetary items that are measured in terms of historical cost in a foreign currency are translated using the exchange rate at the date of the transaction.
Foreign operationsThe assets and liabilities of foreign operations are translated at the relevant foreign exchange rates ruling at the reporting date to the presentation currency of the Group. The income and expenses of foreign operations are translated to the presentation currency of the Group at the weighted-average rate of exchange for the period. Profits or losses arising on the translation of assets and liabilities of foreign operations are recognised in other comprehensive income (OCI) and presented within equity in a foreign currency translation reserve.
When the settlement of a monetary item receivable from or payable to a foreign operation is neither planned nor likely in the foreseeable future, foreign exchange gains or losses arising from such a monetary item are considered to form part of a net investment in a foreign operation, and are recognised in OCI and presented in a foreign currency translation reserve.
1.6 Use of estimates, judgements and assumptionsThe preparation of these annual financial statements in conformity with IFRS requires management to make judgements, estimates and assumptions that affect the application of accounting policies and reported amounts of assets and liabilities, income and expenses. Estimates and associated assumptions are based on historical experience and various other factors that are believed to be reasonable under the circumstances. Actual results may differ from these estimates. The uncertainty about these assumptions and estimates could result in outcomes that require a material adjustment to the carrying amount of assets or liabilities affected in future periods.
Estimates and underlying assumptions are reviewed on an ongoing basis. Revisions to accounting estimates are recognised in the period in which the estimate is revised if the revision affects only that period, or in the period of revision and future periods if the revision affects both current and future periods.
Estimates, judgements and assumptions used in the Group’s accounting policies that have a significant risk of causing a material adjustment to the carrying amounts of assets and liabilities within the next financial period include, but are not limited to, the following:
Purchase rebates and other income earned from suppliersThe Group enters into various agreements with suppliers and these agreements provide for various purchase rebates and other income.
Purchase rebates are accrued for as part of cost of inventory sold when they are closely related to the purchase of inventory. Management uses judgement when assessing the nature of the rebates earned for recognition as a reduction in the purchase price of inventories and when recognising the relevant portion as a reduction in the cost of inventory.
Taking into account cumulative purchases of inventory to date, as well as historical and forecasted performance, management uses judgement to estimate the probability of meeting contractual obligations and in determining the amount of volume-related rebates recognised. Rebates actually received may therefore differ from that which has been accrued.
Other income earned from suppliers is recognised in revenue, within other income, when services are provided to suppliers that are not closely related to the purchase of inventory and when the Group can reasonably estimate the fair value of the service. Management uses judgement in determining whether the services provided to suppliers are sufficiently separable from the purchase of inventory, by determining if the supplier could have entered into an agreement with a party, other than a purchaser of its inventory, in order to receive those services. Refer to note 1.19.
Estimating variable consideration for returnsThe Group estimates variable consideration to be included in the transaction price for the sale of goods where customers are entitled to a right of return within a specified time frame. The Group uses statistical projection methods for forecasting sales returns which is based on historical return data. Any significant changes in experience as compared to historical return patterns will impact the expected return percentages estimated by the Group. Estimated return percentages are updated regularly and the refund liability is adjusted accordingly. Refer to note 25.
GROUP ANNUAL FINANCIAL STATEMENTS 02
www.picknpay.com34
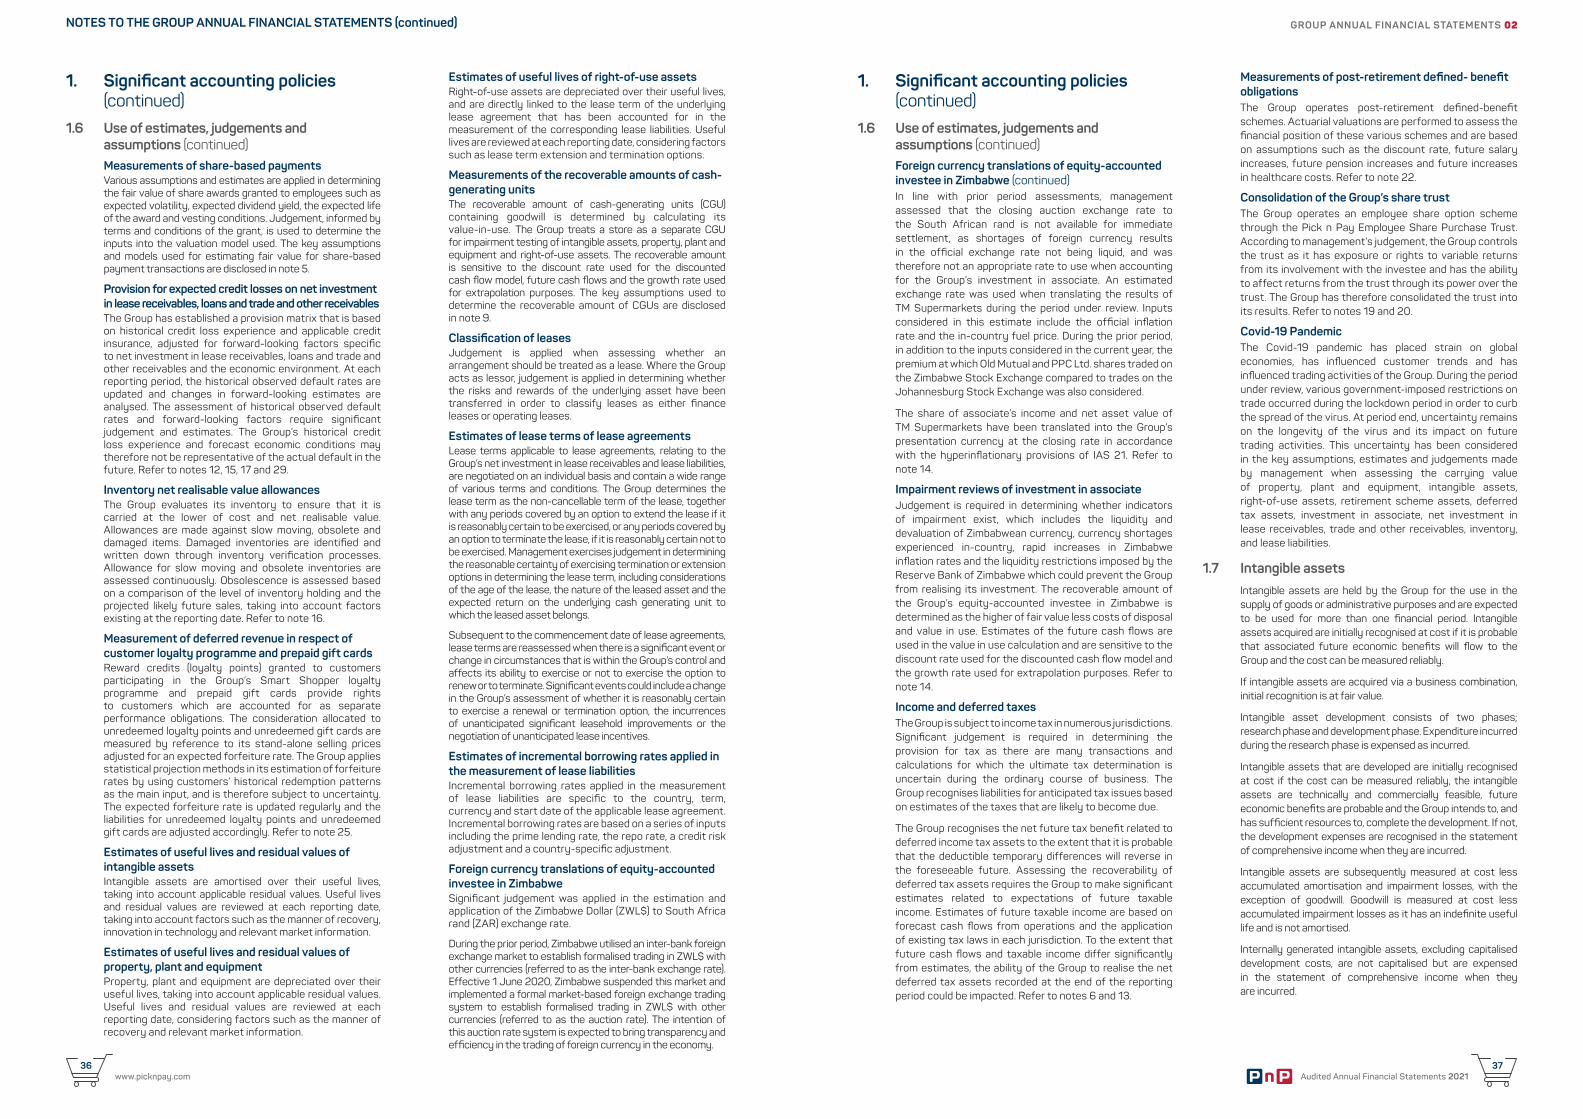
Audited Annual Financial Statements 202137
www.picknpay.com36
1. Significant accounting policies (continued)
1.6 Use of estimates, judgements and assumptions (continued)Measurements of share-based paymentsVarious assumptions and estimates are applied in determining the fair value of share awards granted to employees such as expected volatility, expected dividend yield, the expected life of the award and vesting conditions. Judgement, informed by terms and conditions of the grant, is used to determine the inputs into the valuation model used. The key assumptions and models used for estimating fair value for share-based payment transactions are disclosed in note 5.
Provision for expected credit losses on net investment in lease receivables, loans and trade and other receivables The Group has established a provision matrix that is based on historical credit loss experience and applicable credit insurance, adjusted for forward-looking factors specific to net investment in lease receivables, loans and trade and other receivables and the economic environment. At each reporting period, the historical observed default rates are updated and changes in forward-looking estimates are analysed. The assessment of historical observed default rates and forward-looking factors require significant judgement and estimates. The Group’s historical credit loss experience and forecast economic conditions may therefore not be representative of the actual default in the future. Refer to notes 12, 15, 17 and 29.
Inventory net realisable value allowancesThe Group evaluates its inventory to ensure that it is carried at the lower of cost and net realisable value. Allowances are made against slow moving, obsolete and damaged items. Damaged inventories are identified and written down through inventory verification processes. Allowance for slow moving and obsolete inventories are assessed continuously. Obsolescence is assessed based on a comparison of the level of inventory holding and the projected likely future sales, taking into account factors existing at the reporting date. Refer to note 16.
Measurement of deferred revenue in respect of customer loyalty programme and prepaid gift cardsReward credits (loyalty points) granted to customers participating in the Group’s Smart Shopper loyalty programme and prepaid gift cards provide rights to customers which are accounted for as separate performance obligations. The consideration allocated to unredeemed loyalty points and unredeemed gift cards are measured by reference to its stand-alone selling prices adjusted for an expected forfeiture rate. The Group applies statistical projection methods in its estimation of forfeiture rates by using customers’ historical redemption patterns as the main input, and is therefore subject to uncertainty. The expected forfeiture rate is updated regularly and the liabilities for unredeemed loyalty points and unredeemed gift cards are adjusted accordingly. Refer to note 25.
Estimates of useful lives and residual values of intangible assetsIntangible assets are amortised over their useful lives, taking into account applicable residual values. Useful lives and residual values are reviewed at each reporting date, taking into account factors such as the manner of recovery, innovation in technology and relevant market information.
Estimates of useful lives and residual values of property, plant and equipmentProperty, plant and equipment are depreciated over their useful lives, taking into account applicable residual values. Useful lives and residual values are reviewed at each reporting date, considering factors such as the manner of recovery and relevant market information.
Estimates of useful lives of right-of-use assetsRight-of-use assets are depreciated over their useful lives, and are directly linked to the lease term of the underlying lease agreement that has been accounted for in the measurement of the corresponding lease liabilities. Useful lives are reviewed at each reporting date, considering factors such as lease term extension and termination options.
Measurements of the recoverable amounts of cash-generating unitsThe recoverable amount of cash-generating units (CGU) containing goodwill is determined by calculating its value-in-use. The Group treats a store as a separate CGU for impairment testing of intangible assets, property, plant and equipment and right-of-use assets. The recoverable amount is sensitive to the discount rate used for the discounted cash flow model, future cash flows and the growth rate used for extrapolation purposes. The key assumptions used to determine the recoverable amount of CGUs are disclosed in note 9.
Classification of leasesJudgement is applied when assessing whether an arrangement should be treated as a lease. Where the Group acts as lessor, judgement is applied in determining whether the risks and rewards of the underlying asset have been transferred in order to classify leases as either finance leases or operating leases.
Estimates of lease terms of lease agreements Lease terms applicable to lease agreements, relating to the Group’s net investment in lease receivables and lease liabilities, are negotiated on an individual basis and contain a wide range of various terms and conditions. The Group determines the lease term as the non-cancellable term of the lease, together with any periods covered by an option to extend the lease if it is reasonably certain to be exercised, or any periods covered by an option to terminate the lease, if it is reasonably certain not to be exercised. Management exercises judgement in determining the reasonable certainty of exercising termination or extension options in determining the lease term, including considerations of the age of the lease, the nature of the leased asset and the expected return on the underlying cash generating unit to which the leased asset belongs.
Subsequent to the commencement date of lease agreements, lease terms are reassessed when there is a significant event or change in circumstances that is within the Group’s control and affects its ability to exercise or not to exercise the option to renew or to terminate. Significant events could include a change in the Group’s assessment of whether it is reasonably certain to exercise a renewal or termination option, the incurrences of unanticipated significant leasehold improvements or the negotiation of unanticipated lease incentives.
Estimates of incremental borrowing rates applied in the measurement of lease liabilitiesIncremental borrowing rates applied in the measurement of lease liabilities are specific to the country, term, currency and start date of the applicable lease agreement. Incremental borrowing rates are based on a series of inputs including the prime lending rate, the repo rate, a credit risk adjustment and a country-specific adjustment.
Foreign currency translations of equity-accounted investee in ZimbabweSignificant judgement was applied in the estimation and application of the Zimbabwe Dollar (ZWL$) to South Africa rand (ZAR) exchange rate.
During the prior period, Zimbabwe utilised an inter-bank foreign exchange market to establish formalised trading in ZWL$ with other currencies (referred to as the inter-bank exchange rate). Effective 1 June 2020, Zimbabwe suspended this market and implemented a formal market-based foreign exchange trading system to establish formalised trading in ZWL$ with other currencies (referred to as the auction rate). The intention of this auction rate system is expected to bring transparency and efficiency in the trading of foreign currency in the economy.
1. Significant accounting policies (continued)
1.6 Use of estimates, judgements and assumptions (continued)Foreign currency translations of equity-accounted investee in Zimbabwe (continued)In line with prior period assessments, management assessed that the closing auction exchange rate to the South African rand is not available for immediate settlement, as shortages of foreign currency results in the official exchange rate not being liquid, and was therefore not an appropriate rate to use when accounting for the Group’s investment in associate. An estimated exchange rate was used when translating the results of TM Supermarkets during the period under review. Inputs considered in this estimate include the official inflation rate and the in-country fuel price. During the prior period, in addition to the inputs considered in the current year, the premium at which Old Mutual and PPC Ltd. shares traded on the Zimbabwe Stock Exchange compared to trades on the Johannesburg Stock Exchange was also considered.
The share of associate’s income and net asset value of TM Supermarkets have been translated into the Group’s presentation currency at the closing rate in accordance with the hyperinflationary provisions of IAS 21. Refer to note 14.
Impairment reviews of investment in associateJudgement is required in determining whether indicators of impairment exist, which includes the liquidity and devaluation of Zimbabwean currency, currency shortages experienced in-country, rapid increases in Zimbabwe inflation rates and the liquidity restrictions imposed by the Reserve Bank of Zimbabwe which could prevent the Group from realising its investment. The recoverable amount of the Group’s equity-accounted investee in Zimbabwe is determined as the higher of fair value less costs of disposal and value in use. Estimates of the future cash flows are used in the value in use calculation and are sensitive to the discount rate used for the discounted cash flow model and the growth rate used for extrapolation purposes. Refer to note 14.
Income and deferred taxesThe Group is subject to income tax in numerous jurisdictions. Significant judgement is required in determining the provision for tax as there are many transactions and calculations for which the ultimate tax determination is uncertain during the ordinary course of business. The Group recognises liabilities for anticipated tax issues based on estimates of the taxes that are likely to become due.
The Group recognises the net future tax benefit related to deferred income tax assets to the extent that it is probable that the deductible temporary differences will reverse in the foreseeable future. Assessing the recoverability of deferred tax assets requires the Group to make significant estimates related to expectations of future taxable income. Estimates of future taxable income are based on forecast cash flows from operations and the application of existing tax laws in each jurisdiction. To the extent that future cash flows and taxable income differ significantly from estimates, the ability of the Group to realise the net deferred tax assets recorded at the end of the reporting period could be impacted. Refer to notes 6 and 13.
Measurements of post-retirement defined- benefit obligationsThe Group operates post-retirement defined-benefit schemes. Actuarial valuations are performed to assess the financial position of these various schemes and are based on assumptions such as the discount rate, future salary increases, future pension increases and future increases in healthcare costs. Refer to note 22.
Consolidation of the Group’s share trustThe Group operates an employee share option scheme through the Pick n Pay Employee Share Purchase Trust. According to management’s judgement, the Group controls the trust as it has exposure or rights to variable returns from its involvement with the investee and has the ability to affect returns from the trust through its power over the trust. The Group has therefore consolidated the trust into its results. Refer to notes 19 and 20.
Covid-19 PandemicThe Covid-19 pandemic has placed strain on global economies, has influenced customer trends and has influenced trading activities of the Group. During the period under review, various government-imposed restrictions on trade occurred during the lockdown period in order to curb the spread of the virus. At period end, uncertainty remains on the longevity of the virus and its impact on future trading activities. This uncertainty has been considered in the key assumptions, estimates and judgements made by management when assessing the carrying value of property, plant and equipment, intangible assets, right-of-use assets, retirement scheme assets, deferred tax assets, investment in associate, net investment in lease receivables, trade and other receivables, inventory, and lease liabilities.
1.7 Intangible assetsIntangible assets are held by the Group for the use in the supply of goods or administrative purposes and are expected to be used for more than one financial period. Intangible assets acquired are initially recognised at cost if it is probable that associated future economic benefits will flow to the Group and the cost can be measured reliably.
If intangible assets are acquired via a business combination, initial recognition is at fair value.
Intangible asset development consists of two phases; research phase and development phase. Expenditure incurred during the research phase is expensed as incurred.
Intangible assets that are developed are initially recognised at cost if the cost can be measured reliably, the intangible assets are technically and commercially feasible, future economic benefits are probable and the Group intends to, and has sufficient resources to, complete the development. If not, the development expenses are recognised in the statement of comprehensive income when they are incurred.
Intangible assets are subsequently measured at cost less accumulated amortisation and impairment losses, with the exception of goodwill. Goodwill is measured at cost less accumulated impairment losses as it has an indefinite useful life and is not amortised.
Internally generated intangible assets, excluding capitalised development costs, are not capitalised but are expensed in the statement of comprehensive income when they are incurred.
GROUP ANNUAL FINANCIAL STATEMENTS 02NOTES TO THE GROUP ANNUAL FINANCIAL STATEMENTS (continued)
Audited Annual Financial Statements 202139
www.picknpay.com38
1. Significant accounting policies (continued)
1.7 Intangible assets (continued)CostThe cost of intangible assets includes expenditure that is directly attributable to the acquisition of the intangible asset. The cost of developed intangible assets includes the cost of materials, direct labour and any overhead costs directly attributable to preparing the intangible asset for its intended use.
The Group recognises in the carrying amount of intangible assets, subsequent expenditure when that cost is incurred, if it is probable that the future economic benefits embodied with the cost will flow to the Group and the cost can be measured reliably. All other costs, such as costs associated with the implementation or maintenance of intangible assets, are recognised in the statement of comprehensive income as an expense when incurred.
Goodwill is acquired through business combinations and initially measured at the fair value of the consideration transferred, including the recognised amount of any non-controlling interest in the acquiree, less the net recognised amount (generally fair value) of the identifiable assets acquired and liabilities assumed, all measured as at the acquisition date.
After initial recognition, goodwill is measured at cost less any accumulated impairment losses. For the purpose of impairment testing, goodwill acquired in a business combination is, from the acquisition date, allocated to each of the Group’s cash-generating units that are expected to benefit from the combination, irrespective of whether other assets or liabilities of the acquiree are assigned to those units.
AmortisationAmortisation is calculated on the cost of an intangible asset, less its residual value, over its useful life. The residual value is the estimated amount that the Group would receive from the disposal of the intangible asset, after deducting the estimated costs of disposal, if the intangible asset was already of the age and the condition expected at the end of its useful life.
Management determines the amortisation methods, useful lives and residual values at acquisition. These are reviewed at each reporting date and adjusted if appropriate. Any adjustments are accounted for prospectively as a change in estimate.
Amortisation is recognised as an expense in the statement of comprehensive income, within operational expenses, on a straight-line basis over the estimated useful life of each intangible asset from the date that it is available for its intended use.
Useful livesThe estimated useful lives, per category of intangible assets, are as follows:
• Goodwill Indefinite • Systems development 7 years • Licences 5 to 10 years
ImpairmentIntangible assets are assessed for impairment as non-financial assets in accordance with note 1.14.
DerecognitionIntangible assets are derecognised upon disposal or when no future economic benefits are expected to flow to the Group from either their use or disposal. Gains or losses on derecognition of an intangible asset are determined by comparing the proceeds from disposal, if applicable, with the carrying amount of the intangible asset and are recognised directly in the statement of comprehensive income.
1.8 Property, plant and equipmentProperty, plant and equipment are tangible assets held by the Group for use in the supply of goods or for administrative purposes and are expected to be used for more than one financial period. Property, plant and equipment are initially recognised at cost if it is probable that associated future economic benefits will flow to the Group and the cost can be measured reliably. All property, plant and equipment are subsequently measured at cost less accumulated depreciation and impairment losses, with the exception of land. Land is measured at cost less impairment losses as it has an indefinite useful life and is not depreciated.
CostThe cost of property, plant and equipment includes expenditure that is directly attributable to the acquisition of the asset. The cost of self-constructed assets includes the cost of materials and direct labour, any other costs directly attributable to bringing the asset to a working condition for its intended use, and the costs of dismantling and removing the items and restoring the site on which they are located.
The Group recognises in the carrying amount of property, plant and equipment subsequent expenditure, including the cost of replacing part of such an item, when that cost is incurred, if it is probable that the future economic benefits embodied within the cost will flow to the Group and the cost of the item can be measured reliably. The carrying amount of the replaced part is derecognised. All other costs, such as day-to-day servicing costs, are recognised in the statement of comprehensive income as an expense when incurred.
DepreciationDepreciation is based on the cost of an asset, less its residual value, over its useful life. The residual value is the estimated amount that the Group would receive from the disposal of the asset, after deducting the estimated costs of disposal, if the asset was already of the age and the condition expected at the end of its useful life.
Management determines the depreciation methods, useful lives and residual values at acquisition. These are reviewed at each reporting date and adjusted, if appropriate. Any adjustments are accounted for prospectively as a change in estimate.
Depreciation is recognised as an expense in the statement of comprehensive income, within operational expenses, on a straight-line basis over the estimated useful lives of each part of an item of property, plant and equipment from the date that they are available for its intended use. Leasehold improvements are depreciated over the shorter of the lease term and their useful lives, unless it is reasonably certain that the Group will obtain ownership by the end of the lease term.
Where significant components of an item of property, plant and equipment have different useful lives, they are depreciated separately.
1. Significant accounting policies (continued)
1.8 Property, plant and equipment (continued)Useful livesThe estimated useful lives, per category of property, plant and equipment, are as follows:
Property
• Land Indefinite • Buildings and major components 10 to 40 years
Furniture, fittings, equipment and vehicles
• Furniture and fittings 5 to 14 years • Equipment 2 to 15 years • Vehicles 4 to 5 years
Leasehold improvements 3 to 8 years
Aircraft and major components 7 to 20 years
ImpairmentProperty, plant and equipment are assessed for impairment as non-financial assets in accordance with note 1.14.
DerecognitionProperty, plant and equipment are derecognised upon disposal or when no future economic benefits are expected to flow to the Group from either their use or disposal. Gains or losses on derecognition of an item of property, plant and equipment are determined by comparing the proceeds from disposal, if applicable, with the carrying amount of the item and are recognised directly in the statement of comprehensive income.
1.9 Right-of-use assetsThe Group enters into various lease agreements as the lessee of property, equipment and vehicles. Where leases convey the right to control the use of the underlying leased assets, the Group classifies these leases as right-of-use assets in a consistent manner to its property, plant and equipment. Right-of-use assets are initially recognised at cost at the date in which the Group gains control of the right to use the leased asset, referred to as the commencement date of lease agreements, and are subsequently measured at cost less accumulated depreciation and accumulated impairment losses.
CostThe cost of right-of-use assets include the initial measurement of the corresponding lease liabilities, any initial direct costs less any lease incentives received and less any dismantling or restoration costs expected to be incurred in order to restore the asset or the site on which it is located.
DepreciationDepreciation is based on the cost of the right-of-use asset over its useful life. At the commencement date of lease agreements, management determines useful lives as the lease term of corresponding lease liabilities. These lease terms are reviewed at each reporting date and adjusted, if appropriate. Any adjustments are accounted for prospectively as a change in estimate.
Depreciation is recognised as an expense in the statement of comprehensive income, within occupancy costs, on a straight-lined basis over the estimated useful lives of the right-of-use assets.
Useful livesThe estimated useful lives, per category of right-of-use assets, are as follows:
• Property 5 to 30 years • Equipment and vehicles 5 to 11 years
ImpairmentRight-of-use assets are assessed for impairment as non-financial assets in accordance with note 1.14.
DerecognitionRight-of-use assets are derecognised upon the loss of control by the Group of the right to use the leased assets. Gains or losses on derecognition are determined by comparing the value of corresponding lease liabilities, with the carrying amount of right-of-use assets and are recognised directly in the statement of comprehensive income.
1.10 Net investment in lease receivablesIn addition to its primary property lease portfolio, the Group holds head-leases over strategic franchise sites. These sites are sub-let to franchisees, with the franchisees holding the right to control the use of the leased assets. Where the Group does not retain the right to control the use of leased assets, due to the leased asset being subjected to a sub-lease, right-of-use assets are not recognised by the Group. The Group recognises the present value of future lease payments under head leases as lease liabilities (refer to note 1.17) and capitalises the present value of future lease receivables under sub-leases as net investment in lease receivables.
Initial measurementAt the date when the franchisee gains the right to control the use of leased assets, referred to as the commencement date of sub-lease agreements, the Group measures the net investment in lease receivable at the present value of the lease payments to be received over the lease term, discounted using the rate implicit in the sub-lease. If the rate implicit in the sub-lease cannot be readily determined, the Group applies the same rate applied in accounting for the corresponding lease liability.
The Group determines the lease term of the net investment in lease receivable as the non-cancellable period of the lease, and determines the incremental borrowing rate as the rate applicable to the corresponding head lease liability.
Subsequent measurementNet investment in lease receivables are subsequently measured at amortised cost using the effective interest method, reduced by future lease receipts net of interest earned.
ImpairmentNet investment in lease receivables are assessed for impairment as financial assets in accordance with note 1.14.
DerecognitionNet investment in lease receivables are derecognised when the Group regains the right to control the use of leased assets. Gains or losses on derecognition are determined by comparing the carrying value of corresponding lease liabilities with the carrying value of net investment in lease receivables, and are recognised directly in the statement of comprehensive income.
GROUP ANNUAL FINANCIAL STATEMENTS 02NOTES TO THE GROUP ANNUAL FINANCIAL STATEMENTS (continued)
Audited Annual Financial Statements 202141
www.picknpay.com40
1. Significant accounting policies (continued)
1.11 Operating lease assets Leases where the lessor retains the right to control the use of underlying leased assets are classified as operating leases. Operating leases include leases for kiosk space within retail owned sites provided to third parties.
Rentals receivable under operating leases are credited to the statement of comprehensive income on a straight-line basis over the term of the relevant lease. This results in the raising of an asset for future lease income on the statement of financial position. Operating lease assets are classified as non-current assets, with the exception of the portion with a maturity date of less than 12 months of the reporting date which are disclosed as current assets and are included under trade and other receivables. The asset reverses during the latter part of each lease term when the actual cash flow exceeds the straight-lined lease income included in the statement of comprehensive income.
1.12 InventoryInventory comprises merchandise for resale and consumables. Inventory is measured at the lower of cost and net realisable value, and is classified as a current asset as it is expected to be sold within the Group’s normal operating cycle.
Cost is calculated on the weighted-average basis and includes expenditure incurred in acquiring the inventory and bringing it to its existing location and condition, including distribution costs, and is stated net of relevant purchase rebates.
Net realisable value is the estimated selling price in the ordinary course of business, less the estimated costs of completion and selling expenses. Obsolete, redundant and slow-moving items are identified on a regular basis and are written down to their estimated net realisable values.
The carrying amount of inventories sold is recognised as an expense in the statement of comprehensive income.
1.13 Right-of-return assets and refund liabilitiesFor the sale of goods where customers are entitled to a right of return within a specified period of time, the Group recognises a right-of-return asset (and corresponding adjustment to cost of sales) which is representative of the Group’s right to recover the goods expected to be returned by customers.
The asset is measured at the carrying amount of inventory estimated to be returned using the expected value method, less any expected costs to recover the goods, including any potential decreases in the value of the returned goods. The Group updates the measurement of the asset recorded for any revisions to its estimated level of returns, as well as any additional decreases in the value of the returned products.
For goods that are expected to be returned, the Group recognises a refund liability for the customer’s right to a refund (and corresponding adjustment to turnover) which is measured at the amount the Group expects it will have to return to the customer. Refer to note 25.
1.14 Impairment of assetsThe determination of whether an asset is impaired requires management judgement. Among others, the following factors will be considered: estimated profit and cash forecasts, discount rates, duration and extent of the impairment, regional economic factors and geographical and sector performance.
Financial assetsThe Group recognises an allowance for expected credit losses (ECL’s) for all debt instruments not held at fair value through profit or loss. ECLs are based on the difference between the contractual cash flows due in accordance with the contract and all the cash flows that the Group expects to receive, discounted at an approximation of the original effective interest. The expected cash flows will include cash flows from the sale of collateral held or other credit enhancements that are integral to the contractual terms.
The Group applies a simplified approach for measuring impairment on trade receivables, net investment in lease receivables and operating lease assets at an amount equal to lifetime ECLs. To measure lifetime ECLs, trade receivables, net investment in lease receivables and operating lease assets are assessed on an individual basis. The ECL rates are based on historical credit loss experienced during the period, adjusted to reflect current and forward-looking information on macro-economic factors affecting the ability of the debtors to settle their receivables. The Group has identified CPI inflation and internal selling price inflation to be the most relevant factors and accordingly adjusts the historical loss rates based on expected changes in these factors.
The Group applies a general approach for measuring impairment on other receivables and loans, at an amount equal to expected credit losses, taking into account past experience and future macro-economic factors. The loss allowance is measured at an amount equal to the lifetime expected credit losses if the credit risk has increased significantly since initial recognition. If, at reporting date, the credit risk has not increased significantly since initial recognition, the loss allowance is measured at an amount equal to 12-month expected credit losses. The Group considers credit risk to have increased significantly since initial recognition, if there has been a significant change in the counterparties ability to meet its obligations. In addition, changes in the general economic or market conditions, changes in internal and external credit ratings and changes in the amount of financial support available to the counterparty are considered.
The Group considers a financial asset in default when contractual payments are one to two weeks past due. However, in certain cases, the Group may also consider a financial asset to be in default when internal or external information indicates that the Group is unlikely to receive outstanding contractual amounts in full before taking into account any credit enhancements held by the Group. A financial asset is written off when there is no reasonable expectation of recovering the contractual cash flows.
1. Significant accounting policies (continued)
1.14 Impairment of assets (continued)Non-financial assetsThe carrying amounts of non-financial assets (other than inventory, defined-benefit assets and deferred tax assets) are reviewed at each reporting date to determine whether there is any indication of impairment. If any such indication exists, the asset’s recoverable amount is estimated. For non-financial assets, such as goodwill, which have indefinite useful lives and are not subject to depreciation or amortisation, or that are not yet available for use, the recoverable amount is estimated at each reporting date.
The recoverable amount of an asset is the greater of its fair value less costs to sell and its value in use. In assessing value in use, the estimated future cash flows are discounted to their present value using a pre-tax discount rate that reflects current market assessments of the time value of money and the risks specific to that asset. For an asset that does not generate largely independent cash inflows, the recoverable amount is determined for the cash-generating units (CGUs) to which the asset belongs. A CGU is the smallest group of assets that generates cash inflows from continuing use that is largely independent of the cash inflows of other assets or groups of assets.
Goodwill acquired in a business combination is allocated to CGUs that are expected to benefit from the synergies of the combination and, for the purposes of impairment testing, are evaluated at the lowest level at which goodwill is monitored for internal reporting purposes. The units or group of units are not larger than the operating segments identified by the Group.
An impairment loss is recognised whenever the carrying amount of an asset or its CGU exceeds its recoverable amount. The carrying amount is impaired and the non-financial asset is written down to its recoverable amount with the related impairment loss recognised in the statement of comprehensive income. Impairment losses recognised in respect of CGUs are allocated first to reduce the carrying amount of any goodwill allocated to the CGUs (or groups of units) and then to reduce the carrying value of the other assets in the unit (or groups of units) on a pro rata basis.
An impairment loss for a non-financial asset is reversed if there has been a change in the estimates used to determine the recoverable amount. An impairment loss is reversed only to the extent that the asset’s carrying amount does not exceed the carrying amount that would have been determined, net of depreciation or amortisation, if no impairment loss had been recognised. Impairment losses in respect of goodwill are not reversed.
Impairment losses for non-financial assets recognised in prior periods are assessed at each reporting date for any indications that the loss has decreased or no longer exists.
1.15 Share capitalOrdinary shares are classified as equity. Incremental costs directly attributable to the issue of ordinary shares are recognised as a deduction from equity, net of any tax effects.
1.16 Treasury sharesOwn equity instruments held by Group entities are classified as treasury shares in the Group annual financial statements, is treated as a reduction of equity at its cost price and is disclosed as a separate component in the statement of changes in equity. No gain or loss is recognised in the statement of comprehensive income on the purchase, sale, issue or cancellation of the Group’s own equity instruments. Amounts received when treasury shares are sold or re-issued is recognised directly in equity, and the resulting surplus or deficit on the transaction is transferred to or from retained earnings.
Dividends received on treasury shares are eliminated on consolidation.
Treasury shares are treated as a deduction from the weighted average number of shares in issue.
1.17 Leases LiabilitiesThe Group enters into various lease agreements as the lessee of property, equipment and vehicles. Where lease agreements convey the right to control the use of underlying leased assets, the Group recognises the present value of future lease payments under the lease as lease liabilities.
Initial recognitionAt the date when the Group gains the right to control the use of underlying leased assets, referred to as the commencement date, the Group measures the lease liability at the present value of the lease payments to be made over the lease term, discounted at an applicable discount rate.
Lease terms are negotiated on an individual basis and contain a wide range of different terms and conditions. The Group determines the lease term as the non-cancellable term of the lease, together with any periods covered by an option to extend the lease if it is reasonably certain to be exercised, or any periods covered by an option to terminate the lease if it is reasonably certain not to be exercised. Judgement is applied in determining the likelihood of exercising extension or termination options in determining the lease period.
Lease payments included in the measurement of the lease liability are made up of fixed payments (including in substance fixed payments), variable payments based on an index or rate, amounts expected to be payable under a residual value guarantee and payments arising from options reasonably certain to be exercised or termination options reasonably certain not to be exercised. Variable lease payments are initially measured using the index or rate at the commencement date.
Lease payments are discounted using the interest rate implicit in the lease. If that rate cannot be readily determined, the Group’s incremental borrowing rate is used. The incremental borrowing rate is the rate that the Group would have to pay to borrow the funds necessary to obtain an asset of a similar value to the right-of-use asset in a similar economic environment with similar terms, security and conditions.
GROUP ANNUAL FINANCIAL STATEMENTS 02NOTES TO THE GROUP ANNUAL FINANCIAL STATEMENTS (continued)
Audited Annual Financial Statements 202143
www.picknpay.com42
1. Significant accounting policies (continued)
1.17 Leases Liabilities (continued)Initial recognition (continued)The discount rate used for the Group’s commercial vehicle fleet is the interest rate implicit in the lease agreement. All other lease payments are discounted using the Group’s incremental borrowing rate specific to the lease term, country, currency and commencement date of the lease. Incremental borrowing rates are based on a series of inputs including the prime rate, the repo rate, credit risk adjustments and country-specific adjustments.
The Group accounts for non-lease components together with the lease component to which it relates as a single lease component.
Subsequent measurementLease liabilities are subsequently measured at amortised cost using the effective interest method, reduced by future lease payments net of interest charged. Interest costs are recorded in the statement of comprehensive income.
The Group is exposed to potential future increases in variable lease payments based on an index or rate, which are not included in the lease liability until they take effect. When adjustments of lease payments based on an index or rate take effect, the lease liability is remeasured with a corresponding adjustment to the right-of-use asset. Further remeasurements occur when there is a change in future lease payments resulting from a rent review.
Lease terms are reassessed when there is a significant event or change in circumstance that is within the Group’s control and affects the Group’s ability to exercise or not to exercise the option to renew or to terminate. Significant events could include a change in the Group’s assessment of whether it is reasonably certain to exercise a renewal or termination option, the incurrences of unanticipated significant leasehold improvements or the negotiation of unanticipated lease incentives. Upon the occurrence of the significant event, lease liabilities are remeasured with a corresponding adjustment to corresponding right-of-use assets.
DerecognitionLease liabilities are derecognised upon the Group’s loss of control of the right to use leased assets. Gains or losses on derecognition are determined by comparing the carrying value of corresponding right-of-use assets with the carrying value of lease liabilities and are recognised directly in the statement of comprehensive income.
Variable lease payments Certain property leases contain variable payment terms linked to sales generated from retail owned and franchise stores, referred to as turnover rent expense. Turnover rent expense is recognised in the statement of comprehensive income within occupancy costs, in the period in which the event or condition that triggers the payment occurs.
Leasing of low-value assets and short-term leasesThe Group elected to use the recognition exemptions for lease contracts that, at the commencement date, have a lease term of 12 months or less and do not contain a purchase option (short-term leases), and lease contracts for which the underlying assets is of low value (low-value assets).
Payments associated with short-term leases and leases of low-value assets are recognised on a straight-line basis as an expense in profit or loss. Short-term leases are leases with a lease term of 12 months or less.
1.18 Financial instrumentsA financial instrument is any contract that gives rise to a financial asset of one entity and a financial liability or equity instrument of another entity.
Initial recognition and measurementThe classification of the Group’s financial instruments at initial recognition depends on the financial instrument’s contractual cash flow characteristics and the Group’s model for managing them. The Group manages its financial assets in order to generate cash flows, by determining whether cash flows will result from collecting cash flows, selling the financial asset, or both, and whether the contractual cash flows are solely payments of principal amounts and interest.
The Group classifies its financial instruments into the following categories: financial assets at amortised cost, financial instruments at fair value through profit or loss, financial liabilities at amortised cost and derivatives designated as hedging instruments.
Financial instruments are recognised on trade date when the Group becomes a party to the contractual provisions of the instrument and are initially recognised at fair value, plus transaction costs for financial instruments not measured at fair value through profit or loss.
Fair value is the price that would be received to sell an asset or paid to transfer a liability in an orderly transaction between market participants at the measurement date. The fair value of an asset or a liability is measured using the assumptions that market participants would use when pricing the asset or liability, assuming that market participants act in their economic best interest. Where there is no active market, the Group uses valuation techniques that are appropriate under the circumstances and for which sufficient data is available to measure fair value, maximising the use of relevant observable inputs and minimising the use of unobservable inputs.
All assets and liabilities for which fair value is measured or disclosed in the annual financial statements are categorised within the fair value hierarchy, described as follows, based on the lowest level input that is significant to the fair value measurement as a whole:
Level 1 – Quoted (unadjusted) market prices in active markets for identical assets or liabilities
Level 2 – Valuation techniques for which the lowest level input that is significant to the fair value measurement is directly or indirectly observable
Level 3 – Valuation techniques for which the lowest level input that is significant to the fair value measurement is unobservable
For the purpose of fair value disclosures, the Group has determined classes of assets and liabilities on the basis of the nature, characteristics and risks of the asset or liability and the level of the fair value hierarchy, as explained above.
DerecognitionFinancial assets (or where applicable, a part of a financial asset or a group of similar financial assets) are derecognised if the Group’s contractual rights to the cash flows from the financial assets expire or if the Group transfers the financial assets to another party without retaining control or substantially all risks and rewards of the asset.
Financial liabilities are derecognised if the Group’s obligations specified in the contract expire, are discharged or are cancelled. The resulting differences between the carrying values on derecognition of the financial instrument and the amount received or paid is recognised in the statement of comprehensive income.
1. Significant accounting policies (continued)
1.18 Financial instruments (continued)OffsettingFinancial assets and financial liabilities are offset, and the net amount reported in the statement of financial position, when the Group has a legally enforceable right to offset the recognised amounts, and intends either to settle on a net basis, or to realise the net assets and settle the liability simultaneously.
Subsequent measurementFinancial assets at amortised cost The Group measures financial assets at amortised cost if both the following conditions are met:
• The financial asset is held with the objective to hold the financial asset in order to collect contractual cash flows; and
• The contractual terms of the financial asset give rise to cash flows on specified dates that are solely payments of principal and interest on the principal amount outstanding.
Financial assets at amortised cost are subsequently measured using the effective interest method and are subject to impairment. Gains and losses are recognised in profit or loss when the asset is derecognised, modified or impaired.
The Group’s financial assets at amortised cost include net investment in lease receivables, trade and other receivables, cash and cash equivalents and loans. Net investment in lease receivables and trade and other receivables mainly comprise franchisee receivables. Certain net investment in lease receivables and trade and other receivables are considered to be long term in nature and are recorded as non-current in the statement of financial position. Loans mainly comprise housing and other employee loans.
Net investment in lease receivables, trade and other receivables and loansNet investment in lease receivables, trade and other receivables and loans are measured at amortised cost using the effective interest method, less impairment losses. The effective interest amortisation is included in finance income in the statement of comprehensive income.
Cash and cash equivalents and overnight borrowingsCash and cash equivalents and overnight borrowings are measured at amortised cost, using the effective interest method, less accumulated impairments. The effective interest amortisation is included in finance income or costs in the statement of comprehensive income. Cash and cash equivalents comprise cash on hand and amounts held on short-term deposit at financial institutions. Overnight borrowings include short-term borrowings repayable on demand. Overnight borrowings are repayable on demand, managed on a daily basis and are considered an integral part of the Group’s cash management.
For the purpose of the statement of cash flows, cash and cash equivalents consist of cash and short-term deposits net of outstanding overnight borrowings.
Financial instruments at fair value through profit or lossFinancial instruments are classified at fair value through profit or loss if they are held for trading or are designated as such upon initial recognition. Financial instruments at fair value through profit or loss are measured at fair value, and changes therein are recognised in the statement of comprehensive income.
Financial assets are classified and measured at amortised cost or fair value through OCI, if it gives rise to cash flows that are ‘solely payments of principal and interest (SPPI)’ on the principal amount outstanding. This assessment is referred to as the SPPI test and is performed at an instrument level. Financial assets with cash flows that are not SPPI are classified and measured at fair value through profit or loss, irrespective of the business model.
The Group’s investment in the insurance cell captive is measured at fair value through profit or loss as cash flows are not solely payments of principal and interest. In addition, the Group manages this investment and evaluates performance based on its fair value in accordance with the Group’s documented risk management or investment strategy. Any fair value gains or losses as a result of subsequent measurement are recognised in the statement of comprehensive income.
Financial liabilities at amortised costFinancial liabilities at amortised cost mainly comprise of lease liabilities, borrowings and trade and other payables.
Lease liabilitiesRefer to note 1.17 for further information.
BorrowingsBorrowings are measured at amortised cost using the effective interest method. The effective interest amortisation is included in finance costs in the statement of comprehensive income. The maturity date of each financial liability is dependent on the contractual terms of the related borrowing.
Trade and other payablesTrade and other payables are measured at amortised cost using the effective interest method. The effective interest amortisation is included in finance costs in the statement of comprehensive income. Trade and other payables mainly comprise trade payables for merchandise for resale and are all short term in nature.
Derivatives designated as hedging instrumentsThe Group holds derivative financial instruments, being forward exchange contracts (FECs) that are designated as hedging instruments, in order to mitigate the risks associated with the firm commitment of purchasing imported inventory, defined as the hedged item.
The relationship between the FECs and the underlying inventory is classified as a cash flow hedge, as the FECs are used to hedge the variability in cash flows attributable to the foreign currency risks of importing inventory.
The hedge is deemed to be highly effective as the terms of the FEC match the terms of the purchase of imported inventory. The effective portion of the change in fair value of the FECs are recognised in other comprehensive income and accumulated in the cash flow hedging reserve within equity. The accumulated amount in the reserve is released to the statement of comprehensive income when the underlying inventory is sold. Where a forecast transaction is no longer expected to occur, the cumulative unrealised gain or loss is recognised immediately in the statement of comprehensive income.
FECs are measured at fair value and are carried as derivative financial assets when the fair value is positive and as derivative financial liabilities when the fair value is negative.
GROUP ANNUAL FINANCIAL STATEMENTS 02NOTES TO THE GROUP ANNUAL FINANCIAL STATEMENTS (continued)
Audited Annual Financial Statements 202145
www.picknpay.com44
1. Significant accounting policies (continued)
1.19 RevenueRevenue is recognised when the Group satisfies performance obligations and transfers control of goods or services to its customers at an amount that reflects the consideration the Group expects to be entitled to in exchange for these goods or services, allocated to each specific performance obligation.
TurnoverRevenue from the sale of goods, or turnover, comprises sales to customers through its owned stores and the Group’s supply arrangements. All turnover is stated exclusive of value added tax.
Turnover is recognised at a point in time when the Group transfers control of goods to its customer at the point of sale and is measured at the consideration received or receivable, net of returns, trade discounts, loyalty discounts and volume rebates. Discounts, rebates or loyalty payments to customers are deducted from turnover, unless it is directly funded by suppliers. Payment of the transaction price in respect of the sale of goods is due immediately when the customer purchases goods and takes delivery.
Turnover recognised through deferred revenue transactions (Smart Shopper loyalty programme and prepaid gift cards) is not recognised at the time of the initial transaction, but is deferred and recognised as a contract liability (deferred revenue) when the consideration is received and recognised as turnover over time, as and when the Group’s obligations are fulfilled.
Smart Shopper loyalty programmeThe Group has a customer loyalty programme in South Africa, Smart Shopper, whereby customers are awarded with reward credits (loyalty points) which are effectively used as cash back against future purchases. Loyalty points granted to customers participating in the Smart Shopper loyalty programme provide rights to customers that is accounted for as separate performance obligations.
The consideration received under the Smart Shopper loyalty programme is allocated between the sale of goods supplied and the loyalty points granted. The consideration allocated to the loyalty points is measured by reference to their relative stand-alone selling price which is calculated as the amount for which the loyalty points could be separately sold, adjusted for an expected forfeiture rate. Such consideration is not recognised as turnover at the time of the sales transaction, but is recognised as a deferred revenue liability until the loyalty points have been redeemed or forfeited. The likelihood of redemption, based on management’s judgement of expected redemption rates, is reviewed on a regular basis and any adjustments to the deferred revenue liability is recognised in turnover. Refer to note 25.
Prepaid gift cardsGift cards represent a prepaid value card which effectively can be redeemed as cash consideration against future purchases. The consideration allocated to prepaid gift cards is measured at the fair value of the consideration received in advance, adjusted for an expected forfeiture rate. Such consideration is not recognised as turnover at the time of the initial transaction, but is recognised as a deferred revenue liability until the prepaid gift card has been redeemed or when the Group’s obligations have been fulfilled. The Group updates its estimates of forfeiture on a regular basis and any adjustments to the deferred revenue liability are recognised in turnover. Refer to note 25.
Franchise fee incomeIncome from franchisees, calculated as a percentage of the sale of goods by franchisees through their point of sale to their customers, in accordance with the substance of the relevant franchise agreement, is recognised at a point in time, as franchisee fee income, when the sale that gives rise to the income takes place.
Lease incomeIncome from operating leases in respect of property is recognised on a straight-line basis over the term of the lease.
Certain property sub-leases contain variable payment terms linked to sales generated from franchise stores, referred to as turnover rent income. Turnover rent income are recognised in the statement of comprehensive income in the period in which the event or condition that triggers the payment occurs.
Commissions and other incomeThe Group acts as a payment office for the services provided by a variety of third parties to the Group’s customers, such as bill payments, sale of electricity and travel tickets. The related agent’s commission received is recognised as income at a point in time, when the transaction that gives rise to the income takes place.
Commissions relating to the sale of third-party services are recognised over time, based on the stage of completion by reference to services performed to date as a percentage of total services to be performed. Commissions related to the sale of third-party products are recognised at a point in time, when the underlying third-party product is sold to the customer.
Other income is recognised as and when the Group satisfies its obligations in terms of the contract and includes income earned from the sale of Smart Shopper analytical data and the sale of advertising space through the Group’s various advertising mediums.
Finance incomeFinance income is recognised over time as it accrues in the statement of comprehensive income, using the effective interest method, by reference to the principal amounts outstanding and at the interest rate applicable.
Dividend incomeDividend income is recognised when the shareholders’ right to receive payment is established.
1.20 Finance costsFinance costs incurred are recognised as an expense in the statement of comprehensive income and are accrued on an effective interest basis by reference to the principal amounts outstanding and at the interest rate applicable.
1.21 TaxesIncome tax on the profit or loss for the period comprises current and deferred tax. Income tax is recognised in the statement of comprehensive income except to the extent that it relates to items recognised in other comprehensive income or directly in equity, in which case it is recognised in other comprehensive income or directly in equity.
Current taxCurrent tax comprises tax payable calculated on the basis of the expected taxable income for the period using tax rates enacted or substantively enacted at the reporting date and any adjustment of tax payable for previous periods.
1. Significant accounting policies (continued)
1.21 Taxes (continued)Deferred taxDeferred tax is recognised for temporary differences between the carrying amounts of assets and liabilities for financial reporting purposes and the tax base of the assets and liabilities at the reporting date.
Deferred tax is not recognised for the following temporary differences: the initial recognition of goodwill; the initial recognition of assets or liabilities in a transaction that is not a business combination and that affects neither accounting nor taxable profit; and investments in subsidiaries, to the extent that the holding company has the ability to control the reversal of the temporary difference and it is probable that the temporary difference will not reverse in the foreseeable future.
The amount of deferred tax provided is based on the expected manner of realisation or settlement of the carrying amount of assets and liabilities using tax rates enacted or substantively enacted at the reporting date.
Deferred tax is recognised in the statement of comprehensive income, except to the extent that it relates to a transaction that is recognised directly in equity or other comprehensive income, or a business combination. The effect on deferred tax of any changes in tax rates is recognised in the statement of comprehensive income, except to the extent that it relates to items previously recognised in other comprehensive income or directly to equity, in which case it is recognised in other comprehensive income or directly in equity.
Deferred tax assets and liabilities are offset if there is a legally enforceable right to offset current tax liabilities and assets, and they relate to income taxes levied by the same tax authority on the same taxable entity, or on different tax entities but they intend to settle current tax liabilities and assets on a net basis or their tax assets and liabilities will be realised simultaneously.
A deferred tax asset is recognised to the extent that it is probable that future taxable profits will be available against which the associated unused tax losses and deductible temporary differences can be utilised. Deferred tax assets are reviewed at each reporting date and are reduced to the extent that it is no longer probable that the related tax benefit will be realised.
Dividends withholding taxDividends withholding tax is a tax levied on shareholders and is applicable on dividends declared. The Company withholds dividends tax on behalf of their shareholders at a rate of 20% on dividends declared for shareholders that are not exempt from this tax.
1.22 Employee benefitsShort-term employee benefitsThe cost of all short-term employee benefits is recognised as an expense during the period in which the employee renders the related service.
Accruals for employee entitlements to wages, salaries, bonuses and annual leave represent the amount which the Group has a present obligation to pay as a result of employees’ services provided up to the reporting date. These accruals have been calculated at undiscounted amounts based on current wage and salary rates.
Share-based payment transactionsThe share ownership programme enables Group employees to acquire shares in Pick n Pay Stores Limited (PIK), thereby treating them as equity-settled share-based payment transactions in the Group.
The fair value of awards granted is recognised as an employee cost expense in the statement of comprehensive income with a corresponding increase in equity for these equity-settled share-based transactions. The fair value is measured at grant date and the cost of the awards granted is spread over the period during which the employees become unconditionally entitled to the awards (the vesting period).
The fair value of the awards granted is measured using an actuarial binomial option pricing model, taking into account the terms and conditions upon which the awards are granted. Service and non-market performance conditions are not taken into account when determining the grant date fair value of awards, but the likelihood of the conditions being met is assessed as part of the Group’s best estimate of the number of equity instruments that will ultimately vest. Market performance conditions are reflected within the grant date fair value. Any other conditions attached to an award, but without an associated service requirement, are considered to be non-vesting conditions. Non-vesting conditions are reflected in the fair value of an award and lead to an immediate expensing of an award, unless there are also service and/or performance conditions.
No cumulative expense is recognised for awards that do not ultimately vest because non-market performance and/or service conditions have not been met. Where awards include a market or non-vesting condition, the transactions are treated as vested, irrespective of whether the market or non-vesting condition is satisfied, provided that all other performance and/or service conditions are satisfied.
Retirement benefitsThe Group operates several retirement schemes comprising defined-contribution funds (one of which has a defined-benefit element), the assets of which are held in trustee-administered funds.
Defined-contribution plansA defined-contribution plan is a post-employment benefit plan under which the Group pays fixed contributions into a separate legal entity and will have no legal or constructive obligation to pay further amounts.
Obligations for contributions to defined-contribution retirement plans are recognised as an expense in the statement of comprehensive income when they are due.
Where the Group is responsible for providing retirement benefits to employees with a retirement scheme outside the Group, contributions are made on behalf of the employee and the cost is accounted for in the period when the services have been rendered.
Contributions to a defined-contribution plan that are made more than 12 months after the end of the period in which the employees render the services are discounted to their present value.
Defined-benefit plansA defined-benefit plan is a post-employment benefit plan other than a defined-contribution plan.
The Group’s net obligation in respect of the defined-benefit plans is calculated separately by estimating the amount of future benefit that qualifying employees have earned in the current and prior periods, discounting that amount and deducting the fair value of any plan assets.
GROUP ANNUAL FINANCIAL STATEMENTS 02NOTES TO THE GROUP ANNUAL FINANCIAL STATEMENTS (continued)
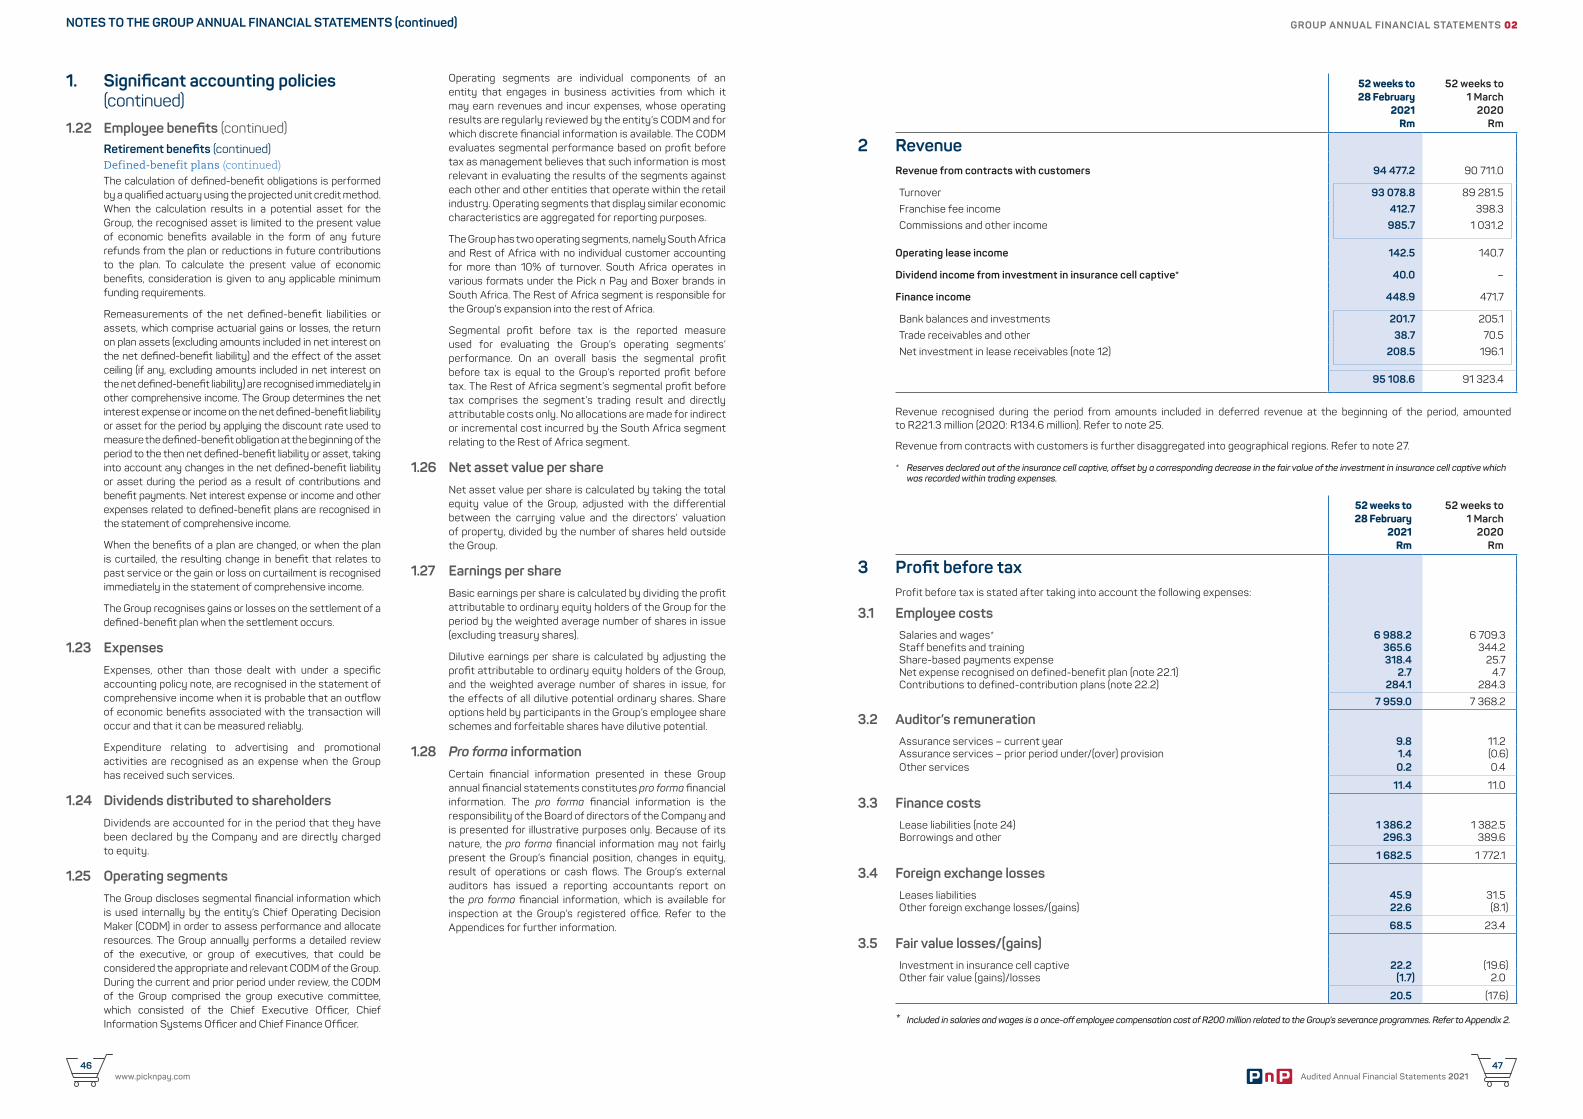
Audited Annual Financial Statements 202147
www.picknpay.com46
1. Significant accounting policies (continued)
1.22 Employee benefits (continued)Retirement benefits (continued)Defined-benefit plans (continued)The calculation of defined-benefit obligations is performed by a qualified actuary using the projected unit credit method. When the calculation results in a potential asset for the Group, the recognised asset is limited to the present value of economic benefits available in the form of any future refunds from the plan or reductions in future contributions to the plan. To calculate the present value of economic benefits, consideration is given to any applicable minimum funding requirements.
Remeasurements of the net defined-benefit liabilities or assets, which comprise actuarial gains or losses, the return on plan assets (excluding amounts included in net interest on the net defined-benefit liability) and the effect of the asset ceiling (if any, excluding amounts included in net interest on the net defined-benefit liability) are recognised immediately in other comprehensive income. The Group determines the net interest expense or income on the net defined-benefit liability or asset for the period by applying the discount rate used to measure the defined-benefit obligation at the beginning of the period to the then net defined-benefit liability or asset, taking into account any changes in the net defined-benefit liability or asset during the period as a result of contributions and benefit payments. Net interest expense or income and other expenses related to defined-benefit plans are recognised in the statement of comprehensive income.
When the benefits of a plan are changed, or when the plan is curtailed, the resulting change in benefit that relates to past service or the gain or loss on curtailment is recognised immediately in the statement of comprehensive income.
The Group recognises gains or losses on the settlement of a defined-benefit plan when the settlement occurs.
1.23 ExpensesExpenses, other than those dealt with under a specific accounting policy note, are recognised in the statement of comprehensive income when it is probable that an outflow of economic benefits associated with the transaction will occur and that it can be measured reliably.
Expenditure relating to advertising and promotional activities are recognised as an expense when the Group has received such services.
1.24 Dividends distributed to shareholdersDividends are accounted for in the period that they have been declared by the Company and are directly charged to equity.
1.25 Operating segmentsThe Group discloses segmental financial information which is used internally by the entity’s Chief Operating Decision Maker (CODM) in order to assess performance and allocate resources. The Group annually performs a detailed review of the executive, or group of executives, that could be considered the appropriate and relevant CODM of the Group. During the current and prior period under review, the CODM of the Group comprised the group executive committee, which consisted of the Chief Executive Officer, Chief Information Systems Officer and Chief Finance Officer.
Operating segments are individual components of an entity that engages in business activities from which it may earn revenues and incur expenses, whose operating results are regularly reviewed by the entity’s CODM and for which discrete financial information is available. The CODM evaluates segmental performance based on profit before tax as management believes that such information is most relevant in evaluating the results of the segments against each other and other entities that operate within the retail industry. Operating segments that display similar economic characteristics are aggregated for reporting purposes.
The Group has two operating segments, namely South Africa and Rest of Africa with no individual customer accounting for more than 10% of turnover. South Africa operates in various formats under the Pick n Pay and Boxer brands in South Africa. The Rest of Africa segment is responsible for the Group’s expansion into the rest of Africa.
Segmental profit before tax is the reported measure used for evaluating the Group’s operating segments’ performance. On an overall basis the segmental profit before tax is equal to the Group’s reported profit before tax. The Rest of Africa segment’s segmental profit before tax comprises the segment’s trading result and directly attributable costs only. No allocations are made for indirect or incremental cost incurred by the South Africa segment relating to the Rest of Africa segment.
1.26 Net asset value per shareNet asset value per share is calculated by taking the total equity value of the Group, adjusted with the differential between the carrying value and the directors’ valuation of property, divided by the number of shares held outside the Group.
1.27 Earnings per shareBasic earnings per share is calculated by dividing the profit attributable to ordinary equity holders of the Group for the period by the weighted average number of shares in issue (excluding treasury shares).
Dilutive earnings per share is calculated by adjusting the profit attributable to ordinary equity holders of the Group, and the weighted average number of shares in issue, for the effects of all dilutive potential ordinary shares. Share options held by participants in the Group’s employee share schemes and forfeitable shares have dilutive potential.
1.28 Pro forma informationCertain financial information presented in these Group annual financial statements constitutes pro forma financial information. The pro forma financial information is the responsibility of the Board of directors of the Company and is presented for illustrative purposes only. Because of its nature, the pro forma financial information may not fairly present the Group’s financial position, changes in equity, result of operations or cash flows. The Group’s external auditors has issued a reporting accountants report on the pro forma financial information, which is available for inspection at the Group’s registered office. Refer to the Appendices for further information.
GROUP ANNUAL FINANCIAL STATEMENTS 02
52 weeks to 28 February
2021Rm
52 weeks to 1 March
2020Rm
2 RevenueRevenue from contracts with customers 94 477.2 90 711.0
Turnover 93 078.8 89 281.5
Franchise fee income 412.7 398.3
Commissions and other income 985.7 1 031.2
Operating lease income 142.5 140.7
Dividend income from investment in insurance cell captive* 40.0 –
Finance income 448.9 471.7
Bank balances and investments 201.7 205.1
Trade receivables and other 38.7 70.5
Net investment in lease receivables (note 12) 208.5 196.1
95 108.6 91 323.4
Revenue recognised during the period from amounts included in deferred revenue at the beginning of the period, amounted to R221.3 million (2020: R134.6 million). Refer to note 25.
Revenue from contracts with customers is further disaggregated into geographical regions. Refer to note 27.
* Reserves declared out of the insurance cell captive, offset by a corresponding decrease in the fair value of the investment in insurance cell captive which was recorded within trading expenses.
52 weeks to 28 February
2021Rm
52 weeks to 1 March
2020Rm
3 Profit before taxProfit before tax is stated after taking into account the following expenses:
3.1 Employee costs Salaries and wages* 6 988.2 6 709.3 Staff benefits and training 365.6 344.2 Share-based payments expense 318.4 25.7 Net expense recognised on defined-benefit plan (note 22.1) 2.7 4.7 Contributions to defined-contribution plans (note 22.2) 284.1 284.3
7 959.0 7 368.2
3.2 Auditor’s remunerationAssurance services – current year 9.8 11.2 Assurance services – prior period under/(over) provision 1.4 (0.6) Other services 0.2 0.4
11.4 11.0
3.3 Finance costsLease liabilities (note 24) 1 386.2 1 382.5 Borrowings and other 296.3 389.6
1 682.5 1 772.1
3.4 Foreign exchange lossesLeases liabilities 45.9 31.5 Other foreign exchange losses/(gains) 22.6 (8.1)
68.5 23.4
3.5 Fair value losses/(gains)Investment in insurance cell captive 22.2 (19.6) Other fair value (gains)/losses (1.7) 2.0
20.5 (17.6)
* Included in salaries and wages is a once-off employee compensation cost of R200 million related to the Group’s severance programmes. Refer to Appendix 2.
NOTES TO THE GROUP ANNUAL FINANCIAL STATEMENTS (continued)
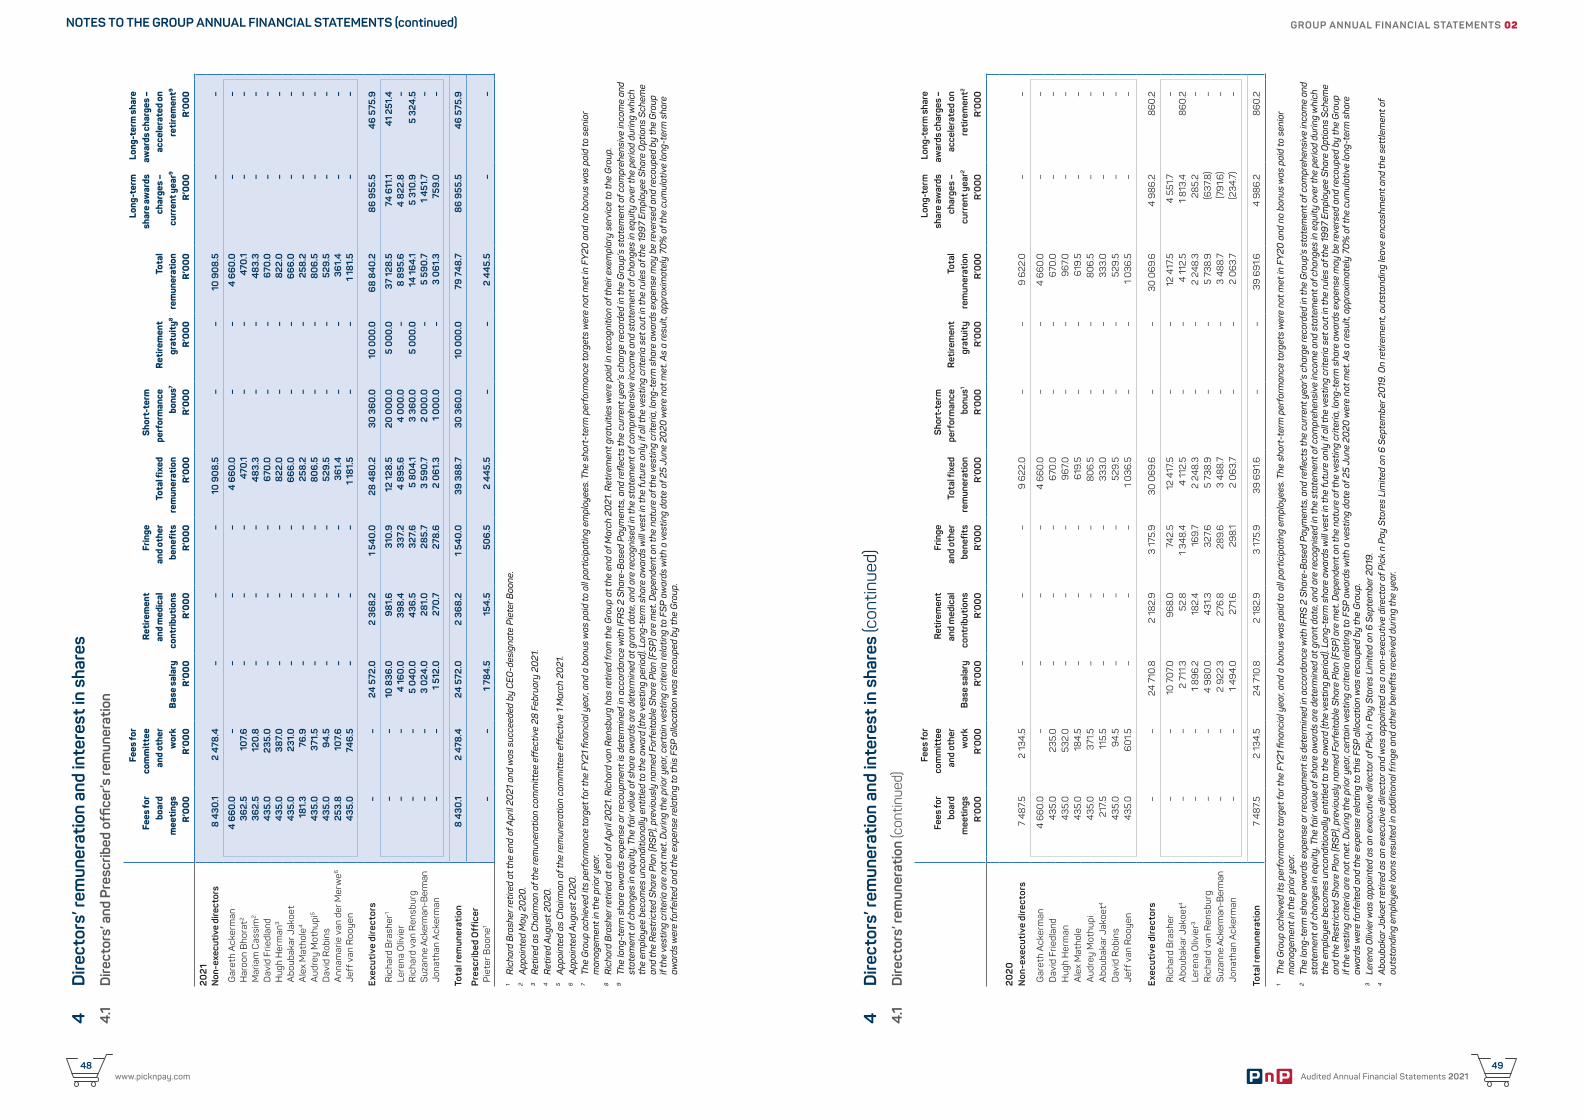
Audited Annual Financial Statements 202149
www.picknpay.com48
4D
irect
ors’
rem
uner
atio
n an
d in
tere
st in
sha
res
4.1
Dire
ctor
s’ a
nd P
resc
ribed
offi
cer’s
rem
uner
atio
n
Fees
for
boar
dm
eeti
ngs
R’0
00
Fees
for
com
mit
tee
and
othe
rw
ork
R’0
00
Bas
e sa
lary
R
’00
0
Ret
irem
ent
and
med
ical
cont
ribut
ions
R’0
00
Frin
gean
d ot
her
bene
fits
R’0
00
Tota
l fix
edre
mun
erat
ion
R’0
00
Sho
rt-t
erm
perf
orm
ance
bonu
s7
R’0
00
Ret
irem
ent
grat
uity
8
R’0
00
Tota
lre
mun
erat
ion
R’0
00
Long
-ter
msh
are
awar
dsch
arge
s –
curr
ent y
ear9
R’0
00
Long
-ter
m s
hare
awar
ds c
harg
es –
acc
eler
ated
on
reti
rem
ent9
R’0
00
20
21
Non
-exe
cuti
ve d
irect
ors
8 4
30.1
2 4
78.4
–
–
–
1
0 9
08
.5
–
–
10
90
8.5
–
–
Gar
eth
Ack
erm
an 4
66
0.0
–
–
–
–
4
66
0.0
–
–
4
66
0.0
–
–
H
aroo
n B
hora
t2 3
62.
5 1
07.
6
–
–
–
470
.1 –
–
4
70.1
–
–
Mar
iam
Cas
sim
2 3
62.
5 1
20.8
–
–
–
4
83.
3 –
–
4
83.
3 –
–
D
avid
Frie
dlan
d 4
35.0
2
35.0
–
–
–
6
70.0
–
–
6
70.0
–
–
H
ugh
Her
man
3 4
35.0
3
87.
0
–
–
–
822
.0
–
–
822
.0
–
–
Abo
ubak
ar J
akoe
t 4
35.0
2
31.0
–
–
–
6
66
.0
–
–
66
6.0
–
–
A
lex
Mat
hole
4 1
81.
3 7
6.9
–
–
–
2
58.2
–
–
2
58.2
–
–
A
udre
y M
othu
pi5
435
.0
371
.5
–
–
–
80
6.5
–
–
8
06
.5
–
–
Dav
id R
obin
s 4
35.0
9
4.5
–
–
–
5
29.5
–
–
5
29.5
–
–
A
nnam
arie
van
der
Mer
we6
253
.8
10
7.6
–
–
–
3
61.
4
–
–
36
1.4
–
–
Je
ff v
an R
ooye
n 4
35.0
7
46
.5
–
–
–
1 1
81.
5 –
–
1
18
1.5
–
–
Exe
cuti
ve d
irec
tors
–
–
24
572
.0
2 3
68
.2
1 5
40
.0
28
48
0.2
3
0 3
60
.0
10
00
0.0
6
8 8
40
.2 8
6 9
55.5
4
6 5
75.9
Ric
hard
Bra
sher
1 –
–
1
0 8
36.0
9
81.
6
310
.9
12
128
.5
20
00
0.0
5
00
0.0
37
128
.5 7
4 6
11.1
41
251.
4
Lere
na O
livie
r –
–
4
16
0.0
3
98
.4
337
.2
4 8
95.
6
4 0
00
.0
–
8 8
95.
6 4
822
.8
–
Ric
hard
van
Ren
sbur
g –
–
5
04
0.0
4
36.5
3
27.6
5
80
4.1
3 3
60
.0
5 0
00
.0
14 1
64
.1 5
310
.9
5 3
24.5
S
uzan
ne A
cker
man
-Ber
man
–
–
3 0
24.0
2
81.
0
28
5.7
3 5
90
.7
2 0
00
.0
–
5 59
0.7
1 4
51.7
–
Jo
nath
an A
cker
man
–
–
1 5
12.0
2
70.7
2
78.6
2
06
1.3
1 0
00
.0
–
3 0
61.
3 7
59.0
–
Tota
l rem
uner
atio
n 8
430
.1 2
478
.4
24
572
.0
2 3
68
.2
1 5
40
.0
39
38
8.7
3
0 3
60
.0
10
00
0.0
79
74
8.7
86
955
.5
46
575
.9
Pre
scri
bed
Off
icer
Pie
ter B
oone
1 –
–
1
78
4.5
1
54.5
5
06
.5
2 4
45.
5 –
–
2
44
5.5
–
–
1 R
icha
rd B
rash
er re
tired
at t
he e
nd o
f Apr
il 20
21 a
nd w
as s
ucce
eded
by
CEO
-des
igna
te P
iete
r Boo
ne.
2 A
ppoi
nted
May
20
20.
3 R
etire
d as
Cha
irman
of t
he re
mun
erat
ion
com
mitt
ee e
ffec
tive
28 F
ebru
ary
2021
.4
Ret
ired
Aug
ust 2
020
.5
App
oint
ed a
s C
hairm
an o
f the
rem
uner
atio
n co
mm
ittee
eff
ectiv
e 1
Mar
ch 2
021
.6
App
oint
ed A
ugus
t 20
20.
7 Th
e G
roup
ach
ieve
d its
per
form
ance
targ
et fo
r the
FY
21 fi
nanc
ial y
ear,
and
a bo
nus
was
pai
d to
all
part
icip
atin
g em
ploy
ees.
The
sho
rt-t
erm
per
form
ance
targ
ets
wer
e no
t met
in F
Y20
and
no
bonu
s w
as p
aid
to s
enio
r m
anag
emen
t in
the
prio
r yea
r.8
Ric
hard
Bra
sher
retir
ed a
t end
of A
pril
2021
. Ric
hard
van
Ren
sbur
g ha
s re
tired
from
the
Gro
up a
t the
end
of M
arch
20
21. R
etire
men
t gra
tuiti
es w
ere
paid
in re
cogn
ition
of t
heir
exem
plar
y se
rvic
e to
the
Gro
up.
9
The
long
-ter
m s
hare
aw
ards
exp
ense
or r
ecou
pmen
t is
dete
rmin
ed in
acc
orda
nce
with
IFR
S 2
Sha
re-B
ased
Pay
men
ts, a
nd re
flect
s th
e cu
rren
t yea
r’s c
harg
e re
cord
ed in
the
Gro
up’s
sta
tem
ent o
f com
preh
ensi
ve in
com
e an
d st
atem
ent o
f cha
nges
in e
quity
. The
fair
valu
e of
sha
re a
war
ds a
re d
eter
min
ed a
t gra
nt d
ate,
and
are
reco
gnis
ed in
the
stat
emen
t of c
ompr
ehen
sive
inco
me
and
stat
emen
t of c
hang
es in
equ
ity o
ver t
he p
erio
d du
ring
whi
ch
the
empl
oyee
bec
omes
unc
ondi
tiona
lly e
ntitl
ed to
the
awar
d (t
he v
estin
g pe
riod)
. Lon
g-te
rm s
hare
aw
ards
will
ves
t in
the
futu
re o
nly
if al
l the
ves
ting
crite
ria s
et o
ut in
the
rule
s of
the
199
7 Em
ploy
ee S
hare
Opt
ions
Sch
eme
and
the
Res
tric
ted
Sha
re P
lan
(RS
P), p
revi
ousl
y na
med
For
feita
ble
Sha
re P
lan
(FS
P) a
re m
et. D
epen
dent
on
the
natu
re o
f the
ves
ting
crite
ria, l
ong-
term
sha
re a
war
ds e
xpen
se m
ay b
e re
vers
ed a
nd re
coup
ed b
y th
e G
roup
if
the
vest
ing
crite
ria a
re n
ot m
et. D
urin
g th
e pr
ior y
ear,
cert
ain
vest
ing
crite
ria re
latin
g to
FS
P aw
ards
with
a v
estin
g da
te o
f 25
June
20
20 w
ere
not m
et. A
s a
resu
lt, a
ppro
xim
atel
y 70
% o
f the
cum
ulat
ive
long
-ter
m s
hare
aw
ards
wer
e fo
rfei
ted
and
the
expe
nse
rela
ting
to th
is F
SP
allo
catio
n w
as re
coup
ed b
y th
e G
roup
.
GROUP ANNUAL FINANCIAL STATEMENTS 02
4D
irect
ors’
rem
uner
atio
n an
d in
tere
st in
sha
res
(con
tinue
d)4.
1D
irect
ors’
rem
uner
atio
n (c
ontin
ued)
Fees
for
boar
dm
eeti
ngs
R’0
00
Fees
for
com
mit
tee
and
othe
rw
ork
R’0
00
Bas
e sa
lary
R
’00
0
Ret
irem
ent
and
med
ical
cont
ribut
ions
R’0
00
Frin
gean
d ot
her
bene
fits
R’0
00
Tota
l fix
edre
mun
erat
ion
R’0
00
Sho
rt-t
erm
perf
orm
ance
bonu
s1
R’0
00
Ret
irem
ent
grat
uity
R’0
00
Tota
lre
mun
erat
ion
R’0
00
Long
-ter
msh
are
awar
dsch
arge
s –
curr
ent y
ear2
R’0
00
Long
-ter
m s
hare
awar
ds c
harg
es –
acc
eler
ated
on
reti
rem
ent2
R’0
00
20
20
Non
-exe
cuti
ve d
irec
tors
7 4
87.
5 2
134
.5
––
– 9
622
.0
––
9 6
22.0
–
–
Gar
eth
Ack
erm
an 4
66
0.0
–
––
– 4
66
0.0
–
– 4
66
0.0
–
–
D
avid
Frie
dlan
d 4
35.0
2
35.0
–
––
670
.0
––
670
.0
–
–
Hug
h H
erm
an 4
35.0
5
32.0
–
––
96
7.0
–
– 9
67.
0
–
–
Ale
x M
atho
le 4
35.0
1
84.
5 –
––
619
.5
––
619
.5
–
–
Aud
rey
Mot
hupi
435
.0
371
.5
––
– 8
06
.5
––
80
6.5
–
–
A
boub
akar
Jak
oet4
217
.5
115
.5
––
– 3
33.0
–
– 3
33.0
–
–
D
avid
Rob
ins
435
.0
94.
5 –
––
529
.5
––
529
.5
–
–
Jeff
van
Roo
yen
435
.0
60
1.5
––
– 1
036
.5
––
1 0
36.5
–
–
Exe
cuti
ve d
irec
tors
––
24
710
.8
2 1
82.
9
3 1
75.9
3
0 0
69.
6
––
30
06
9.6
4
98
6.2
8
60
.2
Ric
hard
Bra
sher
––
10
70
7.0
9
68
.0
74
2.5
12
417.
5 –
– 1
2 41
7.5
4 5
51.7
–
A
boub
akar
Jak
oet4
––
2 7
11.3
5
2.8
1
34
8.4
4
112
.5
––
4 1
12.5
1
813
.4
86
0.2
Le
rena
Oliv
ier3
––
1 8
96
.2
18
2.4
1
69.
7 2
24
8.3
–
– 2
24
8.3
2
85.
2 –
R
icha
rd v
an R
ensb
urg
––
4 9
80
.0
431
.3
327
.6
5 7
38.9
–
– 5
738
.9
(637
.8)
–
Suz
anne
Ack
erm
an-B
erm
an–
– 2
922
.3
276
.8
28
9.6
3
48
8.7
–
– 3
48
8.7
(7
91.
6) –
Jo
nath
an A
cker
man
––
1 4
94.
0
271
.6
29
8.1
2 0
63.
7 –
– 2
06
3.7
(234
.7)
–
Tota
l rem
uner
atio
n 7
48
7.5
2 1
34.5
2
4 7
10.8
2
18
2.9
3
175
.9
39
69
1.6
–
– 3
9 6
91.
6
4 9
86
.2
86
0.2
1 Th
e G
roup
ach
ieve
d its
per
form
ance
targ
et fo
r the
FY
21 fi
nanc
ial y
ear,
and
a bo
nus
was
pai
d to
all
part
icip
atin
g em
ploy
ees.
The
sho
rt-t
erm
per
form
ance
targ
ets
wer
e no
t met
in F
Y20
and
no
bonu
s w
as p
aid
to s
enio
r m
anag
emen
t in
the
prio
r yea
r.2
The
long
-ter
m s
hare
aw
ards
exp
ense
or r
ecou
pmen
t is
dete
rmin
ed in
acc
orda
nce
with
IFR
S 2
Sha
re-B
ased
Pay
men
ts, a
nd re
flect
s th
e cu
rren
t yea
r’s c
harg
e re
cord
ed in
the
Gro
up’s
sta
tem
ent o
f com
preh
ensi
ve in
com
e an
d st
atem
ent o
f cha
nges
in e
quity
. The
fair
valu
e of
sha
re a
war
ds a
re d
eter
min
ed a
t gra
nt d
ate,
and
are
reco
gnis
ed in
the
stat
emen
t of c
ompr
ehen
sive
inco
me
and
stat
emen
t of c
hang
es in
equ
ity o
ver t
he p
erio
d du
ring
whi
ch
the
empl
oyee
bec
omes
unc
ondi
tiona
lly e
ntitl
ed to
the
awar
d (t
he v
estin
g pe
riod)
. Lon
g-te
rm s
hare
aw
ards
will
ves
t in
the
futu
re o
nly
if al
l the
ves
ting
crite
ria s
et o
ut in
the
rule
s of
the
199
7 Em
ploy
ee S
hare
Opt
ions
Sch
eme
and
the
Res
tric
ted
Sha
re P
lan
(RS
P), p
revi
ousl
y na
med
For
feita
ble
Sha
re P
lan
(FS
P) a
re m
et. D
epen
dent
on
the
natu
re o
f the
ves
ting
crite
ria, l
ong-
term
sha
re a
war
ds e
xpen
se m
ay b
e re
vers
ed a
nd re
coup
ed b
y th
e G
roup
if
the
vest
ing
crite
ria a
re n
ot m
et. D
urin
g th
e pr
ior y
ear,
cert
ain
vest
ing
crite
ria re
latin
g to
FS
P aw
ards
with
a v
estin
g da
te o
f 25
June
20
20 w
ere
not m
et. A
s a
resu
lt, a
ppro
xim
atel
y 70
% o
f the
cum
ulat
ive
long
-ter
m s
hare
aw
ards
wer
e fo
rfei
ted
and
the
expe
nse
rela
ting
to th
is F
SP
allo
catio
n w
as re
coup
ed b
y th
e G
roup
.3
Lere
na O
livie
r was
app
oint
ed a
s an
exe
cutiv
e di
rect
or o
f Pic
k n
Pay
Sto
res
Lim
ited
on 6
Sep
tem
ber 2
019
.4
Abo
ubak
ar J
akoe
t ret
ired
as a
n ex
ecut
ive
dire
ctor
and
was
app
oint
ed a
s a
non-
exec
utiv
e di
rect
or o
f Pic
k n
Pay
Sto
res
Lim
ited
on 6
Sep
tem
ber 2
019
. On
retir
emen
t, ou
tsta
ndin
g le
ave
enca
shm
ent a
nd th
e se
ttle
men
t of
outs
tand
ing
empl
oyee
loan
s re
sulte
d in
add
ition
al fr
inge
and
oth
er b
enefi
ts re
ceiv
ed d
urin
g th
e ye
ar.
NOTES TO THE GROUP ANNUAL FINANCIAL STATEMENTS (continued)

Audited Annual Financial Statements 202151
www.picknpay.com50
4 Directors’ remuneration and interest in shares (continued)4.2 Directors’ interest in ordinary shares
2021 Howheld1
Balanceheld at
1 March2020
Additions/grants Disposals Forfeits5
Balanceheld at
28 February20218
Beneficial/non-
beneficialinterest2
Gareth Ackerman direct 309 – – – 309 Beneficialindirect 1 704 200 8 906 – – 1 713 106 Beneficialindirect 19 762 – – – 19 762 Non-beneficial
Ackerman Pick n Pay Foundation3 indirect 101 900 – – – 101 900 Non-beneficial
Ackerman Investment Holdings Proprietary Limited3 indirect 1 – – – 1 Non-beneficial
Newshelf 1321 Proprietary Limited4 indirect 124 677 237 – – – 124 677 237 Non-beneficial
Mistral Trust6 indirect 2 768 000 32 000 – – 2 800 000 Non-beneficial
Richard Brasher direct – 64 800 – – 64 800 Beneficialdirect – RSP/FSP 1 400 000 1 200 000 (120 000) (280 000) 2 200 000 Beneficial
Lerena Olivier direct 8 100 32 400 – – 40 500 Beneficialdirect – RSP/FSP 180 000 120 000 (60 000) – 240 000 Beneficial
Richard van Rensburg direct – RSP/FSP 320 000 – (42 000) (98 000) 180 000 Beneficial
Suzanne Ackerman-Berman direct 120 528 – – – 120 528 Beneficialdirect – RSP/FSP 110 000 60 000 (24 000) (56 000) 90 000 Beneficial
indirect 612 109 12 960 – – 625 069 Beneficial
Jonathan Ackerman direct 122 888 – – – 122 888 Beneficialdirect – RSP/FSP 56 000 30 000 (12 000) (28 000) 46 000 Beneficial
indirect 765 886 33 533 – – 799 419 Beneficialindirect 14 495 – (12 334)7 – 2 161 Non-beneficial
Aboubakar Jakoet direct 758 764 – – – 758 764 Beneficialindirect 13 059 – – – 13 059 Non-beneficial
David Friedland indirect 41 688 10 000 – – 51 688 Beneficial
David Robins direct 975 – – – 975 Beneficialindirect 90 436 – – – 90 436 Non-beneficial
Hugh Herman direct 30 000 – – – 30 000 Beneficialindirect 256 – – – 256 Beneficial
1 Direct interests represent a holding in the director’s personal capacity. Indirect interests represent a holding by a trust (of which the director is a trustee), a spouse or minor children of directors.
2 Beneficial interest represents an interest in shares in which a person is entitled to receive income payable in respect to that shareholding and obtain any benefit as a result of holding those shares. Non-beneficial interest represents an interest in shares in which a person will not benefit directly as a result of holding those shares.
3 The indirect non-beneficial interest in the Ackerman Pick n Pay Foundation represents the holdings of Gareth Ackerman and Suzanne Ackerman-Berman in their capacities as trustees.
4 The indirect non-beneficial interest in Newshelf 1321 Proprietary Limited represents a portion of the holdings of Gareth Ackerman, Suzanne Ackerman-Berman and Jonathan Ackerman.
5 The remuneration committee forfeited approximately 70% of the 2017 FSP award, as the three year cumulative growth rate of 10% set for the Group headline earnings per share hurdle was not met. In line with the discretion provided with the scheme rules, the remuneration committee allowed approximately 30% of the allocation to vest in recognition of the South African’s division market leading performance over the past three years.
6 The indirect non-beneficial interest in Mistral Trust represents a portion of the holdings of Gareth Ackerman, Suzanne Ackerman-Berman and Jonathan Ackerman in their capacity as trustees and/or potential beneficiaries.
7 The disposal of shares relates to minor children of the director becoming a major. These shares are therefore no longer indirectly held by the director.8 There have been no changes in the directors’ interest in ordinary shares since 28 February 2021 up to the date of approval of the 2021 audited Group
annual financial statements.
4 Directors’ remuneration and interest in shares (continued)4.2 Directors’ interest in ordinary shares (continued)
2020 Howheld1
Balanceheld at
3 March2019
Additions/grants Disposals Forfeits6
Balanceheld at
1 March2020
Beneficial/non-
beneficialinterest7
Gareth Ackerman direct 309 – – – 309 Beneficialindirect 1 687 200 17 000 – – 1 704 200 Beneficialindirect 19 762 – – – 19 762 Non-beneficial
Ackerman Pick n Pay Foundation2 indirect 101 900 – – – 101 900 Non-beneficial
Ackerman Investment Holdings Proprietary Limited3 indirect 124 677 238 – (124 677 237) – 1 Non-beneficial
Newshelf 1321 Proprietary Limited3 indirect – 124 677 237 – – 124 677 237 Non-beneficial
Mistral Trust4 indirect 2 735 008 32 992 – – 2 768 000 Non-beneficial
Richard Brasher direct 463 578 230 000 (693 578) – – Beneficialdirect – FSP 1 630 000 – (230 000) – 1 400 000 Beneficial
Lerena Olivier5 direct 8 100 – – – 8 100 Beneficialdirect – FSP 80 000 100 000 – – 180 000 Beneficial
Richard van Rensburg direct 291 439 45 000 (336 439) – – Beneficialdirect – FSP 215 000 150 000 (45 000) – 320 000 Beneficial
Suzanne Ackerman-Berman direct 120 528 25 000 (25 000) – 120 528 Beneficialdirect – FSP 120 000 15 000 (25 000) – 110 000 Beneficial
indirect 598 609 13 500 – – 612 109 Beneficial
Jonathan Ackerman direct 122 888 25 000 (25 000) – 122 888 Beneficialdirect – FSP 73 000 8 000 (25 000) – 56 000 Beneficial
indirect 726 686 39 200 – – 765 886 Beneficialindirect 11 039 3 456 – – 14 495 Non-beneficial
Aboubakar Jakoet6 direct 758 764 185 000 (185 000) – 758 764 Beneficialdirect – FSP 215 000 – (185 000) (30 000) – Beneficial
indirect 13 059 – – – 13 059 Non-beneficial
David Friedland indirect 36 688 5 000 – – 41 688 Beneficial
David Robins direct 975 – – – 975 Beneficialindirect 90 436 – – – 90 436 Non-beneficial
Hugh Herman direct 30 000 – – – 30 000 Beneficialindirect 256 – – – 256 Beneficial
Alex Mathole direct 86 1 700 (1 786) – – Beneficial
1 Direct interests represent a holding in the director’s personal capacity. Indirect interests represent a holding by a trust (of which the director is a trustee), a spouse or minor children of directors.
2 The indirect non-beneficial interest in the Ackerman Pick n Pay Foundation represents the holdings of Gareth Ackerman and Suzanne Ackerman-Berman in their capacities as trustees.
3 In order to ring fence its Pick n Pay shareholding, Ackerman Investment Holdings Proprietary Limited (AIH) transferred its shareholding to a wholly-owned subsidiary of AIH, namely Newshelf 1321 Proprietary Limited. The indirect non-beneficial interest in Newshelf 1321 Proprietary Limited represents a portion of the holdings of Gareth Ackerman, Suzanne Ackerman-Berman and Jonathan Ackerman.
4 The indirect non-beneficial interest in Mistral Trust represents a portion of the holdings of Gareth Ackerman, Suzanne Ackerman-Berman and Jonathan Ackerman in their capacity as trustees and/or potential beneficiaries.
5 Lerena Olivier was appointed as an executive director of Pick n Pay Stores Limited on 6 September 2019.The balance as at 3 March 2019 reflects the interest in shares prior to the executive director appointment.
6 In the prior year, Aboubakar Jakoet retired as an executive director and was appointed as a non-executive director of Pick n Pay Stores Limited. As a result of his retirement, 30 000 of his forfeitable shares were forfeited.
7 Beneficial interest represents an interest in shares in which a person is entitled to receive income payable in respect to that shareholding and obtain any benefit as a result of holding those shares. Non-beneficial interest represents an interest in shares in which a person will not benefit directly as a result of holding those shares.
GROUP ANNUAL FINANCIAL STATEMENTS 02NOTES TO THE GROUP ANNUAL FINANCIAL STATEMENTS (continued)
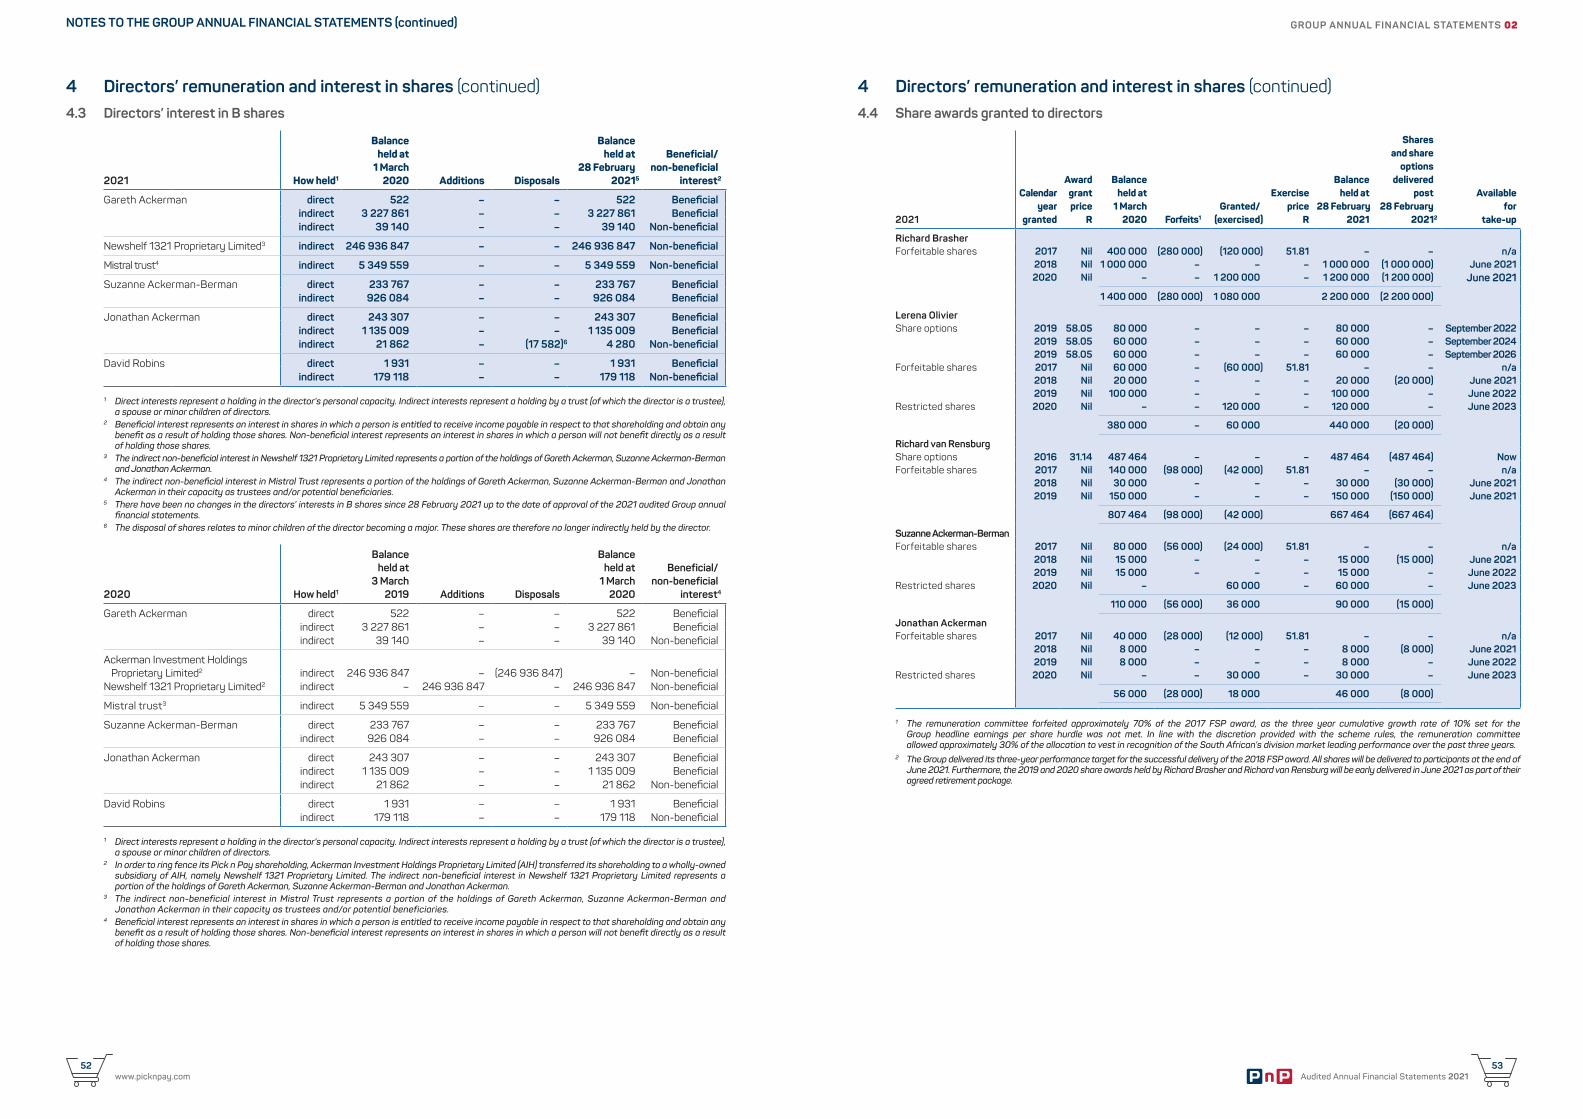
Audited Annual Financial Statements 202153
www.picknpay.com52
4 Directors’ remuneration and interest in shares (continued)4.3 Directors’ interest in B shares
2021 How held1
Balanceheld at
1 March2020 Additions Disposals
Balanceheld at
28 February20215
Beneficial/non-beneficial
interest2
Gareth Ackerman direct 522 – – 522 Beneficialindirect 3 227 861 – – 3 227 861 Beneficialindirect 39 140 – – 39 140 Non-beneficial
Newshelf 1321 Proprietary Limited3 indirect 246 936 847 – – 246 936 847 Non-beneficial
Mistral trust4 indirect 5 349 559 – – 5 349 559 Non-beneficial
Suzanne Ackerman-Berman direct 233 767 – – 233 767 Beneficialindirect 926 084 – – 926 084 Beneficial
Jonathan Ackerman direct 243 307 – – 243 307 Beneficialindirect 1 135 009 – – 1 135 009 Beneficialindirect 21 862 – (17 582)6 4 280 Non-beneficial
David Robins direct 1 931 – – 1 931 Beneficialindirect 179 118 – – 179 118 Non-beneficial
1 Direct interests represent a holding in the director’s personal capacity. Indirect interests represent a holding by a trust (of which the director is a trustee), a spouse or minor children of directors.
2 Beneficial interest represents an interest in shares in which a person is entitled to receive income payable in respect to that shareholding and obtain any benefit as a result of holding those shares. Non-beneficial interest represents an interest in shares in which a person will not benefit directly as a result of holding those shares.
3 The indirect non-beneficial interest in Newshelf 1321 Proprietary Limited represents a portion of the holdings of Gareth Ackerman, Suzanne Ackerman-Berman and Jonathan Ackerman.
4 The indirect non-beneficial interest in Mistral Trust represents a portion of the holdings of Gareth Ackerman, Suzanne Ackerman-Berman and Jonathan Ackerman in their capacity as trustees and/or potential beneficiaries.
5 There have been no changes in the directors’ interests in B shares since 28 February 2021 up to the date of approval of the 2021 audited Group annual financial statements.
6 The disposal of shares relates to minor children of the director becoming a major. These shares are therefore no longer indirectly held by the director.
2020 How held1
Balanceheld at
3 March2019 Additions Disposals
Balanceheld at
1 March2020
Beneficial/non-beneficial
interest4
Gareth Ackerman direct 522 – – 522 Beneficialindirect 3 227 861 – – 3 227 861 Beneficialindirect 39 140 – – 39 140 Non-beneficial
Ackerman Investment Holdings Proprietary Limited2 indirect 246 936 847 – (246 936 847) – Non-beneficial
Newshelf 1321 Proprietary Limited2 indirect – 246 936 847 – 246 936 847 Non-beneficial
Mistral trust3 indirect 5 349 559 – – 5 349 559 Non-beneficial
Suzanne Ackerman-Berman direct 233 767 – – 233 767 Beneficialindirect 926 084 – – 926 084 Beneficial
Jonathan Ackerman direct 243 307 – – 243 307 Beneficialindirect 1 135 009 – – 1 135 009 Beneficialindirect 21 862 – – 21 862 Non-beneficial
David Robins direct 1 931 – – 1 931 Beneficialindirect 179 118 – – 179 118 Non-beneficial
1 Direct interests represent a holding in the director’s personal capacity. Indirect interests represent a holding by a trust (of which the director is a trustee), a spouse or minor children of directors.
2 In order to ring fence its Pick n Pay shareholding, Ackerman Investment Holdings Proprietary Limited (AIH) transferred its shareholding to a wholly-owned subsidiary of AIH, namely Newshelf 1321 Proprietary Limited. The indirect non-beneficial interest in Newshelf 1321 Proprietary Limited represents a portion of the holdings of Gareth Ackerman, Suzanne Ackerman-Berman and Jonathan Ackerman.
3 The indirect non-beneficial interest in Mistral Trust represents a portion of the holdings of Gareth Ackerman, Suzanne Ackerman-Berman and Jonathan Ackerman in their capacity as trustees and/or potential beneficiaries.
4 Beneficial interest represents an interest in shares in which a person is entitled to receive income payable in respect to that shareholding and obtain any benefit as a result of holding those shares. Non-beneficial interest represents an interest in shares in which a person will not benefit directly as a result of holding those shares.
4 Directors’ remuneration and interest in shares (continued)4.4 Share awards granted to directors
2021
Calendar year
granted
Awardgrantprice
R
Balanceheld at
1 March2020 Forfeits1
Granted/(exercised)
Exerciseprice
R
Balanceheld at
28 February2021
Sharesand share
optionsdelivered
post28 February
20212
Availablefor
take-up
Richard BrasherForfeitable shares 2017 Nil 400 000 (280 000) (120 000) 51.81 – – n/a
2018 Nil 1 000 000 – – – 1 000 000 (1 000 000) June 20212020 Nil – – 1 200 000 – 1 200 000 (1 200 000) June 2021
1 400 000 (280 000) 1 080 000 2 200 000 (2 200 000)
Lerena OlivierShare options 2019 58.05 80 000 – – – 80 000 – September 2022
2019 58.05 60 000 – – – 60 000 – September 20242019 58.05 60 000 – – – 60 000 – September 2026
Forfeitable shares 2017 Nil 60 000 – (60 000) 51.81 – – n/a2018 Nil 20 000 – – – 20 000 (20 000) June 20212019 Nil 100 000 – – – 100 000 – June 2022
Restricted shares 2020 Nil – – 120 000 – 120 000 – June 2023
380 000 – 60 000 440 000 (20 000)
Richard van RensburgShare options 2016 31.14 487 464 – – – 487 464 (487 464) Now Forfeitable shares 2017 Nil 140 000 (98 000) (42 000) 51.81 – – n/a
2018 Nil 30 000 – – – 30 000 (30 000) June 2021 2019 Nil 150 000 – – – 150 000 (150 000) June 2021
807 464 (98 000) (42 000) 667 464 (667 464)
Suzanne Ackerman-BermanForfeitable shares 2017 Nil 80 000 (56 000) (24 000) 51.81 – – n/a
2018 Nil 15 000 – – – 15 000 (15 000) June 20212019 Nil 15 000 – – – 15 000 – June 2022
Restricted shares 2020 Nil – 60 000 – 60 000 – June 2023
110 000 (56 000) 36 000 90 000 (15 000)
Jonathan AckermanForfeitable shares 2017 Nil 40 000 (28 000) (12 000) 51.81 – – n/a
2018 Nil 8 000 – – – 8 000 (8 000) June 20212019 Nil 8 000 – – – 8 000 – June 2022
Restricted shares 2020 Nil – – 30 000 – 30 000 – June 2023
56 000 (28 000) 18 000 46 000 (8 000)
1 The remuneration committee forfeited approximately 70% of the 2017 FSP award, as the three year cumulative growth rate of 10% set for the Group headline earnings per share hurdle was not met. In line with the discretion provided with the scheme rules, the remuneration committee allowed approximately 30% of the allocation to vest in recognition of the South African’s division market leading performance over the past three years.
2 The Group delivered its three-year performance target for the successful delivery of the 2018 FSP award. All shares will be delivered to participants at the end of June 2021. Furthermore, the 2019 and 2020 share awards held by Richard Brasher and Richard van Rensburg will be early delivered in June 2021 as part of their agreed retirement package.
GROUP ANNUAL FINANCIAL STATEMENTS 02NOTES TO THE GROUP ANNUAL FINANCIAL STATEMENTS (continued)
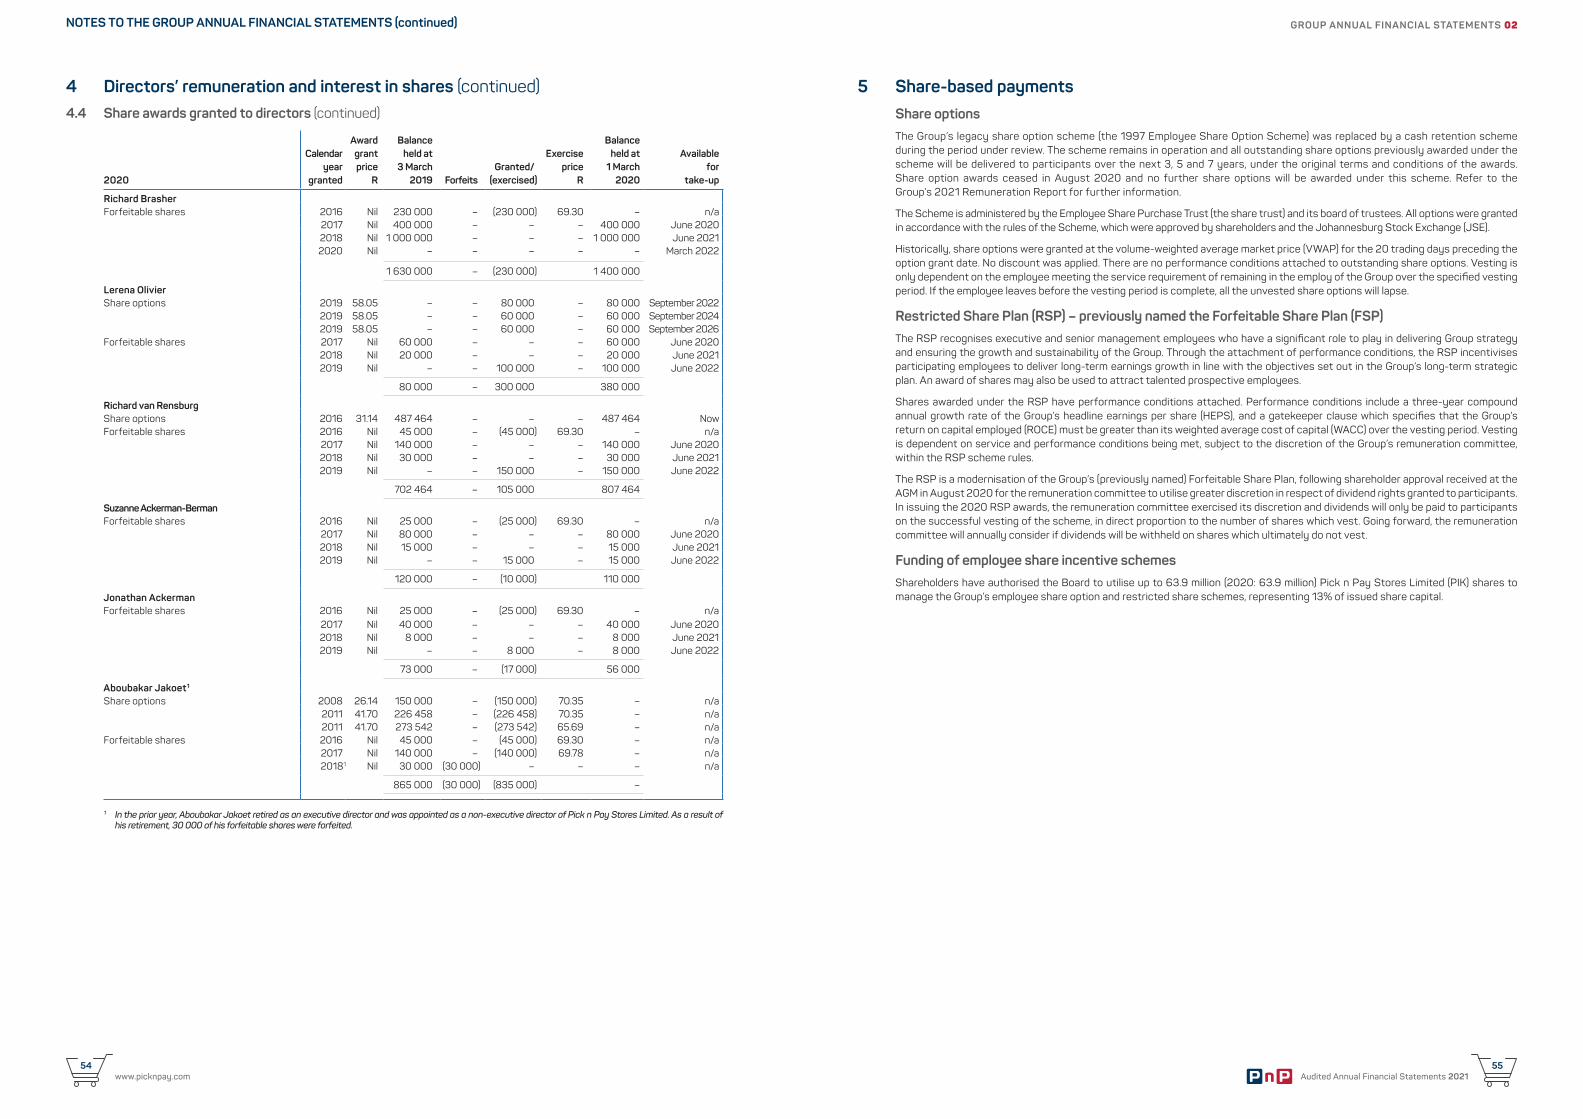
Audited Annual Financial Statements 202155
www.picknpay.com54
4 Directors’ remuneration and interest in shares (continued)4.4 Share awards granted to directors (continued)
2020
Calendar year
granted
Awardgrantprice
R
Balanceheld at
3 March2019 Forfeits
Granted/(exercised)
Exerciseprice
R
Balanceheld at
1 March2020
Availablefor
take-up
Richard BrasherForfeitable shares 2016 Nil 230 000 – (230 000) 69.30 – n/a
2017 Nil 400 000 – – – 400 000 June 20202018 Nil 1 000 000 – – – 1 000 000 June 20212020 Nil – – – – – March 2022
1 630 000 – (230 000) 1 400 000
Lerena OlivierShare options 2019 58.05 – – 80 000 – 80 000 September 2022
2019 58.05 – – 60 000 – 60 000 September 20242019 58.05 – – 60 000 – 60 000 September 2026
Forfeitable shares 2017 Nil 60 000 – – – 60 000 June 20202018 Nil 20 000 – – – 20 000 June 20212019 Nil – – 100 000 – 100 000 June 2022
80 000 – 300 000 380 000
Richard van RensburgShare options 2016 31.14 487 464 – – – 487 464 NowForfeitable shares 2016 Nil 45 000 – (45 000) 69.30 – n/a
2017 Nil 140 000 – – – 140 000 June 20202018 Nil 30 000 – – – 30 000 June 20212019 Nil – – 150 000 – 150 000 June 2022
702 464 – 105 000 807 464
Suzanne Ackerman-BermanForfeitable shares 2016 Nil 25 000 – (25 000) 69.30 – n/a
2017 Nil 80 000 – – – 80 000 June 20202018 Nil 15 000 – – – 15 000 June 20212019 Nil – – 15 000 – 15 000 June 2022
120 000 – (10 000) 110 000
Jonathan AckermanForfeitable shares 2016 Nil 25 000 – (25 000) 69.30 – n/a
2017 Nil 40 000 – – – 40 000 June 20202018 Nil 8 000 – – – 8 000 June 20212019 Nil – – 8 000 – 8 000 June 2022
73 000 – (17 000) 56 000
Aboubakar Jakoet1
Share options 2008 26.14 150 000 – (150 000) 70.35 – n/a2011 41.70 226 458 – (226 458) 70.35 – n/a2011 41.70 273 542 – (273 542) 65.69 – n/a
Forfeitable shares 2016 Nil 45 000 – (45 000) 69.30 – n/a2017 Nil 140 000 – (140 000) 69.78 – n/a20181 Nil 30 000 (30 000) – – – n/a
865 000 (30 000) (835 000) –
1 In the prior year, Aboubakar Jakoet retired as an executive director and was appointed as a non-executive director of Pick n Pay Stores Limited. As a result of his retirement, 30 000 of his forfeitable shares were forfeited.
5 Share-based paymentsShare optionsThe Group’s legacy share option scheme (the 1997 Employee Share Option Scheme) was replaced by a cash retention scheme during the period under review. The scheme remains in operation and all outstanding share options previously awarded under the scheme will be delivered to participants over the next 3, 5 and 7 years, under the original terms and conditions of the awards. Share option awards ceased in August 2020 and no further share options will be awarded under this scheme. Refer to the Group’s 2021 Remuneration Report for further information.
The Scheme is administered by the Employee Share Purchase Trust (the share trust) and its board of trustees. All options were granted in accordance with the rules of the Scheme, which were approved by shareholders and the Johannesburg Stock Exchange (JSE).
Historically, share options were granted at the volume-weighted average market price (VWAP) for the 20 trading days preceding the option grant date. No discount was applied. There are no performance conditions attached to outstanding share options. Vesting is only dependent on the employee meeting the service requirement of remaining in the employ of the Group over the specified vesting period. If the employee leaves before the vesting period is complete, all the unvested share options will lapse.
Restricted Share Plan (RSP) – previously named the Forfeitable Share Plan (FSP)The RSP recognises executive and senior management employees who have a significant role to play in delivering Group strategy and ensuring the growth and sustainability of the Group. Through the attachment of performance conditions, the RSP incentivises participating employees to deliver long-term earnings growth in line with the objectives set out in the Group’s long-term strategic plan. An award of shares may also be used to attract talented prospective employees.
Shares awarded under the RSP have performance conditions attached. Performance conditions include a three-year compound annual growth rate of the Group’s headline earnings per share (HEPS), and a gatekeeper clause which specifies that the Group’s return on capital employed (ROCE) must be greater than its weighted average cost of capital (WACC) over the vesting period. Vesting is dependent on service and performance conditions being met, subject to the discretion of the Group’s remuneration committee, within the RSP scheme rules.
The RSP is a modernisation of the Group’s (previously named) Forfeitable Share Plan, following shareholder approval received at the AGM in August 2020 for the remuneration committee to utilise greater discretion in respect of dividend rights granted to participants. In issuing the 2020 RSP awards, the remuneration committee exercised its discretion and dividends will only be paid to participants on the successful vesting of the scheme, in direct proportion to the number of shares which vest. Going forward, the remuneration committee will annually consider if dividends will be withheld on shares which ultimately do not vest.
Funding of employee share incentive schemesShareholders have authorised the Board to utilise up to 63.9 million (2020: 63.9 million) Pick n Pay Stores Limited (PIK) shares to manage the Group’s employee share option and restricted share schemes, representing 13% of issued share capital.
GROUP ANNUAL FINANCIAL STATEMENTS 02NOTES TO THE GROUP ANNUAL FINANCIAL STATEMENTS (continued)
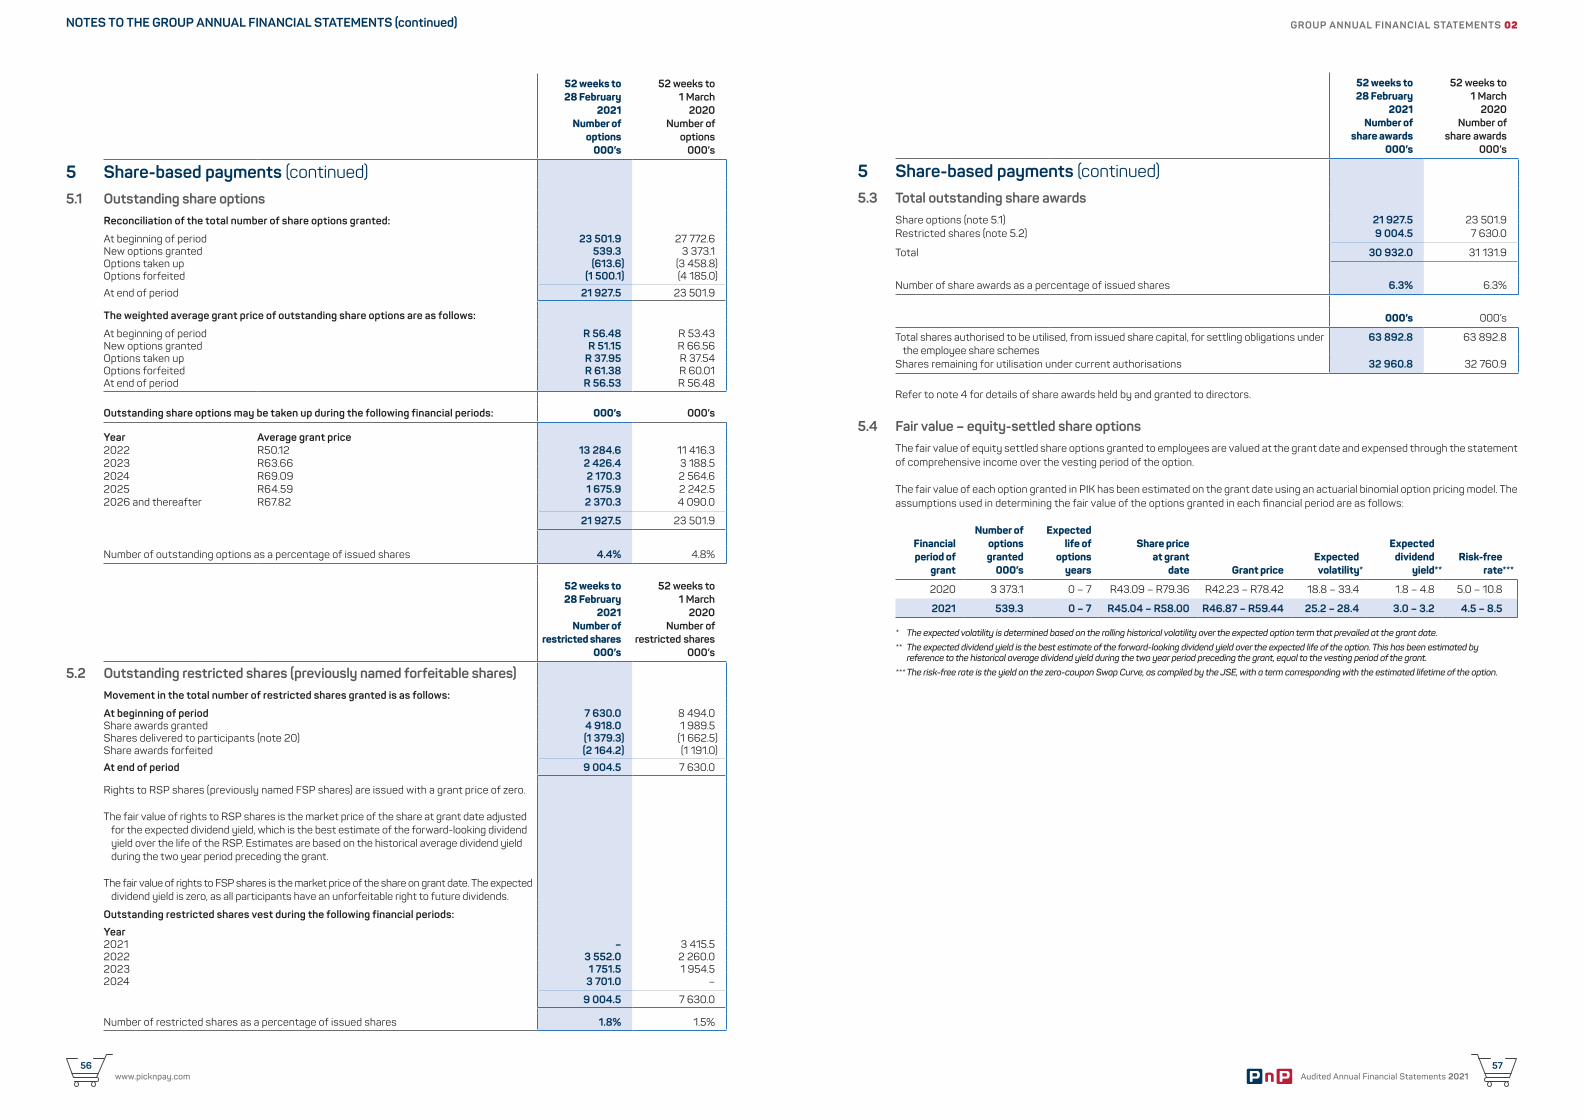
Audited Annual Financial Statements 202157
www.picknpay.com56
52 weeks to 28 February
2021Number of
options000’s
52 weeks to1 March
2020Number of
options000’s
5 Share-based payments (continued)5.1 Outstanding share options
Reconciliation of the total number of share options granted:
At beginning of period 23 501.9 27 772.6 New options granted 539.3 3 373.1 Options taken up (613.6) (3 458.8) Options forfeited (1 500.1) (4 185.0)
At end of period 21 927.5 23 501.9
The weighted average grant price of outstanding share options are as follows:
At beginning of period R 56.48 R 53.43New options granted R 51.15 R 66.56Options taken up R 37.95 R 37.54Options forfeited R 61.38 R 60.01At end of period R 56.53 R 56.48
Outstanding share options may be taken up during the following financial periods: 000’s 000’s
Year Average grant price 2022 R50.12 13 284.6 11 416.3 2023 R63.66 2 426.4 3 188.5 2024 R69.09 2 170.3 2 564.6 2025 R64.59 1 675.9 2 242.5 2026 and thereafter R67.82 2 370.3 4 090.0
21 927.5 23 501.9
Number of outstanding options as a percentage of issued shares 4.4% 4.8%
52 weeks to 28 February
2021Number of
restricted shares000’s
52 weeks to 1 March
2020 Number of
restricted shares 000’s
5.2 Outstanding restricted shares (previously named forfeitable shares)Movement in the total number of restricted shares granted is as follows:
At beginning of period 7 630.0 8 494.0 Share awards granted 4 918.0 1 989.5 Shares delivered to participants (note 20) (1 379.3) (1 662.5) Share awards forfeited (2 164.2) (1 191.0)
At end of period 9 004.5 7 630.0
Rights to RSP shares (previously named FSP shares) are issued with a grant price of zero.
The fair value of rights to RSP shares is the market price of the share at grant date adjusted for the expected dividend yield, which is the best estimate of the forward-looking dividend yield over the life of the RSP. Estimates are based on the historical average dividend yield during the two year period preceding the grant.
The fair value of rights to FSP shares is the market price of the share on grant date. The expected dividend yield is zero, as all participants have an unforfeitable right to future dividends.
Outstanding restricted shares vest during the following financial periods:
Year2021 – 3 415.5 2022 3 552.0 2 260.0 2023 1 751.5 1 954.5 2024 3 701.0 –
9 004.5 7 630.0
Number of restricted shares as a percentage of issued shares 1.8% 1.5%
52 weeks to 28 February
2021Number of
share awards000’s
52 weeks to 1 March
2020 Number of
share awards 000’s
5 Share-based payments (continued)5.3 Total outstanding share awards
Share options (note 5.1) 21 927.5 23 501.9 Restricted shares (note 5.2) 9 004.5 7 630.0
Total 30 932.0 31 131.9
Number of share awards as a percentage of issued shares 6.3% 6.3%
000’s 000’s
Total shares authorised to be utilised, from issued share capital, for settling obligations under the employee share schemes
63 892.8 63 892.8
Shares remaining for utilisation under current authorisations 32 960.8 32 760.9
Refer to note 4 for details of share awards held by and granted to directors.
5.4 Fair value – equity-settled share optionsThe fair value of equity settled share options granted to employees are valued at the grant date and expensed through the statement of comprehensive income over the vesting period of the option.
The fair value of each option granted in PIK has been estimated on the grant date using an actuarial binomial option pricing model. The assumptions used in determining the fair value of the options granted in each financial period are as follows:
Financialperiod of
grant
Number ofoptionsgranted
000’s
Expected life of
optionsyears
Share priceat grant
date Grant priceExpectedvolatility*
Expecteddividend
yield**Risk-free
rate***
2020 3 373.1 0 – 7 R43.09 – R79.36 R42.23 – R78.42 18.8 – 33.4 1.8 – 4.8 5.0 – 10.8
2021 539.3 0 – 7 R45.04 – R58.00 R46.87 – R59.44 25.2 – 28.4 3.0 – 3.2 4.5 – 8.5
* The expected volatility is determined based on the rolling historical volatility over the expected option term that prevailed at the grant date.
** The expected dividend yield is the best estimate of the forward-looking dividend yield over the expected life of the option. This has been estimated by reference to the historical average dividend yield during the two year period preceding the grant, equal to the vesting period of the grant.
*** The risk-free rate is the yield on the zero-coupon Swap Curve, as compiled by the JSE, with a term corresponding with the estimated lifetime of the option.
GROUP ANNUAL FINANCIAL STATEMENTS 02NOTES TO THE GROUP ANNUAL FINANCIAL STATEMENTS (continued)
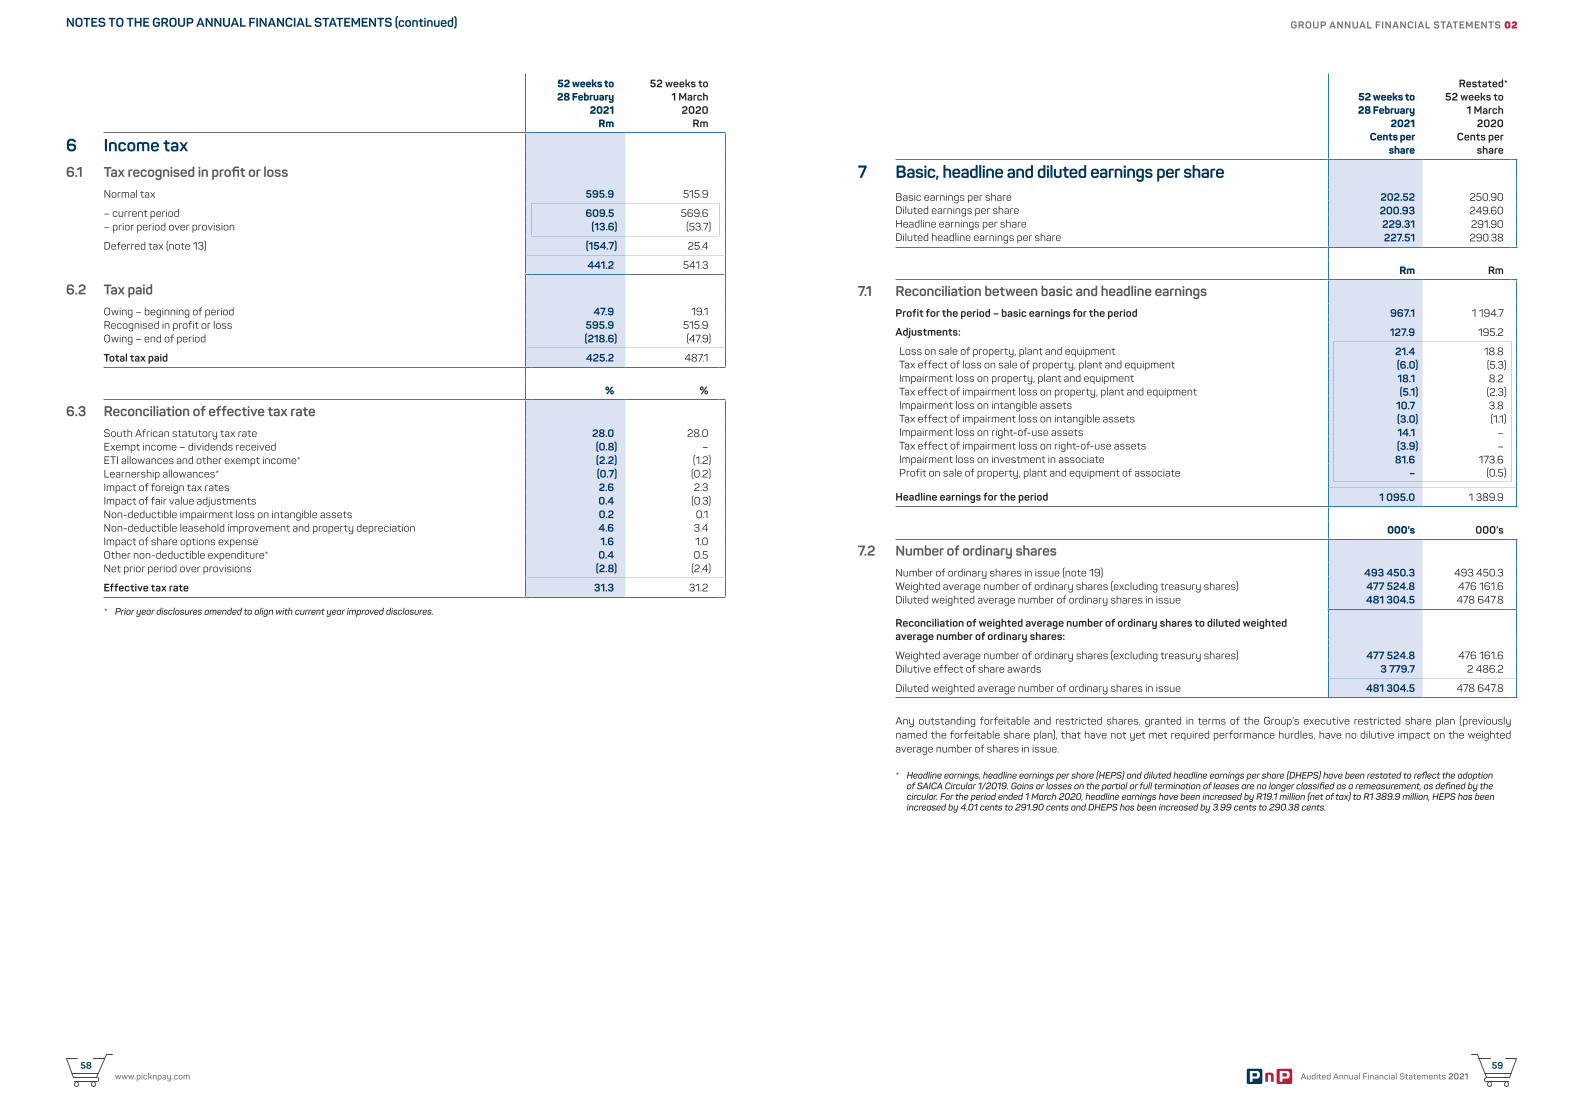
Audited Annual Financial Statements 202159
www.picknpay.com58
52 weeks to 28 February
2021Rm
52 weeks to1 March
2020Rm
6 Income tax6.1 Tax recognised in profit or loss
Normal tax 595.9 515.9
– current period 609.5 569.6 – prior period over provision (13.6) (53.7)
Deferred tax (note 13) (154.7) 25.4
441.2 541.3
6.2 Tax paid Owing – beginning of period 47.9 19.1 Recognised in profit or loss 595.9 515.9 Owing – end of period (218.6) (47.9)
Total tax paid 425.2 487.1
% %
6.3 Reconciliation of effective tax rateSouth African statutory tax rate 28.0 28.0 Exempt income – dividends received (0.8) – ETI allowances and other exempt income* (2.2) (1.2) Learnership allowances* (0.7) (0.2) Impact of foreign tax rates 2.6 2.3 Impact of fair value adjustments 0.4 (0.3) Non-deductible impairment loss on intangible assets 0.2 0.1 Non-deductible leasehold improvement and property depreciation 4.6 3.4 Impact of share options expense 1.6 1.0 Other non-deductible expenditure* 0.4 0.5 Net prior period over provisions (2.8) (2.4)
Effective tax rate 31.3 31.2
* Prior year disclosures amended to align with current year improved disclosures.
52 weeks to 28 February
2021 Cents per
share
Restated*52 weeks to
1 March2020
Cents pershare
7 Basic, headline and diluted earnings per shareBasic earnings per share 202.52 250.90 Diluted earnings per share 200.93 249.60 Headline earnings per share 229.31 291.90 Diluted headline earnings per share 227.51 290.38
Rm Rm
7.1 Reconciliation between basic and headline earningsProfit for the period – basic earnings for the period 967.1 1 194.7
Adjustments: 127.9 195.2
Loss on sale of property, plant and equipment 21.4 18.8 Tax effect of loss on sale of property, plant and equipment (6.0) (5.3) Impairment loss on property, plant and equipment 18.1 8.2 Tax effect of impairment loss on property, plant and equipment (5.1) (2.3) Impairment loss on intangible assets 10.7 3.8 Tax effect of impairment loss on intangible assets (3.0) (1.1) Impairment loss on right-of-use assets 14.1 – Tax effect of impairment loss on right-of-use assets (3.9) – Impairment loss on investment in associate 81.6 173.6 Profit on sale of property, plant and equipment of associate – (0.5)
Headline earnings for the period 1 095.0 1 389.9
000’s 000’s
7.2 Number of ordinary sharesNumber of ordinary shares in issue (note 19) 493 450.3 493 450.3 Weighted average number of ordinary shares (excluding treasury shares) 477 524.8 476 161.6 Diluted weighted average number of ordinary shares in issue 481 304.5 478 647.8
Reconciliation of weighted average number of ordinary shares to diluted weighted average number of ordinary shares:
Weighted average number of ordinary shares (excluding treasury shares) 477 524.8 476 161.6 Dilutive effect of share awards 3 779.7 2 486.2
Diluted weighted average number of ordinary shares in issue 481 304.5 478 647.8
Any outstanding forfeitable and restricted shares, granted in terms of the Group’s executive restricted share plan (previously named the forfeitable share plan), that have not yet met required performance hurdles, have no dilutive impact on the weighted average number of shares in issue.
* Headline earnings, headline earnings per share (HEPS) and diluted headline earnings per share (DHEPS) have been restated to reflect the adoption of SAICA Circular 1/2019. Gains or losses on the partial or full termination of leases are no longer classified as a remeasurement, as defined by the circular. For the period ended 1 March 2020, headline earnings have been increased by R19.1 million (net of tax) to R1 389.9 million, HEPS has been increased by 4.01 cents to 291.90 cents and DHEPS has been increased by 3.99 cents to 290.38 cents.
GROUP ANNUAL FINANCIAL STATEMENTS 02NOTES TO THE GROUP ANNUAL FINANCIAL STATEMENTS (continued)
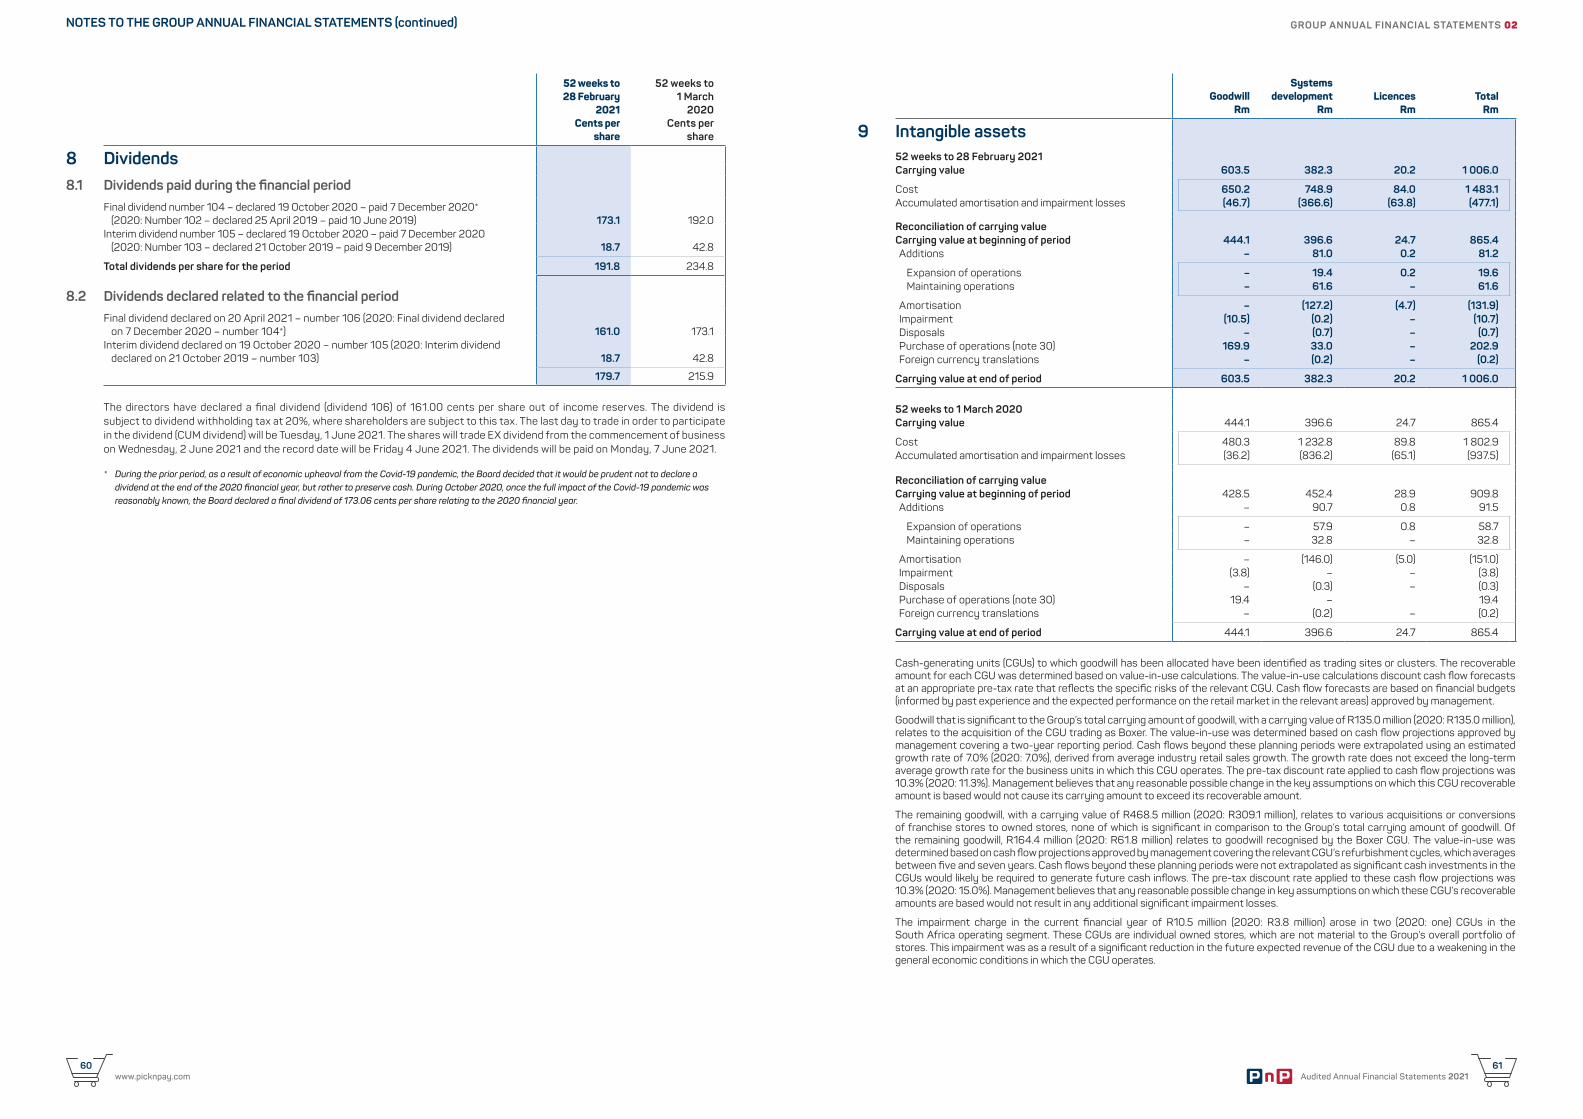
Audited Annual Financial Statements 202161
www.picknpay.com60
52 weeks to 28 February
2021Cents per
share
52 weeks to 1 March
2020Cents per
share
8 Dividends8.1 Dividends paid during the financial period
Final dividend number 104 – declared 19 October 2020 – paid 7 December 2020* (2020: Number 102 – declared 25 April 2019 – paid 10 June 2019) 173.1 192.0
Interim dividend number 105 – declared 19 October 2020 – paid 7 December 2020 (2020: Number 103 – declared 21 October 2019 – paid 9 December 2019) 18.7 42.8
Total dividends per share for the period 191.8 234.8
8.2 Dividends declared related to the financial periodFinal dividend declared on 20 April 2021 – number 106 (2020: Final dividend declared
on 7 December 2020 – number 104*) 161.0 173.1 Interim dividend declared on 19 October 2020 – number 105 (2020: Interim dividend
declared on 21 October 2019 – number 103) 18.7 42.8
179.7 215.9
The directors have declared a final dividend (dividend 106) of 161.00 cents per share out of income reserves. The dividend is subject to dividend withholding tax at 20%, where shareholders are subject to this tax. The last day to trade in order to participate in the dividend (CUM dividend) will be Tuesday, 1 June 2021. The shares will trade EX dividend from the commencement of business on Wednesday, 2 June 2021 and the record date will be Friday 4 June 2021. The dividends will be paid on Monday, 7 June 2021.
* During the prior period, as a result of economic upheaval from the Covid-19 pandemic, the Board decided that it would be prudent not to declare a dividend at the end of the 2020 financial year, but rather to preserve cash. During October 2020, once the full impact of the Covid-19 pandemic was reasonably known, the Board declared a final dividend of 173.06 cents per share relating to the 2020 financial year.
GoodwillRm
Systemsdevelopment
Rm Licences
RmTotal
Rm
9 Intangible assets52 weeks to 28 February 2021Carrying value 603.5 382.3 20.2 1 006.0
Cost 650.2 748.9 84.0 1 483.1 Accumulated amortisation and impairment losses (46.7) (366.6) (63.8) (477.1)
Reconciliation of carrying valueCarrying value at beginning of period 444.1 396.6 24.7 865.4 Additions – 81.0 0.2 81.2
Expansion of operations – 19.4 0.2 19.6 Maintaining operations – 61.6 – 61.6
Amortisation – (127.2) (4.7) (131.9) Impairment (10.5) (0.2) – (10.7) Disposals – (0.7) – (0.7) Purchase of operations (note 30) 169.9 33.0 – 202.9 Foreign currency translations – (0.2) – (0.2)
Carrying value at end of period 603.5 382.3 20.2 1 006.0
52 weeks to 1 March 2020Carrying value 444.1 396.6 24.7 865.4
Cost 480.3 1 232.8 89.8 1 802.9 Accumulated amortisation and impairment losses (36.2) (836.2) (65.1) (937.5)
Reconciliation of carrying valueCarrying value at beginning of period 428.5 452.4 28.9 909.8 Additions – 90.7 0.8 91.5
Expansion of operations – 57.9 0.8 58.7 Maintaining operations – 32.8 – 32.8
Amortisation – (146.0) (5.0) (151.0) Impairment (3.8) – – (3.8) Disposals – (0.3) – (0.3) Purchase of operations (note 30) 19.4 – 19.4 Foreign currency translations – (0.2) – (0.2)
Carrying value at end of period 444.1 396.6 24.7 865.4
Cash-generating units (CGUs) to which goodwill has been allocated have been identified as trading sites or clusters. The recoverable amount for each CGU was determined based on value-in-use calculations. The value-in-use calculations discount cash flow forecasts at an appropriate pre-tax rate that reflects the specific risks of the relevant CGU. Cash flow forecasts are based on financial budgets (informed by past experience and the expected performance on the retail market in the relevant areas) approved by management.
Goodwill that is significant to the Group’s total carrying amount of goodwill, with a carrying value of R135.0 million (2020: R135.0 million), relates to the acquisition of the CGU trading as Boxer. The value-in-use was determined based on cash flow projections approved by management covering a two-year reporting period. Cash flows beyond these planning periods were extrapolated using an estimated growth rate of 7.0% (2020: 7.0%), derived from average industry retail sales growth. The growth rate does not exceed the long-term average growth rate for the business units in which this CGU operates. The pre-tax discount rate applied to cash flow projections was 10.3% (2020: 11.3%). Management believes that any reasonable possible change in the key assumptions on which this CGU recoverable amount is based would not cause its carrying amount to exceed its recoverable amount.
The remaining goodwill, with a carrying value of R468.5 million (2020: R309.1 million), relates to various acquisitions or conversions of franchise stores to owned stores, none of which is significant in comparison to the Group’s total carrying amount of goodwill. Of the remaining goodwill, R164.4 million (2020: R61.8 million) relates to goodwill recognised by the Boxer CGU. The value-in-use was determined based on cash flow projections approved by management covering the relevant CGU’s refurbishment cycles, which averages between five and seven years. Cash flows beyond these planning periods were not extrapolated as significant cash investments in the CGUs would likely be required to generate future cash inflows. The pre-tax discount rate applied to these cash flow projections was 10.3% (2020: 15.0%). Management believes that any reasonable possible change in key assumptions on which these CGU’s recoverable amounts are based would not result in any additional significant impairment losses.
The impairment charge in the current financial year of R10.5 million (2020: R3.8 million) arose in two (2020: one) CGUs in the South Africa operating segment. These CGUs are individual owned stores, which are not material to the Group’s overall portfolio of stores. This impairment was as a result of a significant reduction in the future expected revenue of the CGU due to a weakening in the general economic conditions in which the CGU operates.
GROUP ANNUAL FINANCIAL STATEMENTS 02NOTES TO THE GROUP ANNUAL FINANCIAL STATEMENTS (continued)
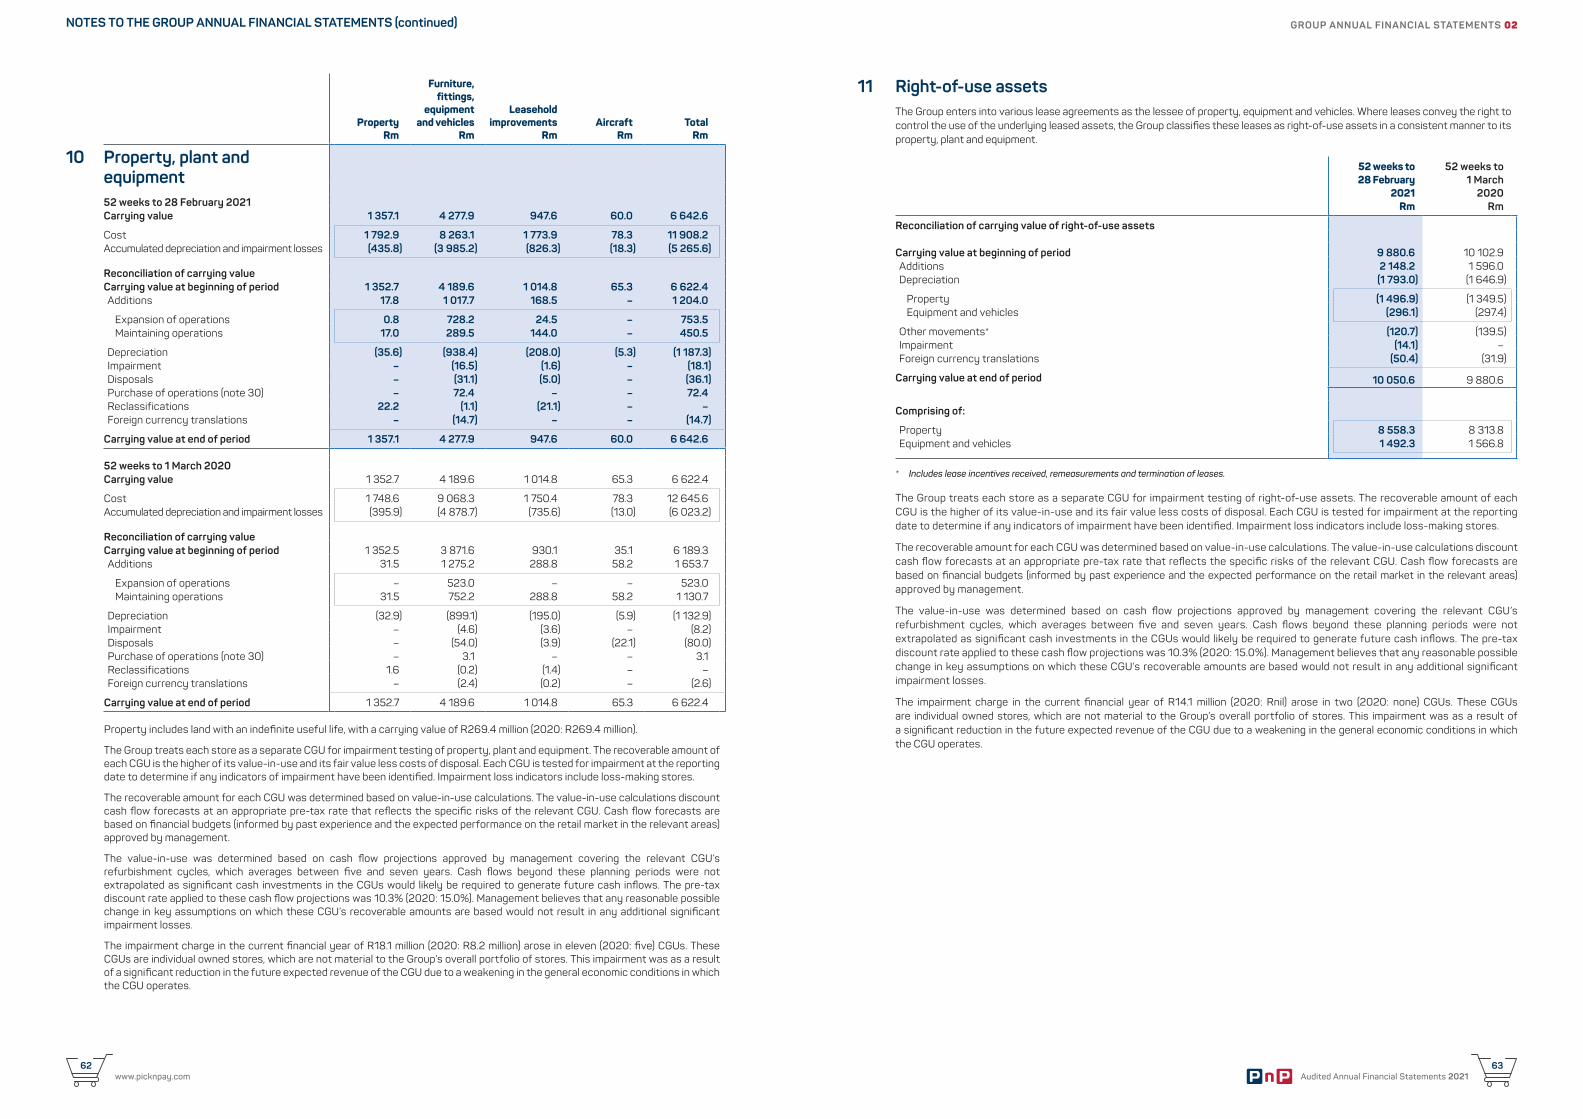
Audited Annual Financial Statements 202163
www.picknpay.com62
PropertyRm
Furniture,fittings,
equipmentand vehicles
Rm
Leaseholdimprovements
RmAircraft
RmTotal
Rm
10 Property, plant and equipment52 weeks to 28 February 2021Carrying value 1 357.1 4 277.9 947.6 60.0 6 642.6
Cost 1 792.9 8 263.1 1 773.9 78.3 11 908.2 Accumulated depreciation and impairment losses (435.8) (3 985.2) (826.3) (18.3) (5 265.6)
Reconciliation of carrying valueCarrying value at beginning of period 1 352.7 4 189.6 1 014.8 65.3 6 622.4 Additions 17.8 1 017.7 168.5 – 1 204.0
Expansion of operations 0.8 728.2 24.5 – 753.5 Maintaining operations 17.0 289.5 144.0 – 450.5
Depreciation (35.6) (938.4) (208.0) (5.3) (1 187.3) Impairment – (16.5) (1.6) – (18.1) Disposals – (31.1) (5.0) – (36.1) Purchase of operations (note 30) – 72.4 – – 72.4 Reclassifications 22.2 (1.1) (21.1) – – Foreign currency translations – (14.7) – – (14.7)
Carrying value at end of period 1 357.1 4 277.9 947.6 60.0 6 642.6
52 weeks to 1 March 2020Carrying value 1 352.7 4 189.6 1 014.8 65.3 6 622.4
Cost 1 748.6 9 068.3 1 750.4 78.3 12 645.6 Accumulated depreciation and impairment losses (395.9) (4 878.7) (735.6) (13.0) (6 023.2)
Reconciliation of carrying valueCarrying value at beginning of period 1 352.5 3 871.6 930.1 35.1 6 189.3 Additions 31.5 1 275.2 288.8 58.2 1 653.7
Expansion of operations – 523.0 – – 523.0 Maintaining operations 31.5 752.2 288.8 58.2 1 130.7
Depreciation (32.9) (899.1) (195.0) (5.9) (1 132.9) Impairment – (4.6) (3.6) – (8.2) Disposals – (54.0) (3.9) (22.1) (80.0) Purchase of operations (note 30) – 3.1 – – 3.1 Reclassifications 1.6 (0.2) (1.4) – – Foreign currency translations – (2.4) (0.2) – (2.6)
Carrying value at end of period 1 352.7 4 189.6 1 014.8 65.3 6 622.4
Property includes land with an indefinite useful life, with a carrying value of R269.4 million (2020: R269.4 million).
The Group treats each store as a separate CGU for impairment testing of property, plant and equipment. The recoverable amount of each CGU is the higher of its value-in-use and its fair value less costs of disposal. Each CGU is tested for impairment at the reporting date to determine if any indicators of impairment have been identified. Impairment loss indicators include loss-making stores.
The recoverable amount for each CGU was determined based on value-in-use calculations. The value-in-use calculations discount cash flow forecasts at an appropriate pre-tax rate that reflects the specific risks of the relevant CGU. Cash flow forecasts are based on financial budgets (informed by past experience and the expected performance on the retail market in the relevant areas) approved by management.
The value-in-use was determined based on cash flow projections approved by management covering the relevant CGU’s refurbishment cycles, which averages between five and seven years. Cash flows beyond these planning periods were not extrapolated as significant cash investments in the CGUs would likely be required to generate future cash inflows. The pre-tax discount rate applied to these cash flow projections was 10.3% (2020: 15.0%). Management believes that any reasonable possible change in key assumptions on which these CGU’s recoverable amounts are based would not result in any additional significant impairment losses.
The impairment charge in the current financial year of R18.1 million (2020: R8.2 million) arose in eleven (2020: five) CGUs. These CGUs are individual owned stores, which are not material to the Group’s overall portfolio of stores. This impairment was as a result of a significant reduction in the future expected revenue of the CGU due to a weakening in the general economic conditions in which the CGU operates.
11 Right-of-use assetsThe Group enters into various lease agreements as the lessee of property, equipment and vehicles. Where leases convey the right to control the use of the underlying leased assets, the Group classifies these leases as right-of-use assets in a consistent manner to its property, plant and equipment.
52 weeks to28 February
2021Rm
52 weeks to1 March
2020Rm
Reconciliation of carrying value of right-of-use assets
Carrying value at beginning of period 9 880.6 10 102.9 Additions 2 148.2 1 596.0 Depreciation (1 793.0) (1 646.9)
Property (1 496.9) (1 349.5) Equipment and vehicles (296.1) (297.4)
Other movements* (120.7) (139.5) Impairment (14.1) – Foreign currency translations (50.4) (31.9)
Carrying value at end of period 10 050.6 9 880.6
Comprising of:
Property 8 558.3 8 313.8 Equipment and vehicles 1 492.3 1 566.8
* Includes lease incentives received, remeasurements and termination of leases.
The Group treats each store as a separate CGU for impairment testing of right-of-use assets. The recoverable amount of each CGU is the higher of its value-in-use and its fair value less costs of disposal. Each CGU is tested for impairment at the reporting date to determine if any indicators of impairment have been identified. Impairment loss indicators include loss-making stores.
The recoverable amount for each CGU was determined based on value-in-use calculations. The value-in-use calculations discount cash flow forecasts at an appropriate pre-tax rate that reflects the specific risks of the relevant CGU. Cash flow forecasts are based on financial budgets (informed by past experience and the expected performance on the retail market in the relevant areas) approved by management.
The value-in-use was determined based on cash flow projections approved by management covering the relevant CGU’s refurbishment cycles, which averages between five and seven years. Cash flows beyond these planning periods were not extrapolated as significant cash investments in the CGUs would likely be required to generate future cash inflows. The pre-tax discount rate applied to these cash flow projections was 10.3% (2020: 15.0%). Management believes that any reasonable possible change in key assumptions on which these CGU’s recoverable amounts are based would not result in any additional significant impairment losses.
The impairment charge in the current financial year of R14.1 million (2020: Rnil) arose in two (2020: none) CGUs. These CGUs are individual owned stores, which are not material to the Group’s overall portfolio of stores. This impairment was as a result of a significant reduction in the future expected revenue of the CGU due to a weakening in the general economic conditions in which the CGU operates.
GROUP ANNUAL FINANCIAL STATEMENTS 02NOTES TO THE GROUP ANNUAL FINANCIAL STATEMENTS (continued)
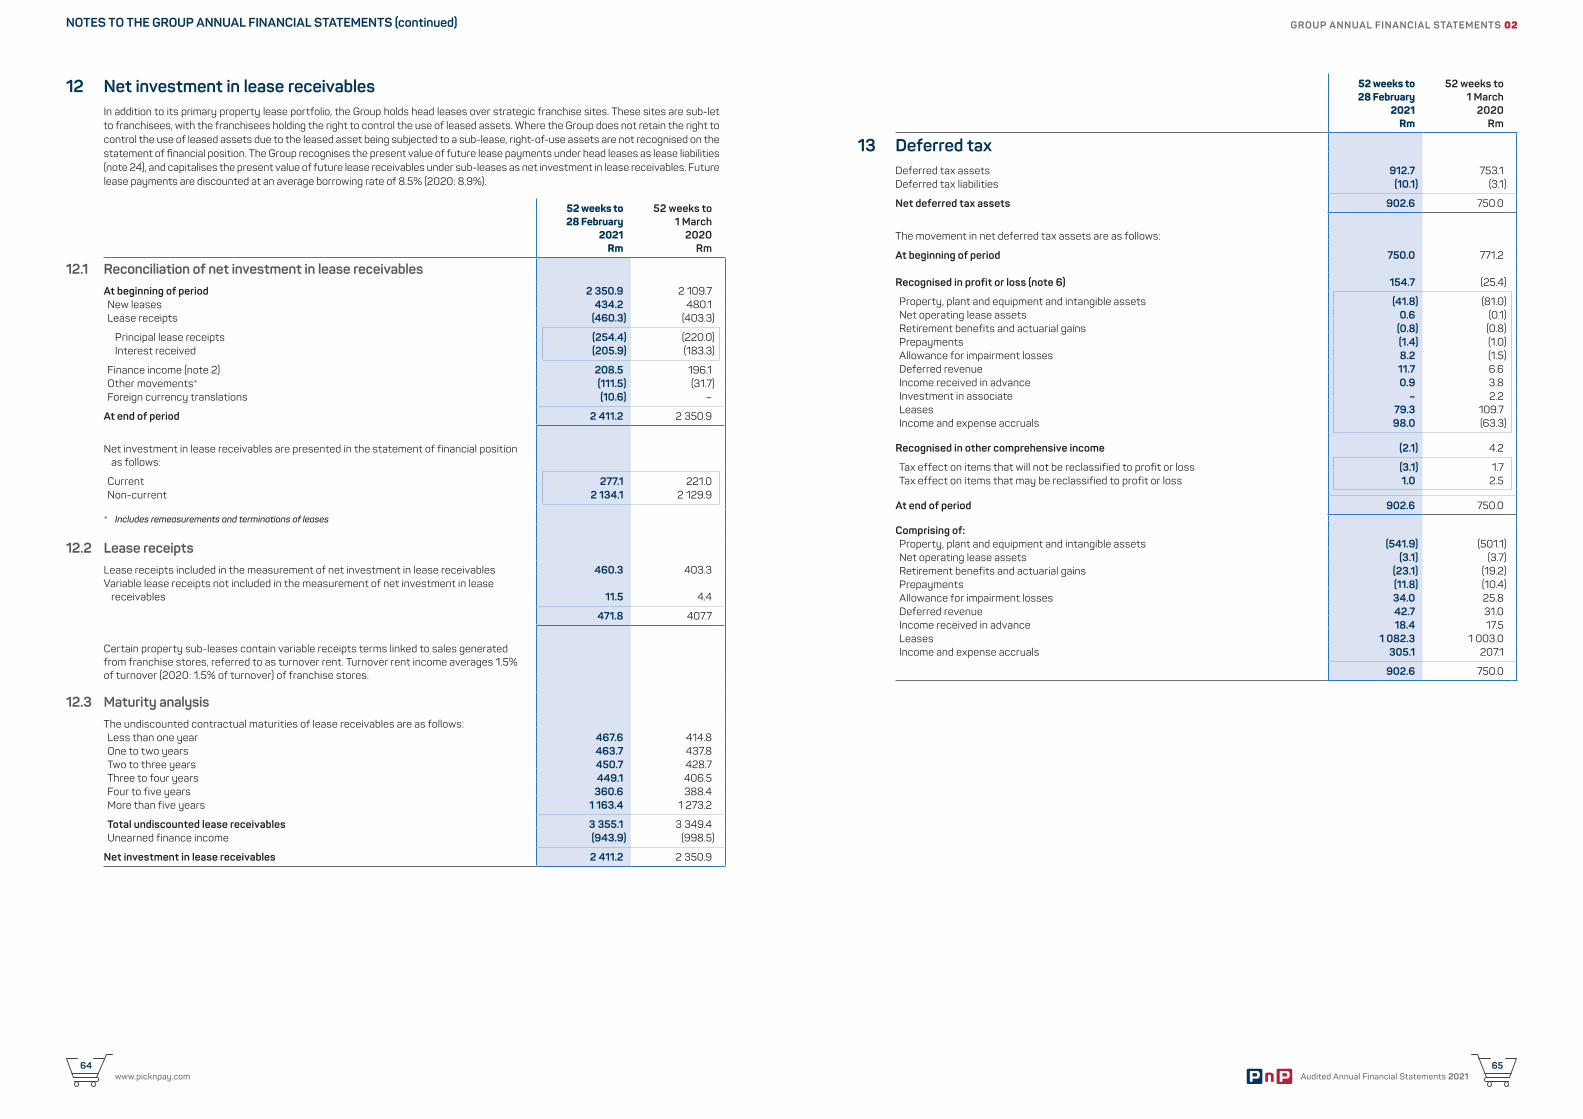
Audited Annual Financial Statements 202165
www.picknpay.com64
12 Net investment in lease receivablesIn addition to its primary property lease portfolio, the Group holds head leases over strategic franchise sites. These sites are sub-let to franchisees, with the franchisees holding the right to control the use of leased assets. Where the Group does not retain the right to control the use of leased assets due to the leased asset being subjected to a sub-lease, right-of-use assets are not recognised on the statement of financial position. The Group recognises the present value of future lease payments under head leases as lease liabilities (note 24), and capitalises the present value of future lease receivables under sub-leases as net investment in lease receivables. Future lease payments are discounted at an average borrowing rate of 8.5% (2020: 8.9%).
52 weeks to 28 February
2021Rm
52 weeks to1 March
2020Rm
12.1 Reconciliation of net investment in lease receivablesAt beginning of period 2 350.9 2 109.7 New leases 434.2 480.1 Lease receipts (460.3) (403.3)
Principal lease receipts (254.4) (220.0) Interest received (205.9) (183.3)
Finance income (note 2) 208.5 196.1 Other movements* (111.5) (31.7) Foreign currency translations (10.6) –
At end of period 2 411.2 2 350.9
Net investment in lease receivables are presented in the statement of financial position as follows:
Current 277.1 221.0 Non-current 2 134.1 2 129.9
* Includes remeasurements and terminations of leases
12.2 Lease receiptsLease receipts included in the measurement of net investment in lease receivables 460.3 403.3 Variable lease receipts not included in the measurement of net investment in lease
receivables 11.5 4.4
471.8 407.7
Certain property sub-leases contain variable receipts terms linked to sales generated from franchise stores, referred to as turnover rent. Turnover rent income averages 1.5% of turnover (2020: 1.5% of turnover) of franchise stores.
12.3 Maturity analysisThe undiscounted contractual maturities of lease receivables are as follows:Less than one year 467.6 414.8 One to two years 463.7 437.8 Two to three years 450.7 428.7 Three to four years 449.1 406.5 Four to five years 360.6 388.4 More than five years 1 163.4 1 273.2
Total undiscounted lease receivables 3 355.1 3 349.4 Unearned finance income (943.9) (998.5)
Net investment in lease receivables 2 411.2 2 350.9
52 weeks to 28 February
2021Rm
52 weeks to1 March
2020Rm
13 Deferred tax Deferred tax assets 912.7 753.1Deferred tax liabilities (10.1) (3.1)
Net deferred tax assets 902.6 750.0
The movement in net deferred tax assets are as follows:
At beginning of period 750.0 771.2
Recognised in profit or loss (note 6) 154.7 (25.4)
Property, plant and equipment and intangible assets (41.8) (81.0) Net operating lease assets 0.6 (0.1) Retirement benefits and actuarial gains (0.8) (0.8) Prepayments (1.4) (1.0) Allowance for impairment losses 8.2 (1.5) Deferred revenue 11.7 6.6 Income received in advance 0.9 3.8 Investment in associate – 2.2 Leases 79.3 109.7 Income and expense accruals 98.0 (63.3)
Recognised in other comprehensive income (2.1) 4.2
Tax effect on items that will not be reclassified to profit or loss (3.1) 1.7 Tax effect on items that may be reclassified to profit or loss 1.0 2.5
At end of period 902.6 750.0
Comprising of:Property, plant and equipment and intangible assets (541.9) (501.1) Net operating lease assets (3.1) (3.7) Retirement benefits and actuarial gains (23.1) (19.2) Prepayments (11.8) (10.4) Allowance for impairment losses 34.0 25.8 Deferred revenue 42.7 31.0 Income received in advance 18.4 17.5 Leases 1 082.3 1 003.0 Income and expense accruals 305.1 207.1
902.6 750.0
GROUP ANNUAL FINANCIAL STATEMENTS 02NOTES TO THE GROUP ANNUAL FINANCIAL STATEMENTS (continued)
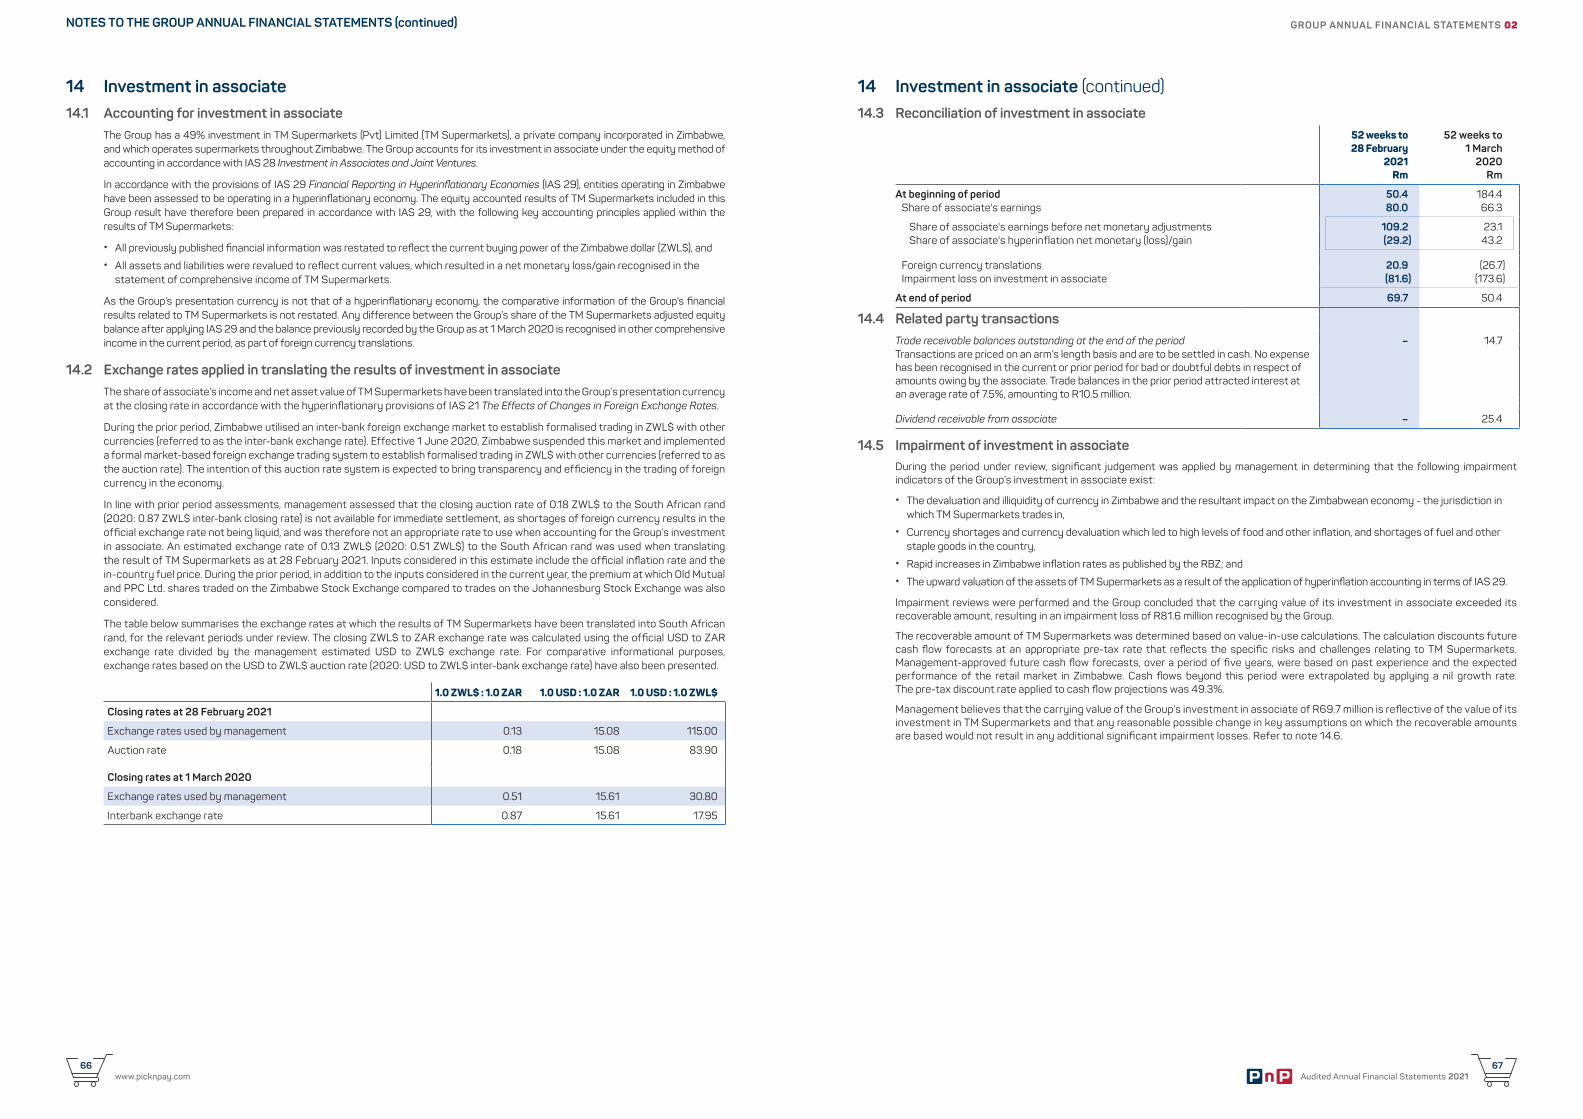
Audited Annual Financial Statements 202167
www.picknpay.com66
14 Investment in associate14.1 Accounting for investment in associate
The Group has a 49% investment in TM Supermarkets (Pvt) Limited (TM Supermarkets), a private company incorporated in Zimbabwe, and which operates supermarkets throughout Zimbabwe. The Group accounts for its investment in associate under the equity method of accounting in accordance with IAS 28 Investment in Associates and Joint Ventures.
In accordance with the provisions of IAS 29 Financial Reporting in Hyperinflationary Economies (IAS 29), entities operating in Zimbabwe have been assessed to be operating in a hyperinflationary economy. The equity accounted results of TM Supermarkets included in this Group result have therefore been prepared in accordance with IAS 29, with the following key accounting principles applied within the results of TM Supermarkets:
• All previously published financial information was restated to reflect the current buying power of the Zimbabwe dollar (ZWL$), and • All assets and liabilities were revalued to reflect current values, which resulted in a net monetary loss/gain recognised in the
statement of comprehensive income of TM Supermarkets.
As the Group’s presentation currency is not that of a hyperinflationary economy, the comparative information of the Group’s financial results related to TM Supermarkets is not restated. Any difference between the Group’s share of the TM Supermarkets adjusted equity balance after applying IAS 29 and the balance previously recorded by the Group as at 1 March 2020 is recognised in other comprehensive income in the current period, as part of foreign currency translations.
14.2 Exchange rates applied in translating the results of investment in associateThe share of associate’s income and net asset value of TM Supermarkets have been translated into the Group’s presentation currency at the closing rate in accordance with the hyperinflationary provisions of IAS 21 The Effects of Changes in Foreign Exchange Rates.
During the prior period, Zimbabwe utilised an inter-bank foreign exchange market to establish formalised trading in ZWL$ with other currencies (referred to as the inter-bank exchange rate). Effective 1 June 2020, Zimbabwe suspended this market and implemented a formal market-based foreign exchange trading system to establish formalised trading in ZWL$ with other currencies (referred to as the auction rate). The intention of this auction rate system is expected to bring transparency and efficiency in the trading of foreign currency in the economy.
In line with prior period assessments, management assessed that the closing auction rate of 0.18 ZWL$ to the South African rand (2020: 0.87 ZWL$ inter-bank closing rate) is not available for immediate settlement, as shortages of foreign currency results in the official exchange rate not being liquid, and was therefore not an appropriate rate to use when accounting for the Group’s investment in associate. An estimated exchange rate of 0.13 ZWL$ (2020: 0.51 ZWL$) to the South African rand was used when translating the result of TM Supermarkets as at 28 February 2021. Inputs considered in this estimate include the official inflation rate and the in-country fuel price. During the prior period, in addition to the inputs considered in the current year, the premium at which Old Mutual and PPC Ltd. shares traded on the Zimbabwe Stock Exchange compared to trades on the Johannesburg Stock Exchange was also considered.
The table below summarises the exchange rates at which the results of TM Supermarkets have been translated into South African rand, for the relevant periods under review. The closing ZWL$ to ZAR exchange rate was calculated using the official USD to ZAR exchange rate divided by the management estimated USD to ZWL$ exchange rate. For comparative informational purposes, exchange rates based on the USD to ZWL$ auction rate (2020: USD to ZWL$ inter-bank exchange rate) have also been presented.
1.0 ZWL$ : 1.0 ZAR 1.0 USD : 1.0 ZAR 1.0 USD : 1.0 ZWL$
Closing rates at 28 February 2021
Exchange rates used by management 0.13 15.08 115.00
Auction rate 0.18 15.08 83.90
Closing rates at 1 March 2020
Exchange rates used by management 0.51 15.61 30.80
Interbank exchange rate 0.87 15.61 17.95
14 Investment in associate (continued)14.3 Reconciliation of investment in associate
52 weeks to 28 February
2021Rm
52 weeks to1 March
2020Rm
At beginning of period 50.4 184.4 Share of associate's earnings 80.0 66.3
Share of associate's earnings before net monetary adjustments 109.2 23.1 Share of associate's hyperinflation net monetary (loss)/gain (29.2) 43.2
Foreign currency translations 20.9 (26.7) Impairment loss on investment in associate (81.6) (173.6)
At end of period 69.7 50.4
14.4 Related party transactionsTrade receivable balances outstanding at the end of the period – 14.7 Transactions are priced on an arm’s length basis and are to be settled in cash. No expense has been recognised in the current or prior period for bad or doubtful debts in respect of amounts owing by the associate. Trade balances in the prior period attracted interest at an average rate of 7.5%, amounting to R10.5 million.
Dividend receivable from associate – 25.4
14.5 Impairment of investment in associate During the period under review, significant judgement was applied by management in determining that the following impairment indicators of the Group’s investment in associate exist:
• The devaluation and illiquidity of currency in Zimbabwe and the resultant impact on the Zimbabwean economy - the jurisdiction in which TM Supermarkets trades in,
• Currency shortages and currency devaluation which led to high levels of food and other inflation, and shortages of fuel and other staple goods in the country,
• Rapid increases in Zimbabwe inflation rates as published by the RBZ; and • The upward valuation of the assets of TM Supermarkets as a result of the application of hyperinflation accounting in terms of IAS 29.
Impairment reviews were performed and the Group concluded that the carrying value of its investment in associate exceeded its recoverable amount, resulting in an impairment loss of R81.6 million recognised by the Group.
The recoverable amount of TM Supermarkets was determined based on value-in-use calculations. The calculation discounts future cash flow forecasts at an appropriate pre-tax rate that reflects the specific risks and challenges relating to TM Supermarkets. Management-approved future cash flow forecasts, over a period of five years, were based on past experience and the expected performance of the retail market in Zimbabwe. Cash flows beyond this period were extrapolated by applying a nil growth rate. The pre-tax discount rate applied to cash flow projections was 49.3%.
Management believes that the carrying value of the Group’s investment in associate of R69.7 million is reflective of the value of its investment in TM Supermarkets and that any reasonable possible change in key assumptions on which the recoverable amounts are based would not result in any additional significant impairment losses. Refer to note 14.6.
GROUP ANNUAL FINANCIAL STATEMENTS 02NOTES TO THE GROUP ANNUAL FINANCIAL STATEMENTS (continued)
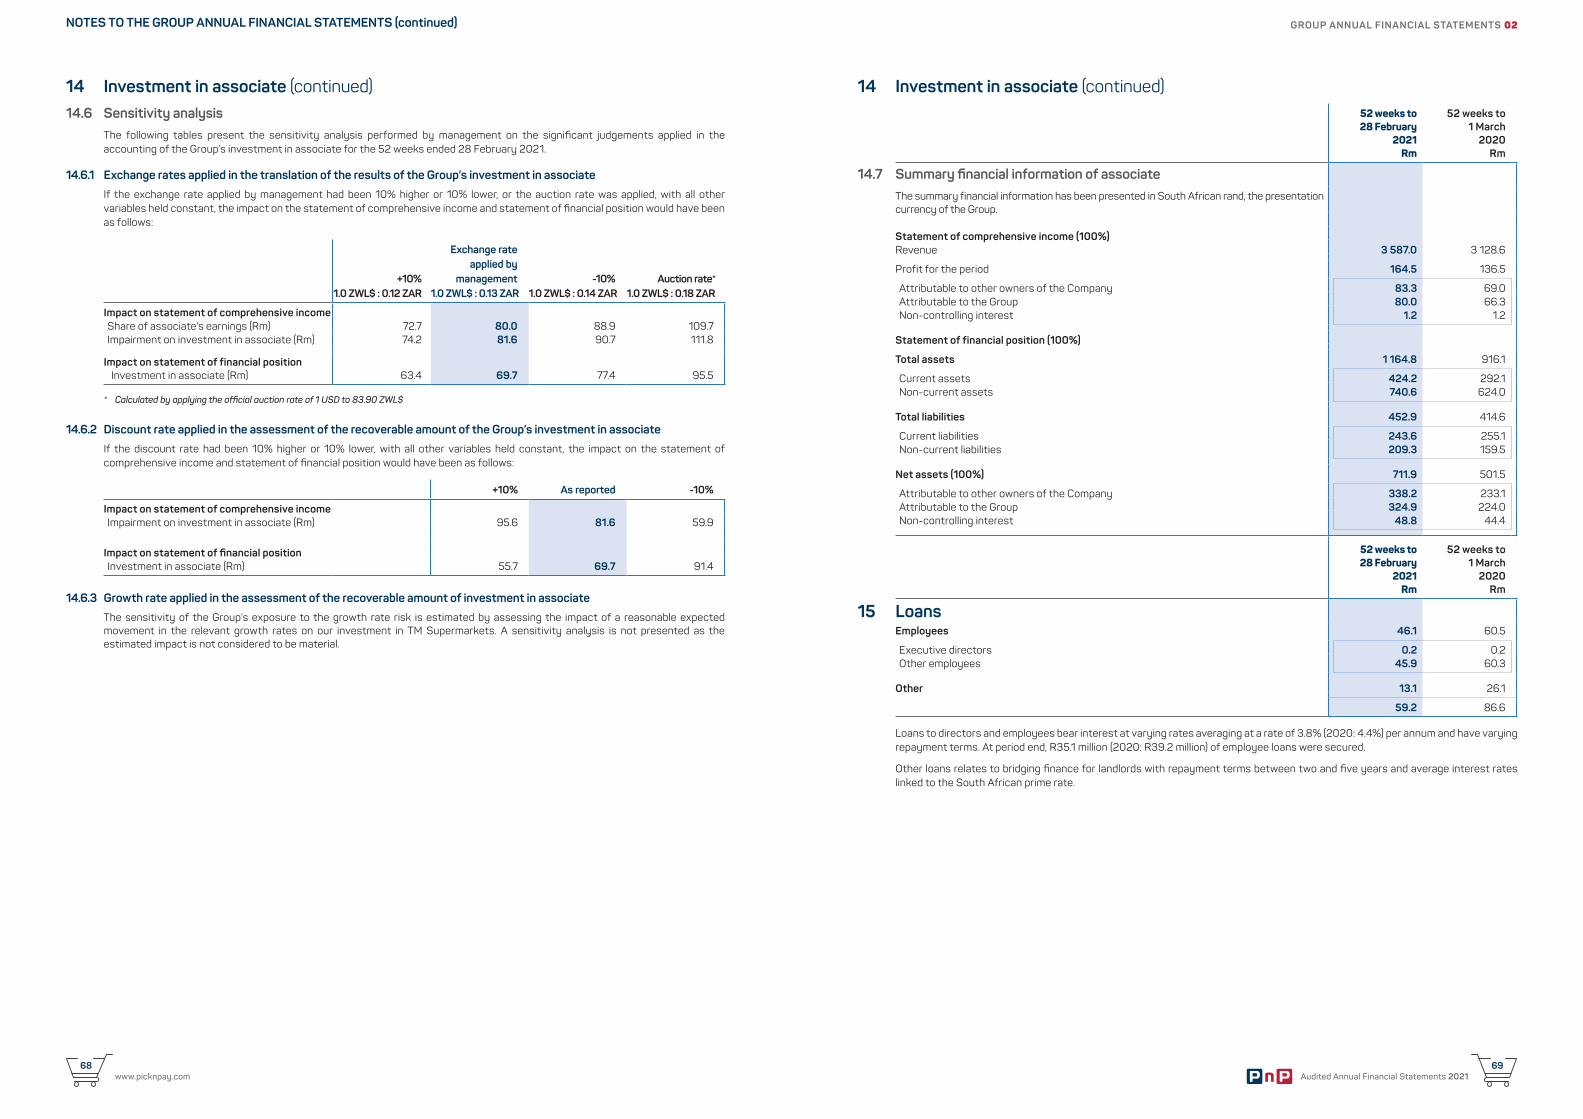
Audited Annual Financial Statements 202169
www.picknpay.com68
14 Investment in associate (continued)14.6 Sensitivity analysis
The following tables present the sensitivity analysis performed by management on the significant judgements applied in the accounting of the Group’s investment in associate for the 52 weeks ended 28 February 2021.
14.6.1 Exchange rates applied in the translation of the results of the Group’s investment in associate
If the exchange rate applied by management had been 10% higher or 10% lower, or the auction rate was applied, with all other variables held constant, the impact on the statement of comprehensive income and statement of financial position would have been as follows:
+10%1.0 ZWL$ : 0.12 ZAR
Exchange rateapplied by
management1.0 ZWL$ : 0.13 ZAR
-10%1.0 ZWL$ : 0.14 ZAR
Auction rate*1.0 ZWL$ : 0.18 ZAR
Impact on statement of comprehensive income Share of associate's earnings (Rm) 72.7 80.0 88.9 109.7Impairment on investment in associate (Rm) 74.2 81.6 90.7 111.8
Impact on statement of financial position Investment in associate (Rm) 63.4 69.7 77.4 95.5
* Calculated by applying the official auction rate of 1 USD to 83.90 ZWL$
14.6.2 Discount rate applied in the assessment of the recoverable amount of the Group’s investment in associate
If the discount rate had been 10% higher or 10% lower, with all other variables held constant, the impact on the statement of comprehensive income and statement of financial position would have been as follows:
+10% As reported -10%
Impact on statement of comprehensive incomeImpairment on investment in associate (Rm) 95.6 81.6 59.9
Impact on statement of financial positionInvestment in associate (Rm) 55.7 69.7 91.4
14.6.3 Growth rate applied in the assessment of the recoverable amount of investment in associate
The sensitivity of the Group’s exposure to the growth rate risk is estimated by assessing the impact of a reasonable expected movement in the relevant growth rates on our investment in TM Supermarkets. A sensitivity analysis is not presented as the estimated impact is not considered to be material.
14 Investment in associate (continued) 52 weeks to 28 February
2021Rm
52 weeks to 1 March
2020Rm
14.7 Summary financial information of associateThe summary financial information has been presented in South African rand, the presentation currency of the Group.
Statement of comprehensive income (100%)Revenue 3 587.0 3 128.6
Profit for the period 164.5 136.5
Attributable to other owners of the Company 83.3 69.0 Attributable to the Group 80.0 66.3 Non-controlling interest 1.2 1.2
Statement of financial position (100%)
Total assets 1 164.8 916.1
Current assets 424.2 292.1 Non-current assets 740.6 624.0
Total liabilities 452.9 414.6
Current liabilities 243.6 255.1 Non-current liabilities 209.3 159.5
Net assets (100%) 711.9 501.5
Attributable to other owners of the Company 338.2 233.1 Attributable to the Group 324.9 224.0 Non-controlling interest 48.8 44.4
52 weeks to 28 February
2021Rm
52 weeks to 1 March
2020Rm
15 LoansEmployees 46.1 60.5
Executive directors 0.2 0.2Other employees 45.9 60.3
Other 13.1 26.1
59.2 86.6
Loans to directors and employees bear interest at varying rates averaging at a rate of 3.8% (2020: 4.4%) per annum and have varying repayment terms. At period end, R35.1 million (2020: R39.2 million) of employee loans were secured.
Other loans relates to bridging finance for landlords with repayment terms between two and five years and average interest rates linked to the South African prime rate.
GROUP ANNUAL FINANCIAL STATEMENTS 02NOTES TO THE GROUP ANNUAL FINANCIAL STATEMENTS (continued)
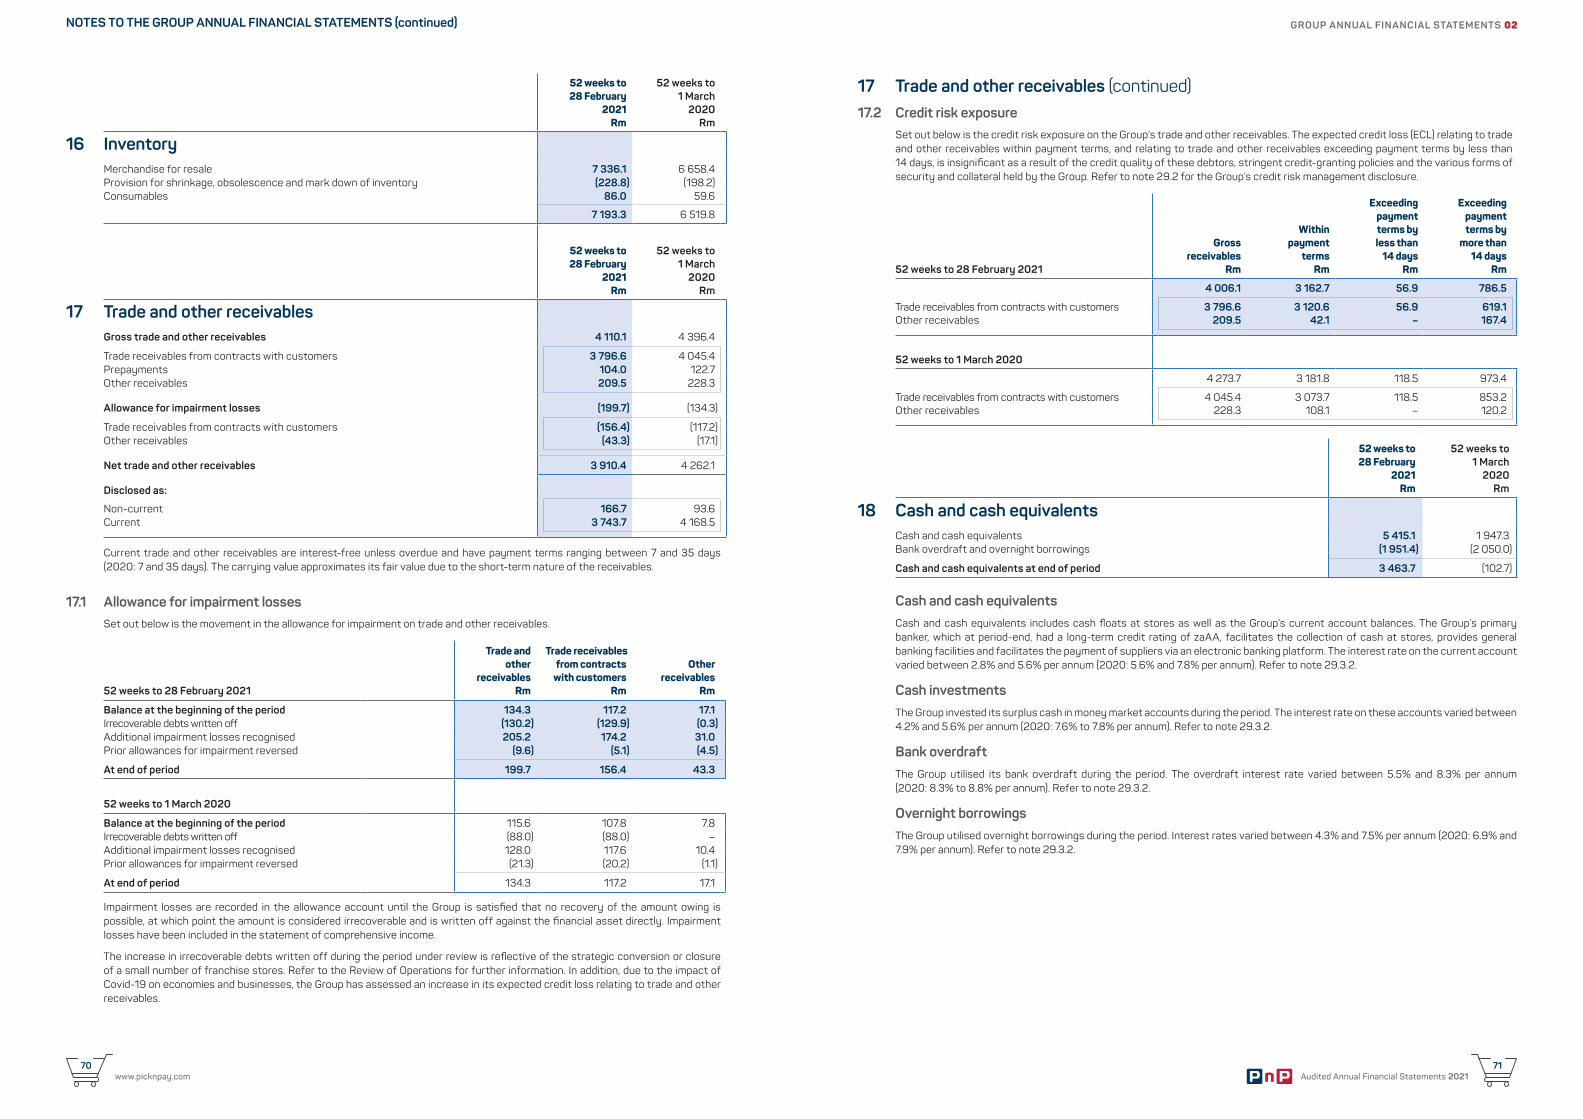
Audited Annual Financial Statements 202171
www.picknpay.com70
52 weeks to 28 February
2021Rm
52 weeks to 1 March
2020Rm
16 InventoryMerchandise for resale 7 336.1 6 658.4 Provision for shrinkage, obsolescence and mark down of inventory (228.8) (198.2) Consumables 86.0 59.6
7 193.3 6 519.8
52 weeks to28 February
2021Rm
52 weeks to1 March
2020Rm
17 Trade and other receivablesGross trade and other receivables 4 110.1 4 396.4
Trade receivables from contracts with customers 3 796.6 4 045.4 Prepayments 104.0 122.7 Other receivables 209.5 228.3
Allowance for impairment losses (199.7) (134.3)
Trade receivables from contracts with customers (156.4) (117.2) Other receivables (43.3) (17.1)
Net trade and other receivables 3 910.4 4 262.1
Disclosed as:
Non-current 166.7 93.6 Current 3 743.7 4 168.5
Current trade and other receivables are interest-free unless overdue and have payment terms ranging between 7 and 35 days (2020: 7 and 35 days). The carrying value approximates its fair value due to the short-term nature of the receivables.
17.1 Allowance for impairment lossesSet out below is the movement in the allowance for impairment on trade and other receivables.
52 weeks to 28 February 2021
Trade andother
receivables Rm
Trade receivables from contracts
with customers Rm
Other receivables
Rm
Balance at the beginning of the period 134.3 117.2 17.1 Irrecoverable debts written off (130.2) (129.9) (0.3) Additional impairment losses recognised 205.2 174.2 31.0 Prior allowances for impairment reversed (9.6) (5.1) (4.5)
At end of period 199.7 156.4 43.3
52 weeks to 1 March 2020
Balance at the beginning of the period 115.6 107.8 7.8 Irrecoverable debts written off (88.0) (88.0) –Additional impairment losses recognised 128.0 117.6 10.4 Prior allowances for impairment reversed (21.3) (20.2) (1.1)
At end of period 134.3 117.2 17.1
Impairment losses are recorded in the allowance account until the Group is satisfied that no recovery of the amount owing is possible, at which point the amount is considered irrecoverable and is written off against the financial asset directly. Impairment losses have been included in the statement of comprehensive income.
The increase in irrecoverable debts written off during the period under review is reflective of the strategic conversion or closure of a small number of franchise stores. Refer to the Review of Operations for further information. In addition, due to the impact of Covid-19 on economies and businesses, the Group has assessed an increase in its expected credit loss relating to trade and other receivables.
17 Trade and other receivables (continued)17.2 Credit risk exposure
Set out below is the credit risk exposure on the Group’s trade and other receivables. The expected credit loss (ECL) relating to trade and other receivables within payment terms, and relating to trade and other receivables exceeding payment terms by less than 14 days, is insignificant as a result of the credit quality of these debtors, stringent credit-granting policies and the various forms of security and collateral held by the Group. Refer to note 29.2 for the Group’s credit risk management disclosure.
52 weeks to 28 February 2021
Gross receivables
Rm
Within payment
terms Rm
Exceedingpaymentterms by less than
14 days Rm
Exceedingpaymentterms by
more than14 days
Rm
4 006.1 3 162.7 56.9 786.5
Trade receivables from contracts with customers 3 796.6 3 120.6 56.9 619.1 Other receivables 209.5 42.1 – 167.4
52 weeks to 1 March 2020
4 273.7 3 181.8 118.5 973.4
Trade receivables from contracts with customers 4 045.4 3 073.7 118.5 853.2 Other receivables 228.3 108.1 – 120.2
52 weeks to 28 February
2021Rm
52 weeks to1 March
2020Rm
18 Cash and cash equivalentsCash and cash equivalents 5 415.1 1 947.3 Bank overdraft and overnight borrowings (1 951.4) (2 050.0)
Cash and cash equivalents at end of period 3 463.7 (102.7)
Cash and cash equivalentsCash and cash equivalents includes cash floats at stores as well as the Group’s current account balances. The Group’s primary banker, which at period-end, had a long-term credit rating of zaAA, facilitates the collection of cash at stores, provides general banking facilities and facilitates the payment of suppliers via an electronic banking platform. The interest rate on the current account varied between 2.8% and 5.6% per annum (2020: 5.6% and 7.8% per annum). Refer to note 29.3.2.
Cash investmentsThe Group invested its surplus cash in money market accounts during the period. The interest rate on these accounts varied between 4.2% and 5.6% per annum (2020: 7.6% to 7.8% per annum). Refer to note 29.3.2.
Bank overdraftThe Group utilised its bank overdraft during the period. The overdraft interest rate varied between 5.5% and 8.3% per annum (2020: 8.3% to 8.8% per annum). Refer to note 29.3.2.
Overnight borrowingsThe Group utilised overnight borrowings during the period. Interest rates varied between 4.3% and 7.5% per annum (2020: 6.9% and 7.9% per annum). Refer to note 29.3.2.
GROUP ANNUAL FINANCIAL STATEMENTS 02NOTES TO THE GROUP ANNUAL FINANCIAL STATEMENTS (continued)
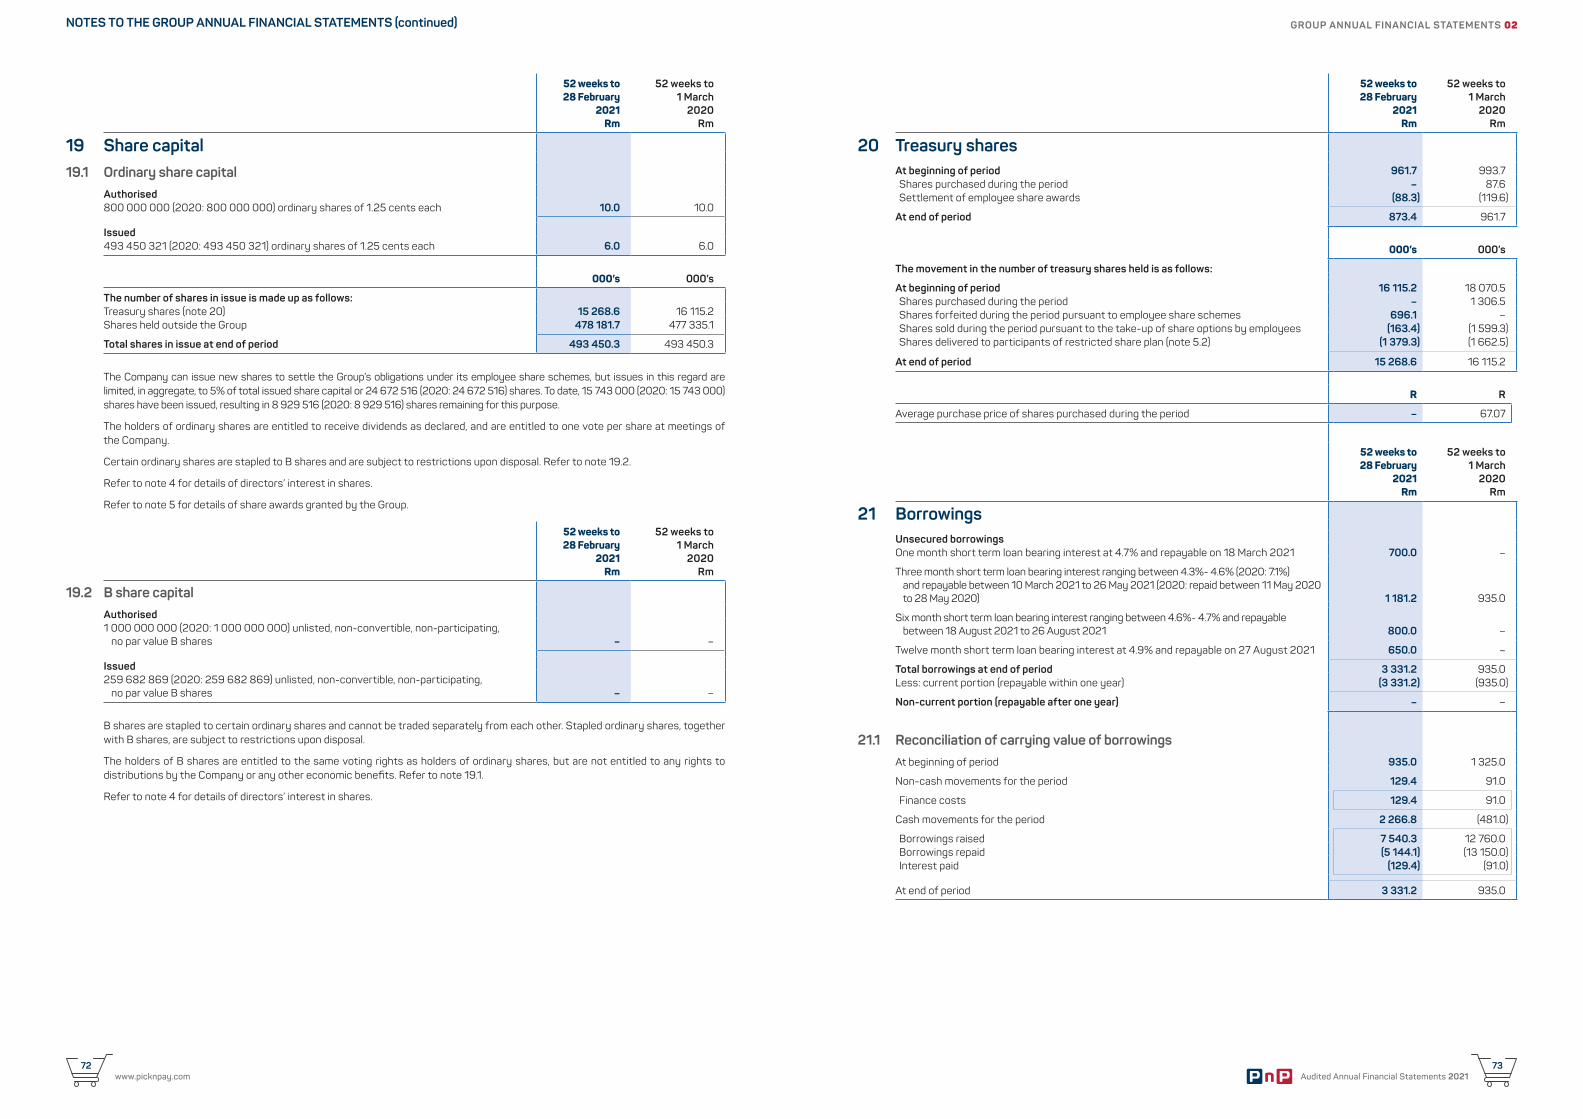
Audited Annual Financial Statements 202173
www.picknpay.com72
52 weeks to 28 February
2021Rm
52 weeks to1 March
2020Rm
19 Share capital19.1 Ordinary share capital
Authorised800 000 000 (2020: 800 000 000) ordinary shares of 1.25 cents each 10.0 10.0
Issued493 450 321 (2020: 493 450 321) ordinary shares of 1.25 cents each 6.0 6.0
000’s 000’s
The number of shares in issue is made up as follows:Treasury shares (note 20) 15 268.6 16 115.2 Shares held outside the Group 478 181.7 477 335.1
Total shares in issue at end of period 493 450.3 493 450.3
The Company can issue new shares to settle the Group’s obligations under its employee share schemes, but issues in this regard are limited, in aggregate, to 5% of total issued share capital or 24 672 516 (2020: 24 672 516) shares. To date, 15 743 000 (2020: 15 743 000) shares have been issued, resulting in 8 929 516 (2020: 8 929 516) shares remaining for this purpose.
The holders of ordinary shares are entitled to receive dividends as declared, and are entitled to one vote per share at meetings of the Company.
Certain ordinary shares are stapled to B shares and are subject to restrictions upon disposal. Refer to note 19.2.
Refer to note 4 for details of directors’ interest in shares.
Refer to note 5 for details of share awards granted by the Group.
52 weeks to 28 February
2021Rm
52 weeks to1 March
2020Rm
19.2 B share capitalAuthorised1 000 000 000 (2020: 1 000 000 000) unlisted, non-convertible, non-participating,
no par value B shares – –
Issued259 682 869 (2020: 259 682 869) unlisted, non-convertible, non-participating,
no par value B shares – –
B shares are stapled to certain ordinary shares and cannot be traded separately from each other. Stapled ordinary shares, together with B shares, are subject to restrictions upon disposal.
The holders of B shares are entitled to the same voting rights as holders of ordinary shares, but are not entitled to any rights to distributions by the Company or any other economic benefits. Refer to note 19.1.
Refer to note 4 for details of directors’ interest in shares.
52 weeks to 28 February
2021Rm
52 weeks to1 March
2020Rm
20 Treasury sharesAt beginning of period 961.7 993.7 Shares purchased during the period – 87.6Settlement of employee share awards (88.3) (119.6)
At end of period 873.4 961.7
000’s 000’s
The movement in the number of treasury shares held is as follows:
At beginning of period 16 115.2 18 070.5 Shares purchased during the period – 1 306.5 Shares forfeited during the period pursuant to employee share schemes 696.1 –Shares sold during the period pursuant to the take-up of share options by employees (163.4) (1 599.3) Shares delivered to participants of restricted share plan (note 5.2) (1 379.3) (1 662.5)
At end of period 15 268.6 16 115.2
R R
Average purchase price of shares purchased during the period – 67.07
52 weeks to 28 February
2021Rm
52 weeks to1 March
2020Rm
21 BorrowingsUnsecured borrowingsOne month short term loan bearing interest at 4.7% and repayable on 18 March 2021 700.0 –
Three month short term loan bearing interest ranging between 4.3%- 4.6% (2020: 7.1%) and repayable between 10 March 2021 to 26 May 2021 (2020: repaid between 11 May 2020 to 28 May 2020) 1 181.2 935.0
Six month short term loan bearing interest ranging between 4.6%- 4.7% and repayable between 18 August 2021 to 26 August 2021 800.0 –
Twelve month short term loan bearing interest at 4.9% and repayable on 27 August 2021 650.0 –
Total borrowings at end of period 3 331.2 935.0 Less: current portion (repayable within one year) (3 331.2) (935.0)
Non-current portion (repayable after one year) – –
21.1 Reconciliation of carrying value of borrowingsAt beginning of period 935.0 1 325.0
Non-cash movements for the period 129.4 91.0
Finance costs 129.4 91.0
Cash movements for the period 2 266.8 (481.0)
Borrowings raised 7 540.3 12 760.0 Borrowings repaid (5 144.1) (13 150.0) Interest paid (129.4) (91.0)
At end of period 3 331.2 935.0
GROUP ANNUAL FINANCIAL STATEMENTS 02NOTES TO THE GROUP ANNUAL FINANCIAL STATEMENTS (continued)
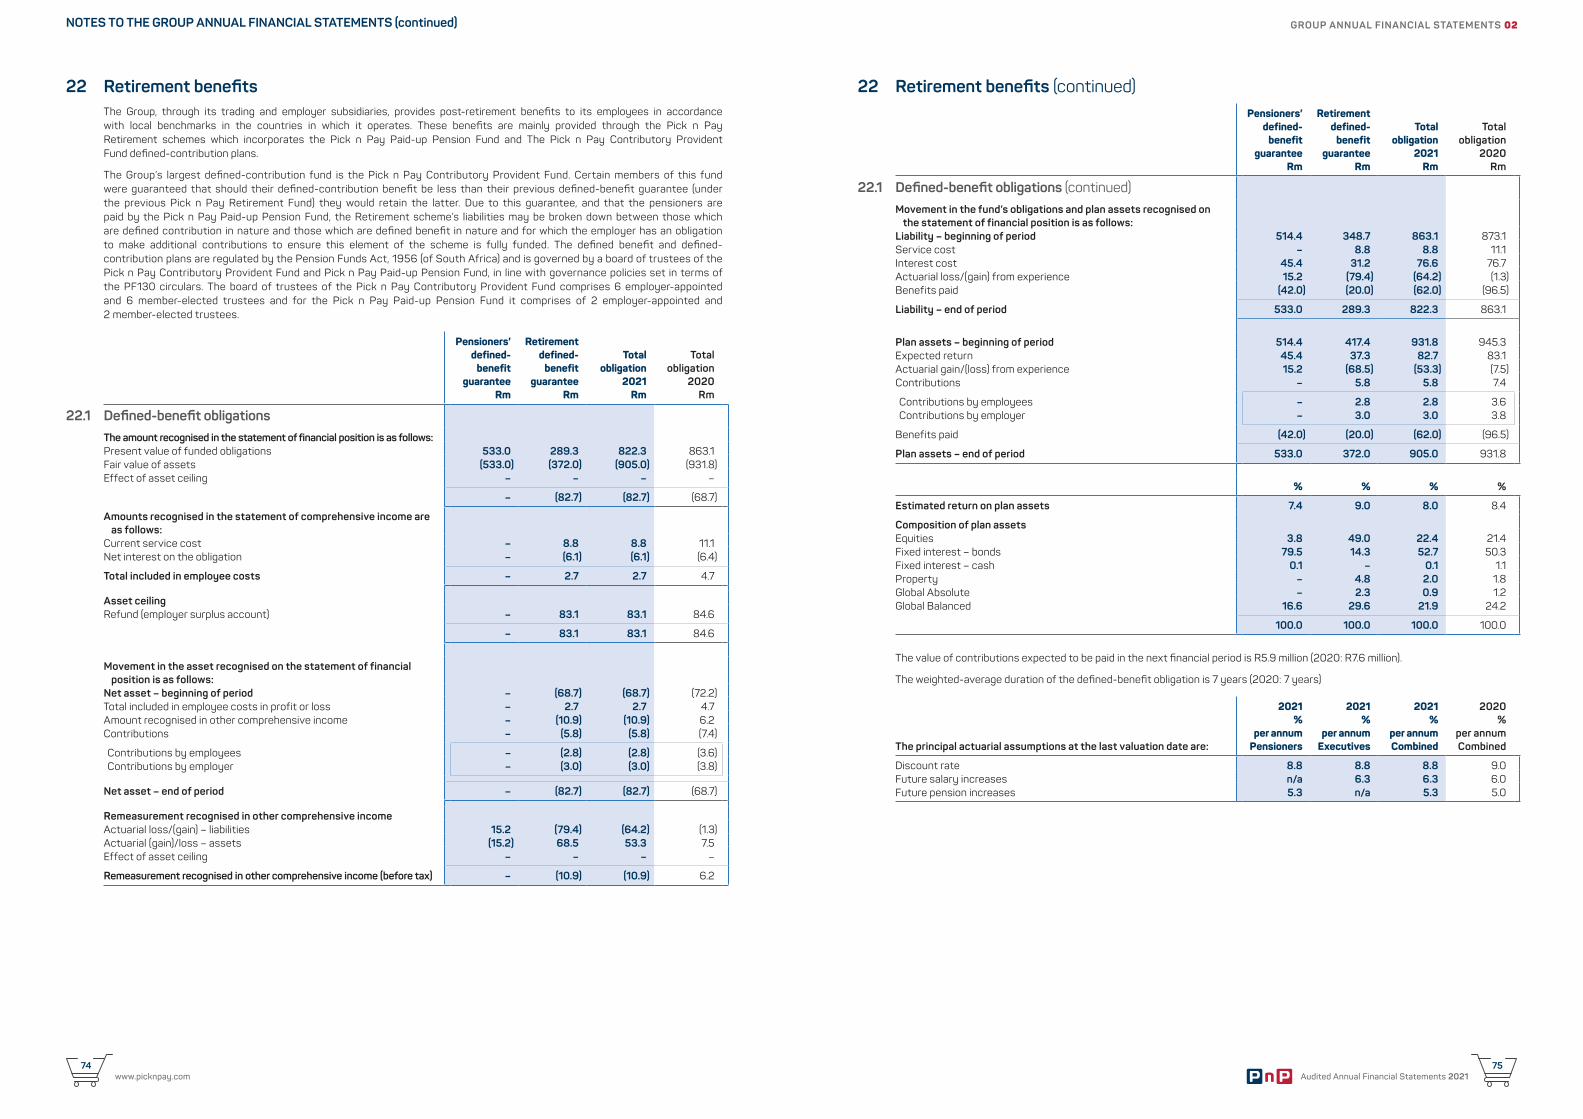
Audited Annual Financial Statements 202175
www.picknpay.com74
22 Retirement benefits (continued)Pensioners’
defined-benefit
guaranteeRm
Retirement defined-
benefit guarantee
Rm
Totalobligation
2021Rm
Totalobligation
2020Rm
22.1 Defined-benefit obligations (continued)Movement in the fund’s obligations and plan assets recognised on
the statement of financial position is as follows:Liability – beginning of period 514.4 348.7 863.1 873.1 Service cost – 8.8 8.8 11.1 Interest cost 45.4 31.2 76.6 76.7 Actuarial loss/(gain) from experience 15.2 (79.4) (64.2) (1.3)Benefits paid (42.0) (20.0) (62.0) (96.5)
Liability – end of period 533.0 289.3 822.3 863.1
Plan assets – beginning of period 514.4 417.4 931.8 945.3 Expected return 45.4 37.3 82.7 83.1 Actuarial gain/(loss) from experience 15.2 (68.5) (53.3) (7.5)Contributions – 5.8 5.8 7.4
Contributions by employees – 2.8 2.8 3.6 Contributions by employer – 3.0 3.0 3.8
Benefits paid (42.0) (20.0) (62.0) (96.5)
Plan assets – end of period 533.0 372.0 905.0 931.8
% % % %
Estimated return on plan assets 7.4 9.0 8.0 8.4
Composition of plan assetsEquities 3.8 49.0 22.4 21.4 Fixed interest – bonds 79.5 14.3 52.7 50.3 Fixed interest – cash 0.1 – 0.1 1.1 Property – 4.8 2.0 1.8 Global Absolute – 2.3 0.9 1.2 Global Balanced 16.6 29.6 21.9 24.2
100.0 100.0 100.0 100.0
The value of contributions expected to be paid in the next financial period is R5.9 million (2020: R7.6 million).
The weighted-average duration of the defined-benefit obligation is 7 years (2020: 7 years)
The principal actuarial assumptions at the last valuation date are:
2021 %
per annum Pensioners
2021 %
per annum Executives
2021%
per annum Combined
2020%
per annum Combined
Discount rate 8.8 8.8 8.8 9.0 Future salary increases n/a 6.3 6.3 6.0 Future pension increases 5.3 n/a 5.3 5.0
22 Retirement benefitsThe Group, through its trading and employer subsidiaries, provides post-retirement benefits to its employees in accordance with local benchmarks in the countries in which it operates. These benefits are mainly provided through the Pick n Pay Retirement schemes which incorporates the Pick n Pay Paid-up Pension Fund and The Pick n Pay Contributory Provident Fund defined-contribution plans.
The Group’s largest defined-contribution fund is the Pick n Pay Contributory Provident Fund. Certain members of this fund were guaranteed that should their defined-contribution benefit be less than their previous defined-benefit guarantee (under the previous Pick n Pay Retirement Fund) they would retain the latter. Due to this guarantee, and that the pensioners are paid by the Pick n Pay Paid-up Pension Fund, the Retirement scheme’s liabilities may be broken down between those which are defined contribution in nature and those which are defined benefit in nature and for which the employer has an obligation to make additional contributions to ensure this element of the scheme is fully funded. The defined benefit and defined-contribution plans are regulated by the Pension Funds Act, 1956 (of South Africa) and is governed by a board of trustees of the Pick n Pay Contributory Provident Fund and Pick n Pay Paid-up Pension Fund, in line with governance policies set in terms of the PF130 circulars. The board of trustees of the Pick n Pay Contributory Provident Fund comprises 6 employer-appointed and 6 member-elected trustees and for the Pick n Pay Paid-up Pension Fund it comprises of 2 employer-appointed and 2 member-elected trustees.
Pensioners’ defined-
benefit guarantee
Rm
Retirement defined-
benefit guarantee
Rm
Totalobligation
2021Rm
Totalobligation
2020Rm
22.1 Defined-benefit obligationsThe amount recognised in the statement of financial position is as follows:Present value of funded obligations 533.0 289.3 822.3 863.1 Fair value of assets (533.0) (372.0) (905.0) (931.8)Effect of asset ceiling – – – –
– (82.7) (82.7) (68.7)
Amounts recognised in the statement of comprehensive income are as follows:
Current service cost – 8.8 8.8 11.1 Net interest on the obligation – (6.1) (6.1) (6.4)
Total included in employee costs – 2.7 2.7 4.7
Asset ceiling Refund (employer surplus account) – 83.1 83.1 84.6
– 83.1 83.1 84.6
Movement in the asset recognised on the statement of financial position is as follows:
Net asset – beginning of period – (68.7) (68.7) (72.2)Total included in employee costs in profit or loss – 2.7 2.7 4.7 Amount recognised in other comprehensive income – (10.9) (10.9) 6.2 Contributions – (5.8) (5.8) (7.4)
Contributions by employees – (2.8) (2.8) (3.6)Contributions by employer – (3.0) (3.0) (3.8)
Net asset – end of period – (82.7) (82.7) (68.7)
Remeasurement recognised in other comprehensive incomeActuarial loss/(gain) – liabilities 15.2 (79.4) (64.2) (1.3)Actuarial (gain)/loss – assets (15.2) 68.5 53.3 7.5 Effect of asset ceiling – – – –
Remeasurement recognised in other comprehensive income (before tax) – (10.9) (10.9) 6.2
GROUP ANNUAL FINANCIAL STATEMENTS 02NOTES TO THE GROUP ANNUAL FINANCIAL STATEMENTS (continued)

Audited Annual Financial Statements 202177
www.picknpay.com76
22 Retirement benefits (continued)22.1 Defined-benefit obligations (continued)
Sensitivity analysisAt 28 February 2021, if either the discount rate, salary inflation or pension increase had been 1% higher or 1% lower (with all other variables held constant), the impact on the financial statements would have been as follows:
Discount rate effect Salary inflation effect Pension increase effect
-1%7.8%
Rm
Asreported
8.8%Rm
+1%9.8%
Rm
-1%5.3%
Rm
Asreported
6.3%Rm
+1%7.3%
Rm
-1%4.3%
Rm
Asreported
5.3%Rm
+1%6.3%
Rm
Statement of comprehensive incomeEmployee costs 4.0 2.7 2.3 2.5 2.7 3.0 n/a n/a n/a
Statement of financial positionAsset at end of period (41.5) (82.7) (82.7) (82.7) (82.7) (73.1) (82.7) (82.7) (82.7)
The following assumptions were used in the sensitivity analysis:
• The effect of a 1% change in the discount rate and a 1% change in the salary inflation rate were assessed independently of each other; • As the minimum guarantee is applicable to Pick n Pay Non-contributory Provident Fund members, the liability is unaffected by
changes in the pension increase rate or by changes in mortality; • The pension liability is also similarly unaffected by changes in the pension increase rate or by changes in mortality as the value of
the notional pensioner account is much higher than the pensioner liability.
The above assumptions are limited in that they do not cater for extreme events.
52 weeks to 28 February
2021Rm
52 weeks to 1 March
2020Rm
22.2 Defined current contribution benefitsCurrent contributions (refer to note 3.1) 284.1 284.3
52 weeks to 28 February
2021Rm
52 weeks to 1 March
2020Rm
23 Trade and other payablesTrade and other payables 12 198.8 11 255.2
Trade and other payables are settled within 60 days. Included in trade and other payables are leave pay obligations and value-added tax (VAT) which are not considered to be financial instruments. Refer to note 29.
24 Lease liabilitiesThe Group enters into various lease agreements as the lessee of property, equipment and vehicles. Where leases convey the right to control the use of underlying leased assets, the Group recognises the present value of future lease payments under the lease contract as lease liabilities. Future lease payments are discounted at an average borrowing rate of 8.6% (2020: 8.9%).
52 weeks to 28 February
2021Rm
52 weeks to1 March
2020Rm
24.1 Reconciliation of lease liabilitiesAt beginning of period 15 905.2 15 311.9 New leases 2 582.4 2 076.1 Lease payments (3 196.4) (2 799.5)
Principal lease liability payments (1 677.0) (1 487.4) Interest paid (1 519.4) (1 312.1)
Rent concessions (54.9) –Finance costs (note 3) 1 386.2 1 382.5 Other movements* (179.8) (76.7) Foreign currency translations (83.3) 10.9
At end of period 16 359.4 15 905.2
Lease liabilities are presented in the statement of financial position as follows:
Current 2 046.8 1 716.7 Non-current 14 312.6 14 188.5
* Includes remeasurements and terminations of leases
24.2 Lease paymentsLease payments included in the measurement of lease liabilities 3 196.4 2 799.5 Variable lease payments not included in the measurement of lease liabilities 50.9 30.3 Short-term and low value lease payments 31.7 23.1
3 279.0 2 852.9
Certain property head leases contain variable payment terms linked to sales generated from retail owned stores, referred to as turnover rent. Turnover rent expense averages 1.5% of turnover (2020: 1.5% of turnover).
24.3 Maturity analysisThe undiscounted contractual maturities of lease liabilities are as follows:
Less than one year 3 310.5 2 952.9 One year to five years 11 673.7 10 985.4 Five to ten years 6 769.6 7 872.8 More than ten years 1 023.8 1 444.5
Total undiscounted lease liabilities 22 777.6 23 255.6 Finance costs to be incurred in future (6 418.2) (7 350.4)
Lease liabilities 16 359.4 15 905.2
24.4 Lease termsLease terms include any non-cancellable periods and reasonably certain extension or termination options. Approximately 63% (2020: 60%) of the Group’s portfolio of property leases contain extension options and approximately 21% (2020: 30%) contain termination options. The majority of extension and termination options held are exercisable by the Group and not by the respective lessor.
The average lease term of the Group’s portfolio of qualifying leases are:Property 11 years 10 yearsEquipment and vehicles 7 years 7 years
GROUP ANNUAL FINANCIAL STATEMENTS 02NOTES TO THE GROUP ANNUAL FINANCIAL STATEMENTS (continued)
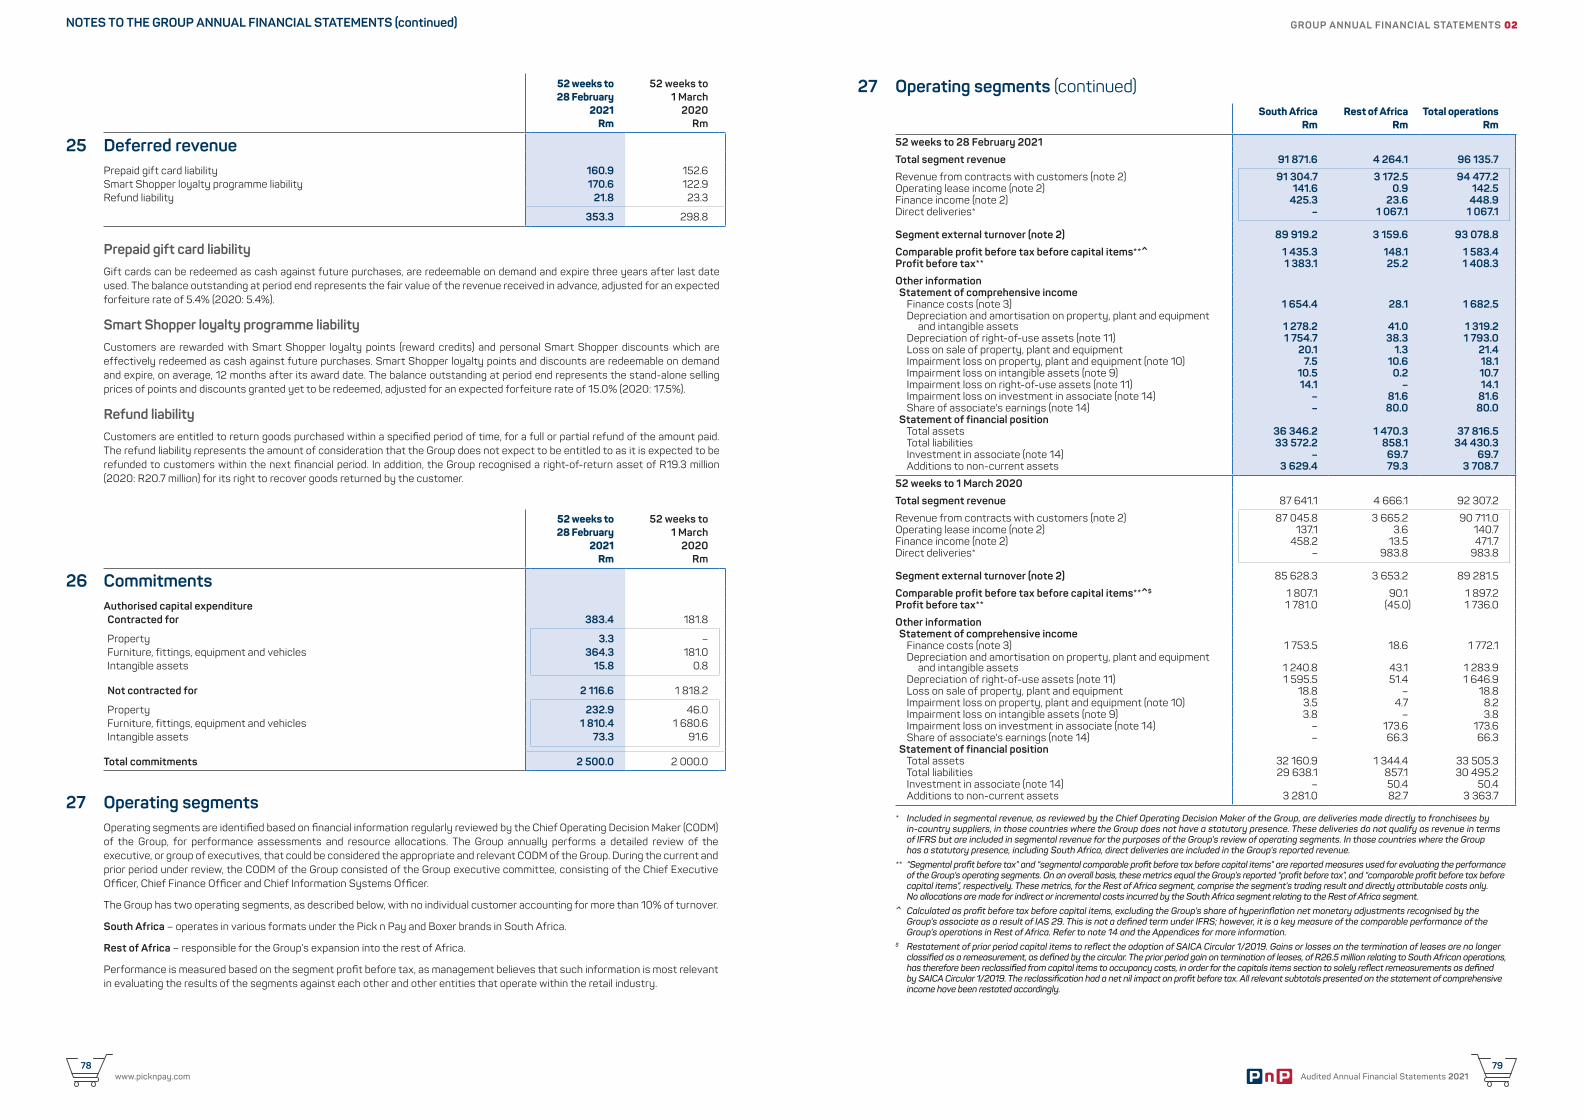
Audited Annual Financial Statements 202179
www.picknpay.com78
52 weeks to 28 February
2021Rm
52 weeks to1 March
2020Rm
25 Deferred revenuePrepaid gift card liability 160.9 152.6 Smart Shopper loyalty programme liability 170.6 122.9Refund liability 21.8 23.3
353.3 298.8
Prepaid gift card liabilityGift cards can be redeemed as cash against future purchases, are redeemable on demand and expire three years after last date used. The balance outstanding at period end represents the fair value of the revenue received in advance, adjusted for an expected forfeiture rate of 5.4% (2020: 5.4%).
Smart Shopper loyalty programme liabilityCustomers are rewarded with Smart Shopper loyalty points (reward credits) and personal Smart Shopper discounts which are effectively redeemed as cash against future purchases. Smart Shopper loyalty points and discounts are redeemable on demand and expire, on average, 12 months after its award date. The balance outstanding at period end represents the stand-alone selling prices of points and discounts granted yet to be redeemed, adjusted for an expected forfeiture rate of 15.0% (2020: 17.5%).
Refund liabilityCustomers are entitled to return goods purchased within a specified period of time, for a full or partial refund of the amount paid. The refund liability represents the amount of consideration that the Group does not expect to be entitled to as it is expected to be refunded to customers within the next financial period. In addition, the Group recognised a right-of-return asset of R19.3 million (2020: R20.7 million) for its right to recover goods returned by the customer.
52 weeks to 28 February
2021 Rm
52 weeks to1 March
2020Rm
26 CommitmentsAuthorised capital expenditureContracted for 383.4 181.8
Property 3.3 –Furniture, fittings, equipment and vehicles 364.3 181.0 Intangible assets 15.8 0.8
Not contracted for 2 116.6 1 818.2
Property 232.9 46.0 Furniture, fittings, equipment and vehicles 1 810.4 1 680.6 Intangible assets 73.3 91.6
Total commitments 2 500.0 2 000.0
27 Operating segmentsOperating segments are identified based on financial information regularly reviewed by the Chief Operating Decision Maker (CODM) of the Group, for performance assessments and resource allocations. The Group annually performs a detailed review of the executive, or group of executives, that could be considered the appropriate and relevant CODM of the Group. During the current and prior period under review, the CODM of the Group consisted of the Group executive committee, consisting of the Chief Executive Officer, Chief Finance Officer and Chief Information Systems Officer.
The Group has two operating segments, as described below, with no individual customer accounting for more than 10% of turnover.
South Africa – operates in various formats under the Pick n Pay and Boxer brands in South Africa.
Rest of Africa – responsible for the Group’s expansion into the rest of Africa.
Performance is measured based on the segment profit before tax, as management believes that such information is most relevant in evaluating the results of the segments against each other and other entities that operate within the retail industry.
27 Operating segments (continued)South Africa
Rm Rest of Africa
Rm Total operations
Rm
52 weeks to 28 February 2021
Total segment revenue 91 871.6 4 264.1 96 135.7
Revenue from contracts with customers (note 2) 91 304.7 3 172.5 94 477.2 Operating lease income (note 2) 141.6 0.9 142.5 Finance income (note 2) 425.3 23.6 448.9 Direct deliveries* – 1 067.1 1 067.1
Segment external turnover (note 2) 89 919.2 3 159.6 93 078.8
Comparable profit before tax before capital items**^ 1 435.3 148.1 1 583.4 Profit before tax** 1 383.1 25.2 1 408.3
Other informationStatement of comprehensive income
Finance costs (note 3) 1 654.4 28.1 1 682.5 Depreciation and amortisation on property, plant and equipment
and intangible assets 1 278.2 41.0 1 319.2 Depreciation of right-of-use assets (note 11) 1 754.7 38.3 1 793.0 Loss on sale of property, plant and equipment 20.1 1.3 21.4 Impairment loss on property, plant and equipment (note 10) 7.5 10.6 18.1 Impairment loss on intangible assets (note 9) 10.5 0.2 10.7 Impairment loss on right-of-use assets (note 11) 14.1 – 14.1 Impairment loss on investment in associate (note 14) – 81.6 81.6 Share of associate's earnings (note 14) – 80.0 80.0
Statement of financial positionTotal assets 36 346.2 1 470.3 37 816.5 Total liabilities 33 572.2 858.1 34 430.3 Investment in associate (note 14) – 69.7 69.7 Additions to non-current assets 3 629.4 79.3 3 708.7
52 weeks to 1 March 2020
Total segment revenue 87 641.1 4 666.1 92 307.2
Revenue from contracts with customers (note 2) 87 045.8 3 665.2 90 711.0 Operating lease income (note 2) 137.1 3.6 140.7 Finance income (note 2) 458.2 13.5 471.7 Direct deliveries* – 983.8 983.8
Segment external turnover (note 2) 85 628.3 3 653.2 89 281.5
Comparable profit before tax before capital items**^$ 1 807.1 90.1 1 897.2 Profit before tax** 1 781.0 (45.0) 1 736.0
Other informationStatement of comprehensive income
Finance costs (note 3) 1 753.5 18.6 1 772.1 Depreciation and amortisation on property, plant and equipment
and intangible assets 1 240.8 43.1 1 283.9 Depreciation of right-of-use assets (note 11) 1 595.5 51.4 1 646.9 Loss on sale of property, plant and equipment 18.8 – 18.8 Impairment loss on property, plant and equipment (note 10) 3.5 4.7 8.2 Impairment loss on intangible assets (note 9) 3.8 – 3.8 Impairment loss on investment in associate (note 14) – 173.6 173.6 Share of associate's earnings (note 14) – 66.3 66.3
Statement of financial positionTotal assets 32 160.9 1 344.4 33 505.3 Total liabilities 29 638.1 857.1 30 495.2 Investment in associate (note 14) – 50.4 50.4 Additions to non-current assets 3 281.0 82.7 3 363.7
* Included in segmental revenue, as reviewed by the Chief Operating Decision Maker of the Group, are deliveries made directly to franchisees by in-country suppliers, in those countries where the Group does not have a statutory presence. These deliveries do not qualify as revenue in terms of IFRS but are included in segmental revenue for the purposes of the Group’s review of operating segments. In those countries where the Group has a statutory presence, including South Africa, direct deliveries are included in the Group’s reported revenue.
** “Segmental profit before tax” and “segmental comparable profit before tax before capital items” are reported measures used for evaluating the performance of the Group’s operating segments. On an overall basis, these metrics equal the Group’s reported “profit before tax”, and “comparable profit before tax before capital items”, respectively. These metrics, for the Rest of Africa segment, comprise the segment’s trading result and directly attributable costs only. No allocations are made for indirect or incremental costs incurred by the South Africa segment relating to the Rest of Africa segment.
^ Calculated as profit before tax before capital items, excluding the Group’s share of hyperinflation net monetary adjustments recognised by the Group’s associate as a result of IAS 29. This is not a defined term under IFRS; however, it is a key measure of the comparable performance of the Group’s operations in Rest of Africa. Refer to note 14 and the Appendices for more information.
$ Restatement of prior period capital items to reflect the adoption of SAICA Circular 1/2019. Gains or losses on the termination of leases are no longer classified as a remeasurement, as defined by the circular. The prior period gain on termination of leases, of R26.5 million relating to South African operations, has therefore been reclassified from capital items to occupancy costs, in order for the capitals items section to solely reflect remeasurements as defined by SAICA Circular 1/2019. The reclassification had a net nil impact on profit before tax. All relevant subtotals presented on the statement of comprehensive income have been restated accordingly.
GROUP ANNUAL FINANCIAL STATEMENTS 02NOTES TO THE GROUP ANNUAL FINANCIAL STATEMENTS (continued)
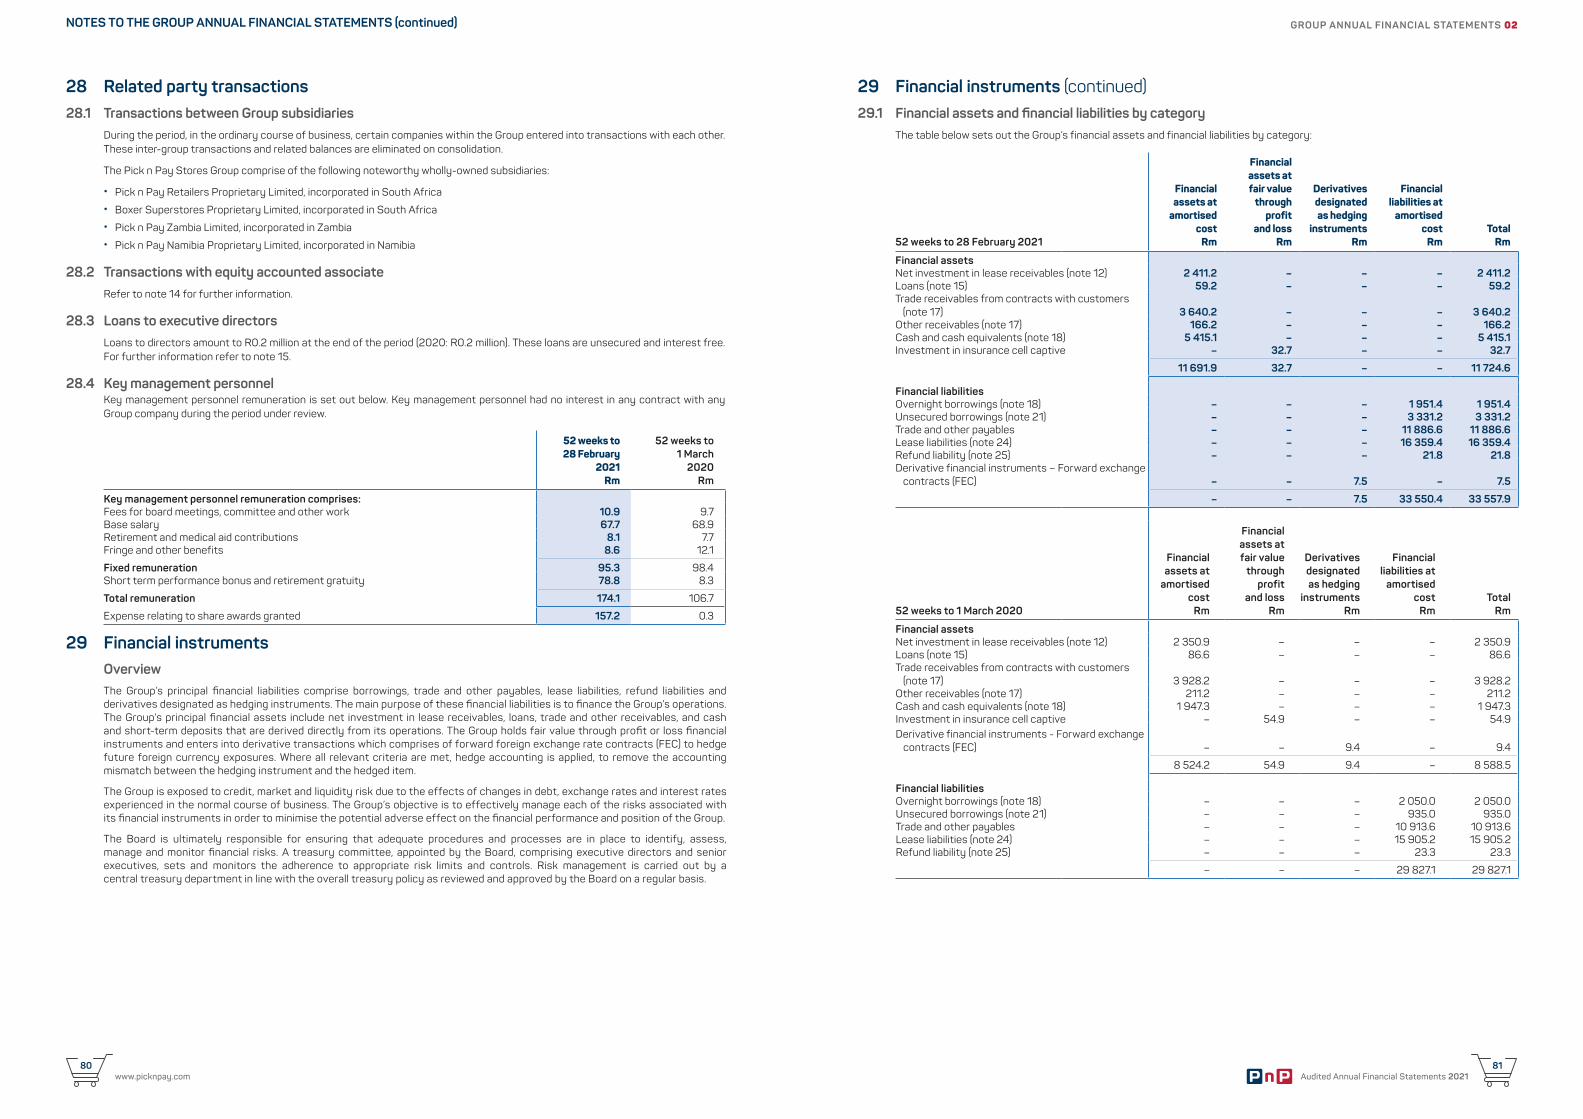
Audited Annual Financial Statements 202181
www.picknpay.com80
29 Financial instruments (continued)29.1 Financial assets and financial liabilities by category
The table below sets out the Group’s financial assets and financial liabilities by category:
52 weeks to 28 February 2021
Financialassets at
amortisedcost
Rm
Financialassets atfair value
throughprofit
and lossRm
Derivativesdesignatedas hedging
instrumentsRm
Financialliabilities at
amortisedcost
RmTotal
Rm
Financial assetsNet investment in lease receivables (note 12) 2 411.2 – – – 2 411.2 Loans (note 15) 59.2 – – – 59.2 Trade receivables from contracts with customers
(note 17) 3 640.2 – – – 3 640.2 Other receivables (note 17) 166.2 – – – 166.2 Cash and cash equivalents (note 18) 5 415.1 – – – 5 415.1 Investment in insurance cell captive – 32.7 – – 32.7
11 691.9 32.7 – – 11 724.6
Financial liabilities Overnight borrowings (note 18) – – – 1 951.4 1 951.4 Unsecured borrowings (note 21) – – – 3 331.2 3 331.2 Trade and other payables – – – 11 886.6 11 886.6 Lease liabilities (note 24) – – – 16 359.4 16 359.4 Refund liability (note 25) – – – 21.8 21.8 Derivative financial instruments – Forward exchange
contracts (FEC) – – 7.5 – 7.5
– – 7.5 33 550.4 33 557.9
52 weeks to 1 March 2020
Financialassets at
amortised cost
Rm
Financialassets at fair value
through profit
and lossRm
Derivativesdesignatedas hedging
instrumentsRm
Financialliabilities at
amortised cost
RmTotal
Rm
Financial assetsNet investment in lease receivables (note 12) 2 350.9 – – – 2 350.9 Loans (note 15) 86.6 – – – 86.6 Trade receivables from contracts with customers
(note 17) 3 928.2 – – – 3 928.2 Other receivables (note 17) 211.2 – – – 211.2 Cash and cash equivalents (note 18) 1 947.3 – – – 1 947.3 Investment in insurance cell captive – 54.9 – – 54.9 Derivative financial instruments - Forward exchange
contracts (FEC) – – 9.4 – 9.4
8 524.2 54.9 9.4 – 8 588.5
Financial liabilities Overnight borrowings (note 18) – – – 2 050.0 2 050.0 Unsecured borrowings (note 21) – – – 935.0 935.0 Trade and other payables – – – 10 913.6 10 913.6 Lease liabilities (note 24) – – – 15 905.2 15 905.2 Refund liability (note 25) – – – 23.3 23.3
– – – 29 827.1 29 827.1
28 Related party transactions28.1 Transactions between Group subsidiaries
During the period, in the ordinary course of business, certain companies within the Group entered into transactions with each other. These inter-group transactions and related balances are eliminated on consolidation.
The Pick n Pay Stores Group comprise of the following noteworthy wholly-owned subsidiaries:
• Pick n Pay Retailers Proprietary Limited, incorporated in South Africa • Boxer Superstores Proprietary Limited, incorporated in South Africa • Pick n Pay Zambia Limited, incorporated in Zambia • Pick n Pay Namibia Proprietary Limited, incorporated in Namibia
28.2 Transactions with equity accounted associateRefer to note 14 for further information.
28.3 Loans to executive directorsLoans to directors amount to R0.2 million at the end of the period (2020: R0.2 million). These loans are unsecured and interest free. For further information refer to note 15.
28.4 Key management personnelKey management personnel remuneration is set out below. Key management personnel had no interest in any contract with any Group company during the period under review.
52 weeks to 28 February
2021Rm
52 weeks to 1 March
2020 Rm
Key management personnel remuneration comprises:Fees for board meetings, committee and other work 10.9 9.7 Base salary 67.7 68.9 Retirement and medical aid contributions 8.1 7.7 Fringe and other benefits 8.6 12.1
Fixed remuneration 95.3 98.4 Short term performance bonus and retirement gratuity 78.8 8.3
Total remuneration 174.1 106.7
Expense relating to share awards granted 157.2 0.3
29 Financial instrumentsOverviewThe Group’s principal financial liabilities comprise borrowings, trade and other payables, lease liabilities, refund liabilities and derivatives designated as hedging instruments. The main purpose of these financial liabilities is to finance the Group’s operations. The Group’s principal financial assets include net investment in lease receivables, loans, trade and other receivables, and cash and short-term deposits that are derived directly from its operations. The Group holds fair value through profit or loss financial instruments and enters into derivative transactions which comprises of forward foreign exchange rate contracts (FEC) to hedge future foreign currency exposures. Where all relevant criteria are met, hedge accounting is applied, to remove the accounting mismatch between the hedging instrument and the hedged item.
The Group is exposed to credit, market and liquidity risk due to the effects of changes in debt, exchange rates and interest rates experienced in the normal course of business. The Group’s objective is to effectively manage each of the risks associated with its financial instruments in order to minimise the potential adverse effect on the financial performance and position of the Group.
The Board is ultimately responsible for ensuring that adequate procedures and processes are in place to identify, assess, manage and monitor financial risks. A treasury committee, appointed by the Board, comprising executive directors and senior executives, sets and monitors the adherence to appropriate risk limits and controls. Risk management is carried out by a central treasury department in line with the overall treasury policy as reviewed and approved by the Board on a regular basis.
GROUP ANNUAL FINANCIAL STATEMENTS 02NOTES TO THE GROUP ANNUAL FINANCIAL STATEMENTS (continued)

Audited Annual Financial Statements 202183
www.picknpay.com82
29 Financial instruments (continued)29.2 Credit risk
Credit risk is the risk of financial loss to the Group if a counterparty to a financial instrument fails to meet its contractual obligations. Financial assets, which potentially subject the Group to credit risk, consist principally of net investment in lease receivables, loans, trade and other receivables and cash and cash equivalents.
Net investment in lease receivables and trade and other receivables Net investment in lease receivables and trade and other receivables mainly relate to amounts owing by franchisees and are presented net of impairment losses (refer to note 12 and 17). Rigorous credit granting procedures are applied to assess the credit quality of debtors, taking into account their financial position and credit rating. The Group obtains various forms of security from its debtors, including bank guarantees, notarial bonds over inventory and moveable assets and suretyships from shareholders. The total credit risk with respect to receivables from franchise debtors is further limited as a result of the dispersion amongst the individual franchisees and across different geographic areas. Consequently, the Group does not consider there to be any significant concentration or exposure to credit risk.
Loans Loans mainly comprise employee loans granted in line with the Group’s remuneration policy. Loans are granted after reviewing the affordability of each employee and, where appropriate, suitable forms of security are obtained. Majority of loans are secured and considered to have low credit risk. Refer to note 15.
Cash and cash equivalentsThe Group’s cash is placed with major South African and international financial institutions, which at period end had a high credit standing and had a long-term credit rating of zaAA (refer to note 18).
29.3 Market riskMarket risk is the risk that the fair value of future cash flows of a financial instrument will fluctuate because of changes in market prices. Market risk comprises three types of risk: currency risk, interest rate risk and other price risk (such as equity price risk). Financial instruments affected by market risk include borrowings, lease liabilities, loans, deposits, fair value through profit or loss financial instruments and derivative financial instruments. The objective of market risk management is to manage and control exposure to market risk, while optimising the return on the risk.
29.3.1 Currency risk
Foreign currency risk is the risk that the fair value or future cash flows of a financial instrument will fluctuate because of changes in foreign exchange rates. The Group’s exposure to the risk of changes in foreign exchange rates relates primarily to the Group’s operating activities and the Group’s net investment in foreign subsidiaries.
Transactional currency risk - FEC’sThe Group has transactional currency exposures arising from the acquisition of goods and services in currencies other than its functional currency. The Group operates internationally and is exposed to currency risk through the importation of merchandise, however it does not have material foreign creditors as inventory imports are mostly prepaid. Investments in foreign operations and master franchise agreements with international counter parties do not contribute to transactional currency risk as the related transactions and balances are denominated in South African rands.
The Group imports inventory from foreign countries and is exposed to fluctuations in foreign exchange rates. The Group uses FEC’s to mitigate its foreign exchange risks from the import of inventory. It is the Group’s policy to cover all foreign inventory purchases by utilising a derivative contract (FEC). The Group does not use derivatives for speculative purposes.
The Group’s FEC’s have been designated as cash flow hedges of firm commitments in US dollar, GBP and Euro. All firm commitments are expected to be realised within 12 months. An economic relationship exists between the hedged items and the hedging instruments. The Group has established a hedge ratio of 1:1, as the terms of the FEC’s match the terms of the firm commitments. To test hedge effectiveness, the Group uses the hypothetical derivative method and compares the changes in the fair value of the hedging instruments against the changes in fair value of the hedged items attributable to the hedged risks. The effective portion of the gain or loss on the hedging instrument is recognised in other comprehensive income in the cash flow hedge reserve. During the period under review, R5.0 million (2020: R5.0 million) was reclassified to the statement of comprehensive income.
29 Financial instruments (continued)29.3 Market risk (continued)
29.3.1 Currency risk (continued)
Forward exchange contract (liabilities)/assets
Contractforeign
currencym
Rand equivalent
Rm
Average forward
rateR
Fairvalue
Rm
2021US dollars 6.9 111.5 16.1 (6.1)Euro 2.9 54.4 19.1 (1.5)British pound 0.2 4.9 21.6 0.1
170.8 (7.5)
2020US dollars 10.9 154.9 14.2 7.8 Euro 2.3 39.0 16.9 1.3 British pound 0.3 5.7 19.6 0.3
199.6 9.4
Transactional currency risk – Foreign cash balances, trade and other receivables, trade and other payables and lease liabilities The Group has exposure to foreign currency translation risk through its foreign cash balances, trade and other receivables, trade and other payables and lease liabilities included in the net assets and liabilities of foreign subsidiaries denominated in currencies other than the South African rand. These balances are immaterial in relation to the total of the line items they are included in. These risks are not hedged.
Sensitivity of the Group’s exposure to material foreign currencies is estimated by assessing the impact of a reasonable expected movement of the currencies on the statement of comprehensive income, statement of financial position and statement of changes in equity of the Group. A sensitivity analysis is not presented as the estimated impact of the expected movement in currencies is not material.
Average spot rate Closing rate
The following significant foreign exchange rates applied during the period: 2021 2020 2021 2020
USD/ZAR 16.5 14.6 15.1 15.7Euro/ZAR 19.1 16.2 18.2 17.3GBP/ZAR 21.3 18.6 21.0 20.1USD/ZMW 19.3 13.3 21.7 15.0
GROUP ANNUAL FINANCIAL STATEMENTS 02NOTES TO THE GROUP ANNUAL FINANCIAL STATEMENTS (continued)
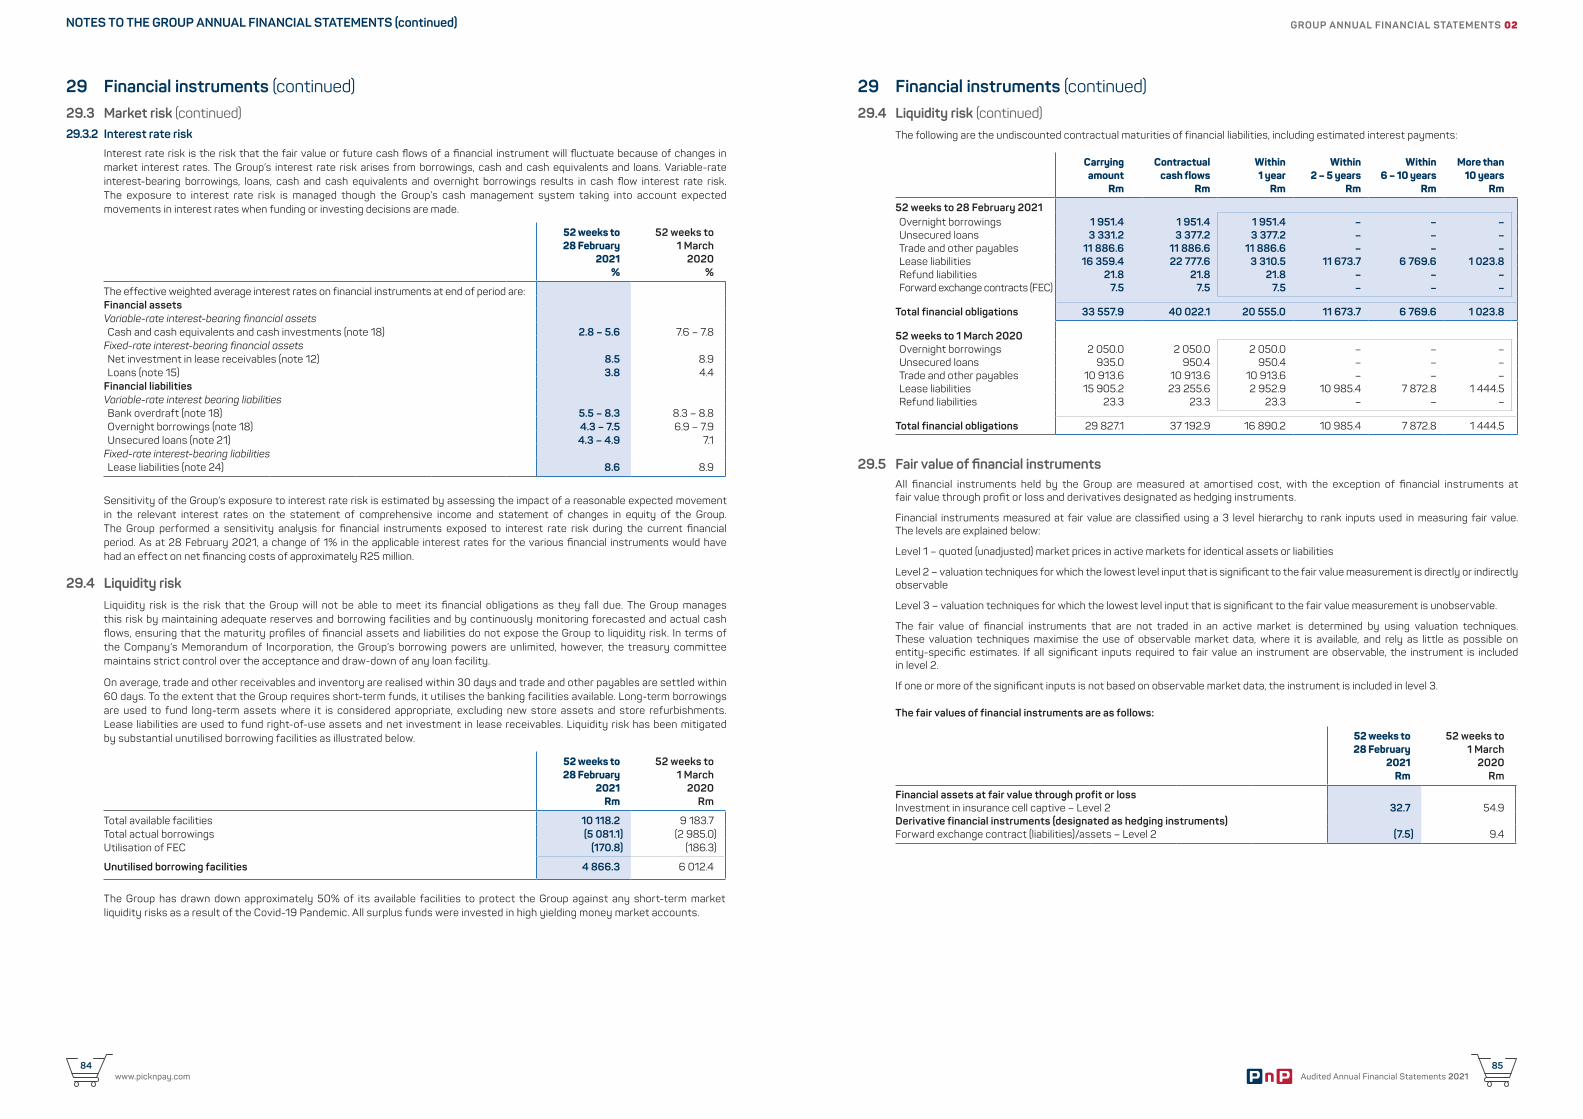
Audited Annual Financial Statements 202185
www.picknpay.com84
29 Financial instruments (continued)29.3 Market risk (continued)29.3.2 Interest rate risk
Interest rate risk is the risk that the fair value or future cash flows of a financial instrument will fluctuate because of changes in market interest rates. The Group’s interest rate risk arises from borrowings, cash and cash equivalents and loans. Variable-rate interest-bearing borrowings, loans, cash and cash equivalents and overnight borrowings results in cash flow interest rate risk. The exposure to interest rate risk is managed though the Group’s cash management system taking into account expected movements in interest rates when funding or investing decisions are made.
52 weeks to28 February
2021%
52 weeks to1 March
2020%
The effective weighted average interest rates on financial instruments at end of period are:Financial assetsVariable-rate interest-bearing financial assetsCash and cash equivalents and cash investments (note 18) 2.8 – 5.6 7.6 – 7.8
Fixed-rate interest-bearing financial assetsNet investment in lease receivables (note 12) 8.5 8.9 Loans (note 15) 3.8 4.4
Financial liabilitiesVariable-rate interest bearing liabilitiesBank overdraft (note 18) 5.5 – 8.3 8.3 – 8.8 Overnight borrowings (note 18) 4.3 – 7.5 6.9 – 7.9 Unsecured loans (note 21) 4.3 – 4.9 7.1
Fixed-rate interest-bearing liabilitiesLease liabilities (note 24) 8.6 8.9
Sensitivity of the Group’s exposure to interest rate risk is estimated by assessing the impact of a reasonable expected movement in the relevant interest rates on the statement of comprehensive income and statement of changes in equity of the Group. The Group performed a sensitivity analysis for financial instruments exposed to interest rate risk during the current financial period. As at 28 February 2021, a change of 1% in the applicable interest rates for the various financial instruments would have had an effect on net financing costs of approximately R25 million.
29.4 Liquidity riskLiquidity risk is the risk that the Group will not be able to meet its financial obligations as they fall due. The Group manages this risk by maintaining adequate reserves and borrowing facilities and by continuously monitoring forecasted and actual cash flows, ensuring that the maturity profiles of financial assets and liabilities do not expose the Group to liquidity risk. In terms of the Company’s Memorandum of Incorporation, the Group’s borrowing powers are unlimited, however, the treasury committee maintains strict control over the acceptance and draw-down of any loan facility.
On average, trade and other receivables and inventory are realised within 30 days and trade and other payables are settled within 60 days. To the extent that the Group requires short-term funds, it utilises the banking facilities available. Long-term borrowings are used to fund long-term assets where it is considered appropriate, excluding new store assets and store refurbishments. Lease liabilities are used to fund right-of-use assets and net investment in lease receivables. Liquidity risk has been mitigated by substantial unutilised borrowing facilities as illustrated below.
52 weeks to 28 February
2021Rm
52 weeks to1 March
2020Rm
Total available facilities 10 118.2 9 183.7 Total actual borrowings (5 081.1) (2 985.0)Utilisation of FEC (170.8) (186.3)
Unutilised borrowing facilities 4 866.3 6 012.4
The Group has drawn down approximately 50% of its available facilities to protect the Group against any short-term market liquidity risks as a result of the Covid-19 Pandemic. All surplus funds were invested in high yielding money market accounts.
29 Financial instruments (continued)29.4 Liquidity risk (continued)
The following are the undiscounted contractual maturities of financial liabilities, including estimated interest payments:
Carryingamount
Rm
Contractualcash flows
Rm
Within1 year
Rm
Within 2 – 5 years
Rm
Within 6 – 10 years
Rm
More than 10 years
Rm
52 weeks to 28 February 2021Overnight borrowings 1 951.4 1 951.4 1 951.4 – – – Unsecured loans 3 331.2 3 377.2 3 377.2 – – – Trade and other payables 11 886.6 11 886.6 11 886.6 – – – Lease liabilities 16 359.4 22 777.6 3 310.5 11 673.7 6 769.6 1 023.8 Refund liabilities 21.8 21.8 21.8 – – – Forward exchange contracts (FEC) 7.5 7.5 7.5 – – –
Total financial obligations 33 557.9 40 022.1 20 555.0 11 673.7 6 769.6 1 023.8
52 weeks to 1 March 2020Overnight borrowings 2 050.0 2 050.0 2 050.0 – – – Unsecured loans 935.0 950.4 950.4 – – – Trade and other payables 10 913.6 10 913.6 10 913.6 – – – Lease liabilities 15 905.2 23 255.6 2 952.9 10 985.4 7 872.8 1 444.5 Refund liabilities 23.3 23.3 23.3 – – –
Total financial obligations 29 827.1 37 192.9 16 890.2 10 985.4 7 872.8 1 444.5
29.5 Fair value of financial instrumentsAll financial instruments held by the Group are measured at amortised cost, with the exception of financial instruments at fair value through profit or loss and derivatives designated as hedging instruments.
Financial instruments measured at fair value are classified using a 3 level hierarchy to rank inputs used in measuring fair value. The levels are explained below:
Level 1 – quoted (unadjusted) market prices in active markets for identical assets or liabilities
Level 2 – valuation techniques for which the lowest level input that is significant to the fair value measurement is directly or indirectly observable
Level 3 – valuation techniques for which the lowest level input that is significant to the fair value measurement is unobservable.
The fair value of financial instruments that are not traded in an active market is determined by using valuation techniques. These valuation techniques maximise the use of observable market data, where it is available, and rely as little as possible on entity-specific estimates. If all significant inputs required to fair value an instrument are observable, the instrument is included in level 2.
If one or more of the significant inputs is not based on observable market data, the instrument is included in level 3.
The fair values of financial instruments are as follows:
52 weeks to 28 February
2021Rm
52 weeks to1 March
2020Rm
Financial assets at fair value through profit or lossInvestment in insurance cell captive – Level 2 32.7 54.9 Derivative financial instruments (designated as hedging instruments)Forward exchange contract (liabilities)/assets – Level 2 (7.5) 9.4
GROUP ANNUAL FINANCIAL STATEMENTS 02NOTES TO THE GROUP ANNUAL FINANCIAL STATEMENTS (continued)
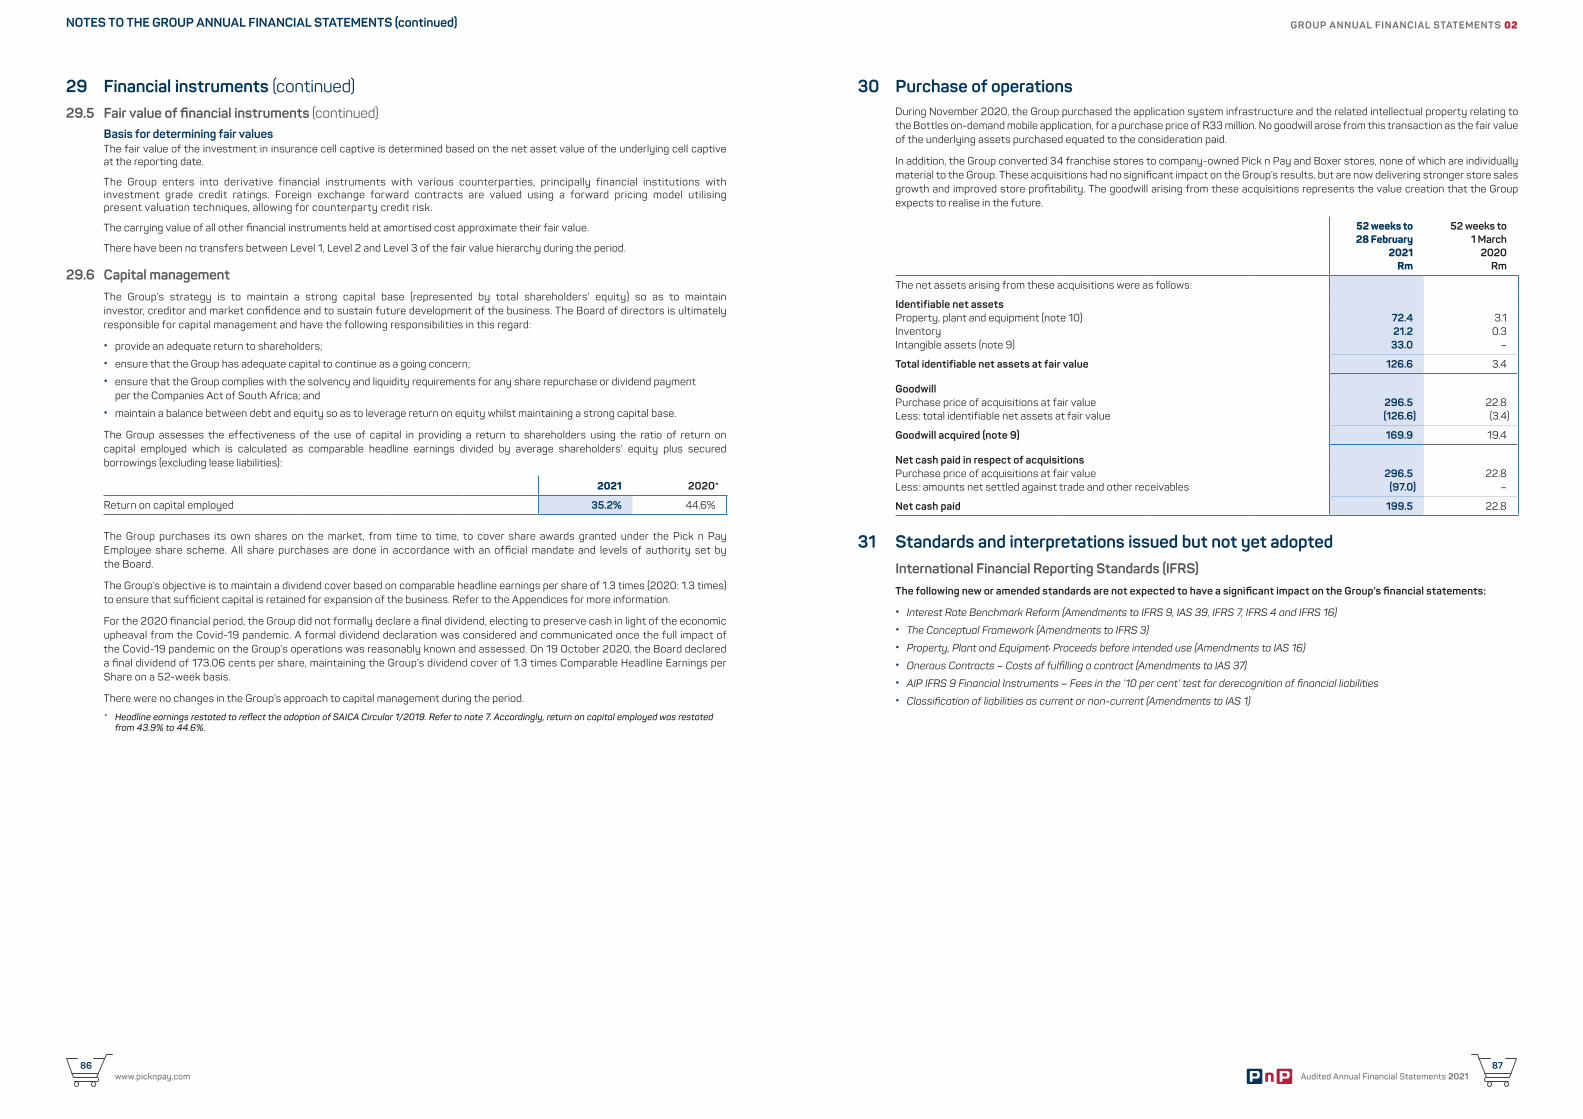
Audited Annual Financial Statements 202187
www.picknpay.com86
29 Financial instruments (continued)29.5 Fair value of financial instruments (continued)
Basis for determining fair valuesThe fair value of the investment in insurance cell captive is determined based on the net asset value of the underlying cell captive at the reporting date.
The Group enters into derivative financial instruments with various counterparties, principally financial institutions with investment grade credit ratings. Foreign exchange forward contracts are valued using a forward pricing model utilising present valuation techniques, allowing for counterparty credit risk.
The carrying value of all other financial instruments held at amortised cost approximate their fair value.
There have been no transfers between Level 1, Level 2 and Level 3 of the fair value hierarchy during the period.
29.6 Capital managementThe Group’s strategy is to maintain a strong capital base (represented by total shareholders’ equity) so as to maintain investor, creditor and market confidence and to sustain future development of the business. The Board of directors is ultimately responsible for capital management and have the following responsibilities in this regard:
• provide an adequate return to shareholders; • ensure that the Group has adequate capital to continue as a going concern; • ensure that the Group complies with the solvency and liquidity requirements for any share repurchase or dividend payment
per the Companies Act of South Africa; and • maintain a balance between debt and equity so as to leverage return on equity whilst maintaining a strong capital base.
The Group assesses the effectiveness of the use of capital in providing a return to shareholders using the ratio of return on capital employed which is calculated as comparable headline earnings divided by average shareholders’ equity plus secured borrowings (excluding lease liabilities):
2021 2020*
Return on capital employed 35.2% 44.6%
The Group purchases its own shares on the market, from time to time, to cover share awards granted under the Pick n Pay Employee share scheme. All share purchases are done in accordance with an official mandate and levels of authority set by the Board.
The Group’s objective is to maintain a dividend cover based on comparable headline earnings per share of 1.3 times (2020: 1.3 times) to ensure that sufficient capital is retained for expansion of the business. Refer to the Appendices for more information.
For the 2020 financial period, the Group did not formally declare a final dividend, electing to preserve cash in light of the economic upheaval from the Covid-19 pandemic. A formal dividend declaration was considered and communicated once the full impact of the Covid-19 pandemic on the Group’s operations was reasonably known and assessed. On 19 October 2020, the Board declared a final dividend of 173.06 cents per share, maintaining the Group’s dividend cover of 1.3 times Comparable Headline Earnings per Share on a 52-week basis.
There were no changes in the Group’s approach to capital management during the period.
* Headline earnings restated to reflect the adoption of SAICA Circular 1/2019. Refer to note 7. Accordingly, return on capital employed was restated from 43.9% to 44.6%.
30 Purchase of operationsDuring November 2020, the Group purchased the application system infrastructure and the related intellectual property relating to the Bottles on-demand mobile application, for a purchase price of R33 million. No goodwill arose from this transaction as the fair value of the underlying assets purchased equated to the consideration paid.
In addition, the Group converted 34 franchise stores to company-owned Pick n Pay and Boxer stores, none of which are individually material to the Group. These acquisitions had no significant impact on the Group’s results, but are now delivering stronger store sales growth and improved store profitability. The goodwill arising from these acquisitions represents the value creation that the Group expects to realise in the future.
52 weeks to 28 February
2021Rm
52 weeks to1 March
2020Rm
The net assets arising from these acquisitions were as follows:
Identifiable net assetsProperty, plant and equipment (note 10) 72.4 3.1 Inventory 21.2 0.3 Intangible assets (note 9) 33.0 –
Total identifiable net assets at fair value 126.6 3.4
Goodwill Purchase price of acquisitions at fair value 296.5 22.8 Less: total identifiable net assets at fair value (126.6) (3.4)
Goodwill acquired (note 9) 169.9 19.4
Net cash paid in respect of acquisitionsPurchase price of acquisitions at fair value 296.5 22.8 Less: amounts net settled against trade and other receivables (97.0) –
Net cash paid 199.5 22.8
31 Standards and interpretations issued but not yet adoptedInternational Financial Reporting Standards (IFRS)The following new or amended standards are not expected to have a significant impact on the Group’s financial statements:
• Interest Rate Benchmark Reform (Amendments to IFRS 9, IAS 39, IFRS 7, IFRS 4 and IFRS 16) • The Conceptual Framework (Amendments to IFRS 3) • Property, Plant and Equipment: Proceeds before intended use (Amendments to IAS 16) • Onerous Contracts – Costs of fulfilling a contract (Amendments to IAS 37) • AIP IFRS 9 Financial Instruments – Fees in the ’10 per cent’ test for derecognition of financial liabilities • Classification of liabilities as current or non-current (Amendments to IAS 1)
GROUP ANNUAL FINANCIAL STATEMENTS 02NOTES TO THE GROUP ANNUAL FINANCIAL STATEMENTS (continued)

Audited Annual Financial Statements 202189
03
CO
MPA
NY
AN
NU
AL
FIN
AN
CIA
L S
TATE
MEN
TS
90Statement of comprehensive income
91Statement of financial position
92Statement of changes in equity
93Statement of cash flows
94Notes to the Company annual financial statements
88 Audited Annual Financial Statements 2021
89www.picknpay.com
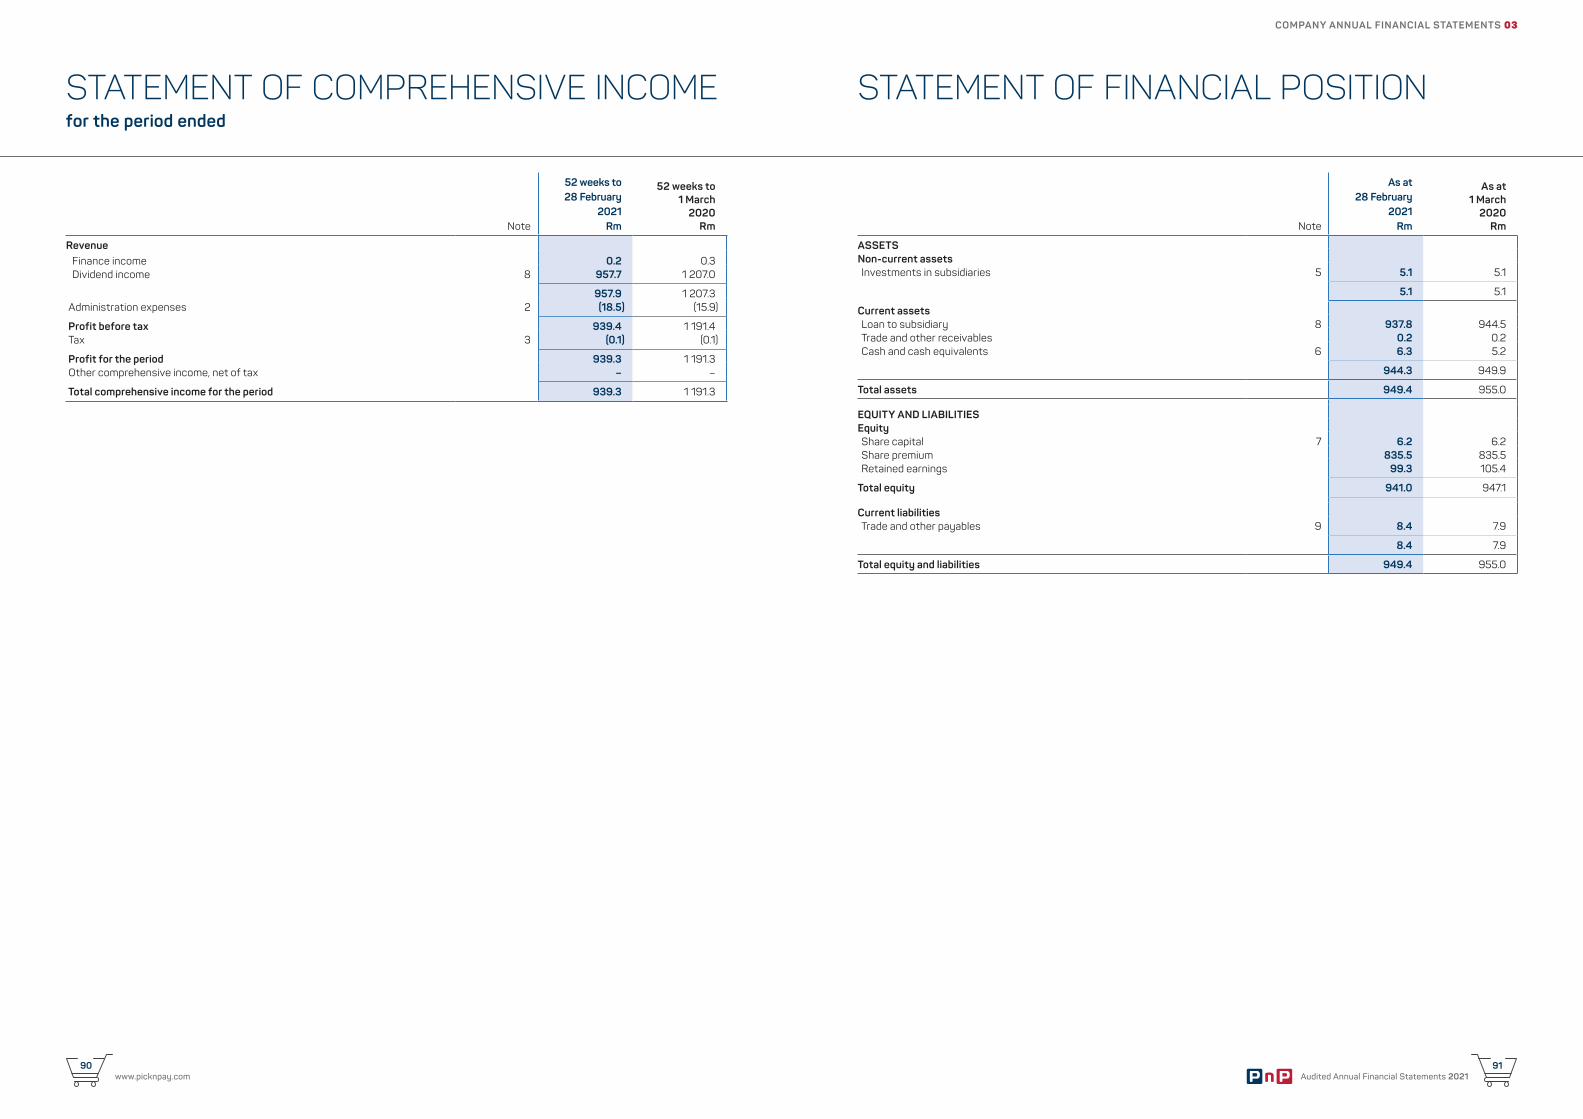
Audited Annual Financial Statements 202191
STATEMENT OF FINANCIAL POSITIONSTATEMENT OF COMPREHENSIVE INCOMEfor the period ended
Note
52 weeks to 28 February
2021 Rm
52 weeks to 1 March
2020 Rm
Revenue Finance income 0.2 0.3 Dividend income 8 957.7 1 207.0
957.9 1 207.3 Administration expenses 2 (18.5) (15.9)
Profit before tax 939.4 1 191.4 Tax 3 (0.1) (0.1)
Profit for the period 939.3 1 191.3 Other comprehensive income, net of tax – –
Total comprehensive income for the period 939.3 1 191.3
Note
As at 28 February
2021 Rm
As at1 March
2020 Rm
ASSETSNon-current assetsInvestments in subsidiaries 5 5.1 5.1
5.1 5.1
Current assetsLoan to subsidiary 8 937.8 944.5 Trade and other receivables 0.2 0.2 Cash and cash equivalents 6 6.3 5.2
944.3 949.9
Total assets 949.4 955.0
EQUITY AND LIABILITIESEquityShare capital 7 6.2 6.2 Share premium 835.5 835.5 Retained earnings 99.3 105.4
Total equity 941.0 947.1
Current liabilitiesTrade and other payables 9 8.4 7.9
8.4 7.9
Total equity and liabilities 949.4 955.0
COMPANY ANNUAL FINANCIAL STATEMENTS 03
www.picknpay.com90
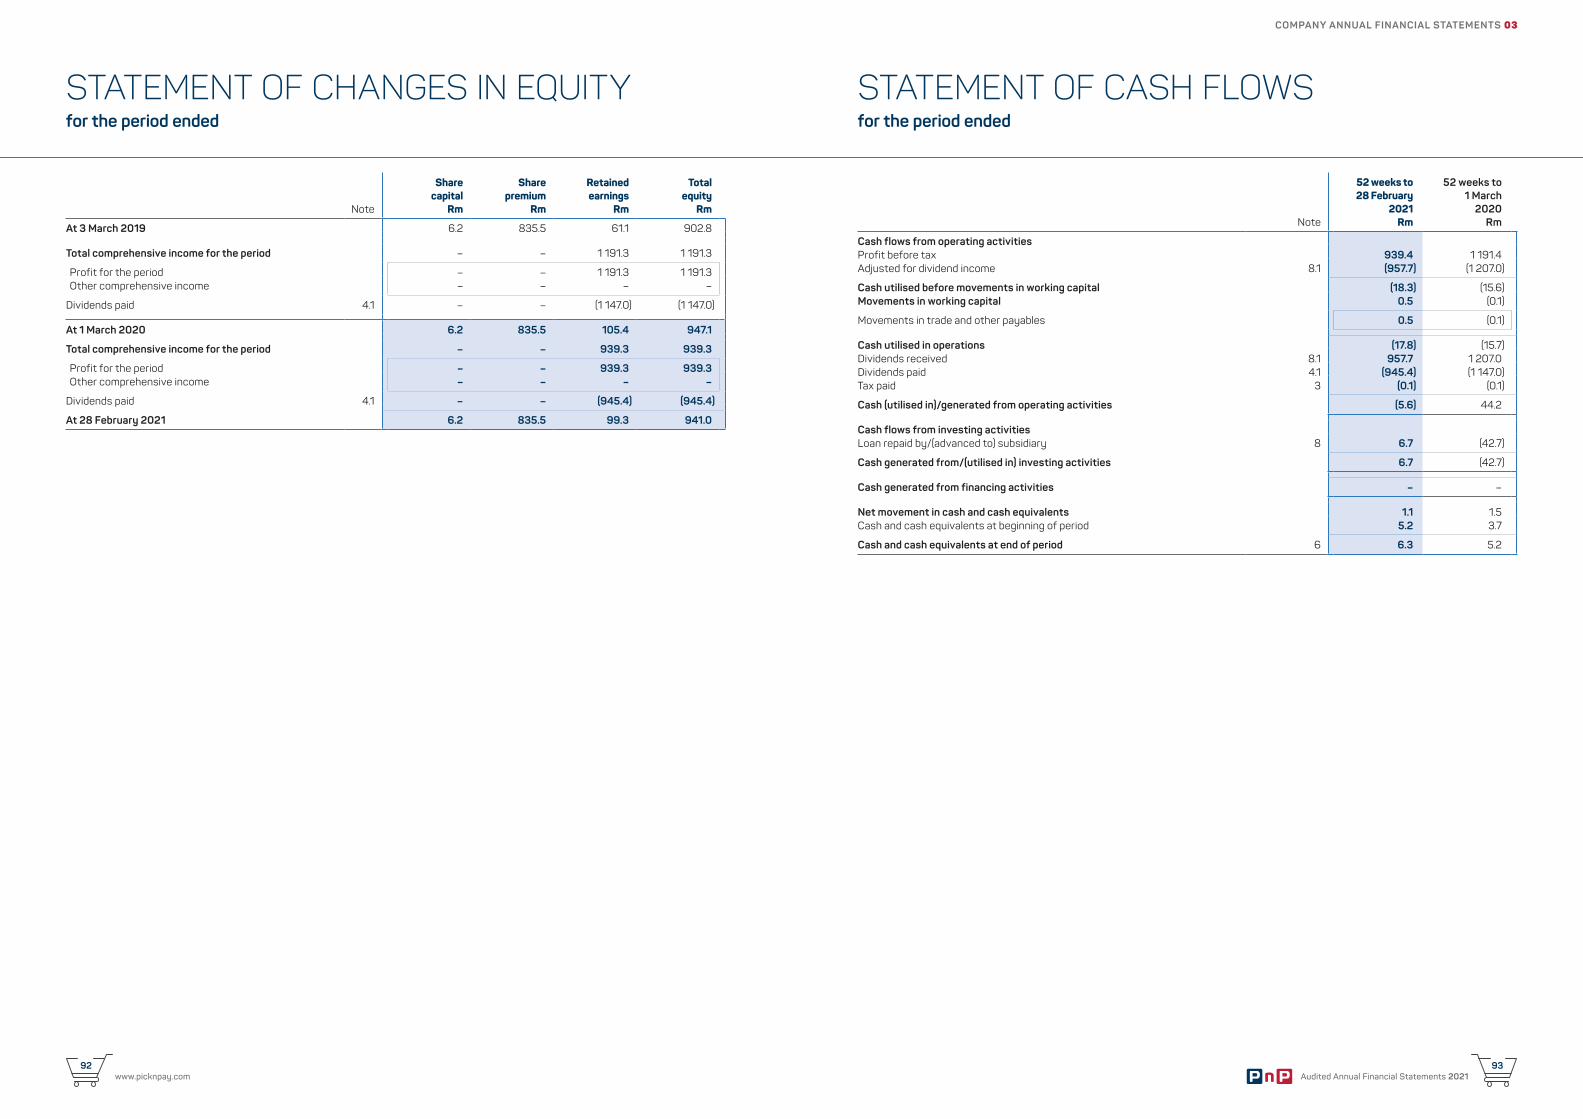
Audited Annual Financial Statements 202193
www.picknpay.com92
STATEMENT OF CASH FLOWSfor the period ended
STATEMENT OF CHANGES IN EQUITYfor the period ended
Note
52 weeks to 28 February
2021 Rm
52 weeks to 1 March
2020 Rm
Cash flows from operating activitiesProfit before tax 939.4 1 191.4 Adjusted for dividend income 8.1 (957.7) (1 207.0)
Cash utilised before movements in working capital (18.3) (15.6) Movements in working capital 0.5 (0.1)
Movements in trade and other payables 0.5 (0.1)
Cash utilised in operations (17.8) (15.7) Dividends received 8.1 957.7 1 207.0 Dividends paid 4.1 (945.4) (1 147.0) Tax paid 3 (0.1) (0.1)
Cash (utilised in)/generated from operating activities (5.6) 44.2
Cash flows from investing activitiesLoan repaid by/(advanced to) subsidiary 8 6.7 (42.7)
Cash generated from/(utilised in) investing activities 6.7 (42.7)
Cash generated from financing activities – –
Net movement in cash and cash equivalents 1.1 1.5 Cash and cash equivalents at beginning of period 5.2 3.7
Cash and cash equivalents at end of period 6 6.3 5.2
Note
Sharecapital
Rm
Sharepremium
Rm
Retainedearnings
Rm
Totalequity
Rm
At 3 March 2019 6.2 835.5 61.1 902.8
Total comprehensive income for the period – – 1 191.3 1 191.3
Profit for the period – – 1 191.3 1 191.3 Other comprehensive income – – – –
Dividends paid 4.1 – – (1 147.0) (1 147.0)
At 1 March 2020 6.2 835.5 105.4 947.1
Total comprehensive income for the period – – 939.3 939.3
Profit for the period – – 939.3 939.3 Other comprehensive income – – – –
Dividends paid 4.1 – – (945.4) (945.4)
At 28 February 2021 6.2 835.5 99.3 941.0
COMPANY ANNUAL FINANCIAL STATEMENTS 03
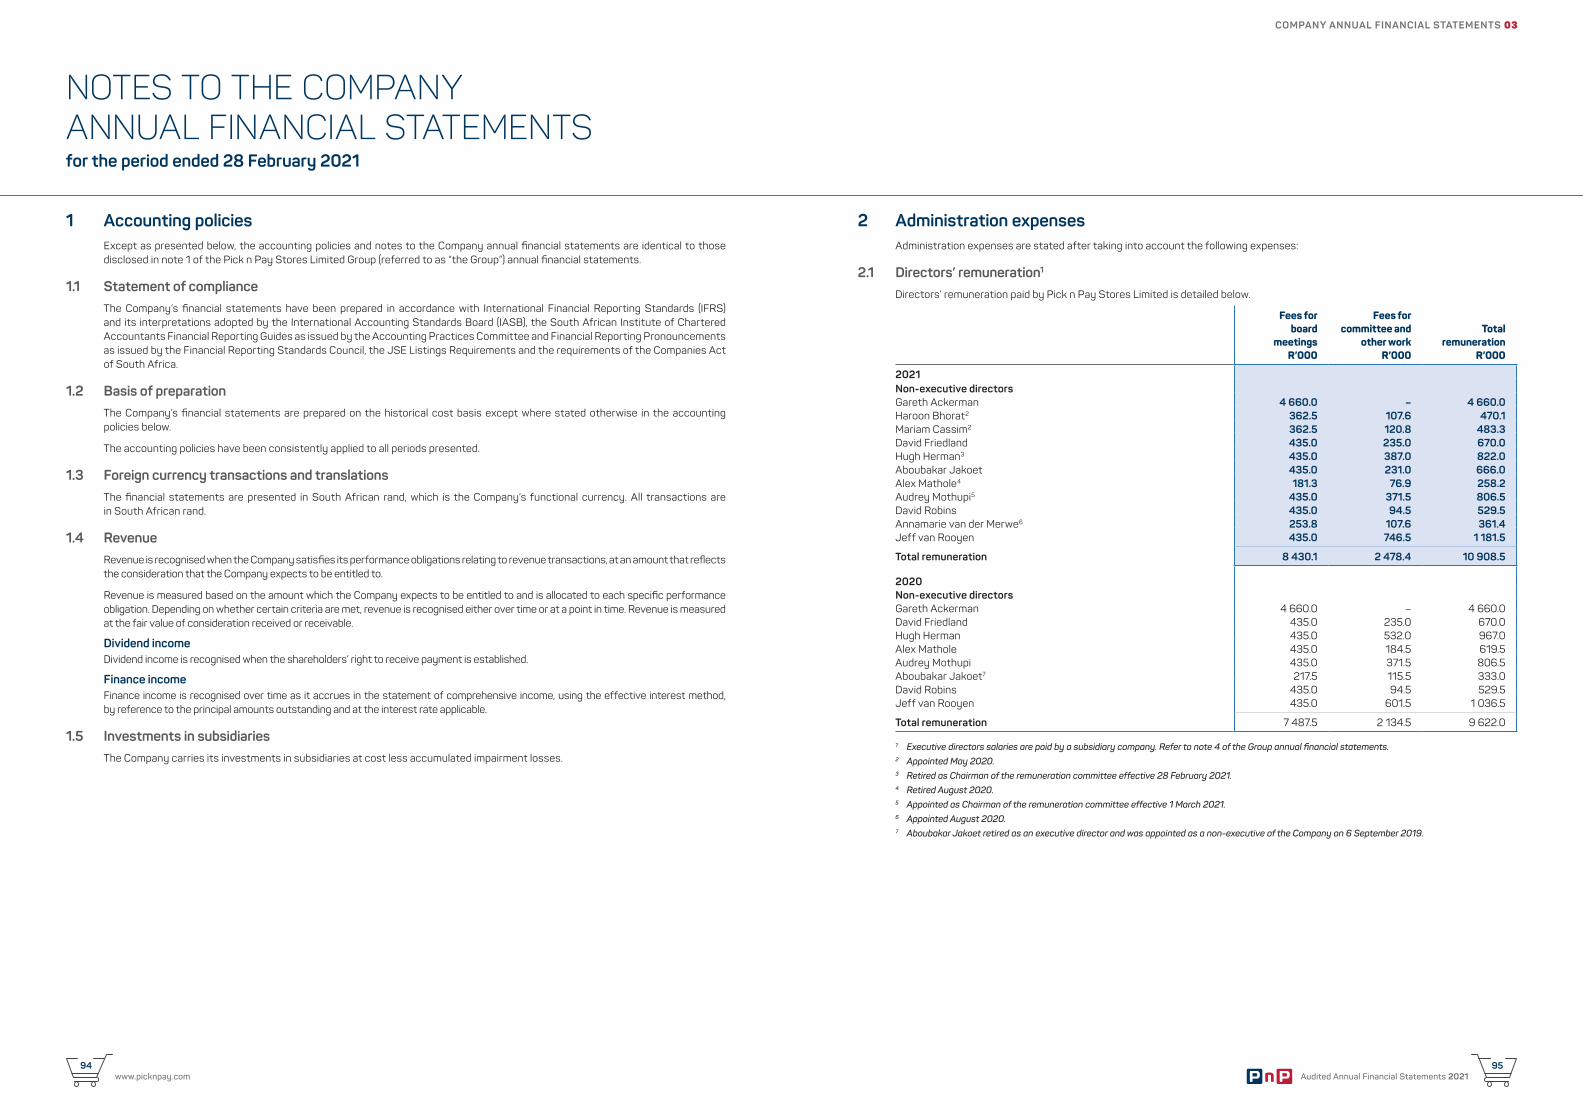
www.picknpay.com94
Audited Annual Financial Statements 202195
NOTES TO THE COMPANY ANNUAL FINANCIAL STATEMENTSfor the period ended 28 February 2021
1 Accounting policiesExcept as presented below, the accounting policies and notes to the Company annual financial statements are identical to those disclosed in note 1 of the Pick n Pay Stores Limited Group (referred to as “the Group”) annual financial statements.
1.1 Statement of complianceThe Company’s financial statements have been prepared in accordance with International Financial Reporting Standards (IFRS) and its interpretations adopted by the International Accounting Standards Board (IASB), the South African Institute of Chartered Accountants Financial Reporting Guides as issued by the Accounting Practices Committee and Financial Reporting Pronouncements as issued by the Financial Reporting Standards Council, the JSE Listings Requirements and the requirements of the Companies Act of South Africa.
1.2 Basis of preparationThe Company’s financial statements are prepared on the historical cost basis except where stated otherwise in the accounting policies below.
The accounting policies have been consistently applied to all periods presented.
1.3 Foreign currency transactions and translationsThe financial statements are presented in South African rand, which is the Company’s functional currency. All transactions are in South African rand.
1.4 RevenueRevenue is recognised when the Company satisfies its performance obligations relating to revenue transactions, at an amount that reflects the consideration that the Company expects to be entitled to.
Revenue is measured based on the amount which the Company expects to be entitled to and is allocated to each specific performance obligation. Depending on whether certain criteria are met, revenue is recognised either over time or at a point in time. Revenue is measured at the fair value of consideration received or receivable.
Dividend incomeDividend income is recognised when the shareholders’ right to receive payment is established.
Finance incomeFinance income is recognised over time as it accrues in the statement of comprehensive income, using the effective interest method, by reference to the principal amounts outstanding and at the interest rate applicable.
1.5 Investments in subsidiariesThe Company carries its investments in subsidiaries at cost less accumulated impairment losses.
2 Administration expenses Administration expenses are stated after taking into account the following expenses:
2.1 Directors’ remuneration1
Directors’ remuneration paid by Pick n Pay Stores Limited is detailed below.
Fees forboard
meetingsR’000
Fees forcommittee and
other workR’000
Totalremuneration
R’000
2021Non-executive directorsGareth Ackerman 4 660.0 – 4 660.0 Haroon Bhorat2 362.5 107.6 470.1 Mariam Cassim2 362.5 120.8 483.3 David Friedland 435.0 235.0 670.0 Hugh Herman3 435.0 387.0 822.0 Aboubakar Jakoet 435.0 231.0 666.0 Alex Mathole4 181.3 76.9 258.2 Audrey Mothupi5 435.0 371.5 806.5 David Robins 435.0 94.5 529.5 Annamarie van der Merwe6 253.8 107.6 361.4 Jeff van Rooyen 435.0 746.5 1 181.5
Total remuneration 8 430.1 2 478.4 10 908.5
2020Non-executive directorsGareth Ackerman 4 660.0 – 4 660.0 David Friedland 435.0 235.0 670.0 Hugh Herman 435.0 532.0 967.0 Alex Mathole 435.0 184.5 619.5 Audrey Mothupi 435.0 371.5 806.5 Aboubakar Jakoet7 217.5 115.5 333.0 David Robins 435.0 94.5 529.5 Jeff van Rooyen 435.0 601.5 1 036.5
Total remuneration 7 487.5 2 134.5 9 622.0
1 Executive directors salaries are paid by a subsidiary company. Refer to note 4 of the Group annual financial statements.2 Appointed May 2020.3 Retired as Chairman of the remuneration committee effective 28 February 2021.4 Retired August 2020.5 Appointed as Chairman of the remuneration committee effective 1 March 2021.6 Appointed August 2020.7 Aboubakar Jakoet retired as an executive director and was appointed as a non-executive of the Company on 6 September 2019.
COMPANY ANNUAL FINANCIAL STATEMENTS 03
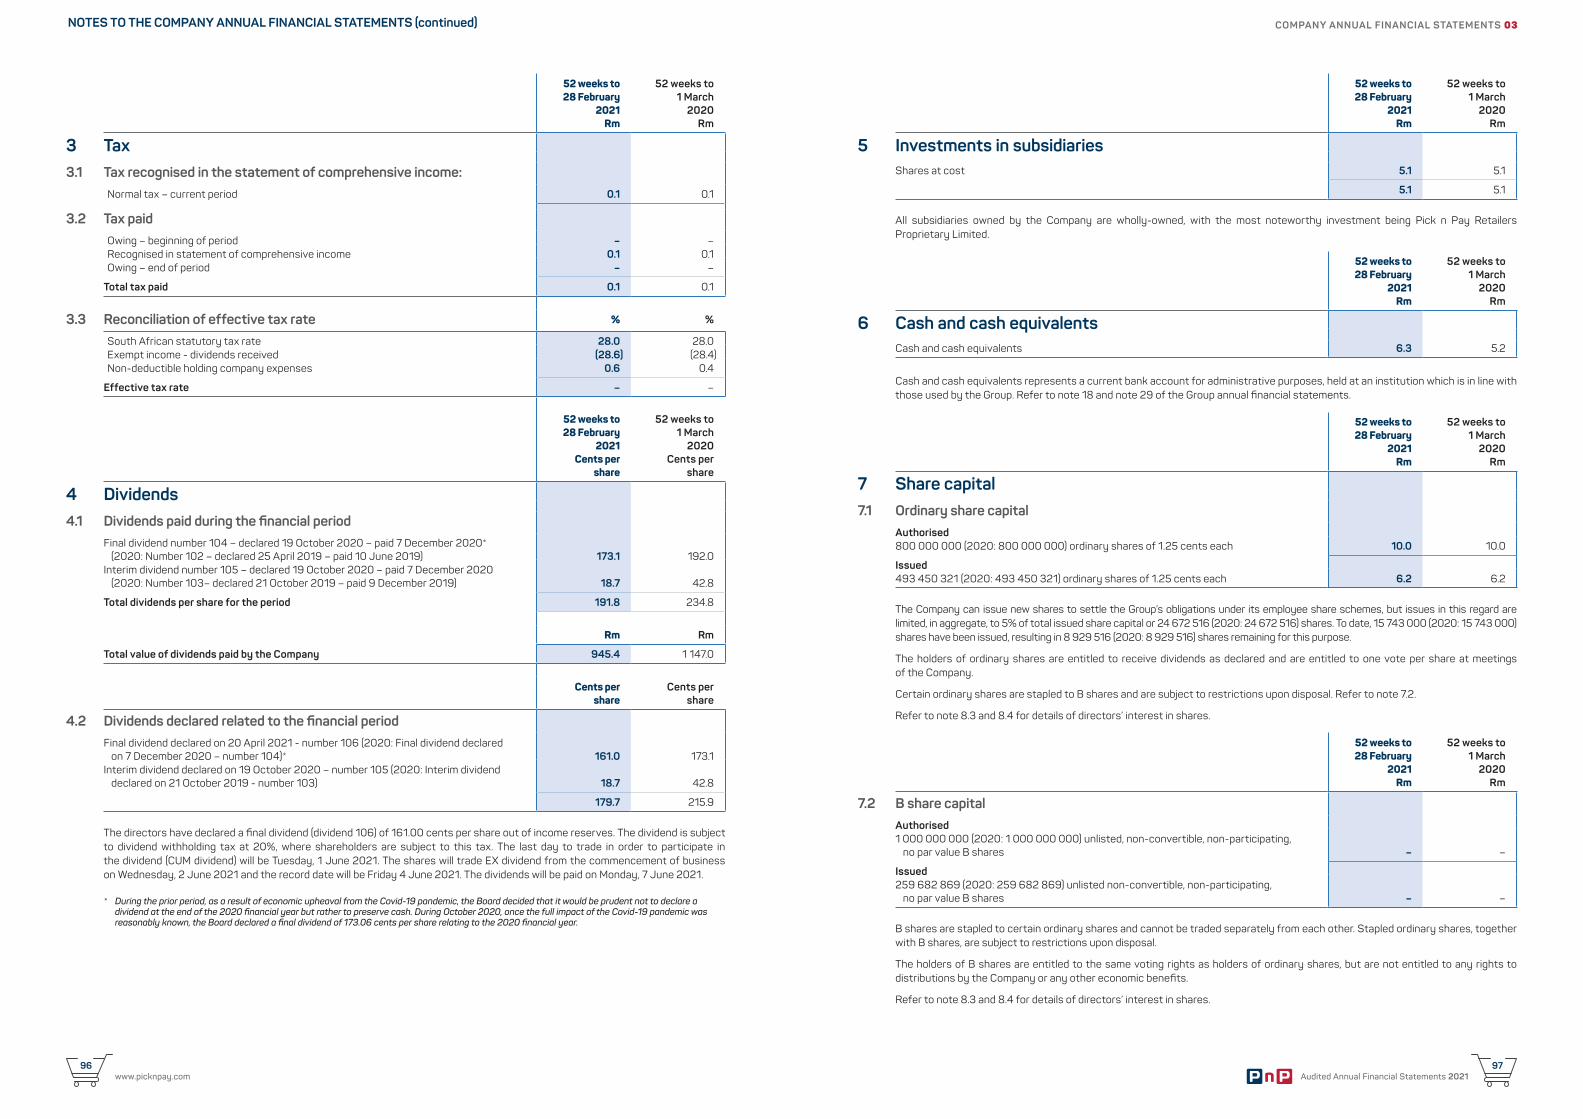
www.picknpay.com96
Audited Annual Financial Statements 202197
52 weeks to 28 February
2021 Rm
52 weeks to 1 March
2020 Rm
3 Tax3.1 Tax recognised in the statement of comprehensive income:
Normal tax – current period 0.1 0.1
3.2 Tax paidOwing – beginning of period – –Recognised in statement of comprehensive income 0.1 0.1 Owing – end of period – –
Total tax paid 0.1 0.1
3.3 Reconciliation of effective tax rate % %
South African statutory tax rate 28.0 28.0 Exempt income - dividends received (28.6) (28.4) Non-deductible holding company expenses 0.6 0.4
Effective tax rate – –
52 weeks to 28 February
2021Rm
52 weeks to 1 March
2020 Rm
5 Investments in subsidiaries Shares at cost 5.1 5.1
5.1 5.1
All subsidiaries owned by the Company are wholly-owned, with the most noteworthy investment being Pick n Pay Retailers Proprietary Limited.
52 weeks to 28 February
2021Rm
52 weeks to 1 March
2020 Rm
6 Cash and cash equivalentsCash and cash equivalents 6.3 5.2
Cash and cash equivalents represents a current bank account for administrative purposes, held at an institution which is in line with those used by the Group. Refer to note 18 and note 29 of the Group annual financial statements.
52 weeks to 28 February
2021Rm
52 weeks to 1 March
2020 Rm
7 Share capital 7.1 Ordinary share capital
Authorised800 000 000 (2020: 800 000 000) ordinary shares of 1.25 cents each 10.0 10.0
Issued493 450 321 (2020: 493 450 321) ordinary shares of 1.25 cents each 6.2 6.2
The Company can issue new shares to settle the Group’s obligations under its employee share schemes, but issues in this regard are limited, in aggregate, to 5% of total issued share capital or 24 672 516 (2020: 24 672 516) shares. To date, 15 743 000 (2020: 15 743 000) shares have been issued, resulting in 8 929 516 (2020: 8 929 516) shares remaining for this purpose.
The holders of ordinary shares are entitled to receive dividends as declared and are entitled to one vote per share at meetings of the Company.
Certain ordinary shares are stapled to B shares and are subject to restrictions upon disposal. Refer to note 7.2.
Refer to note 8.3 and 8.4 for details of directors’ interest in shares.
52 weeks to 28 February
2021Rm
52 weeks to 1 March
2020 Rm
7.2 B share capital Authorised1 000 000 000 (2020: 1 000 000 000) unlisted, non-convertible, non-participating,
no par value B shares – –
Issued 259 682 869 (2020: 259 682 869) unlisted non-convertible, non-participating,
no par value B shares – –
B shares are stapled to certain ordinary shares and cannot be traded separately from each other. Stapled ordinary shares, together with B shares, are subject to restrictions upon disposal.
The holders of B shares are entitled to the same voting rights as holders of ordinary shares, but are not entitled to any rights to distributions by the Company or any other economic benefits.
Refer to note 8.3 and 8.4 for details of directors’ interest in shares.
NOTES TO THE COMPANY ANNUAL FINANCIAL STATEMENTS (continued) COMPANY ANNUAL FINANCIAL STATEMENTS 03
52 weeks to 28 February
2021Cents per
share
52 weeks to 1 March
2020Cents per
share
4 Dividends4.1 Dividends paid during the financial period
Final dividend number 104 – declared 19 October 2020 – paid 7 December 2020* (2020: Number 102 – declared 25 April 2019 – paid 10 June 2019) 173.1 192.0
Interim dividend number 105 – declared 19 October 2020 – paid 7 December 2020 (2020: Number 103– declared 21 October 2019 – paid 9 December 2019) 18.7 42.8
Total dividends per share for the period 191.8 234.8
Rm Rm
Total value of dividends paid by the Company 945.4 1 147.0
Cents pershare
Cents pershare
4.2 Dividends declared related to the financial periodFinal dividend declared on 20 April 2021 - number 106 (2020: Final dividend declared
on 7 December 2020 – number 104)* 161.0 173.1 Interim dividend declared on 19 October 2020 – number 105 (2020: Interim dividend
declared on 21 October 2019 - number 103) 18.7 42.8
179.7 215.9
The directors have declared a final dividend (dividend 106) of 161.00 cents per share out of income reserves. The dividend is subject to dividend withholding tax at 20%, where shareholders are subject to this tax. The last day to trade in order to participate in the dividend (CUM dividend) will be Tuesday, 1 June 2021. The shares will trade EX dividend from the commencement of business on Wednesday, 2 June 2021 and the record date will be Friday 4 June 2021. The dividends will be paid on Monday, 7 June 2021.
* During the prior period, as a result of economic upheaval from the Covid-19 pandemic, the Board decided that it would be prudent not to declare a dividend at the end of the 2020 financial year but rather to preserve cash. During October 2020, once the full impact of the Covid-19 pandemic was reasonably known, the Board declared a final dividend of 173.06 cents per share relating to the 2020 financial year.
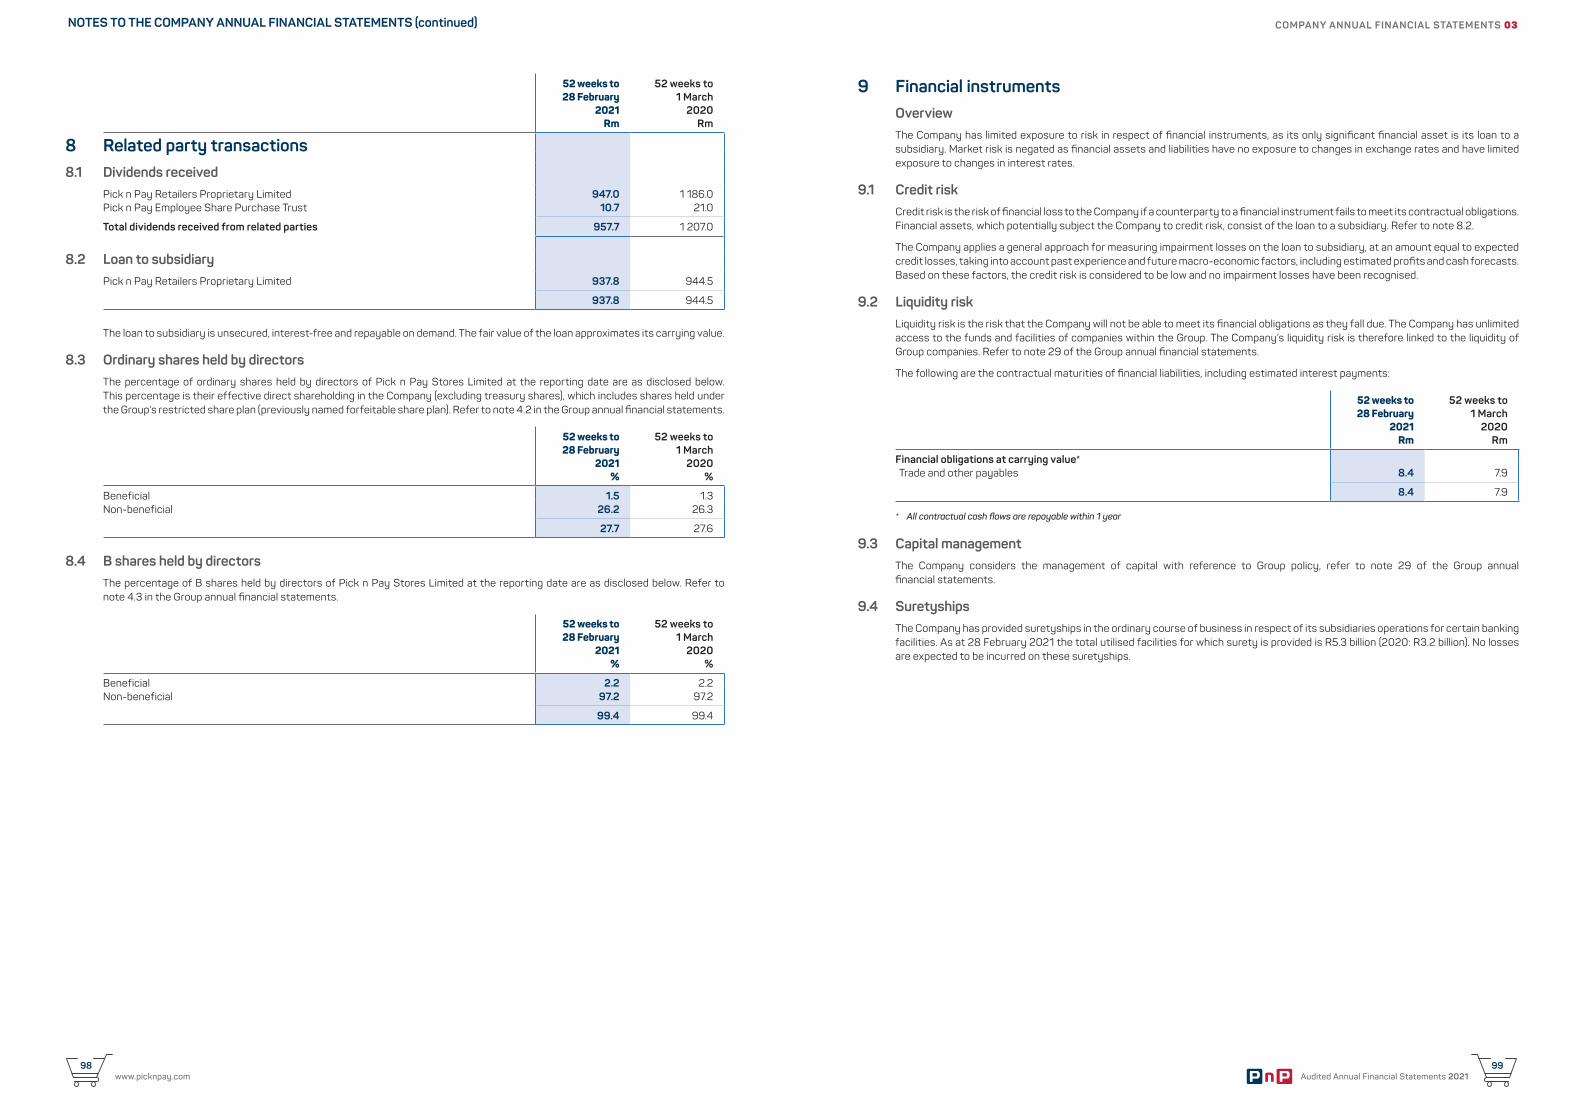
www.picknpay.com98
Audited Annual Financial Statements 202199
52 weeks to 28 February
2021Rm
52 weeks to 1 March
2020Rm
8 Related party transactions8.1 Dividends received
Pick n Pay Retailers Proprietary Limited 947.0 1 186.0 Pick n Pay Employee Share Purchase Trust 10.7 21.0
Total dividends received from related parties 957.7 1 207.0
8.2 Loan to subsidiaryPick n Pay Retailers Proprietary Limited 937.8 944.5
937.8 944.5
The loan to subsidiary is unsecured, interest-free and repayable on demand. The fair value of the loan approximates its carrying value.
8.3 Ordinary shares held by directorsThe percentage of ordinary shares held by directors of Pick n Pay Stores Limited at the reporting date are as disclosed below. This percentage is their effective direct shareholding in the Company (excluding treasury shares), which includes shares held under the Group’s restricted share plan (previously named forfeitable share plan). Refer to note 4.2 in the Group annual financial statements.
52 weeks to 28 February
2021%
52 weeks to 1 March
2020%
Beneficial 1.5 1.3 Non-beneficial 26.2 26.3
27.7 27.6
8.4 B shares held by directorsThe percentage of B shares held by directors of Pick n Pay Stores Limited at the reporting date are as disclosed below. Refer to note 4.3 in the Group annual financial statements.
52 weeks to 28 February
2021%
52 weeks to 1 March
2020%
Beneficial 2.2 2.2 Non-beneficial 97.2 97.2
99.4 99.4
9 Financial instrumentsOverviewThe Company has limited exposure to risk in respect of financial instruments, as its only significant financial asset is its loan to a subsidiary. Market risk is negated as financial assets and liabilities have no exposure to changes in exchange rates and have limited exposure to changes in interest rates.
9.1 Credit risk Credit risk is the risk of financial loss to the Company if a counterparty to a financial instrument fails to meet its contractual obligations. Financial assets, which potentially subject the Company to credit risk, consist of the loan to a subsidiary. Refer to note 8.2.
The Company applies a general approach for measuring impairment losses on the loan to subsidiary, at an amount equal to expected credit losses, taking into account past experience and future macro-economic factors, including estimated profits and cash forecasts. Based on these factors, the credit risk is considered to be low and no impairment losses have been recognised.
9.2 Liquidity riskLiquidity risk is the risk that the Company will not be able to meet its financial obligations as they fall due. The Company has unlimited access to the funds and facilities of companies within the Group. The Company’s liquidity risk is therefore linked to the liquidity of Group companies. Refer to note 29 of the Group annual financial statements.
The following are the contractual maturities of financial liabilities, including estimated interest payments:
52 weeks to28 February
2021 Rm
52 weeks to 1 March
2020Rm
Financial obligations at carrying value*Trade and other payables 8.4 7.9
8.4 7.9
* All contractual cash flows are repayable within 1 year
9.3 Capital managementThe Company considers the management of capital with reference to Group policy, refer to note 29 of the Group annual financial statements.
9.4 SuretyshipsThe Company has provided suretyships in the ordinary course of business in respect of its subsidiaries operations for certain banking facilities. As at 28 February 2021 the total utilised facilities for which surety is provided is R5.3 billion (2020: R3.2 billion). No losses are expected to be incurred on these suretyships.
NOTES TO THE COMPANY ANNUAL FINANCIAL STATEMENTS (continued) COMPANY ANNUAL FINANCIAL STATEMENTS 03

Audited Annual Financial Statements 2021101
w
04
AD
DIT
ION
AL
INFO
RM
ATIO
N
102Appendices
106Analysis of ordinary shareholders
107Analysis of B shareholders
108Corporate information
www.picknpay.com100
Audited Annual Financial Statements 2021101
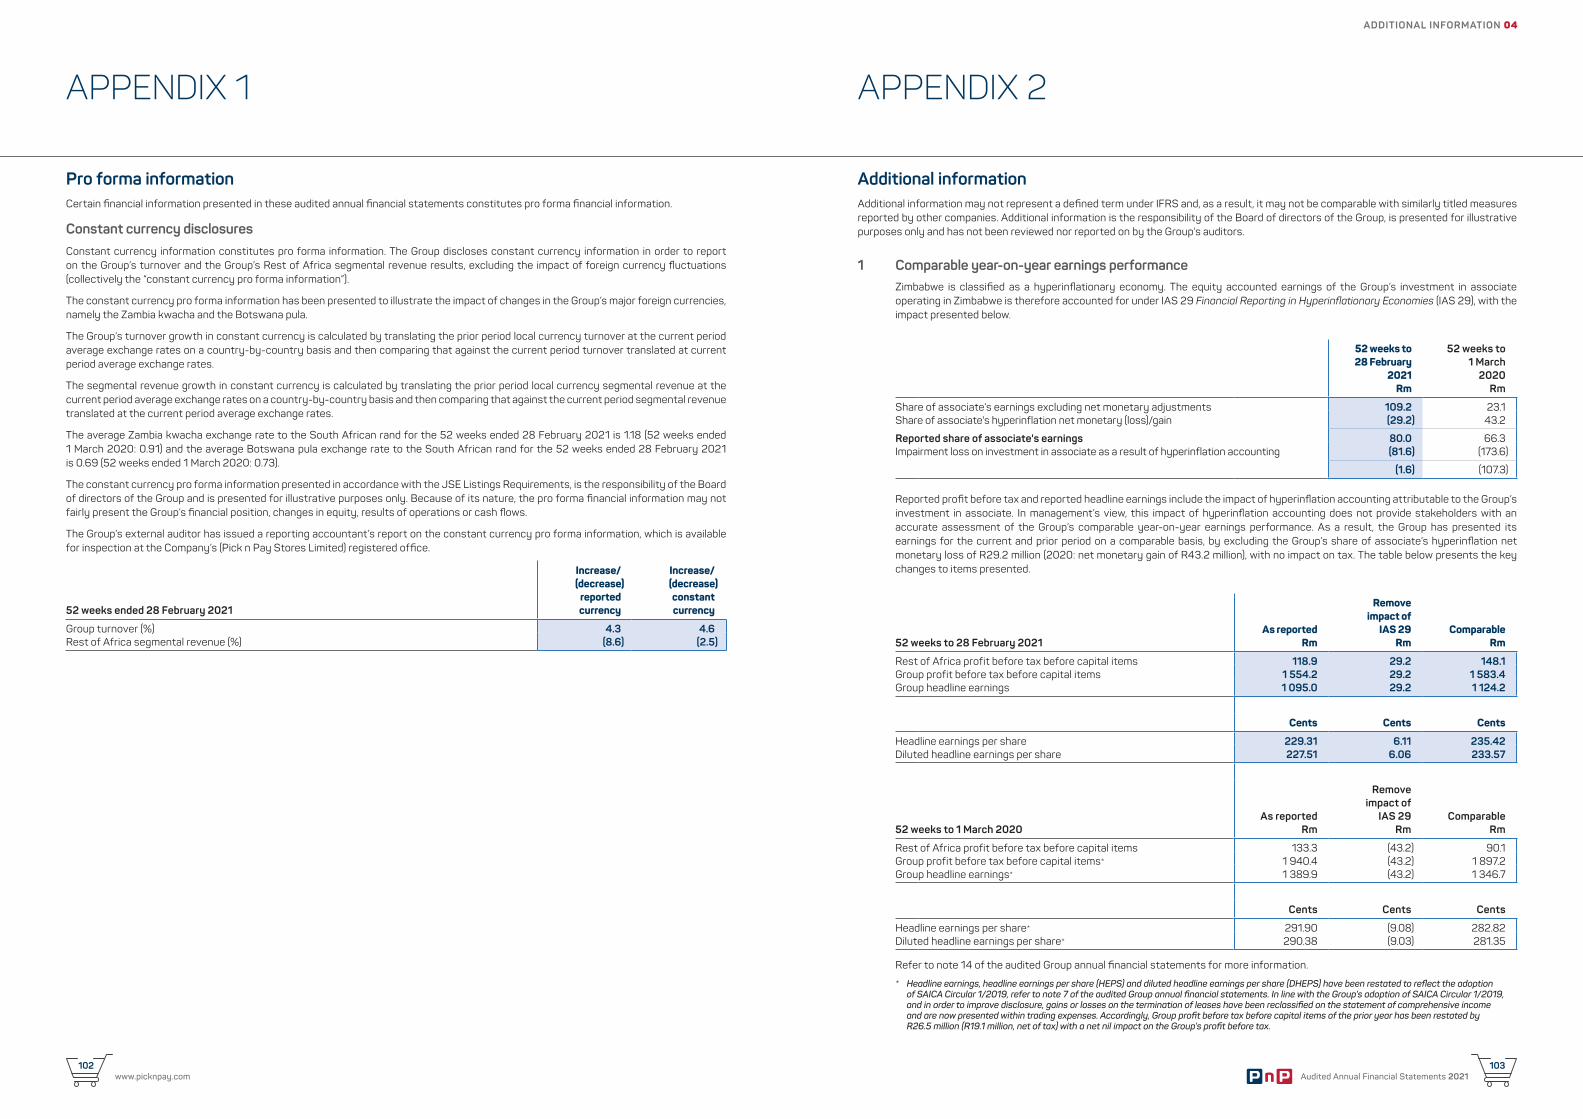
www.picknpay.com102
Audited Annual Financial Statements 2021103
ADDITIONAL INFORMATION 04
APPENDIX 1 APPENDIX 2
Pro forma informationCertain financial information presented in these audited annual financial statements constitutes pro forma financial information.
Constant currency disclosures Constant currency information constitutes pro forma information. The Group discloses constant currency information in order to report on the Group’s turnover and the Group’s Rest of Africa segmental revenue results, excluding the impact of foreign currency fluctuations (collectively the “constant currency pro forma information”).
The constant currency pro forma information has been presented to illustrate the impact of changes in the Group’s major foreign currencies, namely the Zambia kwacha and the Botswana pula.
The Group’s turnover growth in constant currency is calculated by translating the prior period local currency turnover at the current period average exchange rates on a country-by-country basis and then comparing that against the current period turnover translated at current period average exchange rates.
The segmental revenue growth in constant currency is calculated by translating the prior period local currency segmental revenue at the current period average exchange rates on a country-by-country basis and then comparing that against the current period segmental revenue translated at the current period average exchange rates.
The average Zambia kwacha exchange rate to the South African rand for the 52 weeks ended 28 February 2021 is 1.18 (52 weeks ended 1 March 2020: 0.91) and the average Botswana pula exchange rate to the South African rand for the 52 weeks ended 28 February 2021 is 0.69 (52 weeks ended 1 March 2020: 0.73).
The constant currency pro forma information presented in accordance with the JSE Listings Requirements, is the responsibility of the Board of directors of the Group and is presented for illustrative purposes only. Because of its nature, the pro forma financial information may not fairly present the Group’s financial position, changes in equity, results of operations or cash flows.
The Group’s external auditor has issued a reporting accountant’s report on the constant currency pro forma information, which is available for inspection at the Company’s (Pick n Pay Stores Limited) registered office.
52 weeks ended 28 February 2021
Increase/(decrease)
reportedcurrency
Increase/(decrease)constantcurrency
Group turnover (%) 4.3 4.6 Rest of Africa segmental revenue (%) (8.6) (2.5)
Additional informationAdditional information may not represent a defined term under IFRS and, as a result, it may not be comparable with similarly titled measures reported by other companies. Additional information is the responsibility of the Board of directors of the Group, is presented for illustrative purposes only and has not been reviewed nor reported on by the Group’s auditors.
1 Comparable year-on-year earnings performance Zimbabwe is classified as a hyperinflationary economy. The equity accounted earnings of the Group’s investment in associate operating in Zimbabwe is therefore accounted for under IAS 29 Financial Reporting in Hyperinflationary Economies (IAS 29), with the impact presented below.
52 weeks to 28 February
2021 Rm
52 weeks to 1 March
2020 Rm
Share of associate’s earnings excluding net monetary adjustments 109.2 23.1 Share of associate's hyperinflation net monetary (loss)/gain (29.2) 43.2
Reported share of associate's earnings 80.0 66.3 Impairment loss on investment in associate as a result of hyperinflation accounting (81.6) (173.6)
(1.6) (107.3)
Reported profit before tax and reported headline earnings include the impact of hyperinflation accounting attributable to the Group’s investment in associate. In management’s view, this impact of hyperinflation accounting does not provide stakeholders with an accurate assessment of the Group’s comparable year-on-year earnings performance. As a result, the Group has presented its earnings for the current and prior period on a comparable basis, by excluding the Group’s share of associate’s hyperinflation net monetary loss of R29.2 million (2020: net monetary gain of R43.2 million), with no impact on tax. The table below presents the key changes to items presented.
52 weeks to 28 February 2021As reported
Rm
Removeimpact of
IAS 29 Rm
Comparable Rm
Rest of Africa profit before tax before capital items 118.9 29.2 148.1 Group profit before tax before capital items 1 554.2 29.2 1 583.4 Group headline earnings 1 095.0 29.2 1 124.2
Cents Cents Cents
Headline earnings per share 229.31 6.11 235.42 Diluted headline earnings per share 227.51 6.06 233.57
52 weeks to 1 March 2020As reported
Rm
Removeimpact of
IAS 29 Rm
Comparable Rm
Rest of Africa profit before tax before capital items 133.3 (43.2) 90.1 Group profit before tax before capital items* 1 940.4 (43.2) 1 897.2 Group headline earnings* 1 389.9 (43.2) 1 346.7
Cents Cents Cents
Headline earnings per share* 291.90 (9.08) 282.82 Diluted headline earnings per share* 290.38 (9.03) 281.35
Refer to note 14 of the audited Group annual financial statements for more information.
* Headline earnings, headline earnings per share (HEPS) and diluted headline earnings per share (DHEPS) have been restated to reflect the adoption of SAICA Circular 1/2019, refer to note 7 of the audited Group annual financial statements. In line with the Group’s adoption of SAICA Circular 1/2019, and in order to improve disclosure, gains or losses on the termination of leases have been reclassified on the statement of comprehensive income and are now presented within trading expenses. Accordingly, Group profit before tax before capital items of the prior year has been restated by R26.5 million (R19.1 million, net of tax) with a net nil impact on the Group’s profit before tax.
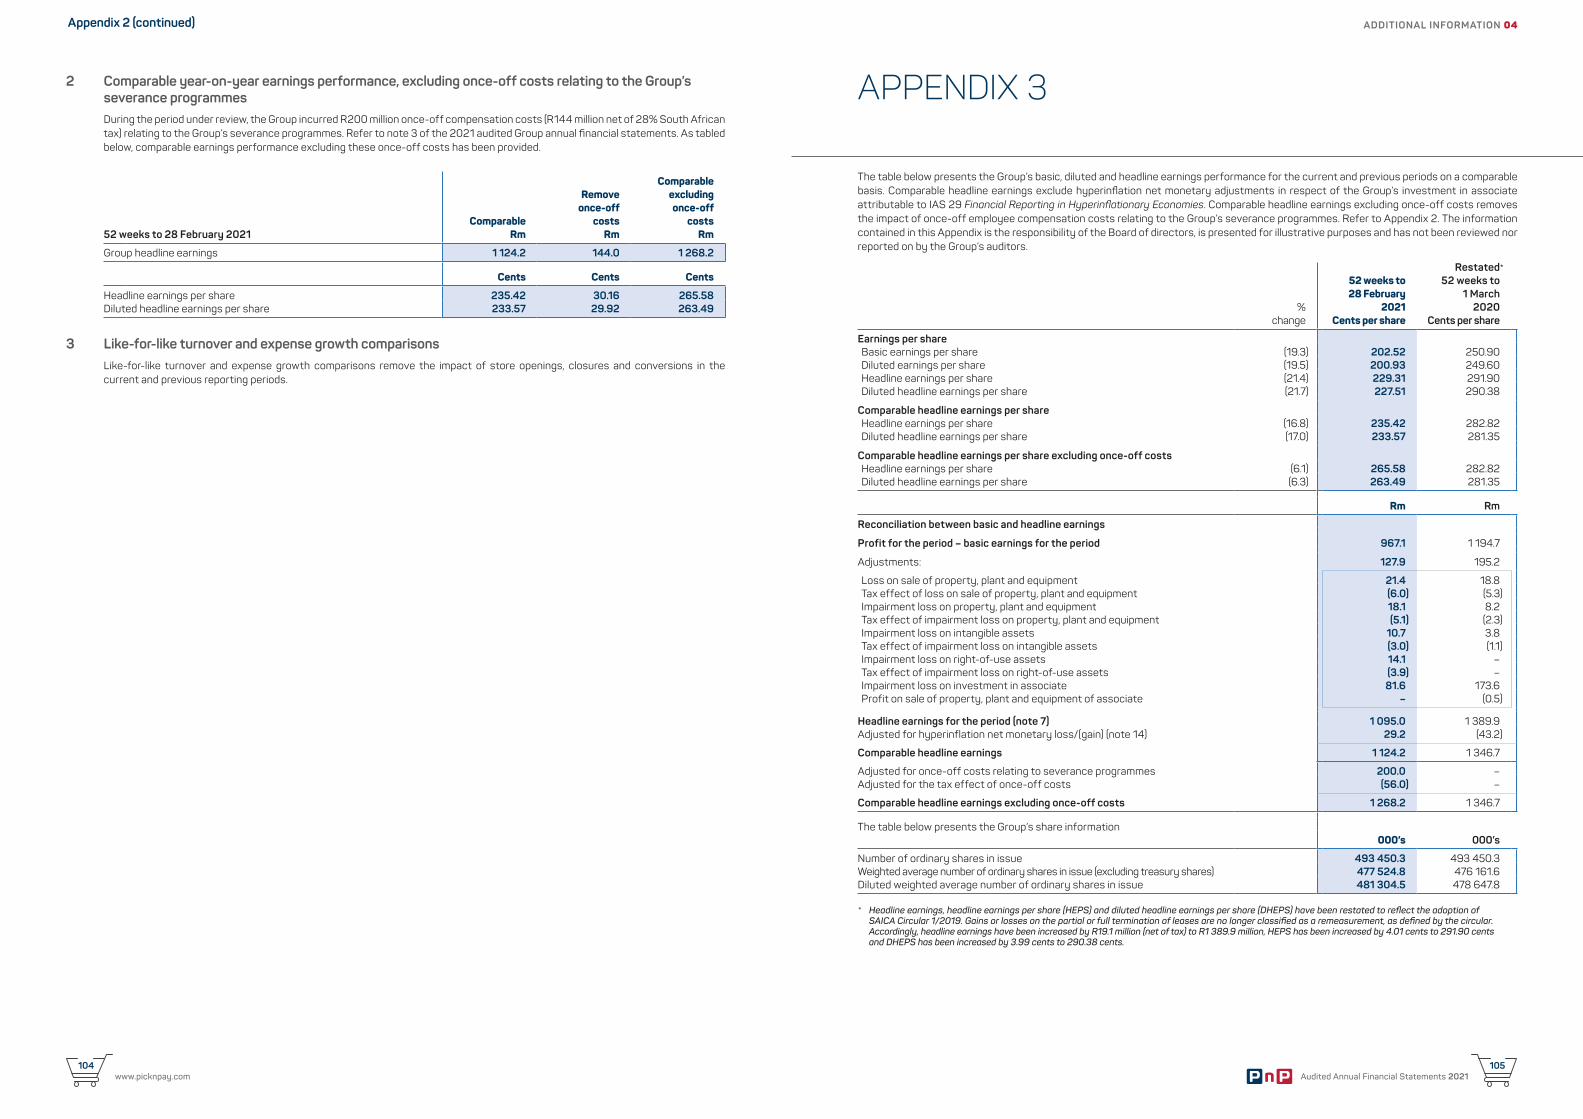
www.picknpay.com104
Audited Annual Financial Statements 2021105
APPENDIX 3
ADDITIONAL INFORMATION 04
2 Comparable year-on-year earnings performance, excluding once-off costs relating to the Group’s severance programmes During the period under review, the Group incurred R200 million once-off compensation costs (R144 million net of 28% South African tax) relating to the Group’s severance programmes. Refer to note 3 of the 2021 audited Group annual financial statements. As tabled below, comparable earnings performance excluding these once-off costs has been provided.
52 weeks to 28 February 2021Comparable
Rm
Removeonce-off
costs Rm
Comparableexcludingonce-off
costs Rm
Group headline earnings 1 124.2 144.0 1 268.2
Cents Cents Cents
Headline earnings per share 235.42 30.16 265.58 Diluted headline earnings per share 233.57 29.92 263.49
3 Like-for-like turnover and expense growth comparisons Like-for-like turnover and expense growth comparisons remove the impact of store openings, closures and conversions in the current and previous reporting periods.
Appendix 2 (continued)
The table below presents the Group’s basic, diluted and headline earnings performance for the current and previous periods on a comparable basis. Comparable headline earnings exclude hyperinflation net monetary adjustments in respect of the Group’s investment in associate attributable to IAS 29 Financial Reporting in Hyperinflationary Economies. Comparable headline earnings excluding once-off costs removes the impact of once-off employee compensation costs relating to the Group’s severance programmes. Refer to Appendix 2. The information contained in this Appendix is the responsibility of the Board of directors, is presented for illustrative purposes and has not been reviewed nor reported on by the Group’s auditors.
%change
52 weeks to 28 February
2021 Cents per share
Restated*52 weeks to
1 March 2020
Cents per share
Earnings per shareBasic earnings per share (19.3) 202.52 250.90Diluted earnings per share (19.5) 200.93 249.60Headline earnings per share (21.4) 229.31 291.90Diluted headline earnings per share (21.7) 227.51 290.38
Comparable headline earnings per shareHeadline earnings per share (16.8) 235.42 282.82 Diluted headline earnings per share (17.0) 233.57 281.35
Comparable headline earnings per share excluding once-off costsHeadline earnings per share (6.1) 265.58 282.82 Diluted headline earnings per share (6.3) 263.49 281.35
Rm Rm
Reconciliation between basic and headline earnings
Profit for the period – basic earnings for the period 967.1 1 194.7
Adjustments: 127.9 195.2
Loss on sale of property, plant and equipment 21.4 18.8 Tax effect of loss on sale of property, plant and equipment (6.0) (5.3) Impairment loss on property, plant and equipment 18.1 8.2 Tax effect of impairment loss on property, plant and equipment (5.1) (2.3) Impairment loss on intangible assets 10.7 3.8 Tax effect of impairment loss on intangible assets (3.0) (1.1) Impairment loss on right-of-use assets 14.1 – Tax effect of impairment loss on right-of-use assets (3.9) – Impairment loss on investment in associate 81.6 173.6 Profit on sale of property, plant and equipment of associate – (0.5)
Headline earnings for the period (note 7) 1 095.0 1 389.9 Adjusted for hyperinflation net monetary loss/(gain) (note 14) 29.2 (43.2)
Comparable headline earnings 1 124.2 1 346.7
Adjusted for once-off costs relating to severance programmes 200.0 – Adjusted for the tax effect of once-off costs (56.0) –
Comparable headline earnings excluding once-off costs 1 268.2 1 346.7
The table below presents the Group’s share information 000’s 000’s
Number of ordinary shares in issue 493 450.3 493 450.3 Weighted average number of ordinary shares in issue (excluding treasury shares) 477 524.8 476 161.6 Diluted weighted average number of ordinary shares in issue 481 304.5 478 647.8
* Headline earnings, headline earnings per share (HEPS) and diluted headline earnings per share (DHEPS) have been restated to reflect the adoption of SAICA Circular 1/2019. Gains or losses on the partial or full termination of leases are no longer classified as a remeasurement, as defined by the circular. Accordingly, headline earnings have been increased by R19.1 million (net of tax) to R1 389.9 million, HEPS has been increased by 4.01 cents to 291.90 cents and DHEPS has been increased by 3.99 cents to 290.38 cents.
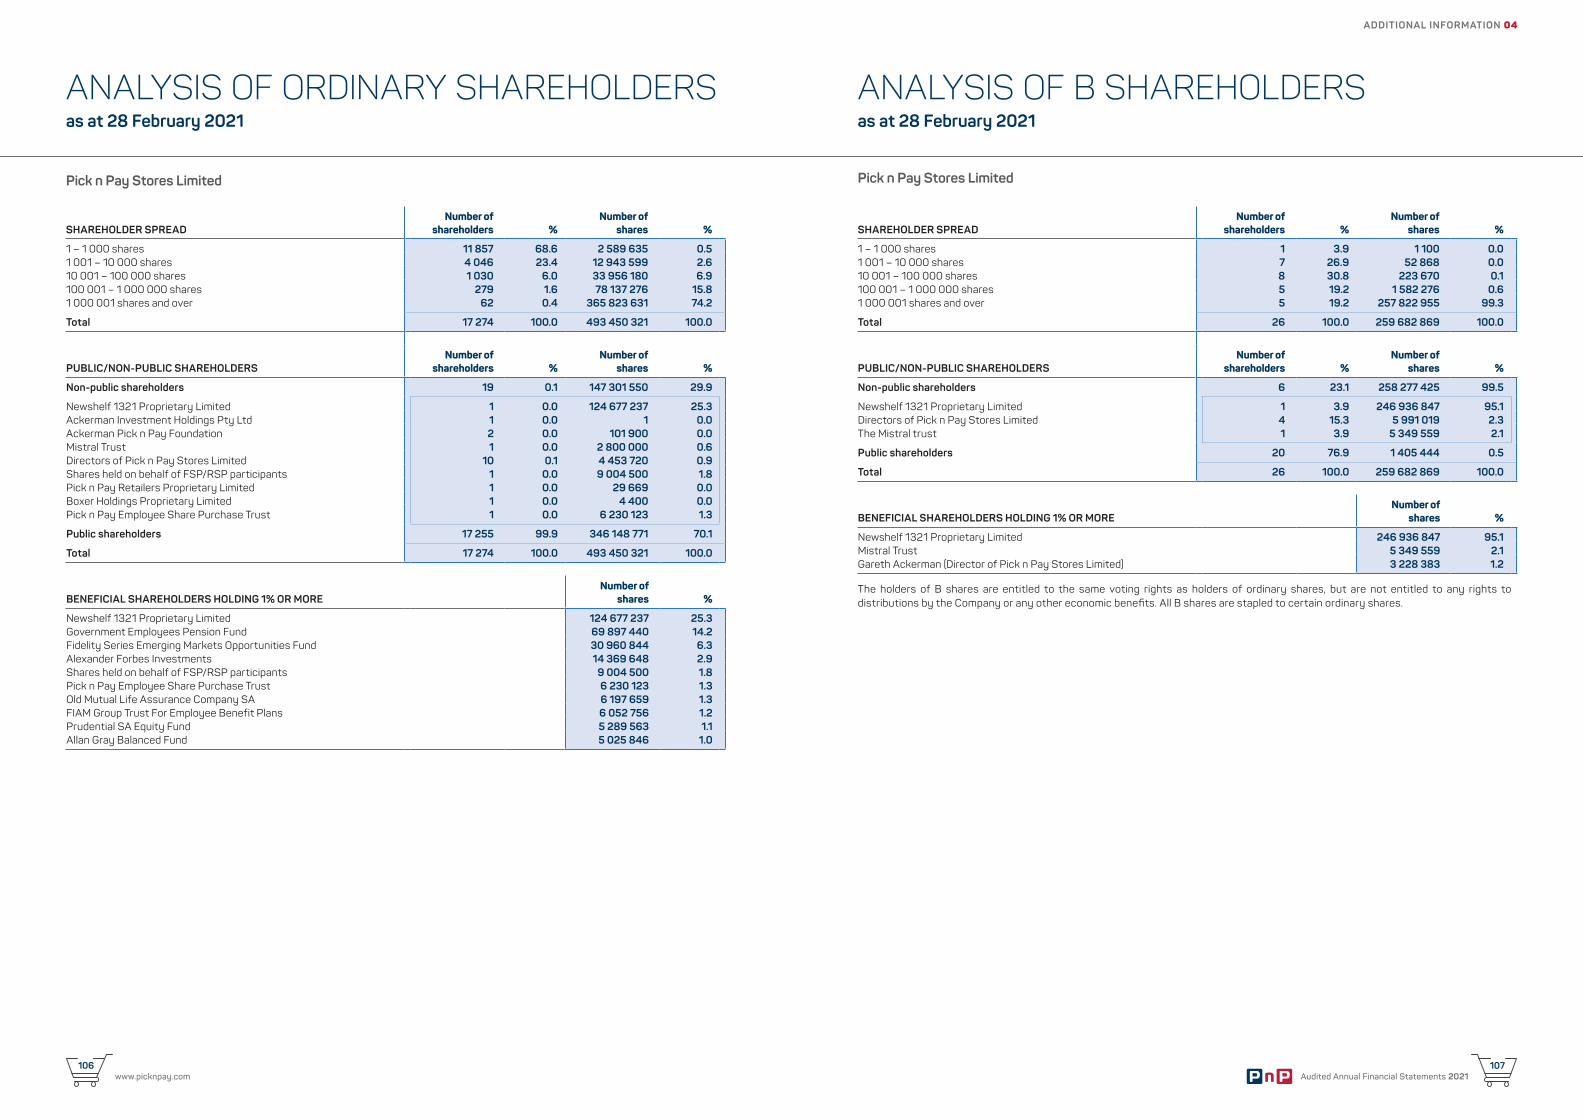
www.picknpay.com106
Pick n Pay Stores Limited
Audited Annual Financial Statements 2021107
ANALYSIS OF B SHAREHOLDERSas at 28 February 2021
ANALYSIS OF ORDINARY SHAREHOLDERSas at 28 February 2021
ADDITIONAL INFORMATION 04
SHAREHOLDER SPREADNumber of
shareholders %Number of
shares %
1 – 1 000 shares 1 3.9 1 100 0.0 1 001 – 10 000 shares 7 26.9 52 868 0.0 10 001 – 100 000 shares 8 30.8 223 670 0.1 100 001 – 1 000 000 shares 5 19.2 1 582 276 0.6 1 000 001 shares and over 5 19.2 257 822 955 99.3
Total 26 100.0 259 682 869 100.0
PUBLIC/NON-PUBLIC SHAREHOLDERSNumber of
shareholders %Number of
shares %
Non-public shareholders 6 23.1 258 277 425 99.5
Newshelf 1321 Proprietary Limited 1 3.9 246 936 847 95.1 Directors of Pick n Pay Stores Limited 4 15.3 5 991 019 2.3 The Mistral trust 1 3.9 5 349 559 2.1
Public shareholders 20 76.9 1 405 444 0.5
Total 26 100.0 259 682 869 100.0
BENEFICIAL SHAREHOLDERS HOLDING 1% OR MORENumber of
shares %
Newshelf 1321 Proprietary Limited 246 936 847 95.1 Mistral Trust 5 349 559 2.1 Gareth Ackerman (Director of Pick n Pay Stores Limited) 3 228 383 1.2
The holders of B shares are entitled to the same voting rights as holders of ordinary shares, but are not entitled to any rights to distributions by the Company or any other economic benefits. All B shares are stapled to certain ordinary shares.
SHAREHOLDER SPREADNumber of
shareholders %Number of
shares %
1 – 1 000 shares 11 857 68.6 2 589 635 0.5 1 001 – 10 000 shares 4 046 23.4 12 943 599 2.6 10 001 – 100 000 shares 1 030 6.0 33 956 180 6.9 100 001 – 1 000 000 shares 279 1.6 78 137 276 15.8 1 000 001 shares and over 62 0.4 365 823 631 74.2
Total 17 274 100.0 493 450 321 100.0
PUBLIC/NON-PUBLIC SHAREHOLDERSNumber of
shareholders %Number of
shares %
Non-public shareholders 19 0.1 147 301 550 29.9
Newshelf 1321 Proprietary Limited 1 0.0 124 677 237 25.3 Ackerman Investment Holdings Pty Ltd 1 0.0 1 0.0 Ackerman Pick n Pay Foundation 2 0.0 101 900 0.0 Mistral Trust 1 0.0 2 800 000 0.6 Directors of Pick n Pay Stores Limited 10 0.1 4 453 720 0.9 Shares held on behalf of FSP/RSP participants 1 0.0 9 004 500 1.8 Pick n Pay Retailers Proprietary Limited 1 0.0 29 669 0.0 Boxer Holdings Proprietary Limited 1 0.0 4 400 0.0 Pick n Pay Employee Share Purchase Trust 1 0.0 6 230 123 1.3
Public shareholders 17 255 99.9 346 148 771 70.1
Total 17 274 100.0 493 450 321 100.0
BENEFICIAL SHAREHOLDERS HOLDING 1% OR MORENumber of
shares %
Newshelf 1321 Proprietary Limited 124 677 237 25.3 Government Employees Pension Fund 69 897 440 14.2 Fidelity Series Emerging Markets Opportunities Fund 30 960 844 6.3 Alexander Forbes Investments 14 369 648 2.9 Shares held on behalf of FSP/RSP participants 9 004 500 1.8 Pick n Pay Employee Share Purchase Trust 6 230 123 1.3Old Mutual Life Assurance Company SA 6 197 659 1.3 FIAM Group Trust For Employee Benefit Plans 6 052 756 1.2 Prudential SA Equity Fund 5 289 563 1.1 Allan Gray Balanced Fund 5 025 846 1.0
Pick n Pay Stores Limited
SECTION (continued)
www.picknpay.com108
CORPORATE INFORMATION
Pick n Pay Stores Limited Registration number: 1968/008034/06JSE share code: PIKISIN: ZAE000005443
Board of directorsExecutive directors*Pieter Boone (CEO)Lerena Olivier (CFO)Suzanne Ackerman-BermanJonathan Ackerman
Non-executiveGareth Ackerman (Chair)Aboubakar JakoetDavid Robins
Independent non-executiveHaroon BhoratMariam CassimDavid FriedlandHugh HermanAudrey MothupiAnnamarie van der MerweJeff van Rooyen
Registered officePick n Pay Office Park101 Rosmead AvenueKenilworthCape Town 7708Tel +27 21 658 1000Fax +27 21 797 0314
Postal addressPO Box 23087ClaremontCape Town 7735
RegistrarComputershare Investor Services Proprietary LimitedRosebank Towers15 Biermann AvenueRosebank 2196Tel +27 11 370 5000Fax +27 11 688 5248
Postal addressPrivate Bag X9000Saxonwold 2132
JSE Limited sponsorInvestec Bank Limited100 Grayston DriveSandton 2196
AuditorsErnst & Young Inc.
AttorneysEdward Nathan Sonnenbergs
Principal transactional bankersAbsa LimitedFirst National Bank
Company SecretaryDebra MullerEmail address: [email protected]
Promotion of Access to Information [email protected]
Investor relationsPenny GerberEmail address: [email protected]
WebsitePick n Pay: www.picknpay.comInvestor relations: www.picknpayinvestor.co.za
Customer carelinePick n PayTel +27 860 30 30 30Email address: [email protected]
BoxerTel +27 860 02 69 37Email address: [email protected]
Online shoppingTel +27 860 30 30 30www.picknpay.com
Engage with us on
* Richard Brasher has retired as CEO of the Group at the end of April 2021, Pieter Boone was appointed in his stead. Richard van Rensburg retired from the Group at the end of March 2021.
GREYMATTERFINCH #15026