Embed Size (px)
Citation preview
HELIX WATER DISTRICT
COMPREHENSIVE ANNUAL FINANCIAL REPORT
FOR THE FISCAL YEAR ENDED JUNE 30, 2017
(WITH COMPARATIVE INFORMATION FOR 2016)

HELIX WATER DISTRICT COMPREHENSIVE ANNUAL FINANCIAL REPORT
FOR THE FISCAL YEAR ENDED JUNE 30, 2017 (WITH COMPARATIVE INFORMATION FOR 2016)
TABLE OF CONTENTS
Page
I. Introductory Section Directory of Officials i Organizational Chart ii Letter of Transmittal iii Certificate of Achievement for Excellence in Financial Reporting viii
II. Financial Section Independent Auditors’ Report 1 Management’s Discussion and Analysis 4 Basic Financial Statements
Statement of Net Position 12 Statement of Revenues, Expenses and Changes in Net Position 14 Statement of Cash Flows 15 Notes to the Basic Financial Statements 17
Required Supplementary Information
Schedule of Changes in the Net Position Liability and Related Ratios 40 Schedule of Contributions-Pension 41 Schedule of Funding Progress – Helix Water District Other Post Employment Benefits 42
III. Statistical Section
Contents 43
Net Position – Last Ten Fiscal Years 44 Changes in Net Position – Last Ten Fiscal Years 45 Water Sold by Type of Customer – Last Ten Fiscal Years 47 District Water Rates – Last Ten Fiscal Years 48 District Funds – Last Ten Fiscal Years 49 Ten Largest Water Customers – Last Ten Fiscal Years 50 Ratios of Outstanding Debt – Last Ten Fiscal Years 51 Debt Coverage Ratio – Last Ten Fiscal Years 52 Economic Statistics – Last Ten Fiscal Years 53 Local Area Employment Profile for the Years 2010 and 2000 54 Operational Information – Employees – Last Ten Fiscal Years 55 Active Meters by Size – Last Ten Fiscal Years 56 Operational Information – Assets – Last Ten Fiscal Years 57 Water Production & Consumption – Last Ten Fiscal Years 58 Capital Assets – Last Ten Fiscal Years 59

INTRODUCTORY SECTION
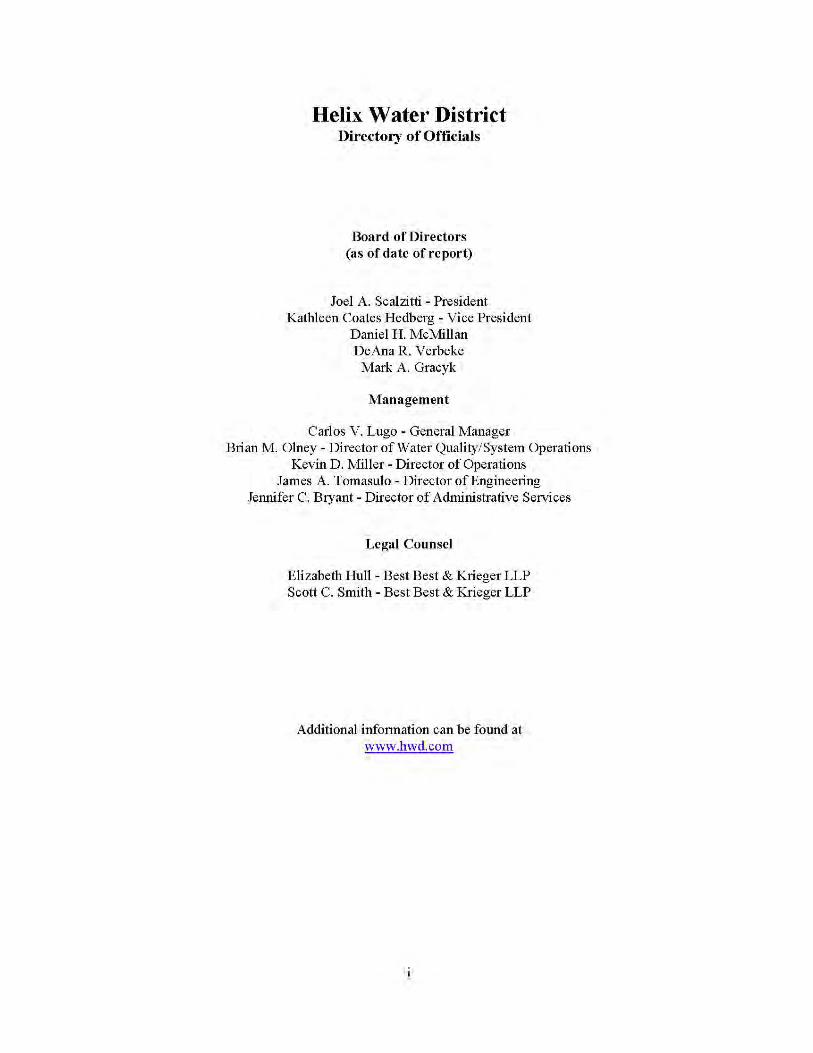
DIRECTORY OF OFFICIALS
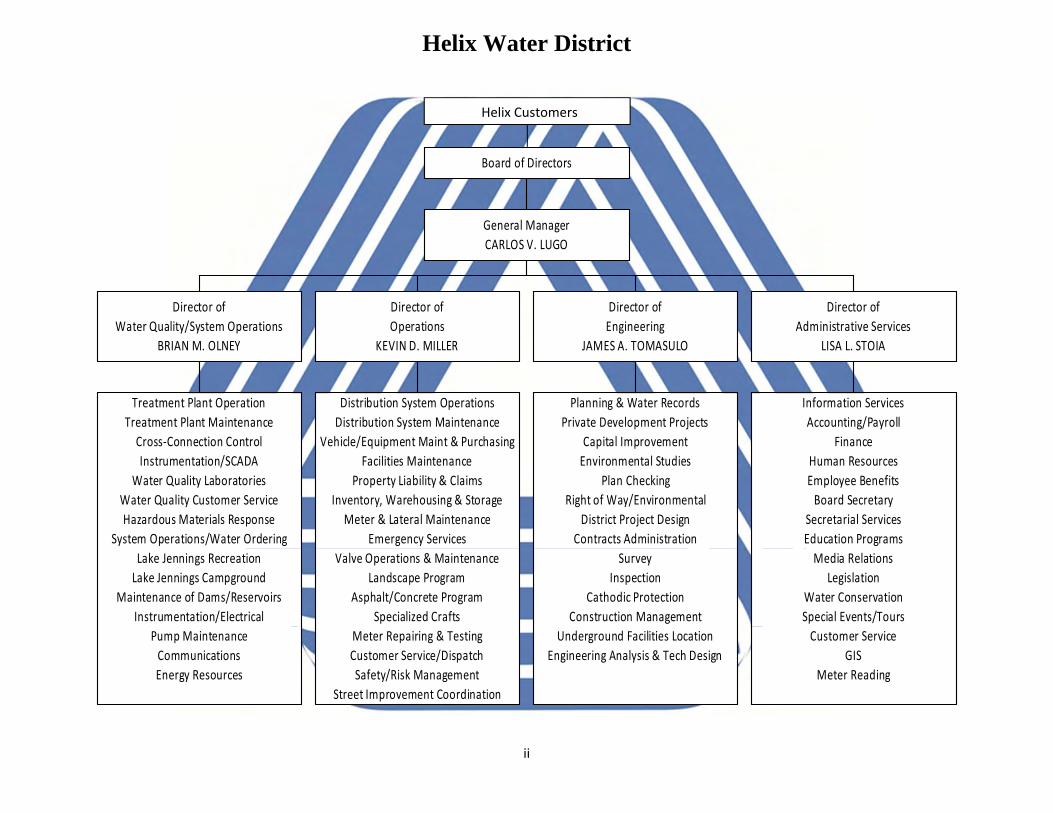
Helix Water District
ii
Treatment Plant OperationTreatment Plant MaintenanceCross‐Connection ControlInstrumentation/SCADA
Water Quality LaboratoriesWater Quality Customer ServiceHazardous Materials Response
System Operations/Water OrderingLake Jennings RecreationLake Jennings Campground
Maintenance of Dams/ReservoirsInstrumentation/Electrical
Pump MaintenanceCommunicationsEnergy Resources
Director ofWater Quality/System Operations
BRIAN M. OLNEY
Distribution System OperationsDistribution System Maintenance
Vehicle/Equipment Maint & PurchasingFacilities Maintenance
Property Liability & ClaimsInventory, Warehousing & Storage
Meter & Lateral MaintenanceEmergency Services
Valve Operations & MaintenanceLandscape Program
Asphalt/Concrete ProgramSpecialized Crafts
Meter Repairing & TestingCustomer Service/DispatchSafety/Risk Management
Street Improvement Coordination
Director ofOperations
KEVIN D. MILLER
Planning & Water RecordsPrivate Development Projects
Capital ImprovementEnvironmental Studies
Plan CheckingRight of Way/Environmental
District Project DesignContracts Administration
SurveyInspection
Cathodic ProtectionConstruction Management
Underground Facilities LocationEngineering Analysis & Tech Design
Director ofEngineering
JAMES A. TOMASULO
Information ServicesAccounting/Payroll
FinanceHuman ResourcesEmployee BenefitsBoard Secretary
Secretarial ServicesEducation ProgramsMedia Relations
LegislationWater ConservationSpecial Events/ToursCustomer Service
GISMeter Reading
Director ofAdministrative Services
LISA L. STOIA
General ManagerCARLOS V. LUGO
Board of Directors
Helix Customers


viii

FINANCIAL SECTION

1
INDEPENDENT AUDITORS' REPORT
Board of Directors Helix Water District La Mesa, California
Report on the Financial Statements
We have audited the accompanying financial statements of the Helix Water District (District), as of and for the year ended June 30, 2017, and the related notes to the financial statements, which collectively comprise the District's basic financial statements as listed in the table of contents.
Management's Responsibility for the Financial Statements
Management is responsible for the preparation and fair presentation of these financial statements in accordance with accounting principles generally accepted in the United States of America; this includes the design, implementation, and maintenance of internal control relevant to the preparation and fair presentation of financial statements that are free from material misstatement, whether due to fraud or error.
Auditors’ Responsibility
Our responsibility is to express an opinion on these financial statements based on our audit. We conducted our audit in accordance with auditing standards generally accepted in the United States of America and the standards applicable to financial audits contained in Government Auditing Standards, issued by the Comptroller General of the United States. Those standards require that we plan and perform the audit to obtain reasonable assurance about whether the financial statements are free from material misstatement.
An audit involves performing procedures to obtain audit evidence about the amounts and disclosures in the financial statements. The procedures selected depend on the auditor's judgment, including the assessment of the risks of material misstatement of the financial statements, whether due to fraud or error. In making those risk assessments, the auditor considers internal control relevant to the entity's preparation and fair presentation of the financial statements in order to design audit procedures that are appropriate in the circumstances, but not for the purpose of expressing an opinion on the effectiveness of the entity's internal control. Accordingly, we express no such opinion. An audit also includes evaluating the appropriateness of accounting policies used and the reasonableness of significant accounting estimates made by management, as well as evaluating the overall presentation of the financial statements.
We believe that the audit evidence we have obtained is sufficient and appropriate to provide a basis for our audit opinion.
2
Opinion In our opinion, the financial statements referred to above present fairly, in all material respects, the financial position of the District, as of June 30, 2017, and the changes in financial position and cash flows thereof for the year then ended in accordance with accounting principles generally accepted in the United States of America. Emphasis of Matter As described in Note 2 to the financial statements, the District adopted Governmental Accounting Standards Board (GASB) Statement No. 82, Pension Issues—an amendment of GASB Statements No. 67, No. 68, and No. 73, as of July 1, 2016. Our opinion is not modified with respect to this matter. Other Matters Required Supplementary Information Accounting principles generally accepted in the United States of America require that the management’s discussion and analysis on pages 4 through 11, schedule of changes in the net pension liability and related ratios on page 40, schedule of contributions on page 41, and schedule of funding progress of the other post-employment benefit plan on page 42 be presented to supplement the basic financial statements. Such information, although not a part of the basic financial statements, is required by the Governmental Accounting Standards Board who considers it to be an essential part of financial reporting for placing the basic financial statements in an appropriate operational, economic, or historical context. We have applied certain limited procedures to the required supplementary information in accordance with auditing standards generally accepted in the United States of America, which consisted of inquiries of management about the methods of preparing the information and comparing the information for consistency with management's responses to our inquiries, the basic financial statements, and other knowledge we obtained during our audit of the basic financial statements. We do not express an opinion or provide any assurance on the information because the limited procedures do not provide us with sufficient evidence to express an opinion or provide any assurance. Other Information Our audit was conducted for the purpose of forming opinion on the financial statements that collectively comprise the District’s basic financial statements. The introductory section and statistical section are presented for purposes of additional analysis and are not a required part of the basic financial statements. The introductory section and statistical section have not been subjected to the auditing procedures applied in the audit of the basic financial statements, and accordingly, we do not express an opinion or provide any assurance on them. Prior-Year Comparative Information The financial statements include partial prior-year comparative information. Such information does not include all of the information required or sufficient detail to constitute a presentation in accordance with accounting principles generally accepted in the United States of America. Accordingly, such information should be read in conjunction with the District’s financial statements for the year ended June 30, 2016, from which such partial information was derived. We have audited the District’s financial statements as of and for the year ended June 30, 2016 and our report dated September 23, 2016 expressed an unmodified opinion on the financial statements.
3
Other Reporting Required by Government Auditing Standards In accordance with Government Auditing Standards, we have also issued our report dated October 4, 2017, on our consideration of the District’s internal control over financial reporting and on our tests of its compliance with certain provisions of laws, regulations, contracts, and grant agreements and other matters. The purpose of that report is solely to describe the scope of our testing of internal control over financial reporting and compliance and the results of that testing, and not to provide an opinion on the effectiveness of the District’s internal control over financial reporting or on compliance. That report is an integral part of an audit performed in accordance with Government Auditing Standards in considering the District’s internal control over financial reporting and compliance. San Diego, California October 4, 2017
Helix Water District Management's Discussion and Analysis
June 30, 2017 and 2016
4
The following management’s discussion and analysis provides a narrative overview and analysis of the financial performance of the Helix Water District during the fiscal year ended June 30, 2017. Please read this analysis in conjunction with the letter of transmittal located in the introductory section, and the district’s basic financial statements and accompanying notes immediately following this section.
Overview of the Financial Statements
The district operates under California Irrigation District Law as a utility enterprise. As such, the district presents its financial statements using the economic resources measurement focus and the full accrual basis of accounting, similar to methods used by private sector companies. These financial statements are designed to provide readers with a broad overview of the finances and also present changes in cash balances, and information about both short-term and long-term activities of the district. There are three required components to these statements; the required supplementary information, the financial statements and the notes to the financial statements. As an enterprise fund, the district’s financial statements include four components:
1) Statement of Net Position presents information on all of the district’s assets, deferred outflows,liabilities and deferred inflows with the difference reported as net position. The statement of netposition provides the basis for evaluating the capital structure of the district and assessing itsliquidity and financial flexibility. Over time, increases or decreases in net position may serve as auseful indicator of whether the financial position of the district is improving or deteriorating. Netposition is displayed in three categories: net investment in capital assets; restricted andunrestricted.
2) Statement of Revenues, Expenses and Changes in Net Position presents information whichshows how the district’s net position changed during the year. All of the current year’s revenuesand expenses are recorded on an accrual basis, meaning when the underlying transaction occurs,regardless of the timing of the related cash flows. This statement measures the success of thedistrict’s operations over the past year and determines whether the district has recovered its coststhrough water sales, user fees and other charges.
3) Statement of Cash Flows provides information regarding the district’s cash receipts and cashdisbursements during the year. The statement reports cash activity in three categories: operating;capital and related financing; and investing. The statement differs from the statement of revenues,expenses, and changes in net position in that it accounts only for transactions that result from cashreceipts and cash disbursements. As in the past, the statement of cash flows continues to reconcilethe reasons why cash from operating activities differ from operating income.
4) Notes to the Basic Financial Statements provide a description of the accounting policies used toprepare the financial statements and present material disclosures required by generally acceptedaccounting principles that are not otherwise present in the financial statements. The notes arelocated immediately following the financial statements.

Helix Water District Management's Discussion and Analysis
June 30, 2017 and 2016
5
Financial Highlights
During the year ended June 30, 2017, the district generated income before contributions of $20.3 million, which is $23.4 million higher than the prior year’s income before contributions. This increase was primarily the result of a $10.3 million increase in water sales driven by a rate increase and a 6.2 percent increase in customer water usage following the third hottest year on record in 2016 but the second wettest winter for the state of California. This allowed the district to use local water runoff which reduced water purchases by $8.0 million. Additionally, this year the district received the final $8.0 million settlement payment from its litigation regarding the El Capitan Golf Club. This payment, which was due under a 2014 court settlement ended a long and costly land dispute over 460 acres HWD owned in Lakeside’s El Monte Valley.
In fiscal year 2016-17, the district captured 11,821 acre-feet of local water runoff, which is more than double the district’s 30-year average of 5,107 and 10,097 more acre-feet than the local water runoff collected in the 2015-16 fiscal year. The region and the state of California emerged from a five year drought in 2017 as the district experienced significant rainfall and Northern California recorded the wettest year on record. The district records the value of local water runoff received during the year at replacement cost. The value of the net local water runoff reduces the cost of water purchases.
Financial Analysis of the District
Statements of Net Position – The district’s net position improved between fiscal years 2015-16 and 2016-17, increasing from $234.8 million to $259.0 million. The change can be seen in the condensed Statement of Net Position on the next page as a $24.2 million increase in net position.
As of July 1, 2014, the district adopted the Governmental Accounting Standards Board Statement No. 68, Accounting and Financial Reporting for Pensions – an amendment of GASB Statement No. 27 and GASB Statement No. 71, Pension Transition for Contributions Made Subsequent to the Measurement Date - an Amendment of GASB Statement No. 68. As a result, the district is reporting a $38.6 million net pension liability, $1.1 million in deferred inflow of resources (deferred amount on pensions) and $8.0 million in deferred outflows of resources from pension contributions made after the measurement date and amortization. These are further discussed in note 9 defined benefit pension plans in the accompanying pages.
The district’s capital assets grew to $242.7 million in fiscal year 2016-17 from $237.2 million in fiscal year 2015-16. The district’s capital asset improvement program includes the extensive water system pipeline replacement project, which is targeted to replace all of the district’s remaining cast-iron pipes by 2025. The district also constructs pipeline and other capital projects that are funded by outside sources. Once these construction projects are complete, the resulting assets are considered contributed to the district. Contributions to capital projects from customers, developers and other public agencies of $3.8 million were recorded in fiscal year 2016-17.

Helix Water District Management's Discussion and Analysis
June 30, 2017 and 2016
6
Helix Water District Condensed Statement of Net Position
(Millions of Dollars)
Changes in Revenues, Expenses and Net Position – The district’s $20.3 million increase in income before contributions in fiscal year 2016-17 was primarily the result of a $10.3 million increase in water sales driven by a rate increase and a 6.2 percent increase in customer water usage following the third hottest year on record in 2016 but the second wettest winter for the state of California. This allowed the district to use local water runoff which reduced water purchases by $8.0 million. Additionally, this year the district received the final $8.0 million settlement payment from its litigation regarding the El Capitan Golf Club. This payment which was due under a 2014 court settlement and ended a long and costly land dispute over 460 acres HWD owned in Lakeside’s El Monte Valley.
The main source for the district’s water supply to its customers comes from water purchases from the San Diego County Water Authority, which increased its variable charge for wholesale water per acre foot to the district by 9.6 percent from fiscal year 2015-16 to fiscal year 2016-17. However, the district was able to partially offset this increase through the capture and use of local water runoff.
The resulting 10.3 percent increase in net position is shown in the table on the following page, which summarizes the Statement of Revenues, Expenses and Changes in Net Position.
2017 2016Current and other assets 74.3$ 55.8$ Capital assets 242.7 237.2
Total assets 317.0 293.0
Total deferred outflows of resources 8.0 3.2
Total assets and deferred outflows of resources 325.0$ 296.2$
Other liabilities 16.3$ 15.2$ Long term liabilities 48.3 43.5
Total liabilities 64.7 58.7
Total deferred inflows of resources 1.4 2.7
Net investment in capital assets 231.3 224.3 Restricted 1.9 1.9 Unrestricted 25.8 8.6
Total net position 259.0 234.8
Total liabilities, deferred inflows of resources and net position 325.0$ 296.2$

Helix Water District Management's Discussion and Analysis
June 30, 2017 and 2016
7
Helix Water District Condensed Statement of Revenues, Expenses and Changes in Net Position
(Millions of Dollars)
2017 2016
Operating revenues Water sales 75.3$ 65.1$ Local water runoff 16.8 2.9 Other 0.6 0.6 Non-operating revenues Interest 0.3 0.3 Other 11.6 3.4 Total revenues 104.6 72.3
Operating expenses 83.2 74.2 Non-operating expenses 1.1 1.2 Total expense 84.3 75.4
Income (loss) before contributions 20.3 (3.1)
Contributions by customers, developers and public agencies 3.8 3.8 Increase in net position 24.2 0.7 Net position, beginning of year 234.8 234.1 Net position, end of year 259.0$ 234.8$
Changes in Net Position
Helix Water District Management's Discussion and Analysis
June 30, 2017 and 2016
8
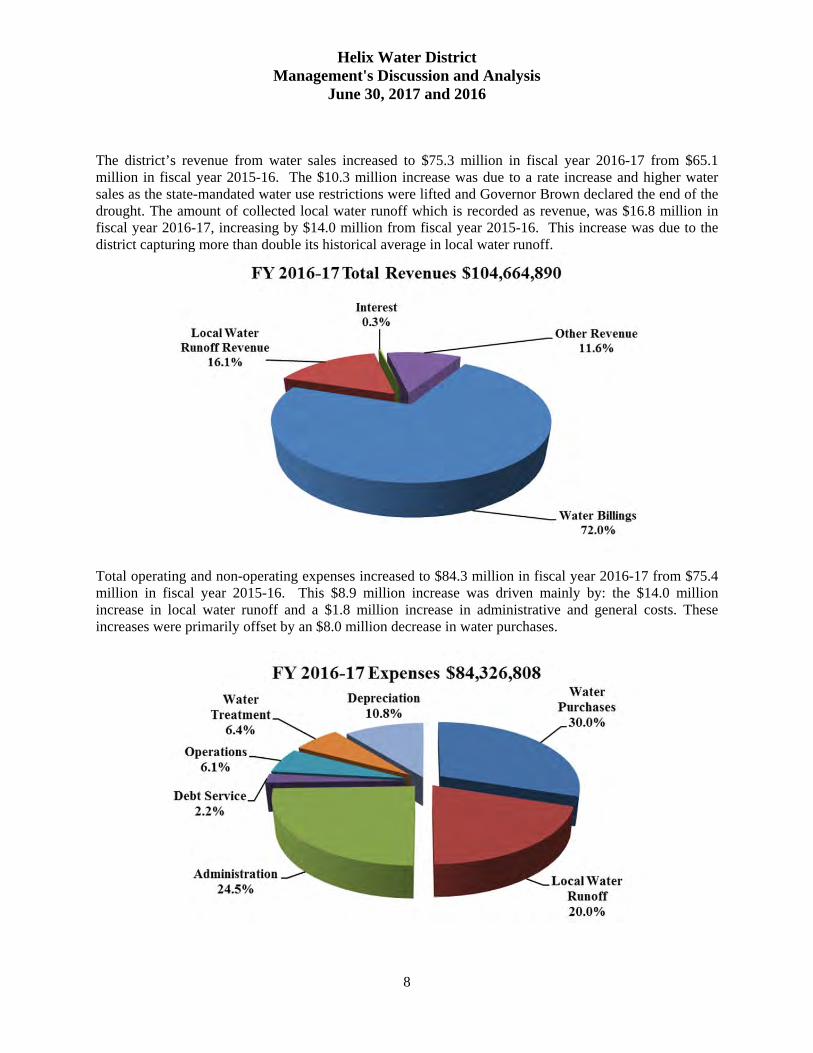
The district’s revenue from water sales increased to $75.3 million in fiscal year 2016-17 from $65.1 million in fiscal year 2015-16. The $10.3 million increase was due to a rate increase and higher water sales as the state-mandated water use restrictions were lifted and Governor Brown declared the end of the drought. The amount of collected local water runoff which is recorded as revenue, was $16.8 million in fiscal year 2016-17, increasing by $14.0 million from fiscal year 2015-16. This increase was due to the district capturing more than double its historical average in local water runoff.
Total operating and non-operating expenses increased to $84.3 million in fiscal year 2016-17 from $75.4 million in fiscal year 2015-16. This $8.9 million increase was driven mainly by: the $14.0 million increase in local water runoff and a $1.8 million increase in administrative and general costs. These increases were primarily offset by an $8.0 million decrease in water purchases.

Helix Water District Management's Discussion and Analysis
June 30, 2017 and 2016
9
Capital Assets As of June 30, 2017, the district had $242.7 million in capital assets net of $162.8 million of accumulated depreciation. This represents a net increase in capital assets of $5.5 million over the prior year. The largest increases in capital assets were the addition and replacement of the district’s pipelines, as well as improvements to pump stations and equipment. The district recorded the replacement of 27,454 feet of pipeline for the year ending June 30, 2017. For more detailed information on capital assets please see Note 6 to the Basic Financial Statements following this analysis.
Debt Administration On October 20, 2009, the district retired the 1999 Certificates of Participation with outstanding principle of $22.3 million by issuing $21.4 million in 2009 Water Revenue Bonds. The refinancing of the 1999 Certificates of Participation reduced the district’s annual debt payment by 18%. No additional debt was issued during the year and the district has no immediate need to issue additional debt. At June 30, 2017, the district had $11.1 million in 2009 Water Revenue Bonds outstanding and $0.3 million of the deferred refunding balance. The district’s debt coverage ratio is 16.0 for fiscal year 2016-17, exceeding the 1.2 debt coverage ratio required by the district’s 2009 Water Revenue bond covenant. In 2015, Fitch affirmed their rating of AA+, with a stable outlook for the 2009 Water Revenue Bonds. More detailed information about the district’s long-term debt is presented in Note 7 to the basic financial statements.
2017 2016Land 5.1$ 5.1$ Reservoirs and pipelines 339.6 329.9 Autos and trucks 3.1 3.0 Building and equipment 49.1 45.8 Construction in progress 8.6 7.5 Total capital assets 405.5 391.3
Less: accumulated depreciation (162.8) (154.1) Capital assets net 242.7$ 237.2$
Capital Assets
Helix Water District Management's Discussion and Analysis
June 30, 2017 and 2016
10
Defined Benefit Pension Plans
Effective on July 1, 2014, all Helix Water District Employees participating in CalPERS and defined as “Classic Members” of CalPERS are contributing 8.0% of their CalPERS eligible salary. Those employees defined by CalPERS as “New Members” are contributing of 5.5% of their CalPERS eligible salary.
In June 2012, the Governmental Accounting Standards Board issued a new standard that made significant changes to how state and local governments account for the cost of pension benefits in their financial statements. This new standard, as detailed in GASB No. 68, Accounting and Financial Reporting for Pensions – an Amendment of GASB Statement No. 27, required state and local governments to adopt this new standard beginning in fiscal year 2014-15. Among the many changes that this pronouncement required, two impact the presentation of the financial statements for fiscal year 2014-15 and beyond. These changes, as summarized by the Government Finance Officers Association, impact the amount that an employer reports as a liability in its financial statements and change the amount an employer reports as pension expense. As a result, state and local governments are now required to record the net pension (unfunded) liability for its defined benefit plan as a liability on its statement of net position (balance sheet). Also, the pension expense that an agency records is no longer equal to the annual required contribution that the agency pays to its pension plan administrator. The expense now also includes the impact of annual fluctuations in the market value of the assets of the plan itself.
Accordingly, the district has several accounts that were first shown on the statement of net position as of June 30, 2015 and are also included as of June 30, 2017. The first of these includes the deferred outflows of resources account with a balance of $8.0 million. This account is the sum of the payments that the district made to CalPERS for its fiscal year 2016-17 required contribution of $2.6 million, the difference from the expected and actual earnings from the plan of $4.6 million and the $750,000 prepayment of the district’s net pension liability. It is required to be recorded here because the measurement date of the plan’s net pension liability is as of June 30, 2016 and these payments were made subsequent to the measurement date. Fiscal year 2015-16 also included a prepayment to the district’s net pension liability of $750,000.
Next, the district has recorded a net pension liability of $38.6 million. This balance represents the difference between the plan’s total pension liability and fiduciary net position. The district’s funded status for its CalPERS plan as of this most recent valuation at June 30, 2016 was 68 percent. It is important to highlight that this is not a new liability for the district and every employer with a qualifying pension plan will record this liability on its balance sheet.
The last account that was created when the district adopted GASB 68 is the deferred amount on pensions recorded as a deferred inflow of resources just after the liability section of the statement of net position. This account shows the remaining, unamortized balance of the impact of changes in the market value of the assets in the district’s CalPERS plan and of any changes in assumptions. The market earnings were less than expected, increasing the district’s net pension expense by $1.5 million in fiscal year 2016-17 following a $1.0 million reduction in pension expense in fiscal year 2015-16 after better than expected market earnings. GASB 68 requires that any gains be amortized over five years and be recalculated on a yearly basis. Due to the fluctuations of market returns on assets, this amount will change in future fiscal years.

Helix Water District Management's Discussion and Analysis
June 30, 2017 and 2016
11
Note 9 – Retirement Plan (Defined Benefit Pension Plan) provides greater detail regarding the assumptions included in the plan’s valuation as well as a schedule that shows the changes in balances in the net pension liability from June 30, 2016 to June 30, 2017. Economic Factors The district experienced a year of above average rainfall after multiple years of drought conditions and the expectation of limited water supplies. In June 2017, the district's Board of Directors rescinded drought response level 1 water conditions, eliminating voluntary watering restrictions for the district's customers. Through conservation, the district’s customers have reduced their water use by a cumulative 19 percent compared to 2013. Although the water restrictions have been lifted, the district’s customers have continued their water conservation practices, which have resulted in decreased water sales in recent fiscal years. Over the past five fiscal years (2013-2017), the district’s cost to purchase wholesale water has increased 24 percent. Unfortunately, based on projections provided by the San Diego County Water Authority, wholesale water costs are projected to continue to increase, resulting in additional water rate increases to its customers. To reduce the impact from rising wholesale water costs, changing demand from dry years and decreased customer usage, the district has implemented a variety of cost-cutting measures within its operating and capital budgets to minimize retail water rate increases. The district also has used local water runoff which reduces the amount of water purchased from San Diego County Water Authority. Many of the district’s costs are fixed, such as debt service on bonds, maintenance, system operations, labor, benefits, and administrative costs. Although the district’s customers conserve water, these costs do not decrease. All of these costs must be recovered in the rates. The district has cut costs and reduced staff to baseline levels required for operations and maintenance and achieving appropriate customer service. Little opportunity exists for further staff reductions, without affecting customer service or infrastructure maintenance. Contacting the District’s Financial Management This financial report is designed to provide our citizens, rate payers, investors and creditors with a general overview of the district’s finances and to demonstrate the district’s accountability for the financial resources it manages. If you have questions about this report or need additional financial information, contact the Helix Water District’s Administrative Services Department at 7811 University Avenue, La Mesa, California, 91942 or (619) 466-0585.
HELIX WATER DISTRICT
STATEMENT OF NET POSITION JUNE 30, 2017
(with Comparative Information for 2016)
The accompanying notes are an integral part of these financial statements.
12
2017 2016ASSETS
Current assets:Cash and cash equivalents (Note 5) 32,895,195$ 25,752,212$ Water receivables (Note 2H):
Billed 3,319,037 2,751,102 Unbilled 6,886,763 6,018,837
Other receivables 140,824 487,365 Water inventory (Note 2F) 22,254,594 12,476,019 Supplies inventory and prepaid expenses 775,686 726,577
Total Current Assets 66,272,099 48,212,112
Non-current assets:Restricted - debt service:
Cash and cash equivalents (Note 5) 1,904,993 1,903,704 Investments (Note 5) 6,140,210 5,698,535 Capital assets (Note 6)
Land 5,067,807 5,067,807 Reservoirs and pipelines 339,615,788 329,949,707 Automobiles and trucks 3,093,945 3,027,176 Buildings and equipment 49,112,961 45,812,485 Less: accumulated depreciation (162,814,699) (154,148,155) Construction in progress 8,652,802 7,452,659
Total Non-Current Assets 250,773,807 244,763,918
Total Assets 317,045,906 292,976,030
DEFERRED OUTFLOWS OF RESOURCESDeferred amount related to pensions (Note 9) 7,994,407 3,247,790
Total Assets and Deferred Outflows of Resources 325,040,313$ 296,223,820$ (continued)

HELIX WATER DISTRICT
STATEMENT OF NET POSITION (CONTINUED) JUNE 30, 2017
(with Comparative Information for 2016)
The accompanying notes are an integral part of these financial statements.
13
2017 2016LIABILITIES
Current liabilities:Accounts payable 7,888,808$ 7,499,350$ Accrued expenses 4,158,787 3,403,702 Compensated absences (Note 2G) 300,690 301,931 Current portion of bonds payable (Note 7) 1,435,000 1,395,000
Total Current Liabilities 13,783,285 12,599,983
Non-current liabilities:Compensated absences (Note 2G) 2,549,369 2,573,771 Bonds payable after one year (Note 7) 9,710,000 11,145,000 Net Pension Liability (Note 9) 38,637,527 32,354,187
Total Non-Current Liabilities 50,896,896 46,072,958
Total Liabilities 64,680,181 58,672,941
DEFERRED INFLOWS OF RESOURCESDeferred amount on refunding of debt 257,518 294,308 Deferred amount related to pensions (Note 9) 1,107,502 2,441,491
Total Deferred Inflows of Resources 1,365,020 2,735,799
NET POSITIONNet investment in capital assets 231,326,086 224,327,371 Restricted: debt service 1,904,993 1,903,704 Unrestricted 25,764,033 8,584,005
Total Net Position 258,995,112 234,815,080
Total Liabilities, Deferred Inflows of Resources and Net Position 325,040,313$ 296,223,820$
HELIX WATER DISTRICT
STATEMENT OF REVENUES, EXPENSES AND CHANGES IN NET POSITION
FOR THE FISCAL YEAR ENDED JUNE 30, 2017 (with Comparative Information for 2016)
The accompanying notes are an integral part of these financial statements.
14
2017 2016OPERATING REVENUES
Water sales 75,332,588$ 65,079,938$ Local water runoff (Note 8) 16,828,525 2,868,403 Other charges 612,542 628,939
Total Operating Revenues 92,773,655 68,577,280
OPERATING EXPENSESWater purchases 25,293,132 33,274,446 Local water runoff (Note 8) 16,828,525 2,868,403 Administrative and general 20,273,722 18,499,846 Depreciation (Note 6) 9,093,269 8,539,576 Transmission and distribution 2,914,809 3,026,865 Water treatment 3,304,543 2,858,235 Pumping 2,113,134 1,926,249 Operations center 2,209,212 1,998,679 Customer services 1,133,143 1,200,519
Total Operating Expenses 83,163,489 74,192,818
OPERATING INCOME (LOSS) 9,610,166 (5,615,538)
NON-OPERATING REVENUES (EXPENSES)Interest income 322,092 310,213 Other income 11,569,143 3,411,700 Interest expense (477,369) (517,869) Other expense (685,950) (658,351)
Total Non-Operating Revenues (Expenses) 10,727,916 2,545,693
INCOME (LOSS) BEFORE CONTRIBUTIONS 20,338,082 (3,069,845)
CONTRIBUTIONS BY CUSTOMERS, DEVELOPERS AND PUBLIC AGENCIES 3,841,950 3,758,230
Increase in net position 24,180,032 688,385
Net position, beginning of year 234,815,080 234,126,695
Net position, end of year 258,995,112$ 234,815,080$
HELIX WATER DISTRICT
STATEMENT OF CASH FLOWS FOR THE YEAR ENDED JUNE 30, 2017 (with Comparative Information for 2016)
The accompanying notes are an integral part of these financial statements.
15
2017 2016CASH FLOWS FROM OPERATING ACTIVITIES
Receipts from customers 74,855,810$ 66,313,420$ Payments to suppliers and vendors (53,275,491) (48,949,676) Payments to employees (11,722,254) (12,995,206) Payments to reduce unfunded pension liability (750,000) (750,000) Other income 11,569,143 3,411,700 Other expenses (685,950) (658,351)
Net Cash Provided by Operating Activities 19,991,258 6,371,887
CASH FLOWS FROM CAPITAL AND RELATED FINANCING ACTIVITIES
Purchase and construction of capital assets (12,312,916) (9,441,608) Principal payments on bonds (1,395,000) (1,350,000) Interest paid (514,158) (554,658) Cash contributions by customers and developers 1,274,877 1,380,139 Cash contributions by public agencies 219,794 36,216
Net Cash (Used) for Capital and Related Financing Activities (12,727,403) (9,929,911)
CASH FLOWS FROM INVESTING ACTIVITIESPurchase of investments (2,293,343) (3,471,786) Sales/maturities of investments 1,851,668 4,390,860 Interest on investments 322,092 310,213
Net Cash Provided (Used) by for Investing Activities (119,583) 1,229,287
NET INCREASE/(DECREASE) IN CASH AND CASH EQUIVALENTS 7,144,272 (2,328,737)
CASH AND CASH EQUIVALENTSAT BEGINNING OF YEAR 27,655,916 29,984,653
CASH AND CASH EQUIVALENTSAT END OF YEAR 34,800,188$ 27,655,916$
RECONCILIATION TO THE STATEMENTS NET POSITION
Cash and cash equivalents - current 32,895,195$ 25,752,212$ Cash and cash equivalents - non-current 1,904,993 1,903,704
Total Cash and cash equivalents 34,800,188$ 27,655,916$
(continued)

HELIX WATER DISTRICT
STATEMENT OF CASH FLOWS, (CONTINUED) FOR THE YEAR ENDED JUNE 30, 2017 (with Comparative Information for 2016)
The accompanying notes are an integral part of these financial statements.
16
2017 2016RECONCILIATION OF OPERATING LOSS
TO NET CASH PROVIDED BY OPERATING ACTIVITIESOperating income (loss) 9,610,166$ (5,615,538)$
Adjustments:Depreciation 9,093,269 8,539,576 Other income and expense 10,883,193 2,753,349
Change in operating assets and liabilities:(Increase) decrease in water receivables (1,435,861) 884,912 (Increase) decrease in other receivables 346,541 (280,369) (Increase) decrease in water inventory (9,778,575) 377,486 (Increase) decrease in supplies inventory
and prepaid expenses (49,109) (40,248) (Increase) decrease in deferred outflows (4,746,617) (285,109) Increase (decrease) in accounts payable 389,458 93,495 Increase (decrease) in accrued expenses 755,085 768,095 Increase (decrease) in compensated absences (25,643) (129) Increase (decrease) in deferred inflows related to pensions (1,333,989) (3,406,604) Increase (decrease) in net pension liability 6,283,340 2,582,971
Net Cash Provided by Operating Activities 19,991,258$ 6,371,887$
SUPPLEMENTAL DISCLOSURES OF NONCASHINVESTING AND FINANCING ACTIVITIES
Contributions of water system assets bycustomers and developers 2,347,279$ 2,341,875$
Amortization of deferred amount on refunding debt 36,790$ 36,790$

HELIX WATER DISTRICT
NOTES TO THE BASIC FINANCIAL STATEMENTS JUNE 30, 2017
(with Comparative Information for 2016)
17
NOTE 1 – ORGANIZATION Helix Water District (district) was organized in 1913 and operates under the provisions of the Irrigation District Law, per Division 11 of the California State Water Code. The district supplies water to the cities of La Mesa, El Cajon, Lemon Grove and surrounding unincorporated areas. It is governed by a board consisting of five directors, each of whom is elected by divisions of the district for a four-year term. The district’s operations are located as follows:
Administration Office – 7811 University Avenue, La Mesa, California Operations Center – 1233 Vernon Way, El Cajon, California Treatment Plant – 9550 Lake Jennings Park Road, Lakeside, California
NOTE 2 – SUMMARY OF SIGNIFICANT ACCOUNTING POLICIES A. Basis of Accounting
The accounting methods and procedures adopted by the district conform to generally accepted accounting principles as applied to governmental enterprise funds. As an enterprise fund, the district accounts for its operations in a manner similar to private business enterprises. The enterprise fund is accounted for using the economic resources measurement focus and the accrual basis of accounting. Revenues are recognized when earned and expenses are recognized when the liability is incurred, regardless of the timing of related cash flows. The intent of the governing body is that the costs (including depreciation and amortization) of providing goods or services to the general public on a continuing basis be financed or recovered primarily through user charges. The focus of enterprise fund measurement is based upon determination of operating income, changes in net position, financial position and cash flows. When both restricted and unrestricted resources are available for use, it is the district’s policy to use restricted resources first and then unrestricted resources as they are needed.
B. Water Systems
Water systems contributed to the district are recorded at acquisition value as of the date received. Water system contributions are typically reimbursable in nature which includes construction first paid by the district and reimbursed by the property owner. The board of directors approves major contributions prior to recording them.
C. Implementation of New Pronouncement
Effective in this Fiscal Year GASB Statement No. 82 – In March 2016, GASB issued Statement No. 82, Pension Issues, an amendment of GASB Statements No. 67, No. 68, and No. 73. This statement addresses issues regarding (1) the presentation of payroll-related measures in required supplementary information, (2) the selection of assumptions and the treatment of deviations from the guidance in an Actuarial Standard of Practice for financial reporting purposes, and (3) the classification of payments made by employers to satisfy employee (plan member) contribution requirements. This statement was implemented effective July 1, 2016.

HELIX WATER DISTRICT
NOTES TO THE BASIC FINANCIAL STATEMENTS JUNE 30, 2017
(with Comparative Information for 2016)
18
NOTE 2 – SUMMARY OF SIGNIFICANT ACCOUNTING POLICIES, (continued) C. Implementation of New Pronouncement, (continued)
Effective in Future Fiscal Years
GASB Statement No. 75 – In June 2015, GASB issued Statement No. 75, Accounting and Financial Reporting for Postemployment Benefits Other Than Pensions. The objective of this statement is to improve accounting and financial reporting by state and local governments for postemployment benefits other than pensions (other postemployment benefits or OPEB). It also improves information provided by state and local governmental employers about financial support for OPEB that is provided by other entities. This statement is effective for periods beginning after June 15, 2017. The district has not determined the effect on the financial statements. GASB Statement No. 81 – In March 2016, GASB issued Statement No. 81, Irrevocable Split-Interest Agreements. The objective of this statement is to improve accounting and financial reporting for irrevocable split-interest agreements by providing recognition and measurement guidance for situations in which a government is a beneficiary of the agreement. The requirements of this statement are effective for reporting periods beginning after December 15, 2016. The district has not determined the effect on the financial statements. GASB Statement No. 83 – In November 2016, GASB issued Statement No. 83, Certain Asset Retirement Obligations. The objective of this statement is to enhance comparability of financial statements by establishing uniform criteria for governments to recognize and measure certain asset retirement obligations and requiring disclosures related to those asset retirement obligations. The requirements of this statement are effective for reporting periods beginning after June 15, 2018. The district has not determined the effect on the financial statements. GASB Statement No. 84 – In January 2017, GASB issued Statement No. 84, Fiduciary Activities. The objective of this statement is to improve guidance regarding the identification of fiduciary activities for accounting and reporting purposes and how those activities should be reported. The requirements of this statement are effective for reporting periods beginning after December 15, 2018. The district has not determined the effect on the financial statements. GASB Statement No. 85 – In March 2017, GASB issued Statement No. 85, Omnibus 2017. The objective of this statement is to address practice issues that have been identified during implementation and application of certain GASB statements including issues related to blending component units, goodwill, fair value measurement and application, and postemployment benefits. The requirements of this statement are effective for reporting periods beginning after June 15, 2017. The district has not determined the effect on the financial statements. GASB Statement No. 86 – In May 2017, GASB issued Statement No. 86, Certain Debt Extinguishment Issues. The objective of this statement is to improve consistency in accounting and financial reporting for in-substance defeasance of debt by providing guidance for transactions in which cash and other monetary assets acquired with only existing resources are placed in an irrevocable trust for the sole purpose of extinguishing debt. This statement also improves accounting and financial reporting for prepaid insurance on debt that is extinguished and notes to financial statements for debt that is defeased in substance. The requirements of this statement are effective for reporting periods beginning after June 15, 2017. The district has not determined the effect on the financial statements.

HELIX WATER DISTRICT
NOTES TO THE BASIC FINANCIAL STATEMENTS JUNE 30, 2017
(with Comparative Information for 2016)
19
NOTE 2 – SUMMARY OF SIGNIFICANT ACCOUNTING POLICIES, (continued) C. Implementation of New Pronouncement, (continued)
Effective in Future Fiscal Years, (continued) GASB Statement No. 87 – In June 2017, GASB issued Statement No. 87, Leases. The objective of this Statement is to better meet the information needs of financial statement users by improving accounting and financial reporting for leases by governments. The requirements of this statement are effective for reporting periods beginning after December 15, 2019. The district has not determined the effect on the financial statements.
D. Capital Assets
Capital assets are those purchased or acquired with an original cost of $10,000 or more and with a useful life of greater than one year. They are reported at historical cost or estimated historical cost. Contributed assets are reported at acquisition value as of the date received. Additions, improvements and other capital outlays that significantly extend the useful life of an asset are capitalized. The costs of normal maintenance and repairs that do not add to the value of the assets or materially extend the lives of the assets are not capitalized, but are expensed as incurred. Depreciation is charged to expense for all capital assets (including assets contributed to the district) and is computed using the straight-line method over the estimated useful asset lives as follows:
Reservoirs and Pipelines 10 – 75 years Buildings and Equipment 10 – 75 years Equipment 5 – 10 years Automobiles and Trucks 6 years
E. Investments
Investments are reported at fair value which is the amount at which financial instruments could be exchanged in a current transaction between willing parties. All fair values are determined by external consultants. Investments are measured at fair value on a recurring basis. Recurring fair value measurements are those that Governmental Accounting Standards Board (GASB) Statements require or permit in the statement of net position at the end of each reporting period. Fair value measurements are categorized based on the valuation inputs used to measure an asset’s fair value: Level 1 inputs are quoted prices in active markets for identical assets; Level 2 inputs are significant other observable inputs; Level 3 inputs are significant unobservable inputs. Management reviews investments for events that might affect fair value measurements of investments on a monthly basis. The evaluation is performed at the lowest level of identifiable unit of account.
F. Inventories
The value of water inventory is determined based upon the quantity of water in storage at the current year's commodity rate and a 3-year average of fixed cost rates. Supplies inventory consists of materials primarily used in the construction and maintenance of the water system and is valued at average cost using the specific identification method.

HELIX WATER DISTRICT
NOTES TO THE BASIC FINANCIAL STATEMENTS JUNE 30, 2017
(with Comparative Information for 2016)
20
NOTE 2 – SUMMARY OF SIGNIFICANT ACCOUNTING POLICIES, (continued) G. Compensated Absences
The district combines vacation and floating holiday leave into “paid time off”. At June 30, 2017 and 2016, the district's policy is to record a liability equal to 100 percent of paid time off available to all employees.
Balance BalanceJune 30, 2016 Earned Used June 30, 2017
Current Compensated absences 301,931$ 88,130$ (89,371)$ 300,690$
Non-current Compensated absences 2,573,771 1,012,630 (1,037,032) 2,549,369
2,875,702$ 1,100,760$ (1,126,403)$ 2,850,059$
Balance BalanceJune 30, 2015 Earned Used June 30, 2016
Current Compensated absences 299,870$ 87,299$ (85,238)$ 301,931$
Non-current Compensated absences 2,575,961 1,118,306 (1,120,496) 2,573,771
2,875,831$ 1,205,605$ (1,205,734)$ 2,875,702$
H. Water Receivables
Water receivables consist of both billed and unbilled water sales provided to district customers. No allowance for doubtful accounts is provided because management believes all receivables are collectible. The unbilled receivable is an estimate of the water usage for each meter based upon the period from the last meter billing to year-end.
I. Tax Status
Helix Water District is exempt from income taxes of the Internal Revenue Code and California Tax Law. The district pays state and local sales tax.
J. Restricted Net Position
Constraints placed on net position that are externally imposed by creditors, grantors, contributors or laws or regulations of other governments imposed by law through constitutional provisions or enabling legislation are classified as restricted net position.
HELIX WATER DISTRICT
NOTES TO THE BASIC FINANCIAL STATEMENTS JUNE 30, 2017
(with Comparative Information for 2016)
21
NOTE 2 – SUMMARY OF SIGNIFICANT ACCOUNTING POLICIES, (continued)
K. Cash and Cash Equivalents
For purposes of the statements of cash flows, cash and cash equivalents consist of short-term highly liquidinvestments with maturities of ninety days or less from the date of purchase. These include cash on hand,cash held in the restricted assets accounts, and the Local Agency Investment Fund.
L. Operating and non-operating revenues and expenses
Operating revenues and expenses generally result from providing services and producing and deliveringgoods in connection with the district’s principal ongoing operations (water delivery and related services).Operating expenses include the cost of water delivery and related services, administrative expenses anddepreciation on capital assets. All revenues and expenses not meeting this definition are reported as non- operating.
M. Pensions
For purposes of measuring the net pension liability and deferred outflows/inflows of resources related topensions, and pension expense, information about the fiduciary net position of the district’s California PublicEmployees Retirement System (CalPERS) Plans and additions to/deductions from the plan’s fiduciary netposition have been determined on the same basis as they are reported by CalPERS. For this purpose, benefitpayments (including refunds of employee contributions) are recognized when due and payable in accordancewith the benefit terms. Investments are reported at fair value.
N. Deferred Outflows and Inflows of Resources
The district reports deferred outflows and inflows of resources. A deferred outflow of resources is aconsumption of net position by the district that is applicable to a future reporting period. A deferred inflow ofresources represents an acquisition of net position by the government that is applicable to a future period.Examples of deferred outflows and inflows of resources include unamortized losses and gains on refunding oflong-term debt and pension related deferrals. Pension related deferred outflows and inflows of resourcesinclude employer contributions to the pension plan subsequent to the measurement date, changes in actuarialassumptions, differences between actual and expected experience in measurement of the total pensionliability, and net differences between projected and actual earnings on plan investments. Refunding of debtrelated deferred inflows are recognized over the remaining life of the refunded debt. As of June 30, 2017 andJune 30, 2016, the balances were $257,518 and $294,308, respectively.
NOTE 3 – USE OF ESTIMATES IN PREPARING BASIC FINANCIAL STATEMENTS
The district uses estimates and assumptions in preparing financial statements in accordance with generally accepted accounting principles. These estimates and assumptions affect the reported amounts of assets, deferred outflows of resources, liabilities, deferred inflows of resources, and the reported amounts of revenues and expenses. Actual results could vary from the estimates that were used.

HELIX WATER DISTRICT
NOTES TO THE BASIC FINANCIAL STATEMENTS JUNE 30, 2017
(with Comparative Information for 2016)
22
NOTE 4 – PRIOR YEAR DATA Selected information regarding the prior year has been included in the accompanying financial statements. This information has been included for comparison purposes only and does not represent a complete presentation in accordance with generally accepted accounting principles. Accordingly, such information should be read in conjunction with the district’s prior year financial statements, from which this selected financial data was derived. NOTE 5 – CASH, CASH EQUIVALENTS AND INVESTMENTS The primary goals of the district’s investment policy are to assure compliance with all Federal, State, and Local laws governing the investment of funds under the control of the organization, protect the principal of investments entrusted and generate income under the parameters of such policies. The district’s investment policy and state statutes authorize the district to invest in obligations of the U.S. Treasury, its agencies and instrumentalities, certificates of deposit with national and state-licensed or chartered banks or federal or state savings and loan associations, money market and mutual funds whose portfolios consist of one or more of the foregoing investments and the Local Agency Investment Fund (LAIF). A summary of cash, cash equivalents and investments is as follows at June 30:
2017 2016Cash and cash equivalents Unrestricted cash and cash equivalents
Cash 3,465,177$ 1,557,986$ Cash equivalents 29,430,018 24,194,226
Total unrestricted cash and cash equivalents 32,895,195 25,752,212
Restricted cash and cash equivalents 1,904,993 1,903,704
Total cash and cash equivalents 34,800,188 27,655,916
Investments 6,140,210 5,698,535
Total cash, cash equivalents and investments 40,940,398$ 33,354,451$

HELIX WATER DISTRICT
NOTES TO THE BASIC FINANCIAL STATEMENTS JUNE 30, 2017
(with Comparative Information for 2016)
23
NOTE 5 – CASH, CASH EQUIVALENTS AND INVESTMENTS, (continued) Investments Authorized by the California Government Code and the District’s Investment Policy For June 30, 2017 and 2016, the table below identifies the investment types that are authorized for the district by the California Government Code (or the district’s investment policy, where more restrictive). The table also identifies certain provisions of the California Government Code (or the district’s investment policy, where more restrictive) that address interest rate risk, credit risk, and concentration of credit risk. This table does not address investments of debt proceeds held by bond trustees that are governed by the provisions of debt agreements of the district, rather than the general provisions of the California Government Code or the district’s investment policy.
Maximum MaximumMaximum Percentage Investment
Authorized Investments Maturity of Portfolio (1) in IssuerLocal Agency Investment Fund (LAIF) N/A None 65,000,000$ U.S. Treasury (bills, notes and bonds) 36 months None NoneGovernment National Mortgage Association (GNMA) 36 months None NoneSmall Business Administration (SBA) 36 months None NoneFarmers Home Administration (FMHA) 36 months None NoneGeneral Services Administration (GSA) 36 months None NoneFederal National Mortgage Association (FNMA) 36 months None NoneFederal Home Loan Bank (FHLB) 36 months None NoneFederal Home Loan Mortgage Corporation (FHLMC) 36 months None NoneBank Certificates of Deposit 36 months 20% NoneMoney Market Mutual Funds 36 months 20% None
(1) Excluding amounts held by the bond trustee that are not subject to California Government Code Restrictions
Investments Authorized by Debt Agreements Investment of debt proceeds held by the bond trustee are governed by provisions of the debt agreements, rather than the general provisions of the California Government Code or the district’s investment policy.

HELIX WATER DISTRICT
NOTES TO THE BASIC FINANCIAL STATEMENTS JUNE 30, 2017
(with Comparative Information for 2016)
24
NOTE 5 – CASH, CASH EQUIVALENTS AND INVESTMENTS, (continued) Disclosures Relating to Interest Rate Risk Interest rate risk is the risk that changes in market interest rates will adversely affect the fair value of an investment. Generally, the longer the maturity of an investment, the greater the sensitivity of its fair value will be to changes in market interest rates. One of the ways that the district manages its exposure to interest rate risk is by purchasing a combination of shorter term and longer term investments and by timing cash flows from maturities, so that a portion of the portfolio is maturing or coming close to maturity evenly over time, as necessary, to provide the cash flow and liquidity needed for operations. Information about the sensitivity of the fair values of the district’s investments (including investments held by the bond trustee) to market interest rate fluctuations is provided by the following tables that show the distribution of the district’s investments by maturity. As of June 30, 2017:
Investment Type Amount 12 or less 13 to 24 25 to 36
Local Agency Investment Fund 29,430,018$ 29,430,018$ -$ -$ Certificates of Deposit 6,140,210 992,362 2,928,830 2,219,018 Held by Fiscal Agent: Money Market Funds 62,500 62,500 - - Federal Agency Securities 1,842,493 1,842,493 - -
Total Investments 37,475,221$ 32,327,373$ 2,928,830$ 2,219,018$
Remaining maturity (in months)
As of June 30, 2016:
Investment Type Amount 12 or less 13 to 24 25 to 36
Local Agency Investment Fund 24,194,226$ 24,194,226$ -$ -$ Federal Agency Securities 500,475 - - 500,475 Certificates of Deposit 5,198,060 1,242,269 1,495,951 2,459,840 Held by Fiscal Agent: Money Market Funds 62,858 62,858 - - US Treasury Notes 1,840,846 1,840,846 - -
Total Investments 31,796,465$ 27,340,199$ 1,495,951$ 2,960,315$
Remaining maturity (in months)
HELIX WATER DISTRICT
NOTES TO THE BASIC FINANCIAL STATEMENTS JUNE 30, 2017
(with Comparative Information for 2016)
25
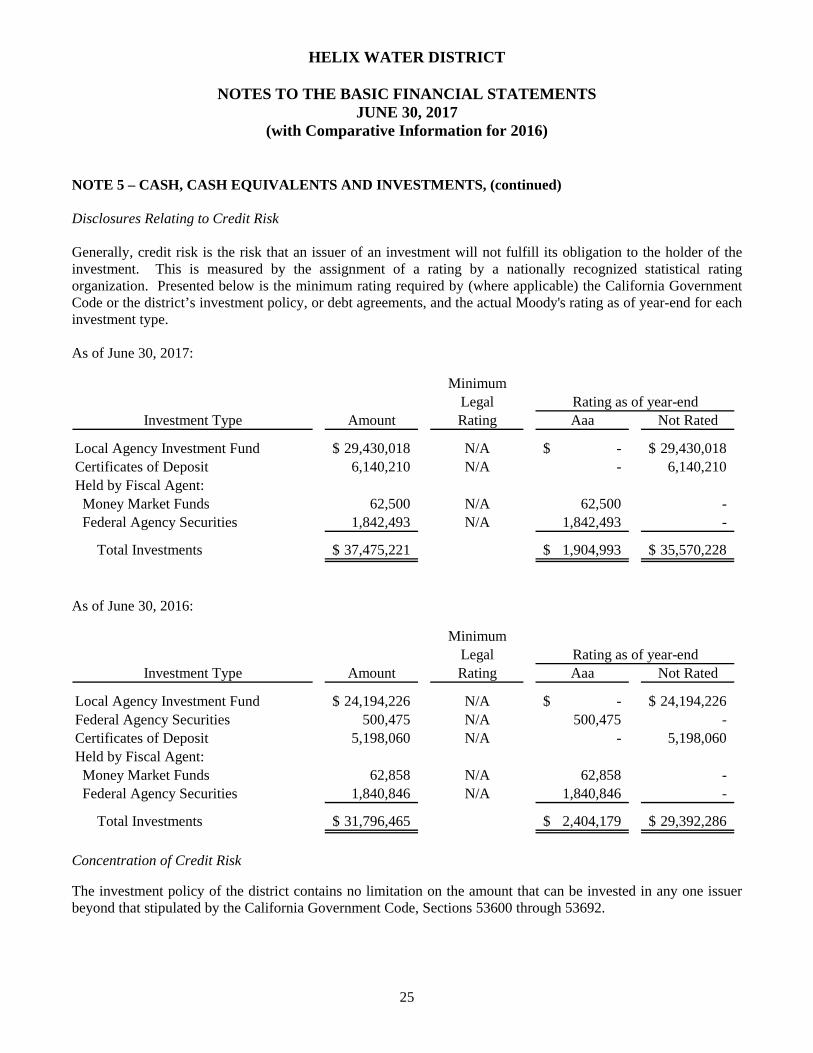
NOTE 5 – CASH, CASH EQUIVALENTS AND INVESTMENTS, (continued) Disclosures Relating to Credit Risk Generally, credit risk is the risk that an issuer of an investment will not fulfill its obligation to the holder of the investment. This is measured by the assignment of a rating by a nationally recognized statistical rating organization. Presented below is the minimum rating required by (where applicable) the California Government Code or the district’s investment policy, or debt agreements, and the actual Moody's rating as of year-end for each investment type. As of June 30, 2017:
MinimumLegal
Investment Type Amount Rating Aaa Not Rated
Local Agency Investment Fund 29,430,018$ N/A -$ 29,430,018$ Certificates of Deposit 6,140,210 N/A - 6,140,210 Held by Fiscal Agent: Money Market Funds 62,500 N/A 62,500 - Federal Agency Securities 1,842,493 N/A 1,842,493 -
Total Investments 37,475,221$ 1,904,993$ 35,570,228$
Rating as of year-end
As of June 30, 2016:
MinimumLegal
Investment Type Amount Rating Aaa Not Rated
Local Agency Investment Fund 24,194,226$ N/A -$ 24,194,226$ Federal Agency Securities 500,475 N/A 500,475 - Certificates of Deposit 5,198,060 N/A - 5,198,060 Held by Fiscal Agent: Money Market Funds 62,858 N/A 62,858 - Federal Agency Securities 1,840,846 N/A 1,840,846 -
Total Investments 31,796,465$ 2,404,179$ 29,392,286$
Rating as of year-end
Concentration of Credit Risk The investment policy of the district contains no limitation on the amount that can be invested in any one issuer beyond that stipulated by the California Government Code, Sections 53600 through 53692.
HELIX WATER DISTRICT
NOTES TO THE BASIC FINANCIAL STATEMENTS JUNE 30, 2017
(with Comparative Information for 2016)
26
NOTE 5 – CASH, CASH EQUIVALENTS AND INVESTMENTS, (continued) Custodial Credit Risk Custodial credit risk for deposits is the risk that, in the event of the failure of a depository financial institution, a government will not be able to recover its deposits or will not be able to recover collateral securities that are in the possession of an outside party. The custodial credit risk for investments is the risk that, in the event of the failure of the counterparty (e.g., broker dealer) to a transaction, a government will not be able to recover the value of its investment or collateral securities that are in the possession of another party. The California Government Code and the district’s investment policy do not contain legal or policy requirements that would limit the exposure to custodial credit risk for deposits or investments, other than the following provision for deposits: The California Government Code requires that a financial institution secure deposits made by state or local government units by pledging securities in an undivided collateral pool held by a depository regulated under state law (unless so waived by the governmental unit). The market value of the pledged securities in the collateral pool must equal at least 110 percent of the total amount deposited by the public agencies. California law also allows financial institutions to secure deposits by pledging first trust deed mortgage notes having a value of 150 percent of the secured public deposits. Of the district's deposits with financial institutions as of June 30, 2017 and 2016, $1,146,047 and $1,139,760, respectively, were in excess of federal depository insurance limits and subject to custodial credit risk described above.
Local Agency Investment Fund (LAIF) The district is a voluntary participant in the Local Agency Investment Fund (LAIF) that is regulated by California Government Code under the oversight of the Treasurer of the State of California. The fair value of the district’s investment in this pool is reported in the accompanying financial statements at amounts based upon district’s pro-rata share of the fair value provided by LAIF for the entire LAIF portfolio (in relation to the amortized cost of that portfolio). The balance deposited by the district and available for withdrawal is based on the accounting records maintained by LAIF, which are recorded on an amortized cost basis. Deposits and withdrawals are made on the basis of $1 and not fair value. Accordingly, under the fair value hierarchy, the value of the district’s participation in LAIF is measured based upon uncategorized inputs not defined as Level 1, Level 2, or Level 3 inputs. LAIF is not registered with the Securities and Exchange Commission and is not rated.
HELIX WATER DISTRICT
NOTES TO THE BASIC FINANCIAL STATEMENTS JUNE 30, 2017
(with Comparative Information for 2016)
27
NOTE 5 – CASH, CASH EQUIVALENTS AND INVESTMENTS, (continued)
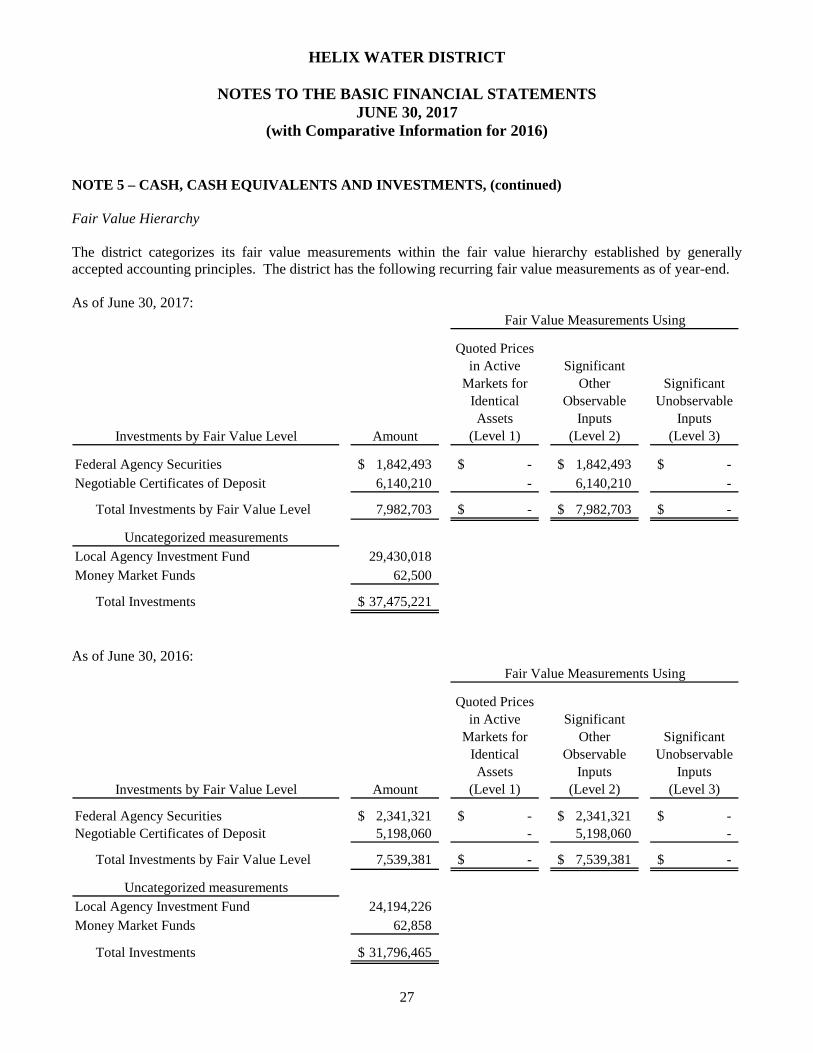
Fair Value Hierarchy
The district categorizes its fair value measurements within the fair value hierarchy established by generally accepted accounting principles. The district has the following recurring fair value measurements as of year-end.
As of June 30, 2017:
Investments by Fair Value Level Amount
Quoted Prices in Active
Markets for Identical Assets
(Level 1)
Significant Other
Observable Inputs
(Level 2)
Significant Unobservable
Inputs(Level 3)
Federal Agency Securities 1,842,493$ -$ 1,842,493$ -$ Negotiable Certificates of Deposit 6,140,210 - 6,140,210 -
Total Investments by Fair Value Level 7,982,703 -$ 7,982,703$ -$
Uncategorized measurementsLocal Agency Investment Fund 29,430,018 Money Market Funds 62,500
Total Investments 37,475,221$
Fair Value Measurements Using
As of June 30, 2016:
Investments by Fair Value Level Amount
Quoted Prices in Active
Markets for Identical Assets
(Level 1)
Significant Other
Observable Inputs
(Level 2)
Significant Unobservable
Inputs(Level 3)
Federal Agency Securities 2,341,321$ -$ 2,341,321$ -$ Negotiable Certificates of Deposit 5,198,060 - 5,198,060 -
Total Investments by Fair Value Level 7,539,381 -$ 7,539,381$ -$
Uncategorized measurementsLocal Agency Investment Fund 24,194,226 Money Market Funds 62,858
Total Investments 31,796,465$
Fair Value Measurements Using

HELIX WATER DISTRICT
NOTES TO THE BASIC FINANCIAL STATEMENTS JUNE 30, 2017
(with Comparative Information for 2016)
28
NOTE 5 – CASH, CASH EQUIVALENTS AND INVESTMENTS, (continued) In determining fair value, the district’s custodians use various methods including market and income approaches. Based on these approaches, the district’s custodians utilize certain assumptions that market participants would use in pricing the asset or liability. The district’s custodians utilize valuation techniques that maximize the use of observable inputs and minimize the use of unobservable inputs. Various inputs are used in determining the value of the district’s investments and other financial instruments. The inputs or methodology used for valuing securities are not necessarily an indication of the risk associated with investing in those securities. These inputs are summarized in the three broad levels: Level 1 - quoted prices in active markets for identical investments, Level 2 - other significant observable inputs (including quoted prices for similar securities, interest rates, credit risk, etc.) and Level 3 - significant unobservable inputs (including the district’s own assumptions in determining the fair value of investments). NOTE 6 – WATER SYSTEM – CAPITAL ASSETS A schedule of changes in water system – capital assets and accumulated depreciation for the year ended June 30, 2017 is shown as follows: Summary of Changes in Water System – Capital Assets
Balance BalanceJune 30, 2016 Additions Deletions June 30, 2017
Capital assets, not being depreciated:Construction in progress 7,452,659$ 16,936,843$ (15,736,700)$ 8,652,802$ Land 5,067,807 - - 5,067,807
Total capital assets, not being depreciated 12,520,466 16,936,843 (15,736,700) 13,720,609
Capital assets, being depreciated:Reservoirs and pipelines 329,949,707 9,797,684 (131,603) 339,615,788 Automobiles and truck 3,027,176 292,236 (225,467) 3,093,945 Buildings and equipment 45,812,485 3,379,984 (79,508) 49,112,961
Total capital assets, being depreciated 378,789,368 13,469,904 (436,578) 391,822,694
Less accumulated depreciation for:Reservoirs and pipelines (126,753,280) (6,388,345) 121,750 (133,019,875) Automobiles and truck (2,622,422) (165,885) 225,467 (2,562,840) Buildings and equipment (24,772,453) (2,539,039) 79,508 (27,231,984)
Total accumulated depreciation (154,148,155) (9,093,269) 426,725 (162,814,699)
Total capital assets being depreciated, net 224,641,213 4,376,635 (9,853) 229,007,995
Capital assets, net 237,161,679$ 21,313,478$ (15,746,553)$ 242,728,604$
HELIX WATER DISTRICT
NOTES TO THE BASIC FINANCIAL STATEMENTS JUNE 30, 2017
(with Comparative Information for 2016)
29
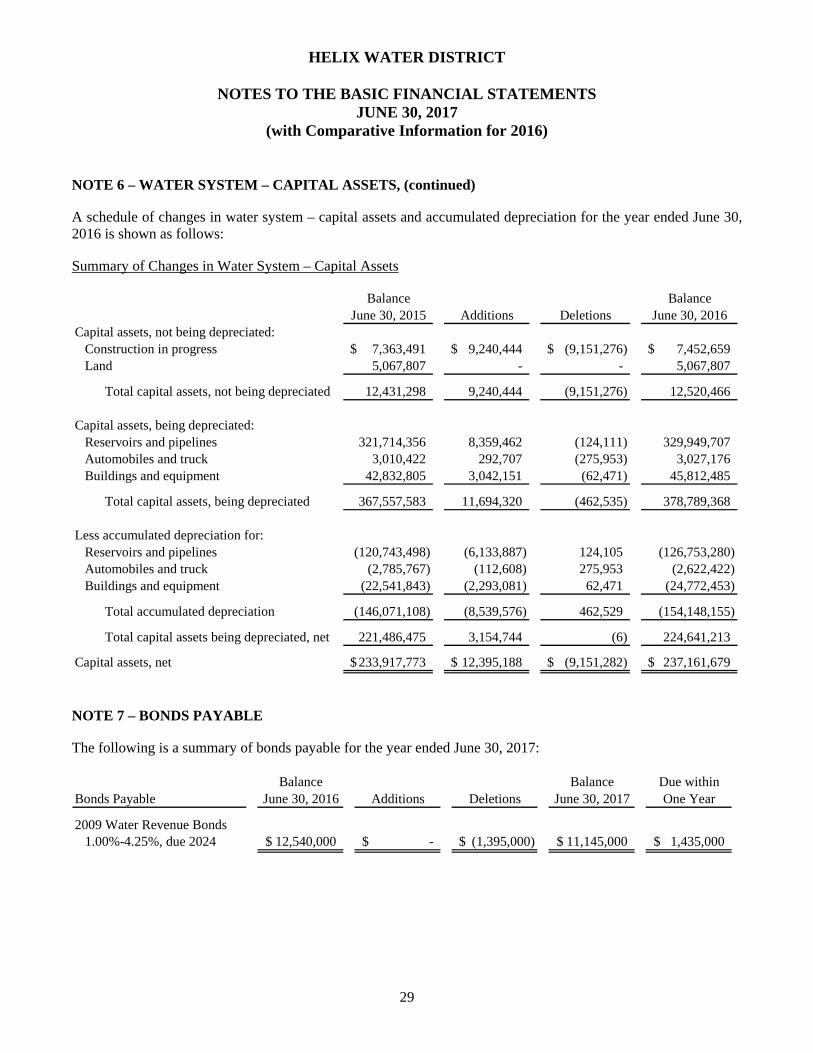
NOTE 6 – WATER SYSTEM – CAPITAL ASSETS, (continued) A schedule of changes in water system – capital assets and accumulated depreciation for the year ended June 30, 2016 is shown as follows: Summary of Changes in Water System – Capital Assets
Balance BalanceJune 30, 2015 Additions Deletions June 30, 2016
Capital assets, not being depreciated:Construction in progress 7,363,491$ 9,240,444$ (9,151,276)$ 7,452,659$ Land 5,067,807 - - 5,067,807
Total capital assets, not being depreciated 12,431,298 9,240,444 (9,151,276) 12,520,466
Capital assets, being depreciated:Reservoirs and pipelines 321,714,356 8,359,462 (124,111) 329,949,707 Automobiles and truck 3,010,422 292,707 (275,953) 3,027,176 Buildings and equipment 42,832,805 3,042,151 (62,471) 45,812,485
Total capital assets, being depreciated 367,557,583 11,694,320 (462,535) 378,789,368
Less accumulated depreciation for:Reservoirs and pipelines (120,743,498) (6,133,887) 124,105 (126,753,280) Automobiles and truck (2,785,767) (112,608) 275,953 (2,622,422) Buildings and equipment (22,541,843) (2,293,081) 62,471 (24,772,453)
Total accumulated depreciation (146,071,108) (8,539,576) 462,529 (154,148,155)
Total capital assets being depreciated, net 221,486,475 3,154,744 (6) 224,641,213
Capital assets, net 233,917,773$ 12,395,188$ (9,151,282)$ 237,161,679$
NOTE 7 – BONDS PAYABLE The following is a summary of bonds payable for the year ended June 30, 2017:
Balance Balance Due withinBonds Payable June 30, 2016 Additions Deletions June 30, 2017 One Year
2009 Water Revenue Bonds1.00%-4.25%, due 2024 12,540,000$ -$ (1,395,000)$ 11,145,000$ 1,435,000$

HELIX WATER DISTRICT
NOTES TO THE BASIC FINANCIAL STATEMENTS JUNE 30, 2017
(with Comparative Information for 2016)
30
NOTE 7 – BONDS PAYABLE, (continued)
The following is a summary of bonds payable for the year ended June 30, 2016:
Balance Balance Due withinBonds Payable June 30, 2015 Additions Deletions June 30, 2016 One Year
2009 Water Revenue Bonds1.00%-4.25%, due 2024 13,890,000$ -$ (1,350,000)$ 12,540,000$ 1,395,000$
The aggregate principal and interest payments of bonds payable is summarized as follows:
Year endingJune 30, Principal Interest Total
2018 1,435,000$ 410,519$ 1,845,519$ 2019 1,480,000 363,881 1,843,881 2020 1,530,000 315,781 1,845,781 2021 1,585,000 262,231 1,847,231 2022 1,640,000 202,794 1,842,794
2023-2024 3,475,000 216,519 3,691,519
Total 11,145,000$ 1,771,725$ 12,916,725$
The proceeds of the 2009 Water Revenue Refunding Bonds, with installments ranging from $1,180,000 to $1,770,000 and interest rates ranging from 1.0 percent to 4.25 percent, were issued to: (1) refund outstanding certificates of participation, (2) pay certain costs incurred in connection with the issuance of the Bonds, and (3) fund a debt service reserve fund. The refunding resulted in a deferred amount of $515,041, which is being amortized over the remaining life of the refunded debt.
The installment payments of the 2009 Water Revenue Bonds are secured by a first lien on net revenues of the water system. The district must also fix and collect rates, fees, and charges for water service which will produce gross revenue in each fiscal year sufficient to: (1) pay the operating and maintenance costs, the Bond installment payments and any other district obligations, (2) restore the required balance in the reserve fund, and (3) yield net revenues of at least 120 percent of annual installment payments. Net revenues are defined in the bond documents as gross revenues, less specified operation and maintenance costs, plus specified non-operating income. The total principal and interest remaining to be paid on the bonds is $12,916,725. Principal and interest paid for the current year and total customer net revenues were $1,847,369 and $30,594,663, respectively.
NOTE 8 – LOCAL WATER RUNOFF
The district measures and records the value of local water runoff as operating revenue and operating expense. Revenue and expense related to local water runoff for the year ended June 30, 2017 and June 30, 2016 was $16,828,525 and $2,868,403, respectively.

HELIX WATER DISTRICT
NOTES TO THE BASIC FINANCIAL STATEMENTS JUNE 30, 2017
(with Comparative Information for 2016)
31
NOTE 9 – RETIREMENT PLAN (DEFINED BENEFIT PENSION PLAN) Plan Description District employees are eligible to participate in the district's plan, an agent multiple-employer public employee defined benefit pension plan administered by the California Public Employees Retirement System (CalPERS). CalPERS acts as a common investment and administrative agent for its participating member employers. Benefit provisions under the plan are established by State statute and may be amended by district resolution. CalPERS issues publicly available reports that include a full description of the pension plans regarding benefit provisions, assumptions and membership information that can be found on the CalPERS website. Benefits Provided CalPERS provides retirement and disability benefits, annual cost of living adjustments and death benefits to plan members, who must be public employees and beneficiaries. Benefits are based on years of credited service, equal to one year of full time employment with the retirement formula of 2.5 percent at 55 for existing “classic” members and 2 percent at 62 for “new” members. The cost of living adjustments for each plan are applied as specified by the Public Employees’ Retirement Law.
Hire DateClassic - Prior to January 1, 2013
New - On or after January 1, 2013
Formula 2.5% @ 55 2% @ 62Benefit vesting schedule 5 years of service 5 years of serviceBenefit payments monthly for life monthly for lifeRetirement age 50-55 52-67Monthly benefits, as a % of annual salary 2.0% to 2.5% 1.0% to 2.5%Required employee contribution rates 8% 5.5%Required employer contribution rates 20.789% 20.789%
Miscellaneous
Employees Covered At June 30, 2015, the date of the most recent actuarial valuation, the following employees were covered by the benefit terms for the plan:
MiscellaneousInactive employees or beneficiaries currently receiving benefits 158Inactive employees entitled to but not yet receiving benefits 54 Active employees 147 Total 359
HELIX WATER DISTRICT
NOTES TO THE BASIC FINANCIAL STATEMENTS JUNE 30, 2017
(with Comparative Information for 2016)
32
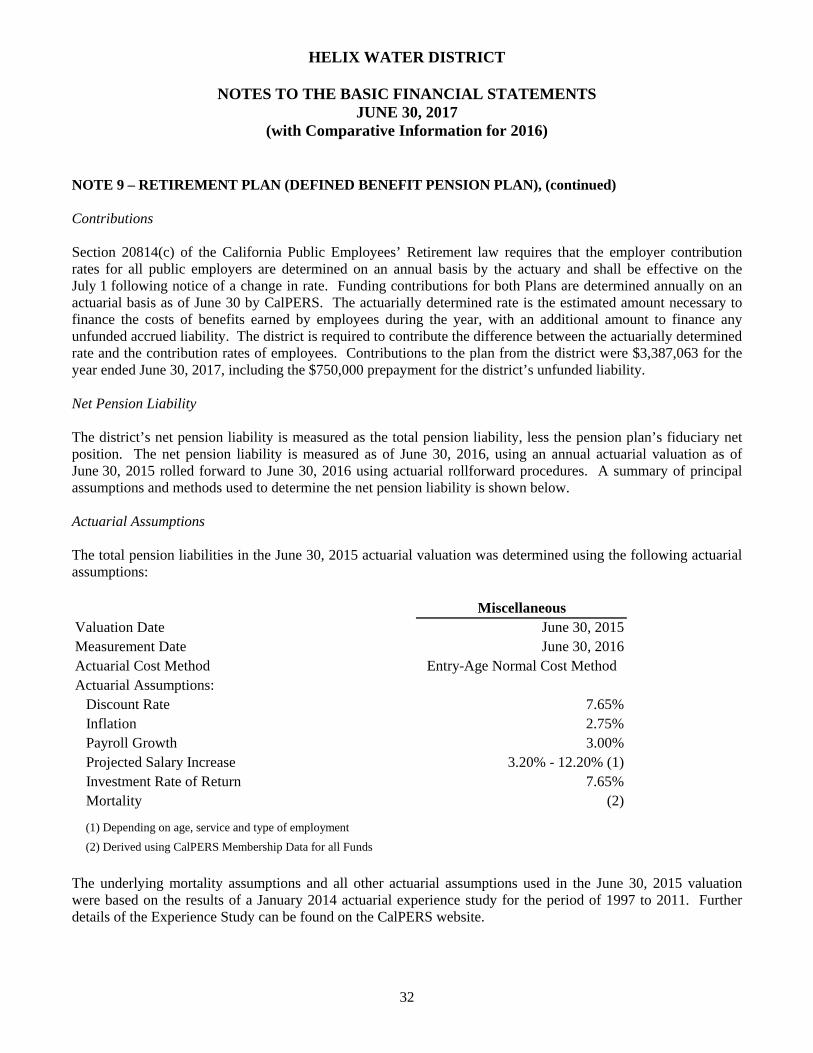
NOTE 9 – RETIREMENT PLAN (DEFINED BENEFIT PENSION PLAN), (continued) Contributions Section 20814(c) of the California Public Employees’ Retirement law requires that the employer contribution rates for all public employers are determined on an annual basis by the actuary and shall be effective on the July 1 following notice of a change in rate. Funding contributions for both Plans are determined annually on an actuarial basis as of June 30 by CalPERS. The actuarially determined rate is the estimated amount necessary to finance the costs of benefits earned by employees during the year, with an additional amount to finance any unfunded accrued liability. The district is required to contribute the difference between the actuarially determined rate and the contribution rates of employees. Contributions to the plan from the district were $3,387,063 for the year ended June 30, 2017, including the $750,000 prepayment for the district’s unfunded liability. Net Pension Liability The district’s net pension liability is measured as the total pension liability, less the pension plan’s fiduciary net position. The net pension liability is measured as of June 30, 2016, using an annual actuarial valuation as of June 30, 2015 rolled forward to June 30, 2016 using actuarial rollforward procedures. A summary of principal assumptions and methods used to determine the net pension liability is shown below. Actuarial Assumptions The total pension liabilities in the June 30, 2015 actuarial valuation was determined using the following actuarial assumptions:
MiscellaneousValuation Date June 30, 2015Measurement Date June 30, 2016Actuarial Cost Method Entry-Age Normal Cost MethodActuarial Assumptions:
Discount Rate 7.65%Inflation 2.75%Payroll Growth 3.00%Projected Salary Increase 3.20% - 12.20% (1)Investment Rate of Return 7.65%Mortality (2)
(1) Depending on age, service and type of employment
(2) Derived using CalPERS Membership Data for all Funds
The underlying mortality assumptions and all other actuarial assumptions used in the June 30, 2015 valuation were based on the results of a January 2014 actuarial experience study for the period of 1997 to 2011. Further details of the Experience Study can be found on the CalPERS website.
HELIX WATER DISTRICT
NOTES TO THE BASIC FINANCIAL STATEMENTS JUNE 30, 2017
(with Comparative Information for 2016)
33
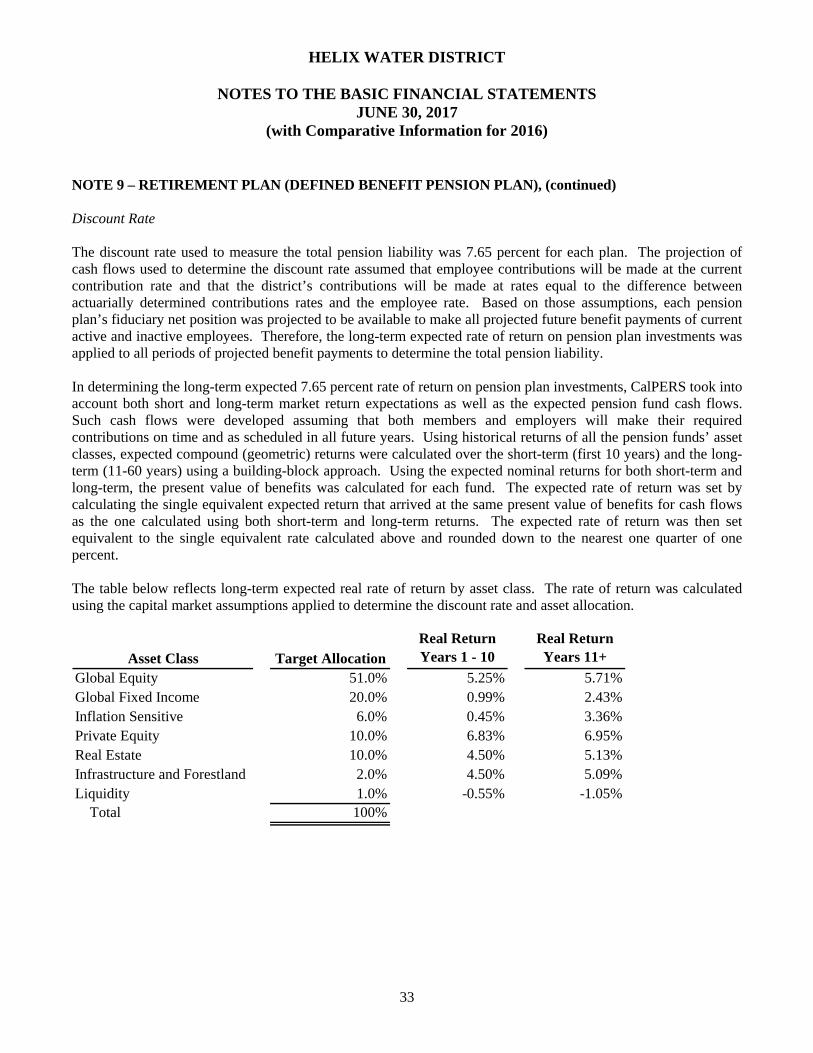
NOTE 9 – RETIREMENT PLAN (DEFINED BENEFIT PENSION PLAN), (continued) Discount Rate The discount rate used to measure the total pension liability was 7.65 percent for each plan. The projection of cash flows used to determine the discount rate assumed that employee contributions will be made at the current contribution rate and that the district’s contributions will be made at rates equal to the difference between actuarially determined contributions rates and the employee rate. Based on those assumptions, each pension plan’s fiduciary net position was projected to be available to make all projected future benefit payments of current active and inactive employees. Therefore, the long-term expected rate of return on pension plan investments was applied to all periods of projected benefit payments to determine the total pension liability. In determining the long-term expected 7.65 percent rate of return on pension plan investments, CalPERS took into account both short and long-term market return expectations as well as the expected pension fund cash flows. Such cash flows were developed assuming that both members and employers will make their required contributions on time and as scheduled in all future years. Using historical returns of all the pension funds’ asset classes, expected compound (geometric) returns were calculated over the short-term (first 10 years) and the long-term (11-60 years) using a building-block approach. Using the expected nominal returns for both short-term and long-term, the present value of benefits was calculated for each fund. The expected rate of return was set by calculating the single equivalent expected return that arrived at the same present value of benefits for cash flows as the one calculated using both short-term and long-term returns. The expected rate of return was then set equivalent to the single equivalent rate calculated above and rounded down to the nearest one quarter of one percent. The table below reflects long-term expected real rate of return by asset class. The rate of return was calculated using the capital market assumptions applied to determine the discount rate and asset allocation.
Asset Class Target AllocationReal Return Years 1 - 10
Real Return Years 11+
Global Equity 51.0% 5.25% 5.71%Global Fixed Income 20.0% 0.99% 2.43%Inflation Sensitive 6.0% 0.45% 3.36%Private Equity 10.0% 6.83% 6.95%Real Estate 10.0% 4.50% 5.13%Infrastructure and Forestland 2.0% 4.50% 5.09%Liquidity 1.0% -0.55% -1.05% Total 100%
HELIX WATER DISTRICT
NOTES TO THE BASIC FINANCIAL STATEMENTS JUNE 30, 2017
(with Comparative Information for 2016)
34
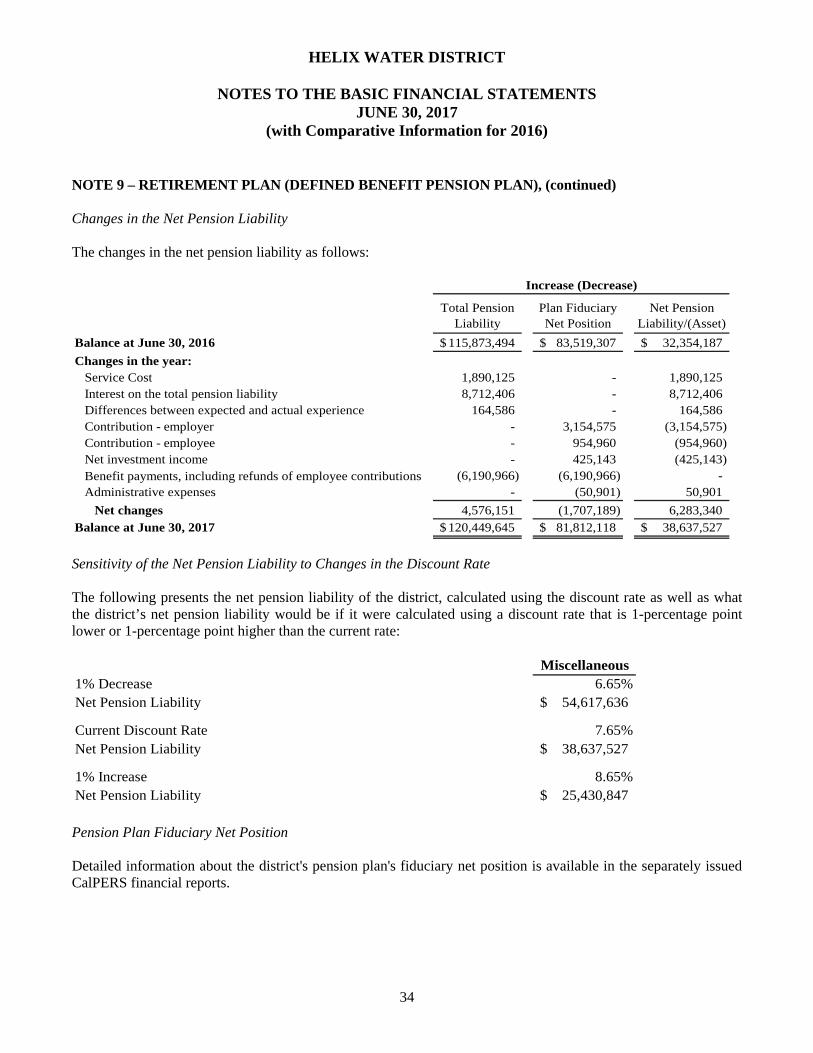
NOTE 9 – RETIREMENT PLAN (DEFINED BENEFIT PENSION PLAN), (continued) Changes in the Net Pension Liability The changes in the net pension liability as follows:
Total Pension Liability
Plan Fiduciary Net Position
Net Pension Liability/(Asset)
Balance at June 30, 2016 115,873,494$ 83,519,307$ 32,354,187$
Changes in the year:Service Cost 1,890,125 - 1,890,125 Interest on the total pension liability 8,712,406 - 8,712,406 Differences between expected and actual experience 164,586 - 164,586 Contribution - employer - 3,154,575 (3,154,575) Contribution - employee - 954,960 (954,960) Net investment income - 425,143 (425,143) Benefit payments, including refunds of employee contributions (6,190,966) (6,190,966) - Administrative expenses - (50,901) 50,901
Net changes 4,576,151 (1,707,189) 6,283,340 Balance at June 30, 2017 120,449,645$ 81,812,118$ 38,637,527$
Increase (Decrease)
Sensitivity of the Net Pension Liability to Changes in the Discount Rate The following presents the net pension liability of the district, calculated using the discount rate as well as what the district’s net pension liability would be if it were calculated using a discount rate that is 1-percentage point lower or 1-percentage point higher than the current rate:
Miscellaneous1% Decrease 6.65%Net Pension Liability 54,617,636$
Current Discount Rate 7.65%Net Pension Liability 38,637,527$
1% Increase 8.65%Net Pension Liability 25,430,847$
Pension Plan Fiduciary Net Position Detailed information about the district's pension plan's fiduciary net position is available in the separately issued CalPERS financial reports.
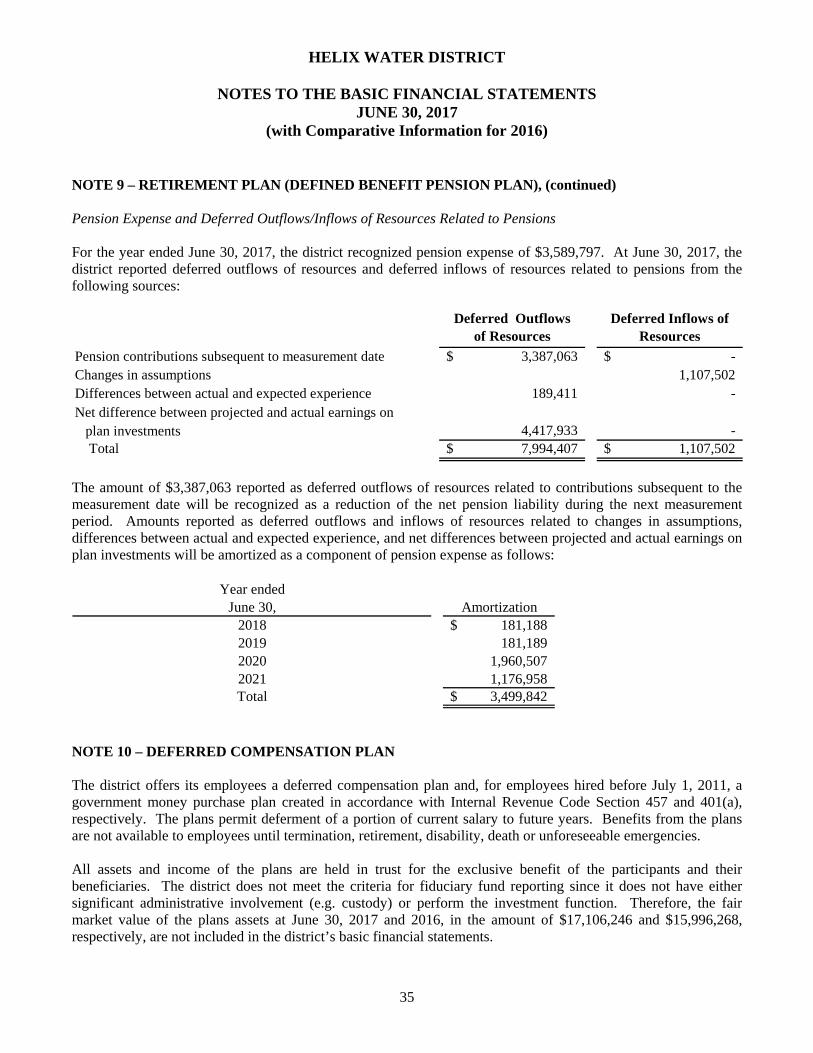
HELIX WATER DISTRICT
NOTES TO THE BASIC FINANCIAL STATEMENTS JUNE 30, 2017
(with Comparative Information for 2016)
35
NOTE 9 – RETIREMENT PLAN (DEFINED BENEFIT PENSION PLAN), (continued)
Pension Expense and Deferred Outflows/Inflows of Resources Related to Pensions
For the year ended June 30, 2017, the district recognized pension expense of $3,589,797. At June 30, 2017, the district reported deferred outflows of resources and deferred inflows of resources related to pensions from the following sources:
Deferred Outflows of Resources
Deferred Inflows of Resources
Pension contributions subsequent to measurement date 3,387,063$ -$ Changes in assumptions 1,107,502 Differences between actual and expected experience 189,411 - Net difference between projected and actual earnings on
plan investments 4,417,933 - Total 7,994,407$ 1,107,502$
The amount of $3,387,063 reported as deferred outflows of resources related to contributions subsequent to the measurement date will be recognized as a reduction of the net pension liability during the next measurement period. Amounts reported as deferred outflows and inflows of resources related to changes in assumptions, differences between actual and expected experience, and net differences between projected and actual earnings on plan investments will be amortized as a component of pension expense as follows:
Year endedJune 30, Amortization
2018 181,188$ 2019 181,189 2020 1,960,507 2021 1,176,958 Total 3,499,842$
NOTE 10 – DEFERRED COMPENSATION PLAN
The district offers its employees a deferred compensation plan and, for employees hired before July 1, 2011, a government money purchase plan created in accordance with Internal Revenue Code Section 457 and 401(a), respectively. The plans permit deferment of a portion of current salary to future years. Benefits from the plans are not available to employees until termination, retirement, disability, death or unforeseeable emergencies.
All assets and income of the plans are held in trust for the exclusive benefit of the participants and their beneficiaries. The district does not meet the criteria for fiduciary fund reporting since it does not have either significant administrative involvement (e.g. custody) or perform the investment function. Therefore, the fair market value of the plans assets at June 30, 2017 and 2016, in the amount of $17,106,246 and $15,996,268, respectively, are not included in the district’s basic financial statements.
HELIX WATER DISTRICT
NOTES TO THE BASIC FINANCIAL STATEMENTS JUNE 30, 2017
(with Comparative Information for 2016)
36
NOTE 11 – CONCENTRATION OF SUPPLIERS During the years ended June 30, 2017 and 2016, the district had one major supplier. Purchases from the San Diego County Water Authority (SDCWA) represent 87 percent and 93 percent of total water produced, respectively. NOTE 12 – COMMITMENTS AND CONTINGENCIES In the ordinary course of operations, the district is subject to claims and litigation from outside parties. Although the outcome of these matters is not presently determinable, in the opinion of legal counsel, the resolution of these matters is not expected to have a material adverse effect upon the district’s financial position. NOTE 13 – OTHER POST-EMPLOYMENT BENEFITS (OPEB) OPEB Description The district provides single-employer post-employment healthcare benefits to eligible employees who retire directly from the district. The district pays a percentage of the premium for retirees and eligible dependent medical, dental, vision, and life insurance coverage. The percent varies from 0 percent to 100 percent depending on the age and service of the participant at retirement. The district also reimburses the Medicare Part B premiums for retirees (and their spouses) hired before July 1, 1989. The qualifications for receiving the post-retirement healthcare benefits are outlined in the district’s Policies and Procedures Manual. The post-employment healthcare benefits are established by a Memoranda of Understanding with the applicable employee associations, and may be amended by agreement between the district and the employee associations. A separate financial report is not prepared for the district’s post-employment healthcare benefits. Funding Policy In 2011, the district established an irrevocable trust with the California Public Employees Retirement System (CalPERS), and California Employers’ Retiree Benefit Trust Fund Program (CERBT), to pre-fund OPEB costs. In March 2011, the district transferred $3,473,000 into the trust to start funding the district’s OPEB liability, using the $2,850,000 that was previously set aside in an internally designated reserve fund to be used for future Annual Requirement Contribution (ARC) and Net OPEB Obligations. The district will continue to pay the portion of the employer related health insurance premiums for current retirees and their spouses/dependents on a pay-as-you-go basis. For the fiscal years ended June 30, 2017 and 2016, the district contributed $1,621,849 in current premiums covering 111 retirees and their spouses/dependents and $1,413,605 in current premiums covering 123 retirees and their spouses/dependents, respectively. The retiree premiums contain an implied rate subsidy for the pay-as-you-go costs since retiree premium rates are the same as active employee medical premium rates rather than the actual medical cost. The district is required to contribute the annual required contribution of the employer (ARC), an amount actuarially determined in accordance with the parameters of GASB Statement No. 45. The ARC represents a level of funding that, if paid on an ongoing basis, is projected to cover normal costs each year and amortize any unfunded actuarial liabilities (or funding excess) over a period not to exceed 30 years. The current ARC rate is 19.9 percent of the estimated annual payroll.
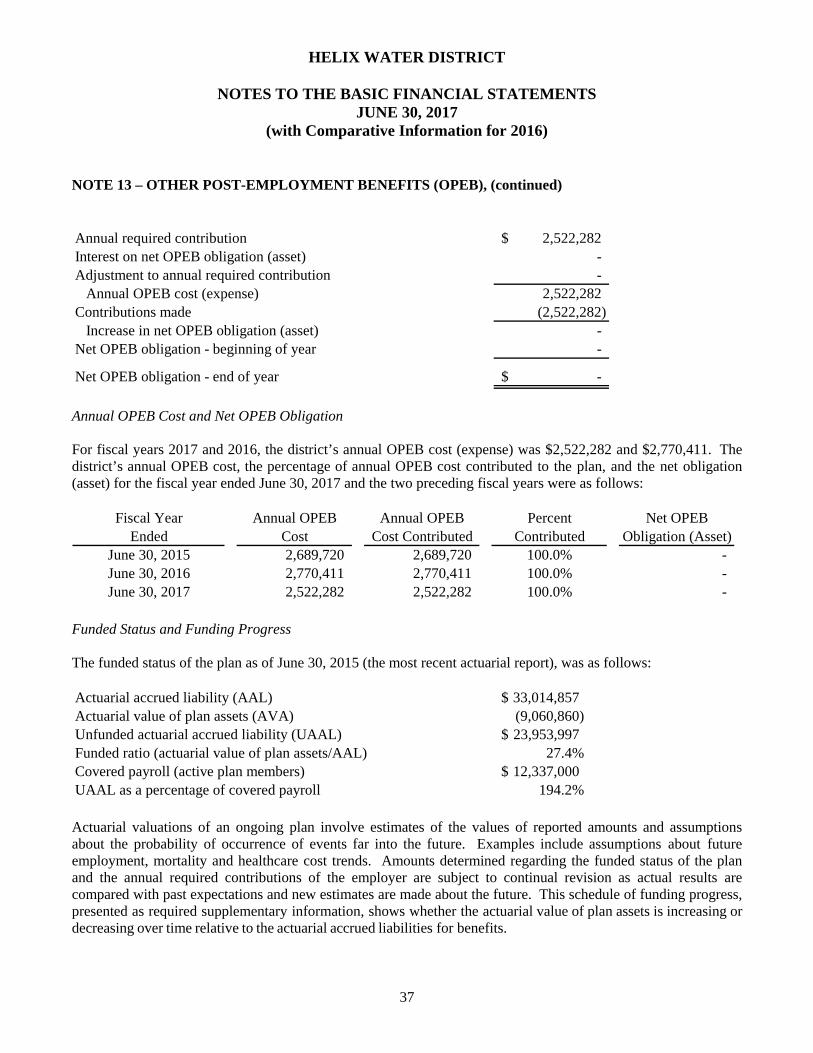
HELIX WATER DISTRICT
NOTES TO THE BASIC FINANCIAL STATEMENTS JUNE 30, 2017
(with Comparative Information for 2016)
37
NOTE 13 – OTHER POST-EMPLOYMENT BENEFITS (OPEB), (continued)
Annual required contribution 2,522,282$ Interest on net OPEB obligation (asset) - Adjustment to annual required contribution -
Annual OPEB cost (expense) 2,522,282 Contributions made (2,522,282)
Increase in net OPEB obligation (asset) - Net OPEB obligation - beginning of year -
Net OPEB obligation - end of year -$
Annual OPEB Cost and Net OPEB Obligation For fiscal years 2017 and 2016, the district’s annual OPEB cost (expense) was $2,522,282 and $2,770,411. The district’s annual OPEB cost, the percentage of annual OPEB cost contributed to the plan, and the net obligation (asset) for the fiscal year ended June 30, 2017 and the two preceding fiscal years were as follows:
Fiscal Year Annual OPEB Annual OPEB Percent Net OPEBEnded Cost Cost Contributed Contributed Obligation (Asset)
June 30, 2015 2,689,720 2,689,720 100.0% - June 30, 2016 2,770,411 2,770,411 100.0% - June 30, 2017 2,522,282 2,522,282 100.0% -
Funded Status and Funding Progress The funded status of the plan as of June 30, 2015 (the most recent actuarial report), was as follows: Actuarial accrued liability (AAL) 33,014,857$ Actuarial value of plan assets (AVA) (9,060,860) Unfunded actuarial accrued liability (UAAL) 23,953,997$ Funded ratio (actuarial value of plan assets/AAL) 27.4%Covered payroll (active plan members) 12,337,000$ UAAL as a percentage of covered payroll 194.2%
Actuarial valuations of an ongoing plan involve estimates of the values of reported amounts and assumptions about the probability of occurrence of events far into the future. Examples include assumptions about future employment, mortality and healthcare cost trends. Amounts determined regarding the funded status of the plan and the annual required contributions of the employer are subject to continual revision as actual results are compared with past expectations and new estimates are made about the future. This schedule of funding progress, presented as required supplementary information, shows whether the actuarial value of plan assets is increasing or decreasing over time relative to the actuarial accrued liabilities for benefits.
HELIX WATER DISTRICT
NOTES TO THE BASIC FINANCIAL STATEMENTS JUNE 30, 2017
(with Comparative Information for 2016)
38
NOTE 13 – OTHER POST-EMPLOYMENT BENEFITS (OPEB), (continued) Actuarial Methods and Assumptions Projections of benefits for financial reporting purposes are based on the substantive post-employment healthcare benefits (as understood by the employer and the covered employees) and include the types of benefits provided at the time of each valuation and the historical pattern of sharing of benefit costs between the employer and covered employees to that point. The actuarial methods and assumptions used include techniques that are designed to reduce the effects of short-term volatility in actuarial accrued liabilities and the actuarial value of assets, consistent with the long-term perspective of the calculations. In the June 30, 2015 actuarial valuation, the Entry Age Normal actuarial cost method was used. The actuarial assumptions included a general inflation rate of 2.8 percent, a 7.28 percent investment rate of return, based on the funded level of the plan at the valuation date, a payroll increase rate of 3.00 percent, no change in the post-retirement benefits, and an annual healthcare cost trend rate of 6.5 percent (HMO) and 7.00 percent (PPO), reduced by increments to an ultimate rate of 5.00 percent per year after five years. The actuarial value of assets were valued on a market value basis. The UAAL is being amortized as a level percent of payroll on a closed basis over an initial 30 years. As of the June 30, 2015 valuation, the remaining amortization is 22 years. The number of active plan participants was 144 and the number of retiree plan participants was 123 as of June 30, 2015. NOTE 14 – RISK MANAGEMENT The district is exposed to various risks of loss related to torts; theft of, damage to, and destruction of assets; errors and omissions; injuries to employees; and natural disasters. During the year ended June 30, 2017, the district participated in the Association of California Water Agencies Joint Powers Insurance Authority (JPIA), which was organized for the purpose of providing liability insurance for the member agencies. The JPIA is a risk-pooling self-insurance authority created under the provisions of California Government Code Section 6500. The JPIA is governed by a board consisting of a representative from each member agency. The board controls the operations of the JPIA, including selections of management and approval of operating budgets. The purpose of the JPIA is to arrange and administer programs of insurance for the pooling of self-insured losses and to purchase excess insurance coverage. The accounts and records of ACWA/JPIA are audited by an independent certified public accounting firm. At June 30, 2017, the district’s participation in the self-insurance programs of the JPIA was as follows: Property Loss - Insured up to $150,000,000 per occurrence (total insurable value $79,510,319) with $25,000 deductible for buildings, personal property, fixed equipment, mobile equipment, and licensed vehicles; the Authority is self-insured up to $100,000 per occurrence and excess insurance coverage has been purchased. General Liability - Insured up to $60,000,000 per occurrence; the Authority is self-insured up to $5,000,000 and excess insurance coverage has been purchased. Auto Liability - Insured up to $60,000,000 per occurrence with no deductible for property damage; the Authority is self-insured up to $5,000,000 and excess insurance coverage has been purchased.

HELIX WATER DISTRICT
NOTES TO THE BASIC FINANCIAL STATEMENTS JUNE 30, 2017
(with Comparative Information for 2016)
39
NOTE 14 – RISK MANAGEMENT, (continued) Workers' Compensation - Insured up to statutory limits per occurrence with no deductible; the Authority is self-insured up to $2,000,000 and excess insurance coverage has been purchased. Public Officials’ Liability - Insured up to $60,000,000 per occurrence; the Authority is self-insured up to $5,000,000 and excess insurance coverage has been purchased. Fidelity - Insured up to $100,000 per occurrence with $1,000 deductible. The district pays annual premiums for the coverages, which are subject to retrospective adjustments based on claims experience. The nature and amounts of these adjustments cannot be estimated and there were no instances in the past three years where a settlement exceeded the district’s coverage.
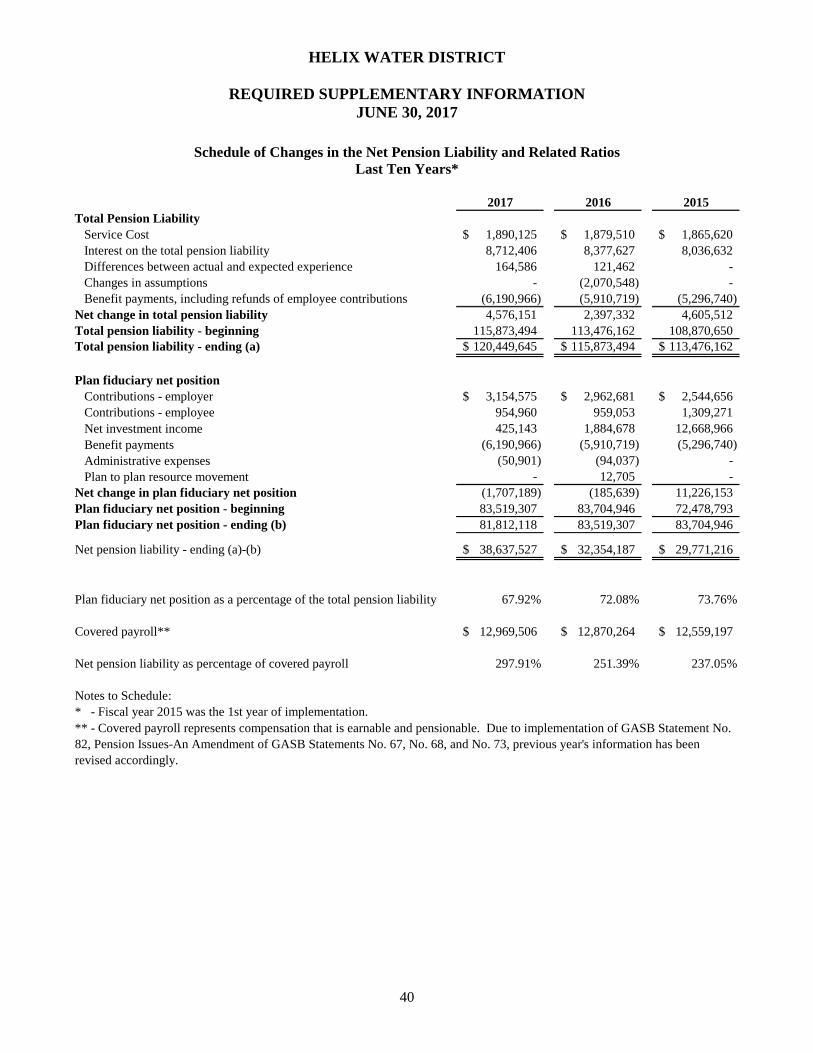
HELIX WATER DISTRICT
REQUIRED SUPPLEMENTARY INFORMATION JUNE 30, 2017
40
Schedule of Changes in the Net Pension Liability and Related Ratios Last Ten Years*
2017 2016 2015
Total Pension LiabilityService Cost 1,890,125$ 1,879,510$ 1,865,620$ Interest on the total pension liability 8,712,406 8,377,627 8,036,632 Differences between actual and expected experience 164,586 121,462 - Changes in assumptions - (2,070,548) - Benefit payments, including refunds of employee contributions (6,190,966) (5,910,719) (5,296,740)
Net change in total pension liability 4,576,151 2,397,332 4,605,512 Total pension liability - beginning 115,873,494 113,476,162 108,870,650 Total pension liability - ending (a) 120,449,645$ 115,873,494$ 113,476,162$
Plan fiduciary net positionContributions - employer 3,154,575$ 2,962,681$ 2,544,656$ Contributions - employee 954,960 959,053 1,309,271 Net investment income 425,143 1,884,678 12,668,966 Benefit payments (6,190,966) (5,910,719) (5,296,740) Administrative expenses (50,901) (94,037) - Plan to plan resource movement - 12,705 -
Net change in plan fiduciary net position (1,707,189) (185,639) 11,226,153 Plan fiduciary net position - beginning 83,519,307 83,704,946 72,478,793 Plan fiduciary net position - ending (b) 81,812,118 83,519,307 83,704,946
Net pension liability - ending (a)-(b) 38,637,527$ 32,354,187$ 29,771,216$
Plan fiduciary net position as a percentage of the total pension liability 67.92% 72.08% 73.76%
Covered payroll** 12,969,506$ 12,870,264$ 12,559,197$
Net pension liability as percentage of covered payroll 297.91% 251.39% 237.05%
Notes to Schedule:* - Fiscal year 2015 was the 1st year of implementation.** - Covered payroll represents compensation that is earnable and pensionable. Due to implementation of GASB Statement No. 82, Pension Issues-An Amendment of GASB Statements No. 67, No. 68, and No. 73, previous year's information has been revised accordingly.
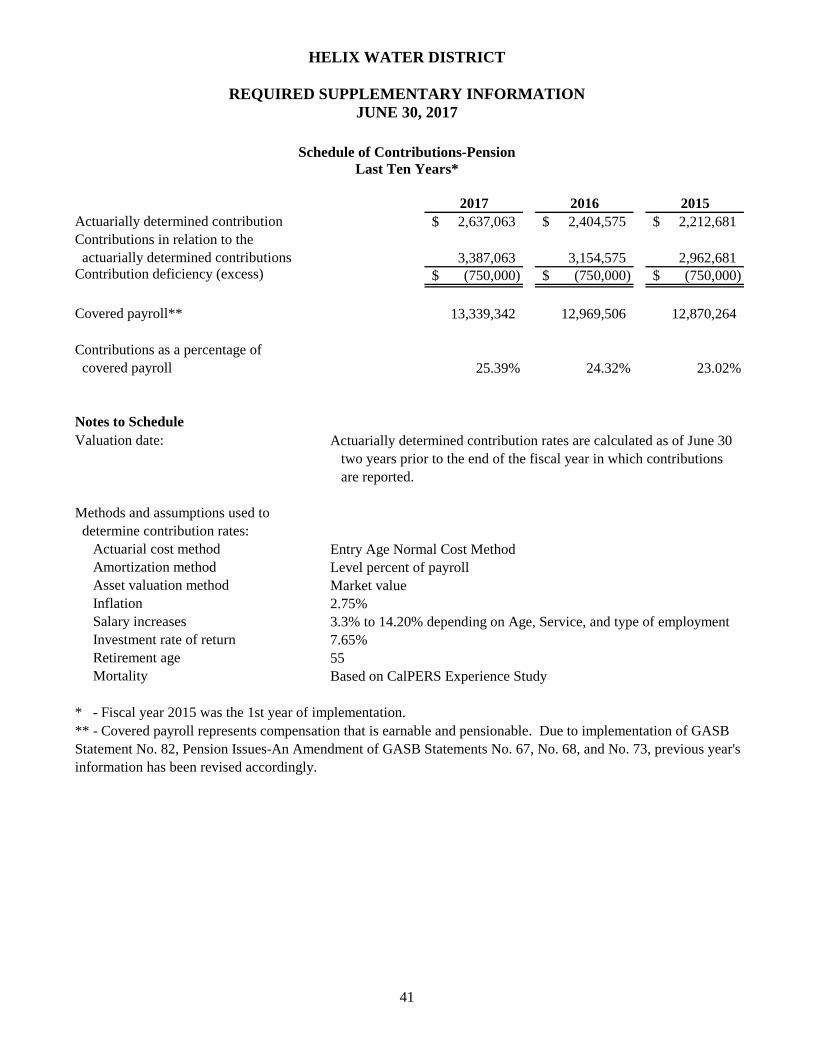
HELIX WATER DISTRICT
REQUIRED SUPPLEMENTARY INFORMATION JUNE 30, 2017
41
Schedule of Contributions-Pension Last Ten Years*
2017 2016 2015Actuarially determined contribution 2,637,063$ 2,404,575$ 2,212,681$ Contributions in relation to the actuarially determined contributions 3,387,063 3,154,575 2,962,681 Contribution deficiency (excess) (750,000)$ (750,000)$ (750,000)$
Covered payroll** 13,339,342 12,969,506 12,870,264
Contributions as a percentage of covered payroll 25.39% 24.32% 23.02%
Notes to ScheduleValuation date: Actuarially determined contribution rates are calculated as of June 30
two years prior to the end of the fiscal year in which contributionsare reported.
Methods and assumptions used to determine contribution rates:
Actuarial cost method Entry Age Normal Cost Method Amortization method Level percent of payroll Asset valuation method Market value Inflation 2.75% Salary increases 3.3% to 14.20% depending on Age, Service, and type of employment Investment rate of return 7.65% Retirement age 55 Mortality Based on CalPERS Experience Study
* - Fiscal year 2015 was the 1st year of implementation.** - Covered payroll represents compensation that is earnable and pensionable. Due to implementation of GASBStatement No. 82, Pension Issues-An Amendment of GASB Statements No. 67, No. 68, and No. 73, previous year'sinformation has been revised accordingly.

HELIX WATER DISTRICT
REQUIRED SUPPLEMENTARY INFORMATION JUNE 30, 2017
42
Helix Water District Other Post-Employment Benefits Schedule of Funding Progress
Actuarial UAAL as a Accrued Actuarial Unfunded Annual Percentage
Actuarial Liability (AAL) Value of AAL Funded Covered of CoveredValuation Entry Age Assets (UAAL) Status Payroll Payroll
Date (a) (b) (a)-(b) (b)/(a) (c) [(a)-(b)]/(c)
6/30/2011 28,480,685$ 3,500,646$ 24,980,039$ 12.3% 11,316,000$ 220.7%6/30/2013 31,462,528 5,882,707 25,579,821 18.7% 11,862,000 215.6%6/30/2015 33,014,857 9,060,860 23,953,997 27.4% 12,337,000 194.2%
43
STATISTICAL SECTION This part of the Helix Water District’s comprehensive annual financial report presents detailed information as a context for understanding what the information says about the District’s overall financial health. Contents Financial Trends
These schedules contain trend information to help the reader understand how the District’s financial performance and well-being have changed over time.
Revenue Capacity These schedules contain information to help the reader assess the District’s most significant local revenue source, water sales.
Debt Capacity These schedules present information to help the reader assess the affordability of the District’s current levels of outstanding debt and the District’s ability to issue additional debt in the future.
Demographic and Economic Information These schedules offer demographic and economic indicators to help the reader understand the environment within which the District’s financial activities take place.
Operating Information These schedules contain service and infrastructure data to help the reader understand how the information in the District’s financial report relates to the services the District provides and the activities it performs.
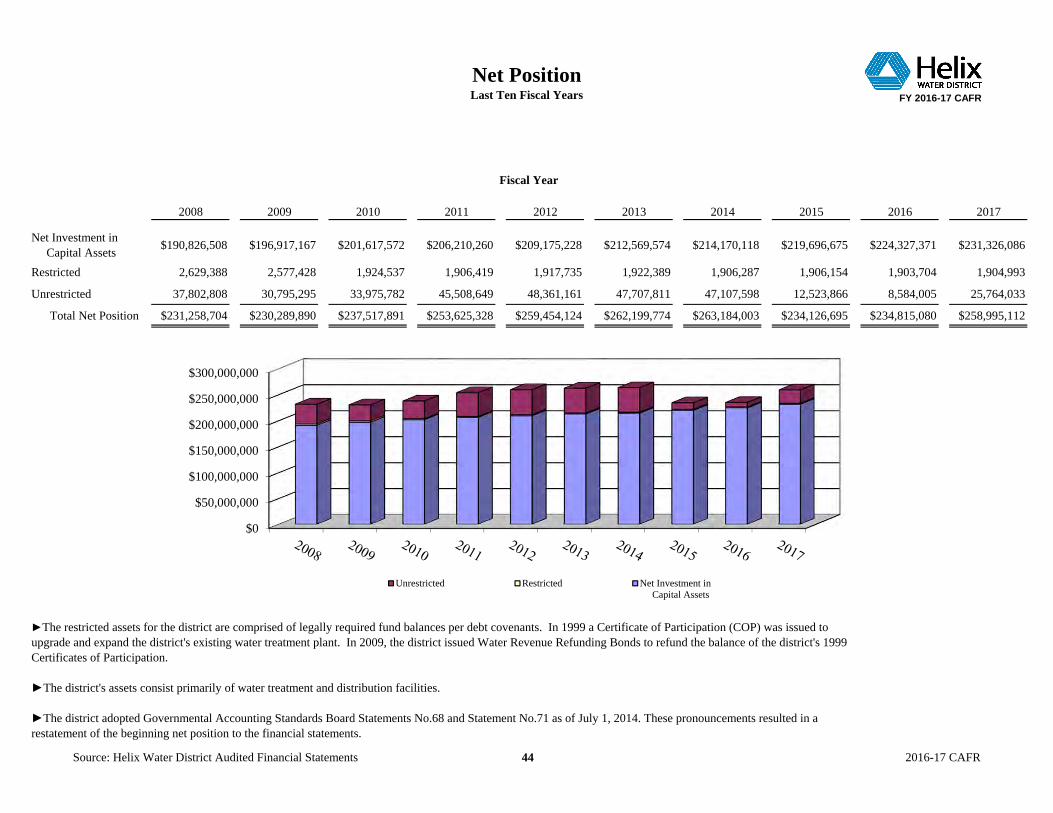
Net PositionLast Ten Fiscal Years FY 2016-17 CAFR
2008 2009 2010 2011 2012 2013 2014 2015 2016 2017
Net Investment in Capital Assets $190,826,508 $196,917,167 $201,617,572 $206,210,260 $209,175,228 $212,569,574 $214,170,118 $219,696,675 $224,327,371 $231,326,086
Restricted 2,629,388 2,577,428 1,924,537 1,906,419 1,917,735 1,922,389 1,906,287 1,906,154 1,903,704 1,904,993
Unrestricted 37,802,808 30,795,295 33,975,782 45,508,649 48,361,161 47,707,811 47,107,598 12,523,866 8,584,005 25,764,033
Total Net Position $231,258,704 $230,289,890 $237,517,891 $253,625,328 $259,454,124 $262,199,774 $263,184,003 $234,126,695 $234,815,080 $258,995,112
Fiscal Year
►The restricted assets for the district are comprised of legally required fund balances per debt covenants. In 1999 a Certificate of Participation (COP) was issued to upgrade and expand the district's existing water treatment plant. In 2009, the district issued Water Revenue Refunding Bonds to refund the balance of the district's 1999 Certificates of Participation.
►The district's assets consist primarily of water treatment and distribution facilities.
►The district adopted Governmental Accounting Standards Board Statements No.68 and Statement No.71 as of July 1, 2014. These pronouncements resulted in a restatement of the beginning net position to the financial statements.
$0
$50,000,000
$100,000,000
$150,000,000
$200,000,000
$250,000,000
$300,000,000
Unrestricted Restricted Net Investment in Capital Assets
Source: Helix Water District Audited Financial Statements 44 2016-17 CAFR
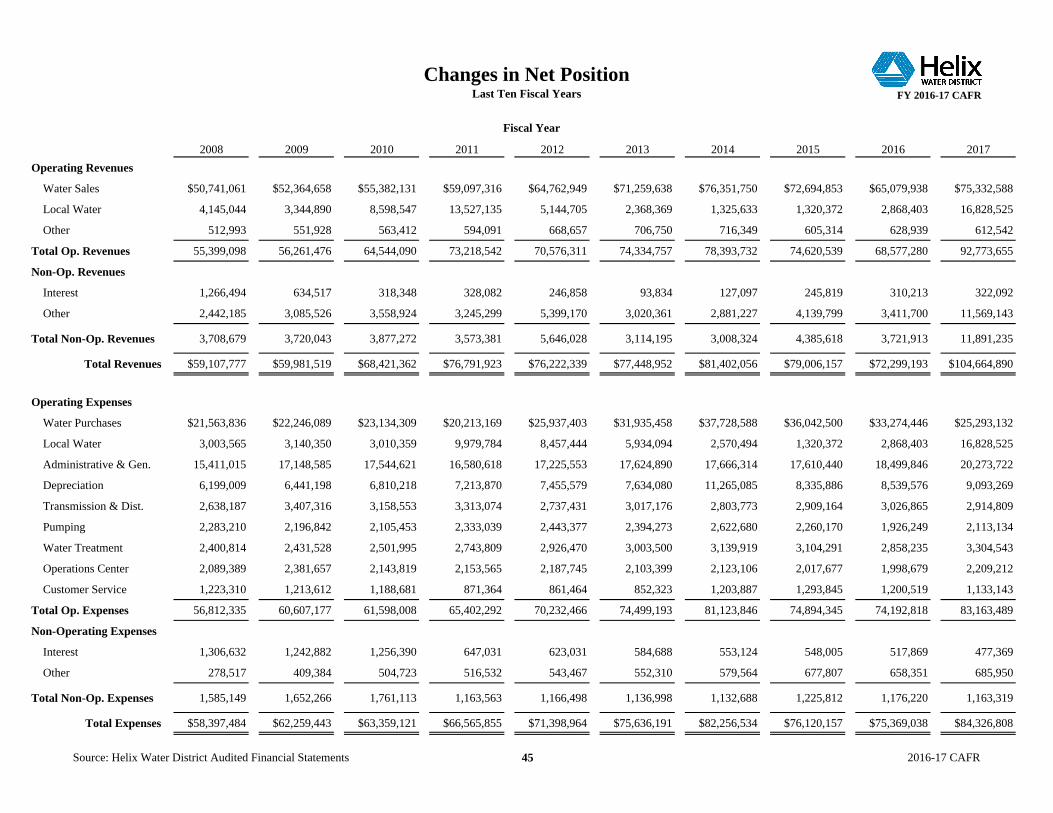
Changes in Net PositionLast Ten Fiscal Years FY 2016-17 CAFR
2008 2009 2010 2011 2012 2013 2014 2015 2016 2017Operating Revenues
Water Sales $50,741,061 $52,364,658 $55,382,131 $59,097,316 $64,762,949 $71,259,638 $76,351,750 $72,694,853 $65,079,938 $75,332,588
Local Water 4,145,044 3,344,890 8,598,547 13,527,135 5,144,705 2,368,369 1,325,633 1,320,372 2,868,403 16,828,525
Other 512,993 551,928 563,412 594,091 668,657 706,750 716,349 605,314 628,939 612,542
Total Op. Revenues 55,399,098 56,261,476 64,544,090 73,218,542 70,576,311 74,334,757 78,393,732 74,620,539 68,577,280 92,773,655
Non-Op. Revenues
Interest 1,266,494 634,517 318,348 328,082 246,858 93,834 127,097 245,819 310,213 322,092
Other 2,442,185 3,085,526 3,558,924 3,245,299 5,399,170 3,020,361 2,881,227 4,139,799 3,411,700 11,569,143
Total Non-Op. Revenues 3,708,679 3,720,043 3,877,272 3,573,381 5,646,028 3,114,195 3,008,324 4,385,618 3,721,913 11,891,235
Total Revenues $59,107,777 $59,981,519 $68,421,362 $76,791,923 $76,222,339 $77,448,952 $81,402,056 $79,006,157 $72,299,193 $104,664,890
Operating Expenses
Water Purchases $21,563,836 $22,246,089 $23,134,309 $20,213,169 $25,937,403 $31,935,458 $37,728,588 $36,042,500 $33,274,446 $25,293,132
Local Water 3,003,565 3,140,350 3,010,359 9,979,784 8,457,444 5,934,094 2,570,494 1,320,372 2,868,403 16,828,525
Administrative & Gen. 15,411,015 17,148,585 17,544,621 16,580,618 17,225,553 17,624,890 17,666,314 17,610,440 18,499,846 20,273,722
Depreciation 6,199,009 6,441,198 6,810,218 7,213,870 7,455,579 7,634,080 11,265,085 8,335,886 8,539,576 9,093,269
Transmission & Dist. 2,638,187 3,407,316 3,158,553 3,313,074 2,737,431 3,017,176 2,803,773 2,909,164 3,026,865 2,914,809
Pumping 2,283,210 2,196,842 2,105,453 2,333,039 2,443,377 2,394,273 2,622,680 2,260,170 1,926,249 2,113,134
Water Treatment 2,400,814 2,431,528 2,501,995 2,743,809 2,926,470 3,003,500 3,139,919 3,104,291 2,858,235 3,304,543
Operations Center 2,089,389 2,381,657 2,143,819 2,153,565 2,187,745 2,103,399 2,123,106 2,017,677 1,998,679 2,209,212
Customer Service 1,223,310 1,213,612 1,188,681 871,364 861,464 852,323 1,203,887 1,293,845 1,200,519 1,133,143
Total Op. Expenses 56,812,335 60,607,177 61,598,008 65,402,292 70,232,466 74,499,193 81,123,846 74,894,345 74,192,818 83,163,489
Non-Operating Expenses
Interest 1,306,632 1,242,882 1,256,390 647,031 623,031 584,688 553,124 548,005 517,869 477,369
Other 278,517 409,384 504,723 516,532 543,467 552,310 579,564 677,807 658,351 685,950
Total Non-Op. Expenses 1,585,149 1,652,266 1,761,113 1,163,563 1,166,498 1,136,998 1,132,688 1,225,812 1,176,220 1,163,319
Total Expenses $58,397,484 $62,259,443 $63,359,121 $66,565,855 $71,398,964 $75,636,191 $82,256,534 $76,120,157 $75,369,038 $84,326,808
Fiscal Year
Source: Helix Water District Audited Financial Statements 45 2016-17 CAFR
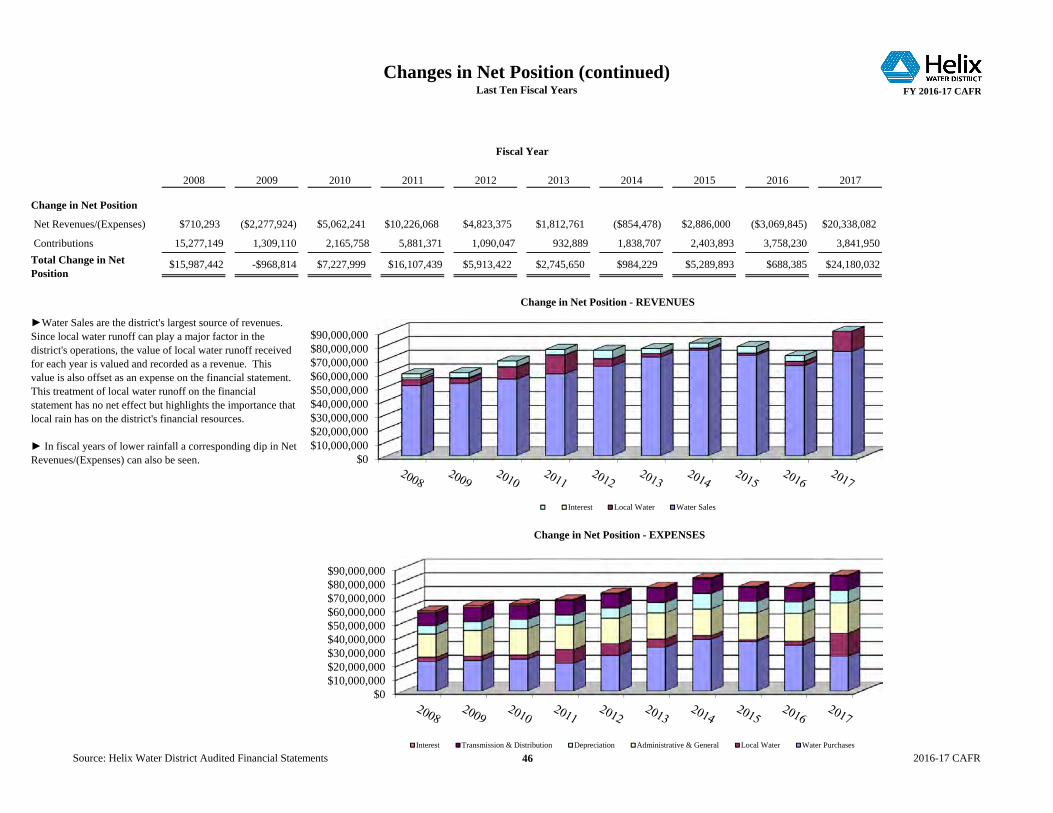
Changes in Net Position (continued)Last Ten Fiscal Years FY 2016-17 CAFR
2008 2009 2010 2011 2012 2013 2014 2015 2016 2017
Change in Net Position
Net Revenues/(Expenses) $710,293 ($2,277,924) $5,062,241 $10,226,068 $4,823,375 $1,812,761 ($854,478) $2,886,000 ($3,069,845) $20,338,082
Contributions 15,277,149 1,309,110 2,165,758 5,881,371 1,090,047 932,889 1,838,707 2,403,893 3,758,230 3,841,950
$15,987,442 -$968,814 $7,227,999 $16,107,439 $5,913,422 $2,745,650 $984,229 $5,289,893 $688,385 $24,180,032Total Change in Net Position
►Water Sales are the district's largest source of revenues. Since local water runoff can play a major factor in the district's operations, the value of local water runoff received for each year is valued and recorded as a revenue. This value is also offset as an expense on the financial statement. This treatment of local water runoff on the financial statement has no net effect but highlights the importance that local rain has on the district's financial resources.
► In fiscal years of lower rainfall a corresponding dip in Net Revenues/(Expenses) can also be seen.
Fiscal Year
$0$10,000,000$20,000,000$30,000,000$40,000,000$50,000,000$60,000,000$70,000,000$80,000,000$90,000,000
Change in Net Position - REVENUES
Interest Local Water Water Sales
$0$10,000,000$20,000,000$30,000,000$40,000,000$50,000,000$60,000,000$70,000,000$80,000,000$90,000,000
Change in Net Position - EXPENSES
Interest Transmission & Distribution Depreciation Administrative & General Local Water Water Purchases
Source: Helix Water District Audited Financial Statements 46 2016-17 CAFR

Water Sold by Type of CustomerLast Ten Fiscal Years FY 2016-17 CAFR
2008 2009 2010 2011 2012 2013 2014 2015 2016 2017
Domestic $28,714,213 $29,746,537 $30,401,691 $31,072,554 $33,706,749 $37,212,911 $40,016,189 $38,471,043 $33,483,479 $38,335,569
Multi-Family 11,444,761 12,086,466 13,680,129 15,146,308 16,623,440 18,032,140 19,220,065 19,404,032 18,772,967 20,505,981
Commercial 5,523,424 5,772,201 6,270,839 6,548,089 7,011,193 7,515,696 7,994,583 8,164,305 7,767,796 8,351,360
Other Water Sales 5,058,663 4,759,454 5,029,472 6,330,365 7,421,567 8,498,891 9,120,913 6,655,473 5,055,696 8,139,678
Total Water Sales $50,741,061 $52,364,658 $55,382,131 $59,097,316 $64,762,949 $71,259,638 $76,351,750 $72,694,853 $65,079,938 $75,332,588
Water SoldHundred Cubic Feet (HCF) 16,776,698 15,836,238 14,031,112 13,857,307 14,285,066 14,966,345 15,275,455 13,566,666 11,100,073 12,529,598
Direct Rate Per HCF $3.02 $3.31 $3.95 $4.26 $4.53 $4.76 $5.00 $5.36 $5.86 $6.01
►Helix's primary revenue source is retail water sales. The proportion of customer types that make up the revenue base has remained relatively unchanged for the timeframe presented. Domestic water customers make up the largest section of the revenue base.
►Although revenue by customer type is not presented separately on the face of the financial statements, these revenues are recorded separately in the district's generalledger for tracking purposes.
Fiscal Year
$0$10,000,000$20,000,000$30,000,000$40,000,000$50,000,000$60,000,000$70,000,000$80,000,000
Other Water Sales Commercial Multi-Family Domestic
Source: Helix Water District Audited Financial Statements 47 2016-17 CAFR
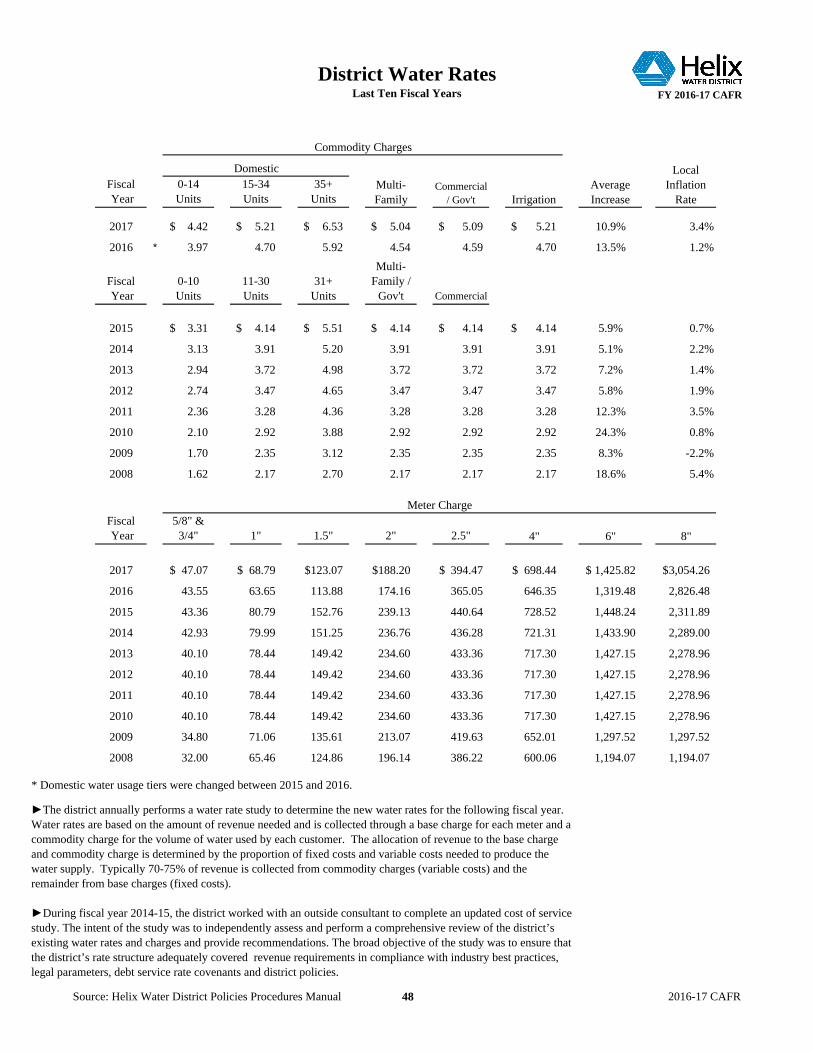
District Water RatesLast Ten Fiscal Years FY 2016-17 CAFR
Fiscal Year
0-14 Units
15-34 Units
35+ Units
2017 4.42$ 5.21$ 6.53$ 5.04$ 5.09$ 5.21$ 10.9% 3.4%
2016 * 3.97 4.70 5.92 4.54 4.59 4.70 13.5% 1.2%
Fiscal Year
0-10 Units
11-30 Units
31+ Units
Multi-Family /
Gov't Commercial
2015 3.31$ 4.14$ 5.51$ 4.14$ 4.14$ 4.14$ 5.9% 0.7%
2014 3.13 3.91 5.20 3.91 3.91 3.91 5.1% 2.2%
2013 2.94 3.72 4.98 3.72 3.72 3.72 7.2% 1.4%
2012 2.74 3.47 4.65 3.47 3.47 3.47 5.8% 1.9%
2011 2.36 3.28 4.36 3.28 3.28 3.28 12.3% 3.5%
2010 2.10 2.92 3.88 2.92 2.92 2.92 24.3% 0.8%
2009 1.70 2.35 3.12 2.35 2.35 2.35 8.3% -2.2%
2008 1.62 2.17 2.70 2.17 2.17 2.17 18.6% 5.4%
Fiscal Year
5/8" &3/4" 1" 1.5" 2" 2.5" 4" 6" 8"
2017 47.07$ 68.79$ 123.07$ 188.20$ 394.47$ 698.44$ 1,425.82$ 3,054.26$
2016 43.55 63.65 113.88 174.16 365.05 646.35 1,319.48 2,826.48
2015 43.36 80.79 152.76 239.13 440.64 728.52 1,448.24 2,311.89
2014 42.93 79.99 151.25 236.76 436.28 721.31 1,433.90 2,289.00
2013 40.10 78.44 149.42 234.60 433.36 717.30 1,427.15 2,278.96
2012 40.10 78.44 149.42 234.60 433.36 717.30 1,427.15 2,278.96
2011 40.10 78.44 149.42 234.60 433.36 717.30 1,427.15 2,278.96
2010 40.10 78.44 149.42 234.60 433.36 717.30 1,427.15 2,278.96
2009 34.80 71.06 135.61 213.07 419.63 652.01 1,297.52 1,297.52
2008 32.00 65.46 124.86 196.14 386.22 600.06 1,194.07 1,194.07
►The district annually performs a water rate study to determine the new water rates for the following fiscal year. Water rates are based on the amount of revenue needed and is collected through a base charge for each meter and a commodity charge for the volume of water used by each customer. The allocation of revenue to the base charge and commodity charge is determined by the proportion of fixed costs and variable costs needed to produce the water supply. Typically 70-75% of revenue is collected from commodity charges (variable costs) and the remainder from base charges (fixed costs).
►During fiscal year 2014-15, the district worked with an outside consultant to complete an updated cost of service study. The intent of the study was to independently assess and perform a comprehensive review of the district’s existing water rates and charges and provide recommendations. The broad objective of the study was to ensure that the district’s rate structure adequately covered revenue requirements in compliance with industry best practices, legal parameters, debt service rate covenants and district policies.
Meter Charge
Commercial / Gov't Irrigation
Local Inflation
Rate
DomesticAverage Increase
Multi-Family
Commodity Charges
* Domestic water usage tiers were changed between 2015 and 2016.
Source: Helix Water District Policies Procedures Manual 48 2016-17 CAFR
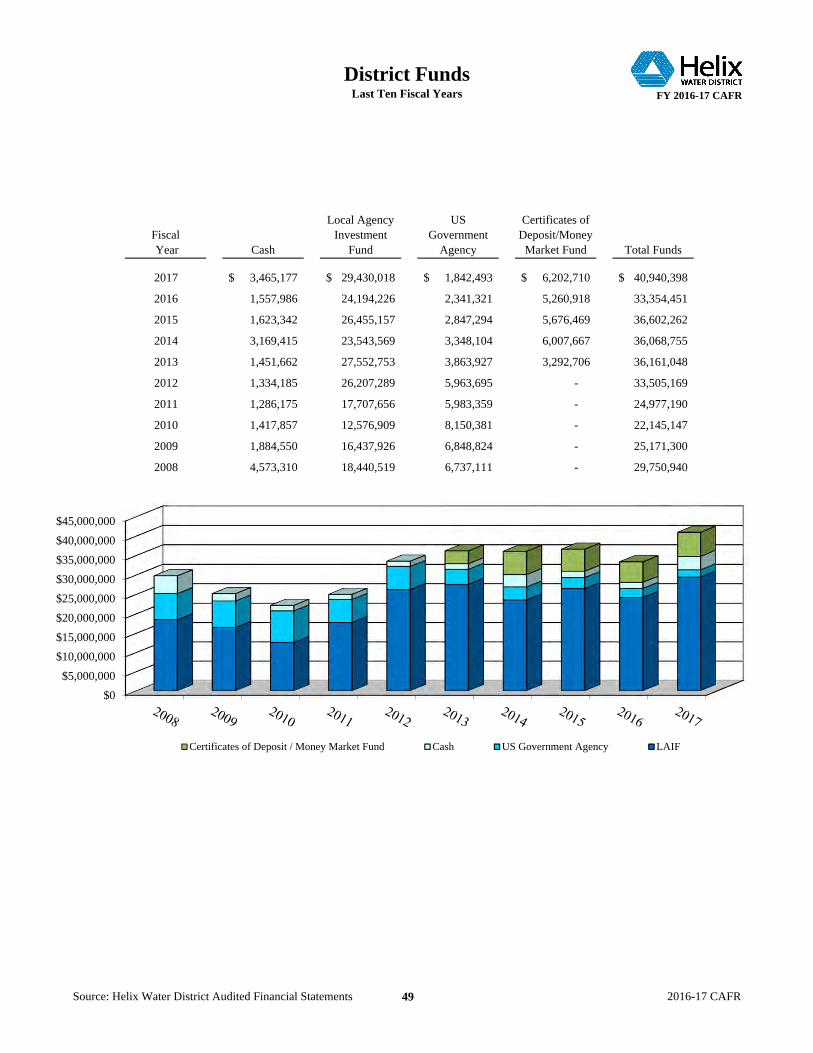
District FundsLast Ten Fiscal Years FY 2016-17 CAFR
Fiscal Year Cash
Local Agency Investment
Fund
US Government
Agency
Certificates of Deposit/Money
Market Fund Total Funds
2017 3,465,177$ 29,430,018$ 1,842,493$ 6,202,710$ 40,940,398$
2016 1,557,986 24,194,226 2,341,321 5,260,918 33,354,451
2015 1,623,342 26,455,157 2,847,294 5,676,469 36,602,262
2014 3,169,415 23,543,569 3,348,104 6,007,667 36,068,755
2013 1,451,662 27,552,753 3,863,927 3,292,706 36,161,048
2012 1,334,185 26,207,289 5,963,695 - 33,505,169
2011 1,286,175 17,707,656 5,983,359 - 24,977,190
2010 1,417,857 12,576,909 8,150,381 - 22,145,147
2009 1,884,550 16,437,926 6,848,824 - 25,171,300
2008 4,573,310 18,440,519 6,737,111 - 29,750,940
$0$5,000,000
$10,000,000$15,000,000$20,000,000$25,000,000$30,000,000$35,000,000$40,000,000$45,000,000
Certificates of Deposit / Money Market Fund Cash US Government Agency LAIF
Source: Helix Water District Audited Financial Statements 49 2016-17 CAFR
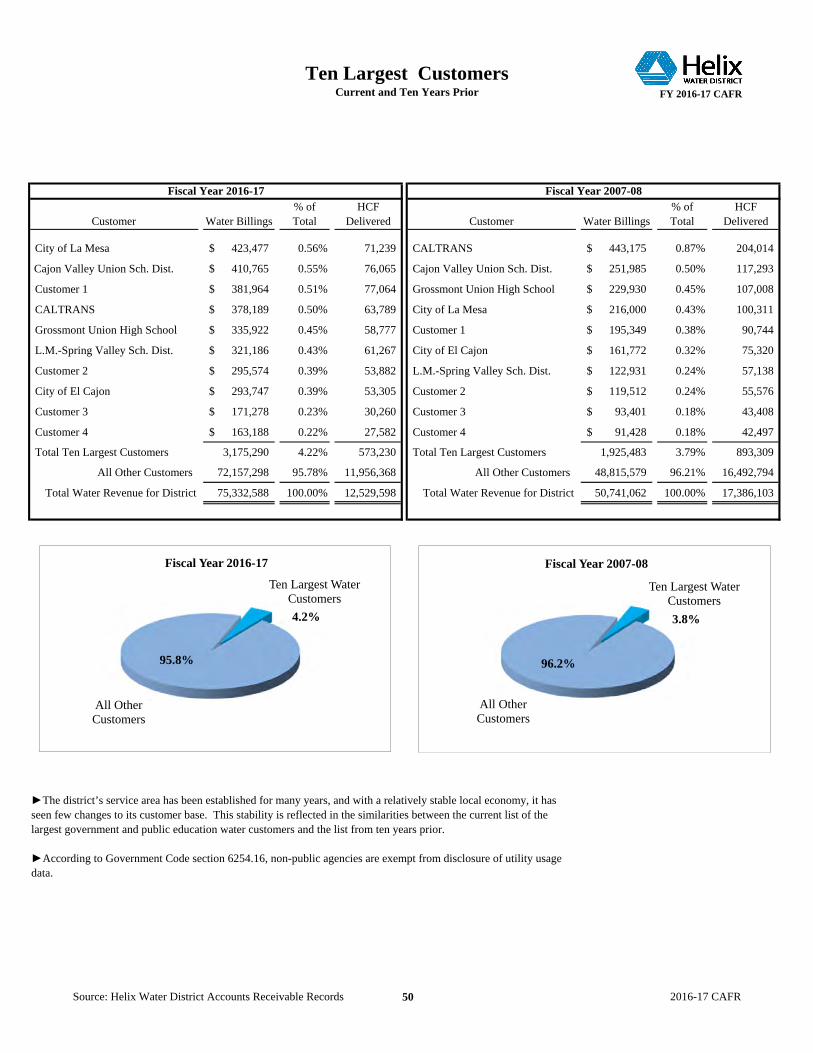
Ten Largest CustomersCurrent and Ten Years Prior FY 2016-17 CAFR
Customer Water Billings% of Total
HCF Delivered Customer Water Billings
% of Total
HCF Delivered
City of La Mesa 423,477$ 0.56% 71,239 CALTRANS 443,175$ 0.87% 204,014
Cajon Valley Union Sch. Dist. 410,765$ 0.55% 76,065 Cajon Valley Union Sch. Dist. 251,985$ 0.50% 117,293
Customer 1 381,964$ 0.51% 77,064 Grossmont Union High School 229,930$ 0.45% 107,008
CALTRANS 378,189$ 0.50% 63,789 City of La Mesa 216,000$ 0.43% 100,311
Grossmont Union High School 335,922$ 0.45% 58,777 Customer 1 195,349$ 0.38% 90,744
L.M.-Spring Valley Sch. Dist. 321,186$ 0.43% 61,267 City of El Cajon 161,772$ 0.32% 75,320
Customer 2 295,574$ 0.39% 53,882 L.M.-Spring Valley Sch. Dist. 122,931$ 0.24% 57,138
City of El Cajon 293,747$ 0.39% 53,305 Customer 2 119,512$ 0.24% 55,576
Customer 3 171,278$ 0.23% 30,260 Customer 3 93,401$ 0.18% 43,408
Customer 4 163,188$ 0.22% 27,582 Customer 4 91,428$ 0.18% 42,497
Total Ten Largest Customers 3,175,290 4.22% 573,230 Total Ten Largest Customers 1,925,483 3.79% 893,309
All Other Customers 72,157,298 95.78% 11,956,368 All Other Customers 48,815,579 96.21% 16,492,794
Total Water Revenue for District 75,332,588 100.00% 12,529,598 Total Water Revenue for District 50,741,062 100.00% 17,386,103
Fiscal Year 2016-17 Fiscal Year 2007-08
►The district’s service area has been established for many years, and with a relatively stable local economy, it has seen few changes to its customer base. This stability is reflected in the similarities between the current list of the largest government and public education water customers and the list from ten years prior.
►According to Government Code section 6254.16, non-public agencies are exempt from disclosure of utility usage data.
Ten Largest Water Customers
All Other Customers
Fiscal Year 2016-17
95.8%
4.2%
Ten Largest Water Customers
All Other Customers
Fiscal Year 2007-08
96.2%
3.8%
Source: Helix Water District Accounts Receivable Records 50 2016-17 CAFR

Ratios of Outstanding DebtLast Ten Fiscal Years FY 2016-17 CAFR
Outstanding Number of Debt Per Debt perDebt Meters Meter Population Capita
2017 11,145,000$ 56,117 198.60$ 273,142 40.80$
2016 12,540,000$ 56,066 223.66$ 271,759 46.14$
2015 13,890,000$ 56,008 248.00$ 270,375 51.37$
2014 15,205,000$ 55,759 272.69$ 267,922 56.75$
2013 16,490,000$ 55,701 296.04$ 267,922 61.55$
2012 17,745,000$ 55,628 318.99$ 267,922 66.23$
2011 18,965,000$ 55,554 341.38$ 267,922 70.79$
2010 20,165,000$ 55,563 362.92$ 267,922 75.26$
2009 22,300,000$ 55,626 400.89$ 263,642 84.58$
2008 23,625,000$ 55,458 426.00$ 263,642 89.61$
Fiscal Year
►Helix Water District only has Business-type activities and only one debt issue outstanding.
►In 2009, $21,345,000 Water Revenue Bonds were issued to refund the 1999 Certificates of Participation.
►The district does not currently have any General Obligation Bonds.
►The district does not currently have any overlapping debt-only direct debt as displayed above.
►Population figures are estimated by SANDAG for all local governments and special districts in San Diego County.
$0
$5,000,000
$10,000,000
$15,000,000
$20,000,000
$25,000,000
Outstanding Debt
Outstanding Debt
Source: Helix Water District Annual Report 51 2016-17 CAFR

Debt Coverage RatioLast Ten Fiscal Years FY 2016-17 CAFR
Principal Interest Total
2017 87,836,365$ 57,927,645$ 29,908,720$ * 1,395,000$ 477,369$ 1,872,369$ 16.0
2016 69,430,790$ 63,443,190$ 5,987,600$ 1,350,000$ 517,869$ 1,867,869$ 3.2
2015 77,685,785$ 65,915,894$ 11,769,891$ 1,315,000$ 548,005$ 1,863,005$ 6.3
2014 80,076,423$ 67,867,831$ 12,208,592$ 1,285,000$ 553,124$ 1,838,124$ 6.6
2013 75,080,583$ 61,483,329$ 13,597,254$ 1,254,999$ 584,688$ 1,839,687$ 7.4
2012 71,077,634$ 54,862,910$ 16,214,724$ 1,220,000$ 623,031$ 1,843,031$ 8.8
2011 63,264,788$ 48,725,170$ 14,539,618$ 1,200,000$ 663,651$ 1,863,651$ 7.8
2010 59,822,815$ 51,102,154$ 8,720,661$ 1,180,000$ 1,256,390$ 2,436,390$ 3.6
2009 56,636,629$ 50,110,013$ 6,526,616$ 1,325,000$ 1,242,882$ 2,567,882$ 2.5
2008 54,962,733$ 46,613,278$ 8,349,455$ 1,275,000$ 1,306,632$ 2,581,632$ 3.2
►The Water Revenue Bonds covenant requires a debt coverage ratio greater than 1.2.
►Only cash basis revenues are included in the Total Revenues for the debt service ratio calculation. Accruals to record the value of local water runoff as a revenue are not included in the total.
►Only cash basis expenses are included in the Total Expenses for the debt service ratio calculation. Accruals to record the value of local water runoff and the change in local water storage as an expense are not included in the total. The transactions to record depreciation expense are also not included in the total.
►Total Expenses prior to 2009 are adjusted for debt service.
► Total revenues and total expenses exclude the value of local water runoff.
* 2017 Net revenue available for debt service includes a non-operating litigation settlement of $8,000,000.
Debt Coverage Ratio
Debt Service RequirementsFiscal Year
TotalRevenues
Total Expenses
Net Revenue Available for Debt Service
$0
$5,000,000
$10,000,000
$15,000,000
$20,000,000
$25,000,000
$30,000,000
Net Revenue Available for Debt Service Debt Service Requirements
*
Source: Helix Water District Audited Financial Statements 52 2016-17 CAFR

Economic StatisticsLast Ten Fiscal Years FY 2016-17 CAFR
Imported Local Population (inches) El Capitan Lake Cuyamaca
2017 86.9% 13.1% 273,142 35.37 5,427 5,822
2016 93.4% 6.6% 271,759 23.26 604 586
2015 99.0% 1.0% 270,375 19.37 134 101
2014 98.0% 2.0% 267,922 20.03 212 117
2013 83.8% 16.2% 267,922 15.71 665 265
2012 73.4% 26.6% 267,922 24.15 2,618 1,330
2011 65.0% 35.0% 267,922 36.10 7,995 5,351
2010 91.4% 8.6% 267,922 38.67 6,257 4,111
2009 96.7% 3.3% 263,642 20.22 2,454 1,590
2008 91.9% 8.1% 263,642 27.50 3,931 2,252
Lake Cuyamaca Rainfall
►Demographics on Personal Income, Per Capita Personal Income and Unemployment Rates:The district is unable to obtain these demographic statistics so they are not being included in the CAFR statistical section. Thedistrict’s boundaries include parts of several different cities and unincorporated areas of San Diego County, California. It wouldbe difficult to collect any meaningful data for these demographics from existing data sources.
►Alternatively, rainfall and water runoff data for our geographical area is being included in the statistics. Rain and the resultingwater runoff play a large part in the operations of the district. Fiscal years in which the district experiences lower levels ofrainfall lead to larger amounts of water that need to be purchased from outside sources, thus increasing district expense. Thereverse is also true when the district receives higher levels of rainfall.
►Population figures are estimated by SANDAG for all local governments and special districts in San Diego County.
Source of WaterLocal Runoff Collected
Fiscal Year
(acre-feet)
05,000
10,00015,00020,00025,00030,00035,00040,000
27.50 20.22 38.67 36.10 24.15 15.71 20.03 19.37 23.26
Local Source SDCWA
Rainfall in
InchesAcre-Feet
35.37
Source: Helix Water District Annual Report 53 2016-17 CAFR
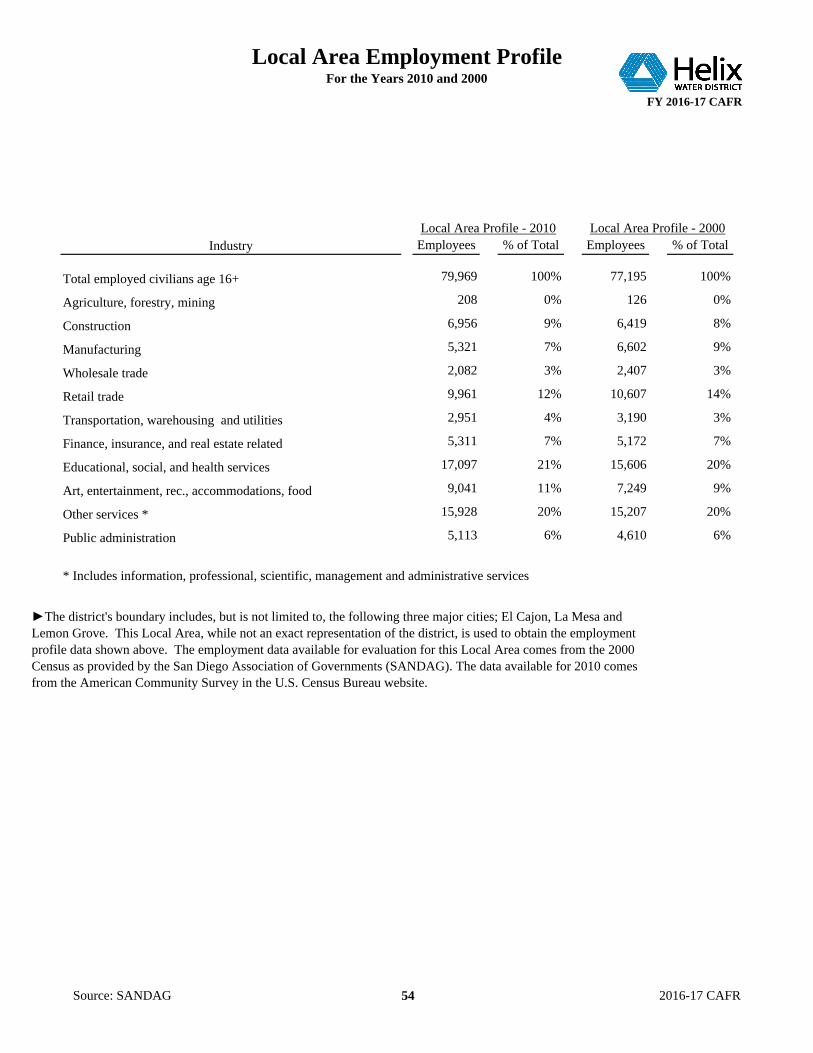
Local Area Employment ProfileFor the Years 2010 and 2000
FY 2016-17 CAFR
Employees % of Total Employees % of Total
Total employed civilians age 16+ 79,969 100% 77,195 100%
Agriculture, forestry, mining 208 0% 126 0%
Construction 6,956 9% 6,419 8%
Manufacturing 5,321 7% 6,602 9%
Wholesale trade 2,082 3% 2,407 3%
Retail trade 9,961 12% 10,607 14%
Transportation, warehousing and utilities 2,951 4% 3,190 3%
Finance, insurance, and real estate related 5,311 7% 5,172 7%
Educational, social, and health services 17,097 21% 15,606 20%
Art, entertainment, rec., accommodations, food 9,041 11% 7,249 9%
Other services * 15,928 20% 15,207 20%
Public administration 5,113 6% 4,610 6%
* Includes information, professional, scientific, management and administrative services
Local Area Profile - 2010 Local Area Profile - 2000
►The district's boundary includes, but is not limited to, the following three major cities; El Cajon, La Mesa and Lemon Grove. This Local Area, while not an exact representation of the district, is used to obtain the employment profile data shown above. The employment data available for evaluation for this Local Area comes from the 2000 Census as provided by the San Diego Association of Governments (SANDAG). The data available for 2010 comes from the American Community Survey in the U.S. Census Bureau website.
Industry
Source: SANDAG 54 2016-17 CAFR
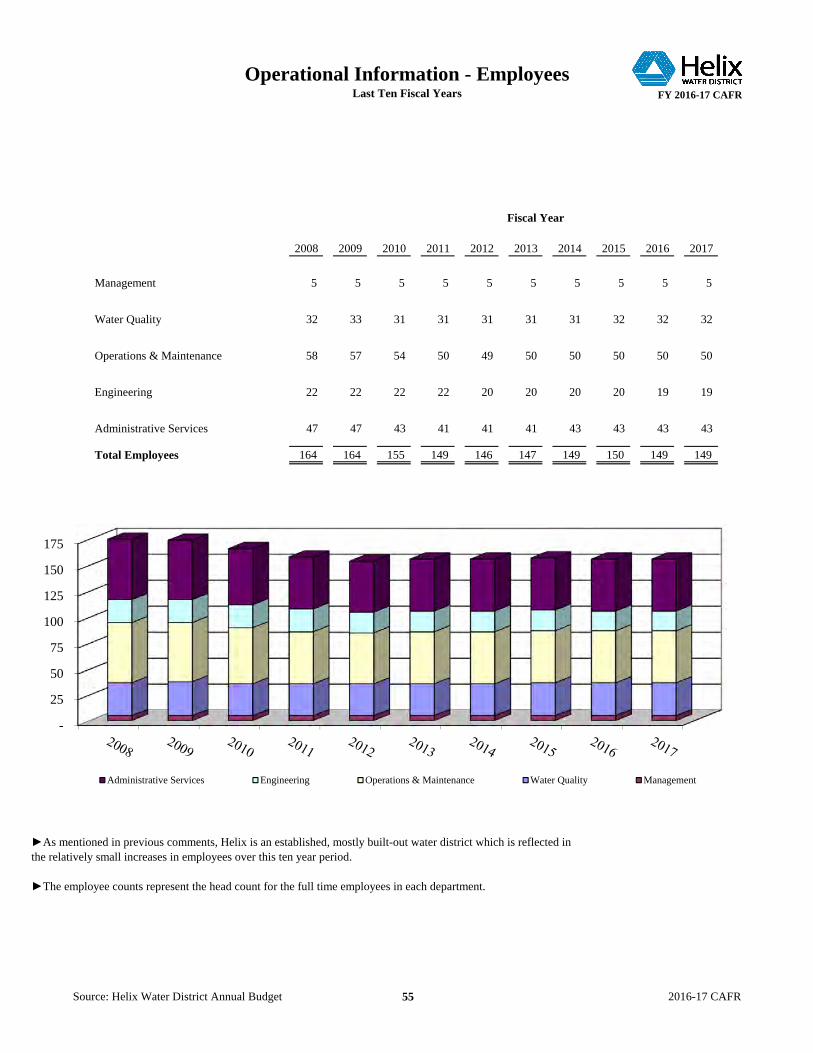
Operational Information - EmployeesLast Ten Fiscal Years FY 2016-17 CAFR
2008 2009 2010 2011 2012 2013 2014 2015 2016 2017
Management 5 5 5 5 5 5 5 5 5 5
Water Quality 32 33 31 31 31 31 31 32 32 32
Operations & Maintenance 58 57 54 50 49 50 50 50 50 50
Engineering 22 22 22 22 20 20 20 20 19 19
Administrative Services 47 47 43 41 41 41 43 43 43 43
Total Employees 164 164 155 149 146 147 149 150 149 149
Fiscal Year
►As mentioned in previous comments, Helix is an established, mostly built-out water district which is reflected in the relatively small increases in employees over this ten year period.
►The employee counts represent the head count for the full time employees in each department.
-
25
50
75
100
125
150
175
Administrative Services Engineering Operations & Maintenance Water Quality Management
Source: Helix Water District Annual Budget 55 2016-17 CAFR
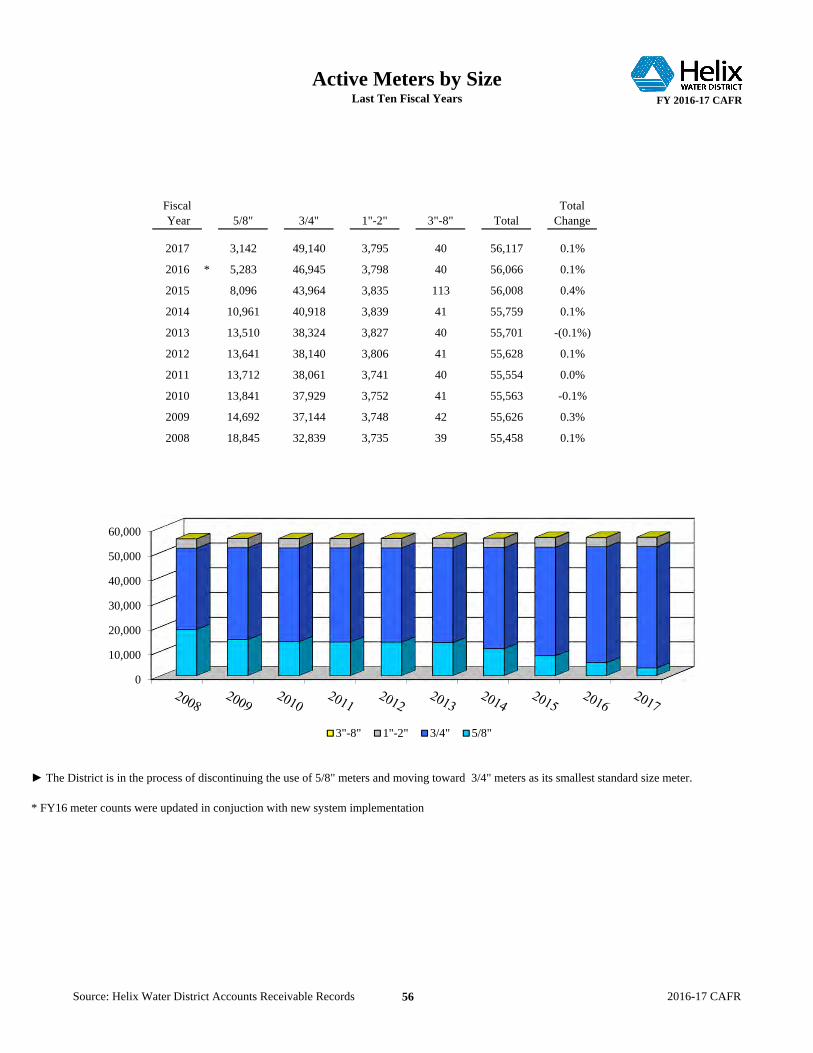
Active Meters by SizeLast Ten Fiscal Years FY 2016-17 CAFR
Fiscal Year 5/8" 3/4" 1"-2" 3"-8" Total
Total Change
2017 3,142 49,140 3,795 40 56,117 0.1%
2016 * 5,283 46,945 3,798 40 56,066 0.1%
2015 8,096 43,964 3,835 113 56,008 0.4%
2014 10,961 40,918 3,839 41 55,759 0.1%
2013 13,510 38,324 3,827 40 55,701 -(0.1%)
2012 13,641 38,140 3,806 41 55,628 0.1%
2011 13,712 38,061 3,741 40 55,554 0.0%
2010 13,841 37,929 3,752 41 55,563 -0.1%
2009 14,692 37,144 3,748 42 55,626 0.3%
2008 18,845 32,839 3,735 39 55,458 0.1%
► The District is in the process of discontinuing the use of 5/8" meters and moving toward 3/4" meters as its smallest standard size meter.
* FY16 meter counts were updated in conjuction with new system implementation
0
10,000
20,000
30,000
40,000
50,000
60,000
3"-8" 1"-2" 3/4" 5/8"
Source: Helix Water District Accounts Receivable Records 56 2016-17 CAFR

Operational Information - AssetsLast Ten Fiscal Years FY 2016-17 CAFR
2017 51 10,831 44 September 971,932,500 94.0
2016 58 10,215 36 September 832,312,316 89.1
2015 249 3,498 34 September 1,131,515,308 102.8
2014 58 3,053 39 September 1,203,656,168 116.8
2013 73 4,349 55 September 1,221,976,184 114.6
2012 74 2,610 41 September 1,202,962,024 109.3
2011 (9) (518) 40 September 1,161,409,876 106.0
2010 (63) 2,043 35 September 1,199,422,488 112.5
2009 168 4,929 40 September 1,332,002,496 127.5
2008 56 8,335 36 September 1,332,566,488 136.9
Fiscal Year
Miles of Pipeline
Treatment Plants
Booster Pumps
Hydropneumatic Stations
2017 728 1 21 4
2016 723 1 21 4
2015 723 1 21 4
2014 723 1 21 4
2013 723 1 21 4
2012 722 1 21 4
2011 719 1 21 4
2010 719 1 21 4
2009 719 1 21 4
2008 720 1 21 4
Water Main Breaks
Fiscal Year
Key Operating Indicators
Month of Peak Consumption
Capital Assets Statistics
Average Daily Consumption in Gallons per Day
Peak Monthly Consumption in
Gallons
Number of Services Added
(Removed)
Net Increase (Decrease) in
Pipeline in Feet
Source: Helix Water District Annual Budget 57 2016-17 CAFR
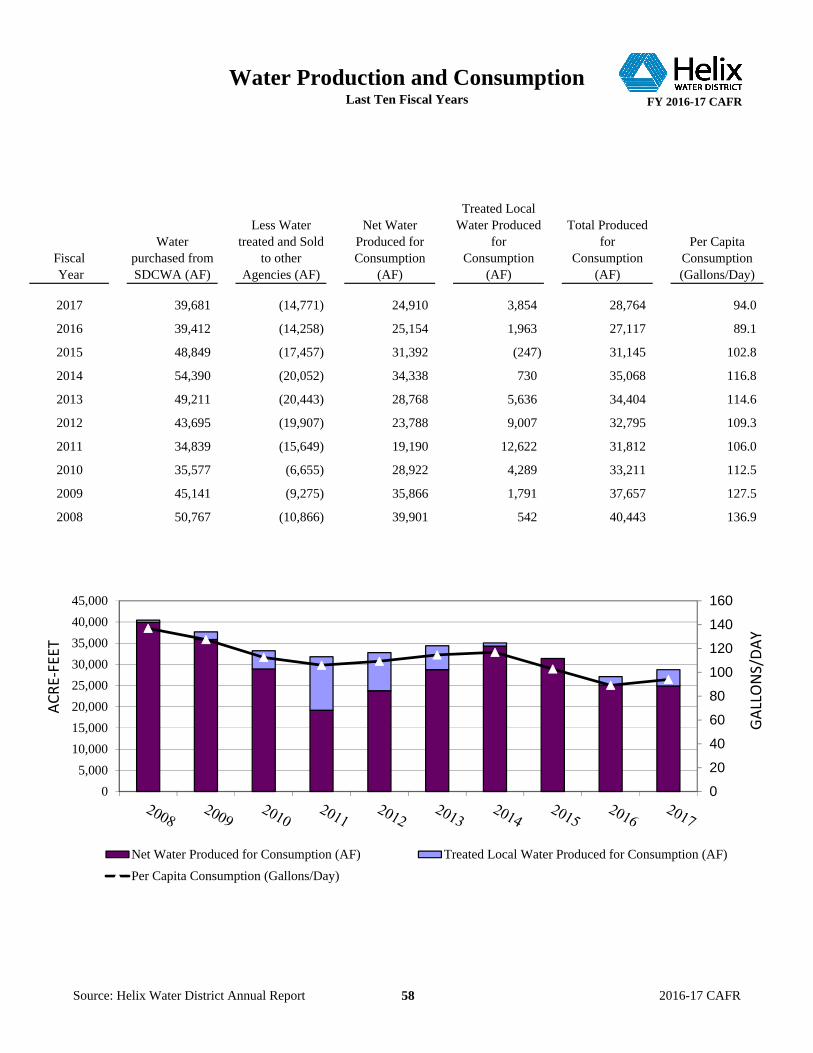
Water Production and ConsumptionLast Ten Fiscal Years FY 2016-17 CAFR
2017 39,681 (14,771) 24,910 3,854 28,764 94.0
2016 39,412 (14,258) 25,154 1,963 27,117 89.1
2015 48,849 (17,457) 31,392 (247) 31,145 102.8
2014 54,390 (20,052) 34,338 730 35,068 116.8
2013 49,211 (20,443) 28,768 5,636 34,404 114.6
2012 43,695 (19,907) 23,788 9,007 32,795 109.3
2011 34,839 (15,649) 19,190 12,622 31,812 106.0
2010 35,577 (6,655) 28,922 4,289 33,211 112.5
2009 45,141 (9,275) 35,866 1,791 37,657 127.5
2008 50,767 (10,866) 39,901 542 40,443 136.9
Per Capita Consumption (Gallons/Day)
Net Water Produced for Consumption
(AF)
Less Water treated and Sold
to other Agencies (AF)
Water purchased from SDCWA (AF)
Fiscal Year
Treated Local Water Produced
for Consumption
(AF)
Total Produced for
Consumption (AF)
0
20
40
60
80
100
120
140
160
05,000
10,00015,00020,00025,00030,00035,00040,00045,000
Net Water Produced for Consumption (AF) Treated Local Water Produced for Consumption (AF)
Per Capita Consumption (Gallons/Day)
ACRE
-FEE
T
GALLONS/DA
Y
Source: Helix Water District Annual Report 58 2016-17 CAFR
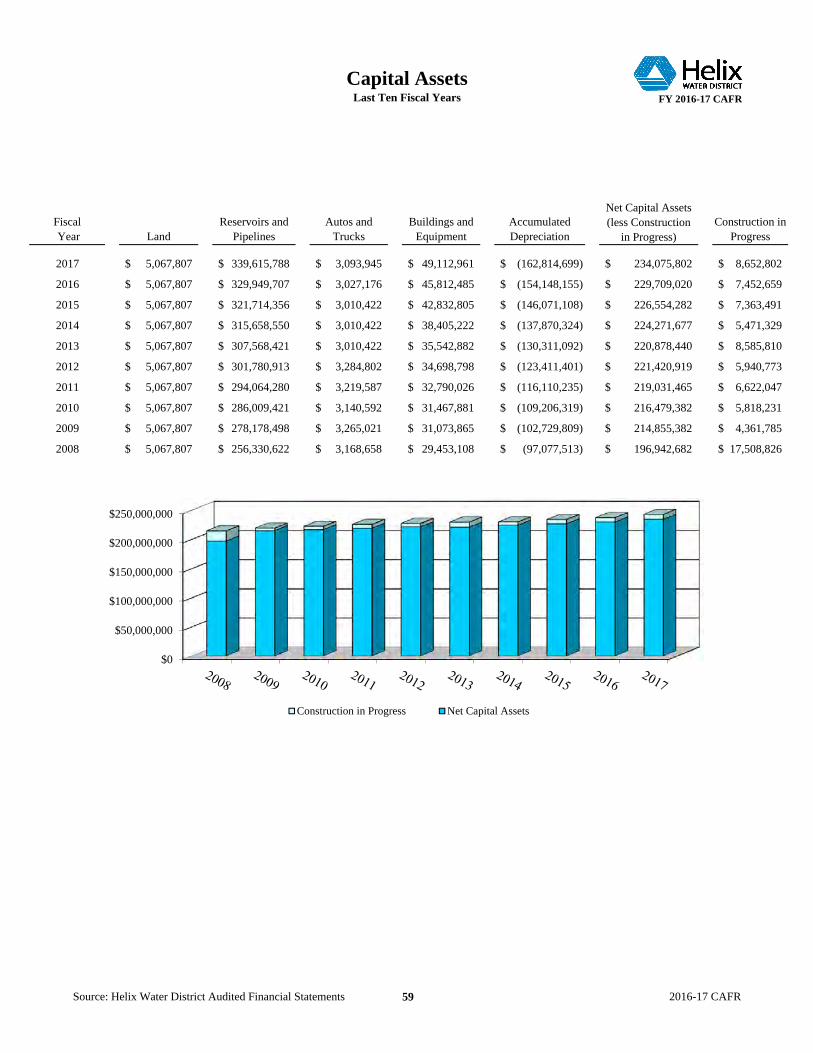
Capital AssetsLast Ten Fiscal Years FY 2016-17 CAFR
Fiscal Year Land
Reservoirs and Pipelines
Autos and Trucks
Buildings and Equipment
Accumulated Depreciation
Construction in Progress
2017 5,067,807$ 339,615,788$ 3,093,945$ 49,112,961$ (162,814,699)$ 234,075,802$ 8,652,802$
2016 5,067,807$ 329,949,707$ 3,027,176$ 45,812,485$ (154,148,155)$ 229,709,020$ 7,452,659$
2015 5,067,807$ 321,714,356$ 3,010,422$ 42,832,805$ (146,071,108)$ 226,554,282$ 7,363,491$
2014 5,067,807$ 315,658,550$ 3,010,422$ 38,405,222$ (137,870,324)$ 224,271,677$ 5,471,329$
2013 5,067,807$ 307,568,421$ 3,010,422$ 35,542,882$ (130,311,092)$ 220,878,440$ 8,585,810$
2012 5,067,807$ 301,780,913$ 3,284,802$ 34,698,798$ (123,411,401)$ 221,420,919$ 5,940,773$
2011 5,067,807$ 294,064,280$ 3,219,587$ 32,790,026$ (116,110,235)$ 219,031,465$ 6,622,047$
2010 5,067,807$ 286,009,421$ 3,140,592$ 31,467,881$ (109,206,319)$ 216,479,382$ 5,818,231$
2009 5,067,807$ 278,178,498$ 3,265,021$ 31,073,865$ (102,729,809)$ 214,855,382$ 4,361,785$
2008 5,067,807$ 256,330,622$ 3,168,658$ 29,453,108$ (97,077,513)$ 196,942,682$ 17,508,826$
Net Capital Assets (less Construction
in Progress)
$0
$50,000,000
$100,000,000
$150,000,000
$200,000,000
$250,000,000
Construction in Progress Net Capital Assets
Source: Helix Water District Audited Financial Statements 59 2016-17 CAFR