Embed Size (px)
Citation preview
For the complete set of policy recommendations and researchplease visit out website: www.njfuture.org

SUMMARY
The Garden State needs action now.Although we appear to enjoy prosperity and a superior quality of life, a look beneath the surface suggests a differentstory.
Our cost of living is one of the nation's highest, our commutes are the third longest in the country (and getting longer),and our communities are among the country's most segregated in terms of income and race.
Many suburbs once considered immune from urban decline now see their own property tax bases declining, even as ourolder cities remain impoverished. We'll be the first state to reach build-out of our remaining developable lands attoday's sprawling pace. We pay some of the nation's highest property taxes. We are losing our choices of where to liveand how to get around. Worse is that these devastating trends hit poor New Jerseyans the hardest.
New Jersey Future is leading the charge for a better future, building on New Jersey‘s heritage as a state of livable commu-nities for people and businesses alike.
A state where people can afford homes in safe neighborhoods close to good schools, can walk or catch a train to a com-petitive job, can buy fresh fruits and vegetables grown by a local farm, can safely jog, ride bikes and enjoy neighborhoodparks.
A state where development and preservation yield genuine prosperity for all. The Future of New Jersey starts here.
New Jersey Future recommends Four Ways to achieve genuine prosperity:
1) Put People FirstRemove obstacles to redevelopment, adopt a statewide housing policy, improve development decisions and leverageschool spending and historic preservation to strengthen communities.
2) Protect Our LandscapeUse "smart conservation" techniques that generally cost less than land purchase, employ more efficient developmentpatterns, be strategic in preservation planning and land buying, support parks.
3) Make It Easier to Get AroundEnsure transportation is funded, ensure transportation investments and land use plans are reinforcing, create incentivesfor employers to locate in pedestrian- and transit-friendly settings, plan "complete communities."
4) Change the RulesReform New Jersey's tax system and ensure that state and local planning and fiscal policies support the StateDevelopment and Redevelopment Plan.
1
TABLE OF CONTENTS
Summary . . . . . . . . . . . . . . . . . . . . . . . . . . . . . . . . . . . . . . . . . . . . . . . . . . . . . . . . . . . . . . . . . . . . . . . . . . . . . . . . . . . . . . . . .1About this Guide . . . . . . . . . . . . . . . . . . . . . . . . . . . . . . . . . . . . . . . . . . . . . . . . . . . . . . . . . . . . . . . . . . . . . . . . . . . . . . . . . . . . . . . . .4
1) Put People First
The Vision . . . . . . . . . . . . . . . . . . . . . . . . . . . . . . . . . . . . . . . . . . . . . . . . . . . . . . . . . . . . . . . . . . . . . . . . . . . . . . . . . . . . . . . . .5Threats to the Vision . . . . . . . . . . . . . . . . . . . . . . . . . . . . . . . . . . . . . . . . . . . . . . . . . . . . . . . . . . . . . . . . . . . . . . . . . . . . . . . . . .5
1) Policies that make it easier to develop on greenfields than to redevelop, so that older suburbs now experiencethe same decline in property values and rise in poverty that still plague our cities . . . . . . . . . . . . . . . . . . . . . . . .5
2) Absence of a statewide housing policy to correct shrinking choices in housing, by type, price and location . . . .53) Local planning that fails to create “complete communities” where daily activities are close at hand . . . . . . . . .64) Communities segregated by race and economics . . . . . . . . . . . . . . . . . . . . . . . . . . . . . . . . . . . . . . . . . . . . . . . . . . .6
Why Act Now . . . . . . . . . . . . . . . . . . . . . . . . . . . . . . . . . . . . . . . . . . . . . . . . . . . . . . . . . . . . . . . . . . . . . . . . . . . . . . . . . . . . . . . .61) We face a housing crisis . . . . . . . . . . . . . . . . . . . . . . . . . . . . . . . . . . . . . . . . . . . . . . . . . . . . . . . . . . . . . . . . . . . . . . .62) As our older cities remain impoverished, communities once considered immune from urban decline now
face the same disinvestment . . . . . . . . . . . . . . . . . . . . . . . . . . . . . . . . . . . . . . . . . . . . . . . . . . . . . . . . . . . . . . . . . . . .7The Solutions . . . . . . . . . . . . . . . . . . . . . . . . . . . . . . . . . . . . . . . . . . . . . . . . . . . . . . . . . . . . . . . . . . . . . . . . . . . . . . . . . . . . . . . .7
1) Remove obstacles to redevelopment and make it easier to rebuild today's communities than todevelop greenfields . . . . . . . . . . . . . . . . . . . . . . . . . . . . . . . . . . . . . . . . . . . . . . . . . . . . . . . . . . . . . . . . . . . . . . . . . . .7
2) Adopt a statewide housing policy. . . . . . . . . . . . . . . . . . . . . . . . . . . . . . . . . . . . . . . . . . . . . . . . . . . . . . . . . . . . . . . . .83) Improve development decisions and leverage school spending and historic preservation to strengthen
communities . . . . . . . . . . . . . . . . . . . . . . . . . . . . . . . . . . . . . . . . . . . . . . . . . . . . . . . . . . . . . . . . . . . . . . . . . . . . . . . .8The Benefits . . . . . . . . . . . . . . . . . . . . . . . . . . . . . . . . . . . . . . . . . . . . . . . . . . . . . . . . . . . . . . . . . . . . . . . . . . . . . . . . . . . . . . . . .9
2) Protect Our Landscape
The Vision . . . . . . . . . . . . . . . . . . . . . . . . . . . . . . . . . . . . . . . . . . . . . . . . . . . . . . . . . . . . . . . . . . . . . . . . . . . . . . . . . . . . . . . .10Threats to the Vision . . . . . . . . . . . . . . . . . . . . . . . . . . . . . . . . . . . . . . . . . . . . . . . . . . . . . . . . . . . . . . . . . . . . . . . . . . . . . . . . .10
1) Outdated land use laws that do not require conservation planning. . . . . . . . . . . . . . . . . . . . . . . . . . . . . . . . . . . .102) Municipal planning that often fails to deliver land-efficient development or strategic thinking
about lands to be saved . . . . . . . . . . . . . . . . . . . . . . . . . . . . . . . . . . . . . . . . . . . . . . . . . . . . . . . . . . . . . . . . . . . . . .103) Rising land costs, which ensure there isn't enough money to save our most important lands
through purchase alone . . . . . . . . . . . . . . . . . . . . . . . . . . . . . . . . . . . . . . . . . . . . . . . . . . . . . . . . . . . . . . . . . . . . . .104) Eroding tax bases in older communities, which compromise their ability to maintain attractive
and safe parks and playgrounds . . . . . . . . . . . . . . . . . . . . . . . . . . . . . . . . . . . . . . . . . . . . . . . . . . . . . . . . . . . . . . .10Why Act Now . . . . . . . . . . . . . . . . . . . . . . . . . . . . . . . . . . . . . . . . . . . . . . . . . . . . . . . . . . . . . . . . . . . . . . . . . . . . . . . . . . . . . . .11
1) We're on course to be the first state to reach full buildout of its remaining developable landwith continued, sprawling development . . . . . . . . . . . . . . . . . . . . . . . . . . . . . . . . . . . . . . . . . . . . . . . . . . . . . . . . .11
2) Our farming heritage and industry won't survive without change . . . . . . . . . . . . . . . . . . . . . . . . . . . . . . . . . . . .113) Our older communities can't prosper without well-maintained parks and open spaces to attract new residents,
shoppers and employers . . . . . . . . . . . . . . . . . . . . . . . . . . . . . . . . . . . . . . . . . . . . . . . . . . . . . . . . . . . . . . . . . . . . . .11The Solutions . . . . . . . . . . . . . . . . . . . . . . . . . . . . . . . . . . . . . . . . . . . . . . . . . . . . . . . . . . . . . . . . . . . . . . . . . . . . . . . . . . . . . . .11
1) Use "smart conservation" techniques that generally cost less than land purchase . . . . . . . . . . . . . . . . . . . . . . . .11
2

2) Employ more efficient development patterns. . . . . . . . . . . . . . . . . . . . . . . . . . . . . . . . . . . . . . . . . . . . . . . . . . . . . .123) Be strategic in preservation planning and land buying. . . . . . . . . . . . . . . . . . . . . . . . . . . . . . . . . . . . . . . . . . . . . .124) Support Parks . . . . . . . . . . . . . . . . . . . . . . . . . . . . . . . . . . . . . . . . . . . . . . . . . . . . . . . . . . . . . . . . . . . . . . . . . . . . . .13
The Benefits . . . . . . . . . . . . . . . . . . . . . . . . . . . . . . . . . . . . . . . . . . . . . . . . . . . . . . . . . . . . . . . . . . . . . . . . . . . . . . . . . . . . . . . .13
3) Make it Easier to Get Around
The Vision . . . . . . . . . . . . . . . . . . . . . . . . . . . . . . . . . . . . . . . . . . . . . . . . . . . . . . . . . . . . . . . . . . . . . . . . . . . . . . . . . . . . . . . .14Threats to the Vision . . . . . . . . . . . . . . . . . . . . . . . . . . . . . . . . . . . . . . . . . . . . . . . . . . . . . . . . . . . . . . . . . . . . . . . . . . . . . . . . .14
1) Lack of adequate, stable funding for the building, maintenance and operation of our transportationinfrastructure . . . . . . . . . . . . . . . . . . . . . . . . . . . . . . . . . . . . . . . . . . . . . . . . . . . . . . . . . . . . . . . . . . . . . . . . . . . . . .14
2) Lack of Linkages to ensure transportation investments and local planning are mutually reinforcing . . . . . . . .143) Policies and incentives that lure employers away from public transit and increase truck and auto traffic . . . .14
Why Act Now . . . . . . . . . . . . . . . . . . . . . . . . . . . . . . . . . . . . . . . . . . . . . . . . . . . . . . . . . . . . . . . . . . . . . . . . . . . . . . . . . . . . . . .151) We're running out of money . . . . . . . . . . . . . . . . . . . . . . . . . . . . . . . . . . . . . . . . . . . . . . . . . . . . . . . . . . . . . . . . . .152) The costs of congestion are high, and rising . . . . . . . . . . . . . . . . . . . . . . . . . . . . . . . . . . . . . . . . . . . . . . . . . . . . . .15
The Solutions . . . . . . . . . . . . . . . . . . . . . . . . . . . . . . . . . . . . . . . . . . . . . . . . . . . . . . . . . . . . . . . . . . . . . . . . . . . . . . . . . . . . . . .151) Ensure transportation is funded. . . . . . . . . . . . . . . . . . . . . . . . . . . . . . . . . . . . . . . . . . . . . . . . . . . . . . . . . . . . . . . .152) Ensure transportation investments and land use plans are reinforcing. . . . . . . . . . . . . . . . . . . . . . . . . . . . . . . . .163) Create incentives for employers to locate in pedestrian- and transit-friendly settings. . . . . . . . . . . . . . . . . . . . . .164) Plan “Complete Communities” . . . . . . . . . . . . . . . . . . . . . . . . . . . . . . . . . . . . . . . . . . . . . . . . . . . . . . . . . . . . . . . .17
The Benefits . . . . . . . . . . . . . . . . . . . . . . . . . . . . . . . . . . . . . . . . . . . . . . . . . . . . . . . . . . . . . . . . . . . . . . . . . . . . . . . . . . . . . . . .17
4) Change the Rules
The Vision . . . . . . . . . . . . . . . . . . . . . . . . . . . . . . . . . . . . . . . . . . . . . . . . . . . . . . . . . . . . . . . . . . . . . . . . . . . . . . . . . . . . . . . .18Threats to the Vision . . . . . . . . . . . . . . . . . . . . . . . . . . . . . . . . . . . . . . . . . . . . . . . . . . . . . . . . . . . . . . . . . . . . . . . . . . . . . . . . .18
1) A property tax system that encourages sprawl, discourages family housing and undermines communityprosperity . . . . . . . . . . . . . . . . . . . . . . . . . . . . . . . . . . . . . . . . . . . . . . . . . . . . . . . . . . . . . . . . . . . . . . . . . . . . . . . . . .18
2) A land use system that is weak on leadership and planning, and plagued by disconnected and conflictingpolicies and practices on where growth best serves the future . . . . . . . . . . . . . . . . . . . . . . . . . . . . . . . . . . . . . . . .18
Why Act Now . . . . . . . . . . . . . . . . . . . . . . . . . . . . . . . . . . . . . . . . . . . . . . . . . . . . . . . . . . . . . . . . . . . . . . . . . . . . . . . . . . . . . . .191) We pay some of the nation's highest property taxes . . . . . . . . . . . . . . . . . . . . . . . . . . . . . . . . . . . . . . . . . . . . . . . .192) Development or "land use change" has been ranked the number-one threat . . . . . . . . . . . . . . . . . . . . . . . . . . . .19
The Solutions . . . . . . . . . . . . . . . . . . . . . . . . . . . . . . . . . . . . . . . . . . . . . . . . . . . . . . . . . . . . . . . . . . . . . . . . . . . . . . . . . . . . . . .191) Reform New Jersey's tax system . . . . . . . . . . . . . . . . . . . . . . . . . . . . . . . . . . . . . . . . . . . . . . . . . . . . . . . . . . . . . . . .192) Ensure that state planning and fiscal policies support the State Development and Redevelopment Plan. . . . . .203) Ensure that local planning and fiscal policies support the State Development and Redevelopment Plan. . . . . .21
The Benefits . . . . . . . . . . . . . . . . . . . . . . . . . . . . . . . . . . . . . . . . . . . . . . . . . . . . . . . . . . . . . . . . . . . . . . . . . . . . . . . . . . . . . . . .21
Appendix . . . . . . . . . . . . . . . . . . . . . . . . . . . . . . . . . . . . . . . . . . . . . . . . . . . . . . . . . . . . . . . . . . . . . . . . . . . . . . . . . . . . . . . .22
3

ABOUT THIS GUIDE
New Jersey Future has developed this Four Ways policy guide for state leaders committed to New Jersey's long-term prosperity.Featuring nearly two years worth of research and policy analysis, the Four Ways guide also reflects the expertise and advice of
many contributors and financial supporters.
New Jersey Future is grateful to the following contributors to this Four Ways guide:
Banisch Associates: Frank Banisch • The Bloustein School: Martin Robins • Board of Public Utilities: Eric Wilkinson • ClarkeCaton Hintz: Phillip Caton • Coalition for Affordable Housing & Environment: Paul Chrystie & Michael Gross • ConservationResources, Inc: Michael Catania • D&R Greenway: Dennis Davidson • DMJM Harris: William Beetle • Governor's Office:Patrick Gillespie • K Hovnanian Homes: Joseph Riggs • Isles, Inc: Elizabeth and Martin Johnson • Looney Ricks Kiss: CarlosRodrigues • Matzel and Mumford: David Fisher • National Housing Institute: Alan Mallach • New Jersey ConservationFoundation: Michele Byers and Greg Romano • New Jersey Farm Bureau: Peter Furey • New Jersey League of Municipalities:William Dressel and Jon Moran • New Jersey Policy Perspective: Jon Shure • NJDCA: Bill Harrison, Maura McManimon & TracieGelbstein • NJDEP: John Flynn and Jay Watson • NJDOT: Brent Barnes, James Lewis & Gary Toth • Office of LegislativeServices: Hannah Shostack • Pinelands Commission: John Stokes • Project for Public Spaces: Juliette Michaelson • RegionalPlan Association: Tom Wright and Tom Dallessio • Regional Planning Partnership: Noelle Reeve • Somerset County PlanningDepartment: Robert Bzik • State Agriculture Development Committee: Susan Craft • Sustainable State Institute: RandallSolomon • Municipal Land Use Center at TCNJ: Martin Bierbaum • Tri-State Transportation Campaign: Jon Orcutt • Trust forPublic Land: Terrence Nolan
We also acknowledge:Candace Ashmun • Senator William Schluter • The Hon. Marvin Reed • Barbara Wolfe
New Jersey Future is grateful to the following organizations for their financial support of this Four Ways guide:
PSE&G • Doris Duke Charitable Foundation • Geraldine R. Dodge Foundation • Leavens Foundation •Schumann Fund for New Jersey • Surdna Foundation • Victoria Foundation • William Penn Foundation
New Jersey Future thanks its Board of Trustees for their contributions to this Four Ways guide:
Roland V. Anglin, Ph.D., New Jersey Public Policy Research Institute, Rutgers University • Anne S. Babineau, Esq., Wilentz,Goldman & Spitzer P.A. • Dorothy P. Bowers, Retired, Merck & Co. • Andrew M. Chapman, American Water Company •Anthony J. Cimino, Schoor DePalma Inc. • Henry A. Coleman, Ph.D., Rutgers University (Bloustein School) • Sally Dudley,ANJEC • W. Cary Edwards, Esq., Edwards & Caldwell • Robert Geddes, FAIA, Architect and designer • James G. Gilbert, MerrillLynch • Jerrold L. Jacobs, Retired, Atlantic City Electric • Richard F. X. Johnson, Matrix Development Group • Beth Kitchen,PP, AICP, Kitchen & Associates Architectural Services • Susan S. Lederman, Ph.D., Kean University • Joseph J. Maraziti, Jr., Esq.,Maraziti, Falcon & Healey LLP • Sandra L. Matsen, League of Women Voters of New Jersey • David F. Moore, Retired, NJConservation Foundation • Pamela H. Mount, Terhune Orchards • Thomas M. O'Neill, Consultant • Kenneth J. Parker,Atlantic City Electric Company • Steven J. Pozycki, SJP Properties • Ingrid W. Reed, Eagleton Institute, Rutgers University •Richard Roper, The Roper Group • R. Edwin Selover, Esq., PSEG • Kevin Shanley, Atlantic Health System • Brian Trelstad,Acumen Fund
Released: October 18, 2005
4

1) PUT PEOPLE FIRST
The Vision
People live in communities where their children can walk to good schools, where transportation choices connect tocompetitive jobs, where houses are affordable at all income levels, where historic buildings are preserved, and whereopen spaces are a bike ride away.
Threats to the Vision
1) Policies that make it easier to develop on greenfields than to redevelop, so that older suburbsnow experience the same decline in property values and rise in poverty that still plague ourcities.
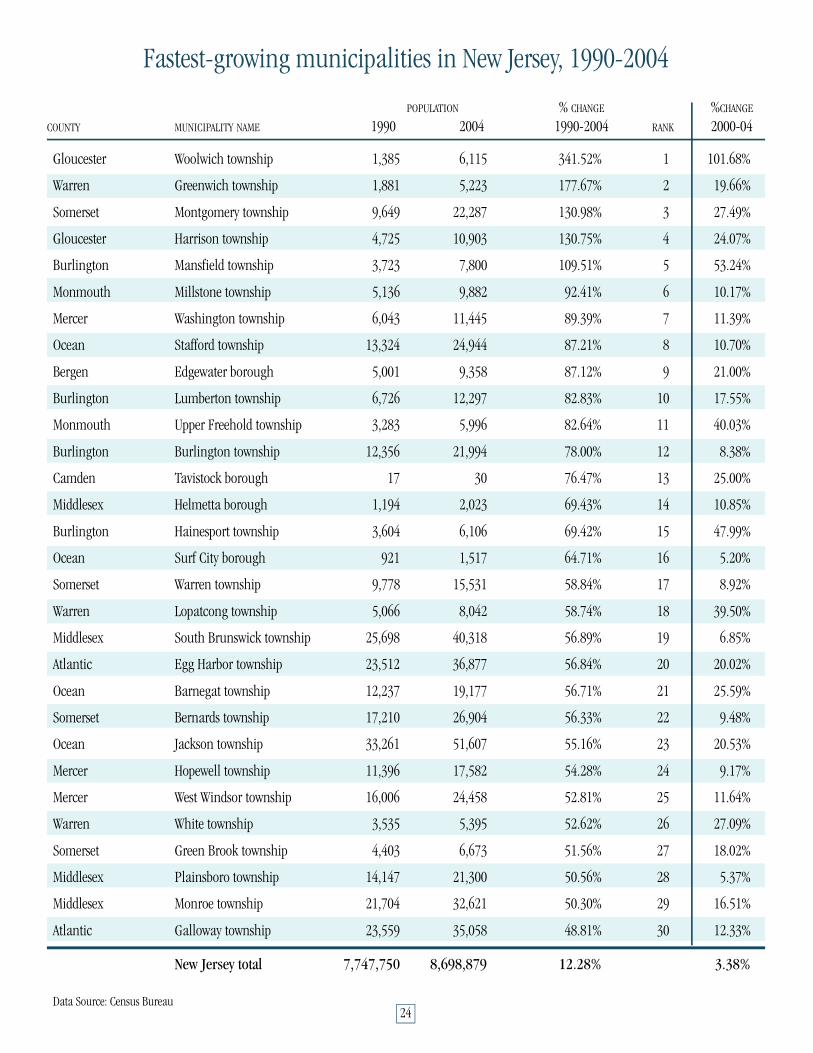
New Jersey’s older suburbs and boroughs are now threatened by the same disinvestment that their creation once inflict-ed upon nearby cities, as state investment in newer areas continues to lure wealthier households and businesses awayfrom established neighborhoods, setting off a vicious cycle that leads to economic segregation, income disparity andconcentration of poverty. The consequences of such policies are acute: New Jersey is home to four of the nation’s top30 poorest cities (see Appendix page 23) - Camden, Passaic, Newark and Paterson - despite having the nation’s second-highest per capita income. The fastest-growing communities (see Appendix page 24) in New Jersey, according to thelatest Census figures, are on the semi-rural fringe of the NYC and Philadlephia metropolitan areas.
2) Absence of a statewide housing policy to correct shrinking choices in housing, by type, priceand location.
Homes with nine or more (see Figure 1) rooms, sometimes labeled “McMansions,” accounted for 29 percent of thetotal increase in housing units in New Jersey between 1990 and 2000. Almost two-thirds of New Jersey communitiesadded no multi-family or apartment housing1 (three or more units) in the 1990s, including more than half (51) of the88 communities that grew by at least 20 percent in this period. The choice of where to live in New Jersey is also limit-ed: Half of all the multi-family housing in the state is concentrated in a handful of communities (32), often far fromgrowing employment centers. The same is true for housing affordable to low- and moderate-income households. Morethan half the housing affordable to residents with moderate or low incomes is concentrated in only 12 of our 566municipalities.2
5
Figure 1
Homes with 9+ rooms
Number of housing units with 9 or more rooms 1990: 292,630
Number of housing units with 9 or more rooms, 2000: 300,963
Change in housing units with 9 or more rooms 1990-2000 68,306
Increase in housing wints with 9 or more rooms, as a percent of increasein total hosuing units: 29.1%

3) Local planning that fails to create “complete communities” where daily activities are close athand.Too many New Jerseyans need to burn a gallon of gas to get a gallon of milk because of few options besides the car fortravel to stores, school, recreation and work. The growing distance between daily destinations caused a jump of 600extra miles of annual travel per person (see Figure 2) between 1990 and 2003.
4) Communities segregated by race and economics.New Jersey ranks worst in the nation3 - and worsening - in the degree to which elementary schools are segregated byincome. New Jersey ranks fifth worst in the nation in the segregation of Black and Hispanic students. Segregatedschools result from segregated neighborhoods and unequal opportunities, which act like a brake on regional prosperi-ty. We can’t reach genuine prosperity without promoting a better quality of life for everyone: city dwellers, suburbanitesand rural residents.
Why Act Now
1) We face a housing crisis.Most job growth is occurring in communities that lack corresponding supplies of housing4 for low-and moderate-income households as well as entry-level professionals and lower-income workers. The lack of more affordableoptions in housing, including low-and moderate-income households -- as well as townhomes and apartments, puts NewJersey second only to California in the median percent of income spent on housing costs (21.8 percent, compared toCalifornia’s 22.5 percent). A quarter of New Jersey households must spend at least 35 percent of their gross income onhousing costs. Five percent of New Jersey’s households must make do in “crowded” conditions, defined as more thanone resident per room, usually for lack of more affordable housing options.
6
Figure 2

2) As our older cities remain impoverished, communities once considered immune from urbandecline now face the same disinvestment.Places like Morristown, Lawrence Township, and Piscataway saw the real value of their taxable property decline5 from1990 to 2003, by 19, 13 and 5 percent, respectively (residential and commercial property values combined, and adjust-ed for inflation). Despite a statewide pattern of booming property values in recent years, property tax bases in theseplaces are still below their 1990 levels, in real terms. The same is true for most older suburbs and towns surroundingour major cities. The percent of children on welfare is double the statewide rate in communities once consideredimmune from urban decline, including Cinnaminson and Delanco in southern New Jersey, Hightstown and FranklinTownship (Somerset County) in central New Jersey, and Montclair and Hillside in northern New Jersey. The number ofinner-ring suburbs and towns affected will continue to climb, and newer suburbs will experience the same distress asthey age if we don’t change these trends.
The Solutions
1) Remove obstacles to redevelopment and make it easier to rebuild today’s communities than todevelop greenfields.Favor redevelopment in state infrastructure funding. Establish a State Infrastructure Bank to provide funding forinfrastructure costs associated with redevelopment that is consistent with the State Plan. Such funding would allowolder municipalities to upgrade existing infrastructure as a means of attracting developers. Alternatively: the existing NJEnvironmental Infrastructure Trust could be re-tooled to support projects that encourage redevelopment, and to dis-continue funding for projects that promote sprawl.
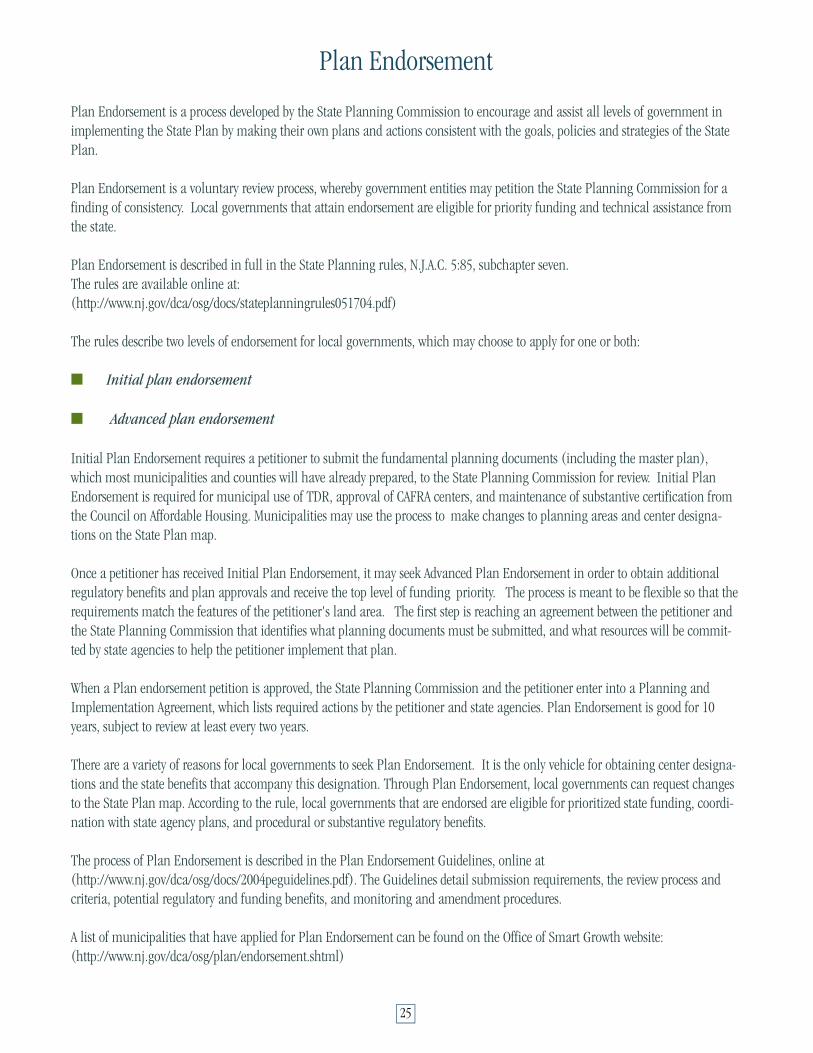
Offer economic and process incentives (such as streamlined permitting) for redevelopment in communities withmaster plans endorsed by the State Planning Commission (see Appendix page 25) as consistent with the State Plan.Meaningful redevelopment incentives offered through the State Plan endorsement process could serve as an alternativeto “Fast Track” legislation, providing regulatory incentives and flexible policies to redevelopment efforts consistent withthe state’s blueprint for development and preservation. Another desirable incentive: the consolidation of existingeconomic incentive programs now scattered across agencies, creating a “one-stop-shopping” connection for develop-ers. Such incentives must only apply to projects that advance state development priorities, particularly redevelopmentand revitalization of our cities and older suburbs.
Create a stable source of funding for redevelopment through re-prioritization of state funds. Builders and envi-ronmentalists are united in their call for directing more state spending to rebuild ailing roads and infrastructure, essen-tial first steps to attracting growth and new investment to existing communities. Voters too, show overwhelming support6
for improving and revitalizing New Jersey’s older communities: more than two-thirds of voters (71 percent) say theyfavor having state government give funding priority to maintain services in existing communities, rather than encourag-ing new development in the countryside. More than half of voters (53 percent) said they would choose investing inalready developed areas such as inner cities as a higher priority for New Jersey than buying open space, which drewslightly more than a third (36 percent) of top-priority votes in this comparison.
As of 2007, the Garden State Preservation Trust will need additional funding to continue land preservation, an actionthat will require voter approval by referendum. Such a vote offers an opportunity to apportion a percentage of preser-vation funding to redevelopment-related activities, as these efforts directly contribute to the preservation of land. Thisfunding could also be used to underwrite the costs of upgrading open lands in existing communities (parks, play-
7

grounds, waterfronts, etc.), or for creating new affordable housing within redevelopment projects.
Launch a Redevelopment Tax Credit program that would benefit developers with projects in redevelopment areas.
2) Adopt a statewide housing policy.New Jersey needs a housing policy that goes beyond today’s mixture of affordable housing programs, one that ensuresa variety of housing by type, location and price and encourages the rebuilding of today’s communities. One example:Massachusetts’ Chapter 40R Smart Growth Zoning and Housing Production law.7 Under this statute, the state paysmunicipalities to zone for higher residential densities in smart growth areas - places served by existing infrastructureand utilities, with pedestrian access to frequently accessed destinations like schools, employers or transit stations.
Increase housing near employment centers, with incentives that attract employers and related investment back to thestate’s urban and older suburban areas, where larger housing stocks and transit connections already exist.
Define the baseline need for affordable housing. The state’s current assessment of need ignores housing expensesaltogether - the most direct measure of affordability - and only peripherally addresses the number of families and indi-viduals living in over-crowded conditions. We believe the Council on Affordable Housing underestimates true need (see
Appendix page 26) for affordable housing by roughly a factor of 20.
Require communities to provide their full share of affordable housing and abolish Regional ContributionAgreements. New affordable housing rules dispense with the idea of “fair share,” (see Appendix page 27) assigning thegreatest obligations to municipalities in which affordable housing is already disproportionately concentrated. This rein-forces today’s concentration of poverty, rather than alleviating it. The rules further concentrate poverty by failing toabolish Regional Contribution Agreements (RCAs), retaining a loophole that allows more prosperous municipalities tobuy their way out of their obligation by displacing it onto already strapped communities.
Increase municipal Growth Share requirements,8 so that one in five new homes is affordable to residents of moderateor low incomes, and one new affordable home is built for every five new jobs.
3) Improve development decisions and leverage school spending and historic preservation tostrenghteen communities.Use world-class design standards for rebuilding old or building new communities. New Jersey is the richest state9 inone of the richest countries.10 Our communities can and should be global leaders in design and livability. A well-designed environment is much more than the sum of its parts - it is an asset to the community, it enriches its users, andit creates real-estate value. The way in which our buildings, streets, activities, and open spaces are physically organizedis critically important to all of us. A companion guide to our State Plan11 describes such design standards and providesexamples of good design already on the ground in New Jersey.
Make town centers and mixed-income housing development the de facto form of municipal planning. Localmaster plans and zoning should encourage development that mixes residential and other uses at higher densities, withfewer places zoned for single-use development that requires more driving, creates more traffic and more rapidlyconsumes open land. Communities without mixed-use centers can create12 them by converting underused and aban-doned shopping centers into traditional downtowns, with community services including libraries and perhaps hospitals,and housing above stores.
8
Use school construction funds to advance a community’s master plan. Though most of the $8.6 billion budget forbuilding and renovating the state’s schools has been allocated or spent, the state has not maximized this investment in away that improves communities. More funds will be required to finish the job mandated by the courts. It is importantthat the ground rules shift to linking school design, construction, and operation to community and citywide planningand development,13 to leverage the most benefit out of these public funds.
Offer an Historic Preservation Tax Credit to boost redevelopment efforts. Historic preservation contributes to therevival of communities by increasing property values for both the restored property and neighboring properties, and bystimulating “heritage tourism” that capitalizes on the area’s historic and cultural assets. The Historic PropertyReinvestment Act14 would encourage more historic preservation in the state. The Act, which has been introduced in thelegislature, would provide homeowners and corporations with a tax credit for revitalizing older neighborhoods and re-using historic structures. The bill would allow a tax credit of 25 percent of the costs of a completed rehabilitation.
Re-prioritize state funding to improve the level of municipal planning with more technical assistance, fundingand training. Many communities cannot afford to hire professionals to conduct the market analyses or create conceptplans important to the success of any development. Local officials need better land use training and educational oppor-tunities that address planning and zoning law, leading an open public process, building support for redevelopment,negotiating, selling the benefits of higher density, and initiating and carrying out the redevelopment process.15
The Benefits
Economic: More vital communities, both old and new, infrastructure spending that strengthens rather than duplicatesexisting communities.
Social: Greater choice of housing and greater access to jobs, schools and transportation options for all.
Environmental: Greenfields no longer the de facto location for new growth.
9
2) Protect Our Landscape
The Vision
A landscape where prime farmland, critical wildlife habitats, lands that store and cleanse drinking water and regionalparks are permanently protected, and where people can walk, bike and exercise in nearby neighborhood parks andrecreational lands.
Threats to the Vision
1) Outdated land use laws that do not require conservation planning.If you plan for it, it will come. And in New Jersey, we have planned and zoned for development of all privately ownedland, with the exception of some land in the Pinelands. Today’s Garden State has less than half of the farmland16 it hadin 1953, and has lost 39 percent of its wetlands17 since 1870. Population growth is not solely to blame; we are con-suming land at more than double the rate of population growth.
2) Municipal planning that often fails to deliver land-efficient development or strategic thinkingabout lands to be saved.There is a sharply drawn "checkerboard" of commitment to environmental conservation: activist towns border uncom-mitted towns. One town's preservation initiatives may be undermined swiftly by inappropriate development approvals orother conservation lapses by its neighbors. Large-lot zoning, an important tool for limiting overall development levels,is often used in such a way that it actually increases the fragmentation of forestlands and wildlife habitat, defeatinggenuine preservation benefits.
3) Rising land costs, which ensure there isn’t enough money to save our most important landsthrough purchase alone.The cost of buying land for preservation has roughly doubled for state taxpayers since Garden State Preservation Trustfunding was launched; the per-acre cost of state open space purchases has jumped from an average price of $1,723per acre in 1998 to $3,994 per acre in 2004. It is estimated that in the Highlands region, source of drinking waterfor more than half the state’s residents, there are 300,000 acres in need of preservation in order to protect state watersupplies; but only 65,000 acres can actually be purchased within the next five years using all available private and publicfunding resources.
4) Eroding tax bases in older communities, which compromise their ability to maintain attrac-tive and safe parks and playgrounds.The City of Newark spends only $35 per resident on parks, well below the national big-city average of $80. Newark hasfewer acres of parkland per resident18 than any of the 55 largest cities in the nation; more than one-third of Newark’schildren do not live within one-quarter mile of any parkland at all. Newark is not unique: eroding tax bases in manyolder communities mean insufficient and dilapidated parks that undermine the quality of life for urban residents,especially children, and stymie community revitalization and regional prosperity.
10
Why Act Now
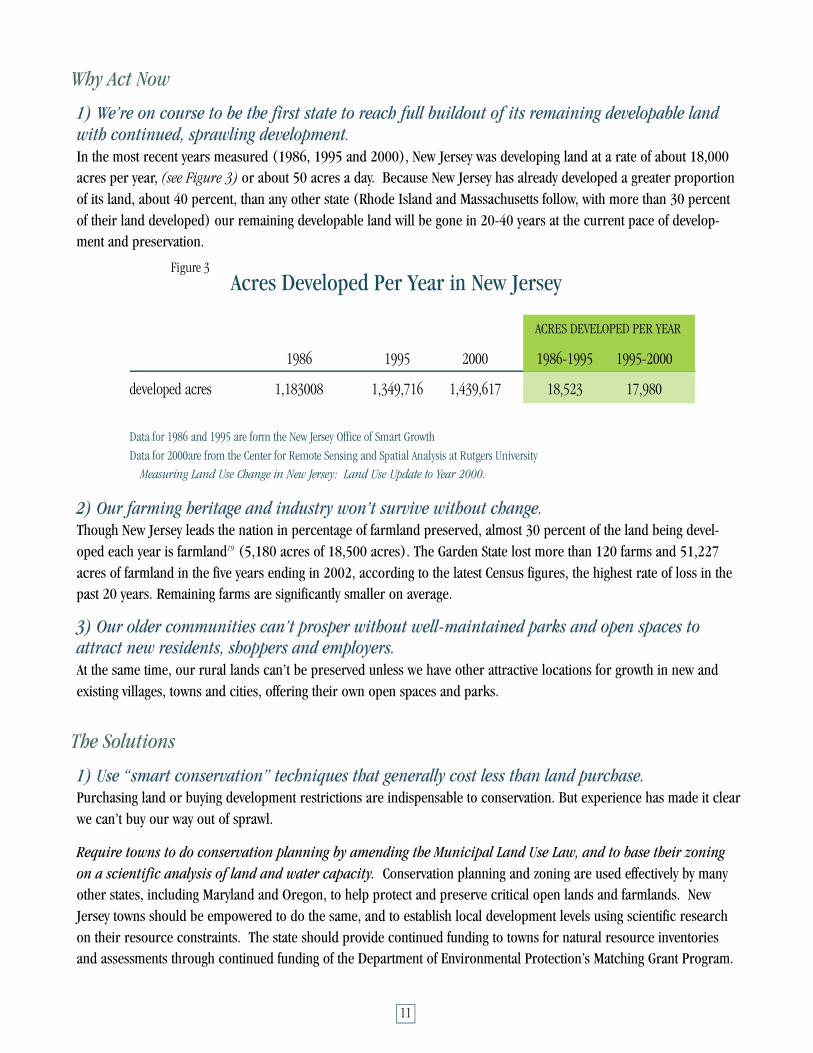
1) We’re on course to be the first state to reach full buildout of its remaining developable landwith continued, sprawling development.In the most recent years measured (1986, 1995 and 2000), New Jersey was developing land at a rate of about 18,000acres per year, (see Figure 3) or about 50 acres a day. Because New Jersey has already developed a greater proportionof its land, about 40 percent, than any other state (Rhode Island and Massachusetts follow, with more than 30 percentof their land developed) our remaining developable land will be gone in 20-40 years at the current pace of develop-ment and preservation.
2) Our farming heritage and industry won’t survive without change.Though New Jersey leads the nation in percentage of farmland preserved, almost 30 percent of the land being devel-oped each year is farmland19 (5,180 acres of 18,500 acres). The Garden State lost more than 120 farms and 51,227acres of farmland in the five years ending in 2002, according to the latest Census figures, the highest rate of loss in thepast 20 years. Remaining farms are significantly smaller on average.
3) Our older communities can’t prosper without well-maintained parks and open spaces toattract new residents, shoppers and employers.At the same time, our rural lands can’t be preserved unless we have other attractive locations for growth in new andexisting villages, towns and cities, offering their own open spaces and parks.
The Solutions
1) Use “smart conservation” techniques that generally cost less than land purchase.Purchasing land or buying development restrictions are indispensable to conservation. But experience has made it clearwe can’t buy our way out of sprawl.
Require towns to do conservation planning by amending the Municipal Land Use Law, and to base their zoningon a scientific analysis of land and water capacity. Conservation planning and zoning are used effectively by manyother states, including Maryland and Oregon, to help protect and preserve critical open lands and farmlands. NewJersey towns should be empowered to do the same, and to establish local development levels using scientific researchon their resource constraints. The state should provide continued funding to towns for natural resource inventoriesand assessments through continued funding of the Department of Environmental Protection’s Matching Grant Program.
11
Figure 3
Acres Developed Per Year in New Jersey
ACRES DEVELOPED PER YEAR
1986 1995 2000 1986-1995 1995-2000
developed acres 1,183008 1,349,716 1,439,617 18,523 17,980
Data for 1986 and 1995 are form the New Jersey Office of Smart Growth
Data for 2000are from the Center for Remote Sensing and Spatial Analysis at Rutgers University
Measuring Land Use Change in New Jersey: Land Use Update to Year 2000.
Towns with a significant percentage of land designated for preservation by the State Plan should be required to includea conservation plan as part of their master plan.
Restrict farmland and conservation land development to low densities, and raise densities in areas suited forgrowth. Towns should be offered clear and measurable criteria that encourage planning for more intensive use of landin State Plan growth areas, and less intensive use in preservation areas, before granting a town the benefits and privi-leges that accompany State Plan Endorsement.
Authorize towns in State Plan conservation areas to limit the places and units served by septic and alternativewaste-water treatment systems. New Jersey needs a rule that increases the environmental review required for devel-opments built on septic systems, a primary type of development claiming today’s remaining open lands, and that allowsappropriate limits to be set on land served by alternative waste water treatment systems. The viability of septic systemsfor waste removal is governed by the ecological conditions of the land - type of soil, depth of bedrock, height of watertable, as example. Any approval for development served by septic and alternative waste water systems must be based onan understanding of the constraints imposed by natural conditions, particularly in areas designated for conservationunder the State Plan.20
2) Employ more efficient development patterns.Allow towns to mandate clustered development in conjunction with an open space or farmland preservationplan. While low-density zoning can assure sustainable levels of development, it rarely leads to good patterns of devel-opment, unless coupled with other tools. Clustering development at higher densities, clustering on non-contiguous lots,and Transfer of Development Rights (TDR) allow towns to shift growth to places where new homes, shops and officescan enhance communities, rather than degrade the environment. Good conservation plans can ensure these toolscontribute to natural resource and farmland preservation goals.
Favor towns that channel development into compact communities when awarding state infrastructure loans,planning grants and technical assistance. Towns with master plans and ordinances fully consistent with the StatePlan should also be rewarded in two ways: Through creation of a new law that grants these plans and ordinances apresumption of validity against legal challenges, backed by legal defense by the State Attorney General; and by one-timebonus grants for either land acquisition or park development from the Green Acres and Farmland Preservationprograms.
Allow towns that use Transfer of Development Rights to assess impact fees for school construction in their growthzones.
3) Be strategic in preservation planning and land buying.Too often, local governments purchase land in reaction to developer proposals, and after development approvals havemultiplied its price. To ensure land purchases help achieve broader goals, local governments should integrate preser-vation planning for open space and farmland into their overall master planning process. They should make sure thatmaster plans reflect state and regional priorities as expressed in the Garden State Greenways plan and the FarmlandStrategic Targeting plan, which combine data on resources such as habitat and prime soils with information on otherpreserved lands. Towns should adopt an investment priority scheme that ensures wiser preservation spending, withenough flexibility to allow towns to take advantage of willing seller opportunities. And towns with farmland should berequired to include farmland preservation in their master planning and a right-to-farm ordinance as a condition forstate agricultural and planning funding from the state agriculture development committee (SADC). The SADC also
12
should require comparisons of local farmland plans to the Farmland Strategic Targeting plan as a condition of PlanningIncentive Grant (PIG) funding.
Adopt a statewide open lands map that identifies and prioritizes open space and farmland, consistent with theState Plan. The map should be used to drive state land acquisitions and measure progress against natural resourceprotection goals. A statewide plan should be built upon the work of existing open lands plans and most recent data,including the Green Acres Land Preservation Plan for statewide acquisitions, the Landscape Project, the Garden StateGreenways project, and the Farmland Strategic Targeting Project; these projects deserve continued state funding andincreased promotion to towns. Allowances should be made for neighborhood parks and playgrounds that may not belarge enough to be reflected on statewide maps. In the Highlands, the statewide plan should be supplemented with adetailed land-and-water capacity analysis and the designation of preservation area no-build and conservation zones,with incentives to land owners to participate in a regional Transfer of Development Rights program. The state shouldalso have easier access to the power of eminent domain in critical water supply areas.
4) Support ParksState preservation funds also must be used to enhance the quality of life in the communities where most New Jerseyanslive through improvements to community parks, playgrounds and recreational systems. Promoting school-based play-grounds and green space is an efficient, practical way to provide safe recreational facilities in urban areas. In the poor-est areas, where an inability to maintain parks and playgrounds blocks economic investment, ongoing state assistancefor park maintenance is especially important to regional prosperity.
Increase funding for the creation and maintenance of neighborhood and urban parks in communities wherelocal planning is consistent with the State Plan.
Require adequate playgrounds and community open space as a condition of state schools construction funding.Funding from the School Construction Corporation should require the provision of adequate playgrounds and openspace that serves both school children and the surrounding community.
The Benefits
Economic: More land preserved at less cost, farming enhanced, property values enhanced by more local open land.
Social: Healthier lifestyles with increased places to walk and play.
Environmental: The most valuable natural resources are protected.
13

3) Make it Easier to Get Around
The Vision
People spend more time with their families and friends, and less time getting to work, schools, stores parks and placesof worship, because they have more transportation choices.
Threats to the Vision
1) Lack of adequate, stable funding for the building, maintenance and operation of our trans-portation infrastructure.New Jersey’s Transportation Trust Fund,21 the primary source of funding for the state’s transportation projects since1984, is on the verge of insolvency. Because operating costs are chronically under-funded in state budgets, money forcapital improvements such as new train cars or roads has repeatedly been siphoned off to cover operating expenses atboth the New Jersey Department of Transportation (NJDOT) and NJ TRANSIT. According to the Tri-State TransportationCampaign,22 NJ TRANSIT has since 1990 relied on its capital program to fund about 25-35 percent of its day-to-dayoperating costs. The need for a stable source of funding for transportation maintenance and improvements is so self-evident that Bergen County has considered taking matters into its own hands and has proposed a county-wide trans-portation tax23 to raise money in the absence of adequate state funding. This should not be necessary and speaks to afundamental failure on the part of state government to adequately plan for and fund the costs of maintaining our trans-portation infrastructure.
2) Lack of linkages to ensure transportation investments and local planning are mutuallyreinforcing.Today, any community can appeal to the State to build or widen a road, fix an intersection or improve its rail service,without changing the local zoning that encourages additional traffic problems. Similarly, the State can launch a majorroad or rail project within a community paid for by taxpayers statewide, with no assurance that local zoning won’t spurfuture growth that undermines the investment - or won’t suppress the type of development needed for the investment topay off.
3) Policies and incentives that lure employers away from public transit and increase truck andauto traffic.Over the last 20 years, employment locations in New Jersey have become much more decentralized, (see Appendix page
28) with serious implications for traffic congestion and time lost to delays, as well as open land consumed by newoffice development. Most of the state’s older job centers have, in fact, experienced a net loss of jobs. Many of thesecenters are “complete” communities that are walkable and also well served by public transit, so job loss in these places- accompanied by job growth in automobile-dependent locations - has the effect of putting more cars on the roadbecause some people who used to be able to walk or take transit to work must now drive. This increase in traffic holdstrue even in the absence of any net job growth. In large part because of the decentralization of warehousing, distribu-tion, and retail, New Jersey’s truck traffic24 is projected to increase by 80 percent by 2020.
14

Why Act Now
1) We’re running out of money to pay for repair and improvement of our roads, bridges andpublic transit systems.By July 2006, all new revenue generated annually by the state’s Transportation Trust Fund25 will be needed to pay off theloans that New Jersey lawmakers relied on in the 1990s to pay for transportation projects. This will render the Fundincapable of performing the function for which it was explicitly created - repairing and improving New Jersey’s roads,bridges, and public transportation system. There will be no money to fund26 the estimated $10 billion worth of high-way maintenance that will be needed over the next 10 years, or the estimated $7 billion needed to eliminate the backlogof structurally deficient bridges, or the nearly $5 billion needed to restore NJ TRANSIT’s infrastructure to a state of goodrepair. And these are just maintenance costs; billions more will be required for any safety improvements or capacityenhancements. Further borrowing is simply no longer an option.
2) The costs of congestion are high, and rising.New Jersey’s average commute time of 30 minutes is the third highest nationally (see Appendix page 29), and climbing.The costs in time lost and excess fuel consumption27 amount to $6.8 billion a year in the greater-New York City region,and approach $2 billion in the greater-Philadelphia region.
The Solutions
1) Ensure transportation is funded.To ensure our state’s highways, bridges, and public transportation system serve New Jersey for the long run, there mustbe enough money in the Transportation Trust Fund to pay for system upkeep and needed improvements.
Provide an adequate, stable revenue stream for the Transportation Trust Fund to reduce reliance on borrowingand to reduce funds that must be used for debt service. The state must implement the 2003 recommendations28 ofthe Governor’s Blue Ribbon Commission on Transportation for restoring the fiscal health of the Trust Fund, includingpassing a law to prohibit the diversion of money from the Transportation Trust Fund to other uses.
Raise the gas tax to help replenish the Fund. Two years ago, a Blue Ribbon Commission appointed by former Gov.James E. McGreevey concluded that the state’s transportation infrastructure was decaying so rapidly that the state need-ed to more than double the tax charged to motorists29 for a gallon of gas to raise hundreds of millions of dollars forbasic maintenance work. That recommendation is still sound. New Jersey has one of the country’s lowest gasolinetaxes (see Appendix page 30). Raising the gas tax in New Jersey by 12.5 cents per gallon, as proposed, would bring NewJersey closer in parity to gasoline costs nationwide, and would cost the average driver of a mid-size Honda Accord anextra $72 per year, or about $6 per month.
Restore the Fund’s capital program. Sufficient new revenues must be made available to restore the TransportationTrust Fund’s capital program, and to allow NJDOT and NJ TRANSIT to operate without raiding the Trust Fund to coveroperating expenses.
Require adequate funds to covercapital expenditures without cannibalizing the Fund to cover operating expenses.
15
2) Ensure transportation investments and land use plans are reinforcing.Protect our transportation investments through “fix-it-first” spending and context-sensitive design, and requiremunicipal reciprocity. NJDOT’s new “fix-it-first” strategy30 should go a long way toward prioritizing state spending onrepairing existing infrastructure and protecting past investments, rather than spurring new development in inappropri-ate places. And NJDOT’s increased focus on design sensitive to the community31 context is intended to ensure that newtransportation facilities, as well as upgrades to existing facilities, fit with existing community character and make a posi-tive contribution to a community’s vision of its future.
But there needs to be reciprocity from the municipalities. In return for its consideration of municipal concerns, NJDOTneeds to be assured that municipal land use decisions will not undermine the goals of state investments. Municipalitiesshould be explicitly required to consider the effects of proposed development on the transportation system, so that thebenefits generated by investments in the transportation system are not negated by sprawl-inducing or traffic-generatingland uses. This can be achieved by requiring an agreement upfront from the host municipalities for any capacity-increasing transportation project that they will change their zoning so as not to undermine the goals of the project.NJDOT officials already use such criteria informally in prioritizing projects, but the policy should be institutionalized sothat it survives transitions in administration. Also, NJDOT should be allowed official recourse if a municipality fails tofollow through on the agreement.
Encourage municipalities to allow more intensive development around transit facilities, and discourage zoningfor low-density or auto-oriented development adjacent to transit facilities. The state should expand its TransitVillages program32 and continue to emphasize the importance of placing a high-density mix of land uses, includingemployment where appropriate, near transit stations. The state should also emphasize the importance of maintaininggood pedestrian access between transit stations and surrounding development. The state should discourage municipali-ties from zoning for low-density or automobile-oriented land uses adjacent to transit facilities.
Create a collaborative, regional process in deciding where to site development with significant regional impacts.Certain land uses, like warehousing, port infrastructure facilities, freight rail lines and yards, large regional malls, orentertainment and sports venues have such significant regional or statewide traffic and land use impacts that the stateand county governments should be active participants in discussions about where to site those facilities. In fact, it isnearly impossible for a potential host municipality to determine on its own whether it is the “right” place for such afacility in a regional context. As example, if a piece of land ideally suited from a logistical standpoint for a small railyard or container-transfer facility were instead used by the host municipality for a shopping center, the costs to theentire region of not having the facility in the optimal place (higher shipping costs, increased truck traffic) could easilyoutweigh the modest and primarily local benefits that the shopping center generates. Decisions about where to siteprojects with significant regional impacts should be made jointly by host communities together with entities having theregional perspective required to assess and prepare for those impacts.
3) Create incentives for employers to locate in pedestrian- and transit-friendly settings.Recalibrate employer recruitment programs (including BEIP) to steer new and relocating employers to locationsthat exploit unused capacity in the state’s extensive public transit network. Every new job that is steered to a walk-able or transit-accessible location potentially represents one fewer car on the road at rush hour, because jobs in suchplaces offer the possibility of non-automobile commuting. The state can also use existing smart-growth mechanisms(the State Plan endorsement process, NJDOT’s Transit Villages program, etc.) to reward municipalities for planning andzoning that calls for commercial uses near transit stations or where people can easily walk to them.
16
Assure good pedestrian connections. People are walking less in New Jersey than they were 10 years ago, which bodesill for traffic as well as personal health. Despite this fact, pedestrian fatalities33 increased in 10 New Jersey counties overthe past 10 years -- Burlington, Hunterdon, Monmouth, Warren, Somerset, Mercer, Middlesex, Union, Camden, andBergen -- as walking becomes more dangerous in our auto-dependent state. The solution is not to discourage peoplefrom walking. Instead, New Jersey should strive to see a lower pedestrian death rate AND more people walking.Transportation dollars should be invested so that walking as well as biking become a viable transportation option formore people, and in a way that people will be safe once they decide to walk more.
4) Plan “complete communities” that reduce the need to travel by car by encouraging a mix ofuses (retail, offices, housing, schools) within walking distance.Accessibility (or being able to get to where you want to go), rather than mobility (the speed with which you get there),is the ultimate goal of any transportation system. There are other ways of enhancing accessibility besides focusing onmobility. Reducing distances between destinations and placing destinations where they can be accessed by means otherthan the automobile are two ways of improving access that don’t depend on increasing mobility. Bringing origins anddestinations closer together can be accomplished both by increasing development densities - generally bringing build-ings closer together - and by allowing more mixing of land uses - allowing different types of buildings to be near eachother, or, even better, incorporating multiple uses in the same building. Allowing travelers the option of getting out oftheir cars also has the intangible benefit of increasing the likelihood of unplanned encounters with neighbors and localbusiness owners - people you might bump into on the street while on foot - thus contributing to greater social cohesionand a heightened sense of community. New Jersey could take a significant step in this direction by amending theMunicipal Land Use Law to make mixed-use the default development pattern, unless substantial justification exists fordisallowing it.
The Benefits
Economic: A state economy that thrives on a vital transportation infrastructure for the movement of travelers andgoods; reduced transportation debt and costs for households and government, and maximized use of transportationinvestment.
Social: Greater choice in how to get around, increase options for employment, shopping and housing.
Environmental: Cleaner air from less traffic and less greenfield development.
17
4) Change The Rules
The Vision
A Vision for New Jersey: New growth and development are encouraged where they enhance our environment, our econ-omy and our future with reforms that ensure tax, spending and land use decisions support New Jersey’s blueprint fordevelopment, the State Plan.
Threats to the Vision
1) A property tax system that encourages sprawl, discourages family housing and underminescommunity prosperity.Today’s mayors look first to develop open land when they need to cover rising budgets, because New Jersey relies moreheavily than most states on property taxes (see Appendix page 31) to fund local services, from public schools to localroads and sewers to police and fire protection. Because property taxes alone can’t begin to cover the actual cost ofpublic education,34 too many communities zone out families, preferring commercial development and age-restrictedhousing.
Our poorest communities are forced to impose the state’s highest tax rates3 5 go to in order to cover the cost of theirmunicipal services; such high rates in turn help drive new investment, jobs and development away from the very com-munities that need them most, and increase pressure on poorer places to accept polluting and less desirable develop-ment.
All communities suffer from the need to chase development that doesn’t fit community character or needs, adds to localtraffic woes and eliminates farmland and open land. Older and inner-ring suburbs stand to lose the most under today’sratables chase: Some 25 percent of New Jerseyans live in “at-risk developed” municipalities, places with no more roomto develop that now lag the rest of the state in job growth and per-capita property tax base. At the leading edge of thedevelopment wave, another 20 percent of New Jersey residents live in “bedroom-developing” suburbs,3 6 whose rapidpopulation growth is outstripping their ability to provide infrastructure and services.
2) A land-use system that is weak on leadership and planning, and plagued by disconnected andconflicting policies and practices on where growth best serves the future.New Jersey stands enviably among a handful of states with a State Development and Redevelopment Plan. 37 to Our StatePlan reflects nearly two decades of citizen input on where growth and preservation should happen in order to achieveprosperity across New Jersey.
Yet the State Planning Commission charged with overseeing the Plan has insufficient staff, budget, and authority innegotiating Plan consistency with state departments, authorities or municipalities. And unlike forward-thinking states,Maryland and Massachusetts among them, New Jersey has no state-level planning department to coordinate the strategicplans and spending of multiple Cabinet departments, and help ensure development and preservation efforts are focusedon the best interests of the state as a whole. Instead, local land-use decisions are made nightly by volunteer planningboard officials in 566 separate communities with little coordination, and with little control over larger issues such assewer planning that impact their decisions.
18
Why Act Now
1) We pay some of the nation’s highest property taxes, with more than 100 communities chargingrates so high Rutgers experts place them in the “trouble zone” for fiscal distress.38
These communities have property tax rates above 3 percent, which experts agree cannot be sustained without thecommunity suffering a downward spiral of declining services and quality of life that drives away investment needed forchange. The list includes communities many would expect: Camden, Newark and Trenton, but also Maplewood,Montclair, Haddonfield and Pleasantville. And the list is growing every year, with 10 communities added between 1998and 2000 alone.
2) Development or “land use change” has been ranked the number-one threat to New Jersey’senvironment and residents by the New Jersey Comparative Risk Project.39
The 2003 state-sponsored study by scientific experts found land use change “produced by a wide margin the largestnegative ecological and socioeconomic impacts,”40 from traffic congestion and pollution, to loss of natural habitat andspecies, to increased risk of flooding.
The Solutions
1) Reform New Jersey's tax system to reduce reliance on property taxes and achieve morefairness and a better balance among revenue sources within the state.Hold a tax convention aimed at bringing New Jersey in line with national patterns, subject to voter approval. Propertytaxes make up about half of all state and local tax revenues in New Jersey (45 to 47 percent). The national averagereliance on property taxes41 in all states is closer to a third of tax revenues (30 to 32 percent). The quality of life inour communities depends significantly on correcting this imbalance.
State leaders have refused to fix New Jersey’s tax system, despite increasing evidence that it is sapping New Jersey’s eco-nomic, social and environmental health. Direct relief to individuals, including tax rebates, which totaled $2.3 billion in2005, does nothing to fix the system while exacerbating the problem, and are little more than acknowledgment thatproperty owners carry more of the tax burden than is fair.
Because of our leaders’ reluctance to act, the best way to restructure New Jersey’s tax system is through a statewide taxconvention, where elected delegates would do what state legislators are unwilling to do: suggest new laws and constitu-tional reforms that will bring New Jersey’s tax system in line with the national pattern. Arguments that a convention canonly be effective by addressing government spending as well as tax issues are little more than red herrings. The legislatureand governor have ample opportunity to set a new course for state spending annually, through state budget negotiations.
A state’s constitution should be changed grudgingly and infrequently, and only in the absence of alternative action by thestate legislature. New Jersey is there. A bill proposing a tax convention,42 subject to voter approvals, once again failedto come to a vote in the Senate in 2005. Absent a convention, New Jersey stands little hope of true tax reform.
Let all municipalities share the benefits as well as costs of new development by allowing tax sharing on a broaderscale throughout the state. Tax sharing typically means sharing the revenues and resources generated by newdevelopment with residents across an entire region who also share in the costs, rather than just those in the localmunicipality, so lessening the entire region’s need for additional property taxes. It could be accomplished as part ofthe much-needed overhaul of our property tax system; or tax-base sharing could and should be implemented on itsown merits.
19
Make the state a better partner to municipalities. State aid for municipalities must necessarily be increased, andtargeted to the communities with the greatest needs. Municipal aid hasn’t changed appreciably in the last 10 years,holding steady at about $1.8 billion, at a time when municipal expenses (including expenses mandated by the state)have grown exponentially.
Property tax payers are asked to close this gap. Little wonder then that property taxes have climbed 74 percentbetween 1990 and 2003, an average increase of more than $500 million a year. Property tax increases since 2001 havehaveaveraged more than $1 billion a year.
At the same time, our schools need a different source of funding than the property tax, the chief source of revenue foreducation in the Garden State. The median cost of educating a child in New Jersey is $10,652, while the average prop-erty tax bill is $5,269. The math is simple. Even if 100 percent of local property taxes were dedicated to education,the property tax paid by one household can’t cover the costs of educating one child.
No wonder state aid to schools reached almost $9 billion in fiscal year 2005. Property taxes alone can’t do the job,particularly in New Jersey’s most distressed communities (including the Abbott districts). Property values in theseplaces can’t begin to cover the costs of local education, even though residents of these communities pay the state’s high-est property tax rates. Today’s system hurts our poorest places most, and leaves wealthier property tax payers with adisproportionate burden in supporting distressed communities that may fall within their county. A shift in the sourceof school revenues would ease today’s burden for everyone by sharing the costs of public education among the broaderbase of taxpayers statewide.
Today’s tax system merely devolves state budget problems down to local governments. To achieve genuine prosperity,the state must become a better fiscal partner by increasing the amount of aid that goes to municipalities, by shiftingthe source of school funding away from property taxes, and by sharply reducing deficit spending and fiscal gimmickry,including tax rebates, which merely perpetuate today’s status quo.
2) Ensure that s t a t e planning and fiscal policies support the State Development andRedevelopment Plan.Achieve the long-sought goals of the State Plan by favoring communities whose planning and zoning comply withthe Plan with increased state spending for development and preservation, technical assistance and regulatoryincentives. The best way to achieve this is through State Plan Endorsement (see Appendix page 25).
Increase state aid for municipalities willing to coordinate planning services, and decrease aid for those thatwon’t. The state must use its funding to foster regional planning that allows towns joint control over the benefits andconsequences of regional development. In particular, the NJ Smart Futures grant program should be expanded andawarded according to clear criteria established by the State Planning Commission as advancing State Plan goals, andamong these criteria should be the promotion of regional planning initiatives. Special Resource Areas and StrategicDevelopment Plans should be designated for key preservation/economic development regions that span municipalboundaries, and these regions should be favored in state grants and spending.
Use the State Plan to ensure state capital projects contribute to long-term prosperity. State agencies and authoritiesmust be required to demonstrate how their annual spending plans serve to implement the State Plan. The state mustundertake a regular performance evaluation of state expenditures - operating and capital expenditures as well as dis-cretionary and formula-based expenditures - to uncover areas of inconsistency. The NJ Commission on CapitalBudgeting and Planning should receive the necessary resources to accomplish its mission of ensuring state capital
20

projects are consistent with the State Plan.
Improve efficiency and effectiveness by creating a State Planning Department charged with directing spending andinter-agency coordination towards State Plan implementation. Today’s State Planning Commission and its staff, theOffice of Smart Growth, should be located where they can effectively coordinate the competing and often conflictingactions of state agencies and authorities. A new Department of State Planning would provide a cabinet-level officerresponsible for developing and implementing the State Plan, ensuring State Plan implementation receives the full andregular attention of the state’s highest leaders. The Department of State Planning must be adequately funded to providea voice of expertise and authority on regional growth issues that’s missing in state government today, with responsibilityfor coordinating the strategic planning, rule making and spending of state government. And the staff should be of thehighest professional caliber, educated, trained, and experienced in planning and state government finance and operations.
Ensure the State Plan map correctly identifies areas for growth and preservation. The State Plan map should reflectthe latest data on environmental constraints, available infrastructure capacity, and existing development and preservedland. Its Planning Area designations should be consistent across all areas of New Jersey.
3) Ensure that local planning and fiscal policies support the State Development andRedevelopment Plan.Provide rigorous and clear rules for development in each State Plan Planning Area, including desired densities forpromoting development or preservation, and design standards that ensure complete and attractive communities.
Require municipalities to review their master plans for compliance within two years of the State Plan’s amend-ment. Lengthen the time between State Plan amendments to 10 years, to coincide with the release of new Census data,and to free resources for implementation.
Provide incentives for municipal consistency through the Plan endorsement process, including technical andfinancial assistance. This requires new Plan endorsement rules that specify clear and measurable criteria for eachPlanning Area. For urban areas, older suburbs and centers, a process that offers meaningful redevelopment incentivescould be an alternative to “Fast Track” streamlining.
Offer meaningful state legal assistance to towns that comply with the Plan. Towns with master plans and ordi-nances fully consistent with the State Plan should be granted a presumption of validity against legal challenges.
The Benefits
Economic: Lower property tax bills, less concentrated poverty, and the benefits of economic growth shared morewidely and evenly among individual households and communities.
Social: Vibrant communities with increased supplies of family housing affordable to a range of incomes.
Environmental: Protected natural resources and an end to excessive and haphazard development caused by the“ratables chase.”
21
Appendix
Nation’s top 30 poorest cities . . . . . . . . . . . . . . . . . . . . . . . . . . . . . . . . . . . . . . . . . . . . . . . . . . . . . . . . . . . . . . . . . . .23
Fastest-growing municipalities . . . . . . . . . . . . . . . . . . . . . . . . . . . . . . . . . . . . . . . . . . . . . . . . . . . . . . . . . . . . . . . . .24
Plan Endorsement . . . . . . . . . . . . . . . . . . . . . . . . . . . . . . . . . . . . . . . . . . . . . . . . . . . . . . . . . . . . . . . . . . . . . . . . . . .25
COAH underestimates true need for affordable housing . . . . . . . . . . . . . . . . . . . . . . . . . . . . . . . . . . . . . . . . . . . . . . .26
COAH rules dispense with “fair share” . . . . . . . . . . . . . . . . . . . . . . . . . . . . . . . . . . . . . . . . . . . . . . . . . . . . . . . . . . . .27
Job decentralization in New Jersey . . . . . . . . . . . . . . . . . . . . . . . . . . . . . . . . . . . . . . . . . . . . . . . . . . . . . . . . . . . . . . .28
Average one way commute times . . . . . . . . . . . . . . . . . . . . . . . . . . . . . . . . . . . . . . . . . . . . . . . . . . . . . . . . . . . . . . . .29
State with the highest and lowest gasoline tax rates . . . . . . . . . . . . . . . . . . . . . . . . . . . . . . . . . . . . . . . . . . . . . . . . . .30
New Jersey’s reliance on property taxes . . . . . . . . . . . . . . . . . . . . . . . . . . . . . . . . . . . . . . . . . . . . . . . . . . . . . . . . . . .31
22

23
Nation’s top 30 poorest cities (50,000 or more people)2000 PER CAPITA INCOME
PLACE NAME STATE POPULATION 1999
Florence-Graham CDP California 60,132 $8,092
Huntington Park California 61,370 9,340
Lynwood California 69,899 9,542
East Los Angeles CDP California 124,366 9,543
Brownsville Texas 140,075 9,762
Camden New Jersey 79,904 9,815
El Monte California 116,249 10,316
Compton California 93,226 10,389
South Gate California 96,418 10,602
Laredo Texas 176,807 11,084
Paramount California 55,319 11,487
Baldwin Park California 75,753 11,562
National City California 54,405 11,582
Rosemead California 53,280 12,146
Santa Ana California 337,512 12,152
Hialeah Florida 226,411 12,402
Cicero Illinois 85,616 12,489
Carol City CDP Florida 59,443 12,600
Passaic New Jersey 67,861 12,874
San Bernardino California 185,388 12,925
Newark New Jersey 273,546 13,009
Pico Rivera California 63,151 13,011
Reading Pennsylvania 81,201 13,086
Merced California 63,991 13,115
Provo Utah 105,258 13,207
Paterson New Jersey 149,222 13,257
Youngstown Ohio 82,026 13,293
Pomona California 149,644 13,336
Lawrence Massachusetts 72,043 13,360
Rialto California 91,711 13,375
Hartford Connecticut 121,578 13,428
Data source: 2000 Census
Notes:"Places" includes incorporated cities and towns but also built-up unincorporated territories identified by the Census Bureau as "Census-Designated Places" orCDPs. CDPs are recognized as distinct places despite the fact that they generally have no legally-defined boundaries or functioning governments of their own.
New Jersey places 4 cities in the poorest 30, despite ranking second in the nation in per capita income at the state level.
Of the top 30 poorest cities as measured by per capita income, half (15) of them are suburbs of Los Angeles, including the large "suburban" cities of Santa Ana,San Bernardino, and Pomona, and the smaller suburbs of Florence-Graham, Huntington Park, Lynwood, East Los Angeles, El Monte, Compton, South Gate,Paramount, Baldwin Park, Rosemead, Pico Rivera, and Rialto.
Several others are large suburbs of better-known cities, including National City, CA (San Diego), Cicero, IL (Chicago), and Hialeah and Carol City, FL (Miami).
24
Fastest-growing municipalities in New Jersey, 1990-2004
POPULATION % CHANGE %CHANGE
COUNTY MUNICIPALITY NAME 1990 2004 1990-2004 RANK 2000-04
Gloucester Woolwich township 1,385 6,115 341.52% 1 101.68%
Warren Greenwich township 1,881 5,223 177.67% 2 19.66%
Somerset Montgomery township 9,649 22,287 130.98% 3 27.49%
Gloucester Harrison township 4,725 10,903 130.75% 4 24.07%
Burlington Mansfield township 3,723 7,800 109.51% 5 53.24%
Monmouth Millstone township 5,136 9,882 92.41% 6 10.17%
Mercer Washington township 6,043 11,445 89.39% 7 11.39%
Ocean Stafford township 13,324 24,944 87.21% 8 10.70%
Bergen Edgewater borough 5,001 9,358 87.12% 9 21.00%
Burlington Lumberton township 6,726 12,297 82.83% 10 17.55%
Monmouth Upper Freehold township 3,283 5,996 82.64% 11 40.03%
Burlington Burlington township 12,356 21,994 78.00% 12 8.38%
Camden Tavistock borough 17 30 76.47% 13 25.00%
Middlesex Helmetta borough 1,194 2,023 69.43% 14 10.85%
Burlington Hainesport township 3,604 6,106 69.42% 15 47.99%
Ocean Surf City borough 921 1,517 64.71% 16 5.20%
Somerset Warren township 9,778 15,531 58.84% 17 8.92%
Warren Lopatcong township 5,066 8,042 58.74% 18 39.50%
Middlesex South Brunswick township 25,698 40,318 56.89% 19 6.85%
Atlantic Egg Harbor township 23,512 36,877 56.84% 20 20.02%
Ocean Barnegat township 12,237 19,177 56.71% 21 25.59%
Somerset Bernards township 17,210 26,904 56.33% 22 9.48%
Ocean Jackson township 33,261 51,607 55.16% 23 20.53%
Mercer Hopewell township 11,396 17,582 54.28% 24 9.17%
Mercer West Windsor township 16,006 24,458 52.81% 25 11.64%
Warren White township 3,535 5,395 52.62% 26 27.09%
Somerset Green Brook township 4,403 6,673 51.56% 27 18.02%
Middlesex Plainsboro township 14,147 21,300 50.56% 28 5.37%
Middlesex Monroe township 21,704 32,621 50.30% 29 16.51%
Atlantic Galloway township 23,559 35,058 48.81% 30 12.33%
New Jersey total 7,747,750 8,698,879 12.28% 3.38%
Data Source: Census Bureau
25
Plan Endorsement is a process developed by the State Planning Commission to encourage and assist all levels of government inimplementing the State Plan by making their own plans and actions consistent with the goals, policies and strategies of the StatePlan.
Plan Endorsement is a voluntary review process, whereby government entities may petition the State Planning Commission for afinding of consistency. Local governments that attain endorsement are eligible for priority funding and technical assistance fromthe state.
Plan Endorsement is described in full in the State Planning rules, N.J.A.C. 5:85, subchapter seven.The rules are available online at:(http://www.nj.gov/dca/osg/docs/stateplanningrules051704.pdf)
The rules describe two levels of endorsement for local governments, which may choose to apply for one or both:
� Initial plan endorsement
� Advanced plan endorsement
Initial Plan Endorsement requires a petitioner to submit the fundamental planning documents (including the master plan),which most municipalities and counties will have already prepared, to the State Planning Commission for review. Initial PlanEndorsement is required for municipal use of TDR, approval of CAFRA centers, and maintenance of substantive certification fromthe Council on Affordable Housing. Municipalities may use the process to make changes to planning areas and center designa-tions on the State Plan map.
Once a petitioner has received Initial Plan Endorsement, it may seek Advanced Plan Endorsement in order to obtain additionalregulatory benefits and plan approvals and receive the top level of funding priority. The process is meant to be flexible so that therequirements match the features of the petitioner's land area. The first step is reaching an agreement between the petitioner andthe State Planning Commission that identifies what planning documents must be submitted, and what resources will be commit-ted by state agencies to help the petitioner implement that plan.
When a Plan endorsement petition is approved, the State Planning Commission and the petitioner enter into a Planning andImplementation Agreement, which lists required actions by the petitioner and state agencies. Plan Endorsement is good for 10years, subject to review at least every two years.
There are a variety of reasons for local governments to seek Plan Endorsement. It is the only vehicle for obtaining center designa-tions and the state benefits that accompany this designation. Through Plan Endorsement, local governments can request changesto the State Plan map. According to the rule, local governments that are endorsed are eligible for prioritized state funding, coordi-nation with state agency plans, and procedural or substantive regulatory benefits.
The process of Plan Endorsement is described in the Plan Endorsement Guidelines, online at(http://www.nj.gov/dca/osg/docs/2004peguidelines.pdf). The Guidelines detail submission requirements, the review process andcriteria, potential regulatory and funding benefits, and monitoring and amendment procedures.
A list of municipalities that have applied for Plan Endorsement can be found on the Office of Smart Growth website:(http://www.nj.gov/dca/osg/plan/endorsement.shtml)
Plan Endorsement

26
COAH underestimates true need for affordable housing
TRUE NEED
Total number of households statewide (of any income) spending
at least 35 percent of income on housing =.................................663,648
or
Number of renter households spending at least 35 percent of
income on housing =.................................314,146
or
Most conservative estimate of number of low- and moderate-income
households spending at least 35 percent of income on housing =.................................425,213
or
Number of crowded households in the state =.................................153,877
Source: 2000 Census
COAH ESTIMATE
total statewide "current need" for affordable housing as
estimated by COAH =...................................27,044
“Current need” refers to the rehab share plus any prior round obligations, less “credits, reductions, and adjustments for prior housing activities.”
Source: COAH Third Round Rules, Chapter 94 Appendix A pg10
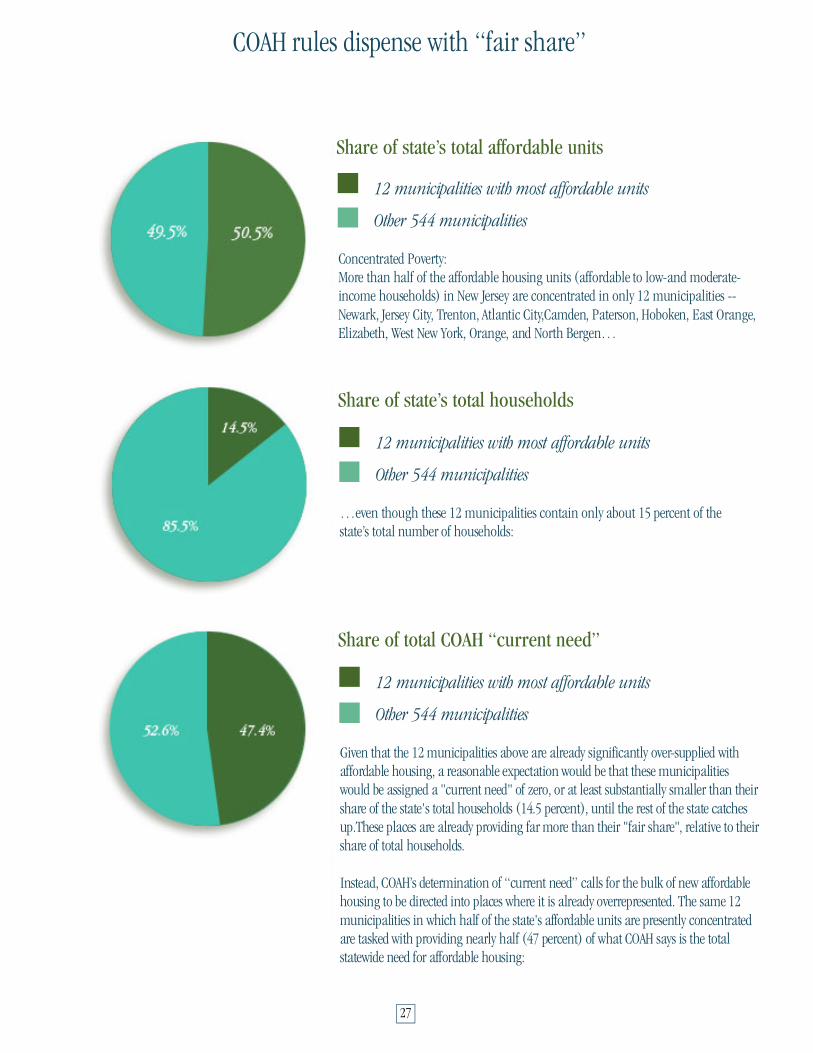
27
COAH rules dispense with “fair share”
12 municipalities with most affordable units
Other 544 municipalities
Concentrated Poverty:More than half of the affordable housing units (affordable to low-and moderate-income households) in New Jersey are concentrated in only 12 municipalities --Newark, Jersey City, Trenton, Atlantic City,Camden, Paterson, Hoboken, East Orange,Elizabeth, West New York, Orange, and North Bergen…
12 municipalities with most affordable units
Other 544 municipalities
…even though these 12 municipalities contain only about 15 percent of thes t a t e ’s total number of households:
Share of state’s total affordable units
Share of state’s total households
12 municipalities with most affordable units
Other 544 municipalities
Given that the 12 municipalities above are already significantly over-supplied withaffordable housing, a reasonable expectation would be that these municipalitieswould be assigned a "current need" of zero, or at least substantially smaller than theirshare of the state's total households (14.5 percent), until the rest of the state catchesup.These places are already providing far more than their "fair share", relative to theirshare of total households.
Instead, COAH’s determination of “current need” calls for the bulk of new affordablehousing to be directed into places where it is already overrepresented. The same 12 municipalities in which half of the state's affordable units are presently concentratedare tasked with providing nearly half (47 percent) of what COAH says is the totalstatewide need for affordable housing:
Share of total COAH “current need”
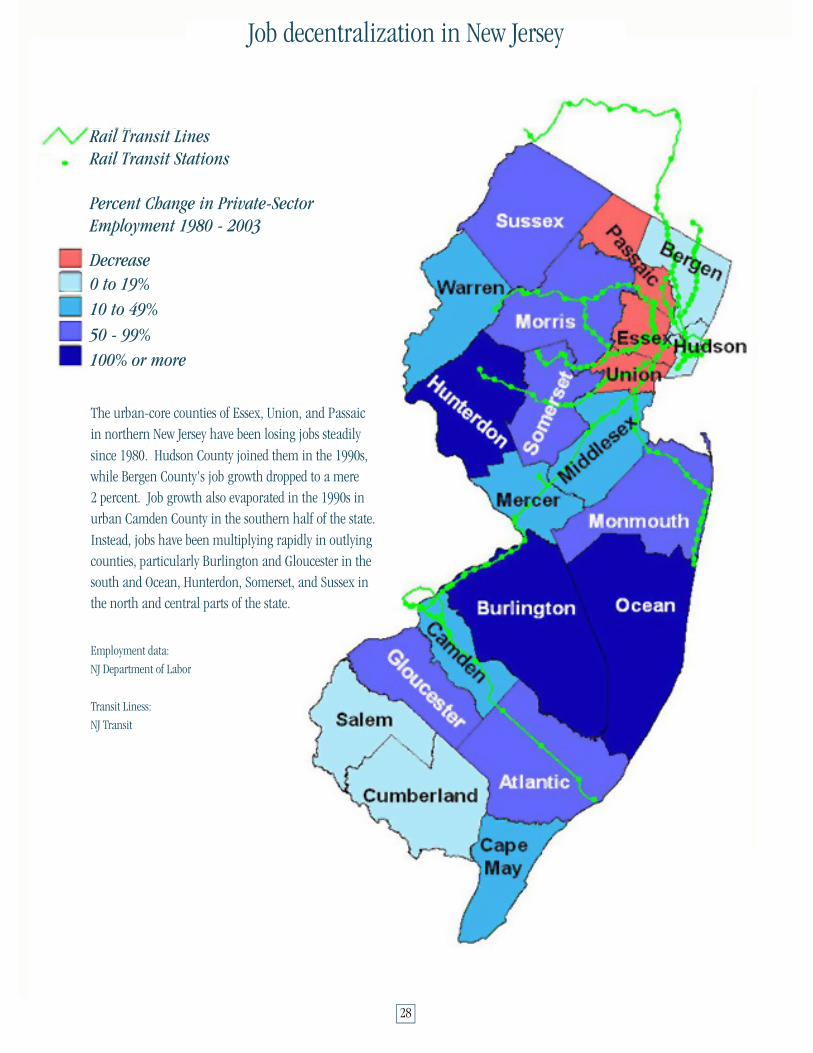
28
Job decentralization in New Jersey
Rail Transit LinesRail Transit Stations
Percent Change in Private-SectorEmployment 1980 - 2003
Decrease0 to 19%10 to 49%50 - 99%100% or more
The urban-core counties of Essex, Union, and Passaic
in northern New Jersey have been losing jobs steadily
since 1980. Hudson County joined them in the 1990s,
while Bergen County's job growth dropped to a mere
2 percent. Job growth also evaporated in the 1990s in
urban Camden County in the southern half of the state.
Instead, jobs have been multiplying rapidly in outlying
counties, particularly Burlington and Gloucester in the
south and Ocean, Hunterdon, Somerset, and Sussex in
the north and central parts of the state.
Employment data:
NJ Department of Labor
Transit Liness:
NJ Transit
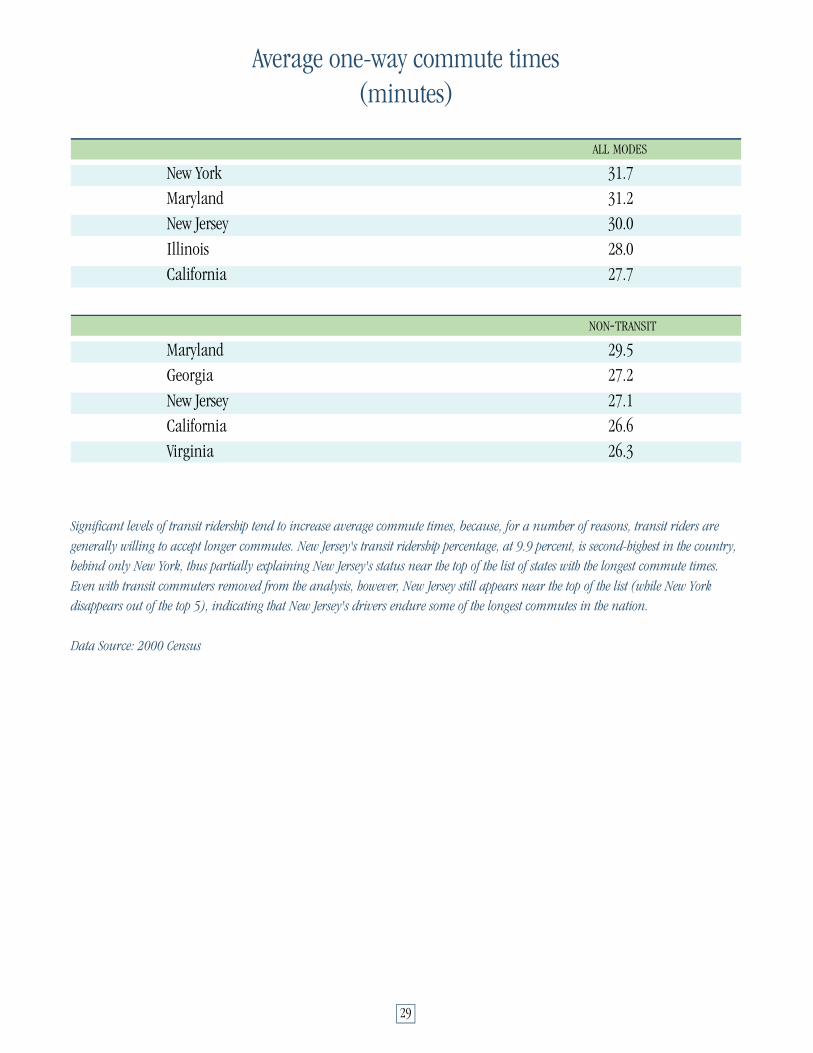
29
Average one-way commute times(minutes)
ALL MODES
New York 31.7
Maryland 31.2
New Jersey 30.0
Illinois 28.0
California 27.7
NON-TRANSIT
Maryland 29.5
Georgia 27.2
New Jersey 27.1
California 26.6
Virginia 26.3
Significant levels of transit ridership tend to increase average commute times, because, for a number of reasons, transit riders are
generally willing to accept longer commutes. New Jersey's transit ridership percentage, at 9.9 percent, is second-highest in the country,
behind only New York, thus partially explaining New Jersey's status near the top of the list of states with the longest commute times.
Even with transit commuters removed from the analysis, however, New Jersey still appears near the top of the list (while New York
disappears out of the top 5), indicating that New Jersey's drivers endure some of the longest commutes in the nation.
Data Source: 2000 Census

30
States with the highest and lowest gasoline tax rates
GASOLINE TAX RATE
RANK STATE(CENTS PER GALLON)
1 Rhode Island 30.0
2 Wisconsin 28.5
3 Washington 28.0
4 Montana 27.0
5 Pennsylvania 25.94
6 Wyoming 14.04
7 New Jersey 10.54
8 Florida 10.14
9 Alaska 8.05
10 Georgia 7.5
Data source: Federal Highway Administration, Highway Statistics 2003,at http://www.fhwa.dot.gov/ohim/mmfr/dec03/mf121tpg1.htm
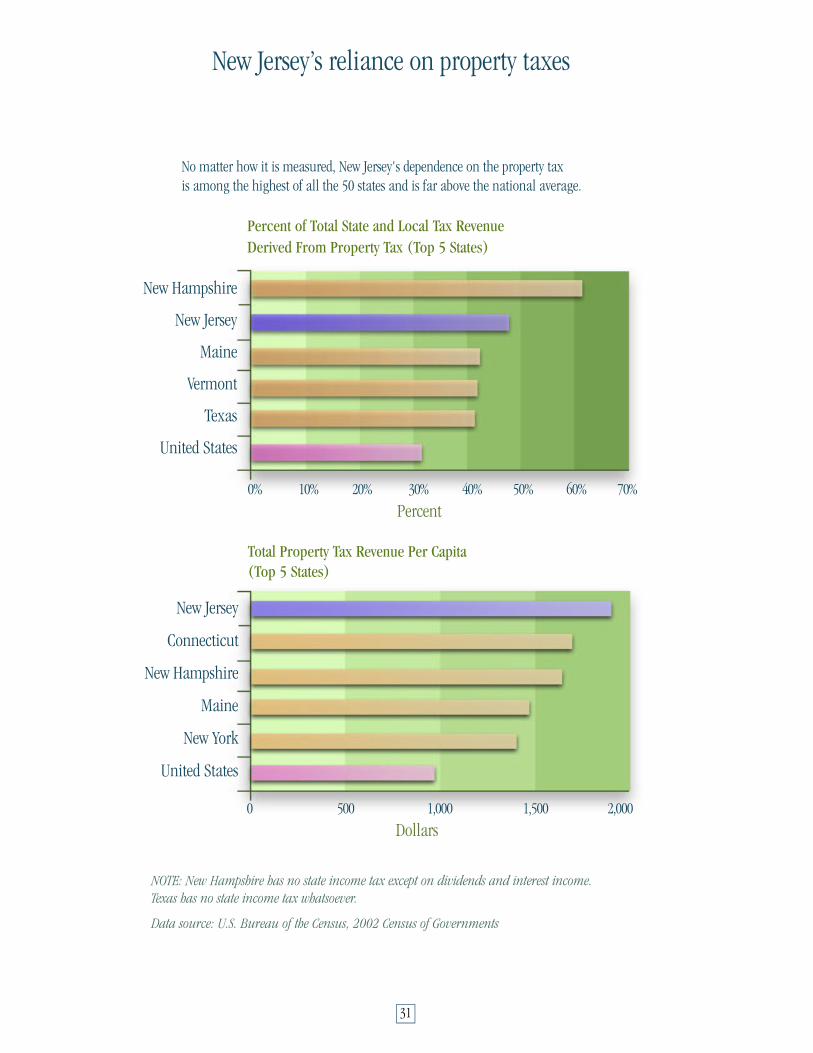
31
New Jersey’s reliance on property taxes
No matter how it is measured, New Jersey's dependence on the property taxis among the highest of all the 50 states and is far above the national average.
Percent of Total State and Local Tax RevenueDerived From Property Tax (Top 5 States)
New Hampshire
New Jersey
Maine
Vermont
Texas
United States
New Jersey
Connecticut
New Hampshire
Maine
New York
United States
NOTE: New Hampshire has no state income tax except on dividends and interest income.Texas has no state income tax whatsoever.
Data source: U.S. Bureau of the Census, 2002 Census of Governments
Total Property Tax Revenue Per Capita(Top 5 States)
0 % 1 0 % 2 0 % 3 0 % 40% 50% 60% 70%
Percent
0 5 0 0 1 , 0 0 0 1 , 5 0 0 2 , 0 0 0
Dollars
Endnotes1) New Jersey Future, Four Ways to Genuine Prosperity, Table: Towns that have not added multi-family housing, 1990 – 1999,
www.mypinwheel.com/accounts/pw_05132002/links/People.1st_Multi-Family.Table.pdf
2) New Jersey Future, Realistic Opportunity? The Distribution of Affordable Housing and Jobs in New Jersey, July 2003,
www.njfuture.org/Media/Docs/Realistic_Opportunities.pdf#page=5
3) David Rusk from an October 2002 presentation to the Bloustein School, Table: Five States with Most Segregated Elementary
Schools at Beginning and End of the 1990s,
www.njfuture.org/index.cfm?ctn=9t45e1o30v9g&emn=5u92y86g2h42&fuseaction=user.item&ThisItem=495#table%202
4) New Jersey Future, Realistic Opportunity? The Distribution of Affordable Housing and Jobs in New Jersey, July 2003,
www.njfuture.org/Media///Docs/Realistic_Opportunities.pdf#page=7
5) New Jersey Future, Four Ways to Genuine Prosperity, Table: Property Value Change in Real Dollars, 1990 – 2003,
www.mypinwheel.com/accounts/pw_05132002/links/People.1st_Tax_Base.Table.pdf
6) New Jersey Future, Poll: New Jerseyans’ Opinions on Growth Issues, April 2005,
www.njfuture.org/index.cfm?ctn=9t45e1o30v9g&emn=5u92y86g2h42&fuseaction=user.item&ThisItem=428
7) State of Massachusetts, Chapter 40R: The Smart Growth Zoning and Housing Production Act,
www.mass.gov/dhcd/40R/default.htm
8) Coalition for Affordable Housing and the Environment, Comments to the Council on Affordable Housing regarding the October
6, 2003 rules, page 17, www.cahenj.org/policy/coahrulefinal.pdf#page=17
9) U.S. Census Bureau, American Community Survey, Table: Median Household Income (50 States Ranked)
www.factfinder.census.gov/servlet/GRTTable?_bm=y&-_box_head_nbr=R2001&ds_name=ACS_2004_EST_G00_&-
format=US-30&-CONTEXT=grt
10) The World Factbook, Table: Rank Order - GDP - per capita (by country)
www.odci.gov/cia/publications/factbook/rankorder/2004rank.html
11) NJ Office of State Planning, Designing New Jersey, 2000, www.newjersey.gov/dca/osg/docs/designingnj060100.pdf
12) NJ Office of Smart Growth, State Development and Redevelopment Plan, Color Exhibits/Design Elements,
www.newjersey.gov/dca/osg/plan/stateplan/map_design.shtml
13) Smart Growth America website, Children & Schools, www.smartgrowthamerica.org/children.html
14) State of New Jersey, Historic Property Reinvestment Act, www.njleg.state.nj.us/2004/Bills/S1500/1416_I1.HTM
15) Smart Growth Gateway, Smart Growth Solutions: The Redevelopment Process,
www.smartgrowthgateway.org/local_redev_process.shtml
16) New Jersey Future, Farmland Preservation in New Jersey: Rethinking the Conservation of New Jersey’s Agricultural Lands,
2001, www.njfuture.org/index.cfm?ctn=9t45e1o30v9g&emn=5u92y86g2h42&fuseaction=user.item&ThisItem=465
32
17) New Jersey Sustainable State Institute, Goals and Indicators: #30 Loss of Freshwater Wetlands,
www.njssi.net/gi/nature/ind30.php
18) Trust for Public Lands, Newark, NJ: An Open Space Analysis, page 7,
www.tpl.org/content_documents/newark_parks_report.pdf#page=7
19) Center for Remote Sensing and Spatial Analysis (CRSSA), Measuring Land Use Change in NJ: Land Use Update to Year 2000,
page 18, deathstar.rutgers.edu/projects/lc/download/reportsdata00_01/landuse_upd.pdf#page=18
20) NJ Office of Smart Growth, State Development and Redevelopment Plan, Statewide Goals and Strategies: Conserve Natural
Resources and Systems, www.newjersey.gov/dca/osg/plan/stateplan/goals_resources.shtml
21) Regional Plan Association, Putting the Trust Back in the New Jersey Transportation Trust Fund, July 2005,
www.rpa.org/pdf/TTFfullreport071105.pdf
22) Tri-State Transportation Campaign, Mobilizing the Region: New Jersey Transit Fare Increase Will Leave the Big Problems
Unsolved, November 2004, www.tstc.org/bulletin/20041122/mtr48101.html
23) Tri-State Transportation Campaign, Mobilizing the Region: New Jersey Brings Transportation Taxes Back to the Table, October
2004, www.tstc.org/bulletin/20041018/mtr47704.html
24) Tri-State Transportation Campaign, The Trucks are Coming: What Growing Truck Traffic Will Mean for New Jersey’s Quality
of Life, January 2005, www.tstc.org/thetrucksarecoming.pdf#page=2
25) Regional Plan Association, Putting the Trust Back in the New Jersey Transportation Trust Fund, July 2005,
www.rpa.org/pdf/TTFfullreport071105.pdf
26) State of New Jersey, Blue Ribbon Commission Report: Recommendations for Ensuring a Strong Transportation Network for
the 21st Century, November 2003, page 3, www.state.nj.us/transportation/refdata/blueribbonreport.pdf#page=3
27) Texas Transportation Institute, 2005 Urban Mobility Study, Table: Components of the Congestion Problem, 2003 – Urban Area
Totals, www.mobility.tamu.edu/ums/congestion_data/tables/national/table_2.pdf
28) State of New Jersey, Blue Ribbon Commission Report: Recommendations for Ensuring a Strong Transportation Network for
the 21st Century, November 2003, page 47, www.state.nj.us/transportation/refdata/blueribbonreport.pdf#page=47
29) State of New Jersey, Blue Ribbon Commission Report: Recommendations for Ensuring a Strong Transportation Network for
the 21st Century, November 2003, page 48, www.state.nj.us/transportation/refdata/blueribbonreport.pdf#page=48
30) NJ Department of Transportation, Proposed Transportation Capital Program: Fiscal Year 2004,
www.state.nj.us/transportation/capital/tcp04/index.html
31) NJ Department of Transportation website, Context Sensitive Design, www.state.nj.us/transportation/eng/CSD/
32) NJ Department of Transportation website, Transit Village Initiative, www.state.nj.us/transportation/community/village/
33) Surface Transportation Policy Project, Mean Streets 2004, www.transact.org/report.asp?id= 235
33
34) New Jersey Policy Perspective, Fiscal Stress: It's Not Just a Big City Problem, www.njpp.org/rpt_fiscalstress.html
35) New Jersey Future, Four Ways to Genuine Prosperity, Table: Resale Value vs. Property Tax Rate,
www.mypinwheel.com/accounts/pw_05132002/links/ChangeRules_Val.vs.Tax.pdf
36) Ameregis, New Jersey Metropatterns: A Regional Agenda for Community and Stability in New Jersey, April 2003,
www.njregionalequity.org/publications/NJ%20Metropatterns%20complete%2003_ 24_03.pdf
37) NJ Office of Smart Growth, New Jersey State Development and Redevelopment Plan, www.nj.gov/dca/osg/plan/index.shtml
38) New Jersey Policy Perspective, Fiscal Stress: It's Not Just a Big City Problem, www.njpp.org/rpt_fiscalstress.html
39) NJ Department of Environmental Protection, Final Report of the New Jersey Comparative Risk Project,
www.state.nj.us/dep/dsr/njcrp/
40) NJ Department of Environmental Protection, Final Report of the New Jersey Comparative Risk Project, Table: Statewide
Socioeconomic Impact Rankings, page 13, www.nj.gov/dep/dsr/njcrp/rankings.pdf#page=13
41) New Jersey Policy Perspective, Fiscal Stress: It's Not Just a Big City Problem, www.njpp.org/rpt_fiscalstress.html
42) New Jersey Future, Property Tax Reform, September 2003, www.njfuture.org/Media///Docs/taxreform.pdf
43) New Jersey Future, Property Tax Reform, September 2003, www.njfuture.org/Media///Docs/taxreform.pdf
34