Embed Size (px)
Citation preview

AS Tallinna Vesi Results of operations – for the 1st quarter of 2016

Currency Thousand euros
Start of reporting period 1 January 2016
End of reporting period 31 March 2016
Address Tallinn, Ädala 10
Chairman of the Management Board Karl Heino Brookes
Commercial register number 10 257 326
Telephone +372 62 62 200
Telefax +372 62 62 300
E-mail [email protected]
Web page www.tallinnavesi.ee
Field of activity Production, treatment and distribution of water; storm and wastewater disposal and treatment CONTENTS Page MANAGEMENT REPORT 3 MANAGEMENT CONFIRMATION 14 CONSOLIDATED STATEMENTS OF FINANCIAL POSITION 15 CONSOLIDATED STATEMENTS OF COMPREHENSIVE INCOME 16 CONSOLIDATED CASH FLOW STATEMENTS 17 CONSOLIDATED STATEMENTS OF CHANGES IN EQUITY 18 NOTES TO THE ACCOUNTS NOTE 1. ACCOUNTING PRINCIPLES 19 NOTE 2. CASH AND CASH EQUIVALENTS 19 NOTE 3. PROPERTY, PLANT AND EQUIPMENT, AND INTANGIBLE ASSETS 20 NOTE 4. REVENUE 21 NOTE 5. STAFF COSTS 21 NOTE 6. COST OF GOODS SOLD, MARKETING AND GENERAL ADMINISTRATIONS
EXPENSES 22 NOTE 7. OTHER INCOME AND EXPENSES 22 NOTE 8. FINANCIAL INCOME AND EXPENSES 23 NOTE 9. DIVIDENDS 23 NOTE 10. EARNINGS PER SHARE 23 NOTE 11. RELATED PARTIES 24 NOTE 12. LIST OF SUPERVISORY BOARD MEMBERS 25 NOTE 13. CONTINGENT LIABILITY REGARDING THE TARIFF RISK 25

MANAGEMENT REPORT Chairman's summary The 1st quarter of 2016 is off to an excellent start. The majority of key performance indicators (KPI) are on track, which given the colder weather and associated increase in network disruption, is very good and a testament of all the hard work done by AS Tallinna Vesi staff, during the winter period.
In the 1st quarter of 2016, the water quality was 100% compliant, according to 6,510 analyses of the 772 samples taken. Average network leakage for the period was 17.51%, which is higher than the same period in 2015 (14.64%), but attributable to the colder ambient temperatures, resulting in a higher number of bursts on the clean water network. With the advent of warmer weather, we hope to see a corresponding reduction in network leakage, helping us to achieve the targeted year end KPI of 15%.
Besides providing premium drinking water, we are also responsible for a wastewater discharge service to nearly one third of Estonia’s population (440,000). It is therefore extremely important that the wastewater treatment plant in Paljassaare works effectively and in accordance with the stipulated quality requirements, set by the Estonian Ministry of Environment. During the 1st quarter of 2016, the final effluent leaving Paljassaare was 100% compliant with the stipulated limits and no pollution incidents have occurred on the network.
We continue to make targeted capital investments, renovating or replacing assets based on previous condition surveys and performance data, to ensure the continued reliability of the infrastructure. This includes the 5+5 programme, where 5 km of water and wastewater network is replaced each year.
Delivering good operational and financial performance is only possible through the continued motivation, commitment and performance of AS Tallinna Vesi staff. We remain focused on the development and training of internal staff and ensuring appropriate succession plans are in place. An example of this, is the company’s ongoing graduate and apprentice programmes, which will also inject fresh talent into the business for the future.
Operational performance for the three months of 2016 Indicator 2015 3 months 2016 3 months Drinking water Compliance of water quality at the customers’ tap 100% 100% Water loss in the water distribution network 14.64% 17.51% Average duration of water interruptions per property in hours 3.05 h 3.49 h Wastewater Number of sewer blockages 220 188 Number of sewer bursts 36 26 Wastewater treatment compliance with environmental standards 100% 100% Customer Service Number of written complaints 21 11 Number of customer contacts regarding water quality 27 13 Number of customer contacts regarding water pressure 79 58 Number of customer contacts regarding blockages and discharge of storm water
307 300
Responding written customer contacts within at least 2 work days 99.1% 98.1% Number of failed promises 4 0 Notification of unplanned water interruptions at least 1 h before the interruption
98.1% 96.5%
3

Contractual Highlights
• Tariffs of AS Tallinna Vesi continue to be on the same level, based on temporary injunction granted by the Court for the period of court proceedings, to protect the Company from unilateral breach of privatization agreement by the Estonian Authorities.
• The Company was privatised in 2001 with the support and knowledge of the Estonian national government.
• At the end of May 2012 the District Court ruled that AS Tallinna Vesi’s Services Agreement, that was part of the international privatisation, is a public law contract. AS Tallinna Vesi believes that the terms and conditions of the international privatisation contract, that has been deemed a public law contract, should enjoy the protection of the Estonian legal system.
• In May 2014, AS Tallinna Vesi submitted a claim against the Competition Authority to the Tallinn Administrative Court to avoid the expiry of monetary claims. The Company claims compensation for potential damages over the lifetime of the international privatisation contract up to 2020. The claim estimation includes future volumes and expectations for consumer price index (CPI). As the CPI has been recently lower than at the time of submitting the estimated, the estimated undiscounted value of the claim is around 74 million euros compared to over the 90 million euros submitted. The Court decided to stay the claim proceeding until the main tariff dispute is resolved.
• On 5th of June 2015, the Tallinn Administrative Court dismissed the Company’s complaint in local tariff dispute. The reasoning of the dismissal of complaints was released not until 12th of October 2015. Tallinn Administrative Court formed an opinion that the tariffs part of the Services Agreement, which has been deemed to be as a public law contract by the Estonian Courts in 2012, is not binding on the Competition Authority. AS Tallinna Vesi filed the appeal to the Tallinn District Court on 11th of November 2015.
• In October 2014, in parallel to the local dispute about tariffs, AS Tallinna Vesi and its shareholder United Utilities (Tallinn) B.V have commenced international arbitration proceedings against the Republic of Estonia, for breaching the international treaty and more specifically “the fair and equitable treatment” requirement by changes to the law and activities of the public authorities which have deprived AS Tallinna Vesi from tariffs approved according to the Services Agreement concluded as part of the privatisation in 2001. The arbitration will be carried out through the International Centre for the Settlement of Investment Disputes (ICSID), which is part of the World Bank Group.
• On 17th of June 2015, the timetable of the International Arbitration Proceedings was determined, with the final hearing set for November 2016. Procedural orders and decisions issued during the arbitration process, subject to the redaction of the confidential information, are available on the ICSID website.
• International Arbitration Proceedings are being held in parallel and separately from local Court dispute.
• There has been no hearings in disputes in the 1st quarter of 2016.
• It has been four years already during which the Company has made intensive effort in trying to agree a solution in order to get the tariff dispute solved. Regretfully it has not been achieved.
• AS Tallinna Vesi has continuously stated its belief in fully transparent regulation and its willingness to enter into meaningful and evidence-based dialogue that takes into account the privatization contract signed in 2001.
4

Financial highlights of 1st quarter 2016
The Group’s sales revenues during the 1st quarter of 2016 were EUR 14.37 million, being up by 5.9% or EUR 0.80 million compared to the same period in 2015.
The gross profit in the 1st quarter of 2016 was EUR 8.34 million, showing an increase by 3.3% or EUR 0.26 million. Increase in gross profit was related to higher water, wastewater and storm water revenues, but moreover with higher revenues from construction and asphalting services, which was balanced by higher costs related to construction and asphalting services and increased staff costs.
The operating profit was EUR 6.63 million, showing a slight decrease by 0.8% or EUR 0.05 million. The operating profit was impacted by the above mentioned changes in gross profit, which was balanced by some increases in staff costs and continuously high legal costs.
The net profit for the 1st quarter of 2016 was EUR 5.64 million, being down by 11.7% or EUR 0.75 million. The net profit was mainly impacted by above mentioned changes in operating profit and higher financial expenses. Higher financial expenses were mostly influenced by the negative change in the fair value of swap contracts in the 1st quarter of 2016. The net profit for the 1st quarter of 2016 and 2015 without the impact resulted from the change of the fair value of swap contracts was EUR 6.29 million and EUR 5.97 million respectively.
EUR million Q1 2014 Q1 2015 Q1 2016 Change 16/15 Sales 13.31 13.57 14.37 5.9% Gross profit 7.26 8.07 8.34 3.3% Gross profit margin % 54.59 59.51 58.02 -2.5% Operating profit 5.68 6.68 6.63 -0.8%
Operating profit - main business 5.63 6.66 6.55 -1.7% Operating profit margin % 42.71 49.26 46.15 -6.3% Profit before taxes 5.06 6.38 5.64 -11.7% Net profit 5.06 6.38 5.64 -11.7% Net profit margin % 38.03 47.04 39.23 -16.6% ROA % 2.42 3.01 2.61 -13.3% Debt to total capital employed % 55.81 55.85 56.15 0.5% ROE % 5.49 6.82 5.96 -12.7% Current ratio 4.60 6.81 5.79 -15.0%
Gross profit margin – Gross profit / Net sales Operating profit margin – Operating profit / Net sales Net profit margin – Net profit / Net sales ROA – Net profit /average Total assets for the period Debt to Total capital employed – Total liabilities / Total capital employed ROE – Net profit / Total equity Current ratio – Current assets / Current liabilities Main business – water and wastewater activities, excl. connections profit and government grants, construction and asphalting services, doubtful debt, other income RESULTS OF OPERATIONS FOR THE 1st QUARTER 2016
Profit and Loss Statement
1st quarter 2016
Sales
As the Company’s tariffs are frozen at the 2010 tariff level, the changes in the revenues from main activities, i.e. from sales of water and wastewater services, are fully driven by consumption.
5

In the 1st quarter of 2016 the Group’s total sales were EUR 14.37 million, showing an increase by 5.9% or EUR 0.80 million year on year. 87.1% of sales comprise of sales of water and wastewater services to domestic and commercial customers within and outside of the service area. 6.6% of sales are the fees received from the City of Tallinn for operating and maintaining the storm water system and fire hydrants and 6.3% from other works and services.
Revenues from main operating activities (EUR thousand) Quarter 1 Variance 16/15
2016 2015 2014 EUR % Total water supply and waste water disposal service, incl: 12,522 12,259 12,040 263 2.1%
Private clients, incl: 6,338 6,154 6,047 184 3.0%
Water supply service 3,485 3,386 3,327 99 2.9%
Wastewater disposal service 2,853 2,768 2,720 85 3.1%
Corporate clients, incl: 4,883 4,672 4,654 211 4.5%
Water supply service 2,673 2,569 2,580 104 4.0%
Wastewater disposal service 2,210 2,103 2,074 107 5.1%
Outside service area clients, incl: 1,130 1,249 1,145 -119 -9.5%
Water supply service 308 292 255 16 5.5%
Wastewater disposal service 670 771 756 -101 -13.1%
Storm water disposal service 152 186 134 -34 -18.3%
Over pollution fee 171 184 194 -13 -7.1%
Storm water treatment and disposal service and fire hydrant service 945 844 991 101 12.0%
Construction service, design and asphalting 761 344 130 417 121.2%
Other works and services 141 121 146 20 16.5% Sales from water and wastewater services were EUR 12.52 million, showing a 2.1% or EUR 0.26 million increase compared to the 1st quarter of 2015, resulting from the changes in sales volumes as described below:
• There has been a slight increase in all residential customer groups within the service area in the 1st quarter of 2016 compared to the same period in 2015 resulting a total increase in private customers’ revenues by 3.0% to EUR 6.34 million.
• Sales to commercial customers within the service area have increased by 4.5% to EUR 4.88 million. Increase is mostly related to industrial and other customer segment.
• Sales to customers outside the main service area have shown a decrease by 9.5% to EUR 1.13 million. Wastewater revenues decreased by 13.1% to EUR 0.67 million and storm water revenues decreased by 18.3% to EUR 0.15 million, while water revenues increased by 5.5% to EUR 0.31 million. Decrease in the revenues from customers outside the main service area is mainly related to the sales to Viimsi, as they started to use their new wastewater treatment facilities.
• Over pollution fees received have decreased by 7.1% to EUR 0.17 million.
Sales from the operation and maintenance of the main service area storm water and fire-hydrant system were EUR 0.95 million, showing an increase of 12.0% or EUR 0.10 million in the 1st quarter of 2016 compared to the same period in 2015. Sales of construction, design and asphalting services were EUR 0.76 million, having increased by 121.2% or EUR 0.42 million year on year. The increase was mainly related to the higher construction revenues resulted from an ongoing big project started at the end of 2015.
6
Cost of Goods Sold and Gross profit
The cost of goods sold amounted to EUR 6.03 million in the 1st quarter of 2016, showing 9.8% or EUR 0.54 million increase compared to the equivalent period in 2015. The cost increase is mainly influenced by increase in construction and asphalting services related costs and also by higher staff costs.
Cost of goods sold (EUR thousand) Quarter 1 Variance 16/15
2016 2015 2014 EUR % Water abstraction charges -291 -270 -264 -21 -7.8%
Chemicals -342 -360 -412 18 5.0%
Electricity -810 -828 -837 18 2.2%
Pollution tax -336 -300 -1,076 -36 -12.0%
Total direct production costs -1,779 -1,758 -2,589 -21 -1.2% Staff costs -1,418 -1,348 -1,228 -70 -5.2%
Depreciation and amortization -1,431 -1,394 -1,298 -37 -2.7%
Construction service, design and asphalting -675 -308 -87 -367 -119.2%
Other costs of goods sold -729 -686 -841 -43 -6.3%
Other costs of goods sold total -4,253 -3,736 -3,454 -517 -13.8%
Total cost of goods sold -6,032 -5,494 -6,043 -538 -9.8% Total direct production costs (water abstraction charges, chemicals, electricity and pollution tax) were EUR 1.78 million, showing 1.2% or EUR 0.02 million increase year on year. Changes in direct production costs came from a combination of changes in prices and in treated volumes that affected the cost of goods sold together with the following additional factors:
• Water abstraction charges increased by 7.8% to EUR 0.29 million, driven mainly by increase in treated volumes.
• Chemicals costs decreased by 5.0% to EUR 0.34 million, driven mainly by 20.5% lower methanol price used in wastewater treatment, worth EUR 0.034 million, which was balanced by higher usage of methanol in the wastewater treatment process, worth EUR 0.017 million.
• Electricity costs decreased by 2.2% to EUR 0.81 million. Electricity costs decrease was related to lower electricity prices, balanced by higher electricity usage per m3 in both treatment processes and increase in treated volumes.
• Pollution tax expense increased by 12.0% to EUR 0.34 million, driven mainly by increase in treated volumes compared to the 1st quarter of 2015.
Other costs of goods sold (staff costs, depreciation, construction and asphalting services costs and other costs of goods sold) amounted to EUR 4.25 million, having increased by 13.8% or EUR 0.52 million. Most of the increase came from costs related to construction and asphalting services and higher staff costs. Staff costs increased by 5.2% to EUR 1.42 million. It was partly driven by higher headcount and also increase in salaries compared to the same period in 2015. Increase in construction and asphalting services costs by 119.2% to EUR 0.68 million was related to increased construction and asphalting revenues from a big overcoming project mentioned earlier. As a result of all above the Group’s gross profit for the 1st quarter of 2016 was EUR 8.34 million, showing an increase of 3.3% or EUR 0.26 million, compared to the gross profit of EUR 8.07 million for the comparative period of 2015. Administrative and marketing expenses
Administrative and marketing expenses were EUR 1.66 million, showing an increase of 22.5% or EUR 0.30 million. Increased legal and consultation fees continue to be at a high level during the time the Company has ongoing local and international disputes. Increase in salary expenses was mostly related to higher headcount but also to some increase in salaries.
7

Operating profit
As a result of the factors listed above the Group’s operating profit for the 1st quarter of 2016 totalled EUR 6.63 million, being 0.8% or EUR 0.05 million lower than in the corresponding quarter of 2015. The Group’s operating profit from main business was 1.7% or EUR 0.11 million lower compared to 2015. Financial expenses
The Group’s net financial income and expenses have resulted a net expense of EUR 1.00 million, compared to net expense of EUR 0.30 million in the 1st quarter of 2015. It is mainly impacted by a negative change of the fair value of the swap contracts year on year (EUR -1.07 million), which was balanced by decrease in interest costs (EUR 0.39 million). The standalone swap agreements have been signed to mitigate the majority of the long term floating interest risk. The interest swap agreements are signed for EUR 75 million and EUR 20 million are still with floating interest rate. At this point in time the estimated fair value of the swap contracts is negative, totalling EUR 1.66 million. Effective interest rate of loans (incl. swap interests) in the 1st quarter of 2016 was 1.47%, amounting to interest costs of EUR 0.35 million, compared to the effective interest rate of 3.11% and the interest costs of EUR 0.74 million in the 1st quarter of 2015. Profit Before and After Tax
The Group’s profit before taxes and net profit for the 1st quarter of 2016 was EUR 5.64 million, being 11.7% or EUR 0.75 million lower than for the 1st quarter of 2015, resulting mainly from increased revenues, balanced by the increased costs and net financial expenses as described above. Eliminating the influence of the derivatives fair value, the Group’s profit before taxes and net profit for the 1st quarter of 2016 would have been EUR 6.29 million, showing an increase by 5.4% or EUR 0.32 million compared to the relevant period in 2015. Statement of financial position
In the three months of 2016 the Group invested EUR 2.00 million into fixed assets. As of 31st March 2016 non-current tangible assets amounted to EUR 163.12 million and total non-current assets amounted to EUR 163.91 million (31st March 2015: EUR 157.51 million and EUR 158.35 million respectively). Compared to the year end of 2015 the receivables and prepayments have shown an increase in the amount of EUR 0.18 million to EUR 7.35 million. Increase is mostly related to construction activities. The collection rate of receivables continues to be high being 99.8% compared to 99.7% in the 1st quarter of 2015. Current liabilities have increased by EUR 0.55 million to EUR 8.97 million compared to the year end of 2015. The increase in trade and other payables by EUR 0.57 million is related to increased investment related liabilities. The Group’s loan balance has remained stable at EUR 95 million. The weighted average interest risk margin for the total loan facility is 0.95%. The Group has a Total debt/Total assets level as expected of 56.2%, in range of 55%-65%, reflecting the Group’s equity profile. This level is consistent with the same period in 2015 when the Total debt/Total assets ratio was 55.9%. Deferred income from connection fees has grown compared to the end of 2015 by EUR 0.31 million to 15.34 million. Contingent liability regarding the tariff risk
In the 4th quarter of 2011 the Group evaluated and noted an exceptional off-balance sheet contingent liability, which could cause an outflow of economic benefits of up to EUR 36.0 million. In the 4th quarter of 2015 the
8

Group re-evaluated the liability, which now stands at EUR 42.8 million, as per note 13 to the accounts. The re-evaluation is made annually at the end of the year. Cash flows
As of 31st March 2016 the cash position of the Group is strong. At the end of March 2016 the cash balance of the Group stood at EUR 44.17 million, which is 20.5% of the total assets (31st March 2015: EUR 46.39 million, forming 21.9% of the total assets). The biggest contribution to the cash flows comes from main operations. During the three months of 2016, the Group generated EUR 8.76 million of cash flows from operating activities, an increase of EUR 0.70 million compared to the corresponding period in 2015. Underlying operating profit continues to be the main contributor to operating cash flows. The collection of receivables continues to be strong. In the three months of 2016 the result of net cash flows from investing activities was a cash outflow of EUR 2.05 million, a decrease of EUR 2.53 million compared to the cash inflow of EUR 0.48 million in the three months of 2015. This is made up as follows:
• In the three months of 2016 the investments in fixed assets have increased by EUR 0.38 million compared to 2015 amounting to EUR 2.24 million.
• The compensations received for the construction of pipelines were EUR 0.15 million in the three months of 2016, showing a decrease of EUR 2.14 million compared to the same period of 2015. It is mostly related to the extension program for which last payments were received in the 1st quarter of 2015.
In the three months of 2016 cash outflow from financing activities amounted to EUR 0.35 million, decreasing by EUR 0.36 million compared to the same period in 2015. The change was mainly related to reduction in interest payments by EUR 0.34 million related to renewal of swap contracts in 2nd quarter of 2015.
Employees
Competent and engaged employees are key to any business. The Group is committed to creating a work environment where everyone is respected and valued. We have described our human resource management procedures, including but not limited to recruitment, remuneration, evaluation and training policies. We follow equality principles in selecting and managing people which translates into providing, when feasible, equal opportunities to everyone. Understanding and appreciating the diversity of our staff, we ensure that everyone is treated fairly and equally and that they have access to the same opportunities as is reasonably practicable. We aim to ensure that no employees are discriminated against due to, but not exclusive to, age; gender; religion; cultural or ethnic origin; disability; sexuality orientation or marital status.
38,6
46,4
33,035,3
37,8
44,28,1
8,2
6,97,9
8,8
0,5
2,6
0,1 4,9
2,10,7
19,0
4,7 0,5
0,4
0,0
10,0
20,0
30,0
40,0
50,0
60,0
CF o
pen
Q1'
15
Ope
ratin
g
Inve
stin
g
Fina
ncin
g
CF e
nd Q
1'15
/ op
en Q
2'15
Ope
ratin
g
Inve
stin
g
Fina
ncin
g
CF e
nd Q
2'15
/ op
en Q
3'15
Ope
ratin
g
Inve
stin
g
Fina
ncin
g
CF e
nd Q
3'15
/ op
en Q
4'15
Ope
ratin
g
Inve
stin
g
Fina
ncin
g
CF e
nd Q
4'15
/ op
en Q
1'16
Ope
ratin
g
Inve
stin
g
Fina
ncin
g
CF e
nd Q
1'16
Tho
usan
ds
9

At the end of the 1st quarter of 2016, the total number of employees was 319 compared to 313 at the end of the 1st quarter of 2015. The full time equivalent (FTE) was respectively 307 in 2016 compared to the 302 in 2015. Average number of employees (FTE) during the 1st quarter was respectively 309 in 2016 and 301 in 2015. By gender, employee allocation was as follows:
As of 31st March 2016 Women Men Total Group 97 222 319 Management Team 13 13 26 Executive Team 6 3 9 Management Board 1 2 3 Supervisory Board 0 9 9
As of 31st March 2015 Women Men Total Group 96 217 313 Management Team 11 13 24 Executive Team 5 3 8 Management Board 1 2 3 Supervisory Board 0 9 9
The total salary cost was EUR 2.08 million, including EUR 0.08 million paid to Management and Supervisory Council members. The off-balance sheet potential salary liability could rise up to EUR 0.08 million should the Council want to replace the current Management Board members. Dividends
Dividend allocation to the shareholders is recorded as a liability in the financial statement of the Company at the time when the profit allocation and dividend payment is confirmed by the annual general meeting of shareholders. According to the dividend policy, which is also published on Company’s website, the Company will maintain dividends to shareholders at the same amount in real terms, i.e. dividends will increase in line with inflation each year. On the annual general meeting of shareholders on 2nd of June 2016 the matter of dividend pay-out will be voted on. Dividends will be paid out in June 2016. Dividend pay-outs in last five years have been as follows:
16 001 16 80117 401 18 001 18 0010,80
0,84 0,87 0,90 0,90
2011 2012 2013 2014 2015Dividend pay-out Dividend per share
10

Share performance
AS Tallinna Vesi is listed on NASDAQ OMX Main Baltic Market with trading code TVEAT and ISIN EE3100026436. As of 31st March 2016 AS Tallinna Vesi shareholders, with a direct holding over 5%, were:
United Utilities (Tallinn) BV 35.3% City of Tallinn 34.7%
During the three months of 2016 the shareholder structure has been relatively stable compared to the end of 2015. At the end of 1st quarter 2016 the pension funds owned 1.87% of the total shares compared to 1.89% at the end of 4th quarter 2015. As of 31st March 2016, the closing price of AS Tallinna Vesi share was EUR 14.80, which is 7.2% (2015: 7.6%) higher compared to the closing price of EUR 13.80 at the beginning of the quarter. During the same period the OMX Tallinn index increased by 8.0% (2015: 14.3%). In the three months of 2016, 1,514 deals with the Company’s shares were concluded (2015: 1,324 deals) during which 258 thousand shares or 1.3% exchanged their owners (2015: 309 thousand shares or 1.5%). The turnover of the transactions was EUR 0.67 million lower than in 2015, amounting to EUR 3.61 million.
Corporate structure
As of 31st March 2016, the Group consisted of 2 companies. The subsidiary Watercom OÜ is wholly owned by AS Tallinna Vesi and consolidated to the results of the Company. Corporate Governance
Supervisory Council
Supervisory Council plans and organises the management of the Company and supervises the activities of the Management Board. According to AS Tallinna Vesi articles of association Supervisory Council consists of 9
500
1 000
1 500
2 000
2 500
4
6
8
10
12
14
16
18
Turn
over
th €
Pric
e €/
shar
e
Closing Price & Adjusted OMXT vs Transaction Turnover
Transaction turnover Closing price of AS Tallinna Vesi share Adjusted OMXT
11

members who are appointed for two years. There has been no changes in Supervisory Council members in the 1st quarter of 2016.
Supervisory Council has formed three committees to advise Supervisory Council on audit, remuneration and corporate governance matters.
More information about the Supervisory Council and committees can be found in the note 12 to the financial statements as well as from the Company’s webpage:
http://tallinnavesi.ee/en/Investor/Corporate-Governance/Supervisory-Board http://tallinnavesi.ee/en/Investor/Corporate-Governance/Audit-Committee http://tallinnavesi.ee/en/Investor/Corporate-Governance/Corporate-Governance-Report Management Board
Management Board is a governing body, which represents and manages AS Tallinna Vesi in its daily operations in accordance with the legal requirements as well as the Articles of Association. The Management Board must act economically in the most efficient way taking into consideration the interest of the Company and its shareholders and ensure the sustainable development of the Company in accordance with the set objectives and strategy.
To ensure that the company’s interests are met in the best way possible, the Management and Supervisory Boards shall extensively collaborate. Meetings of Management and Supervisory Board members are held at least once a quarter. In those meetings the Management Board informs the Supervisory Council about all significant issues in Company’s business operations, the fulfilment of the company’s short and long-term goals are being discussed and the risks impacting them. For every meeting of the Management Board prepares report and submits the report in advance with the sufficient time for the Supervisory Board to study it.
According to the Articles of Association the Management Board consists of 2-5 members, who are elected for 3 years.
Starting from 2nd of June 2014 there are 3 members of the Management Board of AS Tallinna Vesi: Karl Heino Brookes (Chairman of the Board, with the powers of the Management Board Member until 20th of March 2017), Aleksandr Timofejev (with the powers of the Management Board Member until 29th of October 2018) and Riina Käi (with the powers of the Management Board Member until 29th of October 2018).
Additional information on the members of the Management Board can be found from the Company’s website:
http://tallinnavesi.ee/en/Investor/Corporate-Governance/Management-Board Future actions & risks
Legal claim for breach of international treaty
In May 2014, the Supervisory Council of the Company gave notice of potential international arbitration proceedings against the Republic of Estonia for breaching the undertakings it is required to abide by in the bilateral investment treaty.
In October 2014 AS Tallinna Vesi and its shareholder United Utilities (Tallinn) B.V have commenced international arbitration proceedings against the Republic of Estonia for breach of the Agreement on the Encouragement and Reciprocal Protection of Investments between the Kingdom of The Netherlands and the Republic of Estonia.
The claim was filed as three years of intensive negotiation to try and reach an amicable settlement that has not happened.
Additional details related with the claim can be found via the following links: https://newsclient.omxgroup.com/cdsPublic/viewDisclosure.action?disclosureId=609264&messageId=754811 https://newsclient.omxgroup.com/cdsPublic/viewDisclosure.action?disclosureId=627851&messageId=779161
12

Disclosure of relevant papers and perspectives
The Company will keep the investment community informed of all relevant developments of the tariff dispute, both locally as well as internationally. AS Tallinna Vesi has published all relevant materials on its website (http://www.tallinnavesi.ee/en/Investor/Regulation) and to the Tallinn Stock.
At this point in time the Company will not speculate on future developments, possible outcomes or timing of the proceedings.
Additional information: Karl Heino Brookes Chairman of the Management Board +372 6262 201 [email protected]
13

P14

AS TALLINNA VESI
Consolidated Unaudited Interim Condensed Financial Statements
for the 3 months period of financial year 2016 ended 31 March 2016
CONSOLIDATED STATEMENT OF FINANCIAL POSITION (EUR thousand)
as of 31 December
ASSETS Note 2016 2015 2015
CURRENT ASSETS
Cash and cash equivalents 2 44 174 46 393 37 819
7 349 6 730 7 174
Inventories 405 406 447
TOTAL CURRENT ASSETS 51 928 53 529 45 440
NON-CURRENT ASSETS
Derivatives 0 0 142
Property, plant and equipment 3 163 122 157 510 162 732
Intangible assets 3 791 835 758
TOTAL NON-CURRENT ASSETS 163 913 158 345 163 632
TOTAL ASSETS 215 841 211 874 209 072
LIABILITIES AND EQUITY
CURRENT LIABILITIES
Current portion of long-term borrowings 444 286 328
Trade and other payables 6 159 4 915 5 586
Derivatives 594 678 523
Prepayments 1 771 1 980 1 983
TOTAL CURRENT LIABILITIES 8 968 7 859 8 420
NON-CURRENT LIABILITIES
Deferred income from connection fees 15 338 13 535 15 030
Borrowings 95 807 96 175 95 974
Derivatives 1 071 750 628
Other payables 13 23 13
TOTAL NON-CURRENT LIABILITIES 112 229 110 483 111 645
TOTAL LIABILITIES 121 197 118 342 120 065
EQUITY
Share capital 12 000 12 000 12 000
Share premium 24 734 24 734 24 734
Statutory legal reserve 1 278 1 278 1 278
Retained earnings 56 632 55 520 50 995
TOTAL EQUITY 94 644 93 532 89 007
TOTAL LIABILITIES AND EQUITY 215 841 211 874 209 072
Notes to the consolidated financial statements on pages 6 to 12 form an integral part of the condensed financial statements.
Trade receivables, accrued income and prepaid expenses
as of 31 March
15

AS TALLINNA VESI
Consolidated Unaudited Interim Condensed Financial Statements
for the 3 months period of financial year 2016 ended 31 March 2016
CONSOLIDATED STATEMENT OF COMPREHENSIVE INCOME (EUR thousand)
for the year ended
31 December
Note 2016 2015 2015
Revenue 4 14 369 13 568 55 928
Costs of goods/services sold 6 -6 032 -5 494 -23 679
GROSS PROFIT 8 337 8 074 32 249
Marketing expenses 6 -127 -137 -435
General administration expenses 6 -1 528 -1 214 -6 086
Other income(+)/ expenses(-) 7 -50 -40 -150
OPERATING PROFIT 6 632 6 683 25 578
Financial income 8 15 36 95
Financial expenses 8 -1 010 -337 -1 315
PROFIT BEFORE TAXES 5 637 6 382 24 358
Income tax on dividends 9 0 0 -4 500
5 637 6 382 19 858
5 637 6 382 19 858
Attributable profit to:
Equity holders of A-shares 5 636 6 381 19 857
B-share holder 0,60 0,60 0,60
Earnings per A share (in euros) 10 0,28 0,32 0,99
Earnings per B share (in euros) 10 600 600 600
Notes to the consolidated financial statements on pages 6 to 12 form an integral part of the condensed financial
statements.
COMPREHENSIVE INCOME FOR THE PERIOD
Quarter 1
NET PROFIT FOR THE PERIOD
16

AS TALLINNA VESI
Consolidated Unaudited Interim Condensed Financial Statements
for the 3 months period of financial year 2016 ended 31 March 2016
CONSOLIDATED CASH FLOW STATEMENT (EUR thousand)
for the year ended
31 December
Note 2016 2015 2015
CASH FLOWS FROM OPERATING ACTIVITIES
Operating profit 6 633 6 683 25 578
Adjustment for depreciation/amortisation 3,6,7 1 561 1 516 6 184
Adjustment for revenues from connection fees 7 -53 -45 -194
Other non-cash adjustments -3 -4 -15
plant and equipment, and intangible assets -7 -2 2
Change in current assets involved in operating activities -133 -407 -897
Change in liabilities involved in operating activities 761 323 453
Total cash flow from operating activities 8 759 8 064 31 111
CASH FLOWS FROM INVESTING ACTIVITIES
-2 235 -1 856 -13 495
149 2 285 6 499
and intangible assets 18 12 30
Interest received 15 40 99
Total cash flow used in/from investing activities -2 053 481 -6 867
CASH FLOWS FROM FINANCING ACTIVITIES
Interest paid and loan financing costs, incl swap interests -288 -631 -2 178
Repayment of finance lease -63 -81 -306
Dividends paid 9 0 0 -18 001
Income tax on dividends 9 0 0 -4 500
Total cash flow used in financing activities -351 -712 -24 985
Change in cash and cash equivalents 6 355 7 833 -741
37 819 38 560 38 560
2 44 174 46 393 37 819
Quarter 1
Profit(-) /loss(+) from sale and write off of property,
Notes to the consolidated financial statements on pages 6 to 12 form an integral part of the condensed financial statements.
CASH AND CASH EQUIVALENTS AT THE END
OF THE PERIOD
Acquisition of property, plant and equipment, and
intangible assets
Compensations received for construction of pipelines
CASH AND CASH EQUIVALENTS AT THE
BEGINNING OF THE PERIOD
Proceeds from sale of property, plant and equipment,
17

AS TALLINNA VESI
Consolidated Unaudited Interim Condensed Financial Statements
for the 3 months period of financial year 2016 ended 31 March 2016
CONSOLIDATED STATEMENT OF CHANGES IN EQUITY (EUR thousand)
Share capital Share premium
Statutory legal
reserve
Retained
earnings Total equity
as of 31 December 2014 12 000 24 734 1 278 49 138 87 150
Dividends 0 0 0 -18 001 -18 001
Comprehensive income for the period 0 0 0 19 858 19 858
as of 31 December 2015 12 000 24 734 1 278 50 995 89 007
as of 31 December 2014 12 000 24 734 1 278 49 138 87 150
Comprehensive income for the period 0 0 0 6 382 6 382
as of 31 March 2015 12 000 24 734 1 278 55 520 93 532
as of 31 December 2015 12 000 24 734 1 278 50 995 89 007
Comprehensive income for the period 0 0 0 5 637 5 637
as of 31 March 2016 12 000 24 734 1 278 56 632 94 644
Notes to the consolidated financial statements on pages 6 to 12 form an integral part of the condensed financial statements.
18

AS TALLINNA VESI
Consolidated Unaudited Interim Condensed Financial Statements
for the 3 months period of financial year 2016 ended 31 March 2016
NOTES TO THE CONSOLIDATED UNAUDITED INTERIM FINANCIAL STATEMENTS (EUR thousand)
NOTE 1. ACCOUNTING PRINCIPLES
NOTE 2. CASH AND CASH EQUIVALENTS
as of 31 December
2016 2015 2015
Cash in hand and in bank 16 482 18 590 13 738
Short-term deposits 27 692 27 803 24 081
Total cash and cash equivalents 44 174 46 393 37 819
The interim accounts have been prepared according to International Financial Reporting Standards as adopted by the EU. The
same accounting policies are followed in the interim financial statements as in the most recent annual financial statements. The
interim report is prepared in accordance with IAS 34 Interim Financial Reporting.
as of 31 March
19

AS
TA
LL
INN
A V
ES
I
Con
soli
dat
ed U
nau
dit
ed I
nte
rim
Con
den
sed
Fin
anci
al S
tate
men
ts
for
the
3 m
on
ths
per
iod
of
fin
anci
al y
ear
20
16
en
ded
31
Mar
ch 2
01
6
NO
TE
S T
O T
HE
CO
NS
OL
IDA
TE
D U
NA
UD
ITE
D I
NT
ER
IM F
INA
NC
IAL
ST
AT
EM
EN
TS
(EU
R t
hou
san
d)
NO
TE
3.
PR
OP
ER
TY
, P
LA
NT
AN
D E
QU
IPM
EN
T,
AN
D I
NT
AN
GIB
LE
AS
SE
TS
Inta
ng
ible
ass
ets
La
nd
an
d
bu
ild
ing
sF
aci
liti
es
Ma
chin
ery
an
d
equ
ipm
ent
Oth
er
equ
ipm
ent
Co
nst
ruct
ion
in p
rog
ress
Co
nst
ruct
ion
in
pro
gre
ss -
un
fin
ish
ed
pip
elin
es
Un
fin
ish
ed
inta
ng
ible
ass
ets
Acq
uir
ed
lice
nse
s a
nd
oth
er
inta
ng
ible
ass
ets
as
of
31
Dec
emb
er 2
01
4
Acq
uis
itio
n c
ost
2
5 6
89
18
1 3
65
47
20
61
35
96
88
1 2
71
75
5 0
13
26
2 6
66
Acc
um
ula
ted
dep
reci
atio
n-5
94
0-6
0 7
35
-32
44
6-9
76
00
0-4
22
6-1
04
32
3
Net
bo
ok
va
lue
19
74
91
20
63
01
4 7
60
38
36
88
1 2
71
75
78
71
58
34
3
Tra
nsa
ctio
ns
in t
he
per
iod
01
Ja
nu
ary
20
15
- 3
1 D
ecem
ber
20
15
Acq
uis
itio
n i
n b
ook
val
ue
00
00
9 2
12
1 9
15
17
10
11
29
8
Wri
te o
ff a
nd
sal
e of
pro
per
ty,
pla
nt
and
eq
uip
men
t, a
nd
inta
ngib
le a
sset
s in
res
idu
al v
alu
e0
-12
-19
-10
00
0-3
2
Rec
lass
ific
atio
n
31
06
89
51
75
24
3-6
40
5-2
53
0-1
84
18
46
5
Dep
reci
atio
n-3
27
-2 8
36
-2 6
68
-78
00
0-2
75
-6 1
84
as
of
31
Dec
emb
er 2
01
5
Acq
uis
itio
n c
ost
2
5 9
50
18
7 9
43
47
01
61
27
73
49
56
56
62
5 1
92
27
1 5
91
Acc
um
ula
ted
dep
reci
atio
n-6
21
8-6
3 2
66
-33
19
1-9
30
00
0-4
49
6-1
08
10
1
Net
bo
ok
va
lue
19
73
21
24
67
71
3 8
25
34
73
49
56
56
62
69
61
63
49
0
Tra
nsa
ctio
ns
in t
he
per
iod
01
Ja
nu
ary
20
16
- 3
1 M
arc
h 2
01
6
Acq
uis
itio
n i
n b
ook
val
ue
00
00
1 7
39
15
11
05
01
99
5
Wri
te o
ff a
nd
sal
e of
pro
per
ty,
pla
nt
and
eq
uip
men
t, a
nd
inta
ngib
le a
sset
s in
res
idu
al v
alu
e0
0-1
10
00
00
-11
Rec
lass
ific
atio
n
25
47
02
62
5-4
58
-30
4-6
96
90
Dep
reci
atio
n
-83
-73
5-6
53
-18
00
0-7
2-1
56
1
as
of
31
Ma
rch
20
16
Acq
uis
itio
n c
ost
2
5 9
75
18
8 4
13
47
16
91
28
24
77
65
03
98
5 2
62
27
3 4
78
Acc
um
ula
ted
dep
reci
atio
n-6
30
1-6
4 0
01
-33
74
6-9
48
00
0-4
56
9-1
09
56
5
Net
bo
ok
va
lue
19
67
41
24
41
21
3 4
23
33
44
77
65
03
98
69
31
63
91
3
Pro
per
ty,
pla
nt
and
eq
uip
men
t an
d i
nta
ngib
le a
sset
s ar
e w
ritt
en o
ff,
if t
he
con
dit
ion
s of
the
asse
t d
o n
ot
enab
le i
ts f
urt
her
usa
ge
for
pro
du
ctio
n p
urp
ose
s.
Pro
per
ty,
pla
nt
an
d e
qu
ipm
ent
To
tal
pro
per
ty,
pla
nt
an
d
equ
ipm
ent
an
d
inta
ng
ible
ass
ets
Ass
ets
in p
rog
ress
As
of
31
Mar
ch 2
01
5 t
he
book
val
ue
of
the
asse
ts (
Mac
hin
ery a
nd
eq
uip
men
t) l
ease
d u
nd
er f
inan
cial
lea
se i
s 1
34
8 t
hou
san
d e
uro
s (3
1 D
ecem
ber
20
15
: 1
44
2 t
hou
san
d e
uro
s).
20
AS TALLINNA VESI
Consolidated Unaudited Interim Condensed Financial Statements
for the 3 months period of financial year 2016 ended 31 March 2016
NOTES TO THE CONSOLIDATED UNAUDITED INTERIM FINANCIAL STATEMENTS (EUR thousand)
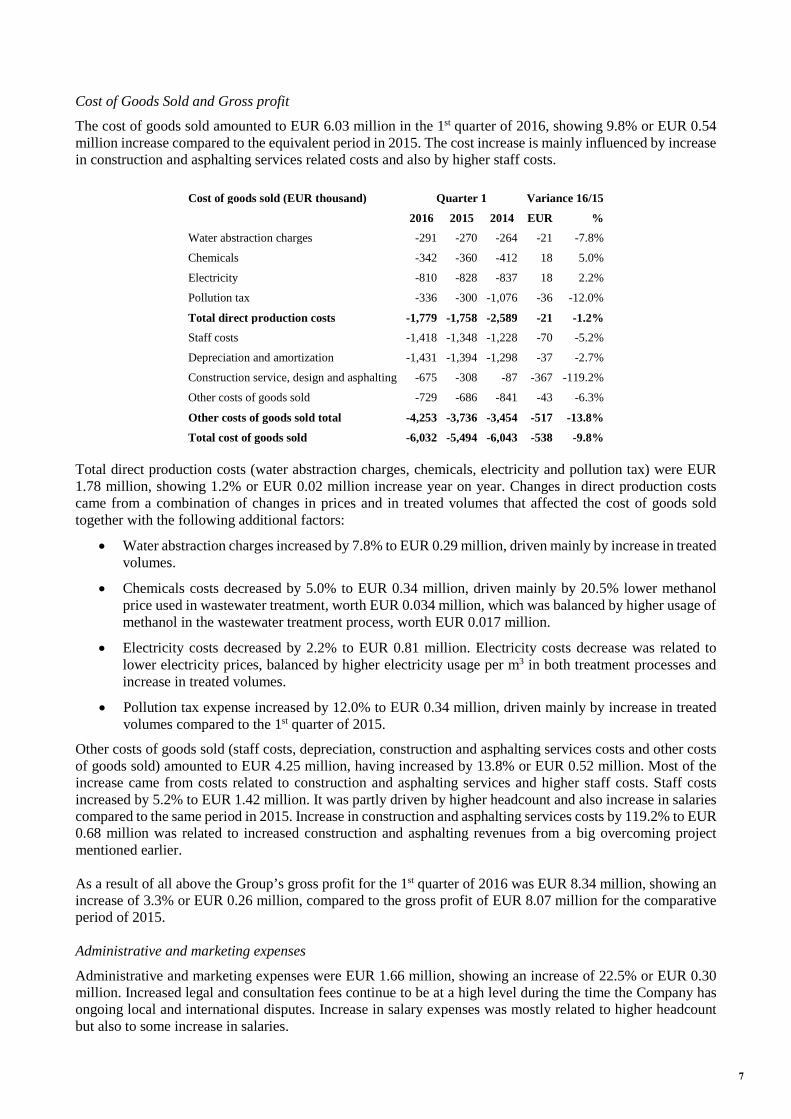
NOTE 4. REVENUE
for the year ended
31 December
Revenues from main operating activities 2016 2015 2015
Total water supply and waste water disposal service, incl: 12 522 12 259 49 297
Private clients, incl: 6 338 6 154 24 408
Water supply service 3 485 3 386 13 436
Wastewater disposal service 2 853 2 768 10 972
Corporate clients, incl: 4 883 4 672 19 358
Water supply service 2 673 2 569 10 736
Wastewater disposal service 2 210 2 103 8 622
Outside service area clients, incl: 1 130 1 249 4 765
Water supply service 308 292 1 280
Wastewater disposal service 670 771 3 011
Storm water disposal service 152 186 474
Over pollution fee 171 184 766
Storm water treatment and disposal service and fire hydrants service 945 844 3 357
Construction service, design and asphalting 761 344 2 724
Other works and services 141 121 550
Total revenue 14 369 13 568 55 928
100 % of the Group´s revenue was generated within the Estonian Republic.
NOTE 5. STAFF COSTS
for the year ended
31 December
2016 2015 2015
Salaries and wages -1 553 -1 484 -5 963
Social security and unemployment insurance taxation -526 -493 -2 017
Staff costs total -2 079 -1 977 -7 980
Number of employees at the end of reporting period 319 313 323
Quarter 1
Quarter 1
21

AS TALLINNA VESI
Consolidated Unaudited Interim Condensed Financial Statements
for the 3 months period of financial year 2016 ended 31 March 2016
NOTES TO THE CONSOLIDATED UNAUDITED INTERIM FINANCIAL STATEMENTS (EUR thousand)
for the year ended
31 December
Cost of goods/services sold
2016 2015 2015
Water abstraction charges -291 -270 -1 101
Chemicals -342 -360 -1 531
Electricity -810 -828 -3 035
Pollution tax -336 -300 -1 002
Staff costs -1 418 -1 348 -5 603
Depreciation and amortization -1 431 -1 394 -5 690
Construction service, design and asphalting -675 -308 -2 398
Other costs -729 -686 -3 319
Total cost of goods/services sold -6 032 -5 494 -23 679
Marketing expenses
Staff costs -117 -112 -362
Depreciation and amortization 0 -3 -11
Other marketing expenses -10 -22 -62
Total marketing expenses -127 -137 -435
Administrative expenses
Staff costs -544 -517 -2 015
Depreciation and amortization -80 -76 -308
Other general administration expenses -904 -621 -3 763
Total administrative expenses -1 528 -1 214 -6 086
NOTE 7. OTHER INCOME / EXPENSES
for the year ended
31 December
2016 2015 2015
Connection fees 53 45 194
Depreciation of single connections -50 -43 -175
Doubtful receivables expenses(-) / expense reduction(+) 1 -11 13
Other income(+)/ expenses(-) -54 -31 -182
Total other income / expenses -50 -40 -150
NOTE 6. COST OF GOODS/SERVICES SOLD, MARKETING AND ADMINISTRATIVE EXPENSES
Quarter 1
Quarter 1
22

AS TALLINNA VESI
Consolidated Unaudited Interim Condensed Financial Statements
for the 3 months period of financial year 2016 ended 31 March 2016
NOTES TO THE CONSOLIDATED UNAUDITED INTERIM FINANCIAL STATEMENTS (EUR thousand)
NOTE 8. FINANCIAL INCOME AND EXPENSES
for the year ended
31 December
2016 2015 2015
Interest income 15 36 95
Interest expense, loan -224 -263 -981
Interest expense, swap -126 -481 -1 149
Increase(+) /decrease(-) of fair value of swap -656 411 830
Other financial income (+)/ expenses (-) -4 -4 -15
Total financial income / expenses -995 -301 -1 220
NOTE 9. DIVIDENDS
for the year ended
31 December
2015
Dividends declared during the period 18 001
Dividends paid during the period 18 0010
Income tax on dividends paid -4 500
Income tax accounted for -4 500
Paid-up dividends per shares:
Dividends per A-share (in euros) 0,90
Dividends per B-share (in euros) 600
Dividend income tax rate in 2016 is 20/80 (in 2015: 20/80).
NOTE 10. EARNINGS PER SHARE
for the year ended
31 December
2016 2015 2015
Net profit minus B-share preferred dividend rights 5 636 6 381 19 857
Weighted average number of ordinary shares for the purposes of basic
earnings per share (in pieces) 20 000 000 20 000 000 20 000 000
Earnings per A share (in euros) 0,28 0,32 0,99
Earnings per B share (in euros) 600 600 600
Diluted earnings per share for the periods ended 31 March 2016 and 2015 and December 2015 was equal to earnings per share
figures stated above.
Quarter 1
Quarter 1
23

AS TALLINNA VESI
Consolidated Unaudited Interim Condensed Financial Statements
for the 3 months period of financial year 2016 ended 31 March 2016
NOTES TO THE CONSOLIDATED UNAUDITED INTERIM FINANCIAL STATEMENTS (thousand EUR)
NOTE 11. RELATED PARTIES
Shareholders having the significant influence
Balances recorded in working capital on the statement of
financial position of the Group as of 31 December
2016 2015 2015
Accounts receivable 3 3 271
Trade and other payables 190 201 184
Transactions
for the year ended
31 December
2016 2015 2015
Revenue 945 844 3 357
Purchase of administrative and consulting services 254 266 1 050
Financial income 0 14 14
Fees for Management Board (excluding social tax) 71 46 151
Supervisory Board fees (excluding social tax) 8 8 32
Company shares belonging to the Management Board and Supervisory Board members
As of 31 March 2016 from all Supervisory Council and Management Board members Riina Käi owned 100 shares (as of of 31
March and 31 December 2015: Riina Käi owned 100 shares).
In the first quarter of 2016 and throughout the year ending on 31 December 2015, management board members were not paid any
leaving compensation. The off balance sheet potential salary liability would be up to 77 thousand euros (excluding social tax) if
the Supervisory Board would want to replace all Management Board members.
Transactions with related parties are considered to be transactions with members of the Supervisory Board and Management
Board, their relatives and the companies in which they have control or significant influence and transactions with shareholder
having the significant influence. Dividend payments are indicated in the Statement of Changes in Equity.
as of 31 March
Quarter 1
The Group’s Management Board and Supervisory Board members are considered as key management personnel for whom the
contractual salary payments have been accounted for as disclosed above. In addition to this some Board Members have also
received direct compensations from the companies belonging to the group of United Utilities (Tallinn) B.V. as overseas
secondees. Such compensations are recorded on line “Purchase of administrative and consulting services”.
The Group’s Management Board members are elected for 3 (three) years and Supervisory Board members for 2 (two) years.
Stock exchange announcement is published about the change in Management and Supervisory Board.
24
AS TALLINNA VESI
Consolidated Unaudited Interim Condensed Financial Statements
for the 3 months period of financial year 2016 ended 31 March 2016
NOTES TO THE CONSOLIDATED UNAUDITED INTERIM FINANCIAL STATEMENTS
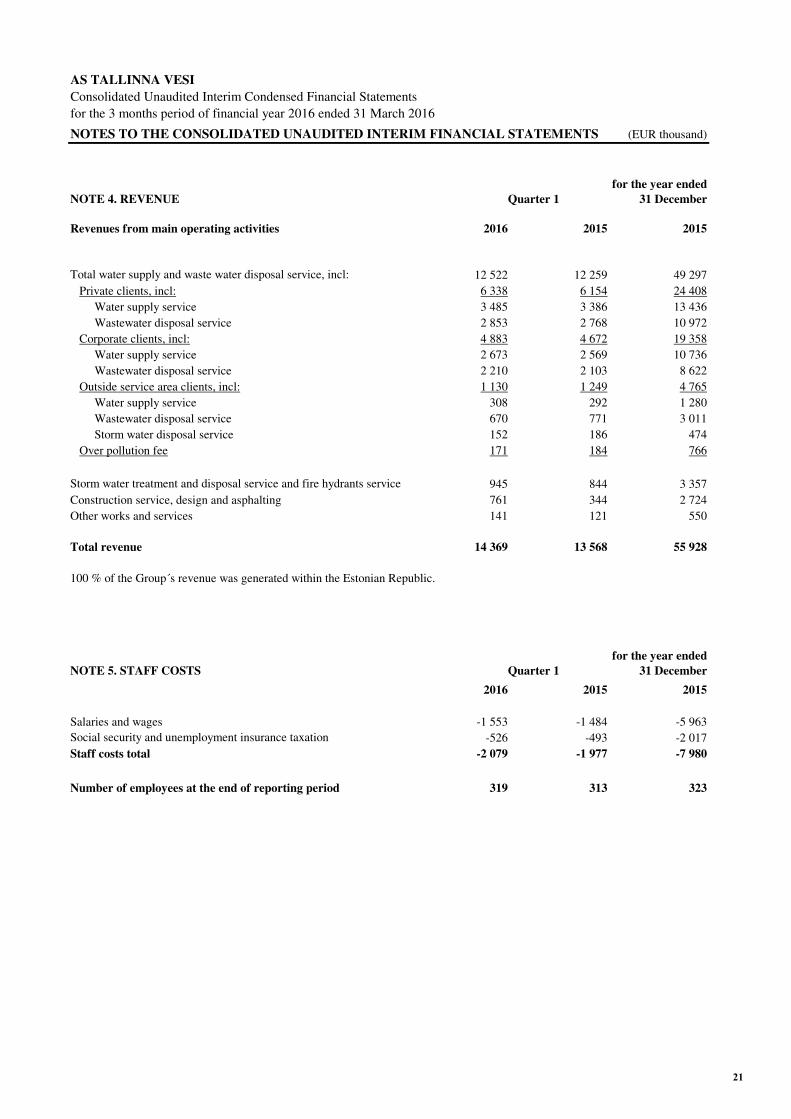
NOTE 12. LIST OF SUPERVISORY BOARD MEMBERS
Simon Roger Gardiner Chairman of the Supervisory Board
Steven Richard Fraser Member of the Supervisory Board
Martin Padley Member of the Supervisory Board
Brendan Francis Murphy Member of the Supervisory Board
Mart Mägi Member of the Supervisory Board
Rein Ratas Member of the Supervisory Board
Toivo Tootsen Member of the Supervisory Board
Allar Jõks Member of the Supervisory Board
Priit Lello Member of the Supervisory Board
http://www.tallinnavesi.ee/en/Investor/Corporate-Governance/Supervisory-Board
NOTE 13. CONTINGENT LIABILITY REGARDING THE TARIFF RISK
On 10th October 2011 the Estonian Competition Authority (CA) issued a prescript for the Company to reduce the tariffs
of water and sewerage services in Tallinn by 29%. The Company disagrees with the position of the CA and has turned to
the Estonian Administrative Court disputing the prescription that seeks to break the privatization contract. Should the
Court uphold the CA's position the privatization contract could cease to be the basis for the tariffs of water and sewerage
services in Tallinn. On 5th June 2015 Tallinn Administrative Court dismissed AS Tallinna Vesi’s complaint in tariff
dispute. AS Tallinna Vesi appealed the decision in the Circuit Court. The length of the court process and the decision
are not within the Company's control.
The management has evaluated the amount of the contingent liability as of 31 December 2015 arising from the potential
claims against the Company if the Court ruling would support the CA’s position. As result of this, the outflow of
economic benefits could be up to EUR 42.8 million (31 March 2015: EUR 40.1 million) the part that CA considers to be
excessively charged from the clients going back three years, and which could be claimed within 10 years of the final
judgement of the courts.
Introduction of Supervisory Board members is published at company’s web page.
25