Embed Size (px)
Citation preview

For Review OnlyModified montmorillonite with alkylamine
chloroanthraquinone as a colorimetric sensor for detection and separation of Cu2+ from an aqueous solution
Journal: Songklanakarin Journal of Science and Technology
Manuscript ID SJST-2019-0273.R2
Manuscript Type: Original Article
Date Submitted by the Author: 13-Nov-2019
Complete List of Authors: Thongkum, Duangrat; Naresuan University, Chemistry Nomnuch, Thitiporn; Naresuan University, Chemistry Chuenchomnakjad, Saksit; Rajamangala University of Technology Lanna, Program of Industrial Engineering
Keyword: adsorption, chloroanthraquinone, colorimetric sensor, copper ion, montmorillonite
For Proof Read only
Songklanakarin Journal of Science and Technology SJST-2019-0273.R2 Thongkum
For Review Only
Original Article
Modified montmorillonite with alkylamine chloroanthraquinone as a colorimetric
sensor for detection and separation of Cu2+ from an aqueous solution
Duangrat Thongkum1*, Thitiporn Nomnuch1, and Saksit Chuenchomnakjad2
1Department of Chemistry, Faculty of Science, Naresuan University,
Mueang, Phitsanulok, 65000 Thailand
2 Program of Industrial Engineering, Rajamangala University of Technology Lanna
Phitsanulok, Mueang, Phitsanulok, 65000 Thailand
* Corresponding author, Email address: [email protected]
Abstract
To compare the adsorption capacity of Cu2+ between Mt and Mt modified with
alkylamine chloroanthraquinone colorimetric sensor (Mt-L), the adsorption properties of
Mt and Mt-L with Cu2+ were studied by using UV-vis spectroscopy. Their structures were
characterized by FTIR spectroscopy and XRD techniques. The adsorbent quantity on the
removal efficiency of Cu2+, effect of pH, effect of initial Cu2+ concentration, equilibrium
adsorption time, adsorption kinetic and adsorption isotherm were determined. The results
revealed that the maximum adsorption efficiency was 54% with an initial Cu2+
concentration of 3.5010-3 M, 40.0 g/L of Mt-L and an initial pH of 5.0. The adsorption
kinetic displayed the pseudo-second order model and the adsorption isotherm
corresponded to the Langmuir isotherm. The qm of Mt-L was calculated to be 9.5511 mg/g
which was higher than the adsorption of Cu2+ on Mt (2.6260 mg/g). Therefore, Mt-L was
a great potential adsorbent for Cu2+ ion adsorption in aqueous solution.
Page 3 of 31
For Proof Read only
Songklanakarin Journal of Science and Technology SJST-2019-0273.R2 Thongkum
123456789101112131415161718192021222324252627282930313233343536373839404142434445464748495051525354555657585960
For Review Only
Keywords: adsorption, chloroanthraquinone, colorimetric sensor, copper ion,
montmorillonite
1. Introduction
Copper is a heavy metal which is considered as one of the most toxic mineral
contaminant in soil and water resources. The effects on human health caused by copper
are liver damage, Wilson disease, Alzheimer’s disease, etc (Borchard et al., 2018;
Roberts, 2011; Squitti et al., 2018). The maximum permissible limit for copper in drinking
water by the World Health Organization (WHO) is 2 mg/L (Datta, Uslu, & Kumar, 2015;
Uddin, 2017). Therefore, it is necessary to cleanup water and metal-contaminated waste
water before its discharge to environment.
There are many techniques for the treatment of water and waste water
contaminating heavy metals, such as, chemical precipitation, solvent extraction,
membrane filtration, ion exchange, electrochemical removal and coagulation (Fan, Zhou,
Jiang, Huang, & Lang, 2014; Rasouli, Aber, Salari, & Khataee, 2014). However,
adsorption is considered as an efficient, simple and low-cost technique (Shirzad-Siboni,
Khataee, Hassani, & Karaca, 2015; Wu et al., 2011). Many studies have reported the
adsorption of metallic ions from water by various adsorbents such as activated carbon,
zeolite and clay mineral (Burakov et al., 2018; Uddin, 2017).
Clay minerals are hydrous aluminosilicates, sometimes with variable amounts of
alkali metals, alkaline earth metals and other cations (Bhattacharyya & Gupta, 2008;
Uddin, 2017). The characteristics of clay minerals are high specific surface area, high
cation exchange capacity (CEC), chemical and mechanical stability, as well as low-cost
Page 4 of 31
For Proof Read only
Songklanakarin Journal of Science and Technology SJST-2019-0273.R2 Thongkum
123456789101112131415161718192021222324252627282930313233343536373839404142434445464748495051525354555657585960
For Review Only
(Gonçalves dos Santos, Grassi, & Abate, 2015). During the past decades, the metal ion
adsorption studies by clay minerals were mainly focused on montmorillonite (Mt).
Abdellaoui et al. (2019) studied the divalent heavy metals adsorption behavior by
commercial montmorillonite and reported the Cu2+ adsorption capacity increases with an
increase in pH of the solution. This behavior can be attributed to the surface charge of the
clays and the competence between the H+ and the divalent ions by the adsorption sites at
lower pH. However, when the pH increases, the clays become negatively charged surface,
and the repulsive force decreases. Therefore the removal of Cu2+ begins to increase. The
adsorption and separation of Cu2+ from an aqueous solution using montmorillonite had
been investigated by Datta et al. (2015). In the kinetic experiments, the maximum
adsorption capacity for the separation of Cu2+ ion from aqueous solution was found
(predicted by the Langmuir model) to be 2.6260 mg/g. However, little has been reported
that investigate modified-Mt with colorimetric sensor to detect Cu2+ in aqueous solution
and also to optimize the adsorption capacity of Cu2+ as well.
The purposes of this present study are to compare the adsorption capacity of Cu2+
ion in aqueous solution between Mt and Mt modified with alkylamine
chloroanthraquinone colorimetric sensor or Mt-L and to evaluate the adsorption
parameters such as adsorbent dosage, pH and Cu2+ ion concentration. In addition, the
color, the adsorption kinetic and the adsorption isotherm studies were determined to
understand the adsorption mechanism of Cu2+ ion on modified-Mt surfaces.
2. Materials and Methods
2.1 Materials
Page 5 of 31
For Proof Read only
Songklanakarin Journal of Science and Technology SJST-2019-0273.R2 Thongkum
123456789101112131415161718192021222324252627282930313233343536373839404142434445464748495051525354555657585960
For Review Only
Montmorillonite-K10 (CEC 120 cmol/kg) and Cu(NO3)2·3H2O were purchased
from Sigma Aldrich. All of the solvents used were of analytical grade and they were
purified by distillation under nitrogen gas before using. The colorimetric sensor L was
synthesized according to the literature (Kaur & Kumar, 2008; Ranyuk et al., 2011) by
using the substitution reaction between 1,8-dichloroanthraquinone (0.40 g, 1.5 mmol) and
2-picolylamine (0.22 mL, 2 mmol) with K2CO3 (0.30 g, 2 mmol) in toluene (40 mL). The
mixture solution was refluxed for 2-3 days under nitrogen atmosphere. Initially the
solution was yellow and upon heating turned to red. Then, the solvent was removed under
reduced pressure. The residue was dissolved in CH2Cl2, and 3M HCl was added to adjust
pH 1. The resulting residue was extracted with CH2Cl2 and water. The organic phase was
dried over anhydrous Na2SO4, filtered and evaporated. The crude residue was purified by
column chromatography (SiO2, CH2Cl2) to yield red solid (45%). The final product was
characterized by FTIR, 1H-NMR and 13C-NMR spectroscopic techniques.
2.2 Characterization techniques
The functional groups of Mt and Mt-L were recorded by attenuated total
reflectance Fourier transform infrared spectroscopy (ATR-FTIR) on a PerkinElmer in the
spectral range 4000-400 cm-1. The X-ray diffraction patterns were performed with a
Panalytical XRD instrument at 2 value range 5-80 degree using Cu K = 0.154 nm.
The absorbance of Cu2+ was measured with a SPECORD 200 PLUS UV-Vis
spectrophotometer over the wavelength range 200-1000 nm.
2.3 Modification of Mt
Page 6 of 31
For Proof Read only
Songklanakarin Journal of Science and Technology SJST-2019-0273.R2 Thongkum
123456789101112131415161718192021222324252627282930313233343536373839404142434445464748495051525354555657585960

For Review Only
The synthesis of L modified Mt (Mt-L) was prepared in 250 mL of volumetric
flask by dispersion 6 g of Mt in 1.5:1 ratio of CH3CN:H2O for 2 h at room temperature
using a magnetic stirrer. Then, the 6.0010-5 M of L in the same ratio of solvent was
added to Mt dispersive solution. The mixture was then adjusted to the pH with 0.1 M
NaOH and 0.1 M HCl while stirring for 2 h. After that, the colloidal solution was
centrifuged for 5 min at 4000 rpm and the precipitate was dried in an oven at 80C to
obtain red-orange solid of Mt-L.
2.4 Adsorption of Cu2+ on the MT-L
All adsorption experiments were prepared by adding 3.00 mL of Cu2+ ion solution
to Mt-L in seven PP bottles at room temperature. The colloidal solutions were stirred at
150 rpm for 2 h in the different time (0, 5, 15, 30, 45, 60, 90, 120 min). Each sample was
centrifuged at 4000 rpm for 5 min to remove the Mt-L. The supernatant was measured in
the range of 200-1000 nm using a double beam UV-Vis spectrophotometer. The
concentrations of Cu2+ after adsorption were calculated by a calibration curve at max 800
nm. Each experiment was done three times.
To determine the effects of various parameters, the adsorption experiments were
studied by varying adsorbent amounts of 4.00 to 40.0 g/L, initial pH 3 to 5 and initial
Cu2+ concentrations of 2.5010-3 to 4.5010-3 M. The Cu2+ adsorption capacity by Mt-L
was calculated through the amounts of Cu2+ adsorbed by the Mt-L (qt and qe) and
percentage of removal efficiency as shown in equations (1), (2) and (3), respectively.
qt = (Ci - Ct)V
M (1)
Page 7 of 31
For Proof Read only
Songklanakarin Journal of Science and Technology SJST-2019-0273.R2 Thongkum
123456789101112131415161718192021222324252627282930313233343536373839404142434445464748495051525354555657585960
For Review Only
qe = (Ci - Ce)V
M (2)
% removal efficiency = Ci - Ct
Ci× 100 (3)
When, qt and qe are the amount of adsorbed metal per gram of clay at the observing
time and at equilibrium (mg/g). Ci, Ct and Ce are the concentration in solution at initial, at
the observing time and at equilibrium (mg/L). V is the volume of metal ion solution (L)
and M is the total amount of Mt-L (g) (Datta et al., 2015).
The adsorption data were studied by varying Cu2+ concentration (2.5010-3 to
4.5010-3 M) containing Mt-L 40.0 g/L at pH 5. To describe the adsorption kinetic, the
pseudo-first and pseudo-second order models were applied using linear and non-linear
regression methods. The non-linear form of pseudo-first order kinetic is as follow:
qt = qe(1 - e -k1t) (4)
The pseudo-second order kinetic model describes that chemical adsorption is the
main rate determining step and the overall rate of adsorption process seems to be
controlled by the chemical process through exchanging of electrons between adsorbent
and adsorbate (Tiwari, Lalhmunsiama, Choi, & Lee, 2014). The non-linear form of
pseudo-second order kinetic is as follow:
qt = k2q2
et1 + k2qet
(5)
Page 8 of 31
For Proof Read only
Songklanakarin Journal of Science and Technology SJST-2019-0273.R2 Thongkum
123456789101112131415161718192021222324252627282930313233343536373839404142434445464748495051525354555657585960
For Review Only
Previously, k1 (1/min) and k2 (g/mgmin) are the pseudo-first order and pseudo-
second order rate constants, respectively.
The adsorption isotherm was investigated by using linear and non-linear
regression methods of Langmuir and Freundlich isotherm models. The Langmuir
isotherm model was used to describe the chemisorption and monolayer coverage of
adsorbates onto adsorbents (Baseri & Tizro, 2017; Hu et al., 2017a; Hu, Zhu, Cai, Hu, &
Fu, 2017b). The non-linear form is given by the following equation:
qe = qmKLCe
1 + KLCe (6)
The Freundlich isotherm model indicates exponential distribution of active sites
and their energies including the surface heterogeneity of the adsorbents. The non-linear
form can be presented by the following equation:
qe = KFC1/ne (7)
Hitherto, qm (mg/g) is maximum monolayer adsorption capacity, KL and KF are
the Langmuir and Freundlich constants, respectively, and n is the intensity of adsorption.
Values of 1/n less than 1 represent favorable chemical adsorption conditions (Baseri &
Tizro, 2017; Hu et al., 2018; Tiwari et al., 2014).
3. Results and Discussion
3.1 Modification of Mt
The structures of Mt and modified-Mt were confirmed by ATR-FTIR technique
(Figure 1). A broad band around 3626 cm-1 of Mt was the hydroxyl group stretching
Page 9 of 31
For Proof Read only
Songklanakarin Journal of Science and Technology SJST-2019-0273.R2 Thongkum
123456789101112131415161718192021222324252627282930313233343536373839404142434445464748495051525354555657585960
For Review Only
vibration of Al2OH group of the octahedral layer in Mt. The intense peak at 1027 cm-1
was attributed to stretching vibration of siloxane group in Si-O of Mt. After modification,
this functional group was shifted to lower wavenumber of 1013 cm-1. These results proved
the successful adsorption of L onto the Mt surface (Shirzad-Siboni et al., 2015). Although,
there was a slightly shift of wavenumber, the retention of all parent montmorillonite bands
clearly showed that the basic clay layer structure remains unaffected on adsorption (Molu
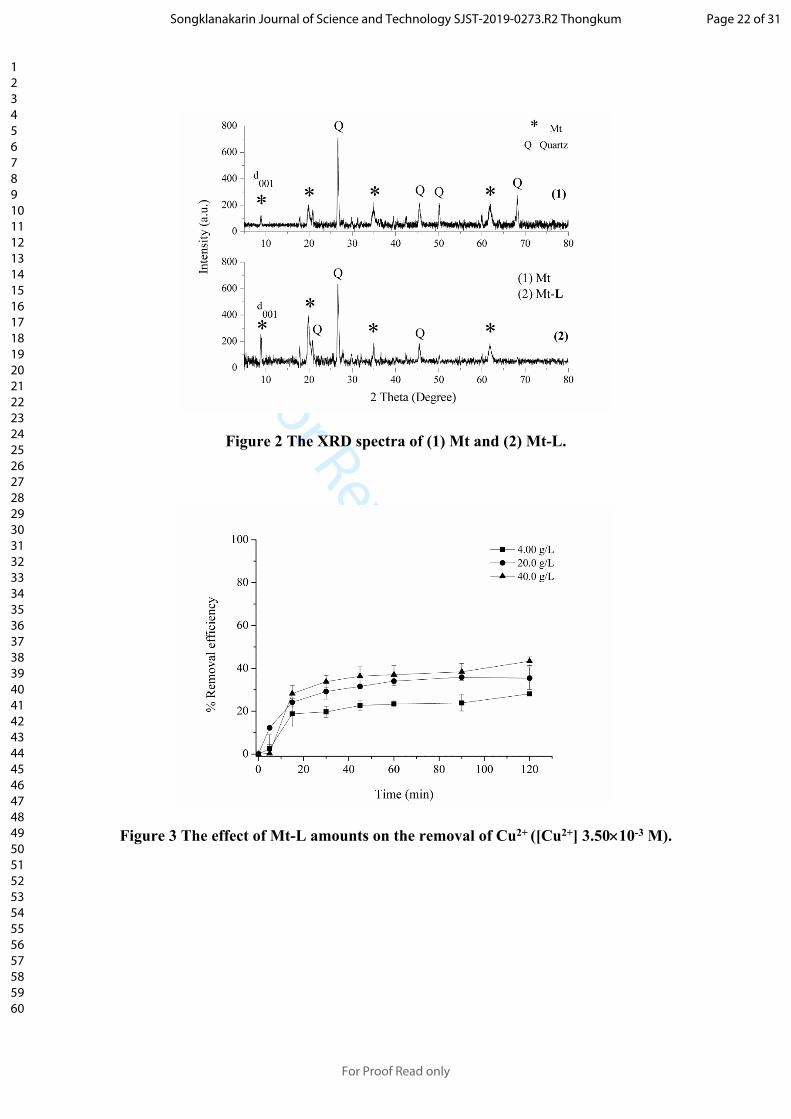
& Yurdakoc, 2010). The XRD spectrum (Figure 2) showed the reflection of Mt at 8.88
degree (1.99 nm) that corresponded to the basal spacing of 001 direction. In the case of
Mt-L, this peak was tiny shifted to a lower angle at 8.83 degree (2.00 nm). However, the
adsorption could be observed by the color change of Mt-L solid from white to red-orange
when L was intercalated between Mt layers.
Figure 1 The ATR-FTIR spectra of (1) L (2) Mt and (3) Mt-L.
Figure 2 The XRD spectra of (1) Mt and (2) Mt-L.
3.2 The effect of Mt-L amounts on the Cu2+ adsorption
The Mt-L in the range of 4.00 to 40.0 g/L on the adsorption of 3.5010-3 M Cu2+
were measured at max 800 nm by UV-Vis spectroscopic technique and the percentage of
removal efficiency of Cu2+ was calculated by using equation (3). The Cu2+ removal
efficiency (Figure 3) was increased from 4.00 to 40.0 g/L of Mt-L because of more
available sites for adsorption with increasing adsorbent. Moreover, the contact time from
0 to 15 min displayed the maximum adsorption rate. This may be due to the abundance
of free surfaces of Mt-L to adsorb the Cu2+ at the beginning. Then adsorption rate was
Page 10 of 31
For Proof Read only
Songklanakarin Journal of Science and Technology SJST-2019-0273.R2 Thongkum
123456789101112131415161718192021222324252627282930313233343536373839404142434445464748495051525354555657585960
For Review Only
constant after 15 min because of the repulsion force between positive charge of adsorbates
and the decrease in free active sites of Mt-L.
Figure 3 The effect of Mt-L amounts on the removal of Cu2+ ([Cu2+] 3.5010-3 M).
3.3 The effect of pH on the Cu2+ adsorption
The surface of clay depends very much on the pH of the exchange solution and
becomes negatively charged when the pH increases (Abdellaoui et al., 2019). In previous
work, the anthracene-9,10-dione based chromogenic sensor was designed which
possessed three amine nitrogens (alkyl amine, pyridyl amine and aryl amine) with
distinctly different pKa values. The chemosensor showed pH dependent colour changes
with Cu2+ at pH 4.0 (Kaur & Kumar, 2008). Therefore, the removal of Cu2+ from aqueous
solution not only depended on negatively charged of Mt surface, but also largely
depended on L properties. In acidic pH solution, the N donor atoms of L were protonated
and deprotonated after Cu2+ was added. Moreover, the solution containing the soluble
Cu(NO3)2·3H2O is made basic with sodium hydroxide. Copper (II) hydroxide, Cu(OH)2,
a light blue color precipitate, precipitates from the solution (Singh, Ojha, & Srivastava,
2009).
Cu(NO3)2(aq) + 2NaOH(aq) Cu(OH)2(s) + NaNO3(aq)
Therefore, the effect of pH on the Cu2+removal efficiency was investigated at acidic pH
values ranging from 3 to 5 with 3.5010-3 M of Cu2+ and 40.0 g/L of Mt-L (Figure 4).
The results displayed the maximum removal efficiency at pH 5. Therefore, Mt-L could
adsorb Cu2+ well at mild acidic conditions. However, the pH value less than 5 caused a
Page 11 of 31
For Proof Read only
Songklanakarin Journal of Science and Technology SJST-2019-0273.R2 Thongkum
123456789101112131415161718192021222324252627282930313233343536373839404142434445464748495051525354555657585960

For Review Only
decrease in the percentage of removal efficiency from 54% to 43% at 120 min because
the Mt-L surface became net positive charge at these pH and there was an electrostatic
repulsion between the positively charged surface and the Cu2+ (Tiwari et al., 2014).
Figure 4 The effect of pH on the removal of Cu2+ ([Cu2+] 3.5010-3 M and Mt-L 40.0
g/L).
3.4 The effect of Cu2+ concentrations
The effect of Cu2+ concentration on the removal efficiency was examined at initial
Cu2+ concentrations from 2.5010-3 to 4.5010-3 M using Mt-L of 40.0 g/L at an initial
pH of 5.0 (Figure 5). An increase in the Cu2+ concentration from 3.5010-3 to 4.5010-3
M caused a decrease in the percentage of removal of Cu2+ from 54% to 40% at 120 min.
The results were in agreement with previous reports that at low concentrations of
adsorbate, an excess of active sites was available for adsorption (Derakhshani &
Naghizadeh, 2018; Tiwari et al., 2014); so a decrease in percentage of removal efficiency
was obtained at higher Cu2+ concentrations due to the limited number of active sites on
Mt-L surface. However, the removal efficiency had no significant differences between
2.5010-3 and 3.5010-3 M.
Figure 5 The effect of initial Cu2+ concentration on the removal of Cu2+ by Mt-L
(Mt-L 40.0 g/L and pH 5).
3.5 The adsorption kinetic and the adsorption isotherm studies
Page 12 of 31
For Proof Read only
Songklanakarin Journal of Science and Technology SJST-2019-0273.R2 Thongkum
123456789101112131415161718192021222324252627282930313233343536373839404142434445464748495051525354555657585960

For Review Only
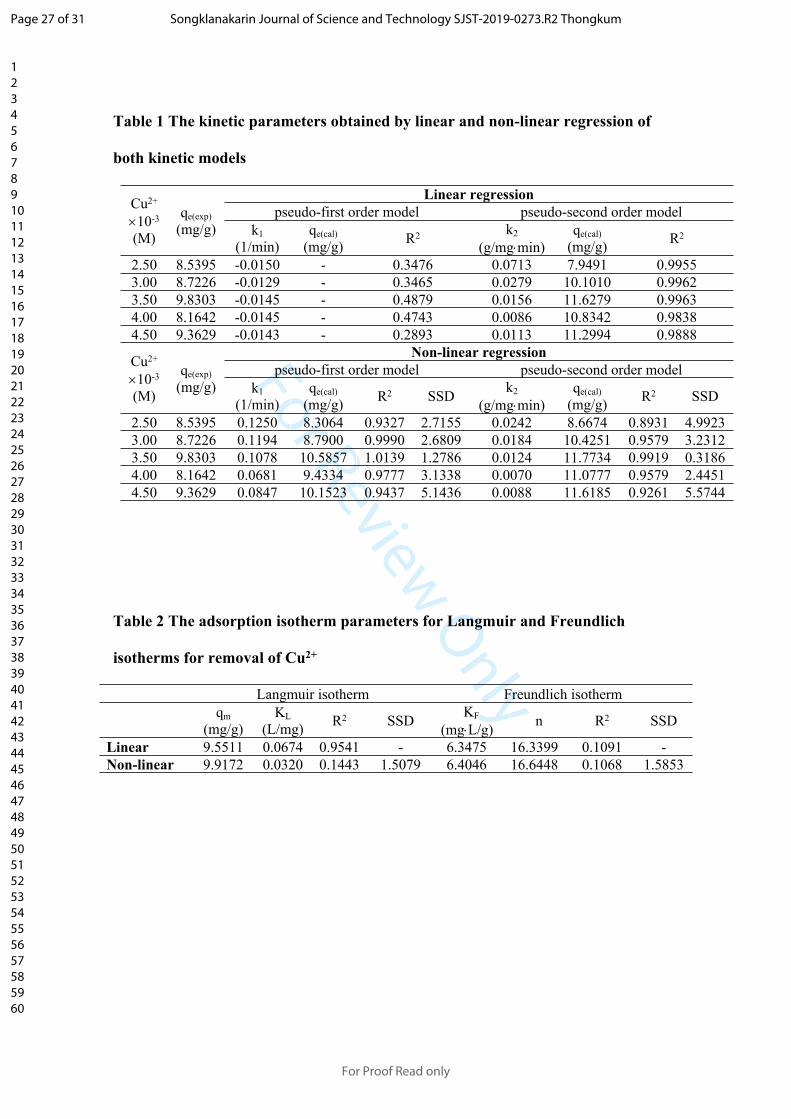
The adsorption kinetic was studied by using linear and non-linear forms of
pseudo-first order and pseudo-second order models. The non-linear least-squares curve
fitting has been applied by using the solver, Excel’s powerful optimization package. The
adsorption data of different Cu2+concentrations had the best fitting to pseudo-second
order of linear model with R2 = 0.9963-0.9888 and exhibited higher R2 than the non-linear
form (Figure 6). Moreover, when the initial Cu2+ concentration increased from 2.5010-3
to 3.5010-3 M, the values of qe were increased which corresponded to this model in
which it described the chemical adsorption through coordinate covalent bond between
Mt-L and Cu2+, and electrostatic force between negative charge of clay surface and
positive charge of Cu2+. The kinetic parameters obtained from the linear and non-linear
regression are summarized in Table 1.
Figure 6 The linear and non-linear plots of pseudo-second order model on the
Cu2+ removal by Mt-L (Mt-L 40.0 g/L and pH 5).
Table 1 The kinetic parameters obtained by linear and non-linear regression of both kinetic models
The adsorption isotherms were evaluated using the models of Langmuir and
Freundlich (Figure 7) and the adsorption parameters are presented in Table 2. The best
model for the adsorption of Cu2+ was Langmuir isotherm with R2 = 0.9541 for the linear
regression that described the chemisorption and monolayer coverage of Cu2+ onto Mt-L.
In addition, the value of 1/n less than 1 (0.0612) confirmed that the adsorption of Cu2+
ions onto adsorbent surface was chemical favorable.
Page 13 of 31
For Proof Read only
Songklanakarin Journal of Science and Technology SJST-2019-0273.R2 Thongkum
123456789101112131415161718192021222324252627282930313233343536373839404142434445464748495051525354555657585960
For Review Only
Figure 7 The linear plots of (1) Langmuir isotherm and (2) Freundlich isotherm on the
Cu2+ adsorption by Mt-L ([Cu2+] 2.50-4.5010-3 M, Mt-L 40.0 g/L, pH 5).
Table 2 The adsorption isotherm parameters for Langmuir and Freundlich isotherms for
removal of Cu2+
3.6 Comparative study of Cu2+ removal by Mt and Mt-L
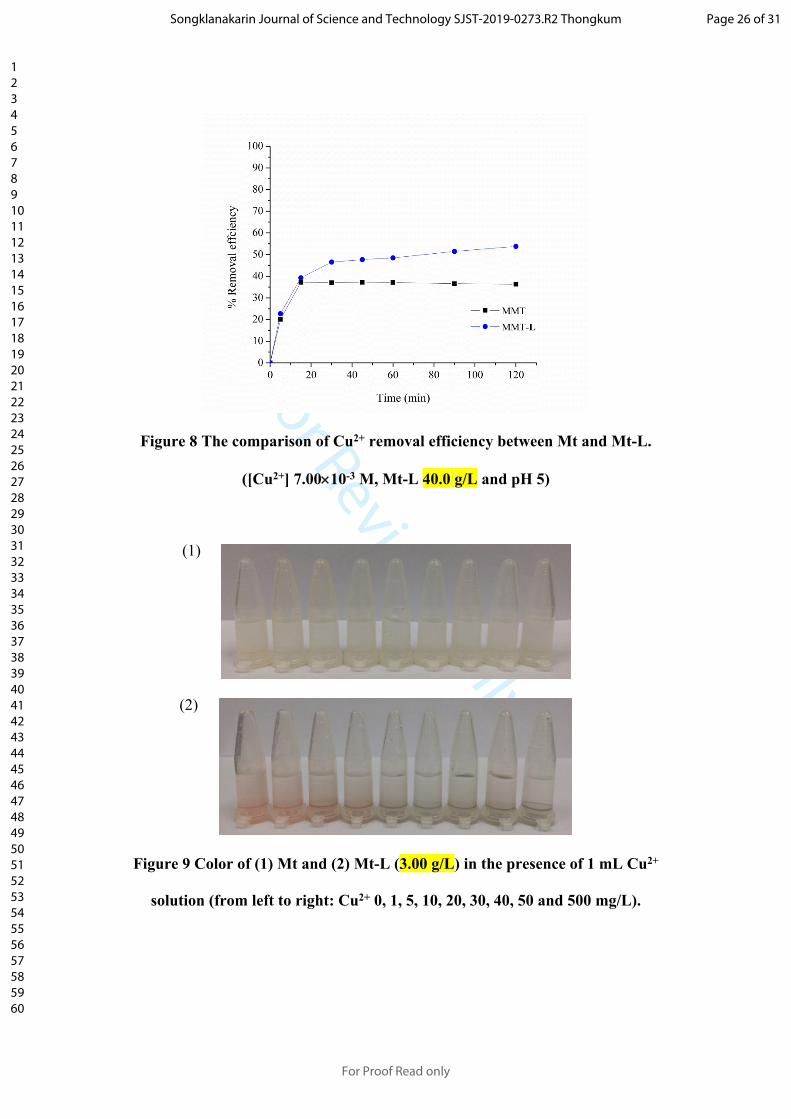
The comparison between Mt and Mt-L on the Cu2+ removal efficiency was
performed with an initial Cu2+ concentration of 3.5010-3 M, 40.0 g/L of adsorbent and
an initial pH of 5.0. From the obtained data, the adsorption of Cu2+ was high in the
presence of L on Mt surface with the 54% of removal efficiency while Mt was 36%
(Figure 8). The maximum adsorption capacity (qm) determined by the Langmuir model
was 9.5511 mg/g which was higher than that of Cu2+ on Mt with qm at 7.5643 mg/g. This
may be the reason that L could coordinate with Cu2+ via coordinate covalent bond that
improved the adsorption capacity. In agreement with previous reports, the adsorption of
Cu2+ on montmorillonite has been shown to follow Langmuir isotherm with qm at 7.6160
mg/g (Ijagbemi, Baek, & Kim, 2009), 2.6260 mg/g (Datta et al., 2015) and the adsorption
capacity was increased by surface modification (Sdiri, Higashi, Hatta, Jamoussi, & Tase,
2011; Wu et al., 2011). Moreover, Mt-L behaved a naked-eye detectable color change
from red-orange to blue upon the adsorption of 10 mg/L Cu2+ (Figure 9) because Cu2+ can
induce deprotonation of NH group of L cause an internal charge transfer (ICT), which
can observed as a color change from red-orange to blue (Wu, Huang, & Du, 2009). These
results confirmed the interaction between Cu2+ and modified Mt surface while the binding
between Mt and Cu2+ without L did not show any color change.
Page 14 of 31
For Proof Read only
Songklanakarin Journal of Science and Technology SJST-2019-0273.R2 Thongkum
123456789101112131415161718192021222324252627282930313233343536373839404142434445464748495051525354555657585960
For Review Only
Figure 8 The comparison of Cu2+ removal efficiency between Mt and Mt-L. ([Cu2+]
7.0010-3 M, Mt-L 40.0 g/L and pH 5).
Figure 9 Color of (1) Mt and (2) Mt-L (3.00 g/L) in the presence of 1 mL Cu2+ solution
(from left to right: Cu2+ 0, 1, 5, 10, 20, 30, 40, 50 and 500 mg/L).
4. Conclusions
The montmorillonite was modified with alkylamine chloroanthraquinone
molecule to use as adsorbent and colorimetric sensor for separation and detection of Cu2+
from aqueous solution. The results showed the maximum adsorption efficiency of 54%
with an initial Cu2+ concentration of 3.5010-3 M, 40.0 g/L of Mt-L and an initial pH of
5.0. The adsorption results could be confirmed by necked-eye as well with generating a
color change from red-orange to blue upon addition Cu2+ to colloidal solution of Mt-L.
The adsorption kinetic displayed the linear regression of the pseudo-second order model
with R2 = 0.99 that described the chemical adsorption. The adsorption isotherm
corresponded to the Langmuir isotherm that based on the assumption of monolayer
coverage on homogeneous adsorbent. The maximum adsorption capacity (qm) was
calculated to be 9.5511 mg/g that was higher than some previous reports. Therefore, Mt-L
was a great potential adsorbent and a powerful colorimetric sensor for Cu2+ ion in an
aqueous solution.
Acknowledgments
Page 15 of 31
For Proof Read only
Songklanakarin Journal of Science and Technology SJST-2019-0273.R2 Thongkum
123456789101112131415161718192021222324252627282930313233343536373839404142434445464748495051525354555657585960
For Review Only
Financial support for Undergraduate Thesis has been provided by Department of
Chemistry, Faculty of Science, Naresuan University.
References
Abdellaoui, Y., Olguín, M.T., Abatal, M., Ali, B., Díaz Méndez, S.E., & Santiago, A.A.
(2019). Comparison of the divalent heavy metals (Pb, Cu and Cd) adsorption
behavior by montmorillonite-KSF and their calcium- and sodium-forms .
Superlattices and Microstructures, 127, 165-175.
https://doi.org/10.1016/j.spmi.2017.11.061
Baseri, H., & Tizro, S. (2017). Treatment of nickel ions from contaminated water by
magnetite based nanocomposite adsorbents: Effects of thermodynamic and
kinetic parameters and modeling with Langmuir and Freundlich isotherms.
Process Safety and Environmental Protection, 109, 465-477.
https://doi.org/10.1016/j.psep.2017.04.022
Bhattacharyya, K.G., & Gupta, S.S. (2008). Adsorption of a few heavy metals on
natural and modified kaolinite and montmorillonite: A review. Advances in
Colloid and Interface Science, 140, 114-131.
https://doi.org/10.1016/j.cis.2007.12.008
Borchard, S., Bork, F., Rieder, T., Eberhagen, C., Popper, B., Lichtmannegger, J., . . .
Zischka, H. (2018). The exceptional sensitivity of brain mitochondria to
copper. Toxicology in Vitro, 51, 11-22.
https://doi.org/10.1016/j.tiv.2018.04.012
Burakov, A.E., Galunin, E.V., Burakova, I.V., Kucherova, A.E., Agarwal, S., Tkachev,
A.G., & Gupta, V.K. (2018). Adsorption of heavy metals on conventional and
Page 16 of 31
For Proof Read only
Songklanakarin Journal of Science and Technology SJST-2019-0273.R2 Thongkum
123456789101112131415161718192021222324252627282930313233343536373839404142434445464748495051525354555657585960

For Review Only
nanostructured materials for wastewater treatment purposes: A review.
Ecotoxicology and Environmental Safety, 148, 702-712.
https://doi.org/10.1016/j.ecoenv.2017.11.034
Datta, D., Uslu, H., & Kumar, S. (2015). Adsorptive separation of Cu2+ from an
aqueous solution using trioctylamine supported montmorillonite. Journal of
Chemical & Engineering Data, 60, 3193-3200. doi: 10.1021/acs.jced.5b00413
Derakhshani, E., & Naghizadeh, A. (2018). Optimization of humic acid removal by
adsorption onto bentonite and montmorillonite nanoparticles. Journal of
Molecular Liquids, 259, 76-81. https://doi.org/10.1016/j.molliq.2018.03.014
Fan, H., Zhou, L., Jiang, X., Huang, Q., & Lang, W. (2014). Adsorption of Cu2+ and
methylene blue on dodecyl sulfobetaine surfactant-modified montmorillonite.
Applied Clay Science, 95, 150-158. https://doi.org/10.1016/j.clay.2014.04.001
Gonçalves dos Santos, V.C., Grassi, M.T., & Abate, G. (2015). Sorption of Hg(II) by
modified K10 montmorillonite: Influence of pH, ionic strength and the
treatment with different cations. Geoderma, 237-238, 129-136.
https://doi.org/10.1016/j.geoderma.2014.08.018
Hu, C., Li, G., Wang, Y., Li, F., Guo, G., & Hu, H. (2017a). The effect of pH on the
bonding of Cu2+and chitosan-montmorillonitecomposite. International Journal
of Biological Macromolecules, 103, 751-757.
https://doi.org/10.1016/j.ijbiomac.2017.05.065
Hu, C., Zhu, P., Cai, M., Hu, H., & Fu, Q. (2017b). Comparative adsorption of Pb(II),
Cu(II) and Cd(II) on chitosan saturated montmorillonite: Kinetic,
thermodynamic and equilibrium studies. Applied Clay Science, 143, 320-326.
https://doi.org/10.1016/j.clay.2017.04.005
Page 17 of 31
For Proof Read only
Songklanakarin Journal of Science and Technology SJST-2019-0273.R2 Thongkum
123456789101112131415161718192021222324252627282930313233343536373839404142434445464748495051525354555657585960

For Review Only
Hu, W., Lu, S., Song, W., Chen, T., Hayat, T., Alsaedi, A.S., Chen, C. & Liu, H.
(2018). Competitive adsorption of U(VI) and Co(II) on montmorillonite: A
batch and spectroscopic approach. Applied Clay Science, 157, 121-129.
https://doi.org/10.1016/j.clay.2018.02.030
Ijagbemi, C.O., Baek, M.H., & Kim, D.S. (2009). Montmorillonite surface properties
and sorption characteristics for heavy metal removal from aqueous solutions,
Journal of Hazardous Materials, 166, 538-546.
https://doi.org/10.1016/j.jhazmat.2008.11.085
Kaur, N., & Kumar, S. (2008). A differential receptor for selective and quantitative
multi-ion analysis for Co2+ and Ni2+/Cu2+. Tetrahedron Letters, 49, 5067-
5069. https://doi.org/10.1016/j.tetlet.2008.06.023
Molu, Z.B., & Yurdakoc, K. (2010). Preparation and characterization of aluminum
pillared K10 and KSF for adsorption of trimethoprim. Microporous and
Mesoporous Materials, 127, 50-60.
https://doi.org/10.1016/j.micromeso.2009.06.027
Ranyuk, E., Uglov, A., Meyer, M., Lemeune, A.B., Denat, F., Averin, A., . . . Guilard,
R. (2011). Rational design of aminoanthraquinones for colorimetric detection
of heavy metal ions in aqueous solution. Dalton Transactions, 40, 10491-
10502. doi: 10.1039/c1dt10677e
Rasouli, F., Aber, S., Salari, D., & Khataee, A.R. (2014). Optimized removal of
Reactive Navy Blue SP-BR by organo-montmorillonite based adsorbents
through central composite design. Applied Clay Science, 87, 228-234.
https://doi.org/10.1016/j.clay.2013.11.010
Page 18 of 31
For Proof Read only
Songklanakarin Journal of Science and Technology SJST-2019-0273.R2 Thongkum
123456789101112131415161718192021222324252627282930313233343536373839404142434445464748495051525354555657585960

For Review Only
Roberts, E.A. (2011). Wilson’s disease. Medicine, 39, 602-604.
https://doi.org/10.1016/j.mpmed.2011.08.006
Sdiri, A., Higashi, T., Hatta, T., Jamoussi, F., & Tase, N. (2011). Evaluating the
adsorptive capacity of montmorillonitic and calcareous clays on the removal of
several heavy metals in aqueous systems. Chemical Engineering Journal, 172,
37-46. https://doi.org/10.1016/j.cej.2011.05.015
Shirzad-Siboni, M., Khataee, A., Hassani, A., & Karaca, S. (2015). Preparation,
characterization and application of a CTAB-modified nanoclay for the
adsorption of an herbicide from aqueous solutions: Kinetic and equilibrium
studies. Comptes Rendus Chimie, 18, 204-214.
https://doi.org/10.1016/j.crci.2014.06.004
Singh, D.P., Ojha, A.K. & Srivastava, O.N. (2009). Synthesis of different Cu(OH)2 and
CuO (nanowires, rectangles, seed-, belt-, and sheetlike) nanostructures by
simple wet chemical route. The Journal of Physical Chemistry C, 113, 3409-
3418. https://doi.org/10.1021/jp804832g
Squitti, R., Ghidoni, R., Simonelli, I., Ivanova, I.D., Colabufo, N. A., Zuin, M., Benussi,
L., Binetti, G., Cassetta, E., Rongioletti, M., & Siotto, M. (2018). Copper
dyshomeostasis in Wilson disease and Alzheimer's disease as shown by serum
and urine copper indicators. Journal of Trace Elements in Medicine and
Biology, 45,181-188. https://doi.org/10.1016/j.jtemb.2017.11.005
Tiwari, D., Lalhmunsiama, Choi, S.I., & Lee, S.M. (2014). Activated Sericite: An
efficient and effective natural clay material for attenuation of cesium from
aquatic environment. Pedosphere, 24(6), 731-742.
https://doi.org/10.1016/S1002-0160(14)60060-6
Page 19 of 31
For Proof Read only
Songklanakarin Journal of Science and Technology SJST-2019-0273.R2 Thongkum
123456789101112131415161718192021222324252627282930313233343536373839404142434445464748495051525354555657585960
For Review Only
Uddin, M.K. (2017). A review on the adsorption of heavy metals by clay minerals, with
special focus on the past decade. Chemical Engineering Journal, 308, 438-462.
https://doi.org/10.1016/j.cej.2016.09.029
Wu, P., Zhang, Q., Dai, Y., Zhu, N., Dang, Z., Li, P., . . . Wang, X. (2011). Adsorption
of Cu(II), Cd(II) and Cr(III) ions from aqueous solutions on humic acid
modified Ca-montmorillonite. Geoderma, 164, 215-219.
https://doi.org/10.1016/j.geoderma.2011.06.012
Wu, S.P., Huang, R.Y., & Du, K.J. (2009). Colorimetric sensing of Cu(II) by 2-methyl-
3-[(pyridin-2-ylmethyl)-amino]-1,4-naphthoquinone: Cu(II) induced
deprotonation of NH responsible for color changes. Dalton Transactions,
4736-4740. doi: 10.1039/b822613j
Page 20 of 31
For Proof Read only
Songklanakarin Journal of Science and Technology SJST-2019-0273.R2 Thongkum
123456789101112131415161718192021222324252627282930313233343536373839404142434445464748495051525354555657585960

For Review Only
Figure 1 The ATR-FTIR spectra of (1) L (2) Mt and (3) Mt-L.
Page 21 of 31
For Proof Read only
Songklanakarin Journal of Science and Technology SJST-2019-0273.R2 Thongkum
123456789101112131415161718192021222324252627282930313233343536373839404142434445464748495051525354555657585960
For Review Only
Figure 2 The XRD spectra of (1) Mt and (2) Mt-L.
Figure 3 The effect of Mt-L amounts on the removal of Cu2+ ([Cu2+] 3.5010-3 M).
Page 22 of 31
For Proof Read only
Songklanakarin Journal of Science and Technology SJST-2019-0273.R2 Thongkum
123456789101112131415161718192021222324252627282930313233343536373839404142434445464748495051525354555657585960

For Review Only
Figure 4 The effect of pH on the removal of Cu2+ ([Cu2+] 3.5010-3 M and Mt-L
40.0 g/L).
Figure 5 The effect of initial Cu2+ concentration on the removal of Cu2+ by Mt-L
(Mt-L 40.0 g/L and pH 5).
Page 23 of 31
For Proof Read only
Songklanakarin Journal of Science and Technology SJST-2019-0273.R2 Thongkum
123456789101112131415161718192021222324252627282930313233343536373839404142434445464748495051525354555657585960

For Review Only
Figure 6 The linear and non-linear plots of pseudo-second order model on the Cu2+
removal by Mt-L (Mt-L 40.0 g/L and pH 5).
Page 24 of 31
For Proof Read only
Songklanakarin Journal of Science and Technology SJST-2019-0273.R2 Thongkum
123456789101112131415161718192021222324252627282930313233343536373839404142434445464748495051525354555657585960

For Review Only
Figure 7 The linear plots of (1) Langmuir isotherm and (2) Freundlich isotherm on
the Cu2+ adsorption by Mt-L ([Cu2+] 2.50-4.5010-3 M, Mt-L 40.0 g/L, pH 5).
Page 25 of 31
For Proof Read only
Songklanakarin Journal of Science and Technology SJST-2019-0273.R2 Thongkum
123456789101112131415161718192021222324252627282930313233343536373839404142434445464748495051525354555657585960
For Review Only
Figure 8 The comparison of Cu2+ removal efficiency between Mt and Mt-L.
([Cu2+] 7.0010-3 M, Mt-L 40.0 g/L and pH 5)
Figure 9 Color of (1) Mt and (2) Mt-L (3.00 g/L) in the presence of 1 mL Cu2+
solution (from left to right: Cu2+ 0, 1, 5, 10, 20, 30, 40, 50 and 500 mg/L).
(1)
(2)
Page 26 of 31
For Proof Read only
Songklanakarin Journal of Science and Technology SJST-2019-0273.R2 Thongkum
123456789101112131415161718192021222324252627282930313233343536373839404142434445464748495051525354555657585960
For Review Only
Table 1 The kinetic parameters obtained by linear and non-linear regression of
both kinetic models
Linear regressionpseudo-first order model pseudo-second order modelCu2+
10-3
(M)
qe(exp)(mg/g) k1
(1/min)qe(cal)
(mg/g) R2 k2
(g/mgmin)qe(cal)
(mg/g) R2
2.50 8.5395 -0.0150 - 0.3476 0.0713 7.9491 0.99553.00 8.7226 -0.0129 - 0.3465 0.0279 10.1010 0.99623.50 9.8303 -0.0145 - 0.4879 0.0156 11.6279 0.99634.00 8.1642 -0.0145 - 0.4743 0.0086 10.8342 0.98384.50 9.3629 -0.0143 - 0.2893 0.0113 11.2994 0.9888
Non-linear regressionpseudo-first order model pseudo-second order modelCu2+
10-3
(M)
qe(exp)(mg/g) k1
(1/min)qe(cal)
(mg/g) R2 SSD k2
(g/mgmin)qe(cal)
(mg/g) R2 SSD
2.50 8.5395 0.1250 8.3064 0.9327 2.7155 0.0242 8.6674 0.8931 4.99233.00 8.7226 0.1194 8.7900 0.9990 2.6809 0.0184 10.4251 0.9579 3.23123.50 9.8303 0.1078 10.5857 1.0139 1.2786 0.0124 11.7734 0.9919 0.31864.00 8.1642 0.0681 9.4334 0.9777 3.1338 0.0070 11.0777 0.9579 2.44514.50 9.3629 0.0847 10.1523 0.9437 5.1436 0.0088 11.6185 0.9261 5.5744
Table 2 The adsorption isotherm parameters for Langmuir and Freundlich
isotherms for removal of Cu2+
Langmuir isotherm Freundlich isothermqm
(mg/g)KL
(L/mg) R2 SSD KF
(mgL/g) n R2 SSD
Linear 9.5511 0.0674 0.9541 - 6.3475 16.3399 0.1091 -Non-linear 9.9172 0.0320 0.1443 1.5079 6.4046 16.6448 0.1068 1.5853
Page 27 of 31
For Proof Read only
Songklanakarin Journal of Science and Technology SJST-2019-0273.R2 Thongkum
123456789101112131415161718192021222324252627282930313233343536373839404142434445464748495051525354555657585960

For Review Only
Appendix
Figure S-1 The structure of alkylamine chloroanthraquinone sensor (L).
Figure S-2 The effect of initial Cu2+ concentration on the removal of Cu2+ by Mt-L
(Mt-L 40.0 g/L and pH 5) with error bars.
Page 28 of 31
For Proof Read only
Songklanakarin Journal of Science and Technology SJST-2019-0273.R2 Thongkum
123456789101112131415161718192021222324252627282930313233343536373839404142434445464748495051525354555657585960
For Review Only
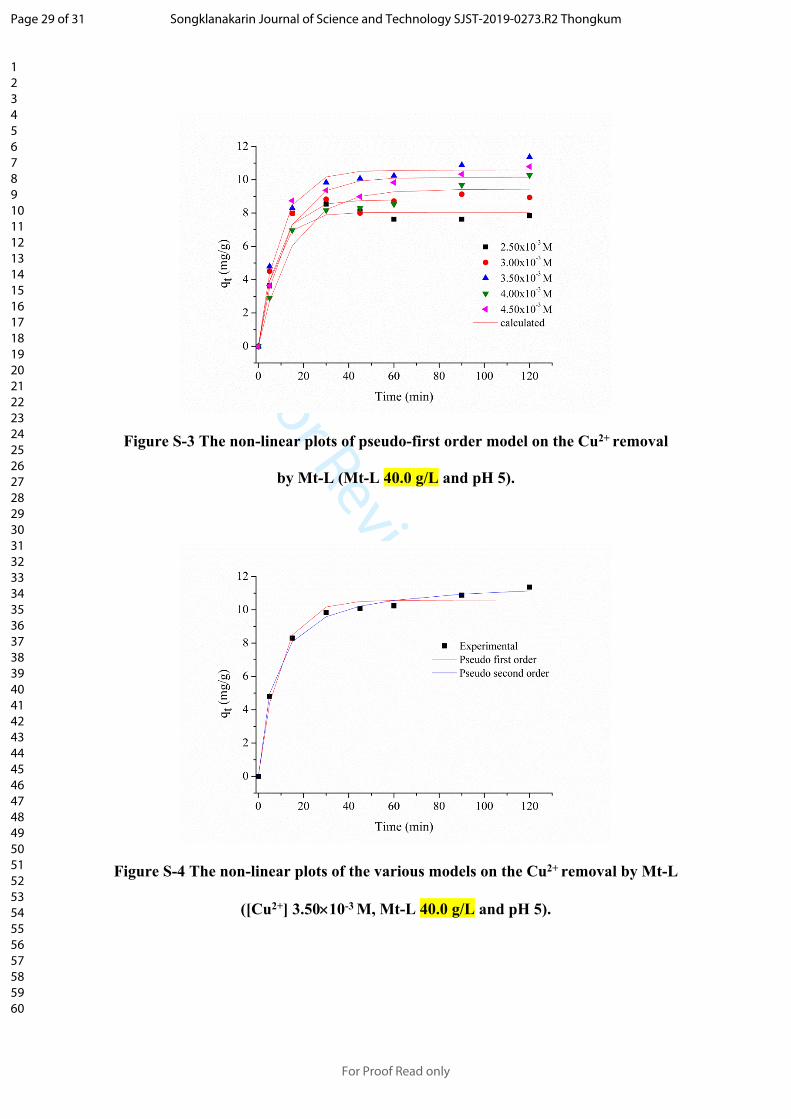
Figure S-3 The non-linear plots of pseudo-first order model on the Cu2+ removal
by Mt-L (Mt-L 40.0 g/L and pH 5).
Figure S-4 The non-linear plots of the various models on the Cu2+ removal by Mt-L
([Cu2+] 3.5010-3 M, Mt-L 40.0 g/L and pH 5).
Page 29 of 31
For Proof Read only
Songklanakarin Journal of Science and Technology SJST-2019-0273.R2 Thongkum
123456789101112131415161718192021222324252627282930313233343536373839404142434445464748495051525354555657585960

For Review Only
Figure S-5 The non-linear plot of Langmuir isotherm on the Cu2+ adsorption by
Mt-L ([Cu2+] 2.50-4.5010-3 M, Mt-L 40.0 g/L, pH 5).
Figure S-6 The non-linear plot of Freundlich isotherm on the Cu2+ adsorption by
Mt-L ([Cu2+] 2.50-4.5010-3 M, Mt-L 40.0 g/L, pH 5).
Page 30 of 31
For Proof Read only
Songklanakarin Journal of Science and Technology SJST-2019-0273.R2 Thongkum
123456789101112131415161718192021222324252627282930313233343536373839404142434445464748495051525354555657585960

For Review OnlyFigure S-7 Colorless solution of Cu2+ 1,000 mg/L
Page 31 of 31
For Proof Read only
Songklanakarin Journal of Science and Technology SJST-2019-0273.R2 Thongkum
123456789101112131415161718192021222324252627282930313233343536373839404142434445464748495051525354555657585960