Embed Size (px)
Citation preview
FOR RELEASE JANUARY 15, 2021
Biden Begins Presidency With Positive Ratings; Trump Departs With Lowest-Ever Job Mark 68% of public does not want Trump to remain a major political figure in the future
FOR MEDIA OR OTHER INQUIRIES:
Carroll Doherty, Director of Political Research Jocelyn Kiley, Associate Director, Research Nida Asheer, Communications Manager Calvin Jordan, Communications Associate
202.419.4372
www.pewresearch.org
RECOMMENDED CITATION
Pew Research Center, January, 2021, “Biden Begins Presidency With Positive Ratings; Trump Departs With Lowest-Ever Job Mark”
2 PEW RESEARCH CENTER
www.pewresearch.org
About Pew Research Center Pew Research Center is a nonpartisan fact tank that informs the public about the issues, attitudes and trends shaping the world. It does not take policy positions. The Center conducts public opinion polling, demographic research, content analysis and other data-driven social science research. It studies U.S. politics and policy; journalism and media; internet, science and technology; religion and public life; Hispanic trends; global attitudes and trends; and U.S. social and demographic trends. All of the Center’s reports are available at www.pewresearch.org. Pew Research Center is a subsidiary of The Pew Charitable Trusts, its primary funder.
© Pew Research Center 2021
3 PEW RESEARCH CENTER
www.pewresearch.org
How we did this Pew Research Center conducted this study to examine the public’s reactions to the aftermath of the 2020 presidential election, including a look into Americans’ views of Joe Biden as the president-elect and thoughts about the insurrection that took place at the Capitol earlier this month. For this analysis, we surveyed 5,360 U.S. adults in January 2021. Everyone who took part in this survey is a member of Pew Research Center’s American Trends Panel (ATP), an online survey panel that is recruited through national, random sampling of residential addresses. This way nearly all U.S. adults have a chance of selection. The survey is weighted to be representative of the U.S. adult population by gender, race, ethnicity, partisan affiliation, education and other categories. Read more about the ATP’s methodology.
Here are the questions used for the report, along with responses, and its methodology.
4 PEW RESEARCH CENTER
www.pewresearch.org
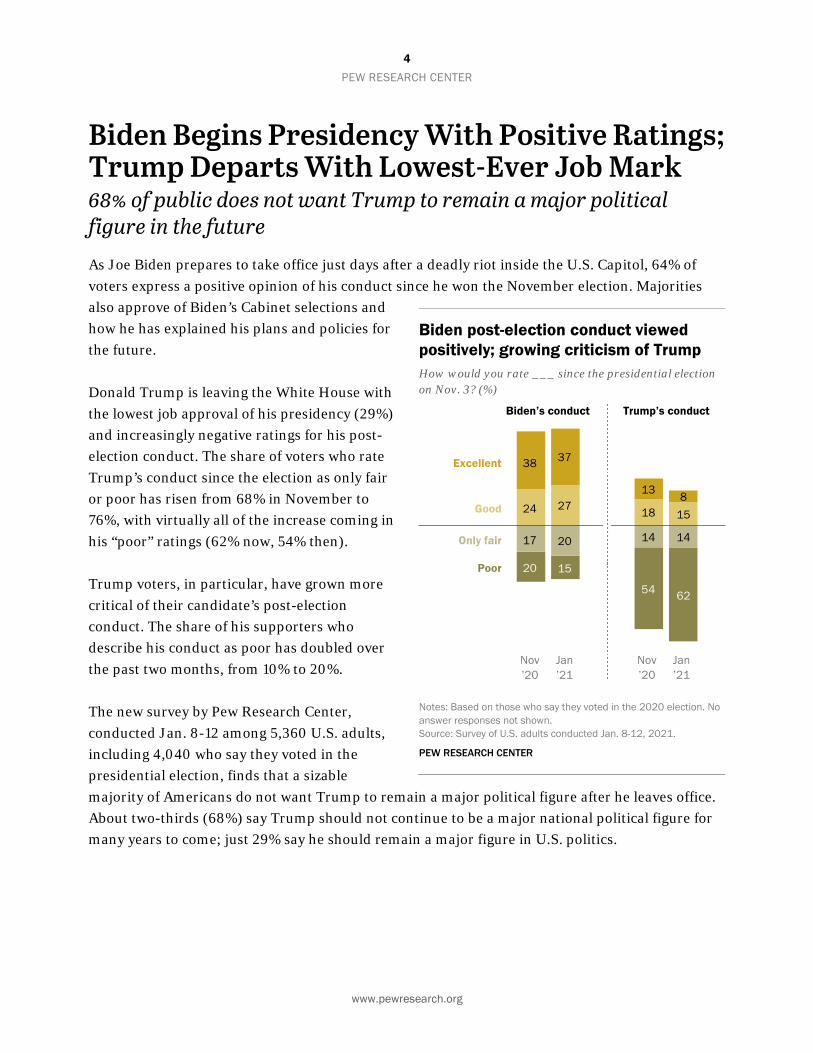
Biden Begins Presidency With Positive Ratings; Trump Departs With Lowest-Ever Job Mark 68% of public does not want Trump to remain a major political figure in the future As Joe Biden prepares to take office just days after a deadly riot inside the U.S. Capitol, 64% of voters express a positive opinion of his conduct since he won the November election. Majorities also approve of Biden’s Cabinet selections and how he has explained his plans and policies for the future.
Donald Trump is leaving the White House with the lowest job approval of his presidency (29%) and increasingly negative ratings for his post-election conduct. The share of voters who rate Trump’s conduct since the election as only fair or poor has risen from 68% in November to 76%, with virtually all of the increase coming in his “poor” ratings (62% now, 54% then).
Trump voters, in particular, have grown more critical of their candidate’s post-election conduct. The share of his supporters who describe his conduct as poor has doubled over the past two months, from 10% to 20%.
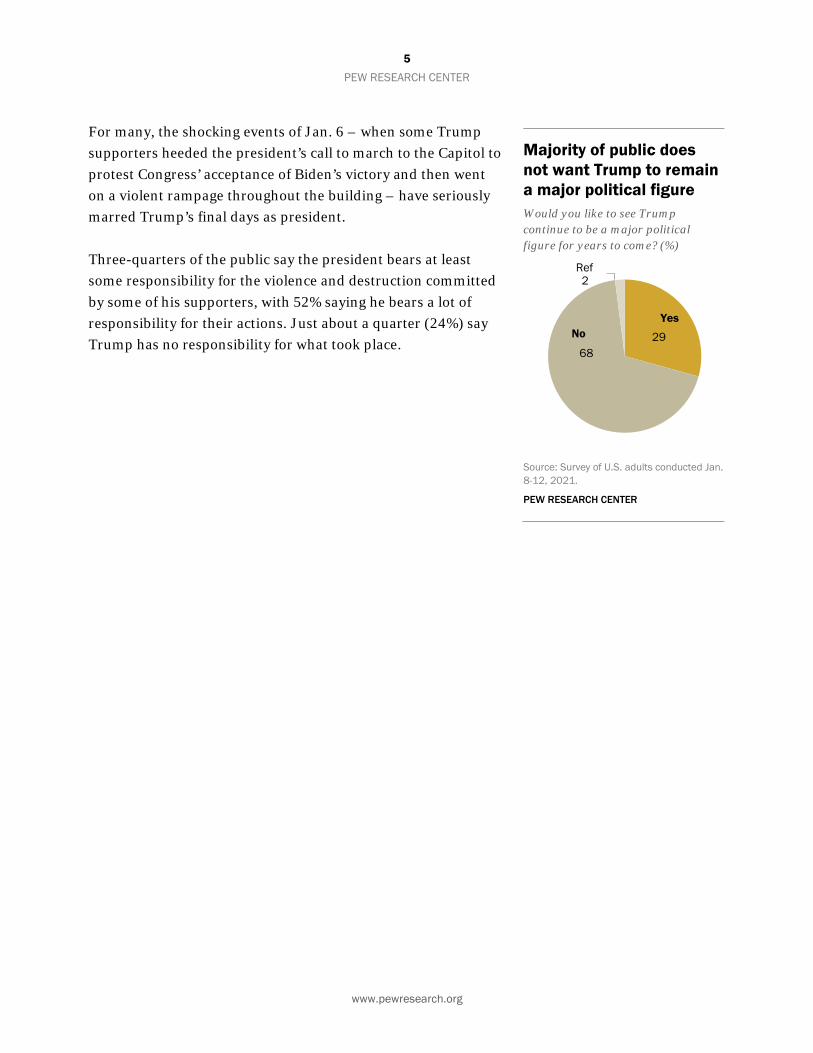
The new survey by Pew Research Center, conducted Jan. 8-12 among 5,360 U.S. adults, including 4,040 who say they voted in the presidential election, finds that a sizable majority of Americans do not want Trump to remain a major political figure after he leaves office. About two-thirds (68%) say Trump should not continue to be a major national political figure for many years to come; just 29% say he should remain a major figure in U.S. politics.
Biden post-election conduct viewed positively; growing criticism of Trump How would you rate ___ since the presidential election on Nov. 3? (%)
Notes: Based on those who say they voted in the 2020 election. No answer responses not shown. Source: Survey of U.S. adults conducted Jan. 8-12, 2021.
PEW RESEARCH CENTER
5 PEW RESEARCH CENTER
www.pewresearch.org
For many, the shocking events of Jan. 6 – when some Trump supporters heeded the president’s call to march to the Capitol to protest Congress’ acceptance of Biden’s victory and then went on a violent rampage throughout the building – have seriously marred Trump’s final days as president.
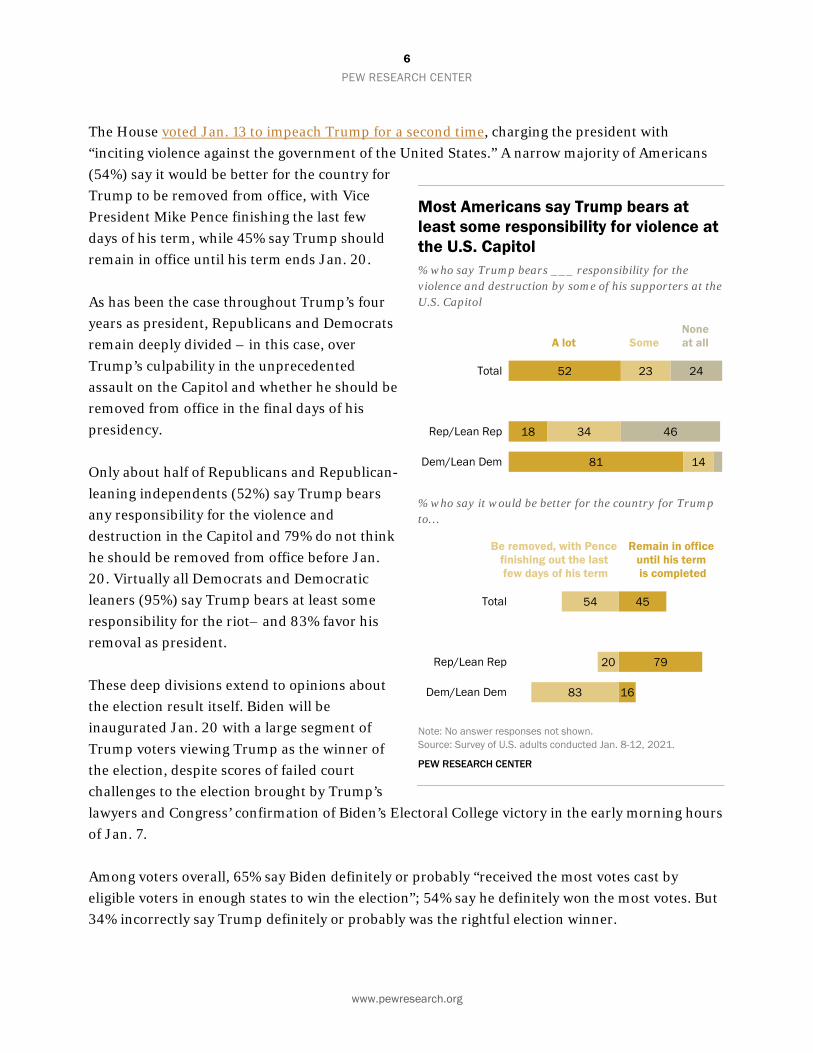
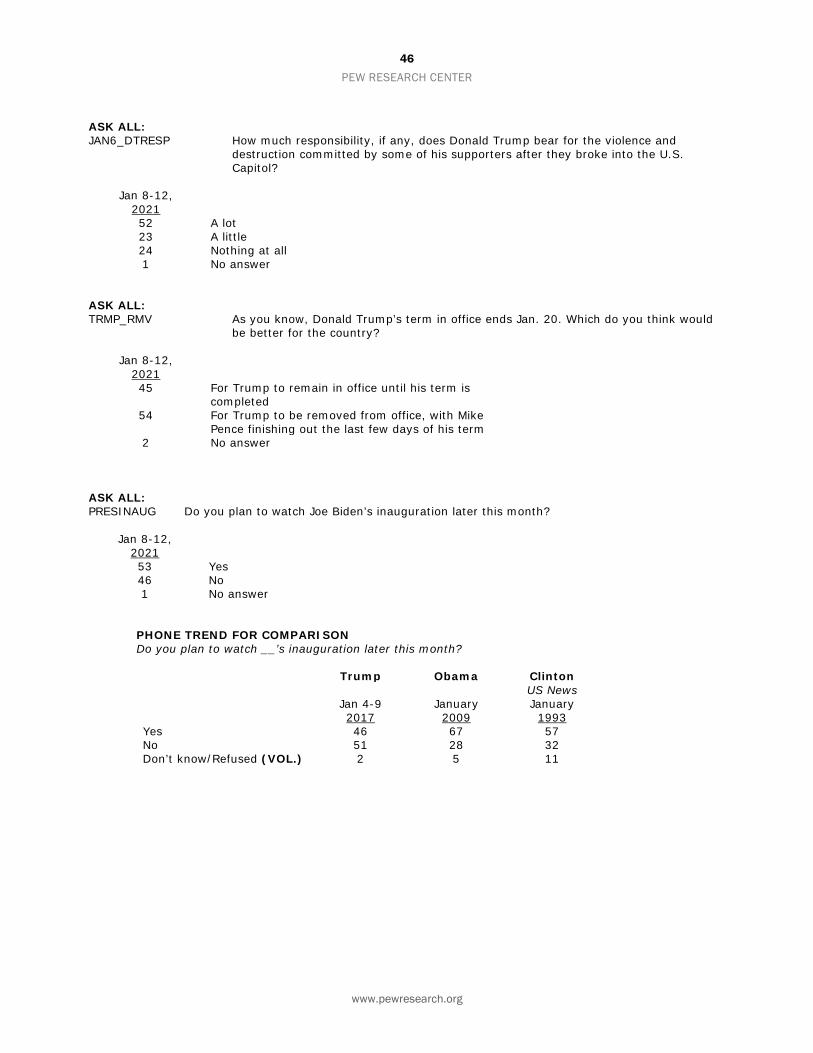
Three-quarters of the public say the president bears at least some responsibility for the violence and destruction committed by some of his supporters, with 52% saying he bears a lot of responsibility for their actions. Just about a quarter (24%) say Trump has no responsibility for what took place.
Majority of public does not want Trump to remain a major political figure Would you like to see Trump continue to be a major political figure for years to come? (%)
Source: Survey of U.S. adults conducted Jan. 8-12, 2021.
PEW RESEARCH CENTER
2968
2Ref
NoYes
6 PEW RESEARCH CENTER
www.pewresearch.org
The House voted Jan. 13 to impeach Trump for a second time, charging the president with “inciting violence against the government of the United States.” A narrow majority of Americans (54%) say it would be better for the country for Trump to be removed from office, with Vice President Mike Pence finishing the last few days of his term, while 45% say Trump should remain in office until his term ends Jan. 20.
As has been the case throughout Trump’s four years as president, Republicans and Democrats remain deeply divided – in this case, over Trump’s culpability in the unprecedented assault on the Capitol and whether he should be removed from office in the final days of his presidency.
Only about half of Republicans and Republican-leaning independents (52%) say Trump bears any responsibility for the violence and destruction in the Capitol and 79% do not think he should be removed from office before Jan. 20. Virtually all Democrats and Democratic leaners (95%) say Trump bears at least some responsibility for the riot– and 83% favor his removal as president.
These deep divisions extend to opinions about the election result itself. Biden will be inaugurated Jan. 20 with a large segment of Trump voters viewing Trump as the winner of the election, despite scores of failed court challenges to the election brought by Trump’s lawyers and Congress’ confirmation of Biden’s Electoral College victory in the early morning hours of Jan. 7.
Among voters overall, 65% say Biden definitely or probably “received the most votes cast by eligible voters in enough states to win the election”; 54% say he definitely won the most votes. But 34% incorrectly say Trump definitely or probably was the rightful election winner.
Most Americans say Trump bears at least some responsibility for violence at the U.S. Capitol % who say Trump bears ___ responsibility for the violence and destruction by some of his supporters at the U.S. Capitol
% who say it would be better for the country for Trump to…
Note: No answer responses not shown. Source: Survey of U.S. adults conducted Jan. 8-12, 2021.
PEW RESEARCH CENTER
52
18
81
23
34
14
24
46
Total
Rep/Lean Rep
Dem/Lean Dem
A lot SomeNoneat all
45
79
16
54
20
83
Total
Rep/Lean Rep
Dem/Lean Dem
Remain in office until his term is completed
Be removed, with Pence finishing out the last few days of his term
7 PEW RESEARCH CENTER
www.pewresearch.org
The survey provides new insights into how Republicans and Republican leaners – a broader group than just Trump voters – view the president as he prepares to exit the White House. Democrats continue to be uniformly critical of Trump.
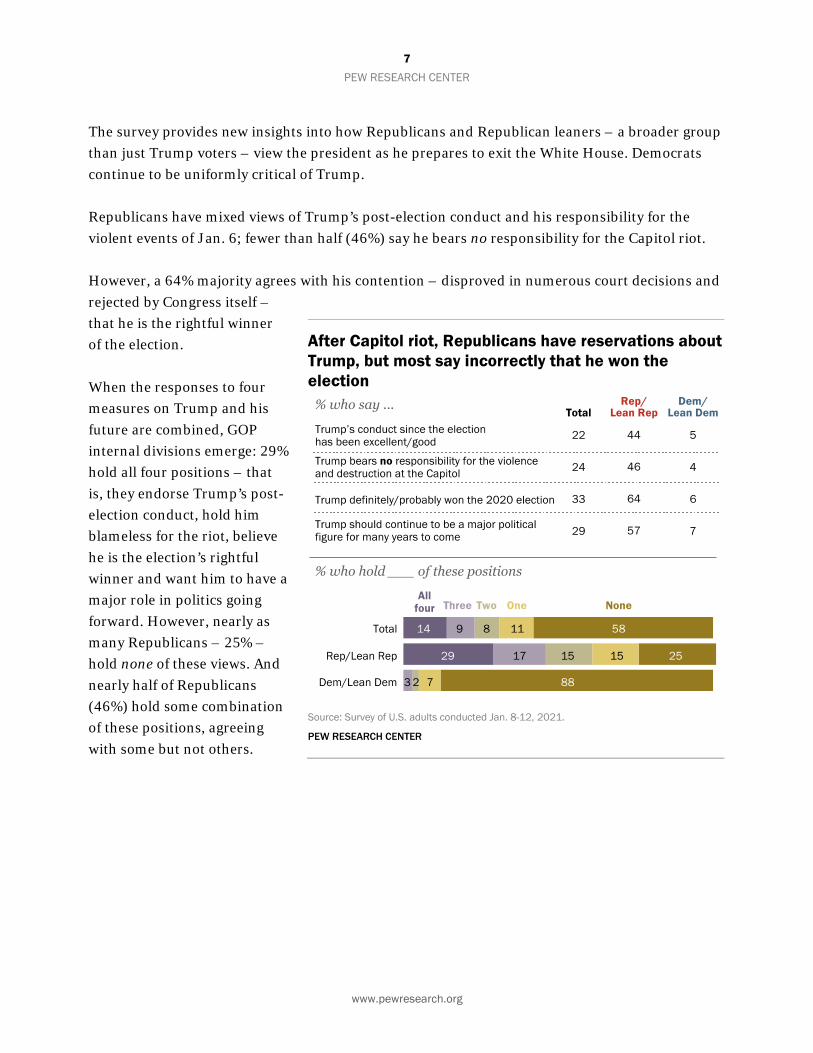
Republicans have mixed views of Trump’s post-election conduct and his responsibility for the violent events of Jan. 6; fewer than half (46%) say he bears no responsibility for the Capitol riot.
However, a 64% majority agrees with his contention – disproved in numerous court decisions and rejected by Congress itself – that he is the rightful winner of the election.
When the responses to four measures on Trump and his future are combined, GOP internal divisions emerge: 29% hold all four positions – that is, they endorse Trump’s post-election conduct, hold him blameless for the riot, believe he is the election’s rightful winner and want him to have a major role in politics going forward. However, nearly as many Republicans – 25% – hold none of these views. And nearly half of Republicans (46%) hold some combination of these positions, agreeing with some but not others.
After Capitol riot, Republicans have reservations about Trump, but most say incorrectly that he won the election
Source: Survey of U.S. adults conducted Jan. 8-12, 2021.
PEW RESEARCH CENTER
8 PEW RESEARCH CENTER
www.pewresearch.org
Biden enters office on a positive note
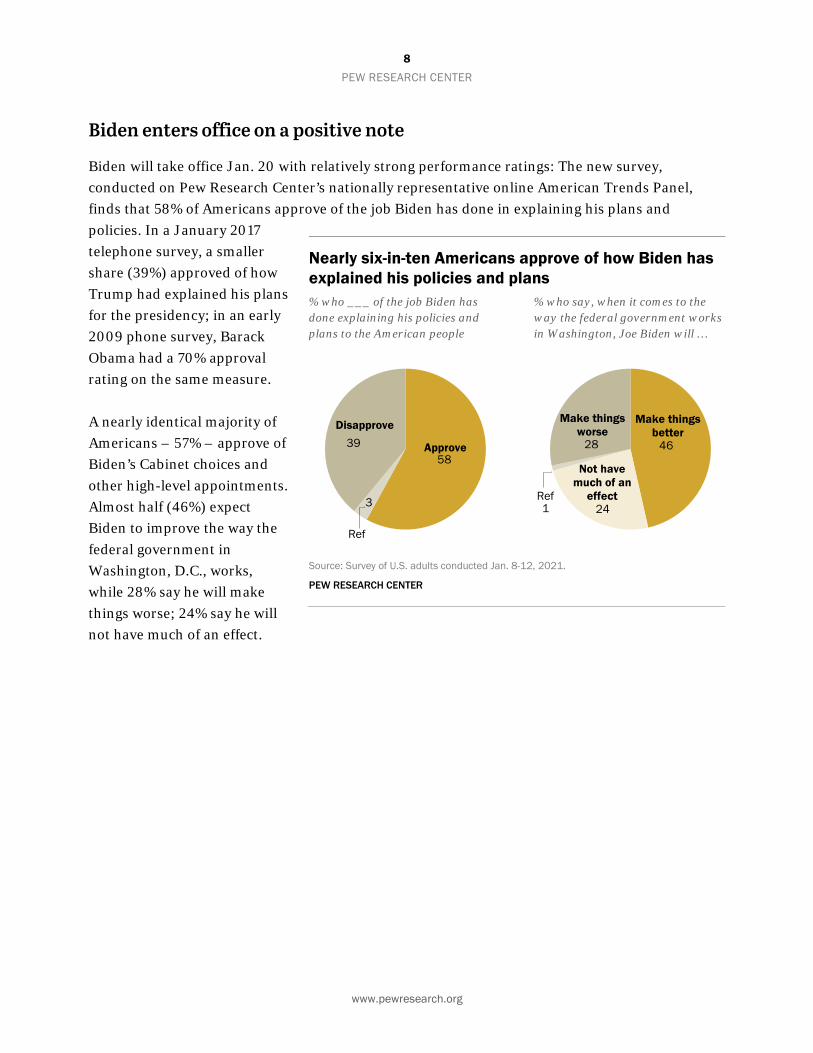
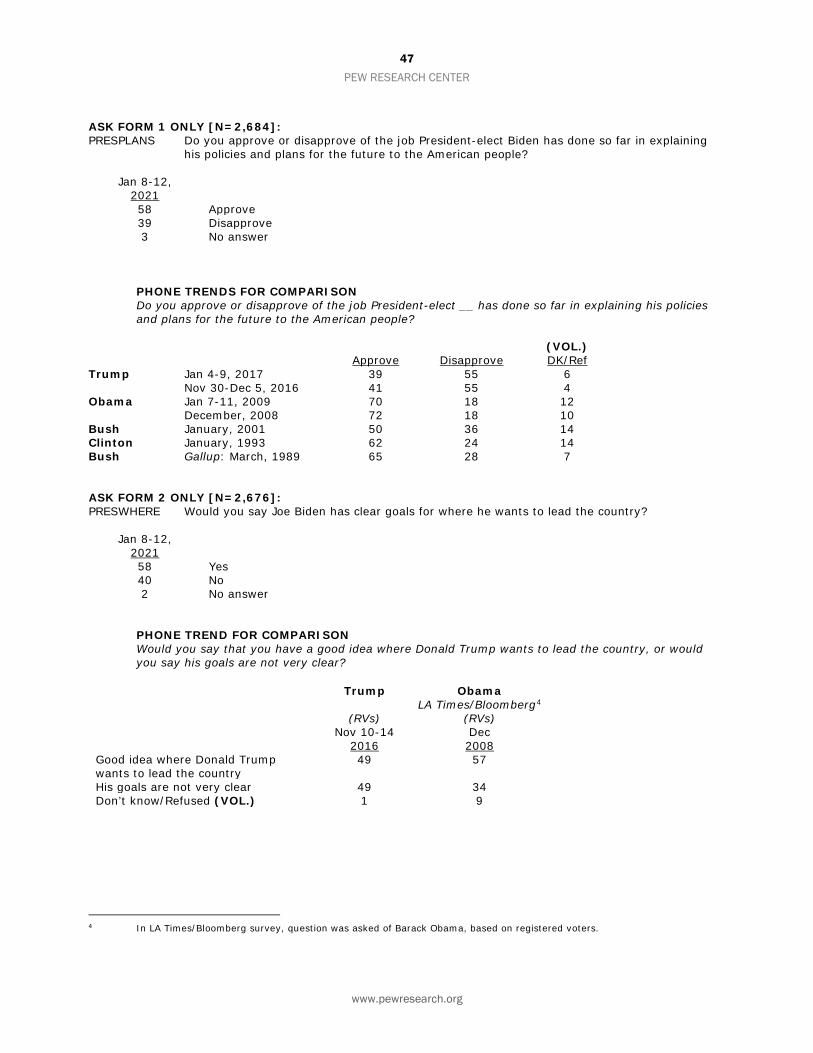
Biden will take office Jan. 20 with relatively strong performance ratings: The new survey, conducted on Pew Research Center’s nationally representative online American Trends Panel, finds that 58% of Americans approve of the job Biden has done in explaining his plans and policies. In a January 2017 telephone survey, a smaller share (39%) approved of how Trump had explained his plans for the presidency; in an early 2009 phone survey, Barack Obama had a 70% approval rating on the same measure.
A nearly identical majority of Americans – 57% – approve of Biden’s Cabinet choices and other high-level appointments. Almost half (46%) expect Biden to improve the way the federal government in Washington, D.C., works, while 28% say he will make things worse; 24% say he will not have much of an effect.
Nearly six-in-ten Americans approve of how Biden has explained his policies and plans % who ___ of the job Biden has done explaining his policies and plans to the American people
% who say, when it comes to the way the federal government works in Washington, Joe Biden will …
Source: Survey of U.S. adults conducted Jan. 8-12, 2021.
PEW RESEARCH CENTER
58
3
39
Ref
Disapprove
Approve 46
241
28
Ref
Make things worse
Make things better
Not have much of an
effect
9 PEW RESEARCH CENTER
www.pewresearch.org
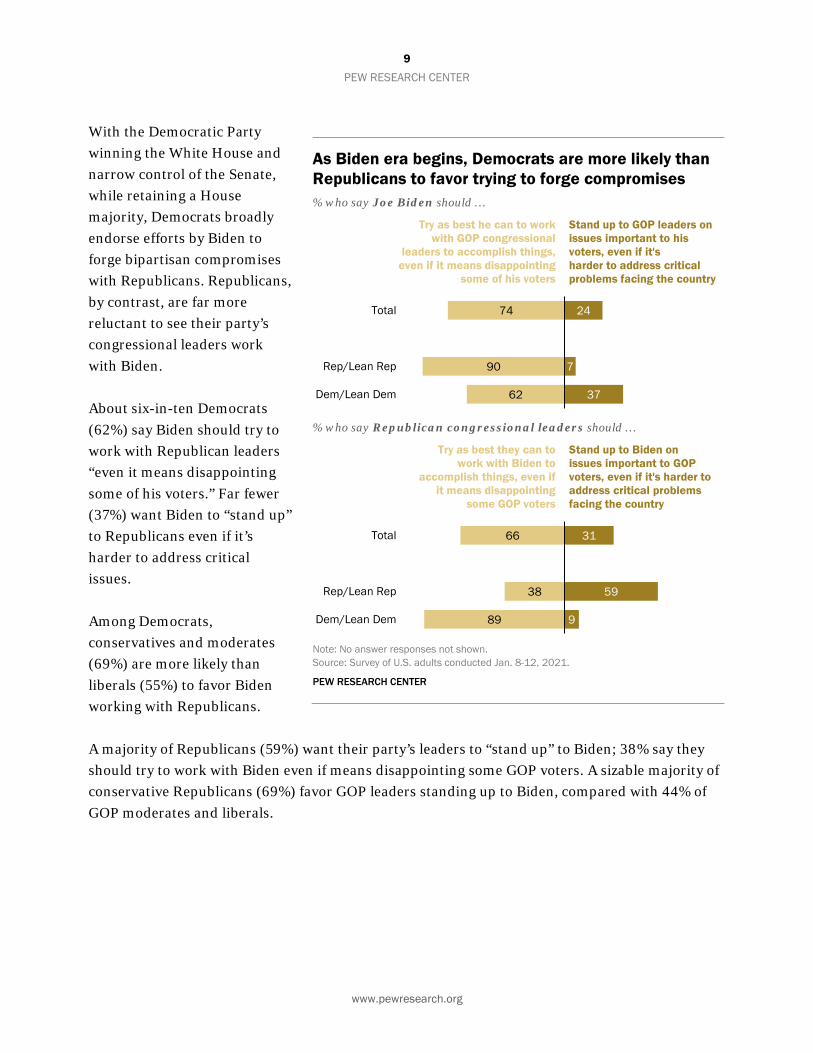
With the Democratic Party winning the White House and narrow control of the Senate, while retaining a House majority, Democrats broadly endorse efforts by Biden to forge bipartisan compromises with Republicans. Republicans, by contrast, are far more reluctant to see their party’s congressional leaders work with Biden.
About six-in-ten Democrats (62%) say Biden should try to work with Republican leaders “even it means disappointing some of his voters.” Far fewer (37%) want Biden to “stand up” to Republicans even if it’s harder to address critical issues.
Among Democrats, conservatives and moderates (69%) are more likely than liberals (55%) to favor Biden working with Republicans.
A majority of Republicans (59%) want their party’s leaders to “stand up” to Biden; 38% say they should try to work with Biden even if means disappointing some GOP voters. A sizable majority of conservative Republicans (69%) favor GOP leaders standing up to Biden, compared with 44% of GOP moderates and liberals.
As Biden era begins, Democrats are more likely than Republicans to favor trying to forge compromises % who say Joe Biden should …
% who say Republican congressional leaders should …
Note: No answer responses not shown. Source: Survey of U.S. adults conducted Jan. 8-12, 2021.
PEW RESEARCH CENTER
66
38
89
31
59
9
Total
Rep/Lean Rep
Dem/Lean Dem
Try as best they can to work with Biden to
accomplish things, even if it means disappointing
some GOP voters
Stand up to Biden on issues important to GOP voters, even if it's harder to address critical problems facing the country
74
90
62
24
7
37
Total
Rep/Lean Rep
Dem/Lean Dem
Try as best he can to work with GOP congressional
leaders to accomplish things,even if it means disappointing
some of his voters
Stand up to GOP leaders on issues important to his voters, even if it's harder to address critical problems facing the country
10 PEW RESEARCH CENTER
www.pewresearch.org
Other major findings from the survey
Opposition to Trump, increased mail and early voting widely viewed as major reasons for election result. Two-thirds of voters (67%) say a major reason for the election result was that “many voters were excited to vote against Trump”; majorities also cite the increased availability of mail and early voting (59%) and the Trump administration’s failure to do a good job in handling the coronavirus outbreak (55%). Only 32% cite widespread illegal voting and fraud; 70% of Trump voters cite this as a major reason for the election result, compared with just 2% of Biden voters.
Most think election cheating occurs often or sometimes. About eight-in-ten Americans say political candidates and campaigns often (36%) or sometimes (43%) do illegal things to ensure they have the best chance of winning. Of those who say such activities occur (even very rarely), 46% say they are done about equally by both parties; 27% say such actions are committed more often by Democrats and 26% more often by Republicans.
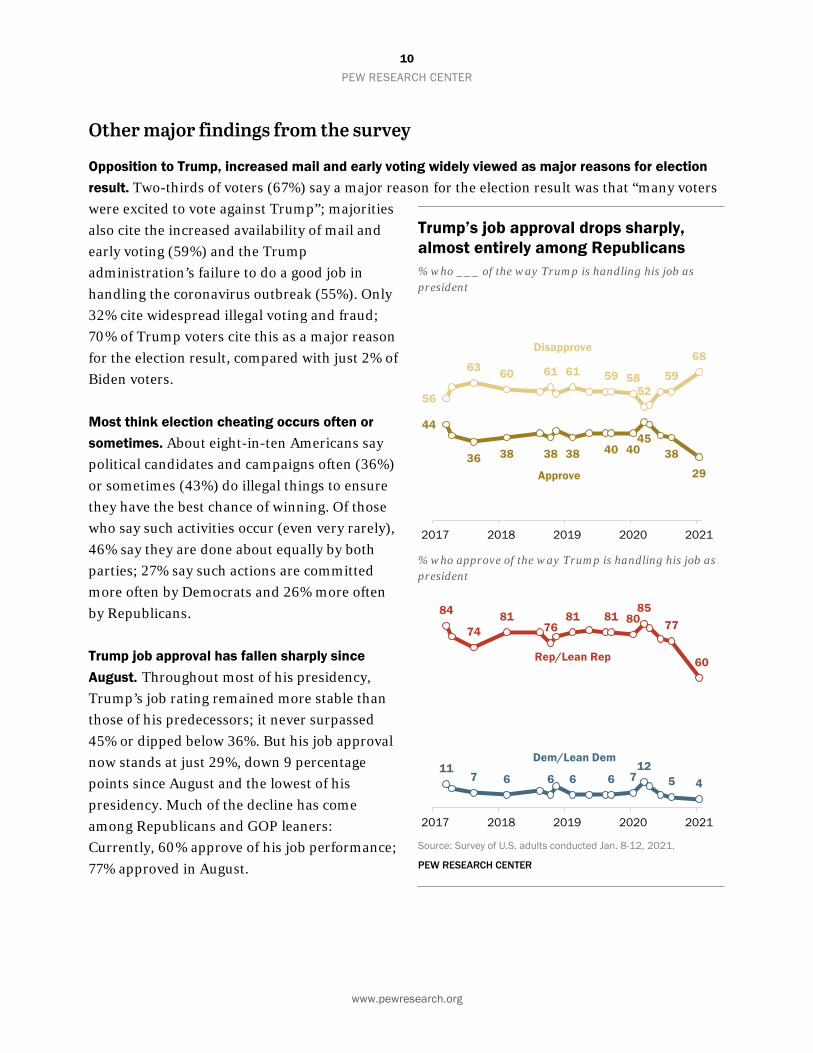
Trump job approval has fallen sharply since August. Throughout most of his presidency, Trump’s job rating remained more stable than those of his predecessors; it never surpassed 45% or dipped below 36%. But his job approval now stands at just 29%, down 9 percentage points since August and the lowest of his presidency. Much of the decline has come among Republicans and GOP leaners: Currently, 60% approve of his job performance; 77% approved in August.
Trump’s job approval drops sharply, almost entirely among Republicans % who ___ of the way Trump is handling his job as president
% who approve of the way Trump is handling his job as president
Source: Survey of U.S. adults conducted Jan. 8-12, 2021.
PEW RESEARCH CENTER
44
36 38 38 38 40 4045
38
29
56
63 60 61 61 59 5852
59
68
2017 2018 2019 2020 2021
Disapprove
Approve
84
7481
7681 81 80
8577
60
117 6 6 6 6 7
125 4
2017 2018 2019 2020 2021
Rep/Lean Rep
Dem/Lean Dem
11 PEW RESEARCH CENTER
www.pewresearch.org
Americans split in their views of Kamala Harris. Harris will make history on Jan. 20 by becoming the nation’s first woman vice president and first Black American and first Asian American to assume this role. Half of Americans say the vice president-elect is qualified to serve as president, while nearly as many say she is not. A majority of the public (55%) expects her to have about the right amount of influence in the Biden administration; 36% say she will have too much influence, while 7% say she will have too little influence.
12 PEW RESEARCH CENTER
www.pewresearch.org
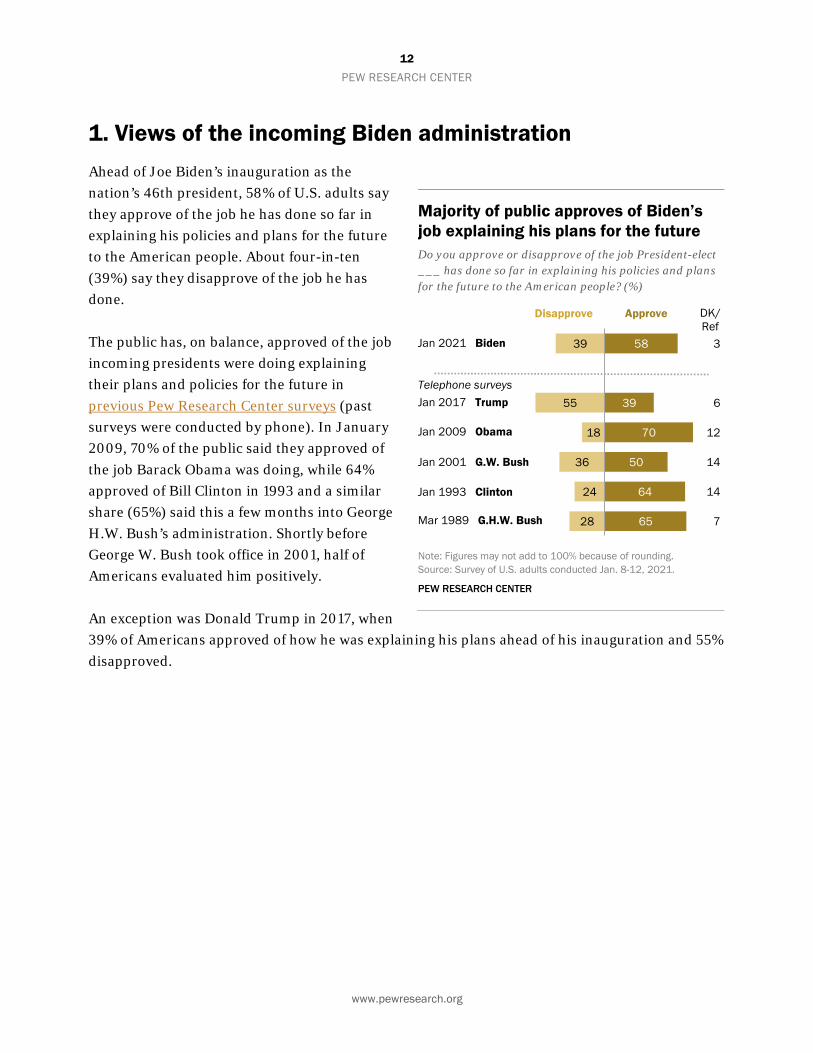
1. Views of the incoming Biden administration Ahead of Joe Biden’s inauguration as the nation’s 46th president, 58% of U.S. adults say they approve of the job he has done so far in explaining his policies and plans for the future to the American people. About four-in-ten (39%) say they disapprove of the job he has done.
The public has, on balance, approved of the job incoming presidents were doing explaining their plans and policies for the future in previous Pew Research Center surveys (past surveys were conducted by phone). In January 2009, 70% of the public said they approved of the job Barack Obama was doing, while 64% approved of Bill Clinton in 1993 and a similar share (65%) said this a few months into George H.W. Bush’s administration. Shortly before George W. Bush took office in 2001, half of Americans evaluated him positively.
An exception was Donald Trump in 2017, when 39% of Americans approved of how he was explaining his plans ahead of his inauguration and 55% disapproved.
Majority of public approves of Biden’s job explaining his plans for the future Do you approve or disapprove of the job President-elect ___ has done so far in explaining his policies and plans for the future to the American people? (%)
Note: Figures may not add to 100% because of rounding. Source: Survey of U.S. adults conducted Jan. 8-12, 2021.
PEW RESEARCH CENTER
39
55
18
36
24
28
58
39
70
50
64
65
3
6
12
14
14
7
Biden
Trump
Obama
Bush
Clinton
Bush
Disapprove DK/Ref
Approve
Jan 2021 Biden
Jan 2017 Trump
Jan 2009 Obama
Jan 2001 G.W. Bush
Jan 1993 Clinton
Mar 1989 G.H.W. Bush
Telephone surveys
13 PEW RESEARCH CENTER
www.pewresearch.org
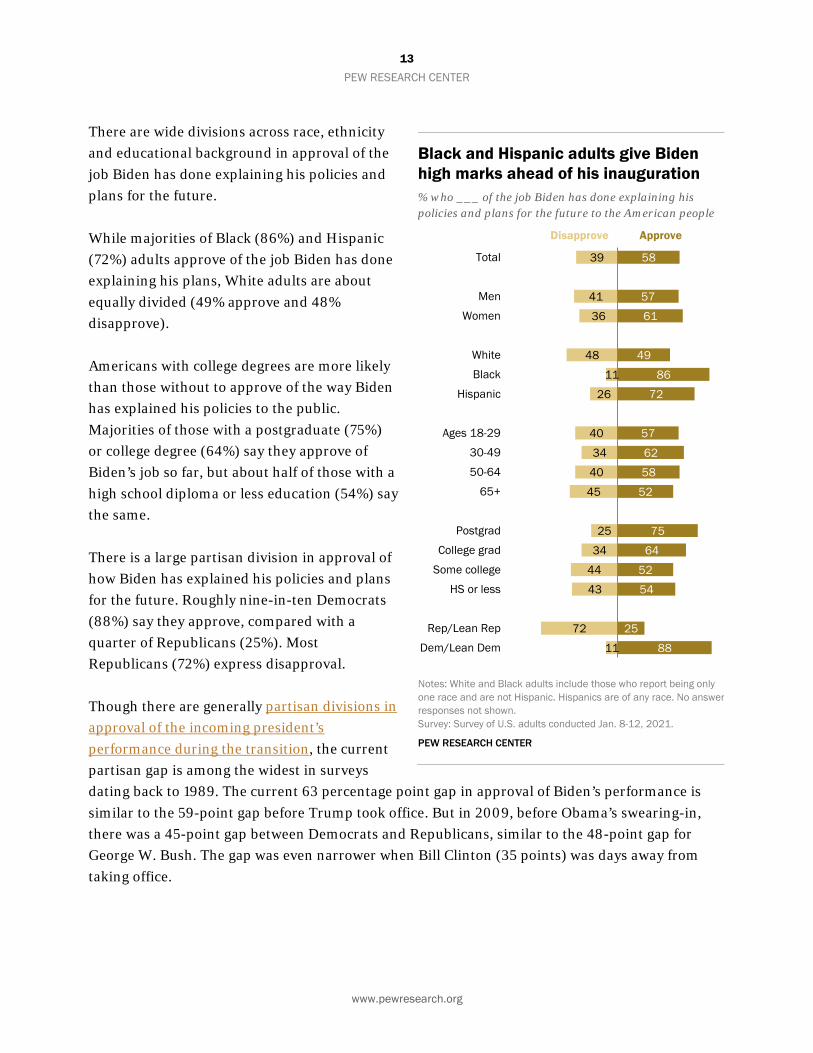
There are wide divisions across race, ethnicity and educational background in approval of the job Biden has done explaining his policies and plans for the future.
While majorities of Black (86%) and Hispanic (72%) adults approve of the job Biden has done explaining his plans, White adults are about equally divided (49% approve and 48% disapprove).
Americans with college degrees are more likely than those without to approve of the way Biden has explained his policies to the public. Majorities of those with a postgraduate (75%) or college degree (64%) say they approve of Biden’s job so far, but about half of those with a high school diploma or less education (54%) say the same.
There is a large partisan division in approval of how Biden has explained his policies and plans for the future. Roughly nine-in-ten Democrats (88%) say they approve, compared with a quarter of Republicans (25%). Most Republicans (72%) express disapproval.
Though there are generally partisan divisions in approval of the incoming president’s performance during the transition, the current partisan gap is among the widest in surveys dating back to 1989. The current 63 percentage point gap in approval of Biden’s performance is similar to the 59-point gap before Trump took office. But in 2009, before Obama’s swearing-in, there was a 45-point gap between Democrats and Republicans, similar to the 48-point gap for George W. Bush. The gap was even narrower when Bill Clinton (35 points) was days away from taking office.
Black and Hispanic adults give Biden high marks ahead of his inauguration % who ___ of the job Biden has done explaining his policies and plans for the future to the American people
Notes: White and Black adults include those who report being only one race and are not Hispanic. Hispanics are of any race. No answer responses not shown. Survey: Survey of U.S. adults conducted Jan. 8-12, 2021.
PEW RESEARCH CENTER
39
41
36
48
11
26
40
34
40
45
25
34
44
43
72
11
58
57
61
49
86
72
57
62
58
52
75
64
52
54
25
88
Total
Men
Women
White
Black
Hispanic
Ages 18-29
30-49
50-64
65+
Postgrad
College grad
Some college
HS or less
Rep/Lean Rep
Dem/Lean Dem
Disapprove Approve
14 PEW RESEARCH CENTER
www.pewresearch.org
Will Biden be a successful or unsuccessful president?
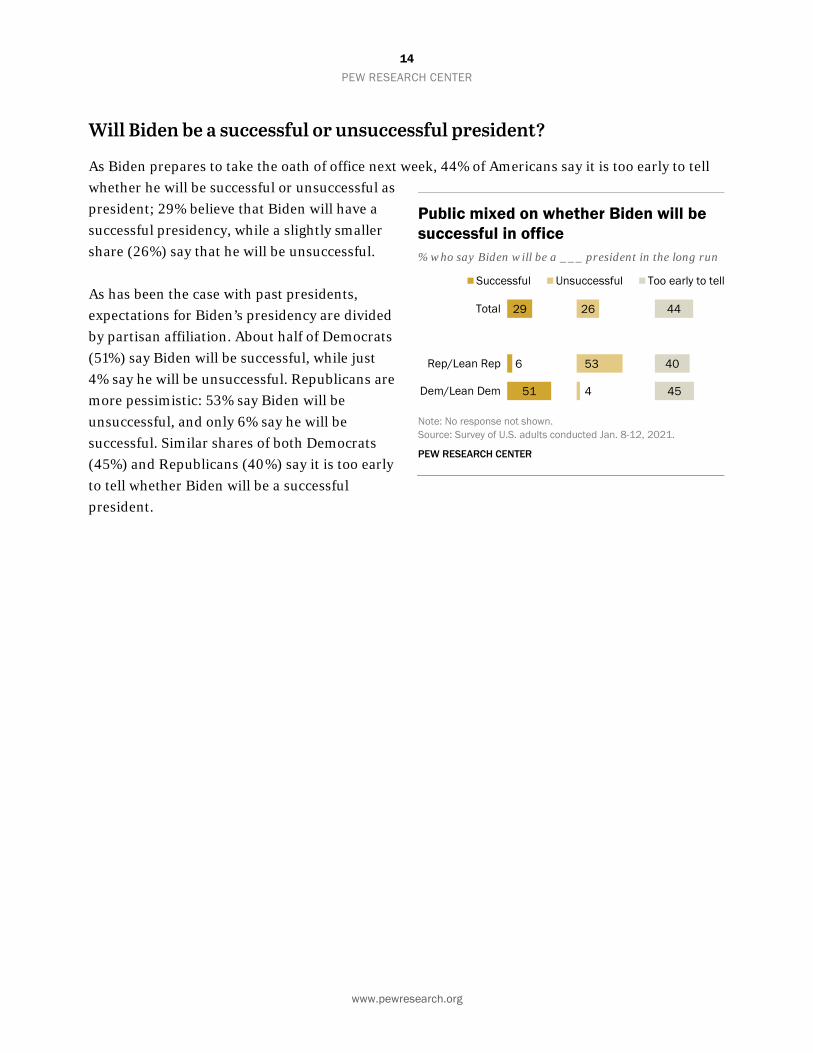
As Biden prepares to take the oath of office next week, 44% of Americans say it is too early to tell whether he will be successful or unsuccessful as president; 29% believe that Biden will have a successful presidency, while a slightly smaller share (26%) say that he will be unsuccessful.
As has been the case with past presidents, expectations for Biden’s presidency are divided by partisan affiliation. About half of Democrats (51%) say Biden will be successful, while just 4% say he will be unsuccessful. Republicans are more pessimistic: 53% say Biden will be unsuccessful, and only 6% say he will be successful. Similar shares of both Democrats (45%) and Republicans (40%) say it is too early to tell whether Biden will be a successful president.
Public mixed on whether Biden will be successful in office % who say Biden will be a ___ president in the long run
Note: No response not shown. Source: Survey of U.S. adults conducted Jan. 8-12, 2021.
PEW RESEARCH CENTER
29
6
51
26
53
4
44
40
45
Total
Rep/Lean Rep
Dem/Lean Dem
Successful Unsuccessful Too early to tell
15 PEW RESEARCH CENTER
www.pewresearch.org
About half say Biden will improve how the federal government works
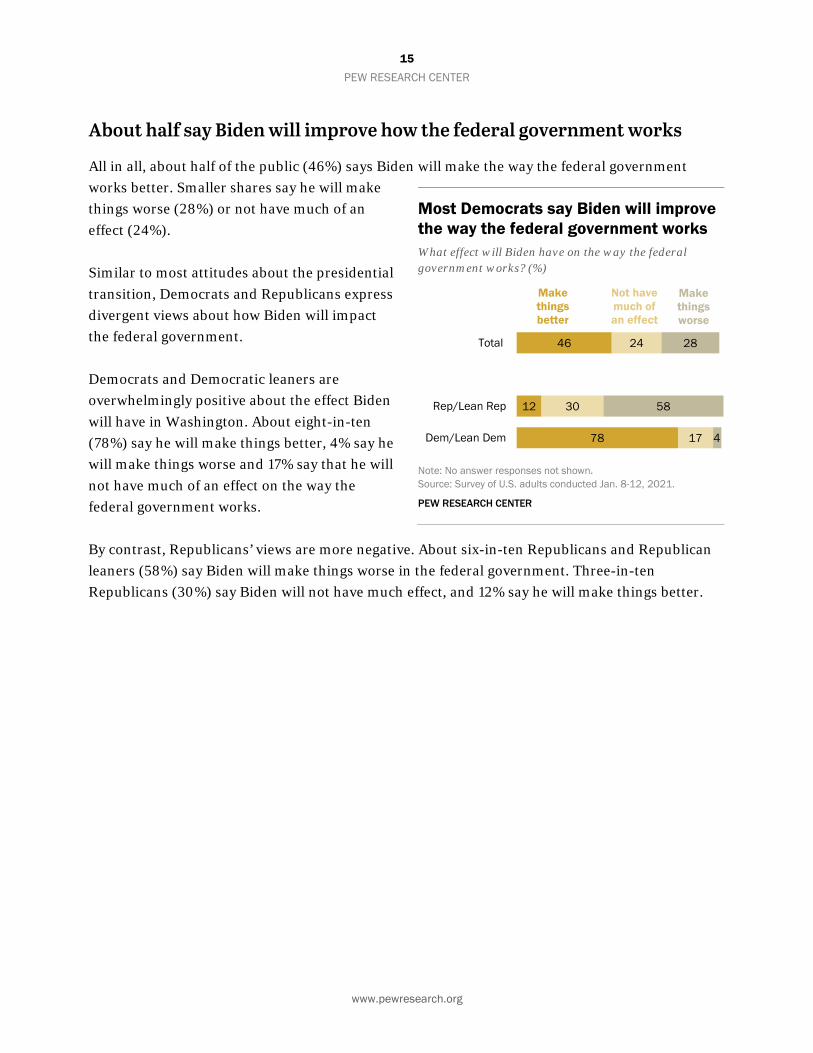
All in all, about half of the public (46%) says Biden will make the way the federal government works better. Smaller shares say he will make things worse (28%) or not have much of an effect (24%).
Similar to most attitudes about the presidential transition, Democrats and Republicans express divergent views about how Biden will impact the federal government.
Democrats and Democratic leaners are overwhelmingly positive about the effect Biden will have in Washington. About eight-in-ten (78%) say he will make things better, 4% say he will make things worse and 17% say that he will not have much of an effect on the way the federal government works.
By contrast, Republicans’ views are more negative. About six-in-ten Republicans and Republican leaners (58%) say Biden will make things worse in the federal government. Three-in-ten Republicans (30%) say Biden will not have much effect, and 12% say he will make things better.
Most Democrats say Biden will improve the way the federal government works What effect will Biden have on the way the federal government works? (%)
Note: No answer responses not shown. Source: Survey of U.S. adults conducted Jan. 8-12, 2021.
PEW RESEARCH CENTER
46
12
78
24
30
17
28
58
4
Total
Rep/Lean Rep
Dem/Lean Dem
Make things worse
Make things better
Not have much of an effect
16 PEW RESEARCH CENTER
www.pewresearch.org
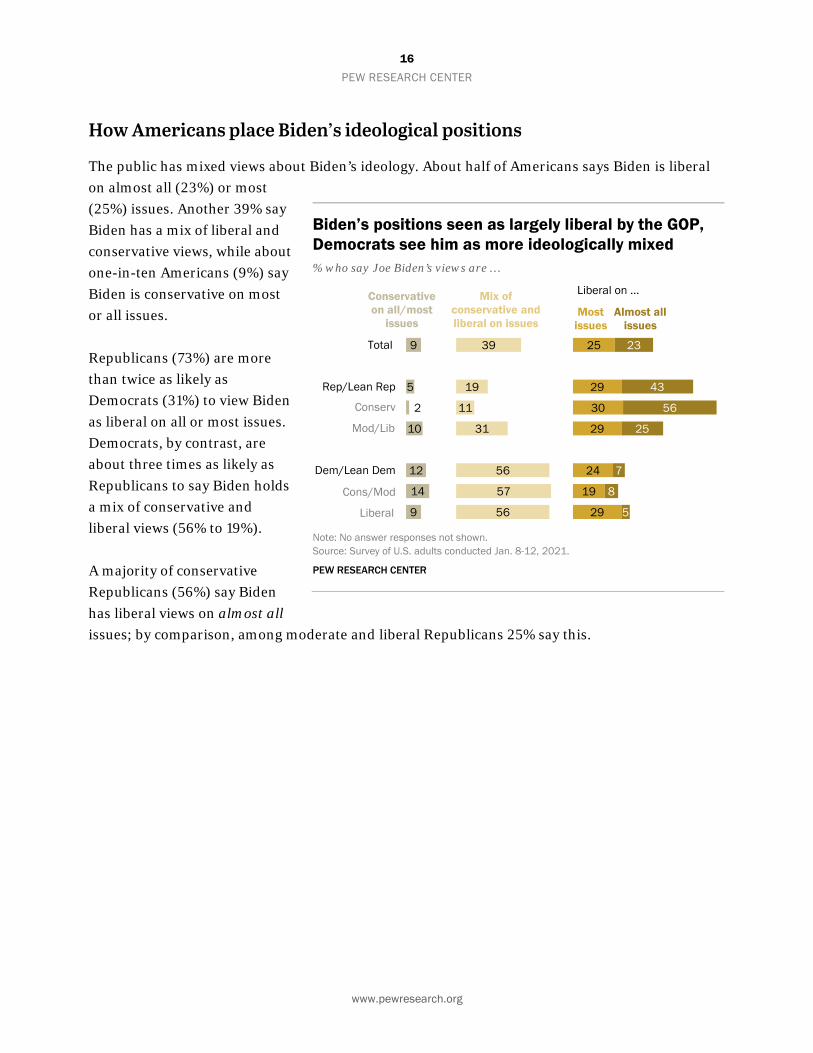
How Americans place Biden’s ideological positions
The public has mixed views about Biden’s ideology. About half of Americans says Biden is liberal on almost all (23%) or most (25%) issues. Another 39% say Biden has a mix of liberal and conservative views, while about one-in-ten Americans (9%) say Biden is conservative on most or all issues.
Republicans (73%) are more than twice as likely as Democrats (31%) to view Biden as liberal on all or most issues. Democrats, by contrast, are about three times as likely as Republicans to say Biden holds a mix of conservative and liberal views (56% to 19%).
A majority of conservative Republicans (56%) say Biden has liberal views on almost all issues; by comparison, among moderate and liberal Republicans 25% say this.
Biden’s positions seen as largely liberal by the GOP, Democrats see him as more ideologically mixed % who say Joe Biden’s views are …
Note: No answer responses not shown. Source: Survey of U.S. adults conducted Jan. 8-12, 2021.
PEW RESEARCH CENTER
9
5
2
10
12
14
9
39
19
11
31
56
57
56
25
29
30
29
24
19
29
23
43
56
25
7
8
5
Total
Rep/Lean Rep
Dem/Lean Dem
Conservativeon all/most
issues
Mix of conservative and liberal on issues
Most issues
Almost all issues
Liberal on ...
Cons/Mod
Liberal
Conserv
Mod/Lib
17 PEW RESEARCH CENTER
www.pewresearch.org
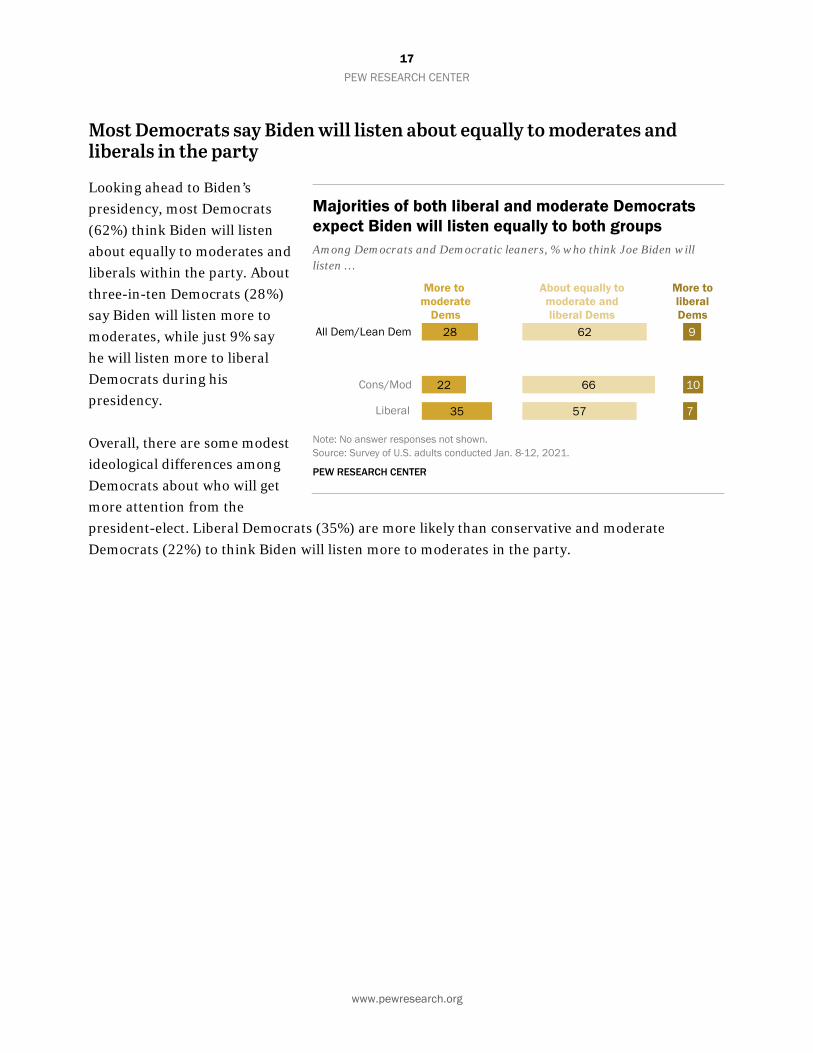
Most Democrats say Biden will listen about equally to moderates and liberals in the party
Looking ahead to Biden’s presidency, most Democrats (62%) think Biden will listen about equally to moderates and liberals within the party. About three-in-ten Democrats (28%) say Biden will listen more to moderates, while just 9% say he will listen more to liberal Democrats during his presidency.
Overall, there are some modest ideological differences among Democrats about who will get more attention from the president-elect. Liberal Democrats (35%) are more likely than conservative and moderate Democrats (22%) to think Biden will listen more to moderates in the party.
Majorities of both liberal and moderate Democrats expect Biden will listen equally to both groups Among Democrats and Democratic leaners, % who think Joe Biden will listen …
Note: No answer responses not shown. Source: Survey of U.S. adults conducted Jan. 8-12, 2021.
PEW RESEARCH CENTER
28
22
35
62
66
57
9
10
7
All Dem/Lean Dem
More tomoderate
Dems
More toliberal Dems
About equally to moderate and liberal Dems
Cons/Mod
Liberal
18 PEW RESEARCH CENTER
www.pewresearch.org
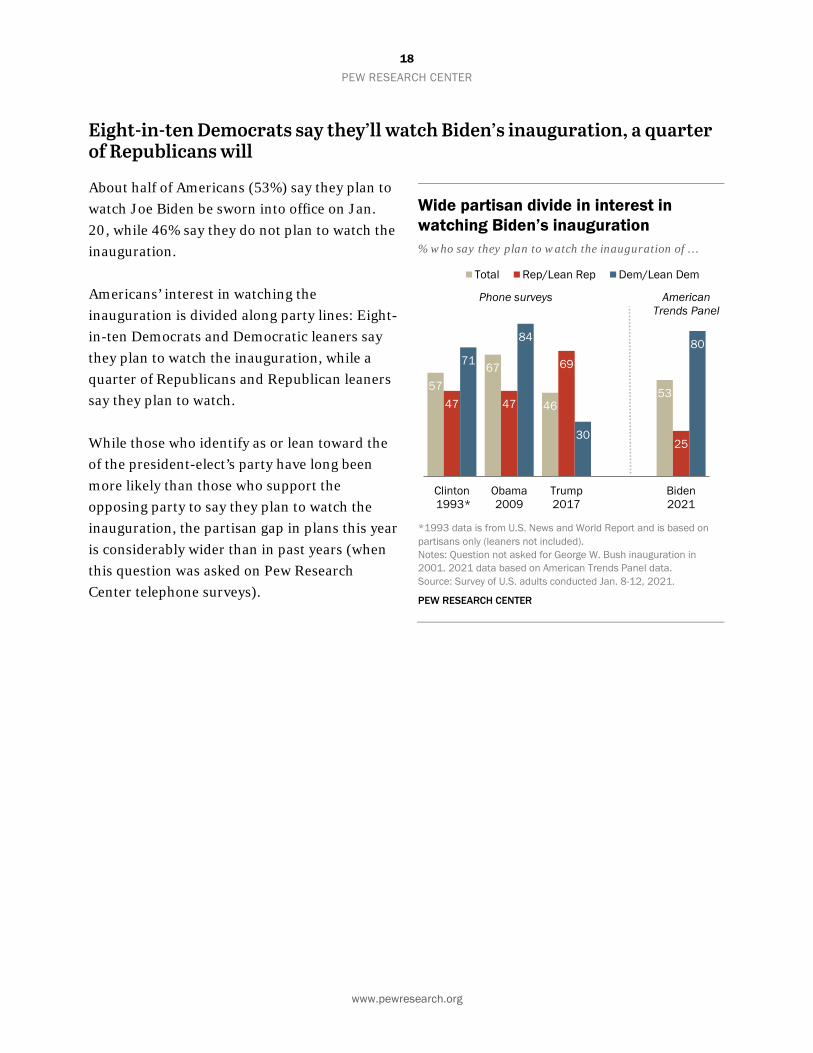
Eight-in-ten Democrats say they’ll watch Biden’s inauguration, a quarter of Republicans will
About half of Americans (53%) say they plan to watch Joe Biden be sworn into office on Jan. 20, while 46% say they do not plan to watch the inauguration.
Americans’ interest in watching the inauguration is divided along party lines: Eight-in-ten Democrats and Democratic leaners say they plan to watch the inauguration, while a quarter of Republicans and Republican leaners say they plan to watch.
While those who identify as or lean toward the of the president-elect’s party have long been more likely than those who support the opposing party to say they plan to watch the inauguration, the partisan gap in plans this year is considerably wider than in past years (when this question was asked on Pew Research Center telephone surveys).
Wide partisan divide in interest in watching Biden’s inauguration % who say they plan to watch the inauguration of …
*1993 data is from U.S. News and World Report and is based on partisans only (leaners not included). Notes: Question not asked for George W. Bush inauguration in 2001. 2021 data based on American Trends Panel data. Source: Survey of U.S. adults conducted Jan. 8-12, 2021.
PEW RESEARCH CENTER
5767
4653
47 47
69
25
71
84
30
80
Clinton 1993*
Obama2009
Trump2017
Biden2021
Total Rep/Lean Rep Dem/Lean Dem
American Trends Panel
Phone surveys
19 PEW RESEARCH CENTER
www.pewresearch.org
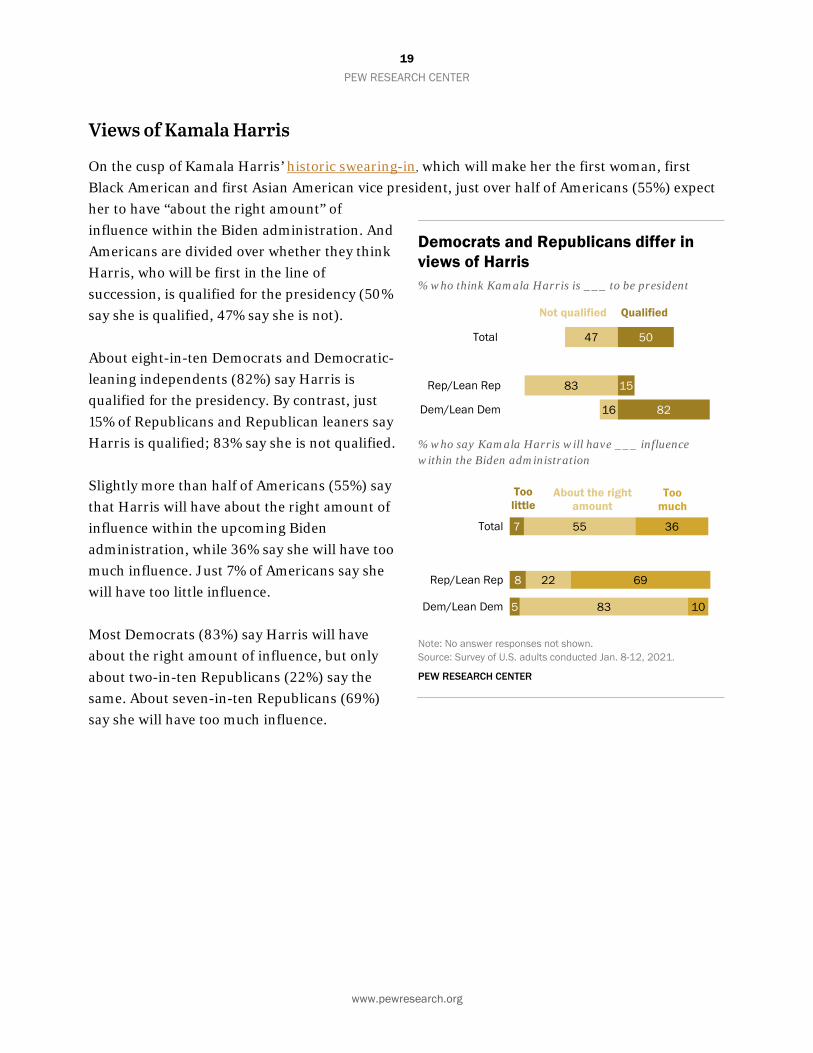
Views of Kamala Harris
On the cusp of Kamala Harris’ historic swearing-in, which will make her the first woman, first Black American and first Asian American vice president, just over half of Americans (55%) expect her to have “about the right amount” of influence within the Biden administration. And Americans are divided over whether they think Harris, who will be first in the line of succession, is qualified for the presidency (50% say she is qualified, 47% say she is not).
About eight-in-ten Democrats and Democratic-leaning independents (82%) say Harris is qualified for the presidency. By contrast, just 15% of Republicans and Republican leaners say Harris is qualified; 83% say she is not qualified.
Slightly more than half of Americans (55%) say that Harris will have about the right amount of influence within the upcoming Biden administration, while 36% say she will have too much influence. Just 7% of Americans say she will have too little influence.
Most Democrats (83%) say Harris will have about the right amount of influence, but only about two-in-ten Republicans (22%) say the same. About seven-in-ten Republicans (69%) say she will have too much influence.
Democrats and Republicans differ in views of Harris % who think Kamala Harris is ___ to be president
% who say Kamala Harris will have ___ influence within the Biden administration
Note: No answer responses not shown. Source: Survey of U.S. adults conducted Jan. 8-12, 2021.
PEW RESEARCH CENTER
47
83
16
50
15
82
Total
Rep/Lean Rep
Dem/Lean Dem
Not qualified Qualified
7
8
5
55
22
83
36
69
10
Total
Rep/Lean Rep
Dem/Lean Dem
Too little
About the right amount
Too much
20 PEW RESEARCH CENTER
www.pewresearch.org
39
7786
63
796
58
2111
35
929094
Total
Rep/Lean Rep
Dem/Lean Dem
Bad thing Good thing
ConservMod/Lib
Cons/ModLiberal
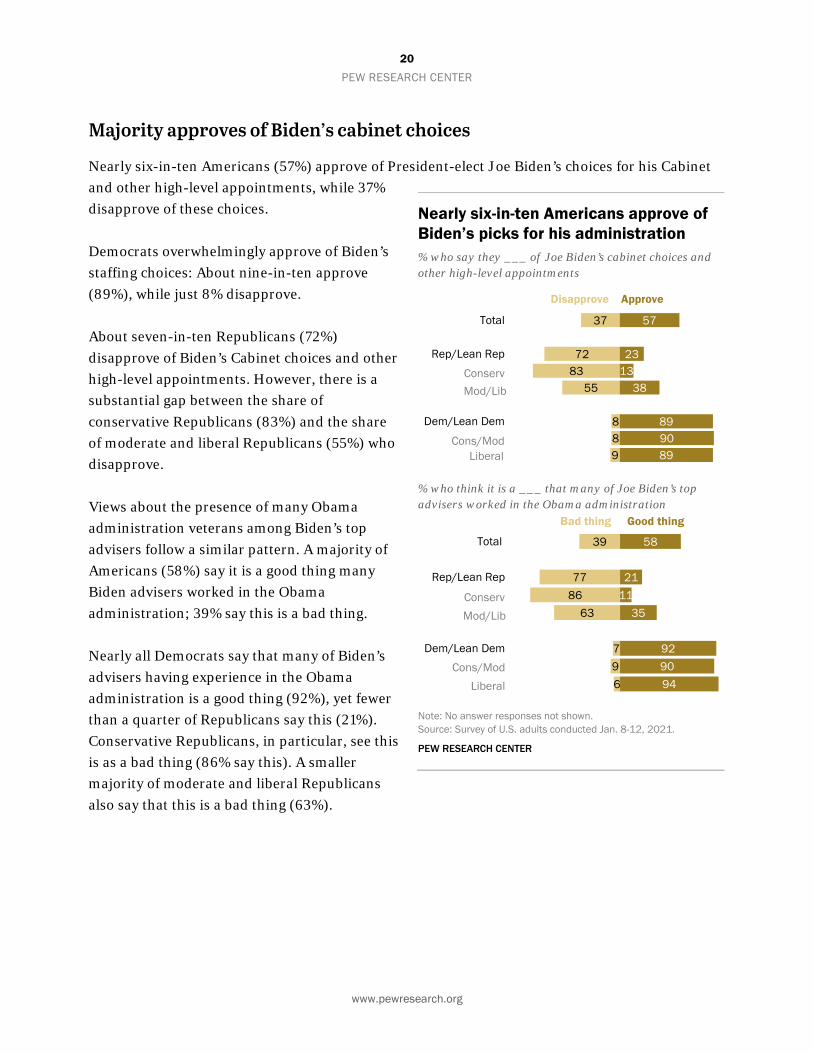
Majority approves of Biden’s cabinet choices
Nearly six-in-ten Americans (57%) approve of President-elect Joe Biden’s choices for his Cabinet and other high-level appointments, while 37% disapprove of these choices.
Democrats overwhelmingly approve of Biden’s staffing choices: About nine-in-ten approve (89%), while just 8% disapprove.
About seven-in-ten Republicans (72%) disapprove of Biden’s Cabinet choices and other high-level appointments. However, there is a substantial gap between the share of conservative Republicans (83%) and the share of moderate and liberal Republicans (55%) who disapprove.
Views about the presence of many Obama administration veterans among Biden’s top advisers follow a similar pattern. A majority of Americans (58%) say it is a good thing many Biden advisers worked in the Obama administration; 39% say this is a bad thing.
Nearly all Democrats say that many of Biden’s advisers having experience in the Obama administration is a good thing (92%), yet fewer than a quarter of Republicans say this (21%). Conservative Republicans, in particular, see this is as a bad thing (86% say this). A smaller majority of moderate and liberal Republicans also say that this is a bad thing (63%).
Nearly six-in-ten Americans approve of Biden’s picks for his administration % who say they ___ of Joe Biden’s cabinet choices and other high-level appointments
% who think it is a ___ that many of Joe Biden’s top advisers worked in the Obama administration
Note: No answer responses not shown. Source: Survey of U.S. adults conducted Jan. 8-12, 2021.
PEW RESEARCH CENTER
37
7283
55
889
57
2313
38
899089
Total
Rep/Lean Rep
Dem/Lean Dem
ApproveDisapprove
ConservMod/Lib
Cons/ModLiberal
21 PEW RESEARCH CENTER
www.pewresearch.org
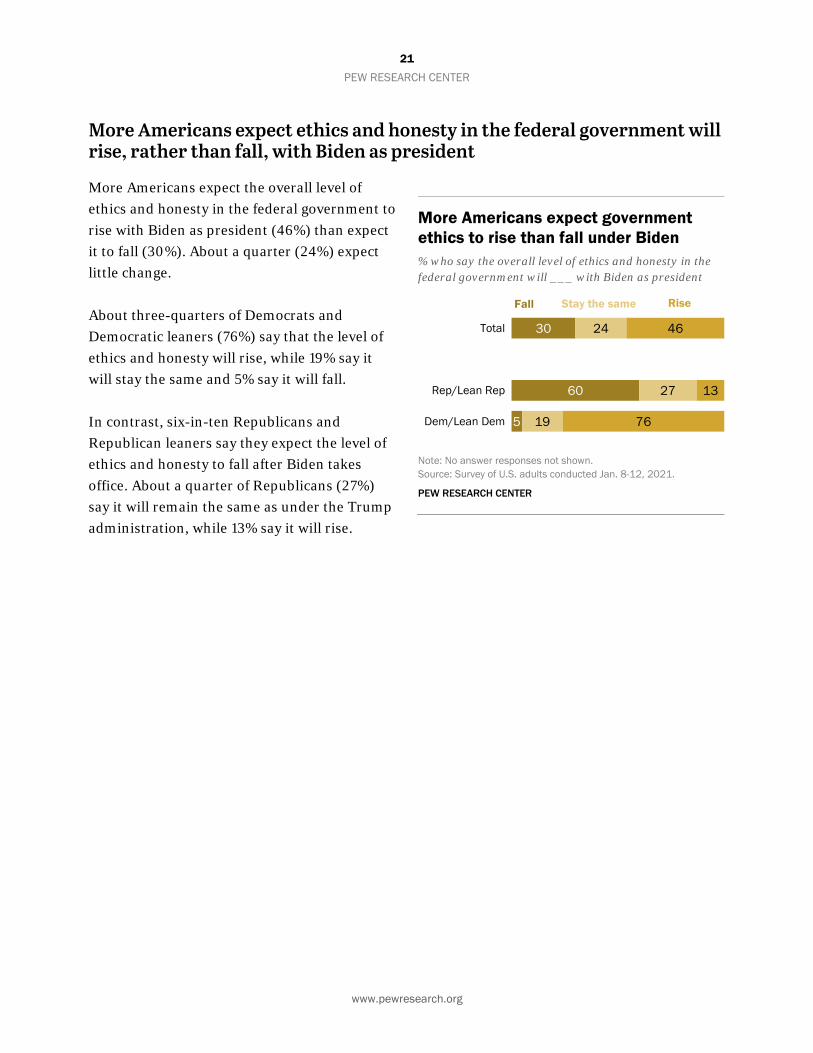
More Americans expect ethics and honesty in the federal government will rise, rather than fall, with Biden as president
More Americans expect the overall level of ethics and honesty in the federal government to rise with Biden as president (46%) than expect it to fall (30%). About a quarter (24%) expect little change.
About three-quarters of Democrats and Democratic leaners (76%) say that the level of ethics and honesty will rise, while 19% say it will stay the same and 5% say it will fall.
In contrast, six-in-ten Republicans and Republican leaners say they expect the level of ethics and honesty to fall after Biden takes office. About a quarter of Republicans (27%) say it will remain the same as under the Trump administration, while 13% say it will rise.
More Americans expect government ethics to rise than fall under Biden % who say the overall level of ethics and honesty in the federal government will ___ with Biden as president
Note: No answer responses not shown. Source: Survey of U.S. adults conducted Jan. 8-12, 2021.
PEW RESEARCH CENTER
30
60
5
24
27
19
46
13
76
Total
Rep/Lean Rep
Dem/Lean Dem
Fall Stay the same Rise
22 PEW RESEARCH CENTER
www.pewresearch.org
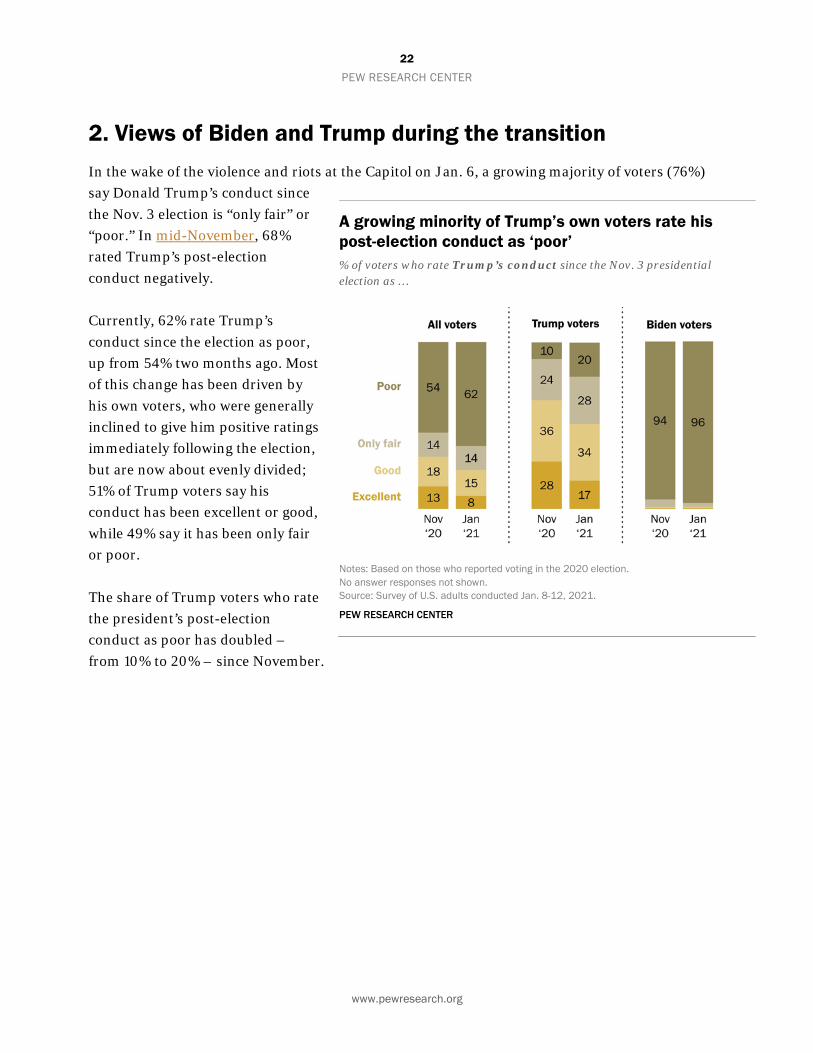
2. Views of Biden and Trump during the transition In the wake of the violence and riots at the Capitol on Jan. 6, a growing majority of voters (76%) say Donald Trump’s conduct since the Nov. 3 election is “only fair” or “poor.” In mid-November, 68% rated Trump’s post-election conduct negatively.
Currently, 62% rate Trump’s conduct since the election as poor, up from 54% two months ago. Most of this change has been driven by his own voters, who were generally inclined to give him positive ratings immediately following the election, but are now about evenly divided; 51% of Trump voters say his conduct has been excellent or good, while 49% say it has been only fair or poor.
The share of Trump voters who rate the president’s post-election conduct as poor has doubled – from 10% to 20% – since November.
A growing minority of Trump’s own voters rate his post-election conduct as ‘poor’ % of voters who rate Trump’s conduct since the Nov. 3 presidential election as …
Notes: Based on those who reported voting in the 2020 election. No answer responses not shown. Source: Survey of U.S. adults conducted Jan. 8-12, 2021.
PEW RESEARCH CENTER
23 PEW RESEARCH CENTER
www.pewresearch.org
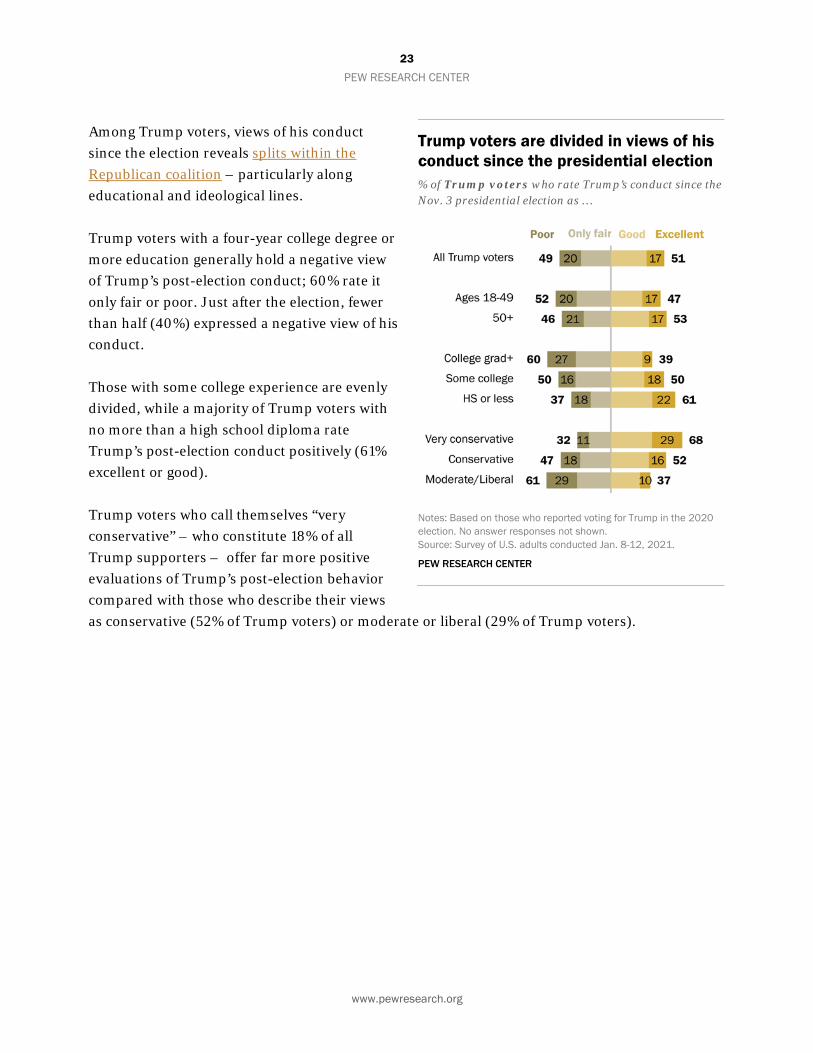
Among Trump voters, views of his conduct since the election reveals splits within the Republican coalition – particularly along educational and ideological lines.
Trump voters with a four-year college degree or more education generally hold a negative view of Trump’s post-election conduct; 60% rate it only fair or poor. Just after the election, fewer than half (40%) expressed a negative view of his conduct.
Those with some college experience are evenly divided, while a majority of Trump voters with no more than a high school diploma rate Trump’s post-election conduct positively (61% excellent or good).
Trump voters who call themselves “very conservative” – who constitute 18% of all Trump supporters – offer far more positive evaluations of Trump’s post-election behavior compared with those who describe their views as conservative (52% of Trump voters) or moderate or liberal (29% of Trump voters).
Trump voters are divided in views of his conduct since the presidential election % of Trump voters who rate Trump’s conduct since the Nov. 3 presidential election as …
Notes: Based on those who reported voting for Trump in the 2020 election. No answer responses not shown. Source: Survey of U.S. adults conducted Jan. 8-12, 2021.
PEW RESEARCH CENTER
24 PEW RESEARCH CENTER
www.pewresearch.org
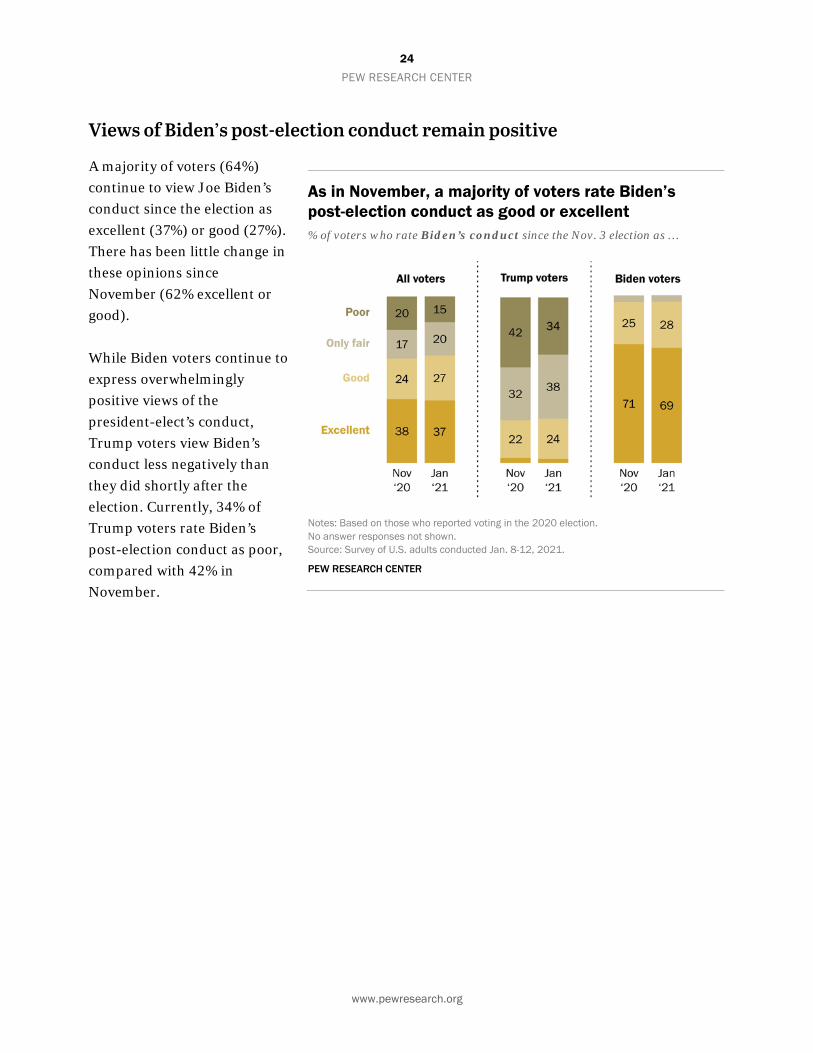
Views of Biden’s post-election conduct remain positive
A majority of voters (64%) continue to view Joe Biden’s conduct since the election as excellent (37%) or good (27%). There has been little change in these opinions since November (62% excellent or good).
While Biden voters continue to express overwhelmingly positive views of the president-elect’s conduct, Trump voters view Biden’s conduct less negatively than they did shortly after the election. Currently, 34% of Trump voters rate Biden’s post-election conduct as poor, compared with 42% in November.
As in November, a majority of voters rate Biden’s post-election conduct as good or excellent % of voters who rate Biden’s conduct since the Nov. 3 election as …
Notes: Based on those who reported voting in the 2020 election. No answer responses not shown. Source: Survey of U.S. adults conducted Jan. 8-12, 2021.
PEW RESEARCH CENTER
25 PEW RESEARCH CENTER
www.pewresearch.org
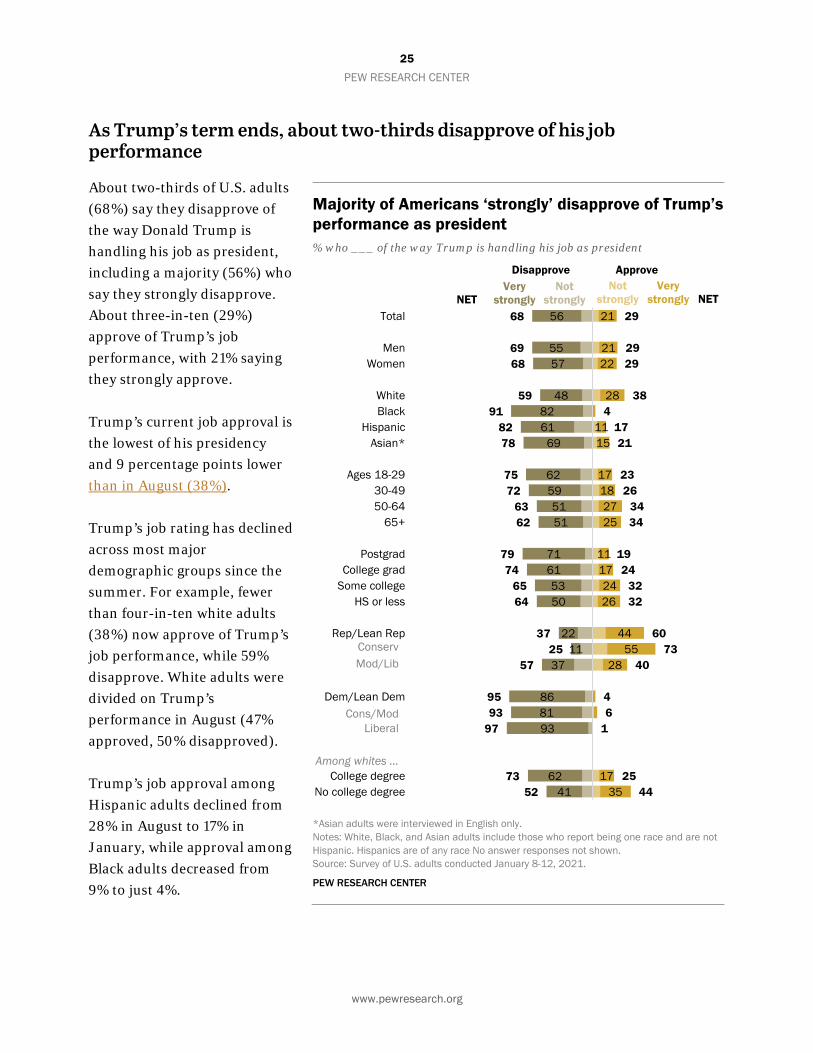
As Trump’s term ends, about two-thirds disapprove of his job performance
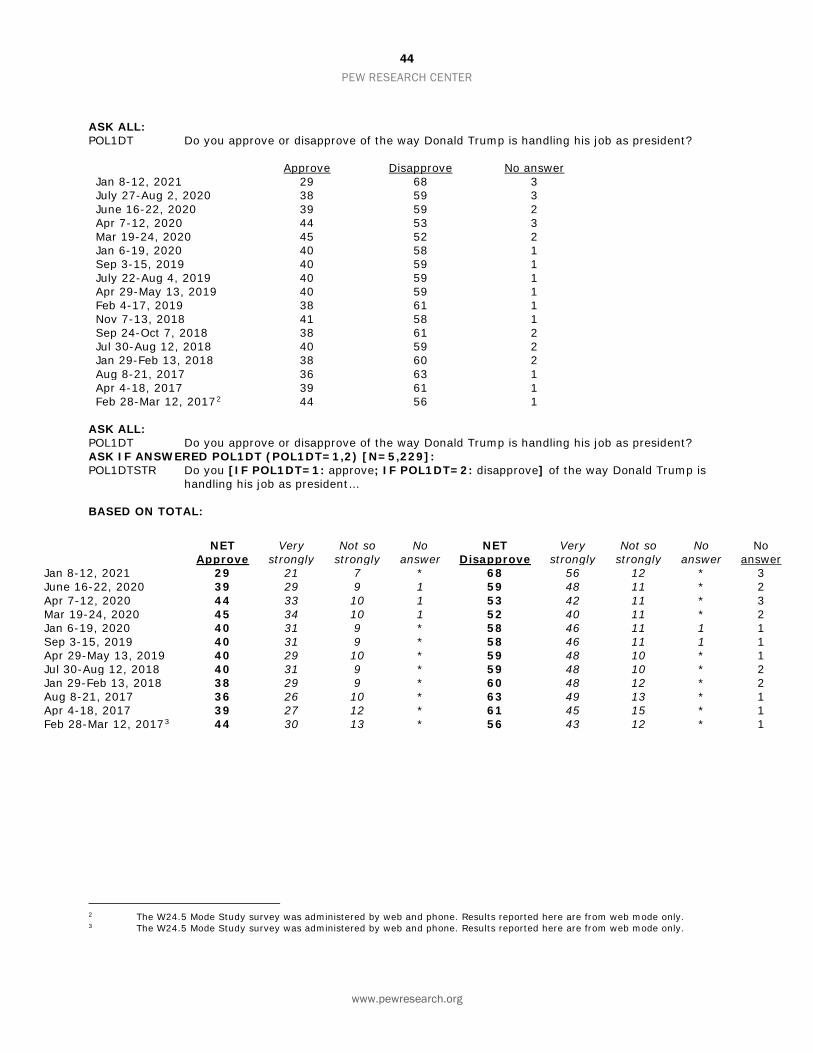
About two-thirds of U.S. adults (68%) say they disapprove of the way Donald Trump is handling his job as president, including a majority (56%) who say they strongly disapprove. About three-in-ten (29%) approve of Trump’s job performance, with 21% saying they strongly approve.
Trump’s current job approval is the lowest of his presidency and 9 percentage points lower than in August (38%).
Trump’s job rating has declined across most major demographic groups since the summer. For example, fewer than four-in-ten white adults (38%) now approve of Trump’s job performance, while 59% disapprove. White adults were divided on Trump’s performance in August (47% approved, 50% disapproved).
Trump’s job approval among Hispanic adults declined from 28% in August to 17% in January, while approval among Black adults decreased from 9% to just 4%.
Majority of Americans ‘strongly’ disapprove of Trump’s performance as president % who ___ of the way Trump is handling his job as president
*Asian adults were interviewed in English only. Notes: White, Black, and Asian adults include those who report being one race and are not Hispanic. Hispanics are of any race No answer responses not shown. Source: Survey of U.S. adults conducted January 8-12, 2021.
PEW RESEARCH CENTER
21
2122
28
1115
17182725
11172426
4455
28
1735
29
2929
384
1721
2326
3434
1924
3232
6073
40
46
1
2544
56
5557
488261
69
62595151
71615350
2211
37
868193
6241
68
6968
5991
8278
7572
6362
7974
6564
3725
57
9593
97
7352
Total
MenWomen
WhiteBlack
HispanicAsian*
Ages 18-2930-4950-64
65+
PostgradCollege grad
Some collegeHS or less
Rep/Lean Rep
Dem/Lean Dem
College degreeNo college degree
Conserv
LiberalCons/Mod
Mod/Lib
Verystrongly
Notstrongly
Notstrongly
VerystronglyNET NET
Among whites ...
ApproveDisapprove
26 PEW RESEARCH CENTER
www.pewresearch.org
Much of the decline in Trump’s job approval has come among Republicans and Republican-leaning independents; currently 60% approve of the way Trump is handling his job as president, down from 77% in August.
Approval of Trump’s performance is now substantially lower among moderate and liberal Republicans than it was last year. Today, just 40% of moderate and liberal Republicans approve of Trump’s performance, while 57% disapprove. Last August, 63% of moderate and liberal Republicans approved of Trump’s job performance. Among conservative Republicans – who make up a clear majority of the GOP – 73% continue to approve of how Trump is handling his job, though this share is also down from the 85% of conservative Republicans who said this in August.
Attitudes among Democrats, the vast majority of whom already disapproved of the president’s performance, are essentially unchanged since August.
27 PEW RESEARCH CENTER
www.pewresearch.org
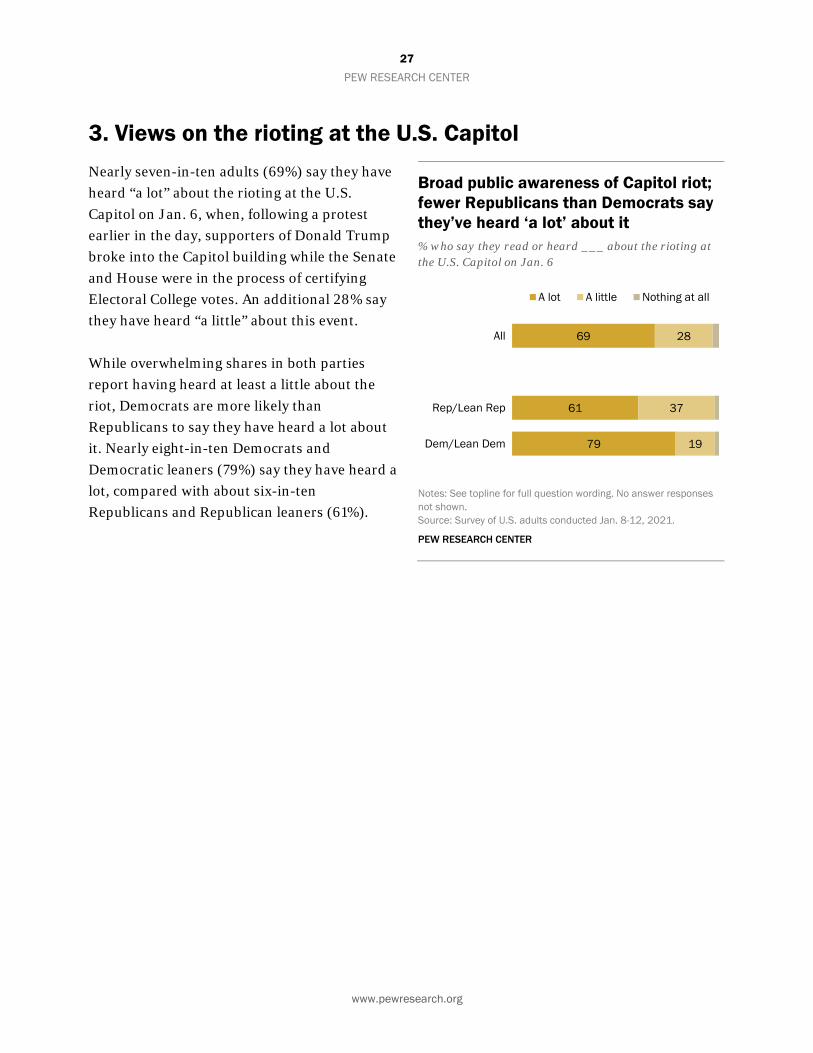
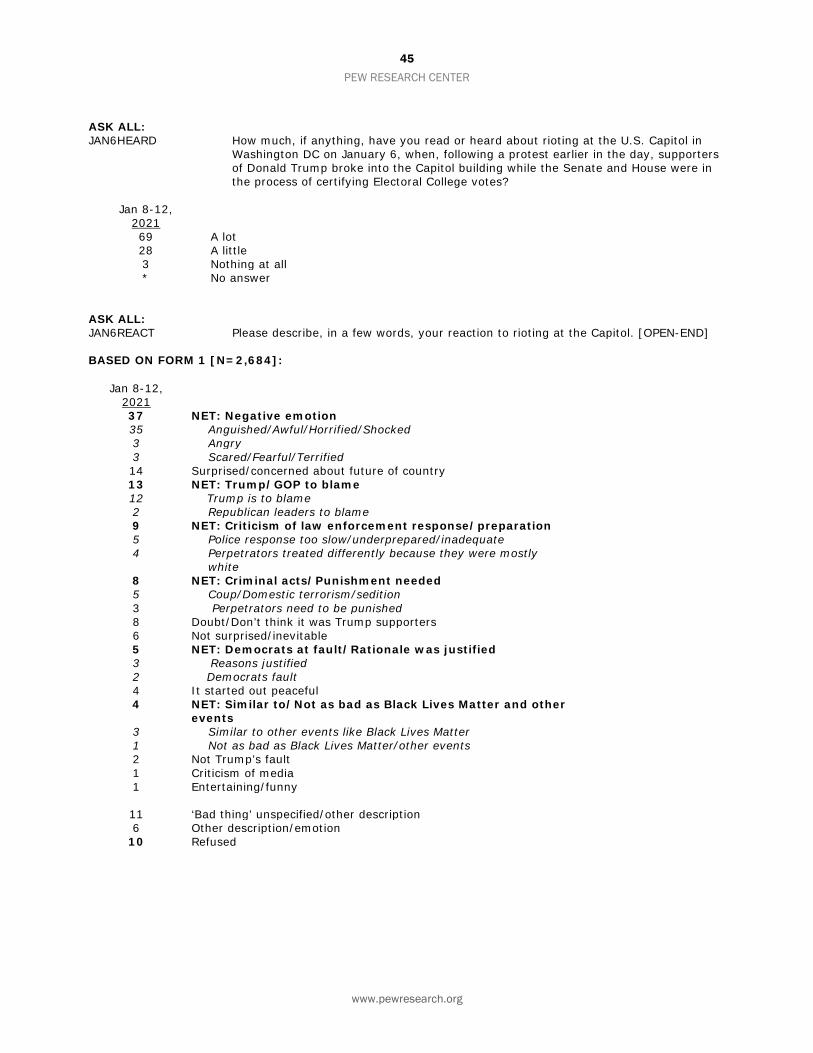
3. Views on the rioting at the U.S. Capitol Nearly seven-in-ten adults (69%) say they have heard “a lot” about the rioting at the U.S. Capitol on Jan. 6, when, following a protest earlier in the day, supporters of Donald Trump broke into the Capitol building while the Senate and House were in the process of certifying Electoral College votes. An additional 28% say they have heard “a little” about this event.
While overwhelming shares in both parties report having heard at least a little about the riot, Democrats are more likely than Republicans to say they have heard a lot about it. Nearly eight-in-ten Democrats and Democratic leaners (79%) say they have heard a lot, compared with about six-in-ten Republicans and Republican leaners (61%).
Broad public awareness of Capitol riot; fewer Republicans than Democrats say they’ve heard ‘a lot’ about it % who say they read or heard ___ about the rioting at the U.S. Capitol on Jan. 6
Notes: See topline for full question wording. No answer responses not shown. Source: Survey of U.S. adults conducted Jan. 8-12, 2021.
PEW RESEARCH CENTER
69
61
79
28
37
19
All
Rep/Lean Rep
Dem/Lean Dem
A lot A little Nothing at all
28 PEW RESEARCH CENTER
www.pewresearch.org
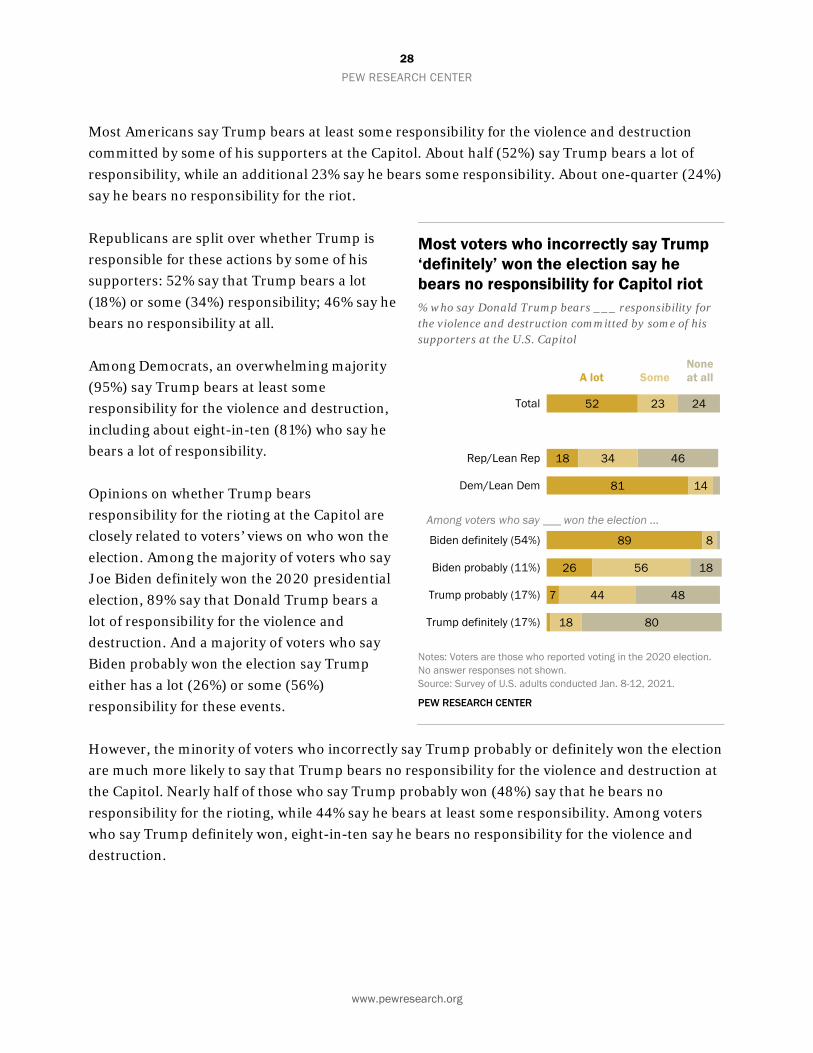
Most Americans say Trump bears at least some responsibility for the violence and destruction committed by some of his supporters at the Capitol. About half (52%) say Trump bears a lot of responsibility, while an additional 23% say he bears some responsibility. About one-quarter (24%) say he bears no responsibility for the riot.
Republicans are split over whether Trump is responsible for these actions by some of his supporters: 52% say that Trump bears a lot (18%) or some (34%) responsibility; 46% say he bears no responsibility at all.
Among Democrats, an overwhelming majority (95%) say Trump bears at least some responsibility for the violence and destruction, including about eight-in-ten (81%) who say he bears a lot of responsibility.
Opinions on whether Trump bears responsibility for the rioting at the Capitol are closely related to voters’ views on who won the election. Among the majority of voters who say Joe Biden definitely won the 2020 presidential election, 89% say that Donald Trump bears a lot of responsibility for the violence and destruction. And a majority of voters who say Biden probably won the election say Trump either has a lot (26%) or some (56%) responsibility for these events.
However, the minority of voters who incorrectly say Trump probably or definitely won the election are much more likely to say that Trump bears no responsibility for the violence and destruction at the Capitol. Nearly half of those who say Trump probably won (48%) say that he bears no responsibility for the rioting, while 44% say he bears at least some responsibility. Among voters who say Trump definitely won, eight-in-ten say he bears no responsibility for the violence and destruction.
Most voters who incorrectly say Trump ‘definitely’ won the election say he bears no responsibility for Capitol riot % who say Donald Trump bears ___ responsibility for the violence and destruction committed by some of his supporters at the U.S. Capitol
Notes: Voters are those who reported voting in the 2020 election. No answer responses not shown. Source: Survey of U.S. adults conducted Jan. 8-12, 2021.
PEW RESEARCH CENTER
52
18
81
89
26
7
23
34
14
8
56
44
18
24
46
18
48
80
Total
Rep/Lean Rep
Dem/Lean Dem
Biden definitely (54%)
Biden probably (11%)
Trump probably (17%)
Trump definitely (17%)
Among voters who say ___ won the election ...
A lot SomeNoneat all
29 PEW RESEARCH CENTER
www.pewresearch.org
Trump’s future as a major U.S. political figure
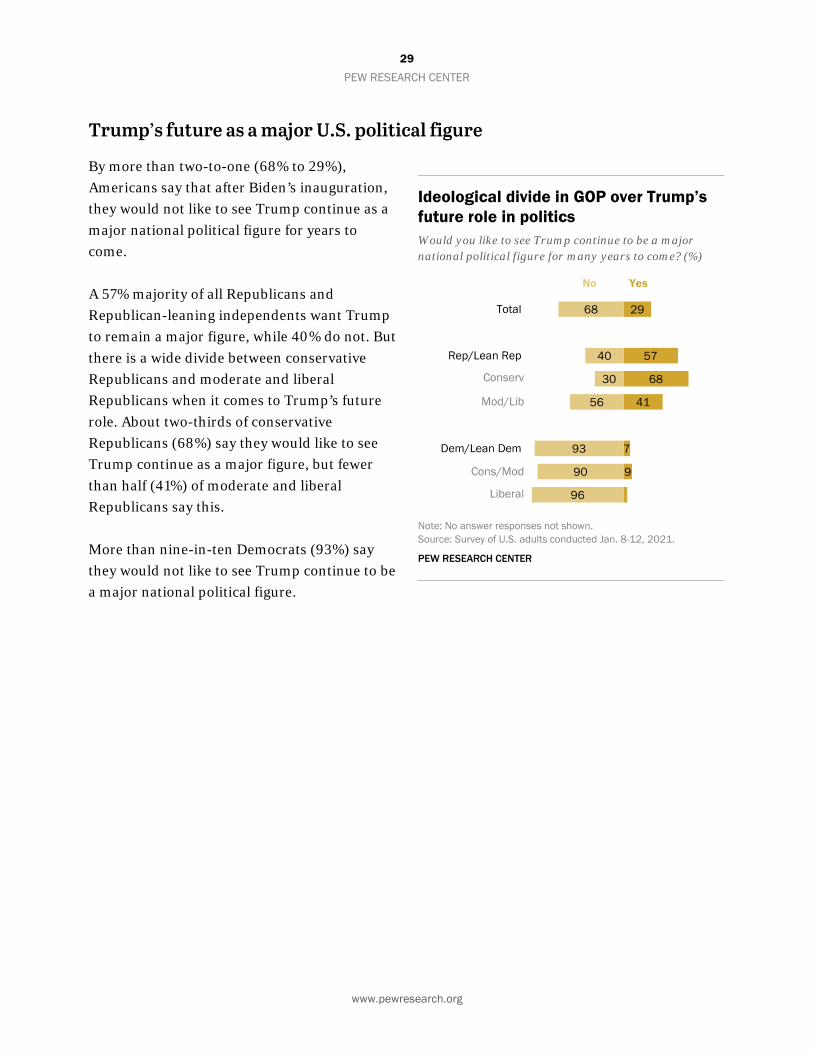
By more than two-to-one (68% to 29%), Americans say that after Biden’s inauguration, they would not like to see Trump continue as a major national political figure for years to come.
A 57% majority of all Republicans and Republican-leaning independents want Trump to remain a major figure, while 40% do not. But there is a wide divide between conservative Republicans and moderate and liberal Republicans when it comes to Trump’s future role. About two-thirds of conservative Republicans (68%) say they would like to see Trump continue as a major figure, but fewer than half (41%) of moderate and liberal Republicans say this.
More than nine-in-ten Democrats (93%) say they would not like to see Trump continue to be a major national political figure.
Ideological divide in GOP over Trump’s future role in politics Would you like to see Trump continue to be a major national political figure for many years to come? (%)
Note: No answer responses not shown. Source: Survey of U.S. adults conducted Jan. 8-12, 2021.
PEW RESEARCH CENTER
29
57
68
41
7
9
68
40
30
56
93
90
96
Total
Rep/Lean Rep
Dem/Lean Dem
Conserv
Mod/Lib
Cons/Mod
Liberal
YesNo
30 PEW RESEARCH CENTER
www.pewresearch.org
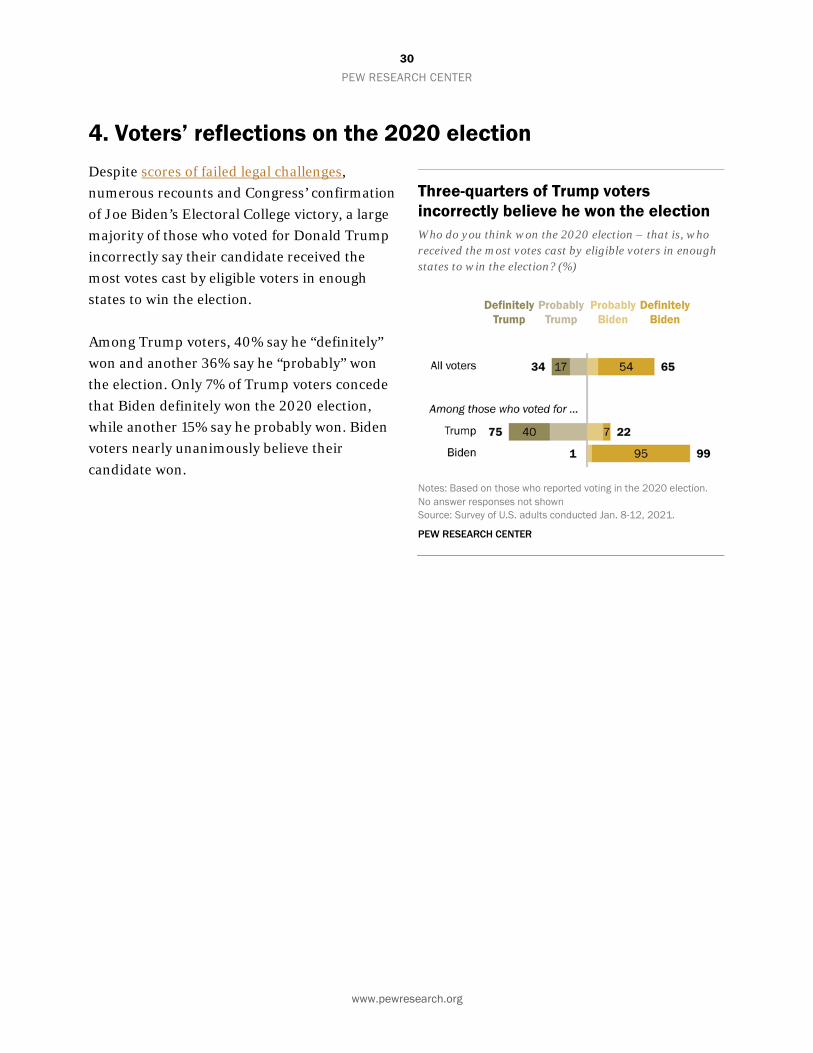
4. Voters’ reflections on the 2020 election Despite scores of failed legal challenges, numerous recounts and Congress’ confirmation of Joe Biden’s Electoral College victory, a large majority of those who voted for Donald Trump incorrectly say their candidate received the most votes cast by eligible voters in enough states to win the election.
Among Trump voters, 40% say he “definitely” won and another 36% say he “probably” won the election. Only 7% of Trump voters concede that Biden definitely won the 2020 election, while another 15% say he probably won. Biden voters nearly unanimously believe their candidate won.
Three-quarters of Trump voters incorrectly believe he won the election Who do you think won the 2020 election – that is, who received the most votes cast by eligible voters in enough states to win the election? (%)
Notes: Based on those who reported voting in the 2020 election. No answer responses not shown Source: Survey of U.S. adults conducted Jan. 8-12, 2021.
PEW RESEARCH CENTER
31 PEW RESEARCH CENTER
www.pewresearch.org
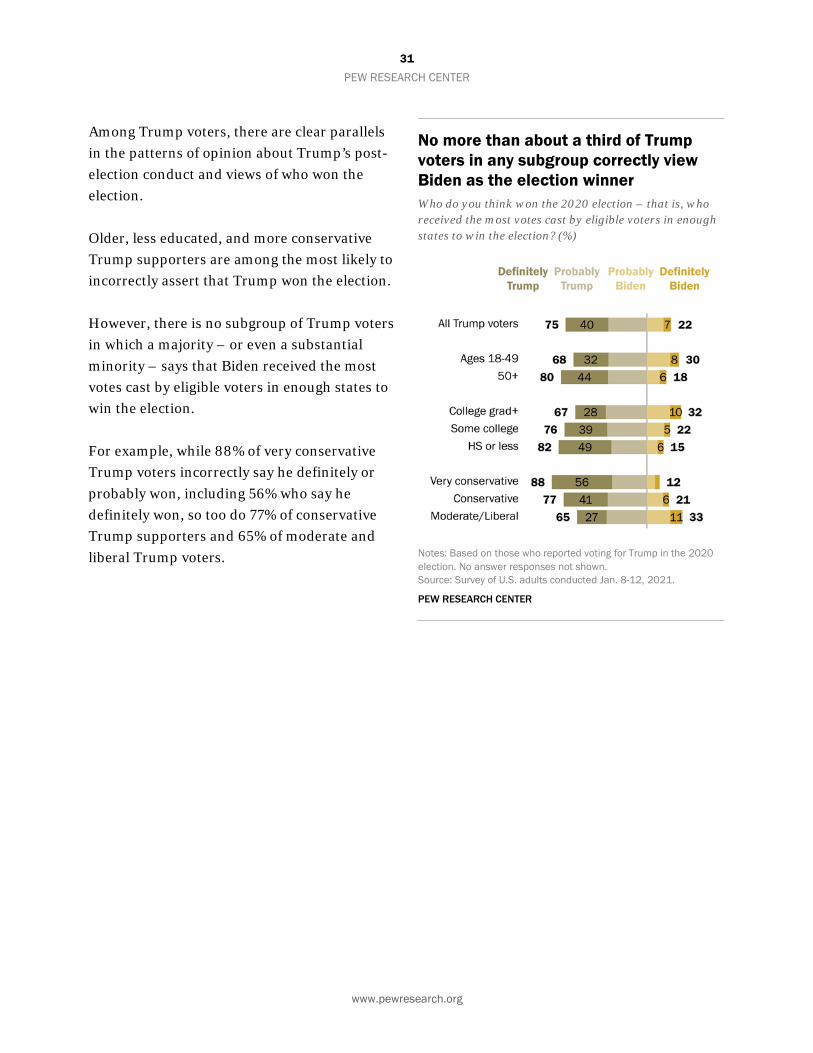
Among Trump voters, there are clear parallels in the patterns of opinion about Trump’s post-election conduct and views of who won the election.
Older, less educated, and more conservative Trump supporters are among the most likely to incorrectly assert that Trump won the election.
However, there is no subgroup of Trump voters in which a majority – or even a substantial minority – says that Biden received the most votes cast by eligible voters in enough states to win the election.
For example, while 88% of very conservative Trump voters incorrectly say he definitely or probably won, including 56% who say he definitely won, so too do 77% of conservative Trump supporters and 65% of moderate and liberal Trump voters.
No more than about a third of Trump voters in any subgroup correctly view Biden as the election winner Who do you think won the 2020 election – that is, who received the most votes cast by eligible voters in enough states to win the election? (%)
Notes: Based on those who reported voting for Trump in the 2020 election. No answer responses not shown. Source: Survey of U.S. adults conducted Jan. 8-12, 2021.
PEW RESEARCH CENTER
32 PEW RESEARCH CENTER
www.pewresearch.org
Major reasons for election result: Voters were excited to oppose Trump; increased early and mail voting; Trump’s mishandling of coronavirus
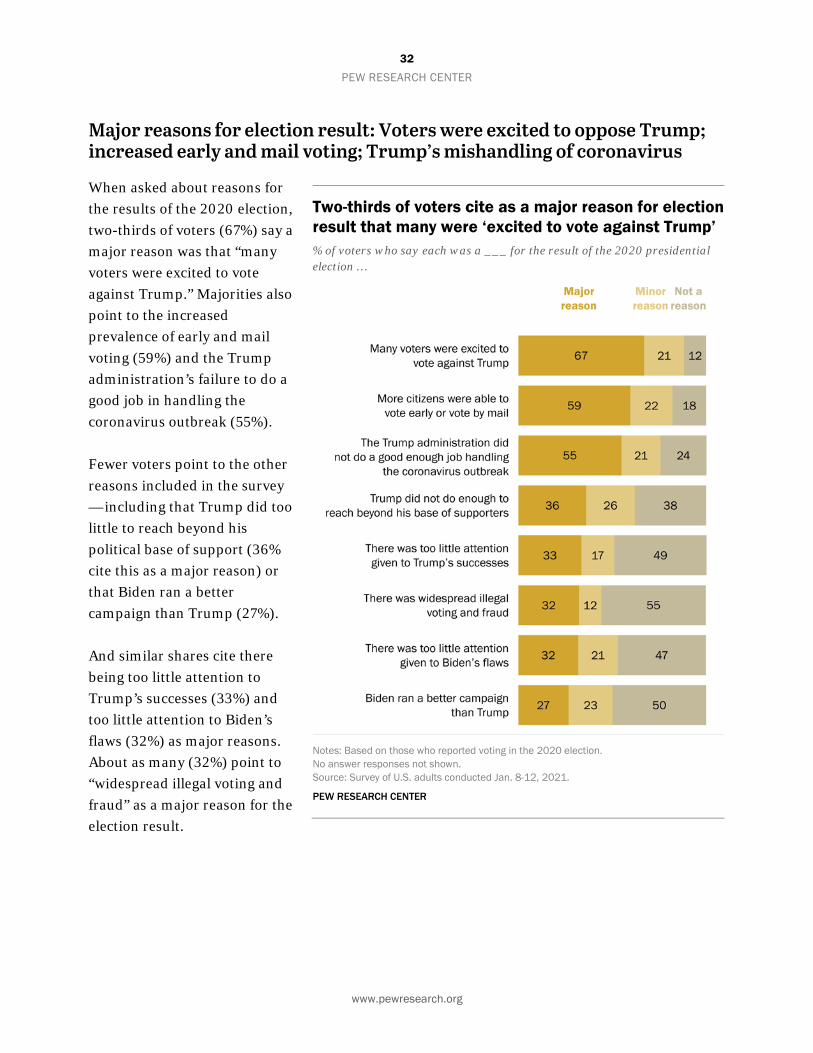
When asked about reasons for the results of the 2020 election, two-thirds of voters (67%) say a major reason was that “many voters were excited to vote against Trump.” Majorities also point to the increased prevalence of early and mail voting (59%) and the Trump administration’s failure to do a good job in handling the coronavirus outbreak (55%).
Fewer voters point to the other reasons included in the survey — including that Trump did too little to reach beyond his political base of support (36% cite this as a major reason) or that Biden ran a better campaign than Trump (27%).
And similar shares cite there being too little attention to Trump’s successes (33%) and too little attention to Biden’s flaws (32%) as major reasons. About as many (32%) point to “widespread illegal voting and fraud” as a major reason for the election result.
Two-thirds of voters cite as a major reason for election result that many were ‘excited to vote against Trump’ % of voters who say each was a ___ for the result of the 2020 presidential election …
Notes: Based on those who reported voting in the 2020 election. No answer responses not shown. Source: Survey of U.S. adults conducted Jan. 8-12, 2021.
PEW RESEARCH CENTER
33 PEW RESEARCH CENTER
www.pewresearch.org
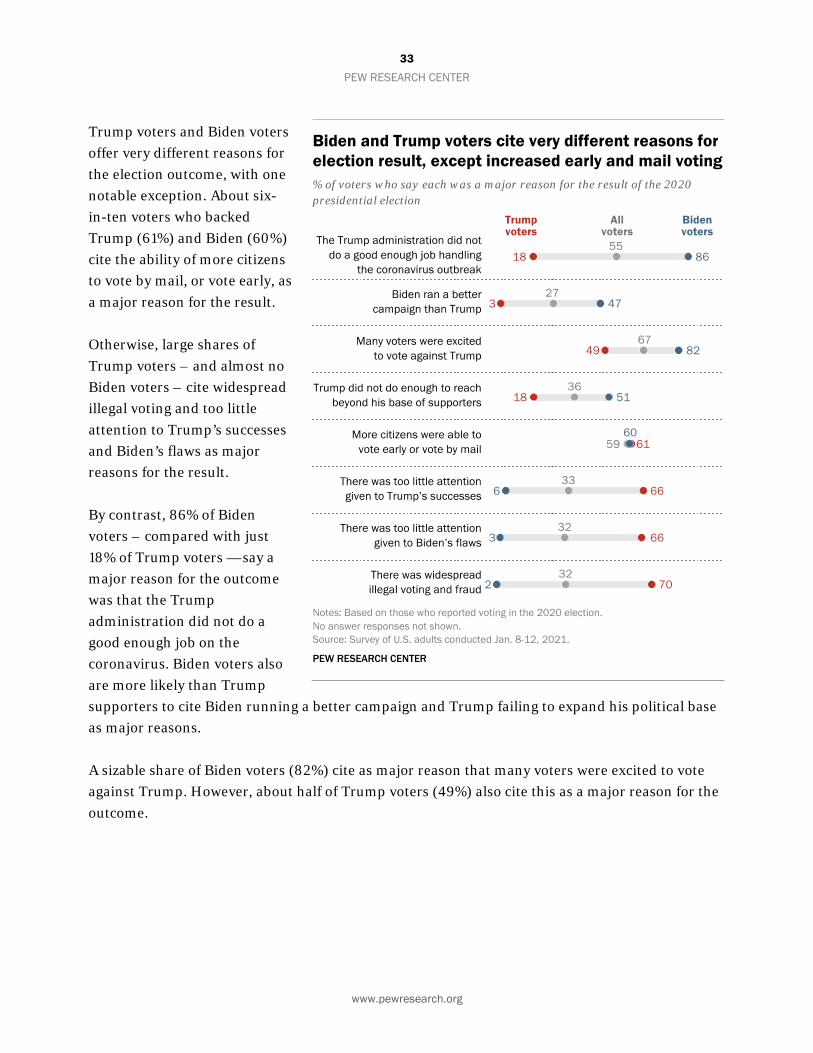
Trump voters and Biden voters offer very different reasons for the election outcome, with one notable exception. About six-in-ten voters who backed Trump (61%) and Biden (60%) cite the ability of more citizens to vote by mail, or vote early, as a major reason for the result.
Otherwise, large shares of Trump voters – and almost no Biden voters – cite widespread illegal voting and too little attention to Trump’s successes and Biden’s flaws as major reasons for the result.
By contrast, 86% of Biden voters – compared with just 18% of Trump voters — say a major reason for the outcome was that the Trump administration did not do a good enough job on the coronavirus. Biden voters also are more likely than Trump supporters to cite Biden running a better campaign and Trump failing to expand his political base as major reasons.
A sizable share of Biden voters (82%) cite as major reason that many voters were excited to vote against Trump. However, about half of Trump voters (49%) also cite this as a major reason for the outcome.
Biden and Trump voters cite very different reasons for election result, except increased early and mail voting % of voters who say each was a major reason for the result of the 2020 presidential election
Notes: Based on those who reported voting in the 2020 election. No answer responses not shown. Source: Survey of U.S. adults conducted Jan. 8-12, 2021.
PEW RESEARCH CENTER
34 PEW RESEARCH CENTER
www.pewresearch.org
Most Americans say politicians often or sometimes do illegal things to try to win
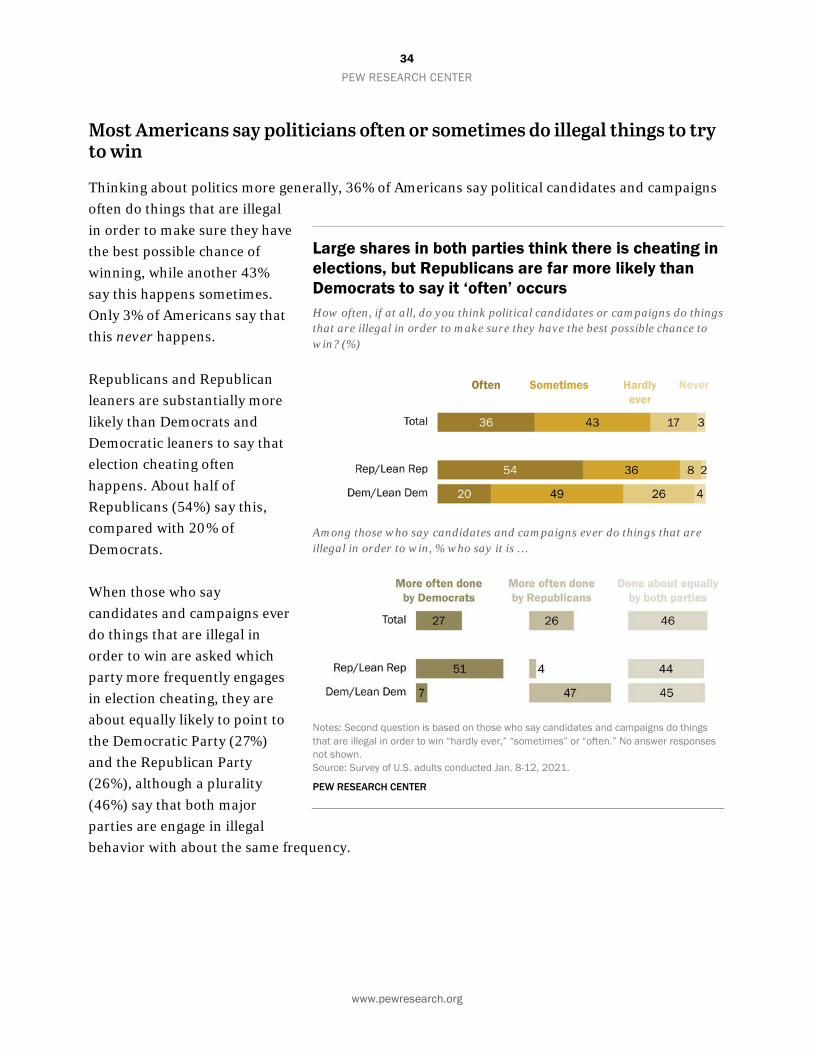
Thinking about politics more generally, 36% of Americans say political candidates and campaigns often do things that are illegal in order to make sure they have the best possible chance of winning, while another 43% say this happens sometimes. Only 3% of Americans say that this never happens.
Republicans and Republican leaners are substantially more likely than Democrats and Democratic leaners to say that election cheating often happens. About half of Republicans (54%) say this, compared with 20% of Democrats.
When those who say candidates and campaigns ever do things that are illegal in order to win are asked which party more frequently engages in election cheating, they are about equally likely to point to the Democratic Party (27%) and the Republican Party (26%), although a plurality (46%) say that both major parties are engage in illegal behavior with about the same frequency.
Large shares in both parties think there is cheating in elections, but Republicans are far more likely than Democrats to say it ‘often’ occurs How often, if at all, do you think political candidates or campaigns do things that are illegal in order to make sure they have the best possible chance to win? (%)
Among those who say candidates and campaigns ever do things that are illegal in order to win, % who say it is …
Notes: Second question is based on those who say candidates and campaigns do things that are illegal in order to win “hardly ever,” “sometimes” or “often.” No answer responses not shown. Source: Survey of U.S. adults conducted Jan. 8-12, 2021.
PEW RESEARCH CENTER
35 PEW RESEARCH CENTER
www.pewresearch.org
Partisans are more likely to point to the other party as cheating more frequently, but relatively large minorities of both Republicans (44%) and Democrats (45%) say that both sides engage in illegal activity about equally.
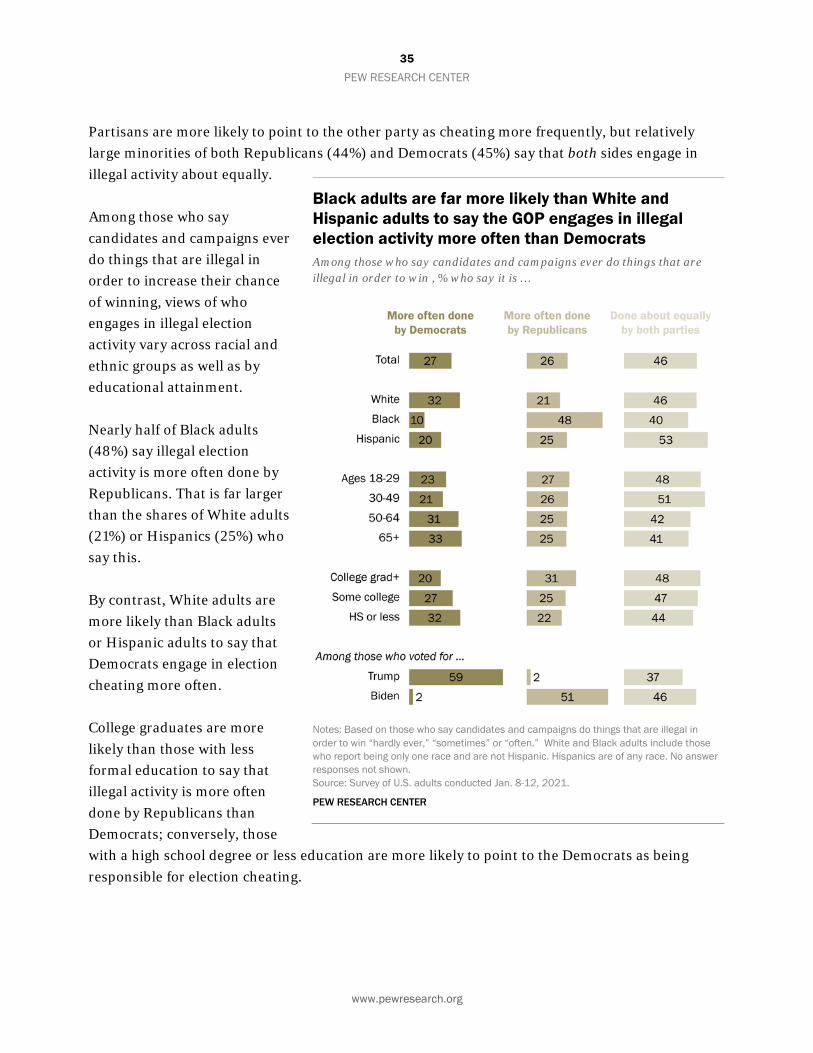
Among those who say candidates and campaigns ever do things that are illegal in order to increase their chance of winning, views of who engages in illegal election activity vary across racial and ethnic groups as well as by educational attainment.
Nearly half of Black adults (48%) say illegal election activity is more often done by Republicans. That is far larger than the shares of White adults (21%) or Hispanics (25%) who say this.
By contrast, White adults are more likely than Black adults or Hispanic adults to say that Democrats engage in election cheating more often.
College graduates are more likely than those with less formal education to say that illegal activity is more often done by Republicans than Democrats; conversely, those with a high school degree or less education are more likely to point to the Democrats as being responsible for election cheating.
Black adults are far more likely than White and Hispanic adults to say the GOP engages in illegal election activity more often than Democrats Among those who say candidates and campaigns ever do things that are illegal in order to win , % who say it is …
Notes: Based on those who say candidates and campaigns do things that are illegal in order to win “hardly ever,” “sometimes” or “often.” White and Black adults include those who report being only one race and are not Hispanic. Hispanics are of any race. No answer responses not shown. Source: Survey of U.S. adults conducted Jan. 8-12, 2021.
PEW RESEARCH CENTER
36 PEW RESEARCH CENTER
www.pewresearch.org
Acknowledgments This report is a collaborative effort based on the input and analysis of the following individuals:
Research team
Carroll Doherty, Director, Political Research Jocelyn Kiley, Associate Director, Political Research Baxter Oliphant, Senior Researcher Andrew Daniller, Research Associate Bradley Jones, Research Associate Hannah Hartig, Research Associate Amina Dunn, Research Analyst Ted Van Green, Research Assistant Vianney Gomez, Research Assistant
Communications and editorial Nida Asheer, Communications Manager Calvin Jordan, Communications Associate David Kent, Senior Copy Editor Graphic design and web publishing Alissa Scheller, Information Graphics Designer Reem Nadeem, Associate Digital Producer Methodology Andrew Mercer, Senior Research Methodologist Nick Bertoni, Senior Panel Manager Arnold Lau, Research Analyst
Others at Pew Research Center also gave valuable assistance on this project, including Research Associate Shannon Schumacher and Research Assistant Jesse Bennett.
37 PEW RESEARCH CENTER
www.pewresearch.org
Methodology The American Trends Panel survey methodology
Overview
The American Trends Panel (ATP), created by Pew Research Center, is a nationally representative panel of randomly selected U.S. adults. Panelists participate via self-administered web surveys. Panelists who do not have internet access at home are provided with a tablet and wireless internet connection. Interviews are conducted in both English and Spanish. The panel is being managed by Ipsos.
Data in this report is drawn from the panel wave conducted Jan. 8 to Jan 12, 2021. A total of 5,360 panelists responded out of 6,107 who were sampled, for a response rate of 88%. This does not include two panelists who were removed from the data due to extremely high rates of refusal or straightlining. The cumulative response rate accounting for nonresponse to the recruitment surveys and attrition is 4%. The break-off rate among panelists who logged on to the survey and completed at least one item is 1%. The margin of sampling error for the full sample of 5,360 respondents is plus or minus 1.9 percentage points.
Panel recruitment
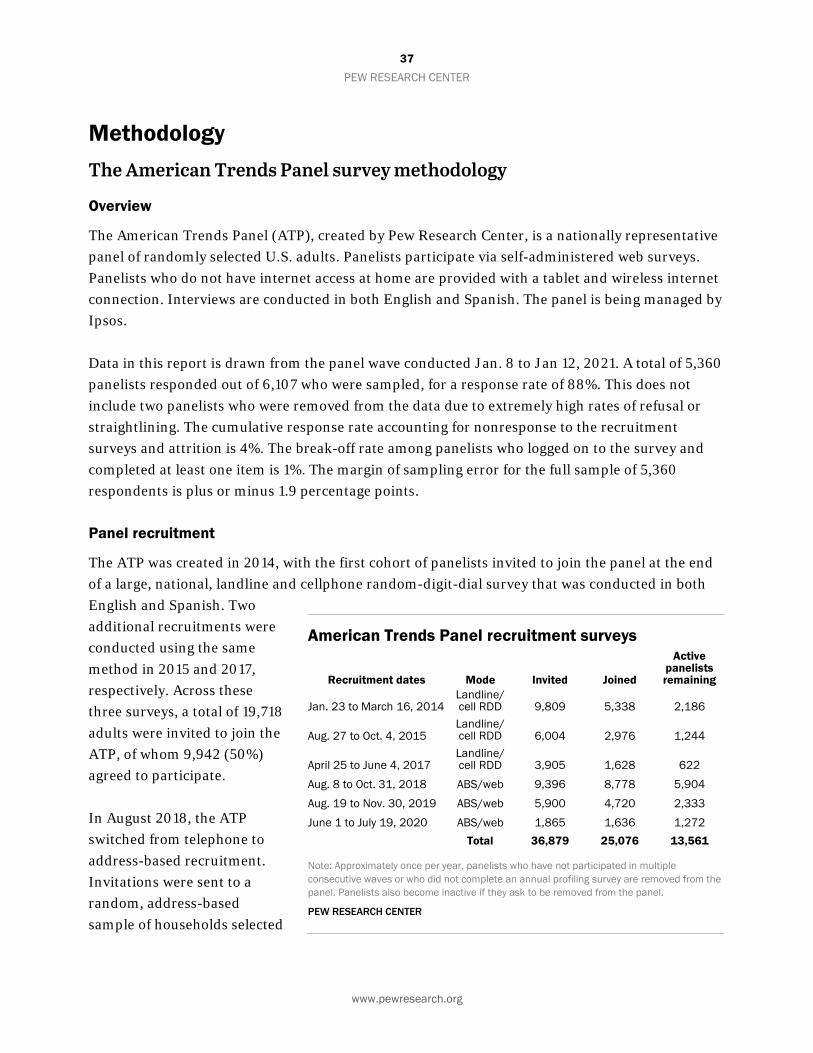
The ATP was created in 2014, with the first cohort of panelists invited to join the panel at the end of a large, national, landline and cellphone random-digit-dial survey that was conducted in both English and Spanish. Two additional recruitments were conducted using the same method in 2015 and 2017, respectively. Across these three surveys, a total of 19,718 adults were invited to join the ATP, of whom 9,942 (50%) agreed to participate.
In August 2018, the ATP switched from telephone to address-based recruitment. Invitations were sent to a random, address-based sample of households selected
American Trends Panel recruitment surveys
Recruitment dates Mode Invited Joined
Active panelists remaining
Jan. 23 to March 16, 2014 Landline/ cell RDD 9,809 5,338 2,186
Aug. 27 to Oct. 4, 2015 Landline/ cell RDD 6,004 2,976 1,244
April 25 to June 4, 2017 Landline/ cell RDD 3,905 1,628 622
Aug. 8 to Oct. 31, 2018 ABS/web 9,396 8,778 5,904 Aug. 19 to Nov. 30, 2019 ABS/web 5,900 4,720 2,333 June 1 to July 19, 2020 ABS/web 1,865 1,636 1,272 Total 36,879 25,076 13,561
Note: Approximately once per year, panelists who have not participated in multiple consecutive waves or who did not complete an annual profiling survey are removed from the panel. Panelists also become inactive if they ask to be removed from the panel.
PEW RESEARCH CENTER
38 PEW RESEARCH CENTER
www.pewresearch.org
from the U.S. Postal Service’s Delivery Sequence File. Two additional recruitments were conducted using the same method in 2019 and 2020, respectively. Across these three address-based recruitments, a total of 17,161 adults were invited to join the ATP, of whom 15,134 (88%) agreed to join the panel and completed an initial profile survey. In each household, the adult with the next birthday was asked to go online to complete a survey, at the end of which they were invited to join the panel. Of the 25,076 individuals who have ever joined the ATP, 13,561 remained active panelists and continued to receive survey invitations at the time this survey was conducted.
The U.S. Postal Service’s Delivery Sequence File has been estimated to cover as much as 98% of the population, although some studies suggest that the coverage could be in the low 90% range.1 The American Trends Panel never uses breakout routers or chains that direct respondents to additional surveys.
Sample design
This study featured a stratified random sample from the ATP. The sample was allocated according to the following strata, in order: tablet households, U.S.-born Hispanics, foreign-born Hispanics, high school education or less, foreign-born Asians, not registered to vote, people ages 18 to 34, uses internet weekly or less, non-Hispanic Black adults, nonvolunteers and all other categories not already falling into any of the above.
Questionnaire development and testing
The questionnaire was developed by Pew Research Center in consultation with Ipsos. The web program was rigorously tested on both PC and mobile devices by the Ipsos project management team and Pew Research Center researchers. The Ipsos project management team also populated test data which was analyzed in SPSS to ensure the logic and randomizations were working as intended before launching the survey.
Incentives
All respondents were offered a post-paid incentive for their participation. Respondents could choose to receive the post-paid incentive in the form of a check or a gift code to Amazon.com or could choose to decline the incentive. Incentive amounts ranged from $5 to $15 depending on whether the respondent belongs to a part of the population that is harder or easier to reach. Differential incentive amounts were designed to increase panel survey participation among groups that traditionally have low survey response propensities.
1 AAPOR Task Force on Address-based Sampling. 2016. “AAPOR Report: Address-based Sampling.”
39 PEW RESEARCH CENTER
www.pewresearch.org
Data collection protocol
The data collection field period for this survey was Jan. 8 to Jan. 12, 2021. Postcard notifications were mailed to all ATP panelists with a known residential address on Jan. 6, 2021.
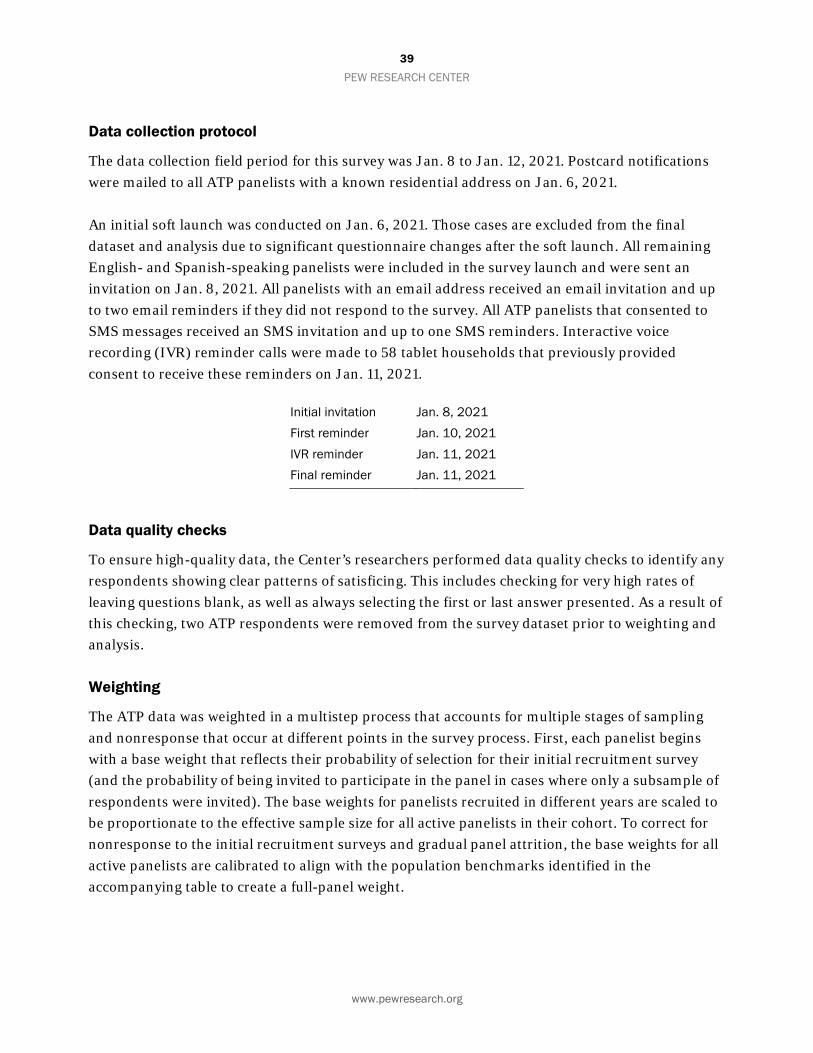
An initial soft launch was conducted on Jan. 6, 2021. Those cases are excluded from the final dataset and analysis due to significant questionnaire changes after the soft launch. All remaining English- and Spanish-speaking panelists were included in the survey launch and were sent an invitation on Jan. 8, 2021. All panelists with an email address received an email invitation and up to two email reminders if they did not respond to the survey. All ATP panelists that consented to SMS messages received an SMS invitation and up to one SMS reminders. Interactive voice recording (IVR) reminder calls were made to 58 tablet households that previously provided consent to receive these reminders on Jan. 11, 2021.
Initial invitation Jan. 8, 2021 First reminder Jan. 10, 2021 IVR reminder Jan. 11, 2021 Final reminder Jan. 11, 2021
Data quality checks
To ensure high-quality data, the Center’s researchers performed data quality checks to identify any respondents showing clear patterns of satisficing. This includes checking for very high rates of leaving questions blank, as well as always selecting the first or last answer presented. As a result of this checking, two ATP respondents were removed from the survey dataset prior to weighting and analysis.
Weighting
The ATP data was weighted in a multistep process that accounts for multiple stages of sampling and nonresponse that occur at different points in the survey process. First, each panelist begins with a base weight that reflects their probability of selection for their initial recruitment survey (and the probability of being invited to participate in the panel in cases where only a subsample of respondents were invited). The base weights for panelists recruited in different years are scaled to be proportionate to the effective sample size for all active panelists in their cohort. To correct for nonresponse to the initial recruitment surveys and gradual panel attrition, the base weights for all active panelists are calibrated to align with the population benchmarks identified in the accompanying table to create a full-panel weight.
40 PEW RESEARCH CENTER
www.pewresearch.org
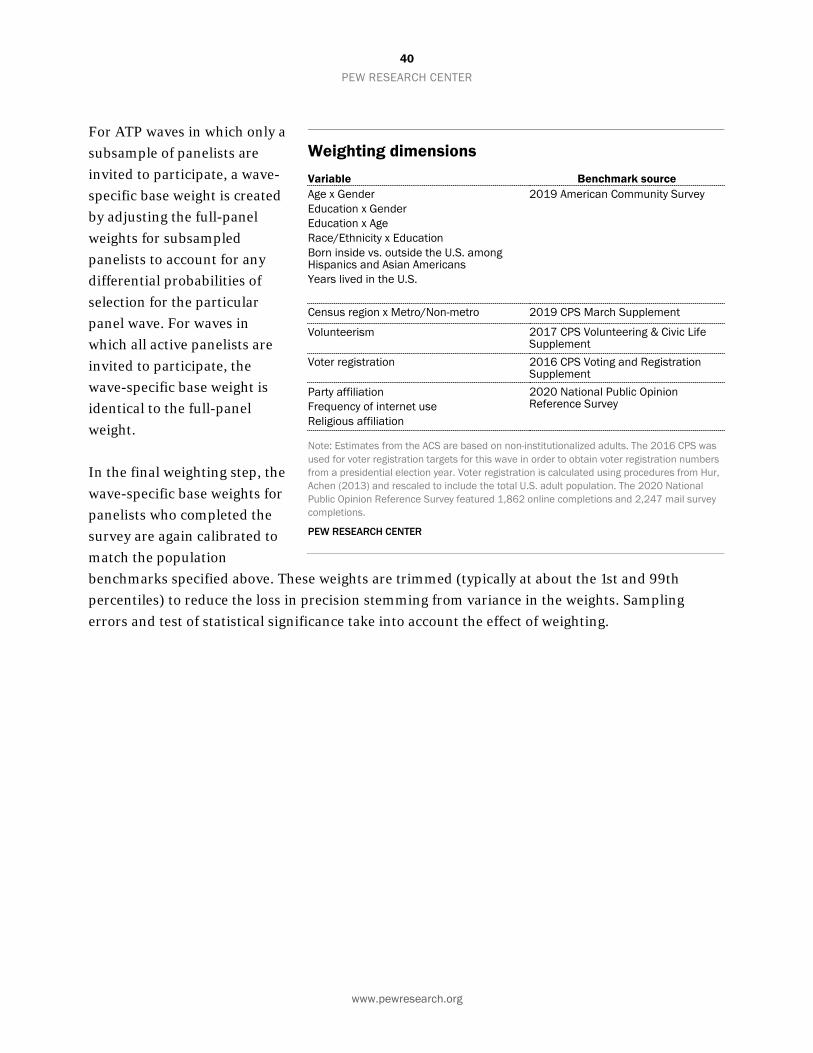
For ATP waves in which only a subsample of panelists are invited to participate, a wave-specific base weight is created by adjusting the full-panel weights for subsampled panelists to account for any differential probabilities of selection for the particular panel wave. For waves in which all active panelists are invited to participate, the wave-specific base weight is identical to the full-panel weight.
In the final weighting step, the wave-specific base weights for panelists who completed the survey are again calibrated to match the population benchmarks specified above. These weights are trimmed (typically at about the 1st and 99th percentiles) to reduce the loss in precision stemming from variance in the weights. Sampling errors and test of statistical significance take into account the effect of weighting.
Weighting dimensions Variable Benchmark source Age x Gender Education x Gender Education x Age Race/Ethnicity x Education Born inside vs. outside the U.S. among Hispanics and Asian Americans Years lived in the U.S.
2019 American Community Survey
Census region x Metro/Non-metro 2019 CPS March Supplement
Volunteerism 2017 CPS Volunteering & Civic Life Supplement
Voter registration 2016 CPS Voting and Registration Supplement
Party affiliation Frequency of internet use Religious affiliation
2020 National Public Opinion Reference Survey
Note: Estimates from the ACS are based on non-institutionalized adults. The 2016 CPS was used for voter registration targets for this wave in order to obtain voter registration numbers from a presidential election year. Voter registration is calculated using procedures from Hur, Achen (2013) and rescaled to include the total U.S. adult population. The 2020 National Public Opinion Reference Survey featured 1,862 online completions and 2,247 mail survey completions.
PEW RESEARCH CENTER
41 PEW RESEARCH CENTER
www.pewresearch.org
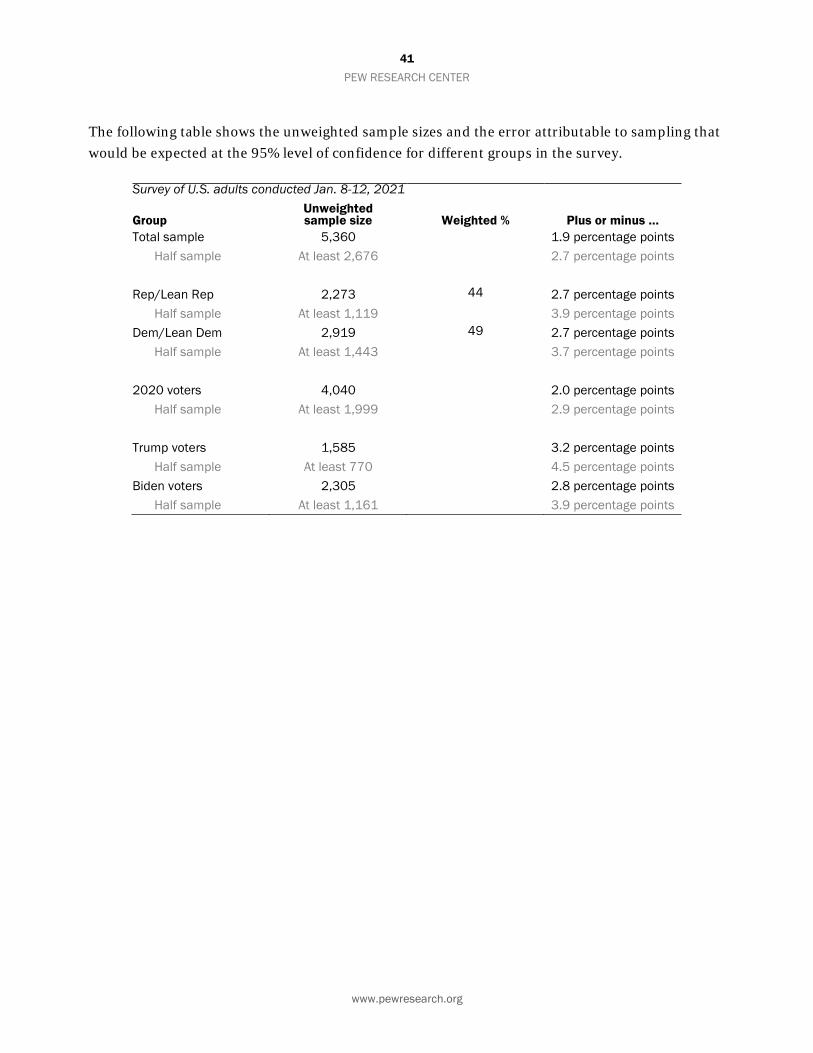
The following table shows the unweighted sample sizes and the error attributable to sampling that would be expected at the 95% level of confidence for different groups in the survey.
Survey of U.S. adults conducted Jan. 8-12, 2021
Group Unweighted sample size Weighted % Plus or minus …
Total sample 5,360 1.9 percentage points Half sample At least 2,676 2.7 percentage points
Rep/Lean Rep 2,273 44 2.7 percentage points
Half sample At least 1,119 3.9 percentage points Dem/Lean Dem 2,919 49 2.7 percentage points
Half sample At least 1,443 3.7 percentage points
2020 voters 4,040 2.0 percentage points Half sample At least 1,999 2.9 percentage points
Trump voters 1,585 3.2 percentage points
Half sample At least 770 4.5 percentage points Biden voters 2,305 2.8 percentage points
Half sample At least 1,161 3.9 percentage points
42 PEW RESEARCH CENTER
www.pewresearch.org
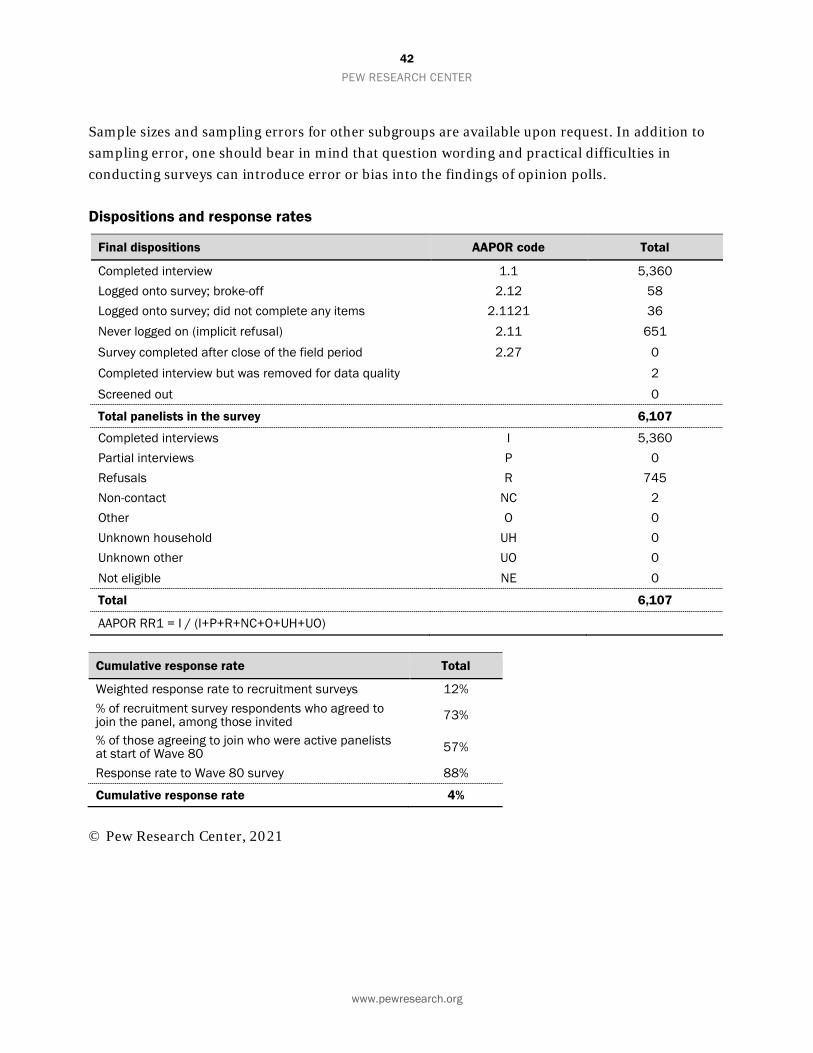
Sample sizes and sampling errors for other subgroups are available upon request. In addition to sampling error, one should bear in mind that question wording and practical difficulties in conducting surveys can introduce error or bias into the findings of opinion polls.
Dispositions and response rates
Final dispositions AAPOR code Total
Completed interview 1.1 5,360 Logged onto survey; broke-off 2.12 58 Logged onto survey; did not complete any items 2.1121 36 Never logged on (implicit refusal) 2.11 651 Survey completed after close of the field period 2.27 0 Completed interview but was removed for data quality 2 Screened out 0
Total panelists in the survey 6,107
Completed interviews I 5,360 Partial interviews P 0 Refusals R 745 Non-contact NC 2 Other O 0 Unknown household UH 0 Unknown other UO 0 Not eligible NE 0
Total 6,107
AAPOR RR1 = I / (I+P+R+NC+O+UH+UO)
Cumulative response rate Total
Weighted response rate to recruitment surveys 12% % of recruitment survey respondents who agreed to join the panel, among those invited 73%
% of those agreeing to join who were active panelists at start of Wave 80 57%
Response rate to Wave 80 survey 88%
Cumulative response rate 4%
© Pew Research Center, 2021
43 PEW RESEARCH CENTER
www.pewresearch.org
2021 PEW RESEARCH CENTER’S AMERICAN TRENDS PANEL WAVE 80 JANUARY 2021
FINAL TOPLINE JANUARY 8-12, 2021
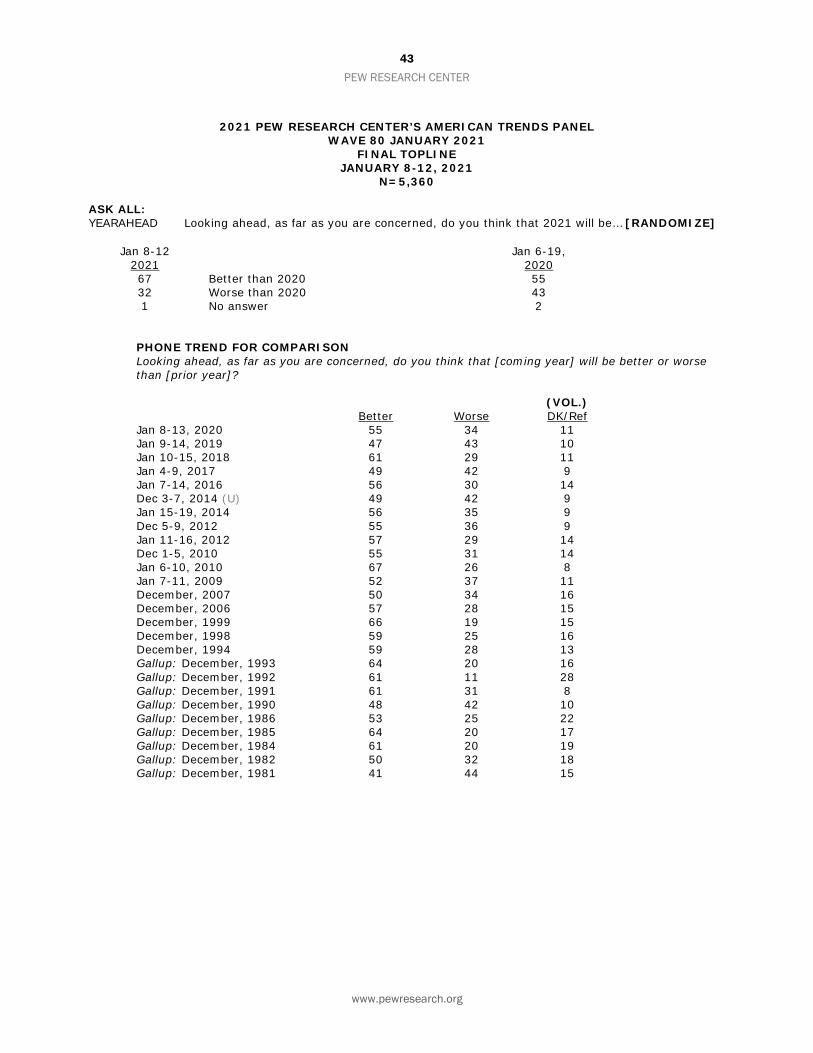
N=5,360 ASK ALL: YEARAHEAD Looking ahead, as far as you are concerned, do you think that 2021 will be… [RANDOMIZE]
Jan 8-12 2021
Jan 6-19, 2020
67 Better than 2020 55 32 Worse than 2020 43 1 No answer 2
PHONE TREND FOR COMPARISON
Looking ahead, as far as you are concerned, do you think that [coming year] will be better or worse than [prior year]?
(VOL.) Better Worse DK/Ref Jan 8-13, 2020 55 34 11 Jan 9-14, 2019 47 43 10 Jan 10-15, 2018 61 29 11 Jan 4-9, 2017 49 42 9 Jan 7-14, 2016 56 30 14 Dec 3-7, 2014 (U) 49 42 9 Jan 15-19, 2014 56 35 9 Dec 5-9, 2012 55 36 9 Jan 11-16, 2012 57 29 14 Dec 1-5, 2010 55 31 14 Jan 6-10, 2010 67 26 8 Jan 7-11, 2009 52 37 11 December, 2007 50 34 16 December, 2006 57 28 15 December, 1999 66 19 15 December, 1998 59 25 16 December, 1994 59 28 13 Gallup: December, 1993 64 20 16 Gallup: December, 1992 61 11 28 Gallup: December, 1991 61 31 8 Gallup: December, 1990 48 42 10 Gallup: December, 1986 53 25 22 Gallup: December, 1985 64 20 17 Gallup: December, 1984 61 20 19 Gallup: December, 1982 50 32 18 Gallup: December, 1981 41 44 15
44 PEW RESEARCH CENTER
www.pewresearch.org
ASK ALL: POL1DT Do you approve or disapprove of the way Donald Trump is handling his job as president?
Approve Disapprove No answer Jan 8-12, 2021 29 68 3 July 27-Aug 2, 2020 38 59 3 June 16-22, 2020 39 59 2 Apr 7-12, 2020 44 53 3 Mar 19-24, 2020 45 52 2 Jan 6-19, 2020 40 58 1 Sep 3-15, 2019 40 59 1 July 22-Aug 4, 2019 40 59 1 Apr 29-May 13, 2019 40 59 1 Feb 4-17, 2019 38 61 1 Nov 7-13, 2018 41 58 1 Sep 24-Oct 7, 2018 38 61 2 Jul 30-Aug 12, 2018 40 59 2 Jan 29-Feb 13, 2018 38 60 2 Aug 8-21, 2017 36 63 1 Apr 4-18, 2017 39 61 1 Feb 28-Mar 12, 20172 44 56 1
ASK ALL: POL1DT Do you approve or disapprove of the way Donald Trump is handling his job as president? ASK IF ANSWERED POL1DT (POL1DT=1,2) [N=5,229]: POL1DTSTR Do you [IF POL1DT=1: approve; IF POL1DT=2: disapprove] of the way Donald Trump is
handling his job as president… BASED ON TOTAL:
NET
Approve Very
strongly Not so
strongly No
answer NET
Disapprove Very
strongly Not so
strongly No
answer No
answer Jan 8-12, 2021 29 21 7 * 68 56 12 * 3 June 16-22, 2020 39 29 9 1 59 48 11 * 2 Apr 7-12, 2020 44 33 10 1 53 42 11 * 3 Mar 19-24, 2020 45 34 10 1 52 40 11 * 2 Jan 6-19, 2020 40 31 9 * 58 46 11 1 1 Sep 3-15, 2019 40 31 9 * 58 46 11 1 1 Apr 29-May 13, 2019 40 29 10 * 59 48 10 * 1 Jul 30-Aug 12, 2018 40 31 9 * 59 48 10 * 2 Jan 29-Feb 13, 2018 38 29 9 * 60 48 12 * 2 Aug 8-21, 2017 36 26 10 * 63 49 13 * 1 Apr 4-18, 2017 39 27 12 * 61 45 15 * 1 Feb 28-Mar 12, 20173 44 30 13 * 56 43 12 * 1
2 The W24.5 Mode Study survey was administered by web and phone. Results reported here are from web mode only. 3 The W24.5 Mode Study survey was administered by web and phone. Results reported here are from web mode only.
45 PEW RESEARCH CENTER
www.pewresearch.org
ASK ALL: JAN6HEARD How much, if anything, have you read or heard about rioting at the U.S. Capitol in
Washington DC on January 6, when, following a protest earlier in the day, supporters of Donald Trump broke into the Capitol building while the Senate and House were in the process of certifying Electoral College votes?
Jan 8-12,
2021
69 A lot 28 A little 3 Nothing at all * No answer
ASK ALL: JAN6REACT Please describe, in a few words, your reaction to rioting at the Capitol. [OPEN-END] BASED ON FORM 1 [N=2,684]:
Jan 8-12, 2021
37 NET: Negative emotion 35 Anguished/Awful/Horrified/Shocked 3 Angry 3 Scared/Fearful/Terrified 14 Surprised/concerned about future of country 13 NET: Trump/GOP to blame 12 Trump is to blame 2 Republican leaders to blame 9 NET: Criticism of law enforcement response/preparation 5 Police response too slow/underprepared/inadequate 4 Perpetrators treated differently because they were mostly
white 8 NET: Criminal acts/Punishment needed 5 Coup/Domestic terrorism/sedition 3 Perpetrators need to be punished 8 Doubt/Don’t think it was Trump supporters 6 Not surprised/inevitable 5 NET: Democrats at fault/Rationale was justified 3 Reasons justified 2 Democrats fault 4 It started out peaceful 4 NET: Similar to/Not as bad as Black Lives Matter and other
events 3 Similar to other events like Black Lives Matter 1 Not as bad as Black Lives Matter/other events 2 Not Trump’s fault 1 Criticism of media 1 Entertaining/funny
11 ‘Bad thing’ unspecified/other description 6 Other description/emotion
10 Refused
46 PEW RESEARCH CENTER
www.pewresearch.org
ASK ALL: JAN6_DTRESP How much responsibility, if any, does Donald Trump bear for the violence and
destruction committed by some of his supporters after they broke into the U.S. Capitol?
Jan 8-12,
2021
52 A lot 23 A little 24 Nothing at all 1 No answer
ASK ALL: TRMP_RMV As you know, Donald Trump’s term in office ends Jan. 20. Which do you think would
be better for the country?
Jan 8-12, 2021
45 For Trump to remain in office until his term is completed
54 For Trump to be removed from office, with Mike Pence finishing out the last few days of his term
2 No answer
ASK ALL: PRESINAUG Do you plan to watch Joe Biden’s inauguration later this month?
Jan 8-12, 2021
53 Yes 46 No 1 No answer
PHONE TREND FOR COMPARISON Do you plan to watch __’s inauguration later this month? Trump Obama Clinton US News Jan 4-9
2017 January
2009 January
1993 Yes 46 67 57 No 51 28 32 Don’t know/Refused (VOL.) 2 5 11
47 PEW RESEARCH CENTER
www.pewresearch.org
ASK FORM 1 ONLY [N=2,684]: PRESPLANS Do you approve or disapprove of the job President-elect Biden has done so far in explaining
his policies and plans for the future to the American people?
Jan 8-12, 2021
58 Approve 39 Disapprove 3 No answer
PHONE TRENDS FOR COMPARISON
Do you approve or disapprove of the job President-elect __ has done so far in explaining his policies and plans for the future to the American people?
(VOL.) Approve Disapprove DK/Ref Trump Jan 4-9, 2017 39 55 6 Nov 30-Dec 5, 2016 41 55 4 Obama Jan 7-11, 2009 70 18 12 December, 2008 72 18 10 Bush January, 2001 50 36 14 Clinton January, 1993 62 24 14 Bush Gallup: March, 1989 65 28 7
ASK FORM 2 ONLY [N=2,676]: PRESWHERE Would you say Joe Biden has clear goals for where he wants to lead the country?
Jan 8-12, 2021
58 Yes 40 No 2 No answer
PHONE TREND FOR COMPARISON
Would you say that you have a good idea where Donald Trump wants to lead the country, or would you say his goals are not very clear?
Trump Obama
(RVs) LA Times/Bloomberg4
(RVs) Nov 10-14
2016 Dec 2008
Good idea where Donald Trump wants to lead the country
49 57
His goals are not very clear 49 34 Don’t know/Refused (VOL.) 1 9
4 In LA Times/Bloomberg survey, question was asked of Barack Obama, based on registered voters.
48 PEW RESEARCH CENTER
www.pewresearch.org
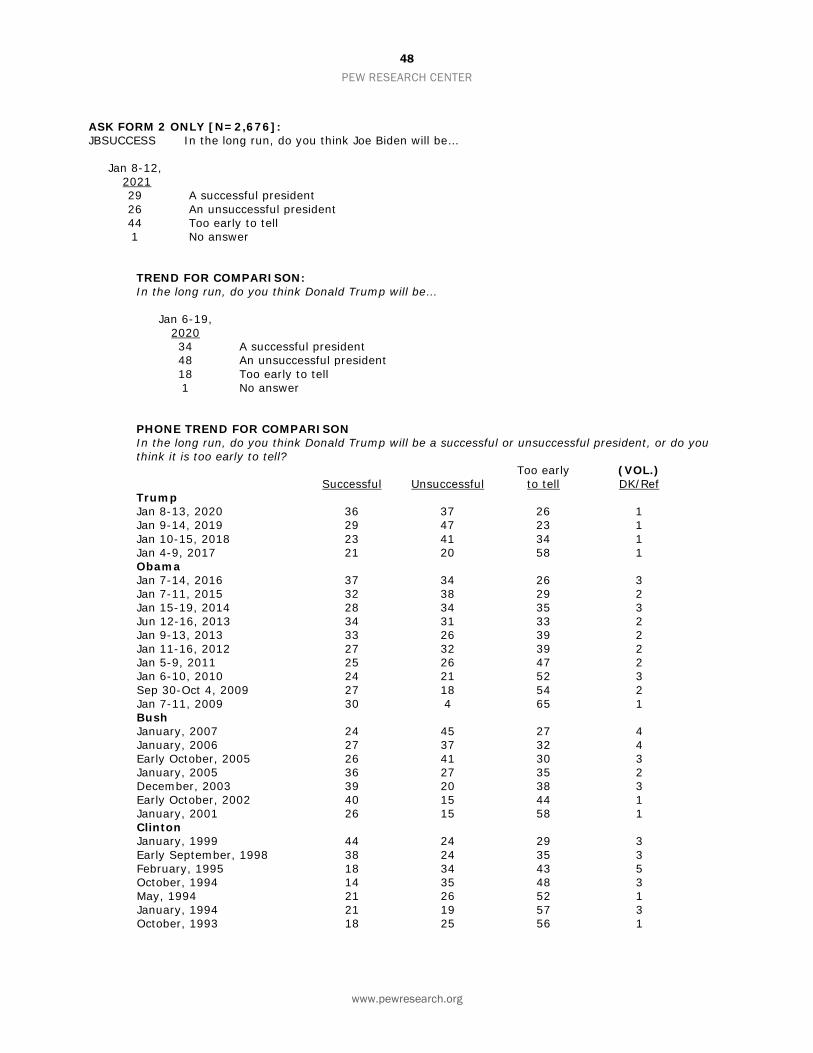
ASK FORM 2 ONLY [N=2,676]: JBSUCCESS In the long run, do you think Joe Biden will be…
Jan 8-12, 2021
29 A successful president 26 An unsuccessful president 44 Too early to tell 1 No answer
TREND FOR COMPARISON: In the long run, do you think Donald Trump will be…
Jan 6-19,
2020
34 A successful president 48 An unsuccessful president 18 Too early to tell 1 No answer
PHONE TREND FOR COMPARISON
In the long run, do you think Donald Trump will be a successful or unsuccessful president, or do you think it is too early to tell?
Too early (VOL.) Successful Unsuccessful to tell DK/Ref Trump Jan 8-13, 2020 36 37 26 1 Jan 9-14, 2019 29 47 23 1 Jan 10-15, 2018 23 41 34 1 Jan 4-9, 2017 21 20 58 1 Obama Jan 7-14, 2016 37 34 26 3 Jan 7-11, 2015 32 38 29 2 Jan 15-19, 2014 28 34 35 3 Jun 12-16, 2013 34 31 33 2 Jan 9-13, 2013 33 26 39 2 Jan 11-16, 2012 27 32 39 2 Jan 5-9, 2011 25 26 47 2 Jan 6-10, 2010 24 21 52 3 Sep 30-Oct 4, 2009 27 18 54 2 Jan 7-11, 2009 30 4 65 1 Bush January, 2007 24 45 27 4 January, 2006 27 37 32 4 Early October, 2005 26 41 30 3 January, 2005 36 27 35 2 December, 2003 39 20 38 3 Early October, 2002 40 15 44 1 January, 2001 26 15 58 1 Clinton January, 1999 44 24 29 3 Early September, 1998 38 24 35 3 February, 1995 18 34 43 5 October, 1994 14 35 48 3 May, 1994 21 26 52 1 January, 1994 21 19 57 3 October, 1993 18 25 56 1
49 PEW RESEARCH CENTER
www.pewresearch.org
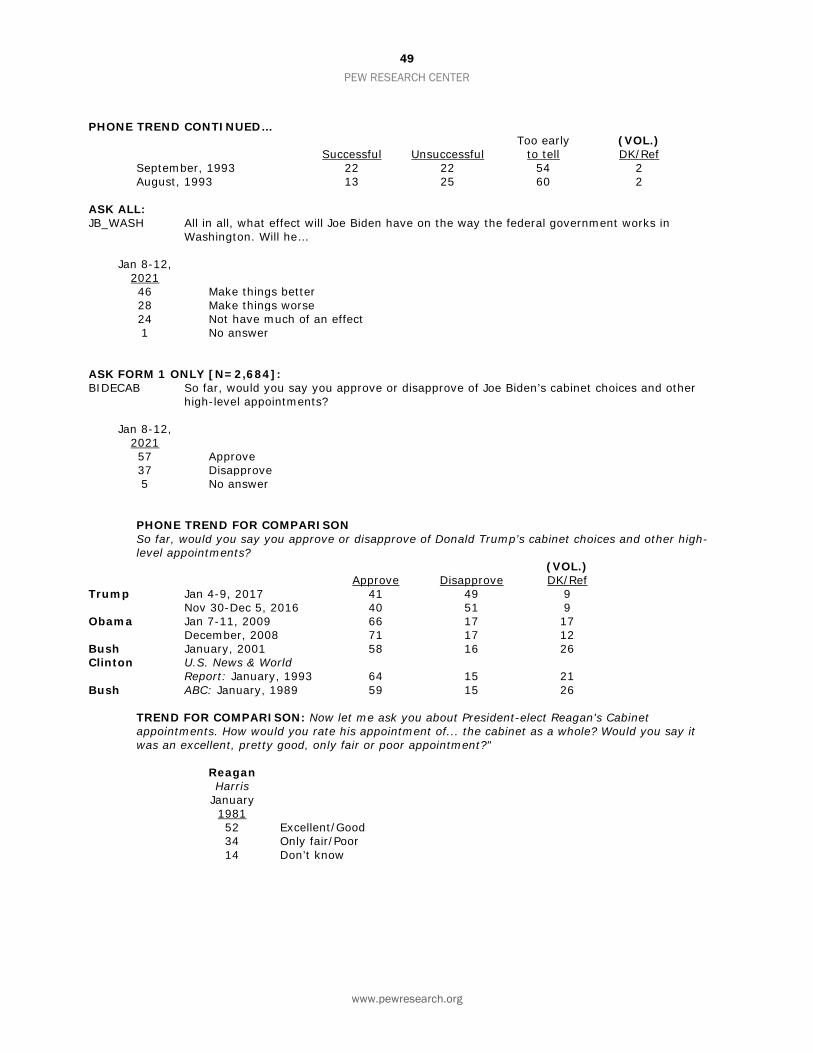
PHONE TREND CONTINUED… Too early (VOL.) Successful Unsuccessful to tell DK/Ref September, 1993 22 22 54 2 August, 1993 13 25 60 2 ASK ALL: JB_WASH All in all, what effect will Joe Biden have on the way the federal government works in
Washington. Will he…
Jan 8-12, 2021
46 Make things better 28 Make things worse 24 Not have much of an effect 1 No answer
ASK FORM 1 ONLY [N=2,684]: BIDECAB So far, would you say you approve or disapprove of Joe Biden’s cabinet choices and other
high-level appointments?
Jan 8-12, 2021
57 Approve 37 Disapprove 5 No answer
PHONE TREND FOR COMPARISON
So far, would you say you approve or disapprove of Donald Trump’s cabinet choices and other high-level appointments?
(VOL.) Approve Disapprove DK/Ref Trump Jan 4-9, 2017 41 49 9 Nov 30-Dec 5, 2016 40 51 9 Obama Jan 7-11, 2009 66 17 17 December, 2008 71 17 12 Bush January, 2001 58 16 26 Clinton U.S. News & World Report: January, 1993 64 15 21 Bush ABC: January, 1989 59 15 26
TREND FOR COMPARISON: Now let me ask you about President-elect Reagan's Cabinet appointments. How would you rate his appointment of... the cabinet as a whole? Would you say it was an excellent, pretty good, only fair or poor appointment?"
Reagan Harris January 1981 52 Excellent/Good 34 Only fair/Poor 14 Don’t know
50 PEW RESEARCH CENTER
www.pewresearch.org
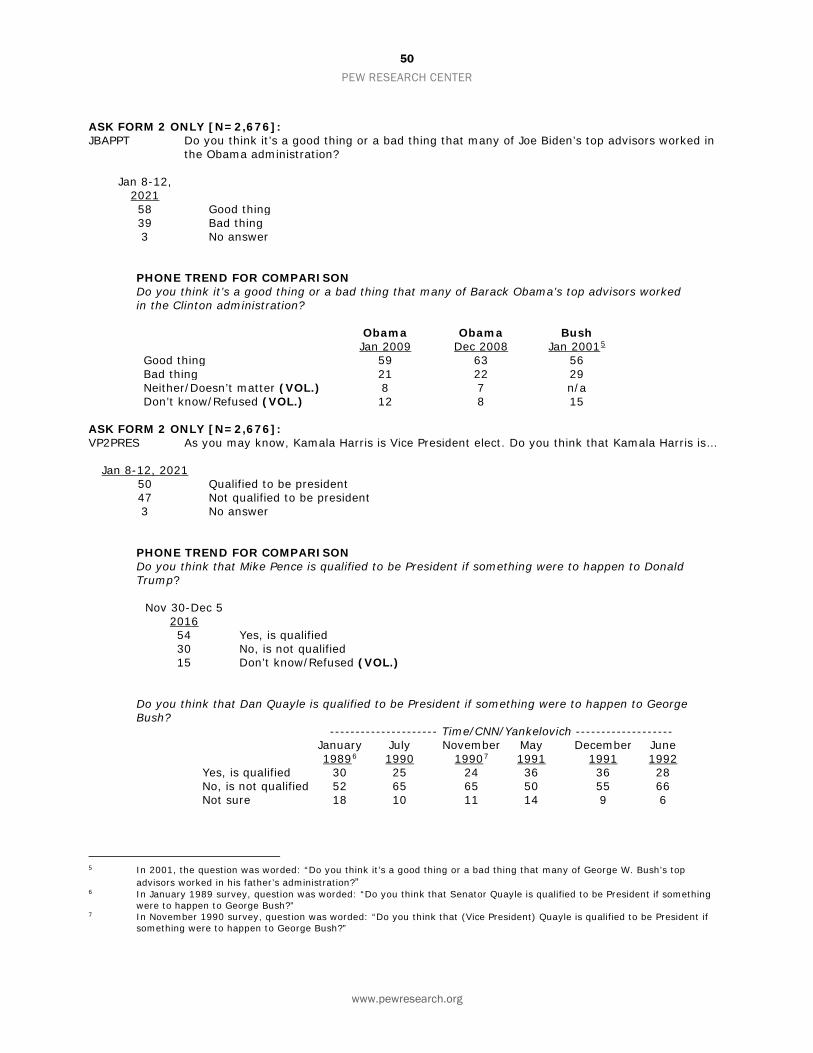
ASK FORM 2 ONLY [N=2,676]: JBAPPT Do you think it’s a good thing or a bad thing that many of Joe Biden’s top advisors worked in
the Obama administration?
Jan 8-12, 2021
58 Good thing 39 Bad thing 3 No answer
PHONE TREND FOR COMPARISON Do you think it’s a good thing or a bad thing that many of Barack Obama’s top advisors worked in the Clinton administration?
Obama Obama Bush Jan 2009 Dec 2008 Jan 20015 Good thing 59 63 56 Bad thing 21 22 29 Neither/Doesn’t matter (VOL.) 8 7 n/a Don’t know/Refused (VOL.) 12 8 15
ASK FORM 2 ONLY [N=2,676]: VP2PRES As you may know, Kamala Harris is Vice President elect. Do you think that Kamala Harris is…
Jan 8-12, 2021 50 Qualified to be president 47 Not qualified to be president 3 No answer
PHONE TREND FOR COMPARISON
Do you think that Mike Pence is qualified to be President if something were to happen to Donald Trump?
Nov 30-Dec 5 2016
54 Yes, is qualified 30 No, is not qualified 15 Don’t know/Refused (VOL.)
Do you think that Dan Quayle is qualified to be President if something were to happen to George Bush?
--------------------- Time/CNN/Yankelovich ------------------- January July November May December June 19896 1990 19907 1991 1991 1992 Yes, is qualified 30 25 24 36 36 28 No, is not qualified 52 65 65 50 55 66 Not sure 18 10 11 14 9 6
5 In 2001, the question was worded: “Do you think it’s a good thing or a bad thing that many of George W. Bush’s top
advisors worked in his father’s administration?” 6 In January 1989 survey, question was worded: “Do you think that Senator Quayle is qualified to be President if something
were to happen to George Bush?” 7 In November 1990 survey, question was worded: “Do you think that (Vice President) Quayle is qualified to be President if
something were to happen to George Bush?”
51 PEW RESEARCH CENTER
www.pewresearch.org
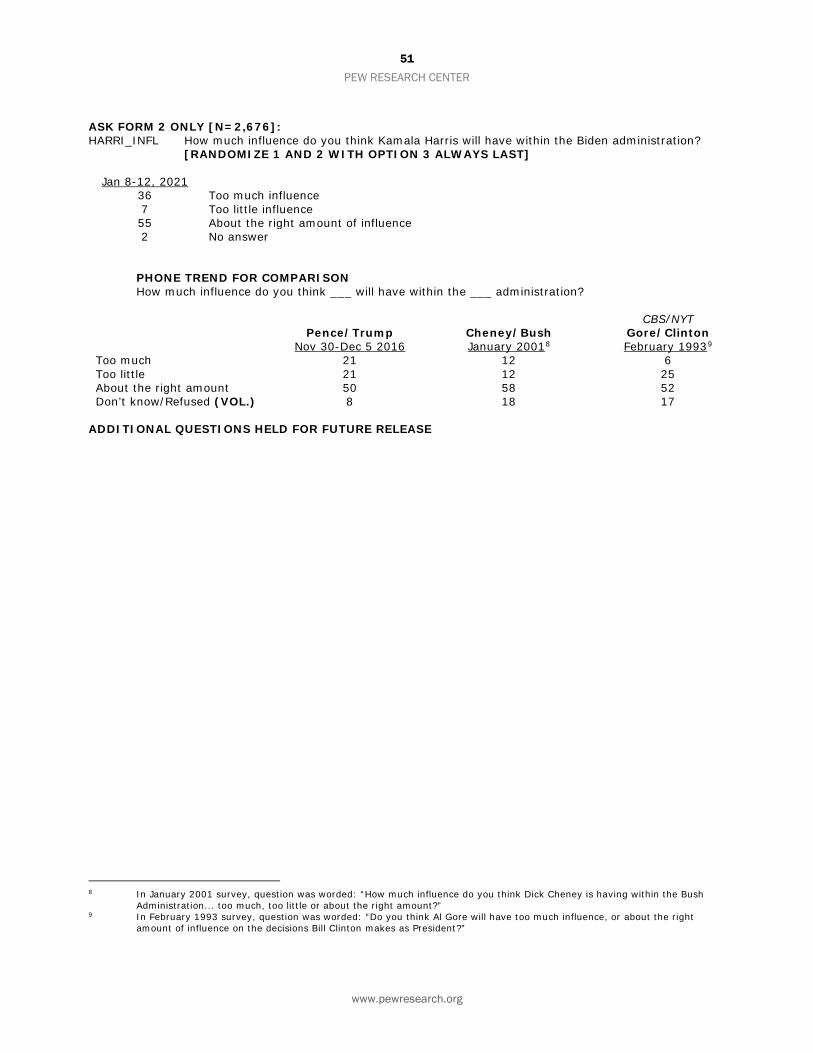
ASK FORM 2 ONLY [N=2,676]: HARRI_INFL How much influence do you think Kamala Harris will have within the Biden administration?
[RANDOMIZE 1 AND 2 WITH OPTION 3 ALWAYS LAST]
Jan 8-12, 2021 36 Too much influence 7 Too little influence 55 About the right amount of influence 2 No answer
PHONE TREND FOR COMPARISON
How much influence do you think ___ will have within the ___ administration? CBS/NYT Pence/Trump Cheney/Bush Gore/Clinton Nov 30-Dec 5 2016 January 20018 February 19939 Too much 21 12 6 Too little 21 12 25 About the right amount 50 58 52 Don’t know/Refused (VOL.) 8 18 17
ADDITIONAL QUESTIONS HELD FOR FUTURE RELEASE
8 In January 2001 survey, question was worded: “How much influence do you think Dick Cheney is having within the Bush
Administration... too much, too little or about the right amount?” 9 In February 1993 survey, question was worded: “Do you think Al Gore will have too much influence, or about the right
amount of influence on the decisions Bill Clinton makes as President?”
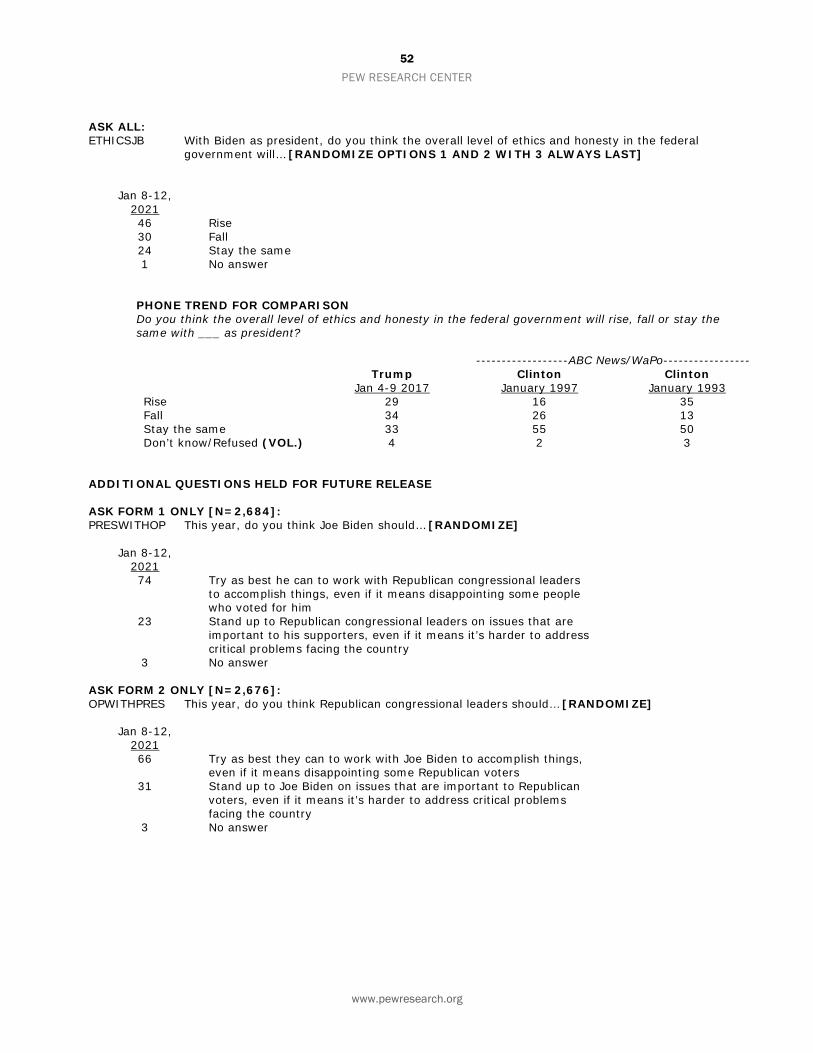
52 PEW RESEARCH CENTER
www.pewresearch.org
ASK ALL: ETHICSJB With Biden as president, do you think the overall level of ethics and honesty in the federal
government will… [RANDOMIZE OPTIONS 1 AND 2 WITH 3 ALWAYS LAST]
Jan 8-12, 2021
46 Rise 30 Fall 24 Stay the same 1 No answer
PHONE TREND FOR COMPARISON Do you think the overall level of ethics and honesty in the federal government will rise, fall or stay the same with ___ as president? ------------------ABC News/WaPo----------------- Trump Clinton Clinton Jan 4-9 2017 January 1997 January 1993 Rise 29 16 35 Fall 34 26 13 Stay the same 33 55 50 Don’t know/Refused (VOL.) 4 2 3
ADDITIONAL QUESTIONS HELD FOR FUTURE RELEASE ASK FORM 1 ONLY [N=2,684]: PRESWITHOP This year, do you think Joe Biden should… [RANDOMIZE]
Jan 8-12, 2021
74 Try as best he can to work with Republican congressional leaders to accomplish things, even if it means disappointing some people who voted for him
23 Stand up to Republican congressional leaders on issues that are important to his supporters, even if it means it’s harder to address critical problems facing the country
3 No answer ASK FORM 2 ONLY [N=2,676]: OPWITHPRES This year, do you think Republican congressional leaders should… [RANDOMIZE]
Jan 8-12, 2021
66 Try as best they can to work with Joe Biden to accomplish things, even if it means disappointing some Republican voters
31 Stand up to Joe Biden on issues that are important to Republican voters, even if it means it’s harder to address critical problems facing the country
3 No answer
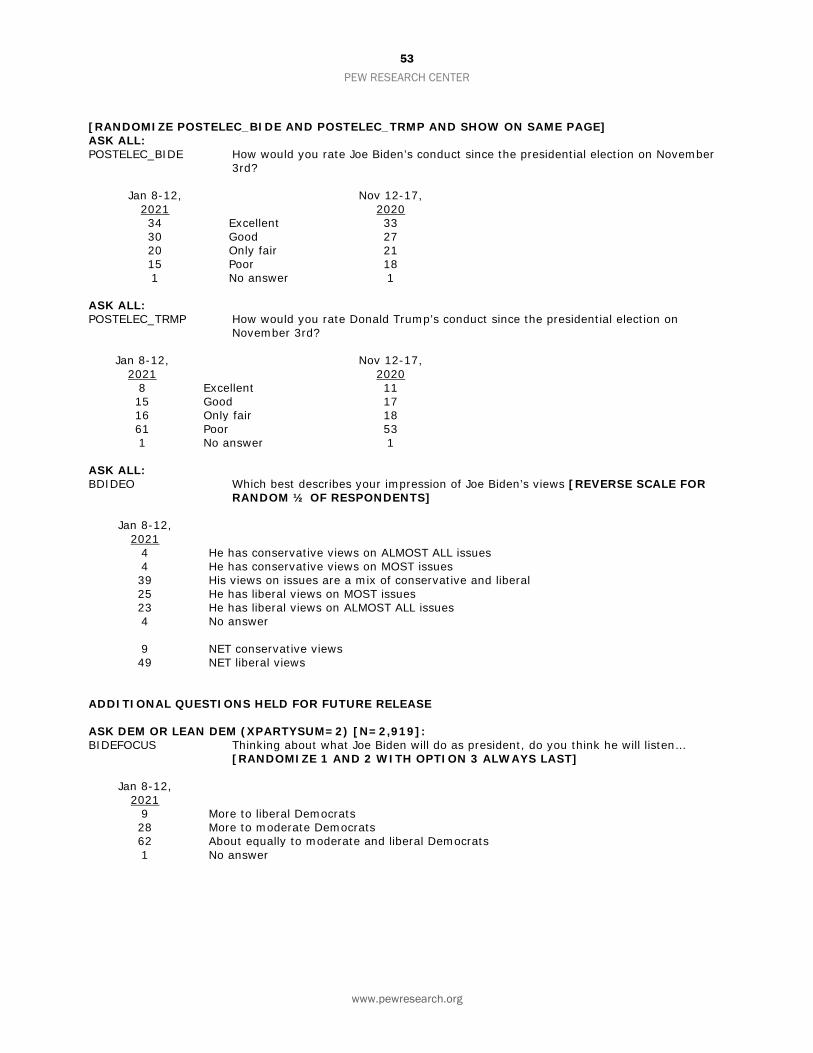
53 PEW RESEARCH CENTER
www.pewresearch.org
[RANDOMIZE POSTELEC_BIDE AND POSTELEC_TRMP AND SHOW ON SAME PAGE] ASK ALL: POSTELEC_BIDE How would you rate Joe Biden’s conduct since the presidential election on November
3rd?
Jan 8-12, 2021
Nov 12-17, 2020
34 Excellent 33 30 Good 27 20 Only fair 21 15 Poor 18 1 No answer 1
ASK ALL: POSTELEC_TRMP How would you rate Donald Trump’s conduct since the presidential election on
November 3rd?
Jan 8-12, 2021
Nov 12-17, 2020
8 Excellent 11 15 Good 17 16 Only fair 18 61 Poor 53 1 No answer 1
ASK ALL: BDIDEO Which best describes your impression of Joe Biden’s views [REVERSE SCALE FOR
RANDOM ½ OF RESPONDENTS]
Jan 8-12, 2021
4 He has conservative views on ALMOST ALL issues 4 He has conservative views on MOST issues 39 His views on issues are a mix of conservative and liberal 25 He has liberal views on MOST issues 23 He has liberal views on ALMOST ALL issues 4 No answer 9 NET conservative views 49 NET liberal views
ADDITIONAL QUESTIONS HELD FOR FUTURE RELEASE ASK DEM OR LEAN DEM (XPARTYSUM=2) [N=2,919]: BIDEFOCUS Thinking about what Joe Biden will do as president, do you think he will listen…
[RANDOMIZE 1 AND 2 WITH OPTION 3 ALWAYS LAST]
Jan 8-12, 2021
9 More to liberal Democrats 28 More to moderate Democrats 62 About equally to moderate and liberal Democrats 1 No answer
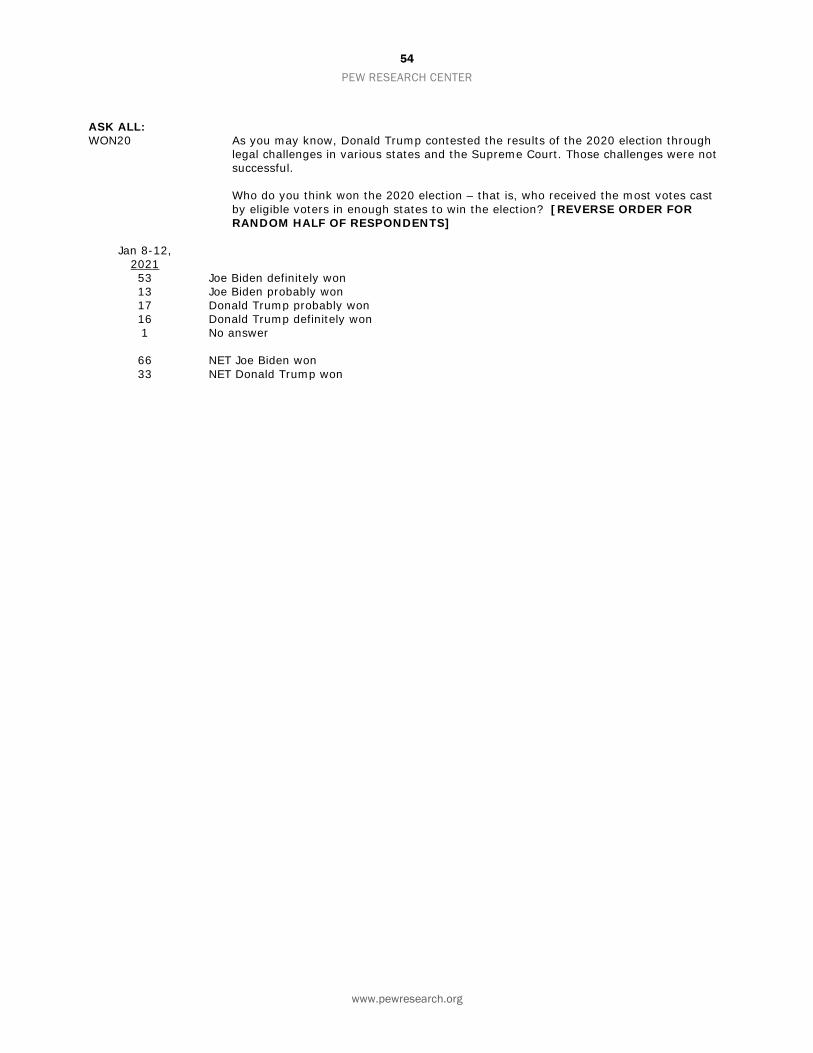
54 PEW RESEARCH CENTER
www.pewresearch.org
ASK ALL: WON20 As you may know, Donald Trump contested the results of the 2020 election through
legal challenges in various states and the Supreme Court. Those challenges were not successful.
Who do you think won the 2020 election – that is, who received the most votes cast
by eligible voters in enough states to win the election? [REVERSE ORDER FOR RANDOM HALF OF RESPONDENTS]
Jan 8-12,
2021
53 Joe Biden definitely won 13 Joe Biden probably won 17 Donald Trump probably won 16 Donald Trump definitely won 1 No answer
66 NET Joe Biden won 33 NET Donald Trump won
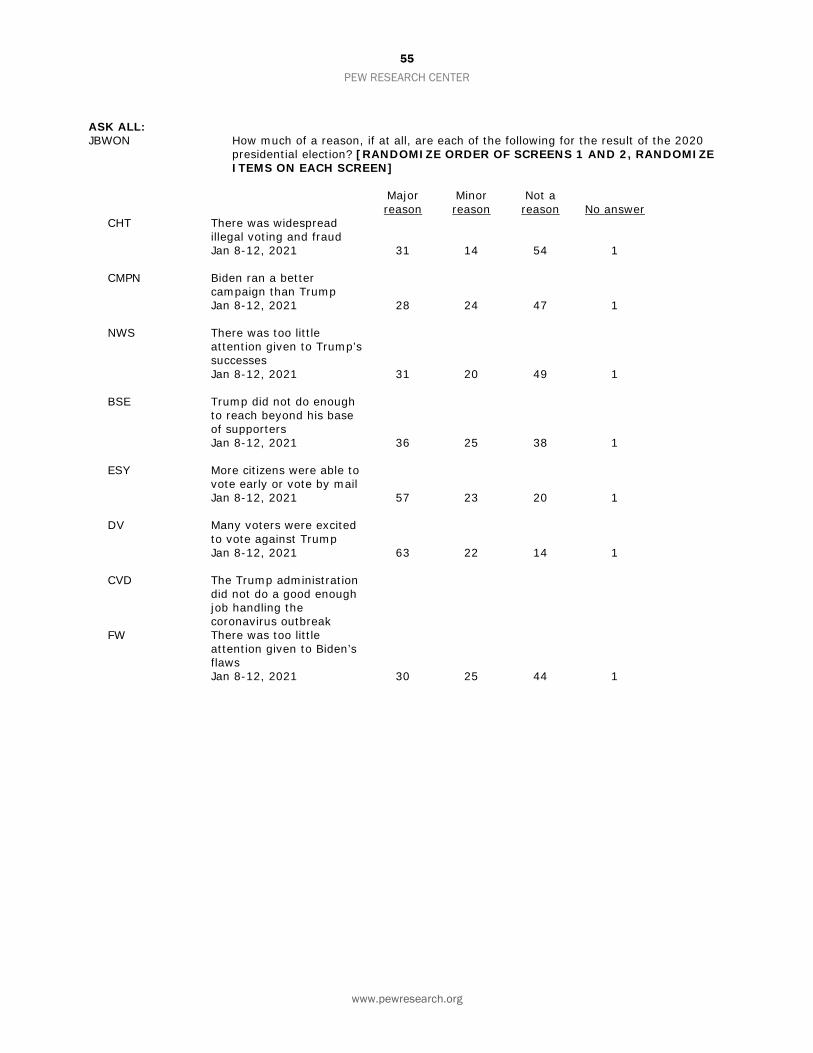
55 PEW RESEARCH CENTER
www.pewresearch.org
ASK ALL: JBWON How much of a reason, if at all, are each of the following for the result of the 2020
presidential election? [RANDOMIZE ORDER OF SCREENS 1 AND 2, RANDOMIZE ITEMS ON EACH SCREEN]
Major
reason Minor reason
Not a reason No answer
CHT There was widespread illegal voting and fraud
Jan 8-12, 2021 31 14 54 1 CMPN Biden ran a better
campaign than Trump
Jan 8-12, 2021 28 24 47 1 NWS There was too little
attention given to Trump’s successes
Jan 8-12, 2021 31 20 49 1 BSE Trump did not do enough
to reach beyond his base of supporters
Jan 8-12, 2021 36 25 38 1 ESY More citizens were able to
vote early or vote by mail
Jan 8-12, 2021 57 23 20 1 DV Many voters were excited
to vote against Trump
Jan 8-12, 2021 63 22 14 1 CVD The Trump administration
did not do a good enough job handling the coronavirus outbreak
FW There was too little attention given to Biden’s flaws
Jan 8-12, 2021 30 25 44 1
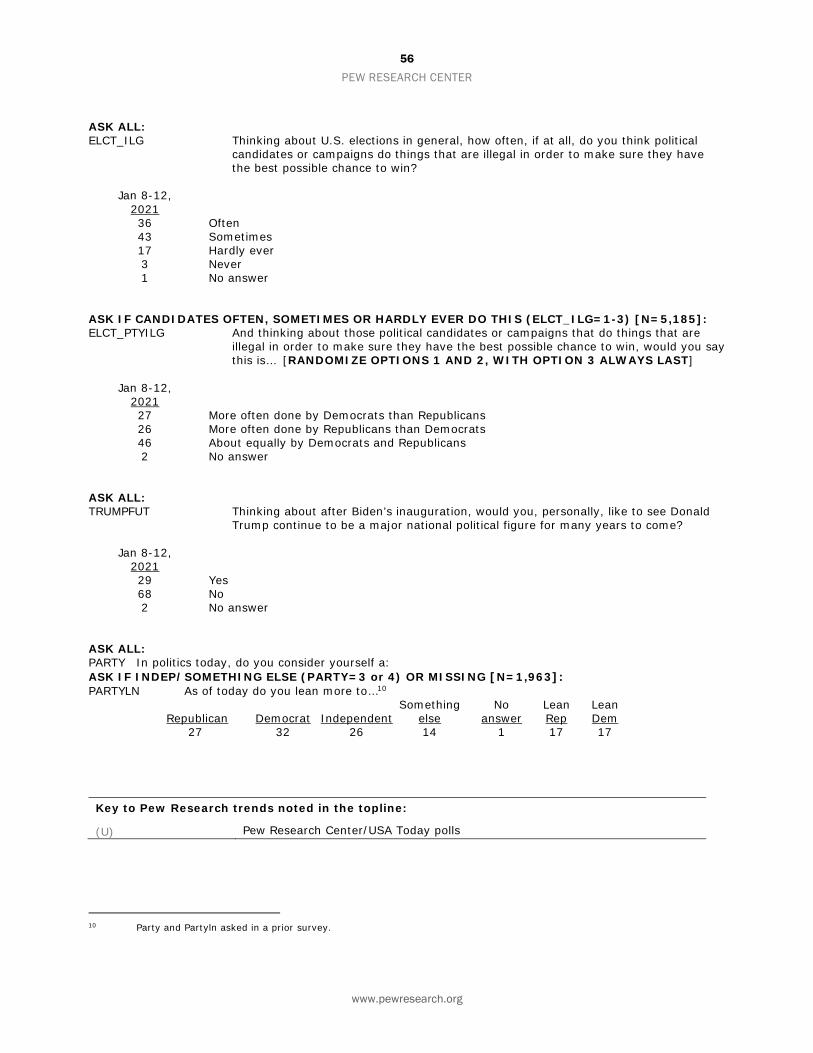
56 PEW RESEARCH CENTER
www.pewresearch.org
ASK ALL: ELCT_ILG Thinking about U.S. elections in general, how often, if at all, do you think political
candidates or campaigns do things that are illegal in order to make sure they have the best possible chance to win?
Jan 8-12,
2021
36 Often 43 Sometimes 17 Hardly ever 3 Never 1 No answer
ASK IF CANDIDATES OFTEN, SOMETIMES OR HARDLY EVER DO THIS (ELCT_ILG=1-3) [N=5,185]: ELCT_PTYILG And thinking about those political candidates or campaigns that do things that are
illegal in order to make sure they have the best possible chance to win, would you say this is… [RANDOMIZE OPTIONS 1 AND 2, WITH OPTION 3 ALWAYS LAST]
Jan 8-12,
2021
27 More often done by Democrats than Republicans 26 More often done by Republicans than Democrats 46 About equally by Democrats and Republicans 2 No answer
ASK ALL: TRUMPFUT Thinking about after Biden’s inauguration, would you, personally, like to see Donald
Trump continue to be a major national political figure for many years to come?
Jan 8-12, 2021
29 Yes 68 No 2 No answer
ASK ALL: PARTY In politics today, do you consider yourself a: ASK IF INDEP/SOMETHING ELSE (PARTY=3 or 4) OR MISSING [N=1,963]: PARTYLN As of today do you lean more to…10 Something No Lean Lean Republican Democrat Independent else answer Rep Dem 27 32 26 14 1 17 17
10 Party and Partyln asked in a prior survey.
Key to Pew Research trends noted in the topline: (U) Pew Research Center/USA Today polls