Embed Size (px)
Citation preview

A Introductory GuideFor Clinicians & Service Managers
DEMANDFOR PSYCHOLOGICALTHERAPIES SERVICES
By The Mental Health Collaborative
aw_Demand.indd 1aw_Demand.indd 1 24/05/2010 15:4524/05/2010 15:45
01/
02 Introduction
This guide provides a basic introduction to demand and ways to infl uence it. It is part of a series of introductory guides for psychological therapies services. These guides cover four areas: Demand, Capacity, Goal Setting/Case Review and Clinical Administration. There is also an introductory guide called ‘Start Here’ that looks at how to implement change in the midst of uncertainty about what will work.
aw_Demand.indd 2aw_Demand.indd 2 24/05/2010 15:4524/05/2010 15:45

This is a introductory guide to demand theory as it applies to psychological therapy services. The intention is that it will plant a few seeds of interest and hope to help you with your own service.
A Psychological Therapy Service is any local service providing psychological therapies. Examples might include: Primary Care Mental Health Teams, Community Mental Health Teams, Clinical Psychology Service and Psychological Therapies Services.
aw_Demand.indd 3aw_Demand.indd 3 24/05/2010 15:4524/05/2010 15:45
03/0
4 What is Demand?
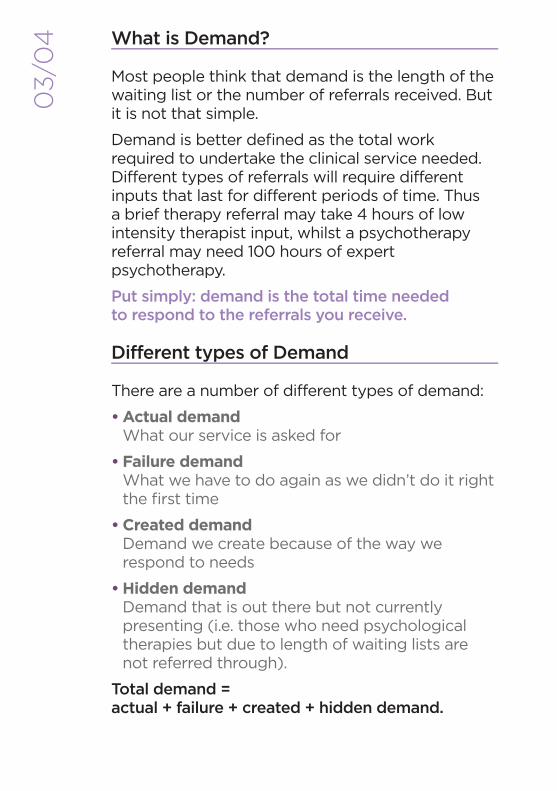
Most people think that demand is the length of the waiting list or the number of referrals received. But it is not that simple.
Demand is better defi ned as the total work required to undertake the clinical service needed. Different types of referrals will require different inputs that last for different periods of time. Thus a brief therapy referral may take 4 hours of low intensity therapist input, whilst a psychotherapy referral may need 100 hours of expert psychotherapy.
Put simply: demand is the total time needed to respond to the referrals you receive.
Different types of Demand
There are a number of different types of demand:
• Actual demandWhat our service is asked for
• Failure demandWhat we have to do again as we didn’t do it right the fi rst time
• Created demandDemand we create because of the way we respond to needs
• Hidden demandDemand that is out there but not currently presenting (i.e. those who need psychological therapies but due to length of waiting lists are not referred through).
Total demand = actual + failure + created + hidden demand.
aw_Demand.indd 4aw_Demand.indd 4 24/05/2010 15:4524/05/2010 15:45
Why is Demand important?
Demand is multi-faceted and something we can infl uence by our actions. It is not simply a never ending stream of people coming through our doors that we have no control over.
We know therapeutically that identifying the nature and extent of a problem is a good fi rst step to looking for solutions – the same applies when thinking about the systems we work in. Understanding your current demand is an important step in then fi nding ways to infl uence it.
Understanding demand is important because:
• If we know what our service demand is, it is easier to quantify what we need to do to meet that demand;
• It allows us to think about whether there is anything we can do differently that will reduce the demand;
• We are able to plan and design our services more appropriately;
• When we combine understanding our demand with understanding our capacity, we can then see if there is a match between the two. If not, and you are running the service as effectively as possible, being able to show the difference helps you to put together effective cases for additional resources;
• We know that one of the biggest contributors to stress is lack of control. Understanding that there are ways to infl uence demand can give teams back a sense of control; leading to increased morale and better working lives. Inevitably, this will then translate to better patient care.
aw_Demand.indd 5aw_Demand.indd 5 24/05/2010 15:4524/05/2010 15:45
05/0
6 How do I measure demand?
Okay, so we understand that demand is the total work required to undertake the clinical service needed. But how do we actually turn this into a fi gure?
There are a number of factors involved, so it will be important to measure more than one thing. The data collected can be quite crude to begin with, increasing in sophistication as time goes on. However, you will fi nd that even just looking at the crude data is is extremely useful.
What do I need to collect to estimate demand?
At the most basic level, you need to know how many people are being referred and how long it takes you to respond to those referrals. But everyone is different I hear you say! Whilst it is true that all clinical cases differ, we can calculate average numbers of sessions for identifi ed subgroups. Whilst not perfect, this data will give us a good estimate of demand. If possible, it is better to break referrals down into subgroups. However, even just looking at the average number of sessions for the service as a whole, will give you good enough estimates to do some useful work with.
aw_Demand.indd 6aw_Demand.indd 6 24/05/2010 15:4524/05/2010 15:45
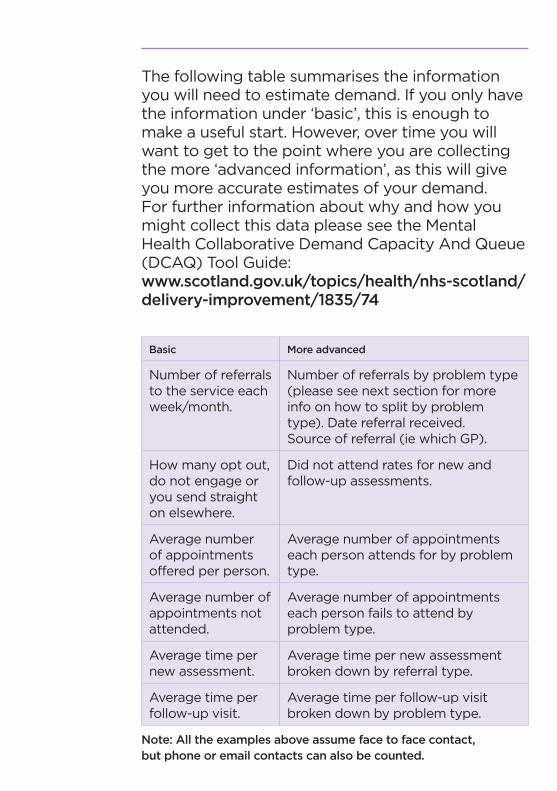
The following table summarises the information you will need to estimate demand. If you only have the information under ‘basic’, this is enough to make a useful start. However, over time you will want to get to the point where you are collecting the more ‘advanced information’, as this will give you more accurate estimates of your demand. For further information about why and how you might collect this data please see the Mental Health Collaborative Demand Capacity And Queue (DCAQ) Tool Guide:www.scotland.gov.uk/topics/health/nhs-scotland/delivery-improvement/1835/74
Basic More advanced
Number of referrals to the service each week/month.
Number of referrals by problem type (please see next section for more info on how to split by problem type). Date referral received. Source of referral (ie which GP).
How many opt out, do not engage or you send straight on elsewhere.
Did not attend rates for new and follow-up assessments.
Average number of appointments offered per person.
Average number of appointments each person attends for by problem type.
Average number of appointments not attended.
Average number of appointments each person fails to attend by problem type.
Average time per new assessment.
Average time per new assessment broken down by referral type.
Average time per follow-up visit.
Average time per follow-up visit broken down by problem type.
Note: All the examples above assume face to face contact,but phone or email contacts can also be counted.
aw_Demand.indd 7aw_Demand.indd 7 24/05/2010 15:4524/05/2010 15:45
07/
08 How do I get this information?
Use Historical Data
Download data from your IT system. Most services will have historical data on referrals. It may be that some of this data is already entered into an electronic information system. All those forms you’ve been fi lling in over the years wondering what they are for: well this might be just the information you need to work out your demand. So the fi rst step is to see if the information already exists electronically.
Audit Case Files. If you fi nd that you don’t already collect this information electronically, then you could conduct an audit of records to pick up historical data. If you do this, you will need to set up systems to start collecting the data or else you won’t ever have accurate up to date information. If your service has a large number of cases, you could survey a randomly selected sample. You will need to make sure this is of suffi cient size to be confi dent that the results will be representative.
A
B
aw_Demand.indd 8aw_Demand.indd 8 24/05/2010 15:4524/05/2010 15:45
So reviewing the last 6 months of referrals you could identify:
• Types of problem using a tiered approach – maybe the ‘Matrix’ defi nitions of problem types/tier;
• Number of referrals by type of problem/tier;
• % that did not engage;
• Average number of appointments booked – by problem type if possible;
• % appointments not kept – by problem type if possible.
You will probably know how long each appointment lasts (as you will have set slots). However, if for any reason you don’t, you can simply collect data on this for a 2 week period and then work out the average length of time you spend with each person.
For appointments ‘not kept’, the important fi gure is the number of appointments that were cancelled or not attended where the clinician did not see anyone else in that time.
aw_Demand.indd 9aw_Demand.indd 9 24/05/2010 15:4524/05/2010 15:45
09/1
0 How do I get this information?
Use current data
Ideally you want systems that allow you to look at current data, so you can spot any signifi cant changes to referral rates as they happen. If you don’t already collect the data electronically, its important to start systems to collect and report on the variables that you are measuring on a monthly basis. Chart this and you can see changes and unusual trends. You will also have baseline measures from which to assess the impact of changes.
Book time with the IT people. Give them a list of the variables you need to be able to record and report on. You can fi nd a more detailed list and explanation of why you need the different data in the Mental Health Collaborative DCAQ Tool Guide: www.scotland.gov.uk/topics/health/nhs-scotland/delivery-improvement/1835/74.
All services have an IT system, often the IT people have not been asked for the information we need. Even if they cannot do it immediately, at least you will be feeding into the development specifi cation for future IT needs.
Need help with IT? Each NHS Board area has dedicated IT support, funded by the Mental Health Collaborative. They are experts in data analysis and the dark arts of Statistical Process Control, Pivot Tables and other unworldly, but very useful things. They can also help as translators for conversations with the IT people.
aw_Demand.indd 10aw_Demand.indd 10 24/05/2010 15:4524/05/2010 15:45
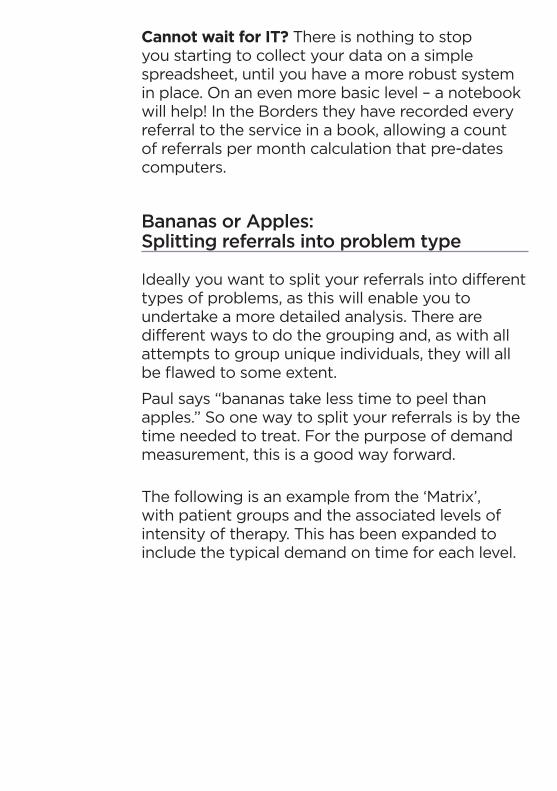
Cannot wait for IT? There is nothing to stop you starting to collect your data on a simple spreadsheet, until you have a more robust system in place. On an even more basic level – a notebook will help! In the Borders they have recorded every referral to the service in a book, allowing a count of referrals per month calculation that pre-dates computers.
Bananas or Apples: Splitting referrals into problem type
Ideally you want to split your referrals into different types of problems, as this will enable you to undertake a more detailed analysis. There are different ways to do the grouping and, as with all attempts to group unique individuals, they will all be fl awed to some extent.
Paul says “bananas take less time to peel than apples.” So one way to split your referrals is by the time needed to treat. For the purpose of demand measurement, this is a good way forward.
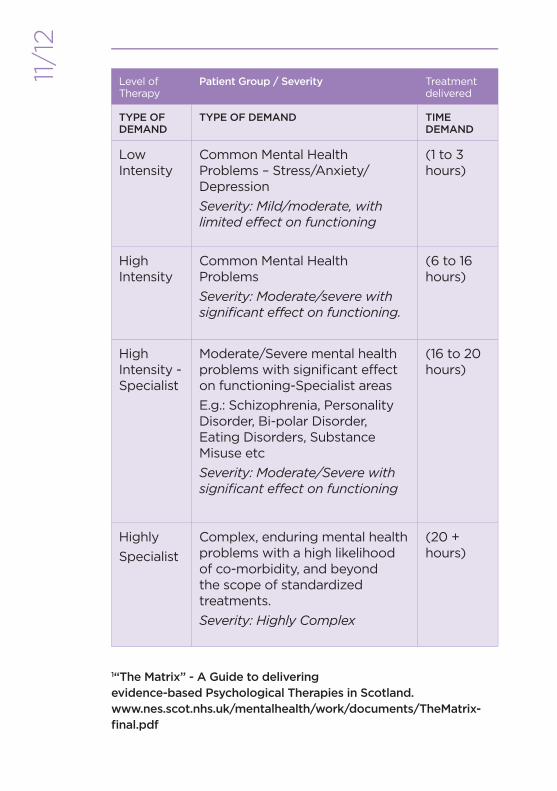
The following is an example from the ‘Matrix’, with patient groups and the associated levels of intensity of therapy. This has been expanded to include the typical demand on time for each level.
aw_Demand.indd 11aw_Demand.indd 11 24/05/2010 15:4524/05/2010 15:45
11/1
2Level of Therapy
Patient Group / Severity Treatment delivered
TYPE OF DEMAND
TYPE OF DEMAND TIME DEMAND
Low Intensity
Common Mental Health Problems – Stress/Anxiety/Depression
Severity: Mild/moderate, with limited effect on functioning
(1 to 3 hours)
High Intensity
Common Mental Health Problems
Severity: Moderate/severe with signifi cant effect on functioning.
(6 to 16 hours)
High Intensity - Specialist
Moderate/Severe mental health problems with signifi cant effect on functioning-Specialist areas
E.g.: Schizophrenia, Personality Disorder, Bi-polar Disorder, Eating Disorders, Substance Misuse etc
Severity: Moderate/Severe with signifi cant effect on functioning
(16 to 20 hours)
Highly
Specialist
Complex, enduring mental health problems with a high likelihood of co-morbidity, and beyond the scope of standardized treatments.
Severity: Highly Complex
(20 + hours)
1“The Matrix” - A Guide to delivering evidence-based Psychological Therapies in Scotland.www.nes.scot.nhs.uk/mentalhealth/work/documents/TheMatrix-fi nal.pdf
aw_Demand.indd 12aw_Demand.indd 12 24/05/2010 15:4524/05/2010 15:45
Some types of referrals are relatively easy to quantify in terms of the time needed, i.e. intellectual assessments and fi xed programmes such as Beating the Blues or a Core CBT skills group programme.
As you collect data on case types and hours needed to treat, you may fi nd you can refi ne your estimate.
However, this is only one way of splitting referrals, you may come up with better ways. Also, you don’t need to split referrals down into type to get started with work around Demand, so don’t get too hung up on this point. You can do really useful work just by thinking about referrals into your team as a whole.
aw_Demand.indd 13aw_Demand.indd 13 24/05/2010 15:4524/05/2010 15:45
13/1
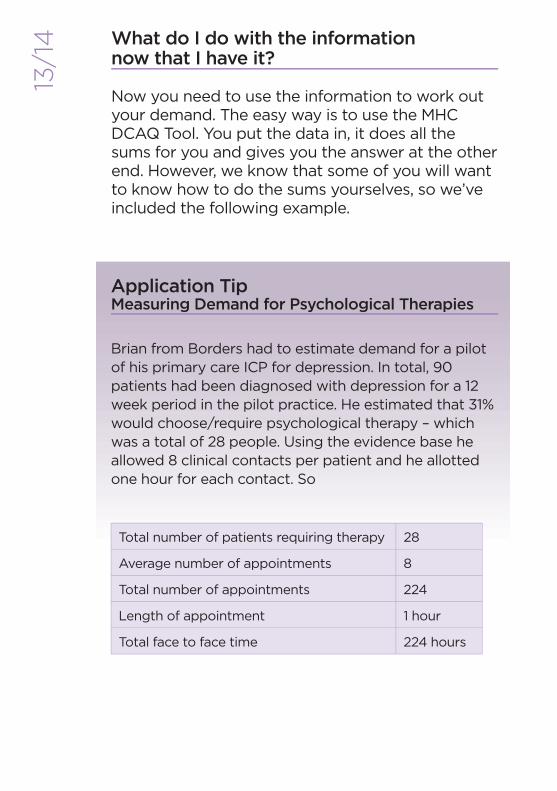
4 What do I do with the information now that I have it?
Now you need to use the information to work out your demand. The easy way is to use the MHC DCAQ Tool. You put the data in, it does all the sums for you and gives you the answer at the other end. However, we know that some of you will want to know how to do the sums yourselves, so we’ve included the following example.
Brian from Borders had to estimate demand for a pilot of his primary care ICP for depression. In total, 90 patients had been diagnosed with depression for a 12 week period in the pilot practice. He estimated that 31% would choose/require psychological therapy – which was a total of 28 people. Using the evidence base he allowed 8 clinical contacts per patient and he allotted one hour for each contact. So
Total number of patients requiring therapy 28
Average number of appointments 8
Total number of appointments 224
Length of appointment 1 hour
Total face to face time 224 hours
Application TipMeasuring Demand for Psychological Therapies
aw_Demand.indd 14aw_Demand.indd 14 24/05/2010 15:4524/05/2010 15:45
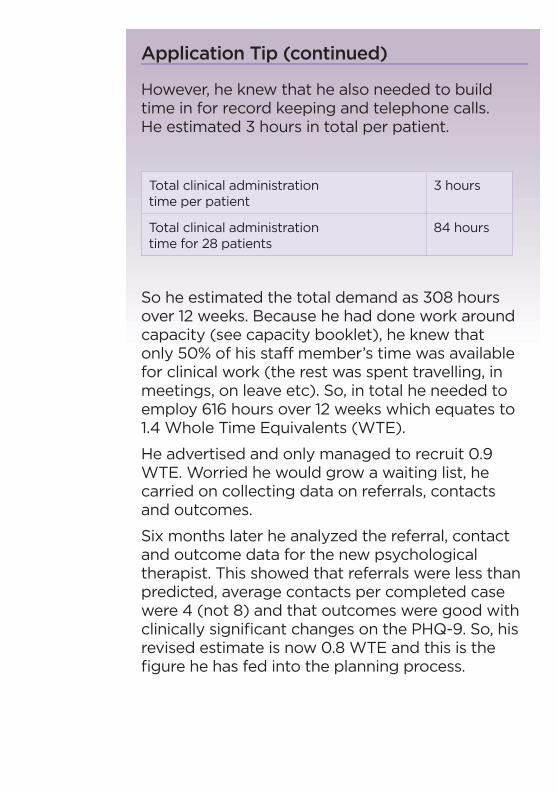
However, he knew that he also needed to build time in for record keeping and telephone calls. He estimated 3 hours in total per patient.
Total clinical administration time per patient
3 hours
Total clinical administration time for 28 patients
84 hours
So he estimated the total demand as 308 hours over 12 weeks. Because he had done work around capacity (see capacity booklet), he knew that only 50% of his staff member’s time was available for clinical work (the rest was spent travelling, in meetings, on leave etc). So, in total he needed to employ 616 hours over 12 weeks which equates to 1.4 Whole Time Equivalents (WTE).
He advertised and only managed to recruit 0.9 WTE. Worried he would grow a waiting list, he carried on collecting data on referrals, contacts and outcomes.
Six months later he analyzed the referral, contact and outcome data for the new psychological therapist. This showed that referrals were less than predicted, average contacts per completed case were 4 (not 8) and that outcomes were good with clinically signifi cant changes on the PHQ-9. So, his revised estimate is now 0.8 WTE and this is the fi gure he has fed into the planning process.
Application Tip (continued)
aw_Demand.indd 15aw_Demand.indd 15 24/05/2010 15:4524/05/2010 15:45
15/1
6 Planning for the future – anticipating demand
We frequently hear people saying that if we get our waiting times down, more people will get referred to the service. This is what we call ‘hidden demand’; its out there, but is not currently presenting to services. That might be because they are not referred due to the long waits, or because we knowingly exclude people (ie through age cut-offs) or unknowingly exclude people (i.e. service doesn’t fi t the needs of a particular population group).
However, it is possible to make estimates of your hidden demand as well. There is a wealth of prevalence and incidence data that you can use. In the absence of appropriate local data, this type of information provides at least a starting point. Using this prevalence data, and your estimates around how many sessions you see someone for and how long it takes, you can estimate the actual demand in the system if everyone was referred.
“”There is a wealth of prevalence and incidence data that you can use…
aw_Demand.indd 16aw_Demand.indd 16 24/05/2010 15:4524/05/2010 15:45
OK, so I am measuring my demand, what next?
We are now clear that demand is not the number of referrals, but the amount of time it takes to respond to the referrals. We know that demand is important and we have started to measure it. So what do we do now?
Well there are a two main ways you can use this information about demand. You can:
• Use it to help you think about how to infl uence and reduce your demand
• Do some work on the capacity of your service – and then see whether you have enough capacity to meet your demand.
If you want to assess whether you have enough capacity to meet your demand then please see the separate leafl et on capacity. For the rest of this leafl et, we will think about ways you can infl uence your demand.
aw_Demand.indd 17aw_Demand.indd 17 24/05/2010 15:4524/05/2010 15:45
17/1
8 Infl uencing Demand
There are three key areas to think about when looking to infl uence your demand. We’ve ordered these as steps one, two and three, but you don’t have to follow this order:
1. Your eligibility criteria – are you doing work that someone else could do, or work that does not need to be done?
2. Are you creating unnecessary demand by not doing things right fi rst time and then having to redo them?
3. Are you creating unnecessary demand by having steps in your processes that don’t add value?
Step One
Have clear eligibility criteriaIt is crucial to have clarity about what the service will and will not do. Whilst acknowledging that every referral will be different, there will be limits at the upper and lower tiers. All areas will have other services that work with mental health and related issues; as well as having psychiatric inpatient units and crisis teams.
However, there is no point making your demand more manageable if you simply move it to someone else who also doesn’t have the capacity to meet the needs. So any changes to your eligibility criteria need to be agreed across the whole system and should be based on who is best placed to meet the need.
aw_Demand.indd 18aw_Demand.indd 18 24/05/2010 15:4524/05/2010 15:45
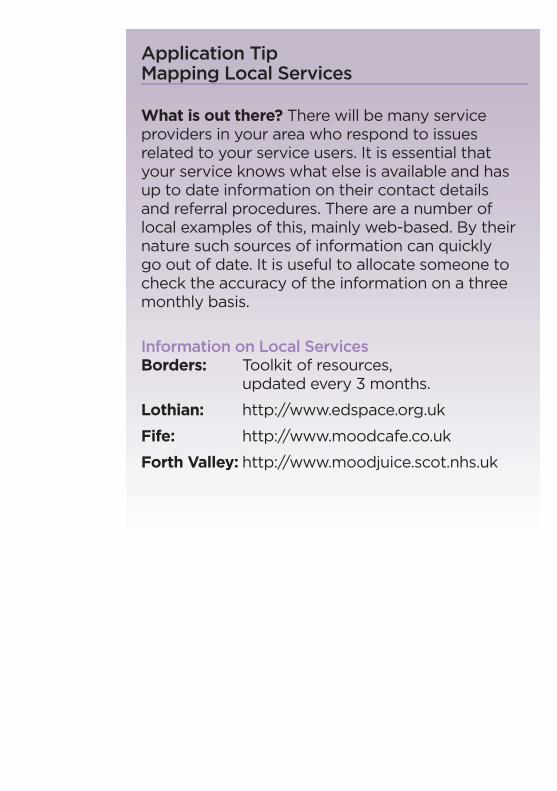
Application Tip Mapping Local Services
What is out there? There will be many service providers in your area who respond to issues related to your service users. It is essential that your service knows what else is available and has up to date information on their contact details and referral procedures. There are a number of local examples of this, mainly web-based. By their nature such sources of information can quickly go out of date. It is useful to allocate someone to check the accuracy of the information on a three monthly basis.
Information on Local ServicesBorders: Toolkit of resources,
updated every 3 months.
Lothian: http://www.edspace.org.uk
Fife: http://www.moodcafe.co.uk
Forth Valley: http://www.moodjuice.scot.nhs.uk
aw_Demand.indd 19aw_Demand.indd 19 24/05/2010 15:4524/05/2010 15:45
19/2
0
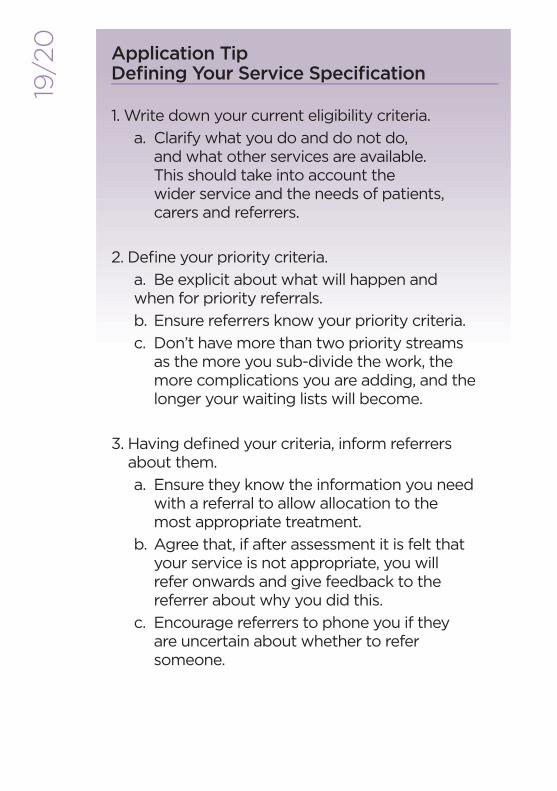
1. Write down your current eligibility criteria.
a. Clarify what you do and do not do, and what other services are available. This should take into account the wider service and the needs of patients, carers and referrers.
2. Defi ne your priority criteria.
a. Be explicit about what will happen and when for priority referrals.
b. Ensure referrers know your priority criteria.
c. Don’t have more than two priority streams as the more you sub-divide the work, the more complications you are adding, and the longer your waiting lists will become.
3. Having defi ned your criteria, inform referrers about them.
a. Ensure they know the information you need with a referral to allow allocation to the most appropriate treatment.
b. Agree that, if after assessment it is felt that your service is not appropriate, you will refer onwards and give feedback to the referrer about why you did this.
c. Encourage referrers to phone you if they are uncertain about whether to refer someone.
Application TipDefi ning Your Service Specifi cation
aw_Demand.indd 20aw_Demand.indd 20 24/05/2010 15:4524/05/2010 15:45
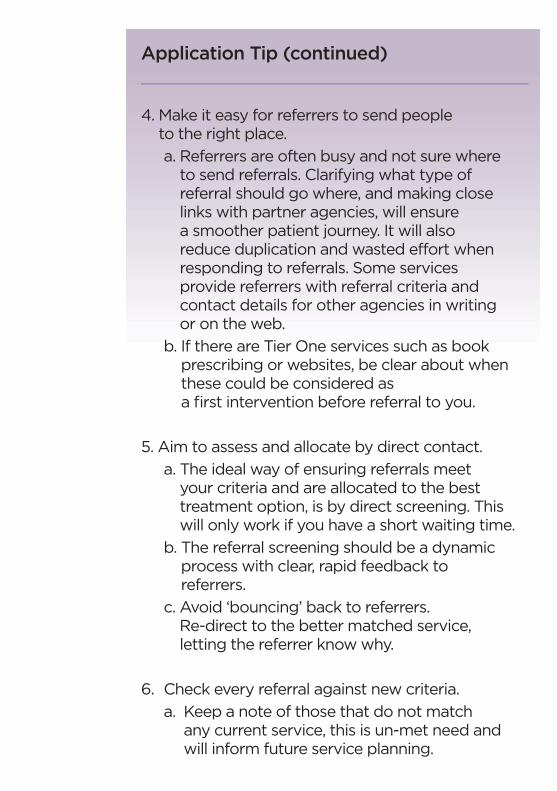
4. Make it easy for referrers to send people to the right place.
a. Referrers are often busy and not sure where to send referrals. Clarifying what type of referral should go where, and making close links with partner agencies, will ensure a smoother patient journey. It will also reduce duplication and wasted effort when responding to referrals. Some services provide referrers with referral criteria and contact details for other agencies in writing or on the web.
b. If there are Tier One services such as book prescribing or websites, be clear about when these could be considered as a fi rst intervention before referral to you.
5. Aim to assess and allocate by direct contact.
a. The ideal way of ensuring referrals meet your criteria and are allocated to the best treatment option, is by direct screening. This will only work if you have a short waiting time.
b. The referral screening should be a dynamic process with clear, rapid feedback to referrers.
c. Avoid ‘bouncing’ back to referrers. Re-direct to the better matched service, letting the referrer know why.
6. Check every referral against new criteria.
a. Keep a note of those that do not match any current service, this is un-met need and will inform future service planning.
Application Tip (continued)
aw_Demand.indd 21aw_Demand.indd 21 24/05/2010 15:4524/05/2010 15:45
21/
22 Step Two
Reduce unnecessary demand that is created because someone didn’t do things right the fi rst time.
We’ve all been there, ended up having to do something because someone else didn’t do it right the fi rst time. We call this failure demand. It is additional work that you wouldn’t have to do if everything was working perfectly. Here’s a couple of examples of this:
Example One.Many services have a high DNA and cancellation rate. Every empty appointment time is an unnecessary demand on our service; adding to the time it takes to treat referrals, but not adding value. While we can’t guarantee everyone will attend their appointments, there are a number of administration changes that can be made to signifi cantly reduce missed appointments. See the Clinical Administration for Psychological Therapies booklet in this series for a detailed description of ways of reducing empty appointment slots.
Example Two.Failure demand can occur if a service does not allocate cases appropriately to the right levels of treatment. The patient may spend a number of appointments seeing either someone over or under qualifi ed to help them. If this leads to a referral onwards, with another wait, followed by another assessment and history taking, a great deal of time has been wasted.
aw_Demand.indd 22aw_Demand.indd 22 24/05/2010 15:4524/05/2010 15:45
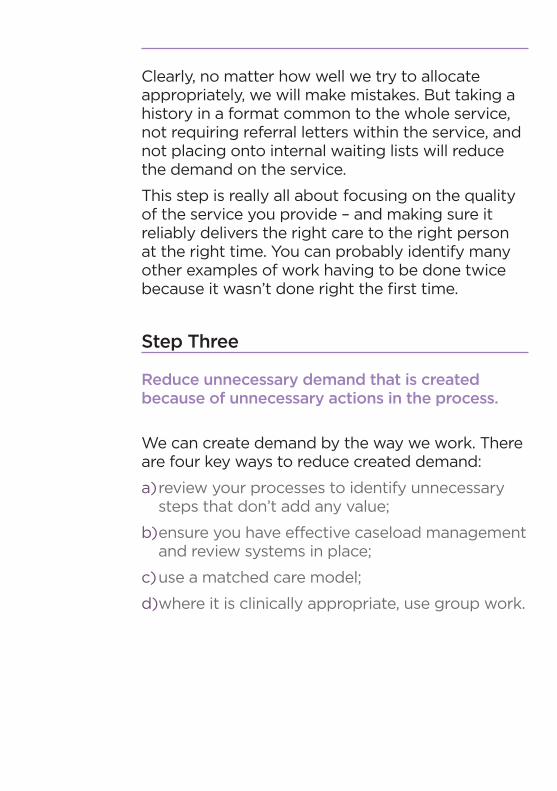
Clearly, no matter how well we try to allocate appropriately, we will make mistakes. But taking a history in a format common to the whole service, not requiring referral letters within the service, and not placing onto internal waiting lists will reduce the demand on the service.
This step is really all about focusing on the quality of the service you provide – and making sure it reliably delivers the right care to the right person at the right time. You can probably identify many other examples of work having to be done twice because it wasn’t done right the fi rst time.
Step Three
Reduce unnecessary demand that is created because of unnecessary actions in the process.
We can create demand by the way we work. There are four key ways to reduce created demand:
a) review your processes to identify unnecessary steps that don’t add any value;
b) ensure you have effective caseload management and review systems in place;
c) use a matched care model;
d) where it is clinically appropriate, use group work.
aw_Demand.indd 23aw_Demand.indd 23 24/05/2010 15:4524/05/2010 15:45
23/2
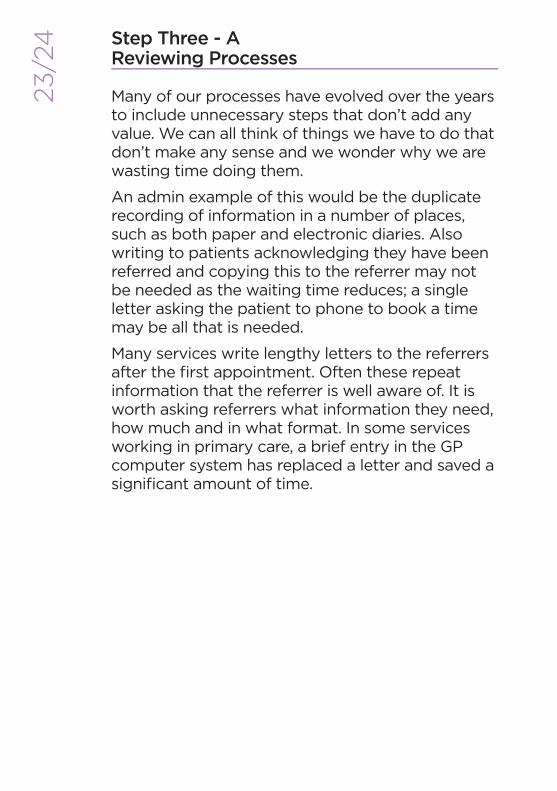
4 Step Three - A Reviewing Processes
Many of our processes have evolved over the years to include unnecessary steps that don’t add any value. We can all think of things we have to do that don’t make any sense and we wonder why we are wasting time doing them.
An admin example of this would be the duplicate recording of information in a number of places, such as both paper and electronic diaries. Also writing to patients acknowledging they have been referred and copying this to the referrer may not be needed as the waiting time reduces; a single letter asking the patient to phone to book a time may be all that is needed.
Many services write lengthy letters to the referrers after the fi rst appointment. Often these repeat information that the referrer is well aware of. It is worth asking referrers what information they need, how much and in what format. In some services working in primary care, a brief entry in the GP computer system has replaced a letter and saved a signifi cant amount of time.
aw_Demand.indd 24aw_Demand.indd 24 24/05/2010 15:4524/05/2010 15:45
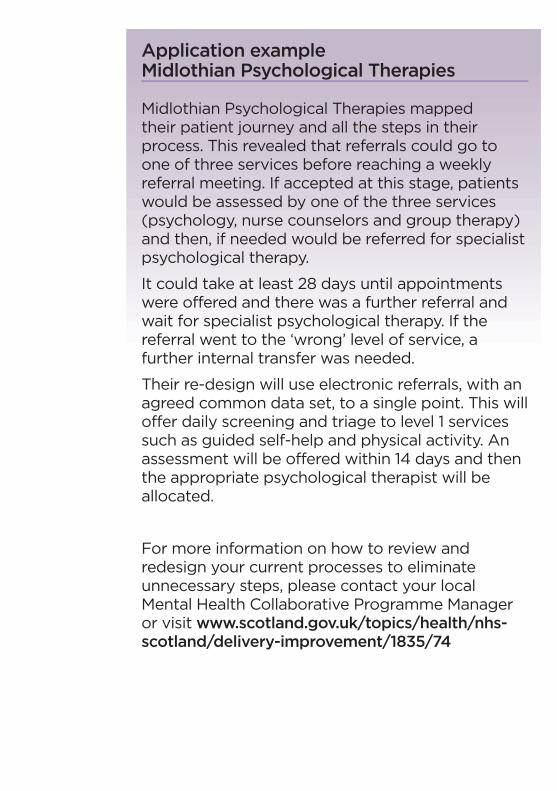
Application exampleMidlothian Psychological Therapies
Midlothian Psychological Therapies mapped their patient journey and all the steps in their process. This revealed that referrals could go to one of three services before reaching a weekly referral meeting. If accepted at this stage, patients would be assessed by one of the three services (psychology, nurse counselors and group therapy) and then, if needed would be referred for specialist psychological therapy.
It could take at least 28 days until appointments were offered and there was a further referral and wait for specialist psychological therapy. If the referral went to the ‘wrong’ level of service, a further internal transfer was needed.
Their re-design will use electronic referrals, with an agreed common data set, to a single point. This will offer daily screening and triage to level 1 services such as guided self-help and physical activity. An assessment will be offered within 14 days and then the appropriate psychological therapist will be allocated.
For more information on how to review and redesign your current processes to eliminate unnecessary steps, please contact your local Mental Health Collaborative Programme Manager or visit www.scotland.gov.uk/topics/health/nhs-scotland/delivery-improvement/1835/74
aw_Demand.indd 25aw_Demand.indd 25 24/05/2010 15:4524/05/2010 15:45
25/2
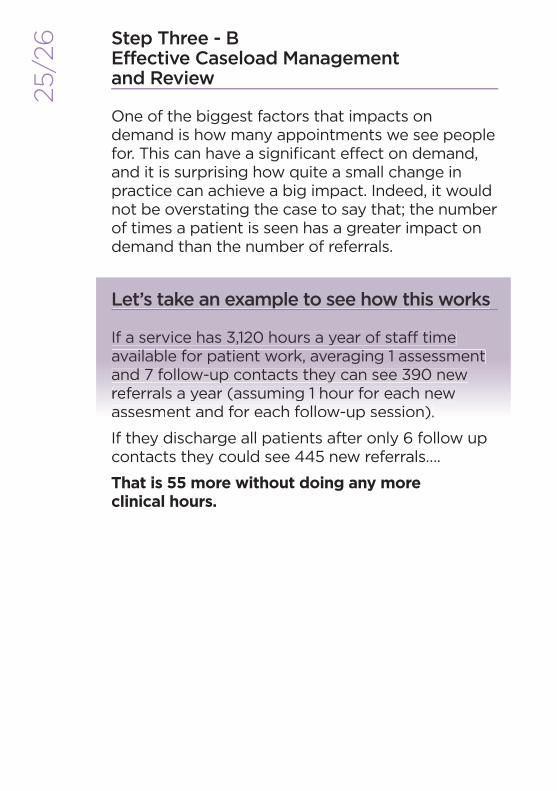
6 Step Three - B Effective Caseload Management and Review
One of the biggest factors that impacts on demand is how many appointments we see people for. This can have a signifi cant effect on demand, and it is surprising how quite a small change in practice can achieve a big impact. Indeed, it would not be overstating the case to say that; the number of times a patient is seen has a greater impact on demand than the number of referrals.
Let’s take an example to see how this works
If a service has 3,120 hours a year of staff time available for patient work, averaging 1 assessment and 7 follow-up contacts they can see 390 new referrals a year (assuming 1 hour for each new assesment and for each follow-up session).
If they discharge all patients after only 6 follow up contacts they could see 445 new referrals….
That is 55 more without doing any more clinical hours.
Let’s take an example to see how this works
If a service has 3,120 hours a year of staff time available for patient work, averaging 1 assessment andd 77 ffollllow-up co tntactts t thhey can see 393900 new rerefeferrrralalss aa yeyearar ( (asassusumimingng 1 1 h houourr foforr eaeachch n newew asassesesmsmenentt anandd foforr eaeachch f folollolow-w upup s sesessisionon).).
If they discharge all patients after only 6 follow up contacts they could see 445 new referrals….
That is 55 more without doing any more clinical hours.
aw_Demand.indd 26aw_Demand.indd 26 24/05/2010 15:4524/05/2010 15:45
We are not suggesting you reduce your number of contacts just to save time – just that you do need to think carefully as a team whether all the contacts are necessary. We suggest you look at:
• Variation between staff or teams. If one CMHT sees people an average of 6 times and another an average of 12 times and their referral rates are the same; the second one will have double the demand of the fi rst. It might be that the second CMHT has individuals with more complex needs being referred. If it is clinically appropriate to see people 12 times, then that’s fi ne. However, we need to be clear that the differences in how often we see people are justifi ed clinically, as it makes such a big difference to the team’s demand.
• Ensuring you have effective caseload management systems in place and effective caseload review. Please see the booklet in this series on Goal Setting and Case Review for further information.
It is common for services to offer follow-up appointments to ‘check progress has been maintained’ or ‘just to be sure’. Is this always necessary?
In one health centre clinic, instead of a routine follow up appointment, patients are offered a choice of a booked time or the option to contact the Health Centre if they wish to come back. Approximately 50% do not re-book, thus eliminating ‘check up’ appointments when things are going well.
aw_Demand.indd 27aw_Demand.indd 27 24/05/2010 15:4524/05/2010 15:45
27/
28
Other possibilities include telephone or email follow-up at a pre-booked time.
Sometimes we book people ‘in a fortnight’ as a matter of routine, rather than asking whether this is needed, or the patient wishes to be seen again so soon. Some research in Fife showed that allowing patients to take control of their next appointments reduced the amount of appointments made.
(Carey, T. A. & Mullan, R.J.(2007). Patients taking the Lead: A naturalistic investigation of a patient-led approach to treatment in primary care. Counselling Psychology Quarterly, 20(1), 27-40.)
Application TipWiseman Workload Measure
The Wiseman Workload Measure (WWM) is one tool that can help you with caseload management.
The WWM measures actual and total workload. Within the tool, total workload is defi ned as Direct Care, Indirect Care, Role/Agency Tasks and Travel. The Measure also features a Turnover and Time on Caseload Monitor. The WWM is completed by individual practitioners but can be aggregated to represent team and service total activity and total capacity.
The caseload profi le and workload information obtained through using the WWM increases the practitioners’ awareness of their styles of, and approaches to, care delivery and caseload management. It supports the process of refl ective practice.
For more information about the WWM please go to www.scotland.gov.uk/topics/health/nhs-scotland/delivery-improvement/1835/74
aw_Demand.indd 28aw_Demand.indd 28 24/05/2010 15:4524/05/2010 15:45
Step Three - C Ensure your service uses a matched/stepped care model
Stepped care is a tiered approach to service provision, best described as pyramidal in structure. High volume, low intensity interventions are provided at the base of the pyramid to service users with the least severe diffi culties. Subsequent ‘steps’ are usually defi ned by increasing levels of case complexity, and increasingly intensive forms of treatment. As the level of intensity increases, the time needed to treat (demand) will increase.
In a matched/stepped care model, there is a system for matching the appropriate level of treatment to the level of complexity of the service user’s problem. And the service user receives the minimum input compatible with effective treatment. Doing this means the demand on the service is kept to the minimum needed, whilst still achieving good clinical outcomes.
In providing treatment to any service user population presenting with problems spanning a spectrum of severity, evidence suggests that a matched/stepped care model is the best way to make use of limited resources. The tiered approach to delivering mental health services in Scotland is laid out in the Framework for Mental Health Services (1997), and in the Matrix (2008).
aw_Demand.indd 29aw_Demand.indd 29 24/05/2010 15:4524/05/2010 15:45
29/3
0There are a number of ways of defi ning steps within a matched care model. Most psychological therapy models will have levels of service delivery corresponding to:
• InformationThis is generally accessed directly and does not involve one-to-one contact with mental health staff. It will include information available on mental health issues in general, on common mental health problems, and on different treatment approaches. It will also include information leafl ets available through GP surgeries or other health and social care agencies. It may also cover library/reading schemes, large scale psycho-educational groups, and direction to high quality Psychological Therapy websites.
Demand = minimal (just the time needed to supply information and keep updated)
• ‘Low Intensity’ interventionsMost commonly accessed through GPs, covers Doing Well Advisors/Self-Help Coaching, solution focused problem solving, supported self-help, structured anxiety management groups etc. Aimed at transient or mild mental health problems with limited effect on functioning; these interventions are time limited and normally last between 2 and 6 sessions.
aw_Demand.indd 30aw_Demand.indd 30 24/05/2010 15:4524/05/2010 15:45
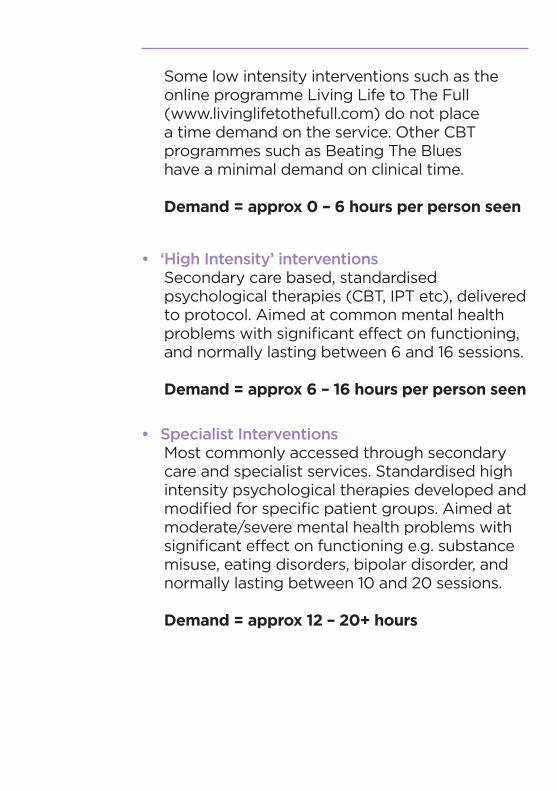
Some low intensity interventions such as the online programme Living Life to The Full (www.livinglifetothefull.com) do not place a time demand on the service. Other CBT programmes such as Beating The Blues have a minimal demand on clinical time.
Demand = approx 0 – 6 hours per person seen
• ‘High Intensity’ interventionsSecondary care based, standardised psychological therapies (CBT, IPT etc), delivered to protocol. Aimed at common mental health problems with signifi cant effect on functioning, and normally lasting between 6 and 16 sessions.
Demand = approx 6 – 16 hours per person seen
• Specialist InterventionsMost commonly accessed through secondary care and specialist services. Standardised high intensity psychological therapies developed and modifi ed for specifi c patient groups. Aimed at moderate/severe mental health problems with signifi cant effect on functioning e.g. substance misuse, eating disorders, bipolar disorder, and normally lasting between 10 and 20 sessions.
Demand = approx 12 – 20+ hours
aw_Demand.indd 31aw_Demand.indd 31 24/05/2010 15:4524/05/2010 15:45
31/
32
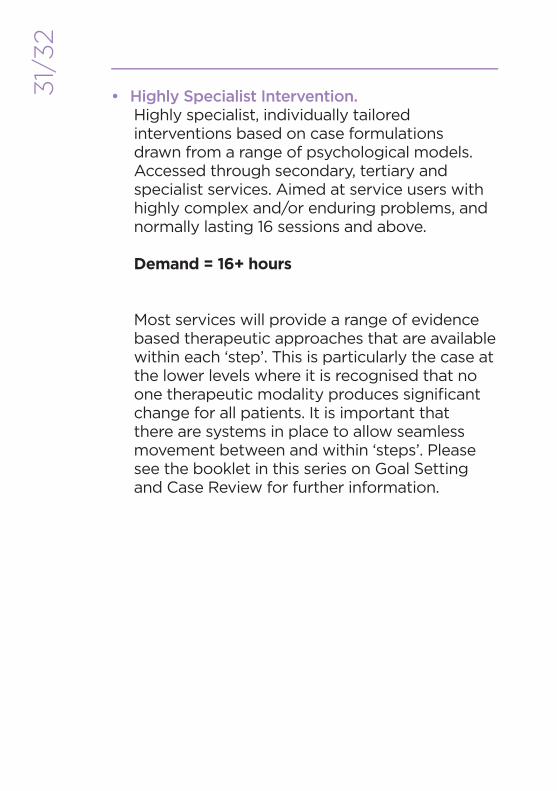
• Highly Specialist Intervention.Highly specialist, individually tailored interventions based on case formulations drawn from a range of psychological models. Accessed through secondary, tertiary and specialist services. Aimed at service users with highly complex and/or enduring problems, and normally lasting 16 sessions and above.
Demand = 16+ hours
Most services will provide a range of evidence based therapeutic approaches that are available within each ‘step’. This is particularly the case at the lower levels where it is recognised that no one therapeutic modality produces signifi cant change for all patients. It is important that there are systems in place to allow seamless movement between and within ‘steps’. Please see the booklet in this series on Goal Setting and Case Review for further information.
aw_Demand.indd 32aw_Demand.indd 32 24/05/2010 15:4524/05/2010 15:45
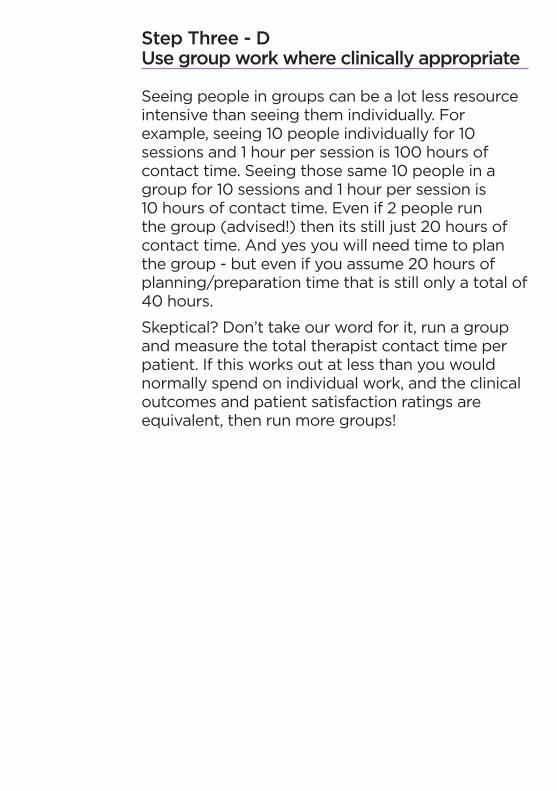
Step Three - D Use group work where clinically appropriate
Seeing people in groups can be a lot less resource intensive than seeing them individually. For example, seeing 10 people individually for 10 sessions and 1 hour per session is 100 hours of contact time. Seeing those same 10 people in a group for 10 sessions and 1 hour per session is 10 hours of contact time. Even if 2 people run the group (advised!) then its still just 20 hours of contact time. And yes you will need time to plan the group - but even if you assume 20 hours of planning/preparation time that is still only a total of 40 hours.
Skeptical? Don’t take our word for it, run a group and measure the total therapist contact time per patient. If this works out at less than you would normally spend on individual work, and the clinical outcomes and patient satisfaction ratings are equivalent, then run more groups!
aw_Demand.indd 33aw_Demand.indd 33 24/05/2010 15:4524/05/2010 15:45
33/3
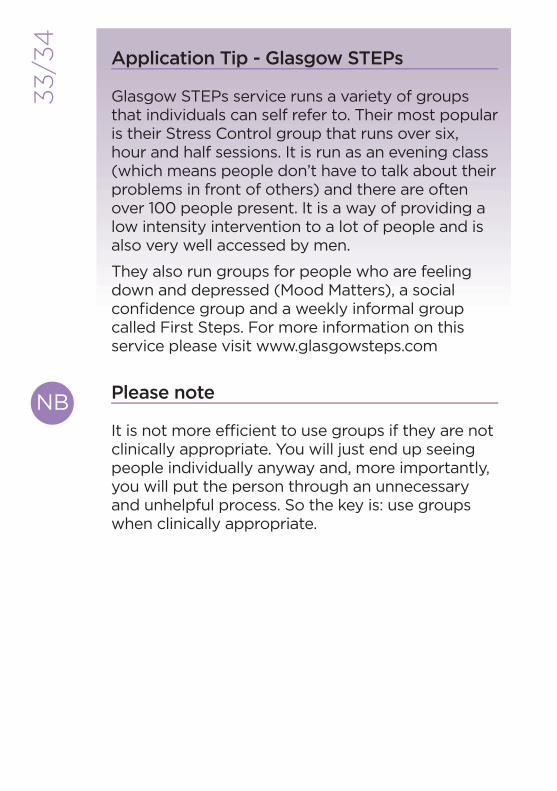
4Application Tip - Glasgow STEPs
Glasgow STEPs service runs a variety of groups that individuals can self refer to. Their most popular is their Stress Control group that runs over six, hour and half sessions. It is run as an evening class (which means people don’t have to talk about their problems in front of others) and there are often over 100 people present. It is a way of providing a low intensity intervention to a lot of people and is also very well accessed by men.
They also run groups for people who are feeling down and depressed (Mood Matters), a social confi dence group and a weekly informal group called First Steps. For more information on this service please visit www.glasgowsteps.com
Please note
It is not more effi cient to use groups if they are not clinically appropriate. You will just end up seeing people individually anyway and, more importantly, you will put the person through an unnecessary and unhelpful process. So the key is: use groups when clinically appropriate.
NB
aw_Demand.indd 34aw_Demand.indd 34 24/05/2010 15:4524/05/2010 15:45
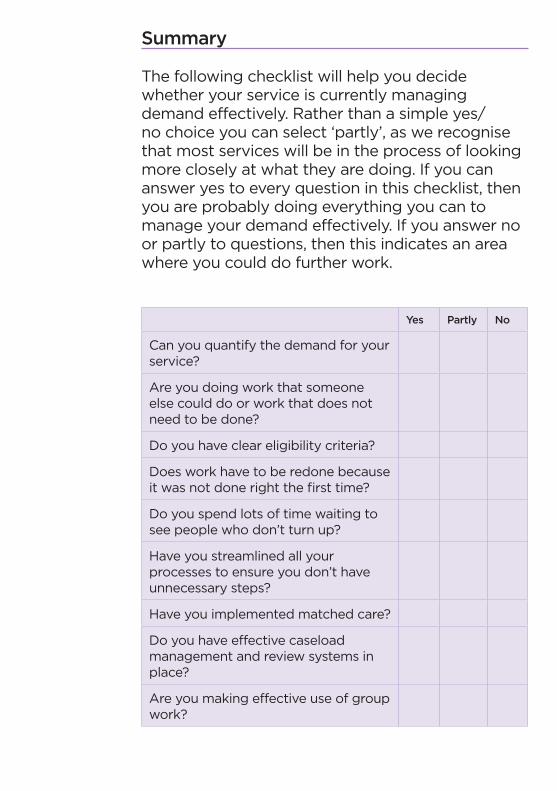
Summary
The following checklist will help you decide whether your service is currently managing demand effectively. Rather than a simple yes/no choice you can select ‘partly’, as we recognise that most services will be in the process of looking more closely at what they are doing. If you can answer yes to every question in this checklist, then you are probably doing everything you can to manage your demand effectively. If you answer no or partly to questions, then this indicates an area where you could do further work.
Yes Partly No
Can you quantify the demand for your service?
Are you doing work that someone else could do or work that does not need to be done?
Do you have clear eligibility criteria?
Does work have to be redone because it was not done right the fi rst time?
Do you spend lots of time waiting to see people who don’t turn up?
Have you streamlined all your processes to ensure you don’t have unnecessary steps?
Have you implemented matched care?
Do you have effective caseload management and review systems in place?
Are you making effective use of group work?
aw_Demand.indd 35aw_Demand.indd 35 24/05/2010 15:4524/05/2010 15:45
35/3
6 Summary of Data to Measure Demand
A number of times in this guide we have referred to the DCAQ tool. This is a spreadsheet based application. To use this tool for capacity analysis, you will need to know certain pieces of information. These are described in more detail in the MHC DCAQ Tool guide at: www.scotland.gov.uk/topics/health/nhs-scotland/delivery-improvement/1835.74
This guide also tells you why you need this information. The following table summarises the data that the DCAQ tool will need.
aw_Demand.indd 36aw_Demand.indd 36 24/05/2010 15:4524/05/2010 15:45
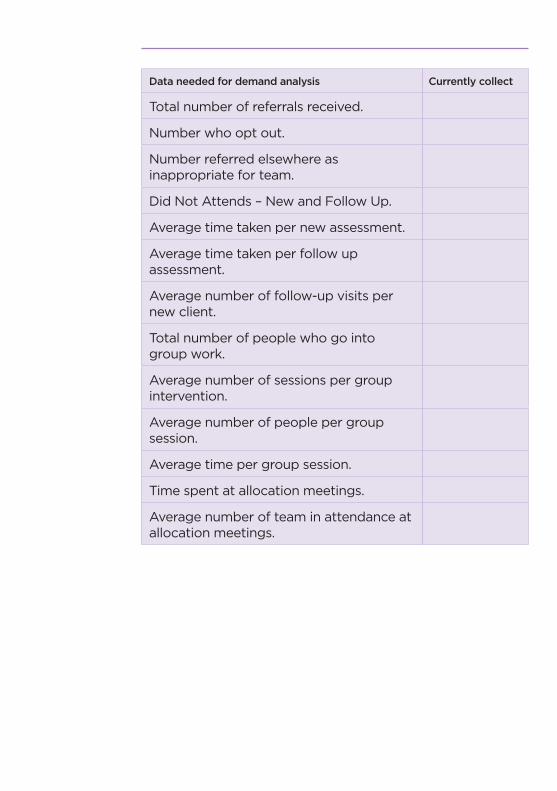
Data needed for demand analysis Currently collect
Total number of referrals received.
Number who opt out.
Number referred elsewhere as inappropriate for team.
Did Not Attends – New and Follow Up.
Average time taken per new assessment.
Average time taken per follow up assessment.
Average number of follow-up visits per new client.
Total number of people who go into group work.
Average number of sessions per group intervention.
Average number of people per group session.
Average time per group session.
Time spent at allocation meetings.
Average number of team in attendance at allocation meetings.
aw_Demand.indd 37aw_Demand.indd 37 24/05/2010 15:4524/05/2010 15:45

Demand and Capacity – two sides of the same coin
Looking at your demand is only one side of the coin, you also need to look at how you manage your capacity. You might fi nd you have more control over it than you realised. See Capacity for Psychological Therapies Services for more information on this.
aw_Demand.indd 38aw_Demand.indd 38 24/05/2010 15:4524/05/2010 15:45

aw_Demand.indd 39aw_Demand.indd 39 24/05/2010 15:4524/05/2010 15:45

© Crown Copyright 2010
These booklets have been produced by the Scottish Mental Health Collaborative. For further information about the work of the Scottish Mental Health Collaborative please visit its website: www.scotland.gov.uk//PsychologicalTherapiesServicesIntroductoryGuides/Demand
These booklets are a series of fi ve. These are listed below:
• Improving Access to Psychological Therapies Services• Capacity for Psychological Therapies Services• Demand for Psychological Therapies Services• Clinical Administration for Psychological Therapies Services• Goal Setting & Case Review for Psychological Therapies Services
PDF copies of these booklets can be assessed at the Scottish Government website: www.scotland.gov.uk
APS Group ScotlandDPPAS10061 05/10
Further copies are available from:BookSource50 Cambuslang RoadCambuslang Investment ParkGlasgow G32 8NB
Telephone: 0845-370-0067Fax: 0845-370-0068
Email: [email protected]
ISBN: 978-0-7559-9344-4
9 780755 993444
aw_Demand.indd 40aw_Demand.indd 40 24/05/2010 15:4524/05/2010 15:45