Embed Size (px)
Citation preview
For-Profit Educationin the United States:
A Primer
James Coleman
Richard Vedder
Center for College Affordability and Productivity*
A Policy Paper from the Center for College Affordability and Productivity
May 2008
James Coleman is a research associate at the Center for College Affordability and Productivity. Richard Vedder isdirector of the Center for College Affordability and Productivity.
2
About the AuthorsJames Coleman is a research assistant at the Center for College Affordability and Productivity. Beginning
in June 2008, he will be a member of the Koch Associate Program, a management training program for
future nonprofit leaders.
Richard Vedder is director of the Center for College Affordability and Productivity, Distinguished Professor
of Economics at Ohio University, and a visiting scholar at the American Enterprise Institute. Dr. Vedder
served as a member of the Secretary of Education’s Commission on the Future of Higher Education. He is
the author of Going Broke by Degree: Why College Costs Too Much, and he has written and lectured widely
on the cost of higher education. Dr. Vedder is also the author of numerous scholarly papers for journals in
economics and public policy, as well as shorter pieces for the serious popular press, including the Wall Street
Journal, Washington Post, Christian Science Monitor, Education Next, Cato Journal, The American Enterprise,
Society, and Forbes.
Center for College Affordability and ProductivityThe Center for College Affordability and Productivity (CCAP) is a nonprofit research center based in
Washington, DC, that is dedicated to research on the issues of rising costs and stagnant efficiency in higher
education, with a special emphasis on developing market-based solutions.
1150 17th St. NW #910 202-375-7831 (Phone) www.collegeaffordability.net
Washington, DC 20036 202-375-7821 (Fax) collegeaffordability.blogspot.com
Table of Contents A Brief History of For-Profit Education . . . . . . . . . . . . . . . . . . . . . . . . . . . . . . . . . . . .5Growth . . . . . . . . . . . . . . . . . . . . . . . . . . . . . . . . . . . . . . . . . . . . . . . . . . . . . . . . . . .5For-Profit Revenues & Expenditures . . . . . . . . . . . . . . . . . . . . . . . . . . . . . . . . . . . . .11Quality . . . . . . . . . . . . . . . . . . . . . . . . . . . . . . . . . . . . . . . . . . . . . . . . . . . . . . . . . .17Company Snapshots . . . . . . . . . . . . . . . . . . . . . . . . . . . . . . . . . . . . . . . . . . . . . . . .20The Secret to For-Profits’ Success . . . . . . . . . . . . . . . . . . . . . . . . . . . . . . . . . . . . . . .26Industry Challenges . . . . . . . . . . . . . . . . . . . . . . . . . . . . . . . . . . . . . . . . . . . . . . . . .27The Future of For-Profit Education . . . . . . . . . . . . . . . . . . . . . . . . . . . . . . . . . . . . . .28References . . . . . . . . . . . . . . . . . . . . . . . . . . . . . . . . . . . . . . . . . . . . . . . . . . . . . . .30
Figures and Tables Figure 1: Total For-Profit Enrollment, 1976–2005 . . . . . . . . . . . . . . . . . . . . . . . . . . . 6Figure 2: For-Profit Market Share as a Percent of Total Students Enrolled in
For-Profits, 1976–2005 (All Institution Types) . . . . . . . . . . . . . . . . . . . . . . . . . . . . . 6Figure 3: Market Share by FTE Enrollment by Institution Type, 2005 . . . . . . . . . . . . . 7Figure 4: For-Profit as Distributed as Industry by Enrollment, 2005 . . . . . . . . . . . . . . 8Figure 5: Average Year-to-Year Growth by Institution Type . . . . . . . . . . . . . . . . . . . . 8Figure 6: Student Age Distribution by Institution Type, 2005 . . . . . . . . . . . . . . . . . . . 9Figure 7: Full-Time v. Part-Time . . . . . . . . . . . . . . . . . . . . . . . . . . . . . . . . . . . . . . . 10Figure 8: Average Total Revenue per Student, 2003–04 . . . . . . . . . . . . . . . . . . . . . 10Figure 9: Average For-Profit Revenue Sources, 2003–04 . . . . . . . . . . . . . . . . . . . . . 12Figure 10: Average Percent of Revenue from Government, 2005 . . . . . . . . . . . . . . 12Figure 11: Average Tuition by Institution Type, 2006–07 . . . . . . . . . . . . . . . . . . . . . 13Figure 12: Average Expenditure per Student, 2005 . . . . . . . . . . . . . . . . . . . . . . . . . 14Figure 13: Average Spending on Instruction, 2003–04 . . . . . . . . . . . . . . . . . . . . . . 14Figure 14: Average Percent of Total Revenue Going to Instruction, 2003–04 . . . . . 15Figure 15: Average Percent of Revenues Going to Instruction and
Academic Support Services, 2003–04 . . . . . . . . . . . . . . . . . . . . . . . . . . . . . . . . . 15Figure 16: Average Tuition Revenue Going To Instruction per Student, 2003–04 . . . 16Figure 17: Average Administrative and General Expenses per Student, 2003–04 . . . 16Figure 18: Mean ACT Scores of Applicants, 2003–04 . . . . . . . . . . . . . . . . . . . . . . . 18Figure 19: Average Amount Borrowed to Complete an Undergraduate
Degree, 2003–04 . . . . . . . . . . . . . . . . . . . . . . . . . . . . . . . . . . . . . . . . . . . . . . . . 18Figure 20: Average Student-to-Faculty Ratio, Fall 2005 . . . . . . . . . . . . . . . . . . . . . . 19Table 1: For-Profit Industry Market Share, Fall 2005 . . . . . . . . . . . . . . . . . . . . . . . . 20Table 2: Company Snapshots, 2005 . . . . . . . . . . . . . . . . . . . . . . . . . . . . . . . . . . . . 21Figure 21: Apollo Group Enrollment . . . . . . . . . . . . . . . . . . . . . . . . . . . . . . . . . . . . 22Figure 22: Apollo Stock v. S&P . . . . . . . . . . . . . . . . . . . . . . . . . . . . . . . . . . . . . . . . 22Figure 23: Apollo Return on Equity . . . . . . . . . . . . . . . . . . . . . . . . . . . . . . . . . . . . . 23Figure 24: ITT Enrollment . . . . . . . . . . . . . . . . . . . . . . . . . . . . . . . . . . . . . . . . . . . . 24Figure 25: ITT Educational Services Stock v. S&P . . . . . . . . . . . . . . . . . . . . . . . . . . . 24Figure 26: ITT Educational Services Return on Equity . . . . . . . . . . . . . . . . . . . . . . . 25Figure 27: Higher Education Price Index . . . . . . . . . . . . . . . . . . . . . . . . . . . . . . . . . 26
3

A Brief History of For-Profit Education
For-profit higher education is not new. In fact, profit motive has played an important role in providing
higher education since the Golden Age of Greece, when anyone could open up a private school and teach
(Coulson 1999). Competitive for-profit education was particularly prominent in Athens, which led the
city to become a beacon of learning (Coulson 1999). For-profit education was all but wiped out during
the Middle Ages, but reemerged in the early Renaissance, when private instructors were hired to teach
merchants the method of double-entry bookkeeping (Reigner 1959). Since the late fifteenth century, for-
profit higher education has continued to develop. During the nineteenth century, well-organized for-
profit business schools were founded across America and for-profit education developed into a very
important form of higher education (Kinser 2006). Compelled by market forces, for-profit schools
sprang up where needed to fill the educational needs of the population.
During the early twentieth century, however, for-profit schools found their markets undercut by the
establishment of publicly funded colleges and vocational institutions. Higher education during the twen-
tieth century underwent drastic changes as reformers forcefully argued education was the business of the
state, and society could be improved by strong, publicly backed schools (Coulson 1999). Often propo-
nents of state-sponsored education on the left argued the government should use education as a way to
shape the minds of the nation’s citizens, who were not responsible enough to take care of their own edu-
cation properly (Coulson 1999). On the right, similar arguments were used as special interest groups saw
the government as a means to influence what went on in the classroom. Consequently, the government
stepped into the higher education arena, in part, by arguing people were not competent enough to over-
see their own education. While the data for this period are scarce, it is safe to say for the period
1890–1972, for-profit colleges were increasingly marginalized by the growth of highly subsidized public
institutions (Breneman et al. 2006; Kinser 2006; Ruch 2001).
Starting in the mid-1970s and accelerating through the 1980s and 1990s, for-profit education under-
went a renaissance, due in large part to the 1972 reauthorization of the Higher Education Act, which
increased the amount of government student aid available to for-profit schools (Kinser 2006; Turner
2006). During this era, the broadened scope of Pell Grants gave rise to an increasing number of for-profit
universities offering associates, bachelors, and graduate degrees (Turner 2006). Since 1976, for-profit
enrollment has grown at an annualized growth rate of about 11 percent, increasing by a factor of nearly
twenty-three. For-profits’ market share of higher education has gone from 0.4 percent to nearly 6 percent
(U.S. Department of Education, National Center for Education Statistics, 2006a). The robust resurgence
of for-profit schools suggests America’s nonprofit colleges are failing to meet fully the people’s needs. As
a result, for-profits are stepping in to meet market demands their highly subsidized counterparts have
chronically failed to satisfy. These recent and rapid developments have once again brought for-profit edu-
cation national visibility.
Growth
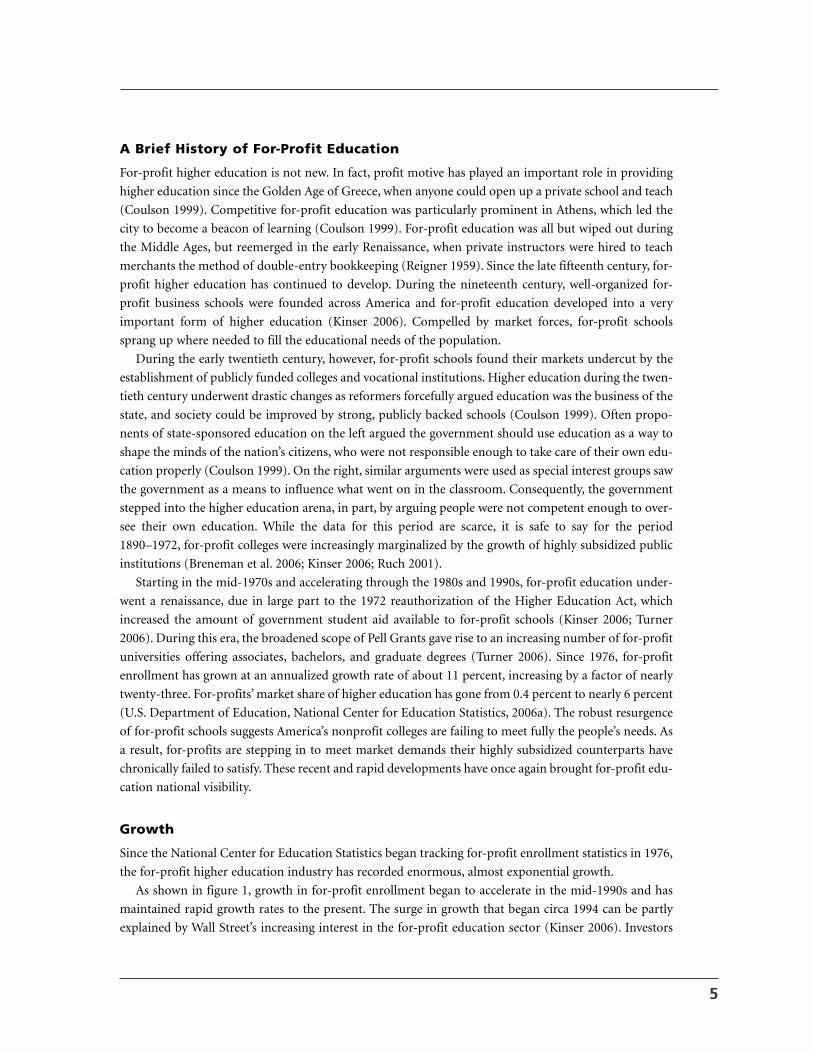
Since the National Center for Education Statistics began tracking for-profit enrollment statistics in 1976,
the for-profit higher education industry has recorded enormous, almost exponential growth.
As shown in figure 1, growth in for-profit enrollment began to accelerate in the mid-1990s and has
maintained rapid growth rates to the present. The surge in growth that began circa 1994 can be partly
explained by Wall Street’s increasing interest in the for-profit education sector (Kinser 2006). Investors
5
For-Profit Education in the United States: A Primer
6
FIGURE 1
TOTAL FOR-PROFIT ENROLLMENT, 1976–2005
Source: U.S. Department of Education, National Center for Education Statistics 2006c.
0
200,000
400,000
600,000
800,000
1,000,000
1,200,000
1976 1981 1986 1991 1996 2001
Stud
ents
Year
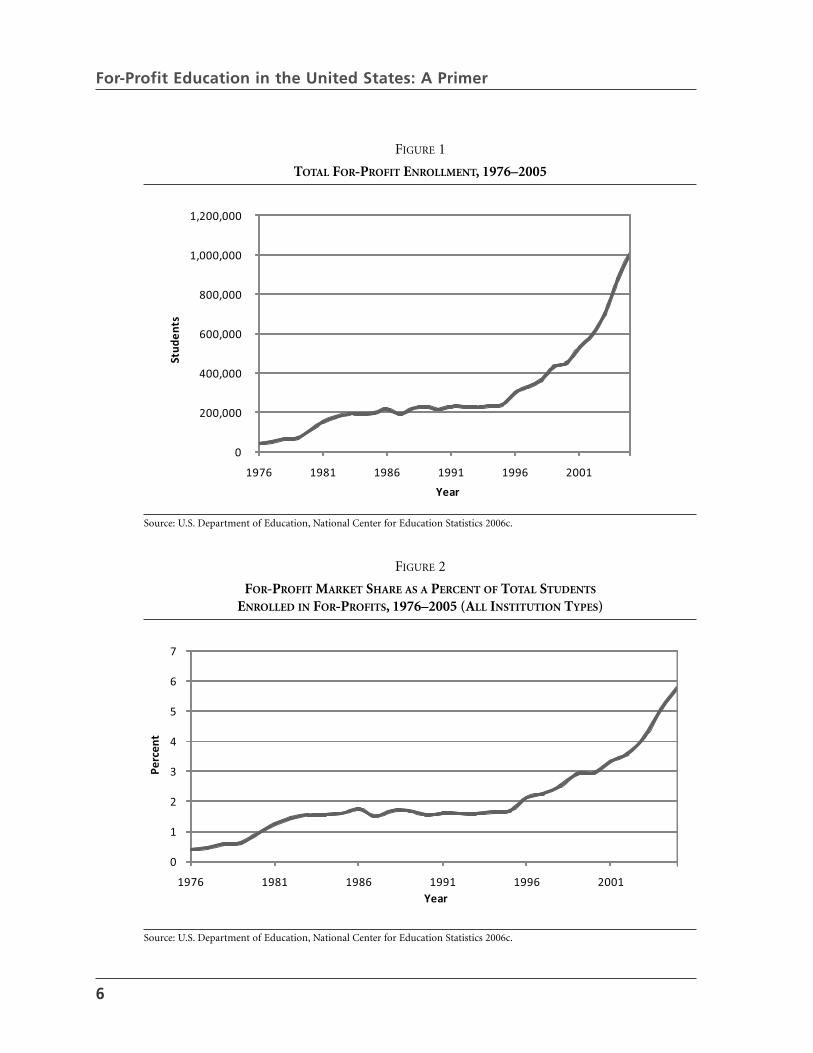
FIGURE 2
FOR-PROFIT MARKET SHARE AS A PERCENT OF TOTAL STUDENTS
ENROLLED IN FOR-PROFITS, 1976–2005 (ALL INSTITUTION TYPES)
Source: U.S. Department of Education, National Center for Education Statistics 2006c.
0
1
2
3
4
5
6
7
1976 1981 1986 1991 1996 2001Year
Perc
ent
saw profit potential in for-profit education and drove its growth via financing Initial Public Offerings
(IPOs) and venture capital firms. The spike in growth is further explained by for-profit institutions posi-
tioning themselves to address a legitimate market demand traditional institutions have increasingly failed
to satisfy, providing higher education to underserved geographic areas and demographic groups and
being attentive to student needs (Turner 2006).
Not only has the absolute change in enrollment been impressive for for-profit schools, but the increase
in their educational market share, defined as their share of enrolled students, has also been robust. Since
1976, for-profits’ market share has increased by a factor of approximately fourteen, from less than 0.5 per-
cent to nearly 6 percent. Figure 2 illustrates strong growth commencing in the mid-nineties.
Figure 3 shows that, in a small number of years, for-profit education has captured a notable percent
of the higher education market. This expansion in market-share has been driven, to a large extent, by
publicly traded companies such as Apollo Group and its University of Phoenix (UOP), Laureate Educa-
tion, Career Education Corporation, as well as others. It is worth noting for-profits also play a critical role
in providing education in fewer-than-two-year programs, an area in which nonprofits have been very
slow to offer highly demanded services. As a result, the for-profits have stepped in to meet the demand,
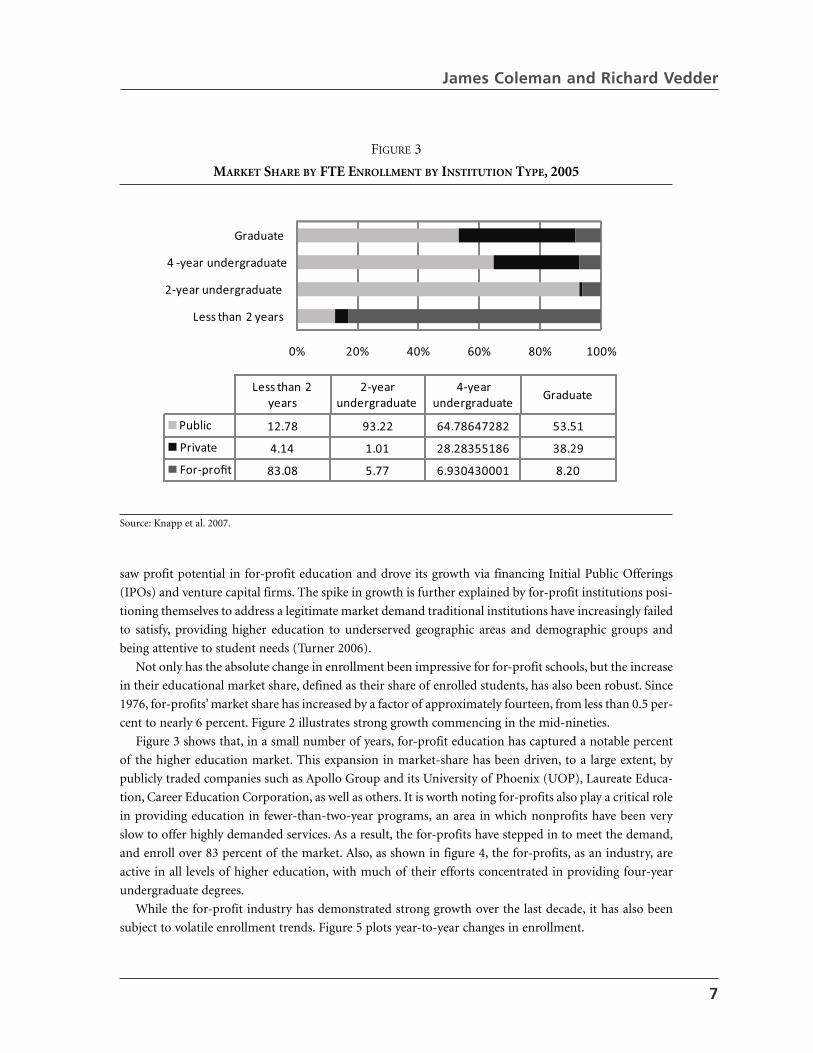
and enroll over 83 percent of the market. Also, as shown in figure 4, the for-profits, as an industry, are
active in all levels of higher education, with much of their efforts concentrated in providing four-year
undergraduate degrees.
While the for-profit industry has demonstrated strong growth over the last decade, it has also been
subject to volatile enrollment trends. Figure 5 plots year-to-year changes in enrollment.
James Coleman and Richard Vedder
7
FIGURE 3
MARKET SHARE BY FTE ENROLLMENT BY INSTITUTION TYPE, 2005
Source: Knapp et al. 2007.
0% 20% 40% 60% 80% 100%
Less than 2 years
2-year undergraduate
4 -year undergraduate
Graduate
Less than 2 years
2-year undergraduate
4-year undergraduate
Graduate
Public 12.78 93.22 64.78647282 53.51
Private 4.14 1.01 28.28355186 38.29
For-profit 83.08 5.77 6.930430001 8.20
For-Profit Education in the United States: A Primer
8
FIGURE 4
FOR-PROFIT AS DISTRIBUTED AS INDUSTRY BY ENROLLMENT, 2005
Source: Knapp et al. 2007.
45%
12%
43% 4-year
Graduate
2-year and less
FIGURE 5
AVERAGE YEAR-TO-YEAR GROWTH BY INSTITUTION TYPE
Source: U.S. Department of Education, National Center for Education Statistics 2006c.
-20
-10
0
10
20
30
40
50
60
70
1977 1982 1987 1992 1997 2002Year
Public Private Profit
Perc
enta
ge
James Coleman and Richard Vedder
9
On average, the for-profit sector has experienced a year-to-year growth rate of over 11 percent since
1976, which is impressive compared to higher education’s total average yearly growth rate of just 1.6 per-
cent (Breneman et al. 2006; U.S. Department of Education, Institute of Education Sciences, National
Center for Education Statistics, 2006b). As is apparent in figure 5, however, this high rate of growth has
also been accompanied by highly volatile enrollment trends. The volatility can be attributed largely to two
factors: First, for-profit is a relatively small sector compared to the industry as a whole, and as a conse-
quence, it is affected more by minor changes in national enrollment trends. Second, unlike nonprofit
education, for-profit is maturing as an industry, and as a result, the sector is subject to more radical
upheavals and revisions in how they do business, which has resulted in significant “creative destruction”
within the industry (Kinser 2006).
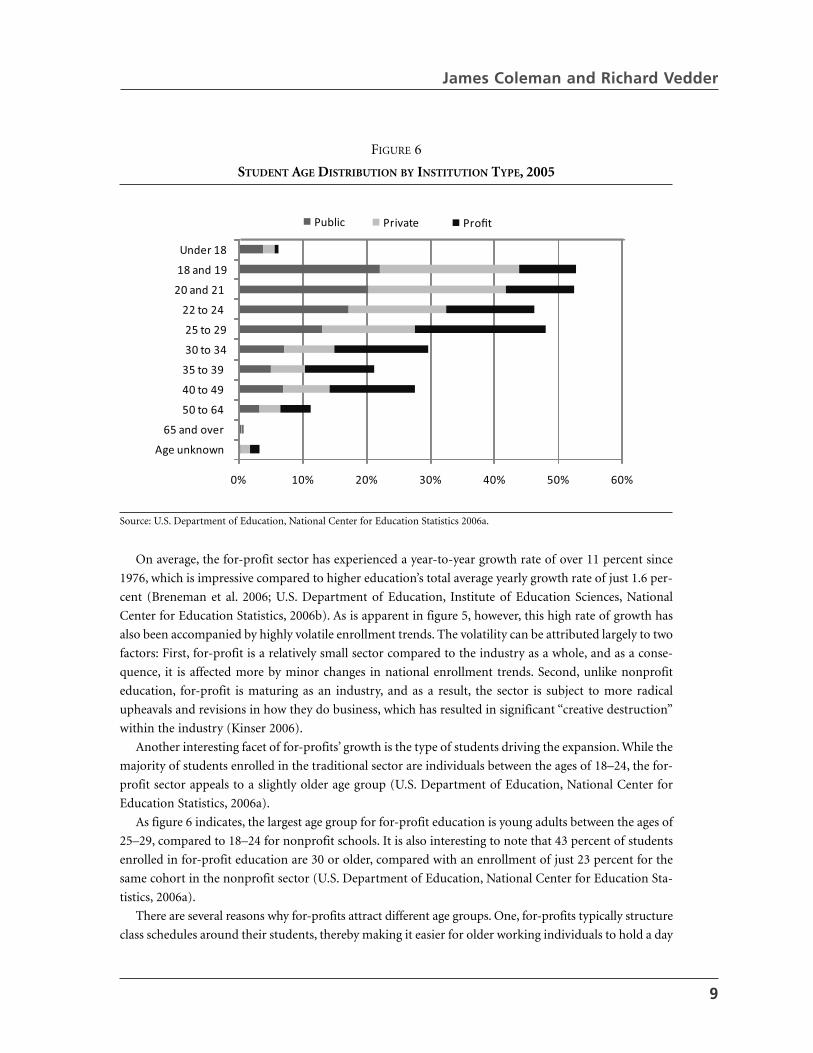
Another interesting facet of for-profits’ growth is the type of students driving the expansion. While the
majority of students enrolled in the traditional sector are individuals between the ages of 18–24, the for-
profit sector appeals to a slightly older age group (U.S. Department of Education, National Center for
Education Statistics, 2006a).
As figure 6 indicates, the largest age group for for-profit education is young adults between the ages of
25–29, compared to 18–24 for nonprofit schools. It is also interesting to note that 43 percent of students
enrolled in for-profit education are 30 or older, compared with an enrollment of just 23 percent for the
same cohort in the nonprofit sector (U.S. Department of Education, National Center for Education Sta-
tistics, 2006a).
There are several reasons why for-profits attract different age groups. One, for-profits typically structure
class schedules around their students, thereby making it easier for older working individuals to hold a day
FIGURE 6
STUDENT AGE DISTRIBUTION BY INSTITUTION TYPE, 2005
Source: U.S. Department of Education, National Center for Education Statistics 2006a.
0% 10% 20% 30% 40% 50% 60%
Under 18
18 and 19
20 and 21
22 to 24
25 to 29
30 to 34
35 to 39
40 to 49
50 to 64
65 and over
Age unknown
Public Private Profit
For-Profit Education in the United States: A Primer
10
FIGURE 7
FULL-TIME V. PART-TIME
Source: U.S. Department of Education, National Center for Education Statistics 2006a.
0
10
20
30
40
50
60
70
80
90
100
For-profit part-�me
For-profit full -�me
Public part-�me
Public full -�me
Private part-�me
Private full -�me
4-year Graduate 2-year
Perc
ent
FIGURE 8
AVERAGE TOTAL REVENUE PER STUDENT, 2003–04
Source: U.S. Department of Education, National Center for Education Statistics 2006b.
Public
Private
For-profit
$0
$10,000
$20,000
$30,000
$40,000
$50,000
$60,000
Ins�tu�on Type
James Coleman and Richard Vedder
11
job while simultaneously attending night classes (Turner 2006). Second, for-profit schools have become
an attractive means for working professionals to obtain continuing education, often with their employer
providing some form of tuition assistance (Breneman et al. 2006). Lastly, for-profit programs tend to be
vocation-oriented, allowing older adults who no longer want the full-blown college experience to acquire
job skills quickly (Turner 2006). Conversely, younger students tend to eschew the no-frills for-profits,
instead opting for the country club–like atmosphere of nonprofit universities.
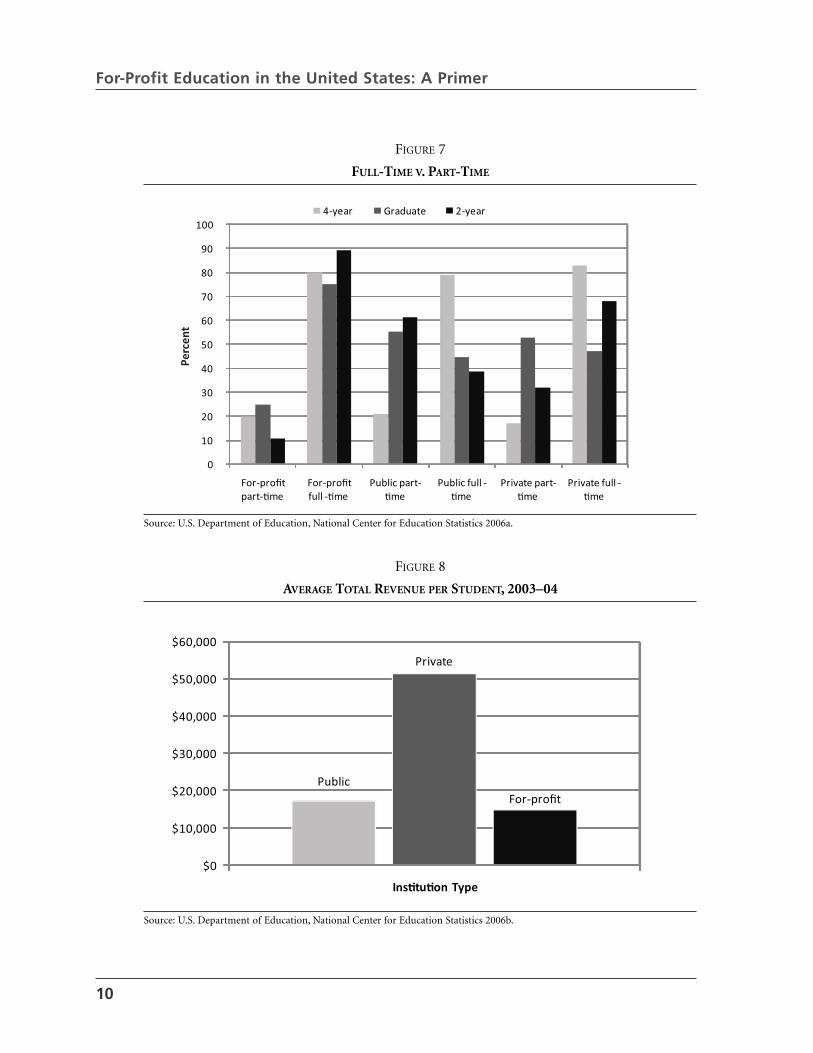
It is interesting to look at the manner in which for-profit students choose to receive their education.
As figure 7 shows, for-profit students often choose to be educated as full-time students. In fact, for-profits
enroll a higher percentage of students full-time than do public schools at any level, and enroll about the
same number or more students full-time as do private nonprofit schools. This is likely because
for-profits are very accommodating to students, making it easier to attend class and hold a job. This
implies students attending for-profits are able to attain their degrees quicker, since more time is spent in
the classroom per semester.
For-Profit Revenues and Expenditures
Perhaps where for-profits differentiate themselves the most from nonprofits is on the balance sheet.
Unlike most colleges, for-profits exist explicitly to make money for their investors. Additionally, for-profit
colleges are subject to corporate taxes and regulatory bodies such as the Securities and Exchange Com-
mission (SEC) and Federal Trade Commission (FTC), and receive little, if any, direct government sup-
port. Not surprisingly, for-profit institutions differ from nonprofits in how they manage their revenues
and expenditures.
The average total revenue per student an institution receives varies dramatically depending on the
type of institution. As figure 8 shows, for-profit schools receive the least revenue per student, $15,063,
while public universities receive slightly more and private colleges receive nearly 3.5 times the revenue of
for-profits. Breaking down college revenues by source further highlights how for-profit revenues differ
from the traditional sector.
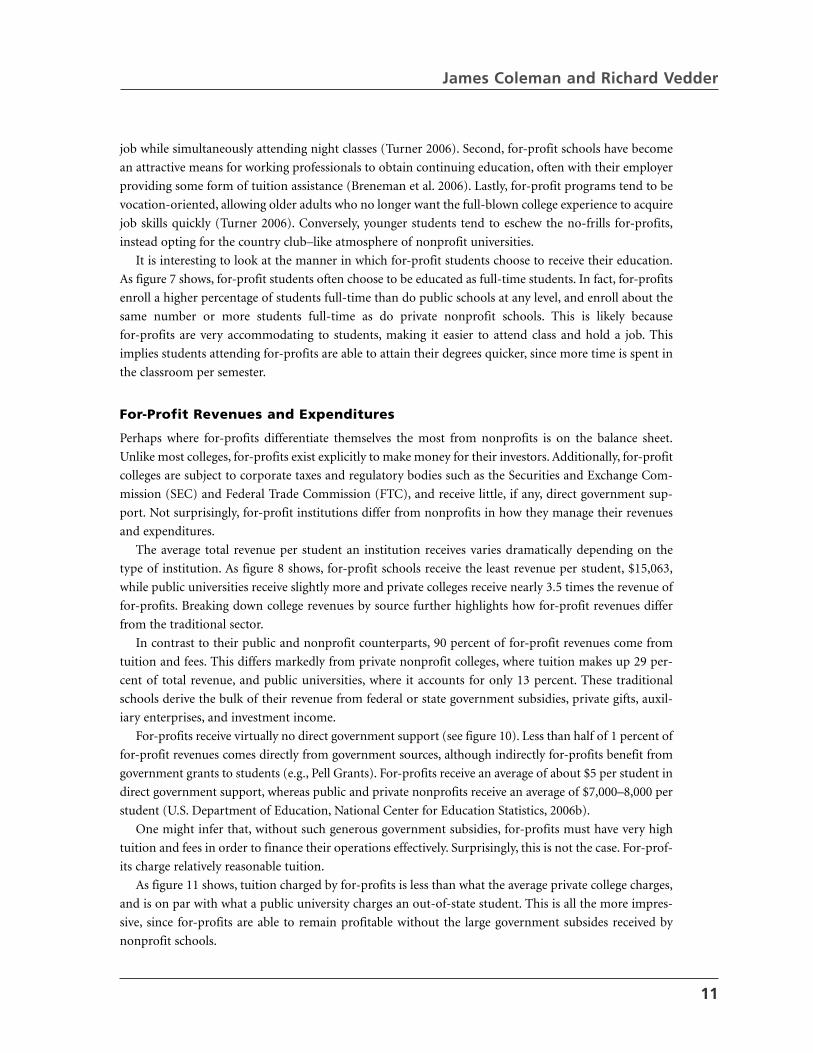
In contrast to their public and nonprofit counterparts, 90 percent of for-profit revenues come from
tuition and fees. This differs markedly from private nonprofit colleges, where tuition makes up 29 per-
cent of total revenue, and public universities, where it accounts for only 13 percent. These traditional
schools derive the bulk of their revenue from federal or state government subsidies, private gifts, auxil-
iary enterprises, and investment income.
For-profits receive virtually no direct government support (see figure 10). Less than half of 1 percent of
for-profit revenues comes directly from government sources, although indirectly for-profits benefit from
government grants to students (e.g., Pell Grants). For-profits receive an average of about $5 per student in
direct government support, whereas public and private nonprofits receive an average of $7,000–8,000 per
student (U.S. Department of Education, National Center for Education Statistics, 2006b).
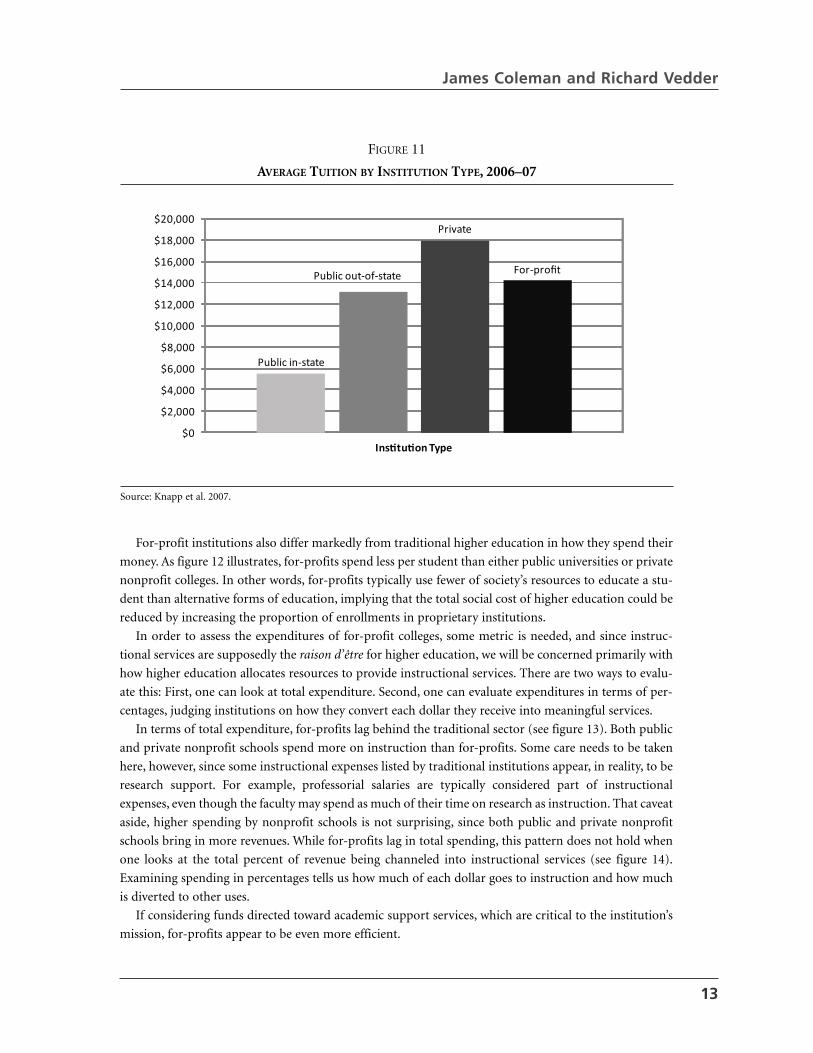
One might infer that, without such generous government subsidies, for-profits must have very high
tuition and fees in order to finance their operations effectively. Surprisingly, this is not the case. For-prof-
its charge relatively reasonable tuition.
As figure 11 shows, tuition charged by for-profits is less than what the average private college charges,
and is on par with what a public university charges an out-of-state student. This is all the more impres-
sive, since for-profits are able to remain profitable without the large government subsides received by
nonprofit schools.
For-Profit Education in the United States: A Primer
12
FIGURE 9
AVERAGE FOR-PROFIT REVENUE SOURCES, 2003–04
Source: U.S. Department of Education, National Center for Education Statistics 2006b.
90%
4%6%
Tui�on and fees
Federal appropria�ons
Other
FIGURE 10
AVERAGE PERCENT OF REVENUE FROM GOVERNMENT, 2005
Source: U.S. Department of Education, National Center for Education Statistics, 2006b.
Public
Private
For-profit0
10
20
30
40
50
60
Ins�tu�on Type
Perc
ent
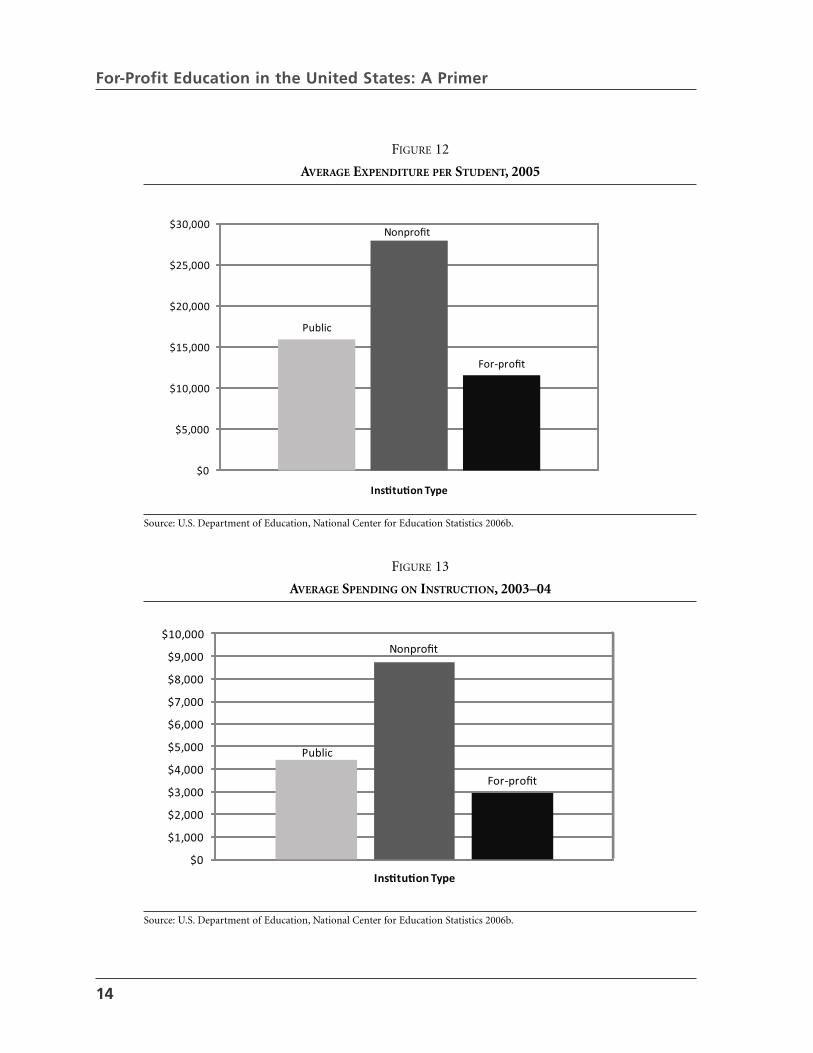
For-profit institutions also differ markedly from traditional higher education in how they spend their
money. As figure 12 illustrates, for-profits spend less per student than either public universities or private
nonprofit colleges. In other words, for-profits typically use fewer of society’s resources to educate a stu-
dent than alternative forms of education, implying that the total social cost of higher education could be
reduced by increasing the proportion of enrollments in proprietary institutions.
In order to assess the expenditures of for-profit colleges, some metric is needed, and since instruc-
tional services are supposedly the raison d’être for higher education, we will be concerned primarily with
how higher education allocates resources to provide instructional services. There are two ways to evalu-
ate this: First, one can look at total expenditure. Second, one can evaluate expenditures in terms of per-
centages, judging institutions on how they convert each dollar they receive into meaningful services.
In terms of total expenditure, for-profits lag behind the traditional sector (see figure 13). Both public
and private nonprofit schools spend more on instruction than for-profits. Some care needs to be taken
here, however, since some instructional expenses listed by traditional institutions appear, in reality, to be
research support. For example, professorial salaries are typically considered part of instructional
expenses, even though the faculty may spend as much of their time on research as instruction. That caveat
aside, higher spending by nonprofit schools is not surprising, since both public and private nonprofit
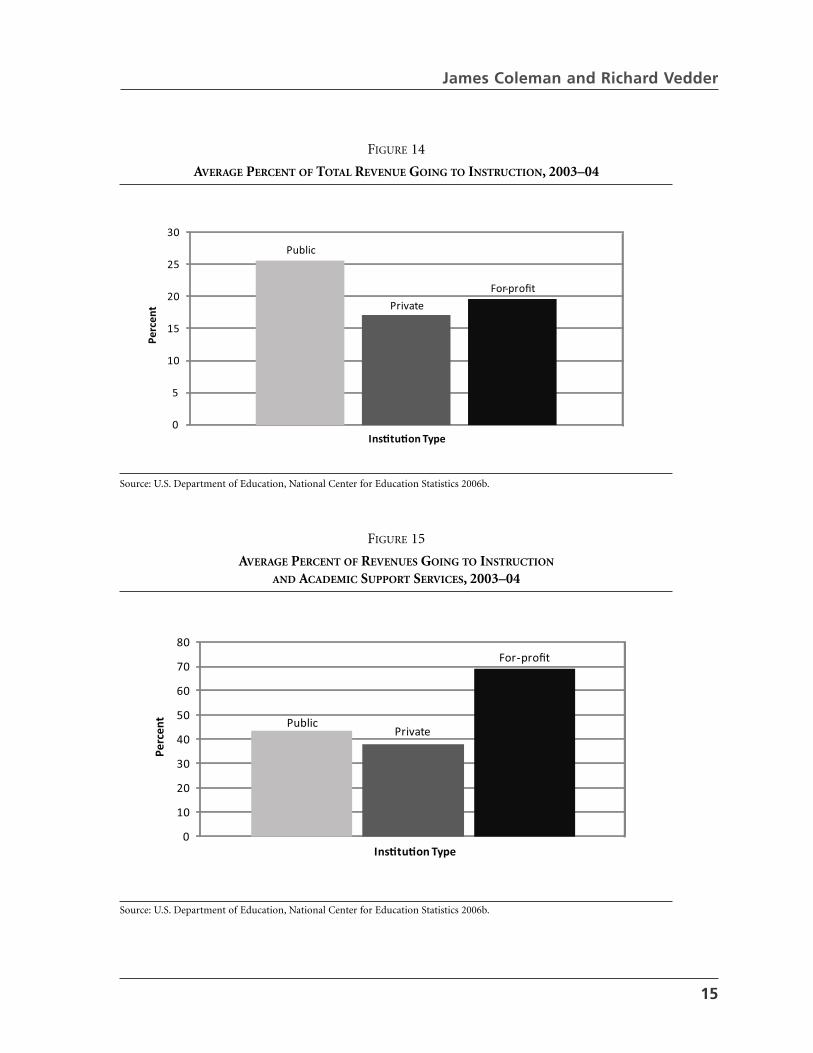
schools bring in more revenues. While for-profits lag in total spending, this pattern does not hold when
one looks at the total percent of revenue being channeled into instructional services (see figure 14).
Examining spending in percentages tells us how much of each dollar goes to instruction and how much
is diverted to other uses.
If considering funds directed toward academic support services, which are critical to the institution’s
mission, for-profits appear to be even more efficient.
James Coleman and Richard Vedder
13
FIGURE 11
AVERAGE TUITION BY INSTITUTION TYPE, 2006–07
Source: Knapp et al. 2007.
Public in-state
Public out-of-state
Private
For-profit
$0
$2,000
$4,000
$6,000
$8,000
$10,000
$12,000
$14,000
$16,000
$18,000
$20,000
Ins�tu�on Type
Public
Nonprofit
For-profit
$0
$1,000
$2,000
$3,000
$4,000
$5,000
$6,000
$7,000
$8,000
$9,000
$10,000
Ins�tu�on Type
For-Profit Education in the United States: A Primer
14
FIGURE 12
AVERAGE EXPENDITURE PER STUDENT, 2005
Source: U.S. Department of Education, National Center for Education Statistics 2006b.
Public
Nonprofit
For-profit
$0
$5,000
$10,000
$15,000
$20,000
$25,000
$30,000
Ins�tu�on Type
FIGURE 13
AVERAGE SPENDING ON INSTRUCTION, 2003–04
Source: U.S. Department of Education, National Center for Education Statistics 2006b.
James Coleman and Richard Vedder
15
FIGURE 14
AVERAGE PERCENT OF TOTAL REVENUE GOING TO INSTRUCTION, 2003–04
Source: U.S. Department of Education, National Center for Education Statistics 2006b.
Public
Private
For-profit
0
5
10
15
20
25
30
Ins�tu�on Type
Perc
ent
FIGURE 15
AVERAGE PERCENT OF REVENUES GOING TO INSTRUCTION
AND ACADEMIC SUPPORT SERVICES, 2003–04
Source: U.S. Department of Education, National Center for Education Statistics 2006b.
PublicPrivate
For-profit
0
10
20
30
40
50
60
70
80
Ins�tu�on Type
Perc
ent
For-Profit Education in the United States: A Primer
16
FIGURE 16
AVERAGE TUITION REVENUE GOING TO INSTRUCTION
PER STUDENT, 2003–04
Source: U.S. Department of Education, National Center for Education Statistics 2006b.
Public
PrivateFor-profit
$0
$500
$1,000
$1,500
$2,000
$2,500
$3,000
Ins�tu�on Type
FIGURE 17
AVERAGE ADMINISTRATIVE AND GENERAL EXPENSES PER STUDENT, 2003–04
Source: U.S. Department of Education, National Center for Education Statistics 2006b.
Public
Nonprofit
For-profit
$0
$2,000
$4,000
$6,000
$8,000
$10,000
$12,000
Ins�tu�on Type
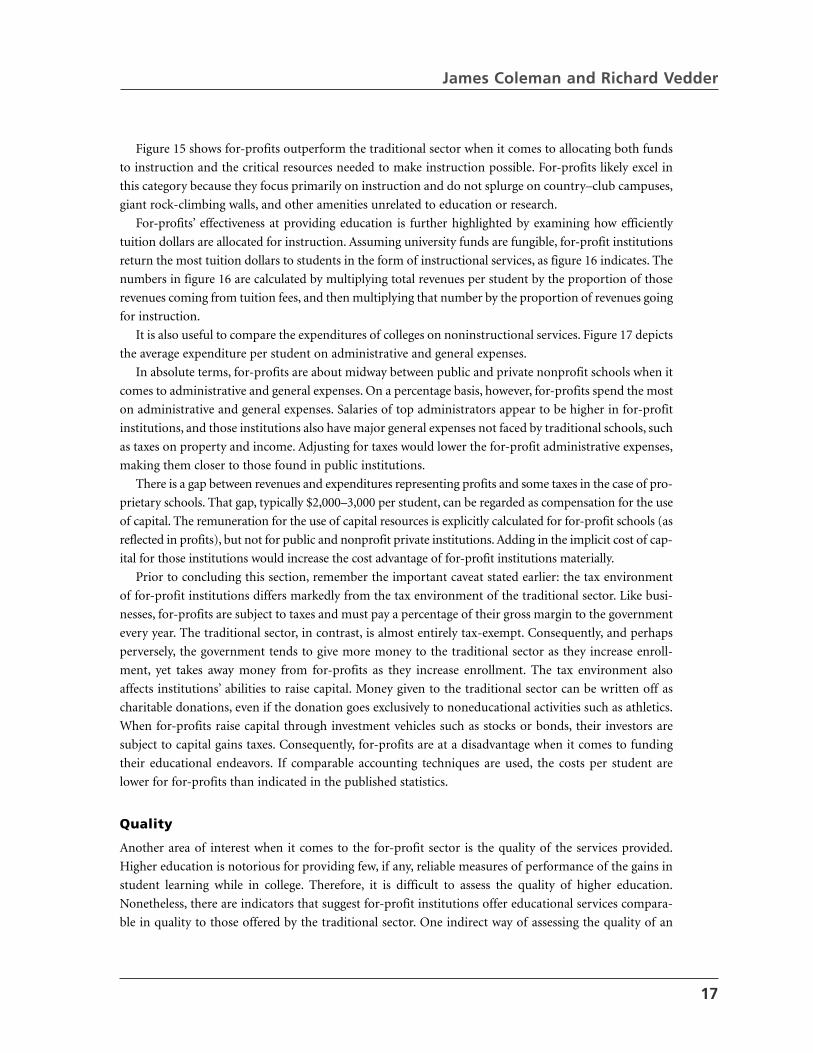
Figure 15 shows for-profits outperform the traditional sector when it comes to allocating both funds
to instruction and the critical resources needed to make instruction possible. For-profits likely excel in
this category because they focus primarily on instruction and do not splurge on country–club campuses,
giant rock-climbing walls, and other amenities unrelated to education or research.
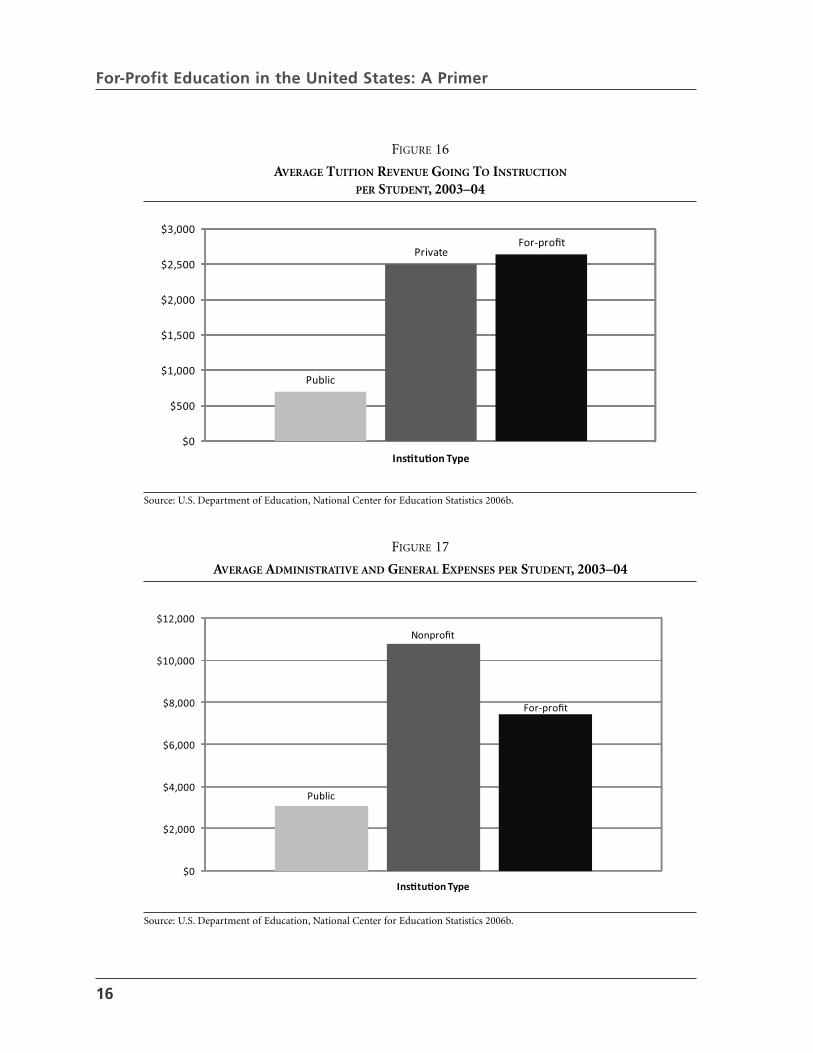
For-profits’ effectiveness at providing education is further highlighted by examining how efficiently
tuition dollars are allocated for instruction. Assuming university funds are fungible, for-profit institutions
return the most tuition dollars to students in the form of instructional services, as figure 16 indicates. The
numbers in figure 16 are calculated by multiplying total revenues per student by the proportion of those
revenues coming from tuition fees, and then multiplying that number by the proportion of revenues going
for instruction.
It is also useful to compare the expenditures of colleges on noninstructional services. Figure 17 depicts
the average expenditure per student on administrative and general expenses.
In absolute terms, for-profits are about midway between public and private nonprofit schools when it
comes to administrative and general expenses. On a percentage basis, however, for-profits spend the most
on administrative and general expenses. Salaries of top administrators appear to be higher in for-profit
institutions, and those institutions also have major general expenses not faced by traditional schools, such
as taxes on property and income. Adjusting for taxes would lower the for-profit administrative expenses,
making them closer to those found in public institutions.
There is a gap between revenues and expenditures representing profits and some taxes in the case of pro-
prietary schools. That gap, typically $2,000–3,000 per student, can be regarded as compensation for the use
of capital. The remuneration for the use of capital resources is explicitly calculated for for-profit schools (as
reflected in profits), but not for public and nonprofit private institutions. Adding in the implicit cost of cap-
ital for those institutions would increase the cost advantage of for-profit institutions materially.
Prior to concluding this section, remember the important caveat stated earlier: the tax environment
of for-profit institutions differs markedly from the tax environment of the traditional sector. Like busi-
nesses, for-profits are subject to taxes and must pay a percentage of their gross margin to the government
every year. The traditional sector, in contrast, is almost entirely tax-exempt. Consequently, and perhaps
perversely, the government tends to give more money to the traditional sector as they increase enroll-
ment, yet takes away money from for-profits as they increase enrollment. The tax environment also
affects institutions’ abilities to raise capital. Money given to the traditional sector can be written off as
charitable donations, even if the donation goes exclusively to noneducational activities such as athletics.
When for-profits raise capital through investment vehicles such as stocks or bonds, their investors are
subject to capital gains taxes. Consequently, for-profits are at a disadvantage when it comes to funding
their educational endeavors. If comparable accounting techniques are used, the costs per student are
lower for for-profits than indicated in the published statistics.
Quality
Another area of interest when it comes to the for-profit sector is the quality of the services provided.
Higher education is notorious for providing few, if any, reliable measures of performance of the gains in
student learning while in college. Therefore, it is difficult to assess the quality of higher education.
Nonetheless, there are indicators that suggest for-profit institutions offer educational services compara-
ble in quality to those offered by the traditional sector. One indirect way of assessing the quality of an
James Coleman and Richard Vedder
17
For-Profit Education in the United States: A Primer
18
FIGURE 18
MEAN ACT SCORES OF APPLICANTS, 2003–04
Source: U.S. Department of Education, Institute of Education Sciences, National Center for Education Statistics 2006b.
19.0
23.9
20.1
25.3
18.5
24.3
0
5
10
15
20
25
30
Composite, 25th Composite, 75th percen�le
Public
Private
For-profit
ACT
Sco
re
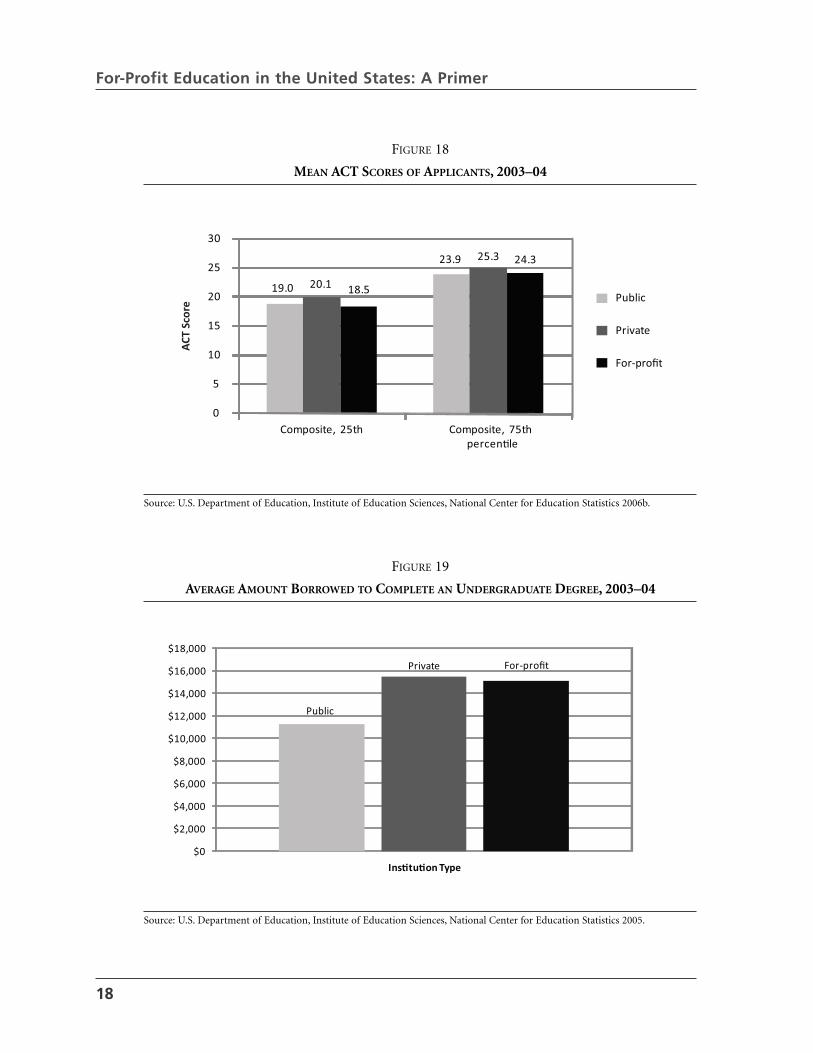
FIGURE 19
AVERAGE AMOUNT BORROWED TO COMPLETE AN UNDERGRADUATE DEGREE, 2003–04
Source: U.S. Department of Education, Institute of Education Sciences, National Center for Education Statistics 2005.
Public
Private For-profit
$0
$2,000
$4,000
$6,000
$8,000
$10,000
$12,000
$14,000
$16,000
$18,000
Ins�tu�on Type
institution is to look at the quality of the students it attracts. Since highly qualified students typically have
more choices available to them and tend to gravitate toward higher-quality schools, it is probably true
that the quality of students attending a school is roughly correlated with the quality of the school itself.
Figure 18 shows that the quality of students attending for-profit institutions is about the same as those
attending traditional public institutions, although it is also somewhat below those attending nonprofit
private institutions.
Another factor is the cost to the student. While tuition has already been discussed, cost can be ana-
lyzed in another way: looking at student borrowing. Student borrowing tells us what amount of future
earnings must be given up, in the form of repaying loans, in order to attend the institution. Other things
being equal, higher levels of debt detract from the value of the education a student receives.
Figure 19 shows that a student attending a for-profit school takes on an average level of debt slightly
less than a student attending a traditional private school, although the for-profit student’s debt is more
than that of a student at a highly subsidized public institution.
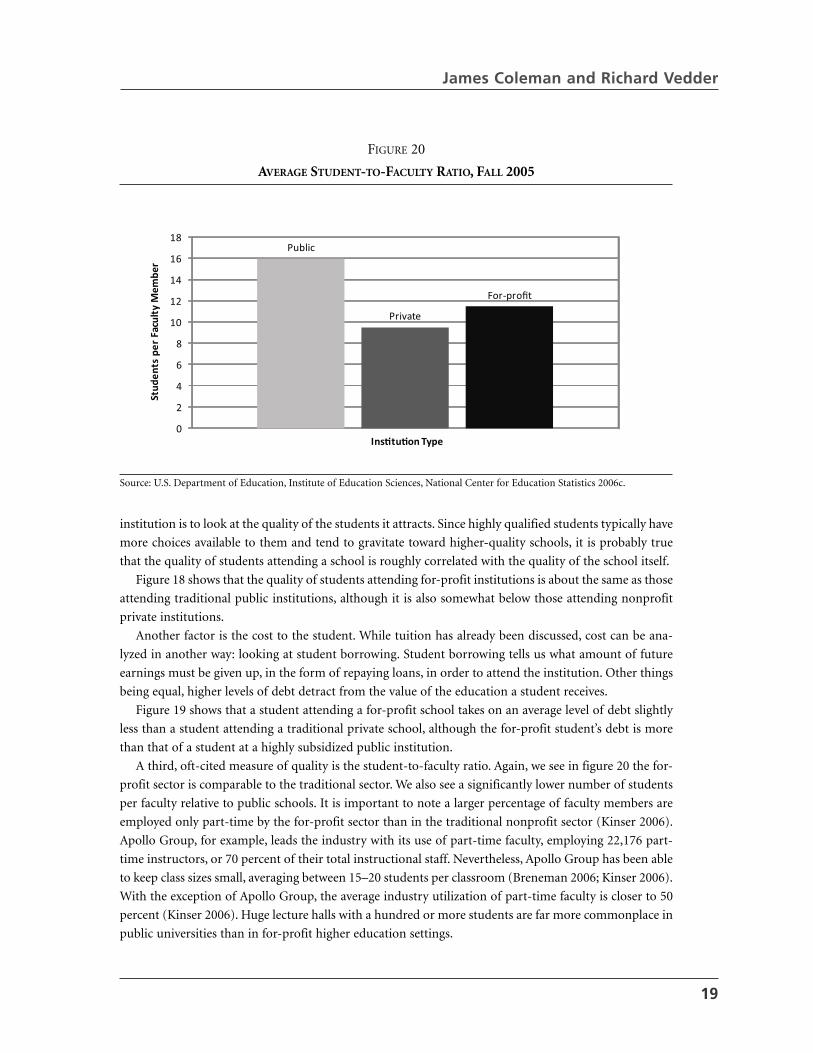
A third, oft-cited measure of quality is the student-to-faculty ratio. Again, we see in figure 20 the for-
profit sector is comparable to the traditional sector. We also see a significantly lower number of students
per faculty relative to public schools. It is important to note a larger percentage of faculty members are
employed only part-time by the for-profit sector than in the traditional nonprofit sector (Kinser 2006).
Apollo Group, for example, leads the industry with its use of part-time faculty, employing 22,176 part-
time instructors, or 70 percent of their total instructional staff. Nevertheless, Apollo Group has been able
to keep class sizes small, averaging between 15–20 students per classroom (Breneman 2006; Kinser 2006).
With the exception of Apollo Group, the average industry utilization of part-time faculty is closer to 50
percent (Kinser 2006). Huge lecture halls with a hundred or more students are far more commonplace in
public universities than in for-profit higher education settings.
James Coleman and Richard Vedder
19
FIGURE 20
AVERAGE STUDENT-TO-FACULTY RATIO, FALL 2005
Source: U.S. Department of Education, Institute of Education Sciences, National Center for Education Statistics 2006c.
Public
Private
For-profit
0
2
4
6
8
10
12
14
16
18
Stud
ents
per
Fac
ulty
Mem
ber
Ins�tu�on Type
For-Profit Education in the United States: A Primer
20
Lastly, it is important to look at the outcomes of students. How does their education pay off after grad-
uation? This question is difficult to answer because there is a general lack of longitudinal data on how
well graduates perform after leaving school. If the goal of the attendees is to be employable in their field
of study, however, then for-profits seem quite successful. For students, the job-placement rate in careers
related to their education ranges between 96 percent (Devry) and 79 percent (Strayer) within six months
of graduation (Ruch 2001). Unfortunately, no comparable data is available from the traditional sector, as
nonprofit schools do not typically report useful statistics on postgraduation success.
An additional assessment of quality is provided by Wall Street analysts who have calculated the aver-
age “return on educational investment.” They concluded that, in 1999, a typical bachelor’s degree from a
nonprofit institution yielded a return of 18.7 percent, while one from a for-profit institution yielded a
return of 28 percent (Cappelli 1999). Rapidly rising enrollments over time would seem to have been
implausible if for-profit schools in general did not satisfy their customers, and a key component of that
satisfaction, no doubt, was the expectation of postgraduate vocational success.
Company Snapshots
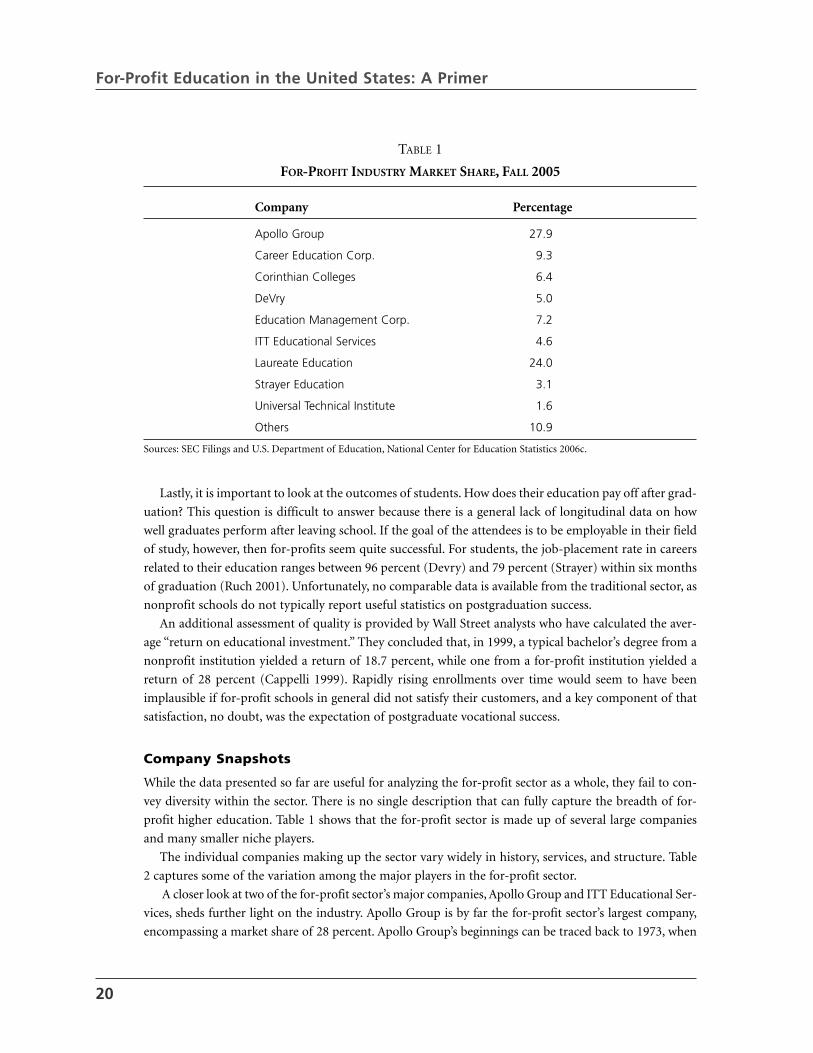
While the data presented so far are useful for analyzing the for-profit sector as a whole, they fail to con-
vey diversity within the sector. There is no single description that can fully capture the breadth of for-
profit higher education. Table 1 shows that the for-profit sector is made up of several large companies
and many smaller niche players.
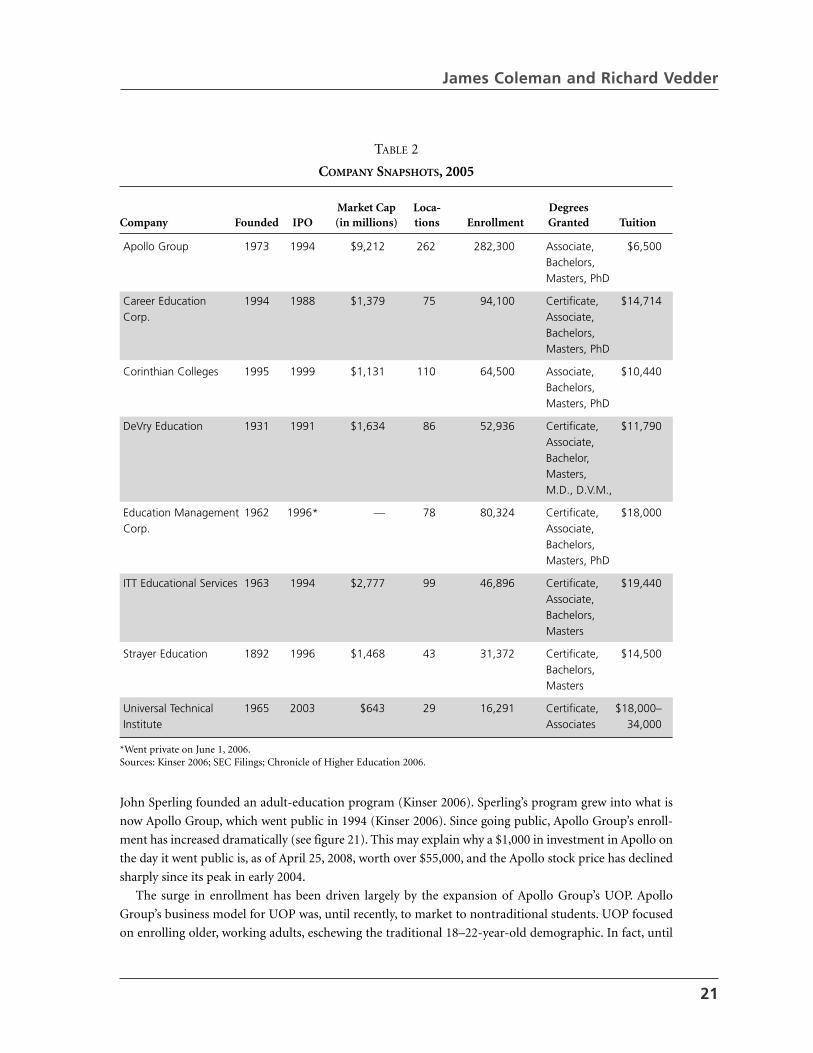
The individual companies making up the sector vary widely in history, services, and structure. Table
2 captures some of the variation among the major players in the for-profit sector.
A closer look at two of the for-profit sector’s major companies, Apollo Group and ITT Educational Ser-
vices, sheds further light on the industry. Apollo Group is by far the for-profit sector’s largest company,
encompassing a market share of 28 percent. Apollo Group’s beginnings can be traced back to 1973, when
TABLE 1
FOR-PROFIT INDUSTRY MARKET SHARE, FALL 2005
Company Percentage
Apollo Group 27.9
Career Education Corp. 9.3
Corinthian Colleges 6.4
DeVry 5.0
Education Management Corp. 7.2
ITT Educational Services 4.6
Laureate Education 24.0
Strayer Education 3.1
Universal Technical Institute 1.6
Others 10.9
Sources: SEC Filings and U.S. Department of Education, National Center for Education Statistics 2006c.
James Coleman and Richard Vedder
21
John Sperling founded an adult-education program (Kinser 2006). Sperling’s program grew into what is
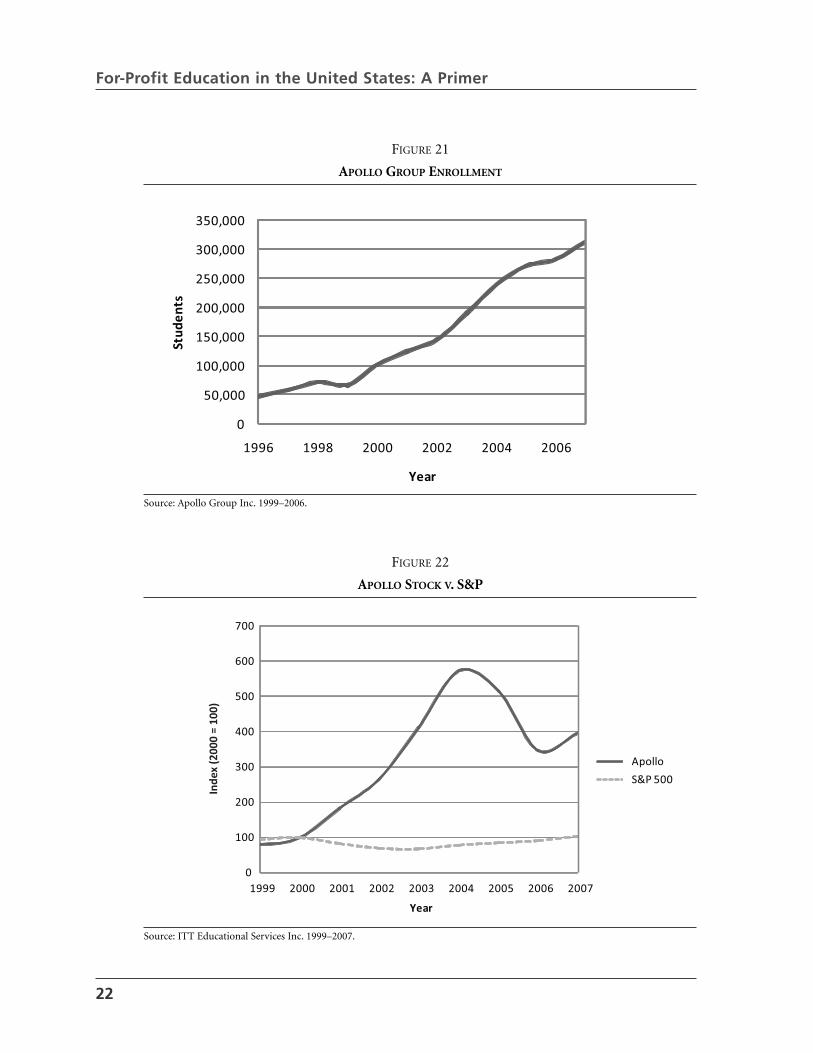
now Apollo Group, which went public in 1994 (Kinser 2006). Since going public, Apollo Group’s enroll-
ment has increased dramatically (see figure 21). This may explain why a $1,000 in investment in Apollo on
the day it went public is, as of April 25, 2008, worth over $55,000, and the Apollo stock price has declined
sharply since its peak in early 2004.
The surge in enrollment has been driven largely by the expansion of Apollo Group’s UOP. Apollo
Group’s business model for UOP was, until recently, to market to nontraditional students. UOP focused
on enrolling older, working adults, eschewing the traditional 18–22-year-old demographic. In fact, until
TABLE 2
COMPANY SNAPSHOTS, 2005
Market Cap Loca- DegreesCompany Founded IPO (in millions) tions Enrollment Granted Tuition
Apollo Group 1973 1994 $9,212 262 282,300 Associate, $6,500 Bachelors, Masters, PhD
Career Education 1994 1988 $1,379 75 94,100 Certificate, $14,714Corp. Associate,
Bachelors, Masters, PhD
Corinthian Colleges 1995 1999 $1,131 110 64,500 Associate, $10,440Bachelors, Masters, PhD
DeVry Education 1931 1991 $1,634 86 52,936 Certificate, $11,790 Associate, Bachelor, Masters, M.D., D.V.M.,
Education Management 1962 1996* — 78 80,324 Certificate, $18,000 Corp. Associate,
Bachelors, Masters, PhD
ITT Educational Services 1963 1994 $2,777 99 46,896 Certificate, $19,440Associate, Bachelors, Masters
Strayer Education 1892 1996 $1,468 43 31,372 Certificate, $14,500 Bachelors, Masters
Universal Technical 1965 2003 $643 29 16,291 Certificate, $18,000–Institute Associates 34,000
*Went private on June 1, 2006.Sources: Kinser 2006; SEC Filings; Chronicle of Higher Education 2006.
For-Profit Education in the United States: A Primer
22
FIGURE 21
APOLLO GROUP ENROLLMENT
Source: Apollo Group Inc. 1999–2006.
0
50,000
100,000
150,000
200,000
250,000
300,000
350,000
1996 1998 2000 2002 2004 2006
Stud
ents
Year
FIGURE 22
APOLLO STOCK V. S&P
Source: ITT Educational Services Inc. 1999–2007.
0
100
200
300
400
500
600
700
1999 2000 2001 2002 2003 2004 2005 2006 2007
Year
Apollo
S&P 500
Inde
x (2
000
= 10
0)
recently, UOP would not accept applicants under the age of twenty-three (Breneman 2006). Additionally,
UOP goes to great lengths to accommodate working adults, offering night classes and an online enroll-
ment option. Another key to Apollo Group’s success is that they run a very cost-conscious operation. On
a per student basis, Apollo has consistently kept general and administrative expenses consistently low.
This has allowed it to provide quality instruction while maintaining a profitable margin.
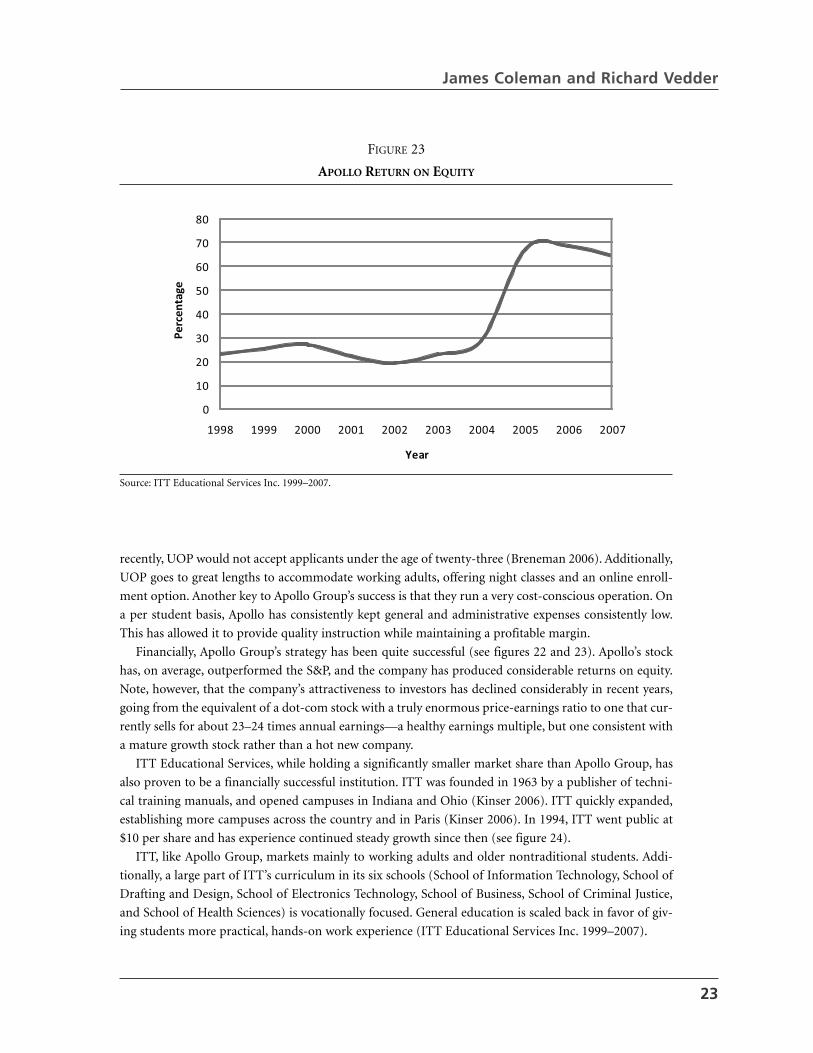
Financially, Apollo Group’s strategy has been quite successful (see figures 22 and 23). Apollo’s stock
has, on average, outperformed the S&P, and the company has produced considerable returns on equity.
Note, however, that the company’s attractiveness to investors has declined considerably in recent years,
going from the equivalent of a dot-com stock with a truly enormous price-earnings ratio to one that cur-
rently sells for about 23–24 times annual earnings—a healthy earnings multiple, but one consistent with
a mature growth stock rather than a hot new company.
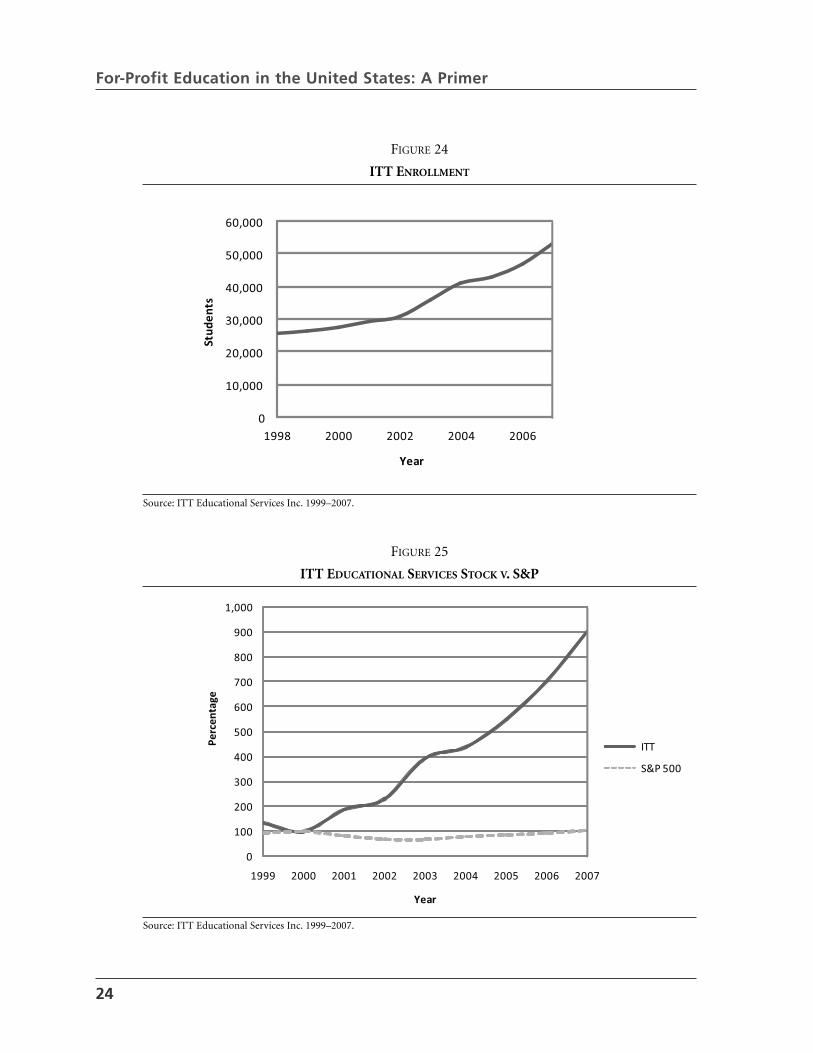
ITT Educational Services, while holding a significantly smaller market share than Apollo Group, has
also proven to be a financially successful institution. ITT was founded in 1963 by a publisher of techni-
cal training manuals, and opened campuses in Indiana and Ohio (Kinser 2006). ITT quickly expanded,
establishing more campuses across the country and in Paris (Kinser 2006). In 1994, ITT went public at
$10 per share and has experience continued steady growth since then (see figure 24).
ITT, like Apollo Group, markets mainly to working adults and older nontraditional students. Addi-
tionally, a large part of ITT’s curriculum in its six schools (School of Information Technology, School of
Drafting and Design, School of Electronics Technology, School of Business, School of Criminal Justice,
and School of Health Sciences) is vocationally focused. General education is scaled back in favor of giv-
ing students more practical, hands-on work experience (ITT Educational Services Inc. 1999–2007).
James Coleman and Richard Vedder
23
FIGURE 23
APOLLO RETURN ON EQUITY
Source: ITT Educational Services Inc. 1999–2007.
0
10
20
30
40
50
60
70
80
1998 1999 2000 2001 2002 2003 2004 2005 2006 2007
Perc
enta
ge
Year
For-Profit Education in the United States: A Primer
24
FIGURE 24
ITT ENROLLMENT
Source: ITT Educational Services Inc. 1999–2007.
0
10,000
20,000
30,000
40,000
50,000
60,000
1998 2000 2002 2004 2006
Stud
ents
Year
FIGURE 25
ITT EDUCATIONAL SERVICES STOCK V. S&P
Source: ITT Educational Services Inc. 1999–2007.
0
100
200
300
400
500
600
700
800
900
1,000
1999 2000 2001 2002 2003 2004 2005 2006 2007
Perc
enta
ge
Year
ITT
S&P 500
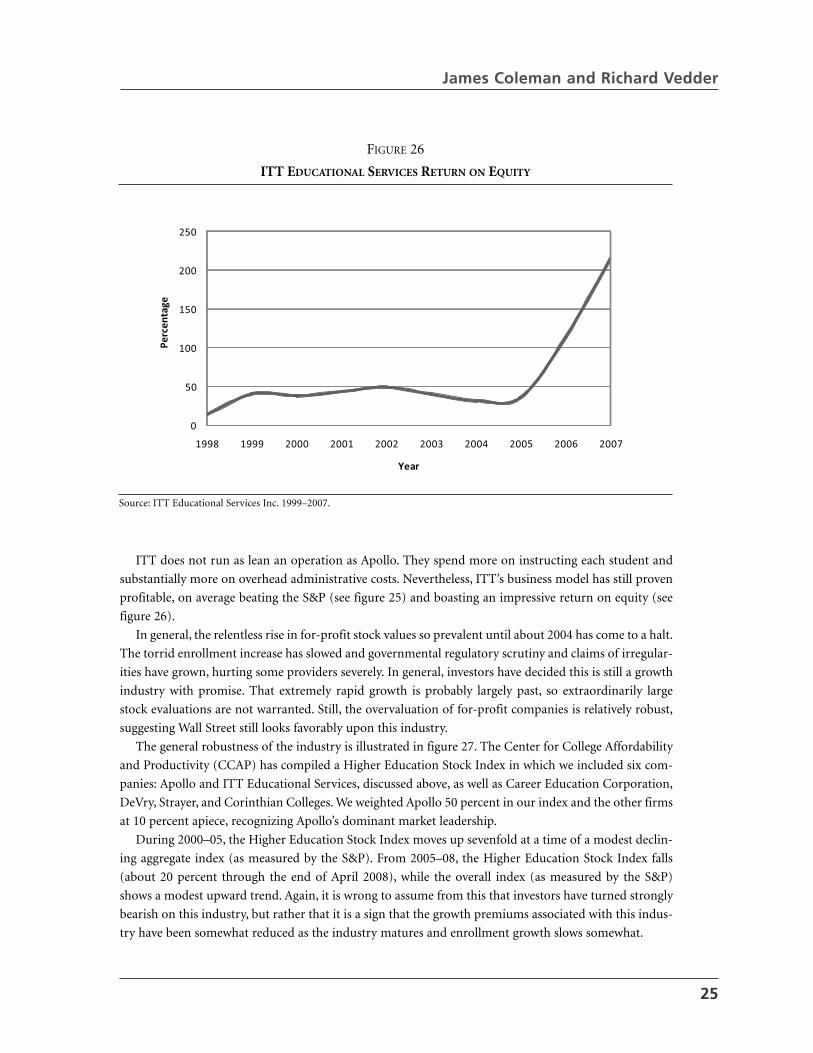
ITT does not run as lean an operation as Apollo. They spend more on instructing each student and
substantially more on overhead administrative costs. Nevertheless, ITT’s business model has still proven
profitable, on average beating the S&P (see figure 25) and boasting an impressive return on equity (see
figure 26).
In general, the relentless rise in for-profit stock values so prevalent until about 2004 has come to a halt.
The torrid enrollment increase has slowed and governmental regulatory scrutiny and claims of irregular-
ities have grown, hurting some providers severely. In general, investors have decided this is still a growth
industry with promise. That extremely rapid growth is probably largely past, so extraordinarily large
stock evaluations are not warranted. Still, the overvaluation of for-profit companies is relatively robust,
suggesting Wall Street still looks favorably upon this industry.
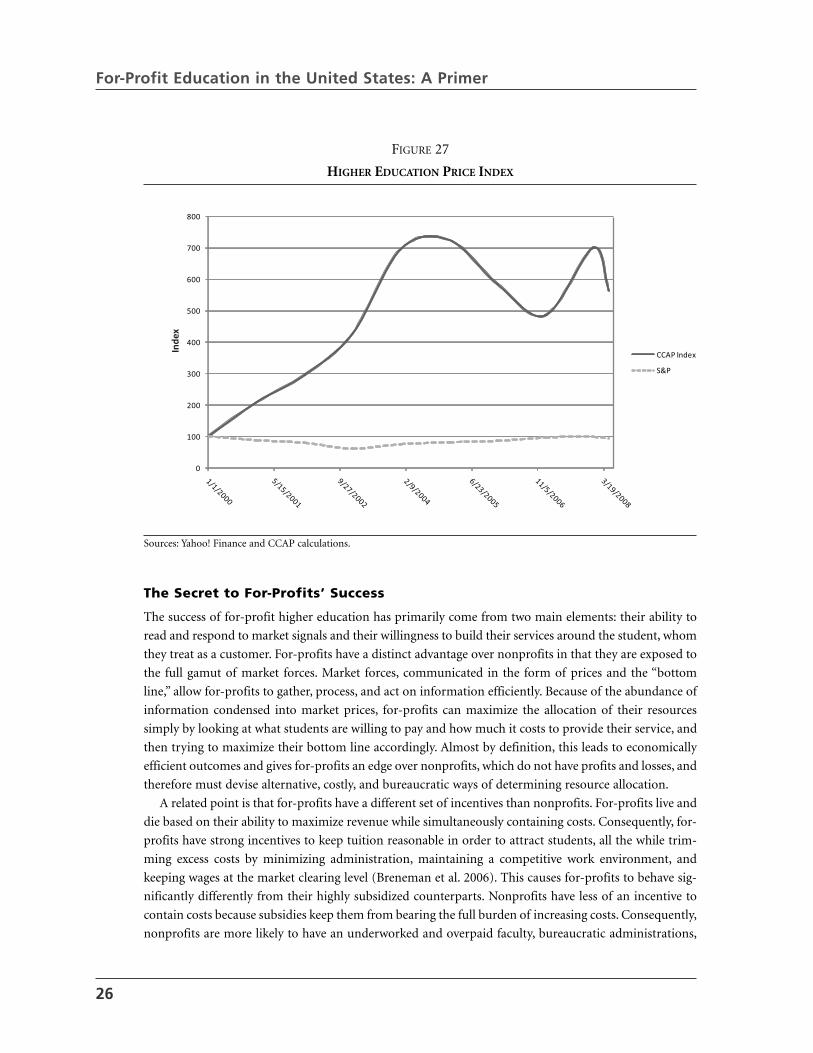
The general robustness of the industry is illustrated in figure 27. The Center for College Affordability
and Productivity (CCAP) has compiled a Higher Education Stock Index in which we included six com-
panies: Apollo and ITT Educational Services, discussed above, as well as Career Education Corporation,
DeVry, Strayer, and Corinthian Colleges. We weighted Apollo 50 percent in our index and the other firms
at 10 percent apiece, recognizing Apollo’s dominant market leadership.
During 2000–05, the Higher Education Stock Index moves up sevenfold at a time of a modest declin-
ing aggregate index (as measured by the S&P). From 2005–08, the Higher Education Stock Index falls
(about 20 percent through the end of April 2008), while the overall index (as measured by the S&P)
shows a modest upward trend. Again, it is wrong to assume from this that investors have turned strongly
bearish on this industry, but rather that it is a sign that the growth premiums associated with this indus-
try have been somewhat reduced as the industry matures and enrollment growth slows somewhat.
James Coleman and Richard Vedder
25
FIGURE 26
ITT EDUCATIONAL SERVICES RETURN ON EQUITY
Source: ITT Educational Services Inc. 1999–2007.
0
50
100
150
200
250
1998 1999 2000 2001 2002 2003 2004 2005 2006 2007
Perc
enta
ge
Year
The Secret to For-Profits’ Success
The success of for-profit higher education has primarily come from two main elements: their ability to
read and respond to market signals and their willingness to build their services around the student, whom
they treat as a customer. For-profits have a distinct advantage over nonprofits in that they are exposed to
the full gamut of market forces. Market forces, communicated in the form of prices and the “bottom
line,” allow for-profits to gather, process, and act on information efficiently. Because of the abundance of
information condensed into market prices, for-profits can maximize the allocation of their resources
simply by looking at what students are willing to pay and how much it costs to provide their service, and
then trying to maximize their bottom line accordingly. Almost by definition, this leads to economically
efficient outcomes and gives for-profits an edge over nonprofits, which do not have profits and losses, and
therefore must devise alternative, costly, and bureaucratic ways of determining resource allocation.
A related point is that for-profits have a different set of incentives than nonprofits. For-profits live and
die based on their ability to maximize revenue while simultaneously containing costs. Consequently, for-
profits have strong incentives to keep tuition reasonable in order to attract students, all the while trim-
ming excess costs by minimizing administration, maintaining a competitive work environment, and
keeping wages at the market clearing level (Breneman et al. 2006). This causes for-profits to behave sig-
nificantly differently from their highly subsidized counterparts. Nonprofits have less of an incentive to
contain costs because subsidies keep them from bearing the full burden of increasing costs. Consequently,
nonprofits are more likely to have an underworked and overpaid faculty, bureaucratic administrations,
For-Profit Education in the United States: A Primer
26
FIGURE 27
HIGHER EDUCATION PRICE INDEX
Sources: Yahoo! Finance and CCAP calculations.
0
100
200
300
400
500
600
700
800
CCAP Index
S&P
Inde
x
and rent-seeking employee groups that resist changes in the status quo. The shared governance model of
many nonprofits leads to blurred lines of authority, making decision-making burdensome, costly, slow,
and noninnovative. The proprietary schools do not face this huge liability.
Related to that, for-profits are structured like corporations, while nonprofits are structured more like
unwieldy government bureaucracies. In nonprofits, most employees are concerned primarily with aca-
demic affairs, and relatively few employees deal with business or economic aspects (Ruch 2001). This
lends itself to an environment in which most employees are insulated from market forces and are conse-
quently unable to pursue the most efficient use of resources.
In contrast, for-profits have significantly more of a business culture (Ruch 2001). A greater number of
employees are aware of the forces of supply and demand and are able to make decisions that maximize
utility for the university and its students. A bonus of the for-profit business culture is that it allows
for-profits a great degree of agility. For-profit employees are able to see via market signals when there is
a shift in student demand and respond quickly. For example, a for-profit dean can look at the financial
statements of his college and make an executive decision to shift resources from one department to
another, bypassing the cumbersome bureaucracy one would typically encounter at a nonprofit institu-
tion (Ruch 2001).
The second major key to for-profits’ success is how they provide services to the student. Nonprofits
only get a fraction of their funding from students and consequently can afford to be dismissive of some
student needs, since students who leave school out of anger do not impose a high cost on the university.
For-profits, however, derive nearly all their revenue from students and thus are more inclined to see the
students as valuable paying customers. As a result, for-profits tend to be more responsive to the needs and
demands of their students (Breneman et al. 2006; Ruch 2001).
Additionally, for-profits focus on providing courses in high demand by students. The result is that the
bulk of for-profits’ instructional resources go to classes students need to take to be employable. For-profits
do not offer or employ faculty in obscure courses that are not in demand and not professionally relevant
(Ruch 2001). This cuts costs for the university and allows the savings to be passed onto students.
Moreover, for-profits have no pretenses of performing research or of offering noninstructional com-
munity outreach through amenities like football teams, concerts, fancy student recreational facilities, or
large libraries. Finally, they keep capital costs down, in part, by using facilities more intensely than other
schools, including during evenings, weekends, and summer periods.
Industry Challenges
Over the past decade, for-profit higher education has proved to be a successful, viable alternative to tra-
ditional higher education. If for-profits are to continue growing, however, they need to overcome several
major challenges facing the industry. One challenge the industry has so far been able to meet and must
continue to meet is its unique regulatory environment. Education, in general, is already a highly regu-
lated sector, and the regulatory environment is further complicated for for-profits because such compa-
nies are also subject to SEC and FTC regulations. Additionally, for-profits are further burdened by
regulation, as they are singled out by the Higher Education Act and must meet requirements not
demanded of nonprofit institutions (Kinser 2006).
Another challenge for-profits must overcome is in the area of accreditation. As for-profits have begun
to expand into the traditional degree-granting market, they have met resistance from accrediting agencies.
James Coleman and Richard Vedder
27
Many regional and specialty accreditators have resisted the growth of for-profits by taking steps to discour-
age their pursuit of accreditation (Kinser 2006). The ability to gain accreditation is extremely important
for the future of for-profits, as it not only lends to their credibility, but also dictates their ability to partic-
ipate in federal student aid programs. So far, for-profits have met this challenge with some success by turn-
ing to national accrediting bodies, typically viewed as being second-class alternatives by the education
sector (Kinser 2006). For-profits have also recently been gaining accreditation by essentially buying it.
There is an industry trend of for-profits buying up accredited nonprofits in order to gain accreditation.
This shows the distortive effects accreditation can have on barriers to entry. To the extent that accredita-
tion works to ensure quality education, it should not be a purchasable commodity. At the same time, gen-
uine educational institutions should not have to face so many obstacles in their quest for accreditation.
A third challenge for for-profits is competition with the traditional sector. If for-profits are to grow
beyond a limited market and become truly competitive alternatives to nonprofit higher education, they
will have to find a way to capture market share from the heavily subsidized nonprofits. Public subsidies
to nonprofits currently serve as massive barriers to entry for for-profits (Winston, Carbone, and Lewis
1999). Moreover, it is unlikely for-profits have the political clout either to lobby for comparable subsides
of their own or to roll back nonprofit subsidies sufficiently to level the playing field. As state budgets
come under more pressure from soaring medical costs and other factors, however, state subsidies are
becoming relatively less important to public universities, posing an opportunity for for-profit institutions
to gain market share in the traditional 18–24-year-old student part of the market. At the rate college
prices are rising, if nonprofits do not contain costs and high rates of tuition growth, their competitive
price advantages will decline.
The Future of For-Profit Education
If history is any guide, for-profit higher education is here to stay. For-profits have found a secure market
niche in which they are able to flourish and outcompete nonprofits. The question is: has for-profit edu-
cation saturated the market or is there still room for growth? The answer is the future of for-profits most
likely is in the hands of the nonprofits. If nonprofits reduce the cost of attendance, it is difficult to see
how for-profits can compete on a large scale with such a heavily subsidized industry. If nonprofit tuition
fees continue to outpace inflation, however, for-profits will gain a competitive advantage and continue to
eat away at nonprofits’ market share.
With the forthcoming decline in the size of the 18–24-year-old pool of potential students because of low
birth rates in the 1990s, many traditional institutions, governors, and state governing boards are talking
about expanding programs in the adult-education market that is the strength of for-profit institutions. This
may put pressure on those firms, which will be under pressure to enter more aggressively the traditional age
market. In short, head-to-head competition between the two types of institutions may accelerate.
As the adult-education market becomes more saturated and competitive, there is also a strong likeli-
hood for-profits will strengthen their presence overseas. Already, these institutions are actively opening
and acquiring campuses abroad. Laureate Education, for example, already has a majority of its locations
overseas, where the market and regulatory conditions are more favorable. Privately controlled institu-
tions run by Dallas entrepreneur Randy Best are expanding aggressively in Latin America.
How should public policy toward for-profits evolve? Given for-profits’ cost advantages and their pop-
ularity with their customers, the nation will lower average costs of educating postsecondary students if
the market share of for-profits continues to rise. Greater competition from these schools may force
For-Profit Education in the United States: A Primer
28

nonprofits to do something they have resisted: make fundamental changes in the way they deliver educa-
tional services. Government-sanctioned regulatory efforts that stifle for-profit competition should be
removed. Accreditation needs to be greatly simplified and made purely outcomes-based, for example.
For-profit schools are part of the solution—not the problem—facing American education in the future.
James Coleman and Richard Vedder
29
References
Apollo Group Inc. 1999–2006.
Breneman, D. W. 2006. The University of Phoenix: Icon of for-profit higher education. In Earnings fromlearning, ed. D.W. Breneman, B. Pusser, and S. E. Turner, 71. Albany, NY: State University of New York.
Breneman, D. W., Pusser, B., and Turner, S. E. 2006. The contemporary provision of for-profit higher edu-cation: Mapping the competitive market. In Earnings from learning, ed. D.W. Breneman, B. Pusser, andS. E. Turner, 3. Albany, NY: State University of New York.
Cappelli, G. W. 1999. Post-secondary education stocks. Wall Street transcript, 2.
The chronicle index of for-profit higher education. 2006. The Chronicle of Higher Education 52:A30.
Coulson, A. J. 1999. Market education. New Brunswick, NJ: Transaction.
ITT Educational Services Inc. 1999–2007.
Kinser, K. 2006. From main street to wall street: The transformation of for-profit higher education. San Fran-cisco: Jossey-Bass.
Knapp, L. G., Kelly-Reid, J. E., Grinder, S. A., and Miller, E. 2007. In Postsecondary institutions in the unitedstates: Fall 2006 and degrees and other awards conferred: 2005–06 No. 166). Washington, DC: U.S.Department of Education.
Reigner, C. G. 1959. Beginning of the business school. Baltimore: H.M. Rowe Co.
Ruch, R. S. 2001. Higher ed, inc.: The rise of the for-profit university. Baltimore: Johns Hopkins University Press.
Turner, S. E. 2006. For-profit colleges in the context of the market for higher education. In Earnings fromlearning, ed. D. W. Breneman, B. Pusser, and S. E. Turner, 51. Albany, NY: State University of New York.
U.S. Department of Education, National Center for Education Statistics. 2006a. U.S. department of edu-cation, national center for education statistics, 2005 integrated postsecondary education data system(IPEDS), spring 2006.
U.S. Department of Education, National Center for Education Statistics. 2006b. U.S. department of educa-tion, national center for education statistics, 1996–97 through 2003–04 integrated postsecondary educationdata system, “fall enrollment survey” (IPEDS-EF:96–99) and “finance survey” (IPEDSF:FY97–99), spring2001 through spring 2005.
U.S. Department of Education, National Center for Education Statistics. 2006c. U.S. department of edu-cation, national center for education statistics, biennial survey of education in the United States; openingfall enrollment in higher education, 1963 through 1965; higher education general information survey(HEGIS), “fall enrollment in colleges and universities” surveys, 1966 through 1985; and 1986 through2005 integrated postsecondary education data system, “fall enrollment survey” (IPEDS-EF:86–99), andspring 2001 through spring 2006.
U.S. Department of Education, Institute of Education Sciences, National Center for Education Statistics.
2005. U.S. department of education, national center for education statistics, 2003–04 national postsecondarystudent aid study (NPSAS:04).
U.S. Department of Education, Institute of Education Sciences, National Center for Education Statistics.
2006a. U.S. department of education, national center for education statistics, 2003–04 integrated post-secondary education data system, spring 2004–spring 2005.
U.S. Department of Education, Institute of Education Sciences, National Center for Education Statistics.
2006b. U.S. department of education, national center for education statistics, 2004-05 integrated post-secondary education data system, fall 2004.
For-Profit Education in the United States: A Primer
30
U.S. Department of Education, Institute of Education Sciences, National Center for Education Statistics.2006c. U.S. department of education, national center for education statistics, higher education general infor-mation survey (HEGIS), employees in institutions of higher education, 1970 and 1972, and “staff survey”1976; projections of education statistics to 2000; 1987 through 2005 integrated postsecondary education datasystem (IPEDS), “fall staff survey” (IPEDS-S:87–99), and winter 2001–02 through winter 2005–06; andU.S. equal employment opportunity commission, higher education staff information survey (EEO-6), 1977,1981, and 1983.
Winston, G., Carbone, J. C., and Lewis, E. G. 1999. For-profit education: Godzilla or chicken little? ChangeJanuary–February.
James Coleman and Richard Vedder
31


![The Participation Motive in the Paralympics1].pdf · The Participation Motive in the Paralympics ... Universiti Putra Malaysia Manisah Mohd-Ali, Education Faculty, ... Sport comes](https://img.pdfslide.us/doc/110x75/5b06370e7f8b9abf568cb3eb/the-participation-motive-in-the-1pdfthe-participation-motive-in-the-paralympics.jpg)