Embed Size (px)
Citation preview
Jersey Retail Study 2008
For
Planning and Environment Department
States of Jersey
DTZ
48 Warwick Street
London W1B 5NL
020-7534-5000
July 2008
Report
1 Introduction 2
2 Responses to Consultations 4
3 Quantitative Need for New Retail Development 31
4 Qualitative Retail and Town Centre Needs 51
5 Accommodating Identified Retail Needs 58
6 Conclusions for the Retail Planning Strategy 65
Appendices
Appendix 1 – Businesses Survey questionnaire and results
Appendix 2 – Key stakeholders interviewed
Appendix 3 – On-street Interview Survey Results
Appendix 4 – Catchment Zones map and Household Interview Survey results
Appendix 5 – Description of the RECAP Model
Appendix 6 – Jersey RECAP Model 2008
Jersey Retail Study 2008
1
1 Introduction
1.1 DTZ was instructed in December 2007 by the Department of Planning and Environment
of the States of Jersey to prepare an up-to-date Retail Study of the Island. The Study
was commissioned to provide part of the evidence supporting the Review of the Island
Plan. It is therefore primarily a land use planning study, aimed at answering the following
questions:
• How much new retail development of each principal type will be supportable on the
Island by growth in population and retail expenditure in future years.
• Where on the Island should it be located and in what commercially realistic formats.
1.2 The Study includes quantitative forecasts of the capacity for new retail floorspace,
qualitative assessments of the need for new retail development, and commercial
assessments of potential sites which could accommodate identified needs. The Study is
based on new surveys, including a Household Interview Survey of existing shopping
patterns on the Island, an On-street Interview Survey of shoppers and other town centre
users in St Helier Town Centre, and a survey of the experiences and attitudes of all the
retailers and service businesses occupying retail shops on the Island. It also included
consultations with retailers and service businesses, and other key stakeholders.
1.3 The Study is not a study of retail competition on Jersey, and does not consider retail
prices or the number of food store operators on the Island; since those are not material
land use planning matters. It does not use a theoretical gravity model for retail capacity
forecasting; but uses an empirical model based on actual shopping habits of the Island’s
residents, and local population and expenditure data, thus making it Jersey-specific. It
does not apply ‘standard’ UK solutions, but takes account of the commercial realities of
achieving new retail development in Jersey, including retailers’ requirements for opening
new shops and stores there, and the availability of potentially suitable sites for new retail
development. The quantitative forecasts are in constant 2005 prices, thus excluding the
effects of price inflation. The forecasts for growth of expenditure are therefore in real
terms.
1.4 In Section 2 of the report, we set out the results of our Survey of Retail and Service
Businesses, our consultations with key stakeholders, our On-street Interview Survey in St
Helier Town Centre, and our survey and assessment of the demand from retailers to
open new stores on Jersey.
Jersey Retail Study 2008
2
1.5 Section 3 of the report identifies the future quantitative need for new retail floorspace in St
Helier Town Centre, and non-central locations on Jersey. It provides an evidence based,
quantitative need assessment for new floorspace. We have forecast the amount of new
retail floorspace likely to be needed up to 2025. A full explanation of our method and our
retail capacity forecasts are included in Section 3. Section 4 describes our assessment
of qualitative needs for new retail development, and for improvement of St Helier Town
Centre. Section 5 sets out the results of our commercial review of the suitability of
potential retail development sites to accommodate the needs for new retail development
which we have identified. The last section, Section 6, concentrates on the strategic
issues for land use planning which arise from our research, and summarises our main
conclusions.
1.6 Being based on more up-to-date information, the retail capacity forecasts set out in this
report are intended to supersede and replace all previous retail capacity forecasts for
Jersey.
Jersey Retail Study 2008
3
2 Responses to Consultations
2.1 In accordance with our instructions, we undertook a range of surveys and consultations to
inform and influence the Study, as follows:
• A postal survey of all retailers and service businesses occupying retail shops on
Jersey, to explore their trading experience, and their views on how trading conditions
for their business might be improved.
• In-depth interviews with a small number of ‘key stakeholders’ representing retailers,
and with the Jersey Competition Regulatory Authority (JCRA).
• An On-street Interview Survey of shoppers and other users of St Helier Town Centre,
conducted in the principal shopping streets, to ascertain how they are using the town
centre, how they rate various aspects of it, and their likes and dislikes about it.
• Retailer demand assessment, including a postal survey of all the principal UK
supermarket operators.
2.2 The purpose of these surveys and consultations was to improve our understanding of
retailing on the Island, and assist us to identify qualitative needs and opportunities for
improvement. It was also to provide retailers, the JCRA and the general public with a
means of influencing our analysis and conclusions; and to inform us about the interest of
retailers in opening new shops and stores in Jersey. In this section therefore, we
describe the principal results of these surveys and consultations.
POSTAL SURVEY OF RETAILERS AND SERVICE BUSINESSES
2.3 A postal survey was conducted of Jersey retail businesses in April 2008. The aim of the
survey was to establish the perceived strengths and weaknesses of Jersey as a business
location. The survey was also used to assess the perceived quality of each business’s
location, and to establish what improvements, if any, were thought to be needed. A copy
of the questionnaire is included in Appendix 1.
2.4 The survey questionnaire was sent to 500 retailers and service businesses occupying
retail shops, together with a letter from the States of Jersey explaining the purpose of the
survey. 94 responses were received, representing a 19% response rate, which is not
unusual for this type of survey.
Jersey Retail Study 2008
4
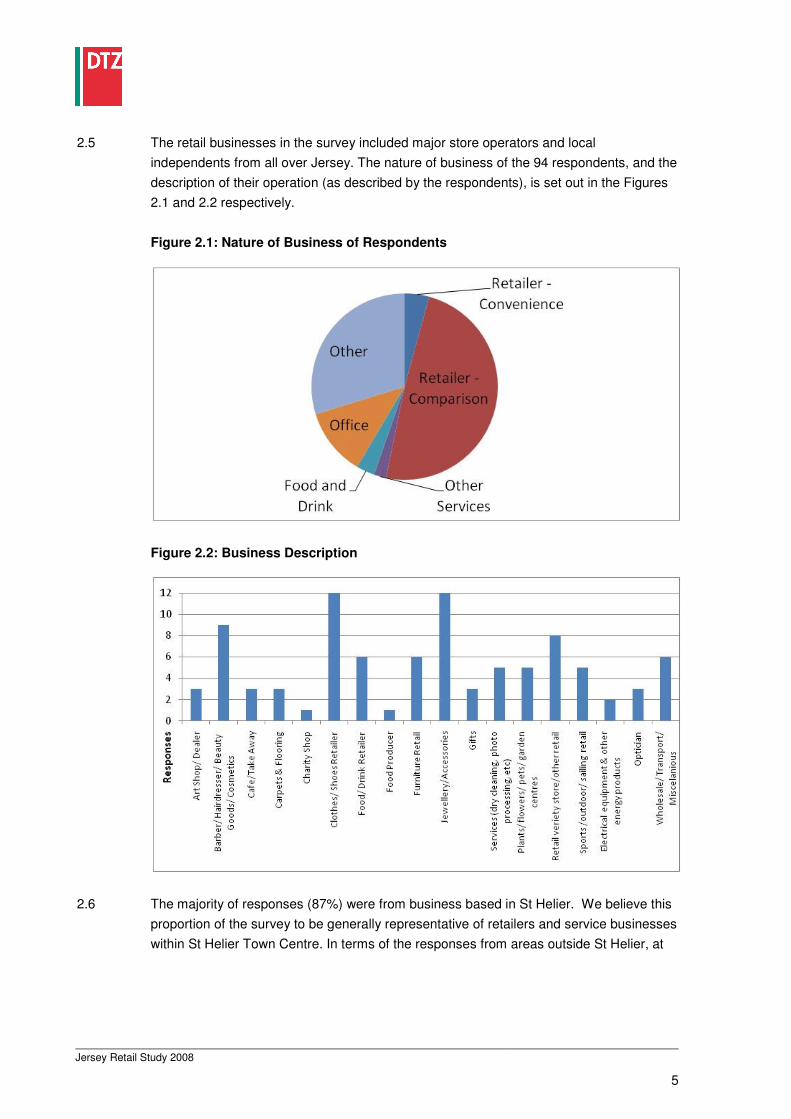
2.5 The retail businesses in the survey included major store operators and local
independents from all over Jersey. The nature of business of the 94 respondents, and the
description of their operation (as described by the respondents), is set out in the Figures
2.1 and 2.2 respectively.
Figure 2.1: Nature of Business of Respondents
Figure 2.2: Business Description
The majority of responses (87%) were from business based in St Helier. We believe this
proportion of the survey to be generally representative of retailers and service businesses
within St Helier Town Centre. In terms of the responses from areas outside St Helier, at
Jersey Retail Study 2008
5
2.6
13% the small sample size may not be generally representative of business elsewhere in
Jersey. As such, cautionh mus t b e take n when observin g the result s o f th e ‘elsewher e i
Jersey’ analysis contained within these results.
In this section we discuss the results of the survey. The analysis focuses on St Helier
Town Centre with reference also paid to the respondents from elsewhere in Jersey. The
results have been broadly grouped into three categories:
• Points relating to the strength of St Helier and elsewhere in Jersey as a business
location;
• Points relating to the weaknesses of St Helier and elsewhere in Jersey as a
business location; and
• Suggested actions and improvements that could be undertaken in St Helier and
elsewhere in Jersey to improve trading conditions for businesses.
n
2.7
Perceived Strengths of St Helier and Elsewhere in Jersey
2.8 The majority of respondents indicated that being in St Helier Town Centre was a major
strength of their business location. The main precinct of King Street is seen as being the
prime centre of retailing in Jersey, whilst spill-over footfall supports many of the
surrounding streets and districts in the town centre. Many businesses highlighted the
importance of tourism to the town centre and the attractive and historic character that
draws these visitors. The footfall deriving from tourism enforced businesses’ desire to be
in or near the main precinct.
2.9 Protection of the historic town centre and stimulation of the tourist trade were cited as
being paramount to the survival of many of the responding businesses. Two respondents
in particular suggested that St Helier was in danger of losing its unique character and
becoming a UK ‘clone town’, with ‘too many UK multiples opening’ in the town.
2.10 In addition to tourism, many retailers in St Helier thought that their proximity to the office-
based workforce (particularly Jersey’s financial sector) was very important. In fact, being
located centrally was regarded with such importance that some businesses located
outside of the centre thought that this was their main weakness.
2.11 Elsewhere in Jersey, respondents thought that ample parking, accessibility, their rural
setting, or a central location on the Island were the main benefits of their location.
Jersey Retail Study 2008
6
Perceived Weaknesses of St Helier Town Centre (and elsewhere in Jersey)
2.12 It is clear from the responses of businesses in St Helier Town Centre that the
overwhelming perceived weakness is car parking. The majority of respondents
commented that the inadequate number of spaces, availability, lack of short term parking
for shoppers and visitors, and restricted on-street parking are particular weaknesses.
Those respondents based elsewhere in Jersey all highlighted ample parking as a
particular strength of their locations. St Helier’s retailers expressed strong feelings on
this issue; which is their highest priority for improvement in the town centre to benefit their
businesses.
2.13 Traffic congestion and access is also regarded as a serious weakness by businesses,
and was commented upon by eighteen respondents. High traffic flows, congestion,
difficult access and poor traffic light systems were noted as causing particular problems
for customers, delivery drivers, and workers. Narrow access roads were an issue for
some rural businesses.
2.14 Although respondents were largely in favour of pedestrianisation, many had problems
with deliveries during pedestrian only periods (especially if supply boats did not arrive on
time). Others had issues with cars parking in the ‘delivery only’ bays, re-enforcing the
perception that there is an overall lack of parking spaces in the town centre.
2.15 Another common issue was regarding the overall fall in tourism resulting in lower footfall.
Tourism in Jersey has experienced an overall fall in recent years (in terms of numbers
and average length of stay)1, and according to respondents, this has impacted
businesses within St Helier’s secondary retail areas.
2.16 The Waterfront development has also evoked fear amongst many St Helier Town Centre
retailers. Those impacted by a reduction in tourist footfall, particularly those located
towards the north and north-east of the centre, fear that a movement of retail activity
towards the Waterfront will signal the end of their business.
2.17 Common perceptions of the Waterfront development amongst existing retailers are that
there are no linkages with the historic town centre, and that it will result in splitting the
town centre in half. One respondent suggested that adding more retail floorspace will
simply result in cannibalisation of the town centre. Two other respondents suggested that
the Waterfront should be used for leisure and other recreational uses (other than retail)
only, or that the town should be split into defined ‘quarters’.
1 Jersey Tourism, A Year in Review 2007.
Jersey Retail Study 2008
7
2.18 Other weaknesses commented upon included ‘soaring/high rents’ that are linked to the
Retail Price Index (RPI) rather than the actual cost of living, poor policing of cyclists and
skateboarders in the town centre, shabby areas in need of tidying up, and too many long-
term vacant units. Many retailers were also concerned about, and opposed to, the (then)
forthcoming implementation of the new Goods and Services Tax.
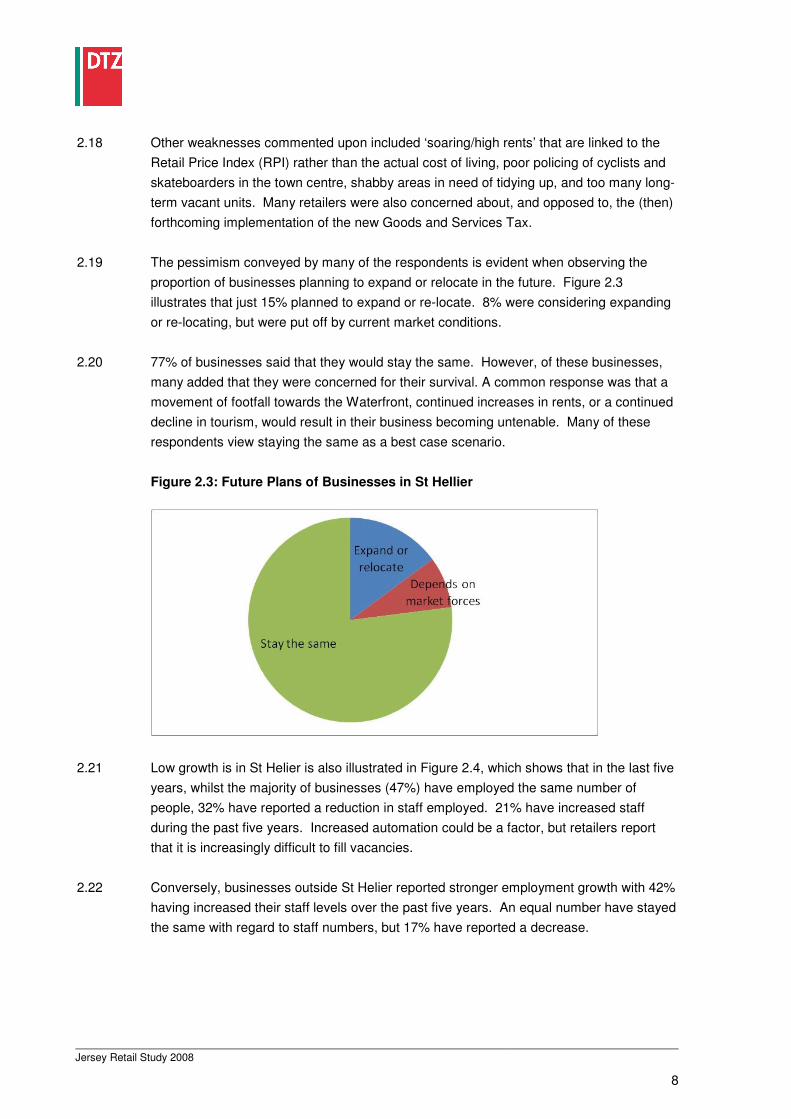
2.19 The pessimism conveyed by many of the respondents is evident when observing the
proportion of businesses planning to expand or relocate in the future. Figure 2.3
illustrates that just 15% planned to expand or re-locate. 8% were considering expanding
or re-locating, but were put off by current market conditions.
2.20 77% of businesses said that they would stay the same. However, of these businesses,
many added that they were concerned for their survival. A common response was that a
movement of footfall towards the Waterfront, continued increases in rents, or a continued
decline in tourism, would result in their business becoming untenable. Many of these
respondents view staying the same as a best case scenario.
Figure 2.3: Future Plans of Businesses in St Hellier
2.21 Low growth is in St Helier is also illustrated in Figure 2.4, which shows that in the last five
years, whilst the majority of businesses (47%) have employed the same number of
people, 32% have reported a reduction in staff employed. 21% have increased staff
during the past five years. Increased automation could be a factor, but retailers report
that it is increasingly difficult to fill vacancies.
2.22 Conversely, businesses outside St Helier reported stronger employment growth with 42%
having increased their staff levels over the past five years. An equal number have stayed
the same with regard to staff numbers, but 17% have reported a decrease.
Jersey Retail Study 2008
8
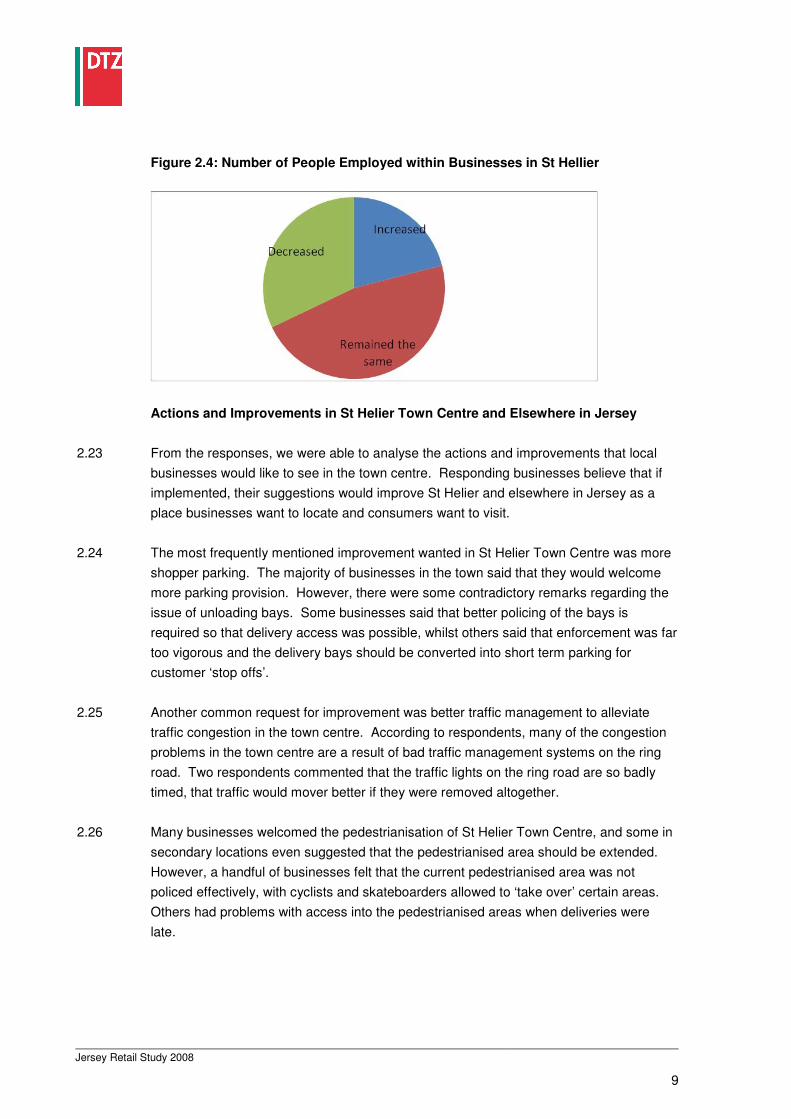
Figure 2.4: Number of People Employed within Businesses in St Hellier
Actions and Improvements in St Helier Town Centre and Elsewhere in Jersey
2.23 From the responses, we were able to analyse the actions and improvements that local
businesses would like to see in the town centre. Responding businesses believe that if
implemented, their suggestions would improve St Helier and elsewhere in Jersey as a
place businesses want to locate and consumers want to visit.
2.24 The most frequently mentioned improvement wanted in St Helier Town Centre was more
shopper parking. The majority of businesses in the town said that they would welcome
more parking provision. However, there were some contradictory remarks regarding the
issue of unloading bays. Some businesses said that better policing of the bays is
required so that delivery access was possible, whilst others said that enforcement was far
too vigorous and the delivery bays should be converted into short term parking for
customer ‘stop offs’.
2.25 Another common request for improvement was better traffic management to alleviate
traffic congestion in the town centre. According to respondents, many of the congestion
problems in the town centre are a result of bad traffic management systems on the ring
road. Two respondents commented that the traffic lights on the ring road are so badly
timed, that traffic would mover better if they were removed altogether.
2.26 Many businesses welcomed the pedestrianisation of St Helier Town Centre, and some in
secondary locations even suggested that the pedestrianised area should be extended.
However, a handful of businesses felt that the current pedestrianised area was not
policed effectively, with cyclists and skateboarders allowed to ‘take over’ certain areas.
Others had problems with access into the pedestrianised areas when deliveries were
late.
Jersey Retail Study 2008
9
2.27 Together with the most contentious issues of parking and traffic congestion, businesses
suggested a wide range of other improvements for addressing their perceptions of the
weaknesses of St Helier Town Centre. The main issues and suggestions include the
following:
• Develop St Helier Town Centre and the Waterfront as a whole and not as separate
parts (or develop them into ‘quarters’ with different uses);
• Improve the provision and accessibility of loading and servicing bays, and prevent
cars parking in them by vigorous enforcement (others suggested the provision of
short term ‘stop off’ bays instead);
• Alter rent review system to a fairer system that is not linked to RPI alone;
• More trees and planting;
• The Market should be more pro-active in hosting events and entertainment;
• More attention to street cleaning and policing;
• Greater regard for and protection of the architectural heritage within the town centre;
• Better signage to and marketing of other areas of St Helier Town Centre apart from
the main precinct;
• Cleaning of streets and pavements on a more frequent basis;
• Extended advertising in the UK and France of Jersey as a tourist destination;
• Discounted air fares to bring tourists to the Island;
• Encouragement of businesses to take up unsightly vacant units.
2.28 Businesses elsewhere in Jersey also suggested a range of other improvements for
addressing the perceived weaknesses of their locations. These include the following:
• More trees and planting;
• Wider access roads to rural areas/businesses;
• Operate ferry service to Gorey from France;
Jersey Retail Study 2008
10
• Better island signage, and relaxation of controls on business signage;
• More monitoring/control of monopolistic landlords;
• Relax Sunday opening hours (or have consistency with St Helier).
Overall Observations
2.29 Despite a number of common concerns shared amongst the majority of postal survey
respondents (i.e. lack of parking, poor access, high rents, the introduction of GST, and
the development of the Waterfront as a retail area), it is clear that many business see St
Helier Town Centre as an attractive business location.
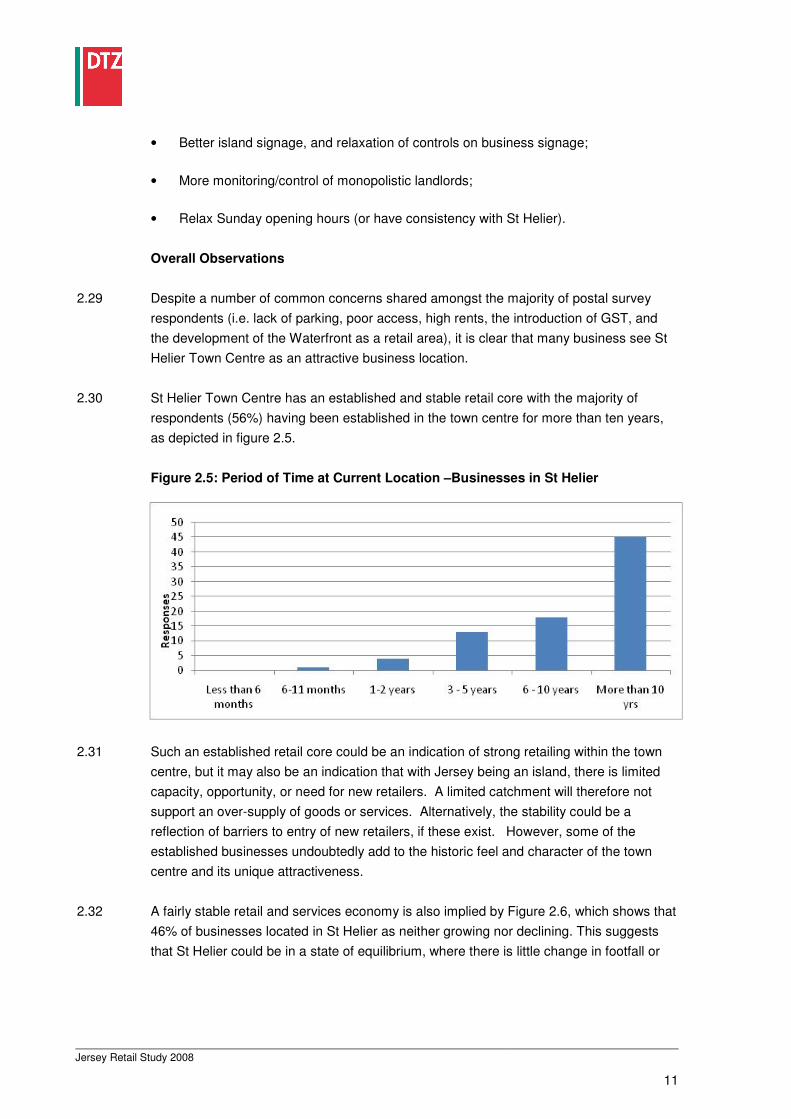
2.30 St Helier Town Centre has an established and stable retail core with the majority of
respondents (56%) having been established in the town centre for more than ten years,
as depicted in figure 2.5.
Figure 2.5: Period of Time at Current Location –Businesses in St Helier
2.31 Such an established retail core could be an indication of strong retailing within the town
centre, but it may also be an indication that with Jersey being an island, there is limited
capacity, opportunity, or need for new retailers. A limited catchment will therefore not
support an over-supply of goods or services. Alternatively, the stability could be a
reflection of barriers to entry of new retailers, if these exist. However, some of the
established businesses undoubtedly add to the historic feel and character of the town
centre and its unique attractiveness.
2.32 A fairly stable retail and services economy is also implied by Figure 2.6, which shows that
46% of businesses located in St Helier as neither growing nor declining. This suggests
that St Helier could be in a state of equilibrium, where there is little change in footfall or
Jersey Retail Study 2008
11
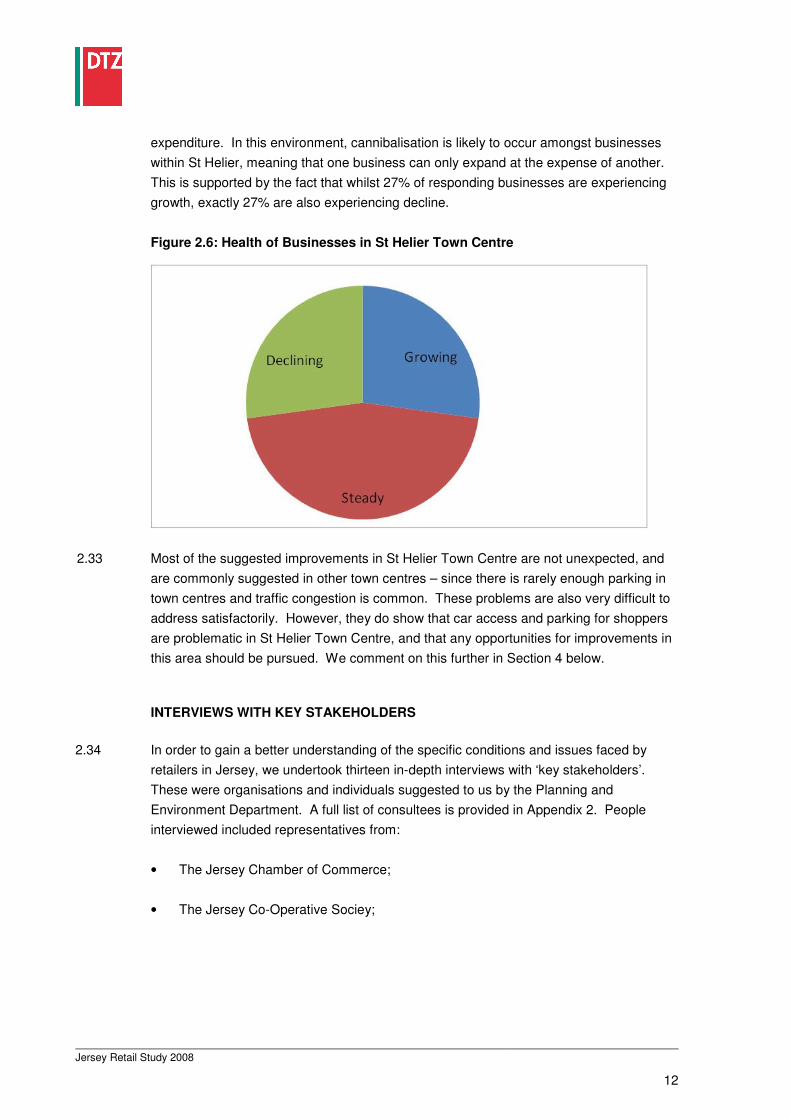
expenditure. In this environment, cannibalisation is likely to occur amongst businesses
within St Helier, meaning that one business can only expand at the expense of another.
This is supported by the fact that whilst 27% of responding businesses are experiencing
growth, exactly 27% are also experiencing decline.
Figure 2.6: Health of Businesses in St Helier Town Centre
2.33 Most of the suggested improvements in St Helier Town Centre are not unexpected, and
are commonly suggested in other town centres – since there is rarely enough parking in
town centres and traffic congestion is common. These problems are also very difficult to
address satisfactorily. However, they do show that car access and parking for shoppers
are problematic in St Helier Town Centre, and that any opportunities for improvements in
this area should be pursued. We comment on this further in Section 4 below.
INTERVIEWS WITH KEY STAKEHOLDERS
2.34 In order to gain a better understanding of the specific conditions and issues faced by
retailers in Jersey, we undertook thirteen in-depth interviews with ‘key stakeholders’.
These were organisations and individuals suggested to us by the Planning and
Environment Department. A full list of consultees is provided in Appendix 2. People
interviewed included representatives from:
• The Jersey Chamber of Commerce;
• The Jersey Co-Operative Sociey;
Jersey Retail Study 2008
12
• Sandpiper (which operates Checkers and Marks & Spencer stores);
• De Gruchy;
• Various other independent retailers in Jersey;
• The Jersey Competition Regulatory Authority;
• The Jersey Consumer Council (consulted by correspondence).
2.35 The following section attempts to capture the commonly arising themes expressed by the
retailers that were interviewed. Whilst we have recorded below comments by retailers,
we cannot vouch for the factual accuracy of such statements made to us.
Nevertheless, the comments indicate retailers’ perceptions based on their day-to-day
experience; which even if they are not wholly accurate will inevitably influence their
business decisions, such as on expansion or relocation.
2.36 The majority of consultees said that retailers on Jersey were faced with much higher
operating costs than other destinations (namely the UK mainland and France). The
higher operating costs were attributed to higher staff costs, higher delivery costs, rents,
and utility bills.
2.37 Where staff costs are concerned, retailers claimed that their average costs are, on
average, from 10% to as much as 43% higher than the UK mainland. They told us that
the retail industry finds it difficult to recruit because of two main factors. First, Jersey is at
full employment, so there is simply a lack of labour supply (which also contributes to
wage increases because labour is in greater demand). Second, they said that the labour
force is rigid due to the Regulation of Undertakings. One consultee observed that it’s
hard to attract Jersey people into the retail industry as it’s increasingly seen as a
secondary career; since many young locals aspire to working in the financial services
industry. Consultees complained of skill gaps and hard to fill vacancies across the
sector, particularly at middle management level.
2.38 According to many of the consultees, in addition to high staff costs, costs are increased
further by retailers’ delivery costs. One major retailer estimated that costs are increased
by 6% to 7% for getting merchandise onto the Island. The supply chain costs increased
further because containers are too large for Island roads and need to be broken down
into smaller containers on the dockside (effectively resulting in ‘double handling’).
2.39 Goods ferries from the UK mainland are provided by only two operators, and these are
costly. There are no other operators because of lack of demand and the need to use
Jersey Retail Study 2008
13
special shallow-draught ships. Also most ferries go back almost empty, and very little
goods are flown onto the Island.
2.40 Other costs perceived to be high are utility bills and rents. According to one retailer,
because of the nature of the Island, the utility companies operate a virtual monopoly so
they are able to charge higher prices. Rents were said to be continually increasing
because they are linked to the RPI, but don’t take account of rising operating costs.
2.41 According to the many of the retailers we interviewed, the consumer has to pay higher
prices on some items as a result of the higher staff and supply chain costs. They stated
that it is a different case for dairy products which are entirely sourced from Jersey.
Higher prices in this category of goods are due to the lower economies of scale on the
Island than can be achieved by some UK and French dairy producers in those countries.
2.42 In relation to food retailing, the Island’s two largest food store operators, Co-Op and
Sandpiper (the latter also running the Marks & Spencer franchise operation), informed us
that the food market is at saturation point on the Island. The M&S Simply Food stores
would need to increase their market share in order to grow turnover. However, they
would risk cannibalisation of their own existing stores. Another consultee was of the
opinion that ‘a ...... superstore would be a disaster for Jersey’; and that it would pose a
threat to the Central and Bereford Markets. However, if a new foodstore was to be
developed, St Helier would be the only location for it.
2.43 This point about market saturation for foodstores was re-enforced by Sandpiper,
informing us that they have planning permission to extend an existing food store from
20,000 sq ft to 52,000 sq ft. However, because cannibalisation is such an issue, they are
reducing the planned extension of convenience goods floorspace by over half and will be
developing some of the permitted floorspace for non-food use.2
One of the two major
food retailers claimed to be trading at an average food sales density 30% lower than the
average for the UK ‘big four’ food retailers; whilst the other claimed to be trading at about
the same sales densities as Tesco and Sainsbury’s in the UK. Sandpiper currently has
plans to remove unused till points from some stores and optimise space through sub
letting space to franchise operations, in particular Iceland Frozen Foods, and Costa
Coffee.
2.44 The food retailers also pointed out that farm shops are growing in popularity in Jersey.
These shops are often ‘off the radar’ in terms of data, but could be growing their share of
the market.
2 Since completion of our retail capacity forecasts and publication of the report, we have been informed by Sandpiper that they
have not yet taken a decision on the implementation of the permitted development, and it may still be implemented in full as a convenience goods extension to the existing store. In this case, it would mean that there would be less capacity for additional convenience goods floor space than we have forecast, and more capacity for comparison goods floor space.
Jersey Retail Study 2008
14
2.45 Cannibalisation was also an issue for non-food retailers who were concerned about the
long term effect of the Waterfront development. Generally, retailers based in St Hellier
Town Centre viewed the development as providing replacement space rather than new
space. Some retailers commented that the amount of retail floorspace in the town centre
had grown up to serve the formerly large numbers of visitors to the Island. However now
that tourism has substantially declined, there is too much retail floorspace for the current
level of expenditure.
2.46 There are concerns over the town centre being split in two, and the movement of interest
away from the north-east of St Helier Town Centre. One interviewee said that there is no
new capacity to support additional floorspace, and that more development on the
Waterfront would lead to the death of the secondary retail areas of St Helier.
2.47 There are also concerns about the potential number of UK multiple retailers which might
locate in St Helier. Local independent retailers said that the unique and historic town
centre should be protected from becoming another ‘UK clone town’. One suggested that
if UK multiples are welcomed into Jersey, there should at least be an ‘independents zone’
in order to differentiate St Helier Town Centre and preserve some its character.
2.48 Despite a lower footfall, some of the niche/high end retailers reported that they were
benefiting from more wealthy tourists – perhaps as a result of the growth in financial
services, or growth of ‘weekend breakers’ (as opposed to the traditional ‘bucket & spade’
holidaymakers).
2.49 According to one retailer, Jersey needs better quality retail floorspace stock in order to ‘fit’
with its high quality brand. The shop spaces in St Helier are generally of an inadequate
size. Many shops (particularly ones in historic buildings) are too small with poor delivery
access. Conversely many of the larger floorplates were set up to cater for the tourism
industry that thrived in the past. Now that there is lower footfall, retailers occupying these
stores are left with redundant space. In essence, the consultees thought that there is
currently enough retail floorspace on the Island, but it is poorly configured.
2.50 In addition to the fall in tourism numbers, the consultees were concerned about the
erosion of spending power amongst Jersey residents. The retailers thought that
uncertainty over the long term impact of the ‘credit crunch’, combined with the
introduction of GST and the ‘20 means 20’ policy, could squeeze the market further.
2.51 As seen in the Postal Survey of Businesses (described above) car parking was again
cited as a major issue within St Helier Town Centre. Consultees said that there simply
Jersey Retail Study 2008
15
aren’t enough parking spaces in the town centre, and that the scratch card system is
highly inconvenient for shoppers (especially tourists).
2.52 Other common issues that were raised included a frustration amongst retailers that the
planning process is too slow and rigid. Feedback ranged from the time taken and level of
bureaucracy required for minor fascia changes, to perceived ‘unfair processes’ for
planning applications. Retailers are unhappy that they are unable to get an indication
whether a larger application will be worth making, before having to submit it formally;
meaning that they have to pay the application fee without being able to judge the chances
of success. Concern was expressed by one consultee that there is no clear town centre
strategy for St Helier and no monitoring of the town centre; and that government is
insufficiently ‘joined up’ in its approach to retail and town centre related matters. This
consultee supported the introduction of Town Centre Management in St Helier, but was
concerned that a Town Centre Manager may be just ‘a PR person’.
2.53 Some retailers commented that the out-of-town or local centres, such as Red Houses,
are growing at the expense of St Helier Town Centre. This was also suggested in the
postal survey; with only 27% of businesses in St Helier Town Centre saying they are
growing, compared with 58% of responding businesses from elsewhere in Jersey. There
is also a fear by some retailers that Jersey residents will increasingly look to the internet
for comparison goods shopping, especially where savings can be made.
2.54 Not surprisingly, comments by the JCRA were very different from those of consultees
representing retailers. The JCRA’s view was that markets are more efficient at allocating
resources and meeting consumer needs than central planning; and that the market for
food retailing on Jersey is currently subject to ‘barriers to entry’, of which restrictive
planning policy for new retail development is one. More competition would be good for
consumers, and this means the introduction of one or more additional main food store
operators to the Island. The most efficient retailers would survive and prosper, to the
benefit of shoppers and the Jersey economy. A study of the Isle of Man before and after
Tesco opened a store there showed that it had ‘brought benefits for shoppers and for the
Isle’s economy’. In its analysis and advice to the Minister of Economic Development in
March 2008, the JCRA had not considered the need (in terms of available expenditure)
for additional foodstore floorspace, or the likely impact on existing foodstores of
permitting a new food superstore on the Island.
2.55 Overall, there is clearly considerable concern by the retail industry that it is being
squeezed by declining expenditure as a result of lower levels of tourism, growth of
internet shopping and (potentially) new retail development on the St Helier Waterfront;
and by increasing costs of staff, rents and utility costs. It is widely believed that there is
no need for additional retail floorspace, although the existing stock of floorspace in St
Helier Town Centre is considered to be not well configured for current needs. There is a
Jersey Retail Study 2008
16
widespread belief that new retail development will simply cannibalise existing shops,
resulting in a decline in the secondary shopping areas of St Helier Town Centre –
particularly if new retail development is on the Waterfront rather than in the town centre
itself. The principal food retailers also claim to be facing challenging conditions and
market saturation, and see no need for more foodstores on the Island. In contrast, the
JCRA believes that another major food retailer is needed to lower prices and provide a
better service to shoppers. There is widespread concern about the difficulties of car
access and parking in St Helier Town Centre.
ON-STREET INTERVIEW SURVEY IN ST HELIER TOWN CENTRE
2.56 In accordance with the project brief, we designed and commissioned an On-street
Interview Survey of shoppers and other town centre users. The survey was undertaken
in St Helier Town Centre, and was based on a random sample of interviews. The first
part of this section describes the findings of the survey, the second part concentrates on
the conclusions.
2.57 The survey was conducted throughout the main shopping areas of St Helier Town
Centre: King Street, Queen Street, Halkett Place, and Bath Street. Interviewing was
conducted in May 2008 on a Monday, Tuesday, Wednesday, Thursday and Saturday
between 9.00am and 6.00 pm. The questionnaire was designed by DTZ following
consultation with the Planning and Environment Department and the Statistics Unit. A
total of 410 interviews was completed (122 interviews were conducted on Monday, 90 on
Tuesday, 104 on Wednesday, 1 on Thursday, and 93 on Saturday). A copy of the
questionnaire and the detailed results are included in Appendix 3 of this report.
Mode of Travel
2.58 Respondents were asked how they travelled to the town centre. 46% came to the centre
on foot, 38% travelled by car as the car driver. 9% of respondents travelled into St Helier
as a passenger in a car. 7% came to the town centre by bus. The remaining
respondents came by cycle (2%), moped/motorcycle (2%), taxi (1%), and boat (0.2%).
The high proportion of walk-in shoppers is a reflection of the high density of St Helier, and
the substantial residential areas close to the town centre.
Purpose of Visit to St Helier Town Centre
2.59 Question 4 asked respondents what was the main purpose of their visit to St Helier Town
Centre on the day of the interview. As illustrated in figure 2.7, 32% of respondents stated
that they were doing non-food shopping, whilst 10% stated that they were doing food
shopping. 30% of respondents stated that they worked in or near the town centre and
Jersey Retail Study 2008
17
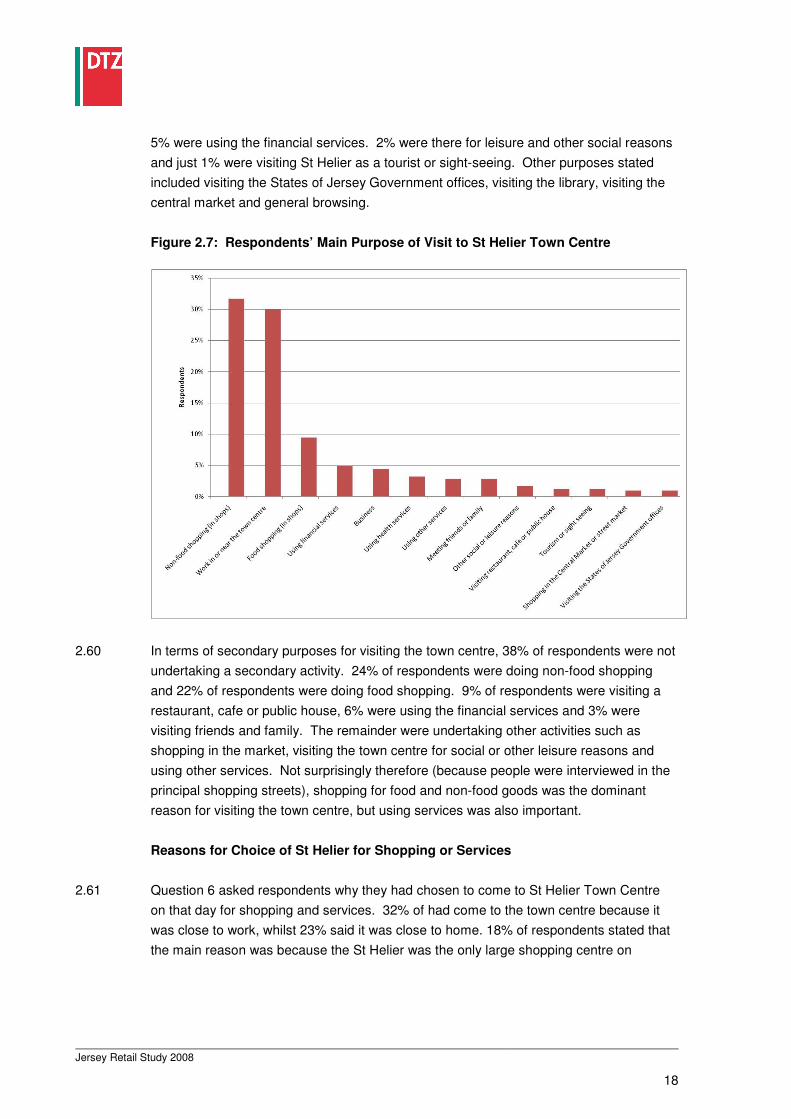
5% were using the financial services. 2% were there for leisure and other social reasons
and just 1% were visiting St Helier as a tourist or sight-seeing. Other purposes stated
included visiting the States of Jersey Government offices, visiting the library, visiting the
central market and general browsing.
Figure 2.7: Respondents’ Main Purpose of Visit to St Helier Town Centre
2.60 In terms of secondary purposes for visiting the town centre, 38% of respondents were not
undertaking a secondary activity. 24% of respondents were doing non-food shopping
and 22% of respondents were doing food shopping. 9% of respondents were visiting a
restaurant, cafe or public house, 6% were using the financial services and 3% were
visiting friends and family. The remainder were undertaking other activities such as
shopping in the market, visiting the town centre for social or other leisure reasons and
using other services. Not surprisingly therefore (because people were interviewed in the
principal shopping streets), shopping for food and non-food goods was the dominant
reason for visiting the town centre, but using services was also important.
Reasons for Choice of St Helier for Shopping or Services
2.61 Question 6 asked respondents why they had chosen to come to St Helier Town Centre
on that day for shopping and services. 32% of had come to the town centre because it
was close to work, whilst 23% said it was close to home. 18% of respondents stated that
the main reason was because the St Helier was the only large shopping centre on
Jersey Retail Study 2008
18
Jersey. 3% stated that they were visiting as a tourist, and a further 3% were visiting
because of the market.
2.62 44 respondents answered the question asking them to specify which particular
shop/service they intended to use. 6 respondents were visiting the doctor/dentist, 5 were
visiting the hairdresser, 5 were specifically using the bank, and 4 were visiting the
Government offices. Shops/services that were particularly mentioned (each by 2
respondents) included Woolworths, Jessops and the job centre.
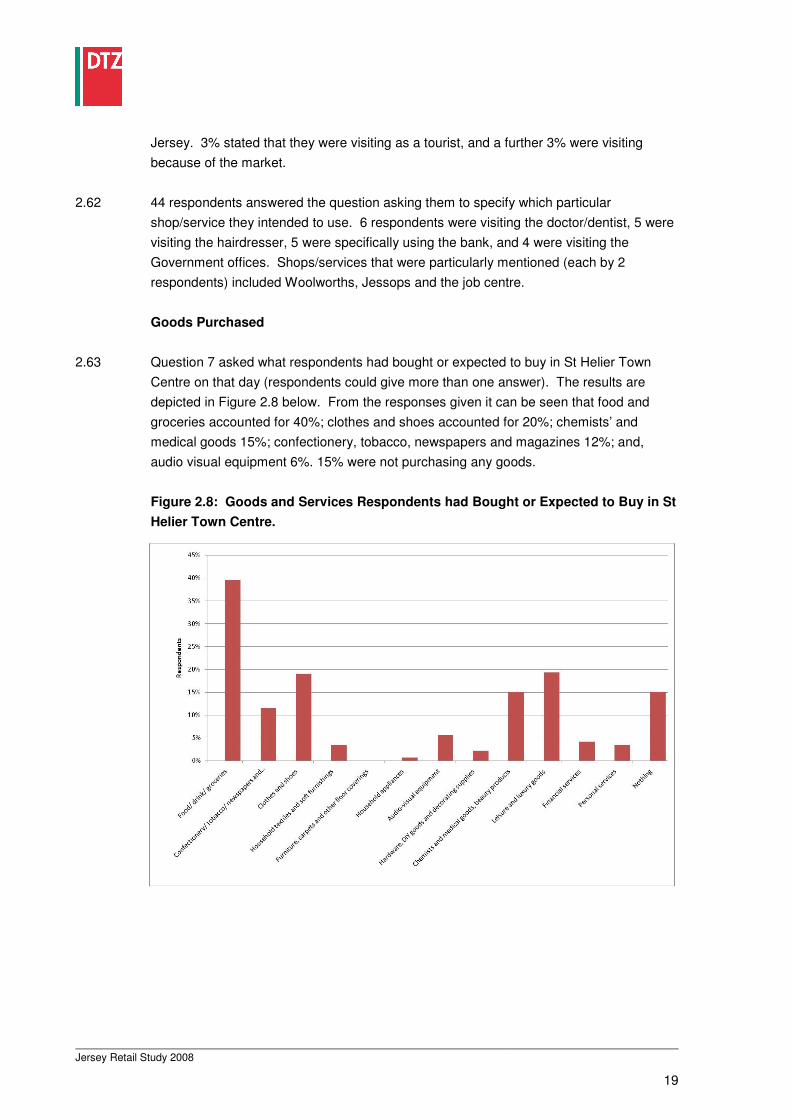
Goods Purchased
2.63 Question 7 asked what respondents had bought or expected to buy in St Helier Town
Centre on that day (respondents could give more than one answer). The results are
depicted in Figure 2.8 below. From the responses given it can be seen that food and
groceries accounted for 40%; clothes and shoes accounted for 20%; chemists’ and
medical goods 15%; confectionery, tobacco, newspapers and magazines 12%; and,
audio visual equipment 6%. 15% were not purchasing any goods.
Figure 2.8: Goods and Services Respondents had Bought or Expected to Buy in St
Helier Town Centre.
Jersey Retail Study 2008
19
Level of Spend Food & Drink Non-Food
Nothing 57% 35%
£1 to £5 13% 8%
£6 to £10 11% 7%
£11 to £20 10% 15%
£21 to £50 9% 18%
£51 to £100 1% 12%
£101 to £200 0% 2%
£201 to £300 0% 1%
£301 to £500 0% 2%
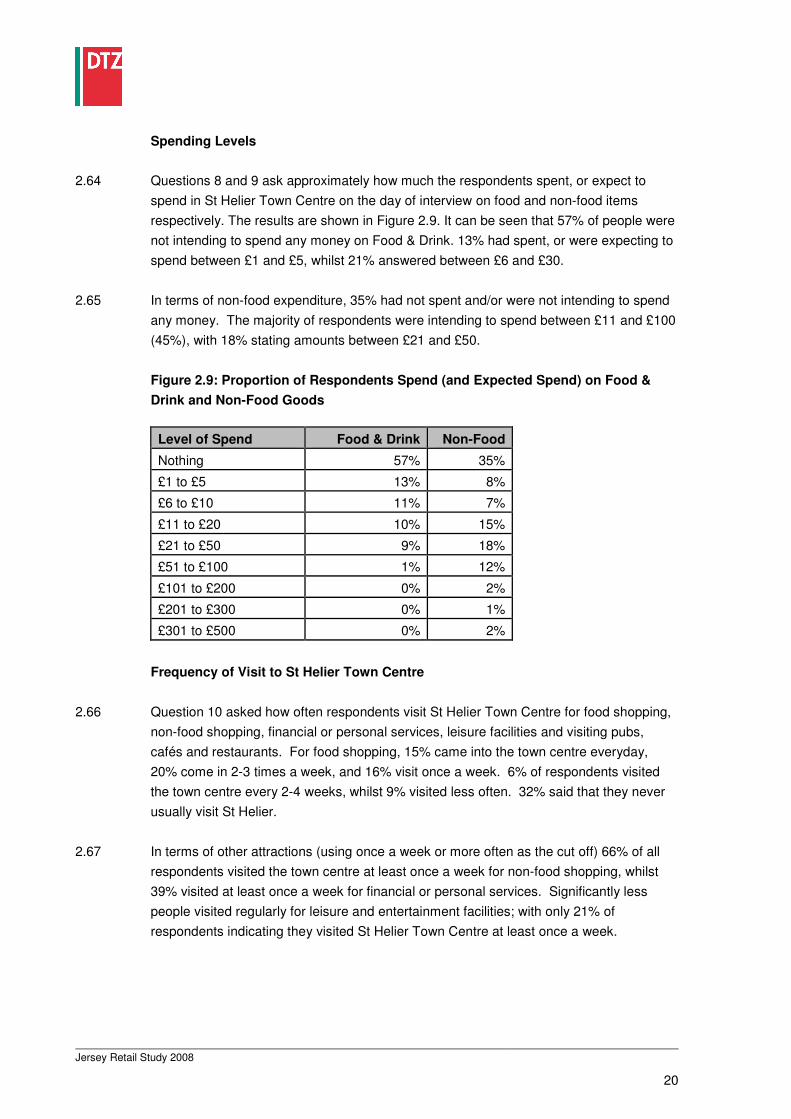
Spending Levels
2.64 Questions 8 and 9 ask approximately how much the respondents spent, or expect to
spend in St Helier Town Centre on the day of interview on food and non-food items
respectively. The results are shown in Figure 2.9. It can be seen that 57% of people were
not intending to spend any money on Food & Drink. 13% had spent, or were expecting to
spend between £1 and £5, whilst 21% answered between £6 and £30.
2.65 In terms of non-food expenditure, 35% had not spent and/or were not intending to spend
any money. The majority of respondents were intending to spend between £11 and £100
(45%), with 18% stating amounts between £21 and £50.
Figure 2.9: Proportion of Respondents Spend (and Expected Spend) on Food &
Drink and Non-Food Goods
Frequency of Visit to St Helier Town Centre
2.66 Question 10 asked how often respondents visit St Helier Town Centre for food shopping,
non-food shopping, financial or personal services, leisure facilities and visiting pubs,
cafés and restaurants. For food shopping, 15% came into the town centre everyday,
20% come in 2-3 times a week, and 16% visit once a week. 6% of respondents visited
the town centre every 2-4 weeks, whilst 9% visited less often. 32% said that they never
usually visit St Helier.
2.67 In terms of other attractions (using once a week or more often as the cut off) 66% of all
respondents visited the town centre at least once a week for non-food shopping, whilst
39% visited at least once a week for financial or personal services. Significantly less
people visited regularly for leisure and entertainment facilities; with only 21% of
respondents indicating they visited St Helier Town Centre at least once a week.
Jersey Retail Study 2008
20
However, 38% of respondents visited pubs, cafés, nightclubs and restaurants in the
centre at least once a week.
Likes About St Helier Town Centre for Shopping or Services
2.68 In question 11, respondents were asked without prompting what they liked about St
Helier Town Centre for shopping or services (respondents could give more than one
answer). 21% of all respondents said they liked the non-food shops. 20% found the
centre easy to get to from home and 13% found it easy to get to from work. 16% of
respondents stated they liked the market and 14% of respondents liked the good cafes,
restaurants and pubs. 12% liked the good food shops and a further 12% liked the
department stores located in the centre.
2.69 Other response included 10% who liked the attractive environment or historic buildings,
12% that liked the clean streets, and 13% liked the traffic free/pedestrian areas.
However, 19% of people interviewed liked nothing or very little about the town centre.
2.70 Only 9 respondents (2.2%) mentioned particular shops or types of shops which they
liked. These included independent shops, Marks & Spencer, De Gruchy, Redvers and
Fest.
Dislikes About St Helier Town Centre for Shopping or Services
2.71 Question 12 asked respondents what they disliked about St Helier Town Centre. The
main unprompted dislikes (respondents could give more than one answer) were that 16%
thought the town centre was too busy/crowded, whilst equally 16% said poor value for
money/high prices. 8% said expensive food shops and 15% said the poor range of
shops. 12% said that it was difficult to park, whilst 9% found parking too expensive; and
a further 9% said that traffic congestion was a problem.
2.72 Other dislikes about the town centre included a lack of bins, seats, phones and toilets
(4%); dirty or badly maintained streets (6%); poor access for the disabled (2%);
skateboarders & cyclists in pedestrian zones (2%), and too much building work (2%).
Individual dislikes focused on a loss of character in the town centre and chain stores
pricing out independent stores.
2.73 Encouragingly, 34% of respondents stated that they disliked nothing or very little about
the centre. When compared with the lower proportion (19%) who liked nothing or very
little, this shows a positive balance of satisfaction with the town centre.
Jersey Retail Study 2008
21
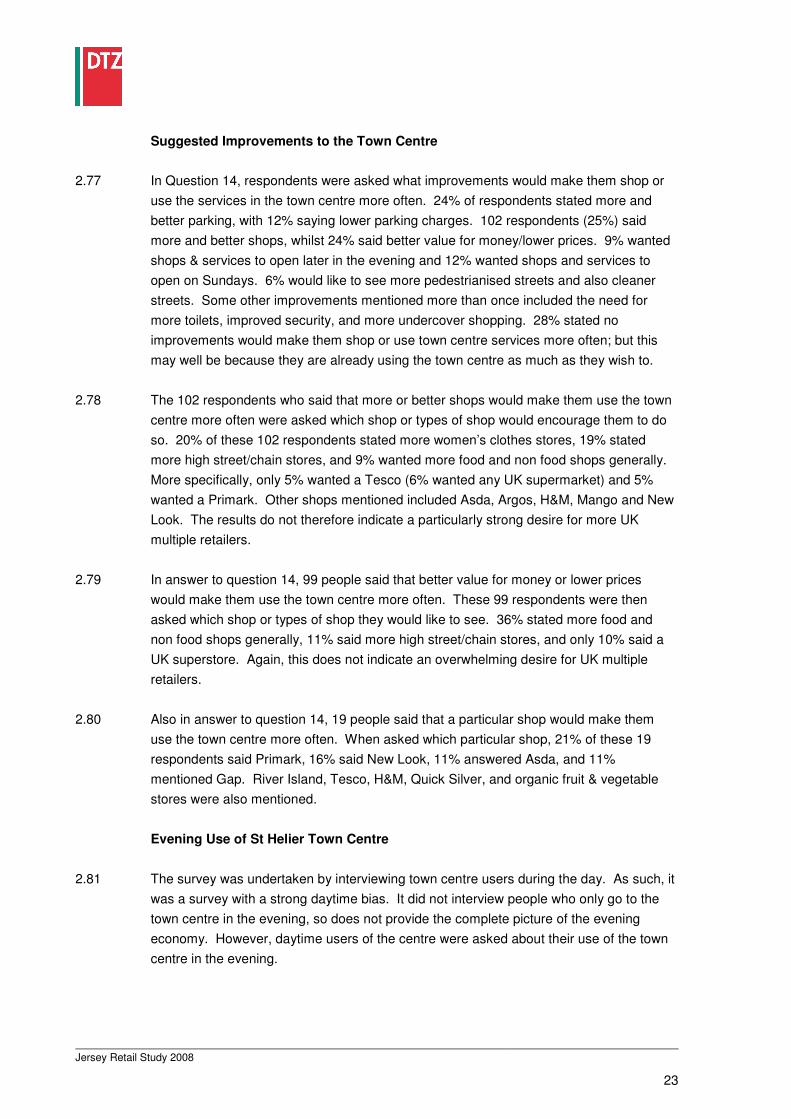
Daytime Town Centre Ratings
2.74 In Question 13, all respondents were asked to rate certain aspects of the town centre in
the daytime. Figure 2.10 illustrates how the respondents rated car parking, bus services,
safety & security, range of shops, value for money, range of services, cleanliness of
streets, and attractiveness of the town centre. The respondents were asked to rate the
categories as either very good, good, neither good nor poor, poor, or very poor.
2.75 Respondents predominantly rated the following aspects of the town centre as either
good, or very good: safety & security (83% of respondents), range of shops (65%), range
of services (67%), cleanness of streets (76%), and attractiveness of town centre (67%).
2.76 33% of respondents rated parking as either poor or very poor, compared with 22% who
said it is good or very good (33% said that they didn’t know and 12% said neither good
nor poor). Value for money in shops also received an overall slightly negative response
(38% said it is poor or very poor, compared with 29% answering that it is good or very
good).
Figure 2.10: How Respondents Rated the Town Centre (During the Daytime)
Jersey Retail Study 2008
22
Suggested Improvements to the Town Centre
2.77 In Question 14, respondents were asked what improvements would make them shop or
use the services in the town centre more often. 24% of respondents stated more and
better parking, with 12% saying lower parking charges. 102 respondents (25%) said
more and better shops, whilst 24% said better value for money/lower prices. 9% wanted
shops & services to open later in the evening and 12% wanted shops and services to
open on Sundays. 6% would like to see more pedestrianised streets and also cleaner
streets. Some other improvements mentioned more than once included the need for
more toilets, improved security, and more undercover shopping. 28% stated no
improvements would make them shop or use town centre services more often; but this
may well be because they are already using the town centre as much as they wish to.
2.78 The 102 respondents who said that more or better shops would make them use the town
centre more often were asked which shop or types of shop would encourage them to do
so. 20% of these 102 respondents stated more women’s clothes stores, 19% stated
more high street/chain stores, and 9% wanted more food and non food shops generally.
More specifically, only 5% wanted a Tesco (6% wanted any UK supermarket) and 5%
wanted a Primark. Other shops mentioned included Asda, Argos, H&M, Mango and New
Look. The results do not therefore indicate a particularly strong desire for more UK
multiple retailers.
2.79 In answer to question 14, 99 people said that better value for money or lower prices
would make them use the town centre more often. These 99 respondents were then
asked which shop or types of shop they would like to see. 36% stated more food and
non food shops generally, 11% said more high street/chain stores, and only 10% said a
UK superstore. Again, this does not indicate an overwhelming desire for UK multiple
retailers.
2.80 Also in answer to question 14, 19 people said that a particular shop would make them
use the town centre more often. When asked which particular shop, 21% of these 19
respondents said Primark, 16% said New Look, 11% answered Asda, and 11%
mentioned Gap. River Island, Tesco, H&M, Quick Silver, and organic fruit & vegetable
stores were also mentioned.
Evening Use of St Helier Town Centre
2.81 The survey was undertaken by interviewing town centre users during the day. As such, it
was a survey with a strong daytime bias. It did not interview people who only go to the
town centre in the evening, so does not provide the complete picture of the evening
economy. However, daytime users of the centre were asked about their use of the town
centre in the evening.
Jersey Retail Study 2008
23
Frequency of Evening Visits
2.82 Question 15 asked respondents how often they visit St Helier Town Centre in the
evening. 16% of respondents visited at least once a week. 34% visited the town centre
less than once a week, with 38% of respondents stating that they never visit in the
evening.
2.83 Of those 256 respondents who visited the town centre in the evening, 72% visit
restaurants and cafes, 44% of respondents visit pubs and bars and 17% stated that they
visit nightclubs. 9% visit friends or family living in St Helier. Other evening activities that
more than one respondent mentioned included visiting a health centre/sports centre,
visiting the church, and going to the library.
Likes about St Helier Town Centre in the Evening
2.84 Question 17 asked what people liked about St Helier Town Centre in the evening. 58%
liked the good cafes, bars and restaurants, 10% liked the good leisure, entertainment and
cultural facilities and 15% liked the good security. Other likes included that the centre
was easy to get to by car (7%), the attractiveness of the town (9%), and the good street
lighting (8%). 20% of people liked very little about the town centre during the evening.
Dislikes about St Helier Town Centre in the Evening
2.85 Question 18 asked respondents what they disliked about the town centre in the evening.
Encouragingly, 36% of respondents stated that they disliked nothing or very little about
the town centre. As with daytime use, when compared with the 20% who liked nothing or
very little, this shows a good positive balance of likes over dislikes about the town centre
in the evening. However, 27% said that the centre feels unsafe, 10% stated that there
were too many rowdy teenagers on the streets, and 4% disliked the amount of
drunkenness and a lack of police presence. Dirty streets (7%) and vandalism (6%) were
mentioned. 7% also stated that there were poor leisure, entertainment or cultural
facilities in the town centre and 6% also referred to a poor bus service.
Evening Town Centre Ratings
2.86 In Question 19, all respondents were asked to rate certain aspects of the town centre in
the evening. Figure 2.10 illustrates how the respondents rated car parking, bus services,
safety & security, range of evening attractions, quality of evening attractions, value for
money, cleanliness of streets, and attractiveness of the town centre. The respondents
Jersey Retail Study 2008
24
were asked to rate the categories either very good, good, neither good nor poor, poor, or
very poor.
2.87 Respondents predominantly rated the following as either good, or very good: car parking
(55%), cleanness of streets (63%), and attractiveness of the town centre (61%). The rest
of the categories were more evenly distributed, but all (other than value for money) had a
positive skew as illustrated in Figure 2.11.
Figure 2.11: How Respondents Rated the Town Centre During the Evening
Profile of Respondents
2.88 The age profile of respondents was fairly evenly split between the age groups. 12% of
respondents were 18 – 24 years, 22% were aged 25 – 34 years, 22% were aged 35- 44
years, 18% were aged 45 – 54 years, 16% were aged 55 – 64 years, and 10% were aged
65 years or above. A majority of households had one or more people either in part time
or full time employment. 19% of respondents stated that their household did not own a
vehicle. 66% of the respondents were female, 34% were male.
Conclusions from the On Street Interview Survey
2.89 It is evident from the survey that over half of the people interviewed in St Helier Town
Centre (56%) chose to come to the town centre because of proximity factors (it is close to
Jersey Retail Study 2008
25
home, work, etc), rather than specific attraction factors such as the shops and services
which it provides. This is not uncommon, since (ceteris paribus) most people prefer
nearby centres over more distant centres. As expected, a high proportion of users come
to St Helier Town Centre because it is the largest shopping centre in Jersey. Over half of
those interviewed visit more than once a week, probably partly because of its close
proximity. Almost half had walked to the town centre, and the predominant remainder of
users reach the town centre by car.
2.90 In terms of attitudes to St Helier, it is clear that general attitudes are more positive than
negative with 34% of respondents stating that for shopping or services they disliked
nothing or very little about the town centre compared with 19% who liked nothing or very
little. Many of the shoppers liked the town centre’s proximity to their home or workplace;
and attitudes to the market and the town centres cafe, restaurant and pub offer were also
positive.
2.91 Generally, respondents to the survey liked the overall attractive and historic environment
of St Helier and the range of shops. Most respondents also rated it as feeling safe &
secure during the daytime. However, a small minority (9%) also commented in one way
or another that the town centre was dirty, shabby or in need of some restoration.
2.92 In terms of dislikes, it is clear that congestion (both people & traffic) and parking are the
biggest issues amongst shoppers. Shoppers particularly disliked the difficulty and cost of
parking, general traffic congestion, and busy, crowded streets. Perceived poor value for
money and expensive food shops were also common dislikes (24% of respondents).
2.93 Attitudes to the shopping offer were more divided, with 15% of people saying that they
disliked the poor range of shops in the town centre, but 32% of people indicating that they
liked the good food or non-food shops. When asked what would make people use the
town centre more often, 30% of respondents wanted more or better shops or a particular
shop. On probing which shops, UK multiples Primark, New Look, Gap, River Island,
H&M, Mango, Argos, Quick Silver, Asda, and Tesco were mentioned specifically, by a
small minority of all respondents to the survey.
2.94 St Helier is primarily a destination for restaurants, cafes, pubs, bars and nightclubs in the
evening. Other evening activities mentioned by respondents included visiting a health
centre/sports centre, the church, or the library.
2.95 58% of those who use the town centre in the evening liked the good cafes, bars and
restaurants, whilst 36% of respondents stated that they disliked nothing or very little
about the town centre. Similarly, 61% of the respondents rated the attractiveness of the
Jersey Retail Study 2008
26
town centre in the evening as good or very good. However, 27% said that the centre felt
unsafe in the evening – drunkenness and rowdy teenagers being specifically mentioned.
2.96 Overall, the results of this survey show that St Helier Town Centre is regarded by its
users as attractive and providing a good range of shops and services. Their principal
concerns are about accessibility by car and the difficulty and cost of parking. There are
also concerns about poor value for money. The balance of satisfaction with the town
centre is positive, both during the day and in the evening.
RETAILER DEMAND ASSESSMENT
2.97 To provide an indication of what scale and type of new retail development might be
commercially realistic on Jersey, we undertook an assessment of the demand from
retailers to open new stores and shops on the Island.
Foodstores
2.98 Retailer demand for new foodstores was assessed by contacting the main UK and
French food store operators, outlining the nature of the study and seeking details from
them as to their requirements and aspirations for Jersey. In total we contacted 17 food
store operators. The operators were contacted by letter in the first instance, phone, and
then email (where possible). For reasons of commercial confidentiality, we have not
included each food store operator’s specific requirements within this report. We therefore
provide below an overview of our findings.
2.99 The retailers not at that time on the Island that we contacted were Aldi, Budgens,
Costcutter, Netto, Asda, Farmfoods, Iceland, Morrisons, Sainsbury’s, Somerfield, Lidl,
Waitrose, Systeme U, and Tesco. We also spoke to the Jersey Co-operative Society and
Sandpiper, which already operate foodstores on the Island, to ask about their expansion
plans.
2.100 In total nine retailers responded to our enquiry; whilst we understand that one other
operator who didn’t respond to this particular approach has previously expressed an
interest in locating on Jersey, and another (French retailer) which we did not contact has
also expressed an interest. Figure 2.12 summarises the responses from the foodstore
operators that were contacted.
2.101 It can be seen that five of the 16 food store operators had no intention of locating in
Jersey. Both of the existing main foodstore operators on Jersey have limited plans to
expand or reconfigure their existing stores, in some cases resulting in a reduction of
convenience goods floorspace. However, apart from a proposed small new foodstore in
Jersey Retail Study 2008
27
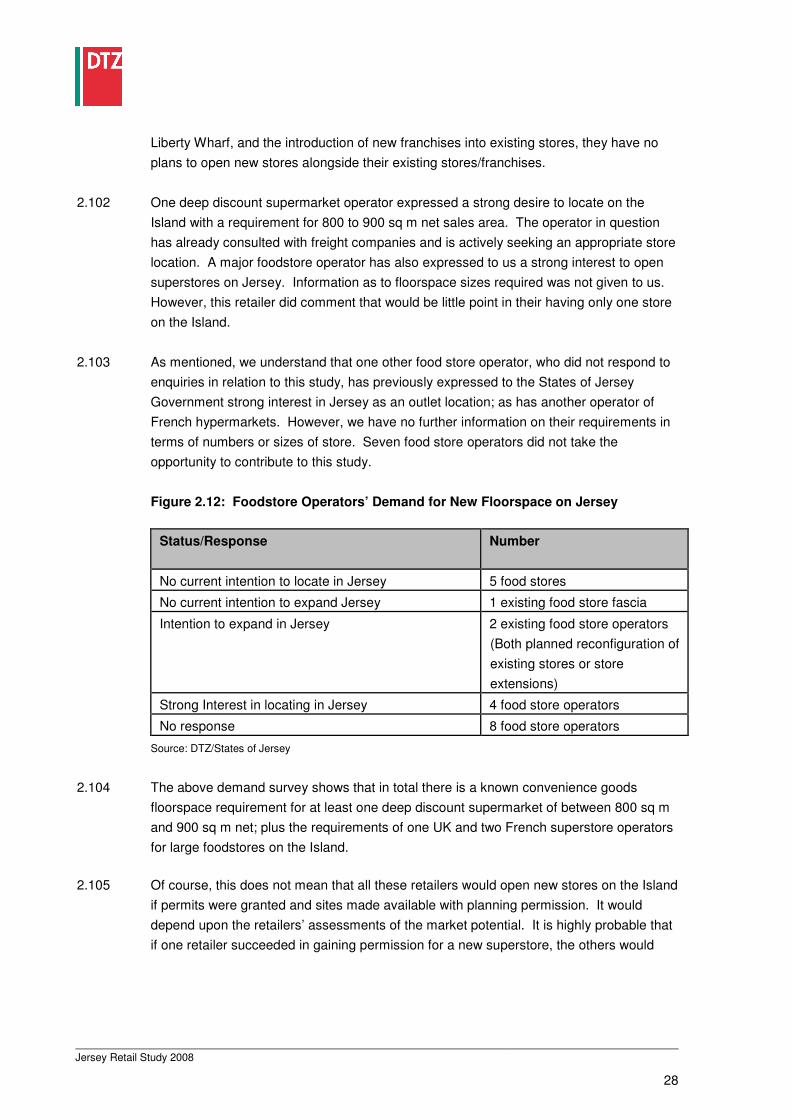
Figure 2.12: Foodstore Operators’ Demand for New Floorspace on Jersey
Status/Response Number
No current intention to locate in Jersey 5 food stores
No current intention to expand Jersey 1 existing food store fascia
Intention to expand in Jersey 2 existing food store operators
(Both planned reconfiguration of
existing stores or store
extensions)
Strong Interest in locating in Jersey 4 food store operators
No response 8 food store operators
Liberty Wharf, and the introduction of new franchises into existing stores, they have no
plans to open new stores alongside their existing stores/franchises.
2.102 One deep discount supermarket operator expressed a strong desire to locate on the
Island with a requirement for 800 to 900 sq m net sales area. The operator in question
has already consulted with freight companies and is actively seeking an appropriate store
location. A major foodstore operator has also expressed to us a strong interest to open
superstores on Jersey. Information as to floorspace sizes required was not given to us.
However, this retailer did comment that would be little point in their having only one store
on the Island.
2.103 As mentioned, we understand that one other food store operator, who did not respond to
enquiries in relation to this study, has previously expressed to the States of Jersey
Government strong interest in Jersey as an outlet location; as has another operator of
French hypermarkets. However, we have no further information on their requirements in
terms of numbers or sizes of store. Seven food store operators did not take the
opportunity to contribute to this study.
Source: DTZ/States of Jersey
2.104 The above demand survey shows that in total there is a known convenience goods
floorspace requirement for at least one deep discount supermarket of between 800 sq m
and 900 sq m net; plus the requirements of one UK and two French superstore operators
for large foodstores on the Island.
2.105 Of course, this does not mean that all these retailers would open new stores on the Island
if permits were granted and sites made available with planning permission. It would
depend upon the retailers’ assessments of the market potential. It is highly probable that
if one retailer succeeded in gaining permission for a new superstore, the others would
Jersey Retail Study 2008
28
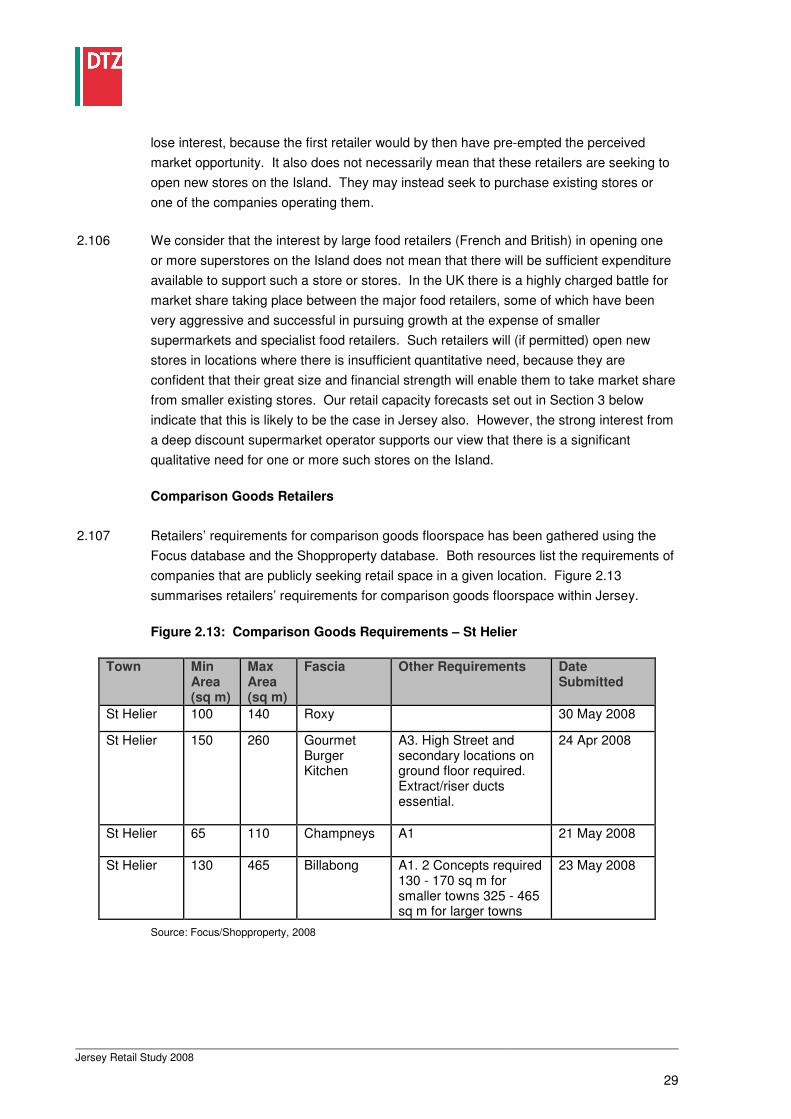
Figure 2.13: Comparison Goods Requirements – St Helier
Town Min Area (sq m)
Max Area (sq m)
Fascia Other Requirements Date Submitted
St Helier 100 140 Roxy 30 May 2008
St Helier 150 260 Gourmet Burger Kitchen
A3. High Street and secondary locations on ground floor required. Extract/riser ducts essential.
24 Apr 2008
St Helier 65 110 Champneys A1 21 May 2008
St Helier 130 465 Billabong A1. 2 Concepts required 130 - 170 sq m for smaller towns 325 - 465 sq m for larger towns
23 May 2008
lose interest, because the first retailer would by then have pre-empted the perceived
market opportunity. It also does not necessarily mean that these retailers are seeking to
open new stores on the Island. They may instead seek to purchase existing stores or
one of the companies operating them.
2.106 We consider that the interest by large food retailers (French and British) in opening one
or more superstores on the Island does not mean that there will be sufficient expenditure
available to support such a store or stores. In the UK there is a highly charged battle for
market share taking place between the major food retailers, some of which have been
very aggressive and successful in pursuing growth at the expense of smaller
supermarkets and specialist food retailers. Such retailers will (if permitted) open new
stores in locations where there is insufficient quantitative need, because they are
confident that their great size and financial strength will enable them to take market share
from smaller existing stores. Our retail capacity forecasts set out in Section 3 below
indicate that this is likely to be the case in Jersey also. However, the strong interest from
a deep discount supermarket operator supports our view that there is a significant
qualitative need for one or more such stores on the Island.
Comparison Goods Retailers
2.107 Retailers’ requirements for comparison goods floorspace has been gathered using the
Focus database and the Shopproperty database. Both resources list the requirements of
companies that are publicly seeking retail space in a given location. Figure 2.13
summarises retailers’ requirements for comparison goods floorspace within Jersey.
Source: Focus/Shopproperty, 2008
Jersey Retail Study 2008
29

2.108 According to these sources, interest is relatively low for comparison goods space.
Multiple retailers and service businesses currently require between 450 sq m and 975 sq
m of space within St Helier town centre within 4 units. The largest requirement comes
from clothing retailers who need between 300 sq m and 715 sq m of space.
2.109 At present therefore, there is little demand for space from comparison goods retailers and
service businesses registered on the Focus database. However, many retailers will not
register an interest in circumstances where they know that there are no substantial
opportunities for new stores coming forward. Also, the current market conditions mean
that retailers’ requirements for new shops and stores are depressed, and that a
peripheral location such as Jersey (in UK terms) is unlikely to be a priority. We would
expect that once economic conditions improve, and attractive new development
proposals to extend the primary shopping area in St Helier Town Centre are brought
forward, interest from comparison goods retailers and service businesses in opening
shops and stores in St Helier would increase substantially.
Jersey Retail Study 2008
30
3 Quantitative Need for New Retail Development
3.1 In this section, we examine the current retail performance of St Helier Town Centre, and
the non-central main food stores and retail warehouses on Jersey. We have also
assessed the quantitative expenditure capacity available to support further convenience
and comparison goods retail floorspace on the Island. This Study therefore includes the
preparation of up-to-date forecasts of the capacity for additional retail floorspace on the
Island, which will be supportable by increases in the population and expenditure of Island
residents and visitors. In this section, we describe our RECAP forecasting Model, and
set out our forecasts of the additional retail floorspace which will be supportable by
growth in available expenditure in the period up to 2025.
THE DTZ RECAP MODEL
3.2 There are a number of possible approaches to forecasting the amount of additional shop
floorspace supportable in any town, and the retail impact of proposed retail
developments. Some use driving time isochrones to define catchment areas, whilst
others use some form of gravity model of retail attraction; or a crude assessment of
overall market share of available expenditure, which is considered appropriate for the
proposed retail development. All need an assessment of existing shopping facilities in
the area, and the amount of expenditure available in the catchment area.
3.3 The effectiveness of the various forecasting methods varies considerably. Conventional
gravity models base the extent of the trade draw of different centres on their size, and on
theoretical measures of attractiveness and accessibility. In reality, other important
factors, including the type and quality of retailers, shoppers’ perceptions, the level of
parking provision, and the retail environment, can also influence the trading pattern.
Forecasts based on driving time isochrones to determine catchment areas rely heavily on
assumptions and judgement rather than measures of the actual pattern of shopping visits
from residential areas to shopping centres, foodstores and retail warehouses. Overall
market share-based methods are inherently unreliable, because they rely on estimates
derived from one location being applied to another with different catchment area
characteristics; and because the result depends substantially on the assumptions about
the extent of the catchment area in each location.
3.4 To overcome these and other problems of such approaches, DTZ uses its RECAP retail
capacity forecasting Model. The main difference between our approach and now out
dated gravity models is that the RECAP Model uses the results of a Household Interview
Survey to identify the actual shopping patterns in the catchment area. By this means, it is
Jersey Retail Study 2008
31

possible to model realistically existing flows of catchment area expenditure to town
centres, foodstores and retail warehouses; as the basis for predicting the existing and
future capacity for further retail development. It is therefore an empirical model not a
theoretical model.
3.5 In summary, the RECAP Model uses the results of the Household Interview Survey as its
objective measured ‘baseline’, using a conventional and widely accepted step by step
approach, to complete the following tasks:
• Calculate the total amount of convenience and comparison goods expenditure3
which is available within the 7 zones comprising the Island (as shown on the map
in Appendix 4);
• Allocate the available expenditure to St Helier Town Centre, and to the principal
non-central stores, based on the results of the Household Interview Survey of
shopping patterns (Appendix 4); so as to obtain estimates of current sales and
forecast future sales in each;
• Compare the estimated sales in the town centre, and non-town centre main
foodstores and retail warehouses, with existing floorspace (and in the case of main
foodstores and retail warehouses, with sales based on ‘benchmark’ levels of
estimated company average performance); so as to assess the current trading
performance of each shopping destination, and the capacity to support further
growth in floorspace.
3.6 The RECAP Model is a very useful tool for retail planning, which avoids the potential
inaccuracies arising from assumptions about existing trade draw patterns and market
shares which are often inherent in other forecasting methods. It is based on forecasting
methods which have been used and refined in a large number of retail studies on behalf
of public sector clients. In particular, forecasts made using the method on which the
RECAP Model is based have been accepted by Planning Inspectors and the Secretary of
State at many Public Inquiries in the UK. The RECAP Model was independently
validated in 2005 by the University of Plymouth as an appropriate forecasting method.
The Model has been used to prepare the expenditure and retail capacity forecasts set out
in this report.
3 Convenience goods are defined as food, alcoholic drink, tobacco products, newspapers and periodicals, non-durable
household goods.
Comparison goods are defined as clothing and footwear; household textiles and soft furnishings; furniture and floor coverings;
household appliances; audio visual equipment; hardware, DIY goods, decorating supplies; chemist and medical goods,
cosmetics and beauty products; books, jewellery, watches, china, glassware and kitchen utensils, recreational, personal and
luxury goods.
Jersey Retail Study 2008
32
3.7 It is important to remember that the RECAP Model (like any other forecasting model of
this type) is an exploratory tool, rather than a prescriptive mechanism. Thus, for
example, in preparing forecasts for future shop floorspace capacity, the Model is usually
run iteratively to explore the changes in the forecasting variables, such as in the pattern
of attraction of expenditure (the market shares) or in sales densities, which would be
necessary to support different levels of new development. Use of the Model in this way
indicates how well existing retailing is performing, illuminates sensitivities in variables,
and assists in making judgements about the realism of any given growth or impact
scenario.
3.8 When using the RECAP Model capacity forecasts as a guide to future planning policy, it
is also important to remember that the further ahead the forecasting date, the less certain
the forecast. Thus the forecasts for 2015 are more reliable than those for 2020 and
2025. In particular for these later dates, we suggest that forecasts such as these should
be treated with some caution, since they only indicate the broad order of magnitude of
retail capacity at those dates, if all of the forecast trends occur. For this reason we
recommend that the forecasts should be reviewed and revised by not later than about
2013 in the light of events, based on a new Household Interview Survey of shopping
patterns, so as to take account of the effects of any development which has occurred in
the meantime. Furthermore, the long term growth in the use of internet shopping is as
yet unknown (although it has to a substantial degree been taken into account in this
report), and reinforces the need to revise the forecasts of retail floorspace capacity well in
advance of 2025. An overview of the RECAP Model process is set out in Appendix 5.
3.9 The detailed RECAP Model tables are set out in Appendix 6, and this section should be
read in conjunction with that Appendix.
PRINCIPAL DATA INPUTS
Household Interview Survey
3.10 The catchment area for the purposes of the retail capacity forecasts was of course, the
whole of the Island of Jersey. This was sub-divided by reference to Parishes, taking
account of the location of St Helier and the smaller settlements, the principal road
pattern, and significant topographical features. After discussion with the States of Jersey
Statistics Unit and the Department of Planning and Environment, some of the Parishes
were grouped together, to form 7 zones for the purposes of the Household Interview
Survey and subsequent forecasting, as indicated in Table 3.1.
Jersey Retail Study 2008
33
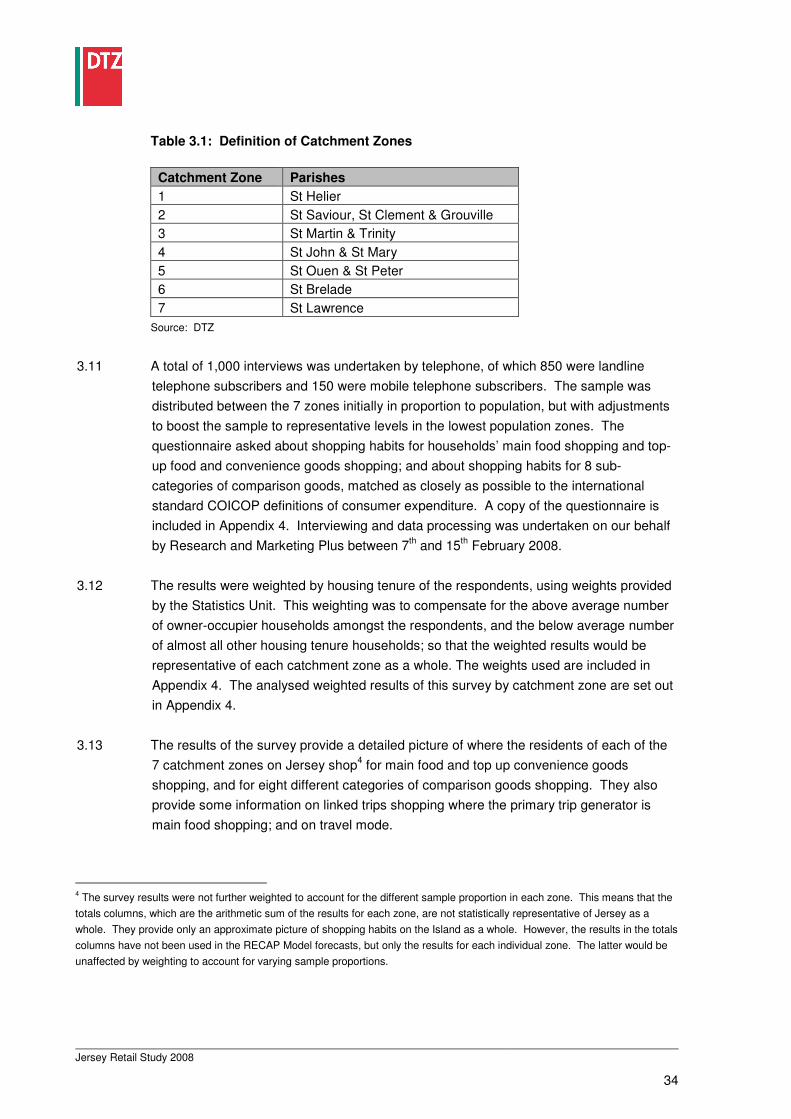
Table 3.1:
Definition of Catchment Zones
Catchment Zone Parishes
1 St Helier
2 St Saviour, St Clement & Grouville
3 St Martin & Trinity
4 St John & St Mary
5 St Ouen & St Peter
6 St Brelade
7 St Lawrence
Source: DTZ
3.11 A total of 1,000 interviews was undertaken by telephone, of which 850 were landline
telephone subscribers and 150 were mobile telephone subscribers. The sample was
distributed between the 7 zones initially in proportion to population, but with adjustments
to boost the sample to representative levels in the lowest population zones. The
questionnaire asked about shopping habits for households’ main food shopping and top-
up food and convenience goods shopping; and about shopping habits for 8 sub
categories of comparison goods, matched as closely as possible to the international
standard COICOP definitions of consumer expenditure. A copy of the questionnaire is
included in Appendix 4. Interviewing and data processing was undertaken on our behalf th th
by Research and Marketing Plus between 7 and 15 February 2008.
3.12 The results were weighted by housing tenure of the respondents, using weights provided
by the Statistics Unit. This weighting was to compensate for the above average number
of owner-occupier households amongst the respondents, and the below average number
of almost all other housing tenure households; so that the weighted results would be
representative of each catchment zone as a whole. The weights used are included in
Appendix 4. The analysed weighted results of this survey by catchment zone are set out
in Appendix 4.
3.13 The results of the survey provide a detailed picture of where the residents of each of the
7 catchment zones on Jersey shop4
for main food and top up convenience goods
shopping, and for eight different categories of comparison goods shopping. They also
provide some information on linked trips shopping where the primary trip generator is
main food shopping; and on travel mode.
4 The survey results were not further weighted to account for the different sample proportion in each zone. This means that the
totals columns, which are the arithmetic sum of the results for each zone, are not statistically representative of Jersey as a
whole. They provide only an approximate picture of shopping habits on the Island as a whole. However, the results in the totals
columns have not been used in the RECAP Model forecasts, but only the results for each individual zone. The latter would be
unaffected by weighting to account for varying sample proportions.
Jersey Retail Study 2008
34
Jersey Population
3.14 Population forecasts were provided by the States of Jersey, setting out the 2008
populations of each of the 7 catchment zones, together with trend based forecast
populations for 2010, 2015, 2020 and 2025. These population forecasts by zone are set
out in RECAP Model Table 1 in Appendix 6. They show the population of the Island as a
whole increasing from 90,800 in 2008 to 99,300 by 2025. This is an increase of about
9.4% over the period 2008 to 2025, or about 0.53% per annum. We understand that
these forecasts are compatible with those used for other aspects of the Island Plan
Review, such as housing development policies.
Forecasting Dates
3.15 We have prepared base year estimates of retail sales as at 2008, which is the year when
the Household Interview Survey was undertaken. Our forecasts have been prepared for
the years 2010, 2015, 2020 and 2025. As indicated above, the longer ahead of these
forecasts i.e. 2020 and 2025 should be treated as a broad guide only, and reviewed and
updated well before those dates.
Price Basis
3.16 All monetary values in this report are in constant 2005 prices, unless otherwise indicated.
Per Capita Expenditure
3.17 Information on average per capita expenditure in 2005 on convenience and comparison
goods, and the eight sub-categories of the latter, was obtained from Table 1.4 of the
Jersey Household Expenditure Survey 2004/5 (JHES) by the States of Jersey Statistics
Unit, and was the most up-to-date available. Before deducting expenditure on special
forms of trading, these amount to £1,919.48 for convenience goods and £2,335.48 for
comparison goods. These base figures are set out in RECAP Model Table 2 in Appendix
4.
We then deducted expenditure on Special Forms of Trading (SFT). This is principally
mail order, vending machines, party plan retailing and on-line shopping via the internet
and interactive TV; and is mainly expenditure not made in retail shops, so needs to be
removed from the Model before forecasting the capacity for additional shop floorspace.
RECAP Model Table 2 shows the growing deductions which we have made, based on
information for the UK published by Verdict on growth in internet shopping and forecast
trends5. Table 3.2 shows Verdict’s estimates for the proportion of all retail sales in the
5 ‘UK e-Retail 2008’, Verdict Research Limited, May 2008
Jersey Retail Study 2008
35
Table 3.2: UK Internet Shopping Estimates and Forecasts
Goods Type Online sales as proportion of all UK retail sales (%)
2007 2012
Food & grocery 3.3 10.0
Comparison goods:
Music & video
30.3
60.8
Electrical goods 15.1 34.5
Books 14.3 21.7
Homewares 7.7 21.2
DIY & gardening goods 3.8 8.7
Clothing & footwear 4.2 12.7
Furniture & floorcoverings 3.8 9.9
Health & beauty 2.2 4.8
Other comparison goods 3.7 11.3
All Comparison Goods 6.5 16.1
UK in 2007 accounted for by internet shopping, and its trend-based forecasts for 2012.
This shows the proportion of sales taking place via the internet more than doubling over
the 5 years to 2012. For some categories of comparison goods, the internet proportion is
already substantial and is expected to become much more so. Based on these, we have
judged the deductions for SFT shown in RECAP Model Table 2. Our deductions:
• assume a flattening of the growth trend after 2012;
• allow for the fact that some internet purchases of food are sourced and delivered
from foodstores rather than separate warehouses (and should therefore be included
in the Model);
• allow for internet shopping to supplant mail order retailing to some degree, but
include other SFT apart from the internet.
Source: ‘UK e-Retail 2008’, Verdict Research Limited, May 2008
3.18 RECAP Model Table 2 also indicates the breakdown of per capita comparison goods
expenditure into the eight different categories of comparison goods expenditure covered
by Questions 6 to 13 in the Household Interview Survey; and the different deductions for
each category which we have made to account for SFT, again based on the information
in Table 3.2 published by Verdict. We consider that it is reasonable to base the SFT
deductions on UK experience of internet shopping. Whilst no directly comparable data
with the Verdict data for the UK exists for Jersey, the results of the Household Interview
Jersey Retail Study 2008
36
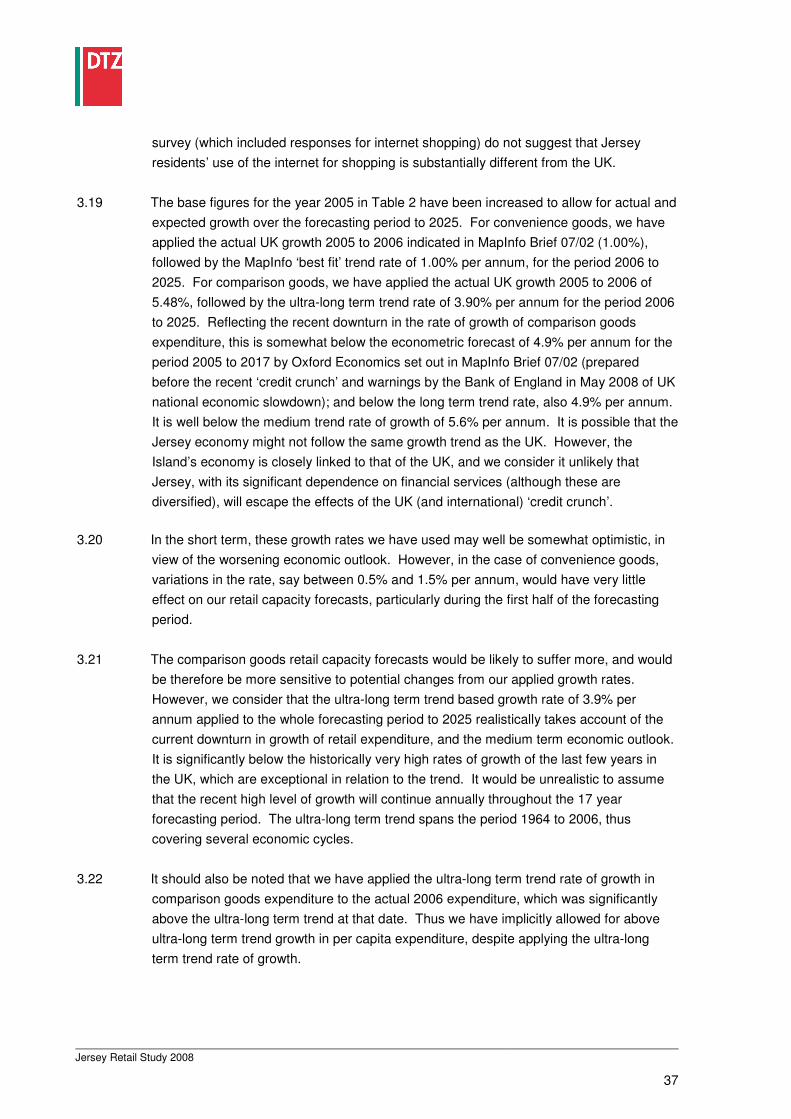
survey (which included responses for internet shopping) do not suggest that Jersey
residents’ use of the internet for shopping is substantially different from the UK.
3.19 The base figures for the year 2005 in Table 2 have been increased to allow for actual and
expected growth over the forecasting period to 2025. For convenience goods, we have
applied the actual UK growth 2005 to 2006 indicated in MapInfo Brief 07/02 (1.00%),
followed by the MapInfo ‘best fit’ trend rate of 1.00% per annum, for the period 2006 to
2025. For comparison goods, we have applied the actual UK growth 2005 to 2006 of
5.48%, followed by the ultra-long term trend rate of 3.90% per annum for the period 2006
to 2025. Reflecting the recent downturn in the rate of growth of comparison goods
expenditure, this is somewhat below the econometric forecast of 4.9% per annum for the
period 2005 to 2017 by Oxford Economics set out in MapInfo Brief 07/02 (prepared
before the recent ‘credit crunch’ and warnings by the Bank of England in May 2008 of UK
national economic slowdown); and below the long term trend rate, also 4.9% per annum.
It is well below the medium trend rate of growth of 5.6% per annum. It is possible that the
Jersey economy might not follow the same growth trend as the UK. However, the
Island’s economy is closely linked to that of the UK, and we consider it unlikely that
Jersey, with its significant dependence on financial services (although these are
diversified), will escape the effects of the UK (and international) ‘credit crunch’.
3.20 In the short term, these growth rates we have used may well be somewhat optimistic, in
view of the worsening economic outlook. However, in the case of convenience goods,
variations in the rate, say between 0.5% and 1.5% per annum, would have very little
effect on our retail capacity forecasts, particularly during the first half of the forecasting
period.
3.21 The comparison goods retail capacity forecasts would be likely to suffer more, and would
be therefore be more sensitive to potential changes from our applied growth rates.
However, we consider that the ultra-long term trend based growth rate of 3.9% per
annum applied to the whole forecasting period to 2025 realistically takes account of the
current downturn in growth of retail expenditure, and the medium term economic outlook.
It is significantly below the historically very high rates of growth of the last few years in
the UK, which are exceptional in relation to the trend. It would be unrealistic to assume
that the recent high level of growth will continue annually throughout the 17 year
forecasting period. The ultra-long term trend spans the period 1964 to 2006, thus
covering several economic cycles.
3.22 It should also be noted that we have applied the ultra-long term trend rate of growth in
comparison goods expenditure to the actual 2006 expenditure, which was significantly
above the ultra-long term trend at that date. Thus we have implicitly allowed for above
ultra-long term trend growth in per capita expenditure, despite applying the ultra-long
term trend rate of growth.
Jersey Retail Study 2008
37
3.23 The combined effect of the forecast growth in population and in per capita expenditure is
that we expect total expenditure by Jersey residents on convenience goods (set out in
Table 3 in Appendix 4) to increase by about £42.6 m (24.2%) over the period 2008 to
2025; and total catchment area expenditure on comparison goods to increase by about
£185.1m (84.2%) over the same period. This compares with expected growth in total
catchment area population of approximately 9.4% over the period. Thus just over one
third of the growth in catchment area expenditure on convenience goods is due to
expected growth in population; but only a small proportion of the growth in catchment
area expenditure on comparison goods (just over one tenth) is accounted for by forecast
growth in population. This means that the comparison goods floorspace capacity
forecasts in particular are very insensitive to the population growth assumptions and
much more sensitive to the assumptions about growth in per capita expenditure and
growth in SFT, particularly in the later part of the forecasting period. Thus if the Island
Plan Review eventually results in marginally different planned population increases from
those already allowed for in RECAP Model Table 1, there will be very little practical effect
on the retail capacity forecasts, particularly for comparison goods.
Shopping Patterns in the Catchment Area
3.24 As indicated above, we undertook a Household Interview Survey of shopping patterns in
February 2008. We have included the detailed tables of results in Appendix 4. We have
used the results as a key input to our RECAP Forecasting Model in Appendix 6. Thus for
St Helier Town Centre for example, in Table 5 we have combined the results from
Question 2 about main food shopping with those from Question 5 about top up food and
convenience goods shopping, to provide a weighted average market share of total
convenience goods expenditure in each zone which is attracted to main foodstores and
other convenience goods shops in St Helier Town Centre. These weighted averages are
then rounded to the nearest integer and used in Table 7 to indicate the pattern of
attraction of convenience goods expenditure to shops and stores in St Helier Town
Centre. A similar approach has been used for the non-central foodstores (Tables 13 and
15) in Appendix 6.
3.25 In the case of comparison goods, for St Helier Town Centre, we have applied the results
of the Household Interview Survey for each of the eight categories of comparison goods,
weighting the market shares for each according to per capita expenditure on each
category (as indicated by the JHES); to provide a weighted average market share of all
comparison goods expenditure which is attracted from each zone by shops and stores in
the town centre. The market shares for each individual goods category and the weighted
averages are set out in Table 6; the final column (weighted average), of which is rounded
to the nearest integer, and applied in Table 7 to indicate the market shares of all
Jersey Retail Study 2008
38
comparison goods expenditure attracted from each zone by shops in St Helier Town
Centre. Similar tables apply to the non-central comparison goods shopping destinations
in Jersey, i.e. Tables 14 and 15.
3.26 The RECAP Model includes provision for a market shares correction factor, in
circumstances where use of Household Interview Survey results without correction would
result in unrealistic base year sales estimates, compared with independently derived
assessments. This can sometimes be the case, for example to correct anomalies which
occur if some respondents misinterpret the Household Interview Survey questions.
However, in the case of Jersey, it has not been necessary to apply market share
correction factors, because use of the survey results without alteration results in realistic
base year sales densities for St Helier Town Centre and for the principal non-central
stores. The market shares correction factors in Tables 7 and 15 are therefore 100%, i.e.
no corrections have been made to the market shares indicated by the Household
Interview Survey, because none were needed.
Visitor Expenditure
3.27 We have allowed for some expenditure in Jersey by visitors who live elsewhere. Jersey
is still clearly a substantial destination for visitors, both those who come on business and
tourists. In this case, we have relied upon the estimate of visitors’ expenditure in the
Jersey Annual Statistical Report. This estimated total expenditure in Jersey by visitors in
2007 to be £234m, of which £42.12m (18%) was expenditure in retail shops (both in 2007
prices). We converted this to 2005 prices (for compatibility with the price basis of the
RECAP Model), apportioned it between convenience and comparison goods, and
between St Helier Town Centre and the non-central stores; and then expressed it in the
RECAP Model as a percentage uplift of the expenditure by Island residents. The result
was that we have allowed for an additional 7.5% of residents’ expenditure on
convenience goods in St Helier Town Centre and an additional 4% of residents’
expenditure on convenience goods in the non-central foodstores. For comparison goods
we have allowed for an additional 20% of residents’ expenditure in St Helier Town
Centre, to account for expenditure by visitors.
Existing Shop Floorspace
3.28 For main food stores in St Helier Town Centre and the non-town centre main food stores,
we have used data supplied by the Department of Planning and Environment,
supplemented where necessary with data from our own inspections of the stores; and in
the case of stores operated by the Jersey Co-operative Society, with details of store
floorspace supplied by the Society. Details of these shops and stores are set out in
Table 10 (St Helier Town Centre) and 18 (non-central).
Jersey Retail Study 2008
39
3.29 For comparison goods floorspace in St Helier Town Centre, we have used data supplied
by the Department of Planning and Environment, sourced from Experian Goad. To this
we have added the net comparison good sales area in the relevant main food stores, and
subtracted loss of comparison goods floorspace due to the impending closure of the Co
op Homemaker store. The resulting total comparison goods shop floorspace in St Helier
Town Centre is estimated as 51,762 sq m net in 2008, falling to 49,578 sq m net from
2010 owing to the Homemaker store closure. This figure is included in RECAP Model
Table 12, Appendix 6. For non-central retail warehouses, we have used data supplied by
the Department together with on-site inspections.
3.30 It should be noted that we have not included in the RECAP Model either the market
shares of expenditure or the floorspace in the small village shops, farm shops and other
isolated shops. This is because these outlets are too small to show up in the results of
the Household Interview Survey and enable their market shares to be modelled reliably;
and because reliable data on their floorspace is not available. It is also because such
shops often change, thus undermining the reliability of the forecasts. The RECAP Model
does not therefore model 100% of Island expenditure. However, it models 87.7% of all
convenience goods expenditure and 93.9% of all comparison goods expenditure; with the
remainder being accounted for by the categories of shops outlined above, and by off-
Island shopping. It is also important to note that the RECAP Model is a growth allocation
model, which allocates growth in expenditure to shopping destinations based on the
results of the Household Interview Survey, and if appropriate, exploratory judgements
about how this pattern of market shares might change in the future. It does not therefore
depend upon precise identification of all existing shop floorspace.
Sales Densities in Main Food Stores
3.31 For the existing main food stores in St Helier Town Centre and the non-central main food
stores we have applied estimated company average convenience goods sales densities
based on information for UK food retailers published by Verdict. These are set out in
Tables 10 and 18 for St Helier Town Centre and the non-central stores respectively.
3.32 For the larger foodstores, we have applied ‘benchmark’ sales densities based on the
average of the company averages for Morrisons, Sainsburys, Tesco, and Somerfield.
Asda has been excluded because its sales density is significantly higher owing to the
narrowly defined (and untypical) way it measures its stores. Waitrose has been excluded
as being untypical of the foodstores on Jersey (and more akin to Marks & Spencer);
whilst UK Co-ops have been excluded because they operated mainly small local
convenience goods stores rather than large supermarkets. This results in a ‘benchmark’
convenience goods sales density for the convenience goods floorspace in the larger
foodstores on Jersey of £10,007 per sq m net.
Jersey Retail Study 2008
40
3.33 For the smaller foodstores, we have applied ‘benchmark’ sales densities based on the
average of the company averages for UK Co-operative Societies and Somerfield; both of
which operate stores of similar retail formats to the small foodstores on Jersey. This
results in a ‘benchmark convenience goods sales density for the convenience goods
floorspace in the smaller foodstores on Jersey of £6,282 per sq m net. For the M&S
stores, we have applied the UK company average for Marks & Spencer’s food sales
floorspace.
3.34 The retail capacity forecasts are dependent upon these ‘benchmark’ sales densities
adopted as being realistic ‘equilibrium’ trading levels for the existing main foodstores on
Jersey. The higher the ‘benchmark’, the lower the forecast capacity for additional
floorspace, and vice-versa. ‘Benchmarks’ are normally based on each retailer’s company
average sales density for a large number of stores, as indicating realistic trading
performance for that company’s existing stores. This does not work reliably where each
company has only a small number of stores, as in Jersey; and does not indicate what
would be a reasonable level of trade for the existing stores, bearing in mind their location,
size, retail format, range of goods, physical form and layout, car parking and accessibility,
etc. We therefore consider that it is more realistic to base the ‘benchmarks’ on averages
of the company averages of groups of UK retailers, because these are derived from very
large numbers of stores, thus minimising in the calculation the peculiarities of individual
stores and their local markets.
3.35 Having inspected all the large supermarkets on the Island, we consider that in terms of
their retail formats and ranges of goods, and their use by Island residents as indicated by
the results of the Household Interview Survey, they are in effect functioning within the
Jersey context as main food shopping stores in a similar way to superstores and large
supermarkets in the UK. We consider that the buildings as currently fitted out and
occupied are capable of trading at sales densities similar to those of the principal UK
foodstore operators. From information provided to us by the Co-op and Sandpiper, the
‘benchmarks’ we have adopted for the large supermarkets are below the current trading
average of one of these operators and above that of the other. If we had adopted
significantly lower ‘benchmarks’, we would have built into our forecasts a substantial
measure of impact upon these existing stores. The forecasts would then no longer have
been forecasts of quantitative need for additional floorspace. However, we have
investigated the sensitivity of the convenience goods forecasts to the use of a
substantially lower ‘benchmark’ sales density, as described below.
3.36 We have not made any allowance within the ‘benchmarks’ for above-UK costs of
operating foodstores in Jersey. This is because we understand that some costs are
above UK retailers’ costs (eg shipping costs for some retailers), and some below (eg
taxes and social security payments). On balance, we considered that no such
exceptional costs allowances should be made.
Jersey Retail Study 2008
41
Retail Destinations
3.37 We have distinguished between St Helier Town Centre, and non-central principal
foodstores and retail warehouses. This is both for forecasting convenience, and because
it provides a more reliable set of forecasts than if town centre and non-central shopping
was lumped together. The Household Interview Survey provides detailed information on
shopping patterns, distinguishing between use of the town centre and of the non-central
stores. This enables us to distinguish between the retail performance of the town centre
and that of the non-central shopping, for example in our Retail Sector Analysis described
below. However, as discussed below and in Section 5, we consider that new retail
development should be located where it can strengthen existing centres wherever
possible, and in retail formats appropriate to its location. Thus much of the forecast need
should be accommodated in or on the edge of St Helier Town Centre as far as possible,
even though the capacity for some of it is calculated as non-central shopping for
forecasting convenience and reliability.
Development Scenarios Assessed
3.38 We have assessed one scenario for development. This is Scenario 1 – the ‘baseline’
scenario, which assumes that there will be no change in the shopping patterns on the
Island through the period to 2025, despite the Liberty Wharf development in St Helier
Town Centre. This effectively assumes that improvement in the attractiveness of St
Helier as a result of Liberty Wharf will be exactly matched by improvement in the
attractiveness of the other shopping destinations
3.39 The results of the Household Interview Survey show that Jersey is retaining very high
market shares of total Island expenditure, and whilst off-Island shopping occurs, it
accounts for only small market shares of expenditure. It is therefore not possible for
market shares to be increased significantly by means of attractive new retail
development. We have therefore not modelled a second or subsequent scenarios,
because development scenario modelling is about assessing the degree to which new
retail development can become partially self-supporting by attracting increased market
shares of available expenditure from a catchment area. In the case of Jersey, the
opportunities are only for displacement of market share from one location to another, for
example from St Helier Town Centre to a new location on the Island. However, we have
undertaken some testing within Scenario 1, to assess how changes in key variables,
such as population or ‘benchmark’ sales densities for foodstores, might affect the retail
capacity forecasts, and thus alter our overall conclusions.
Jersey Retail Study 2008
42
Format of the RECAP Model Tables
3.40 The detailed RECAP Model Tables are set out in Appendix 6. Table 1 sets out the
population forecast for each of the 7 catchment zones. Table 2 indicates per capita
expenditure, growth in that expenditure, and growth in SFT. Table 3 is total catchment
area expenditure by zone for convenience and comparison goods over the period 2008 to
2025. Table 4 indicates total catchment area expenditure by zone in 2008 in each of the
8 categories of comparison goods.
3.41 In Scenario 1, for St Helier Town Centre, Tables 5 and 6 set out the pattern of market
shares of catchment area convenience and comparison goods expenditure respectively,
and the weighted averages of each, which are attracted from the catchment area to that
destination. The market shares in Table 7 are based on the weighted averages set out in
Tables 5 for convenience goods, and 6 for comparison goods. Table 8 shows the
expenditure attracted on each of the 8 comparison goods categories, together with the
resulting overall market shares of such expenditure currently attracted by the town
centre. It is the product of Table 4 (catchment area expenditure by comparison goods
product group) and Table 7 (detailed market shares by comparison goods product
group). Table 9 is the product of Table 3 (catchment area expenditure) and Table 7. It
indicates the convenience and comparison goods expenditure attracted from each
catchment zone by St Helier Town Centre at each date. Table 10 sets out the sales
potential of the existing main food stores at estimated ‘benchmark’ levels; whilst Table 11
indicates the sales potential of committed new developments in the town centre, in this
case Liberty Wharf and re-use of the former Co-op Homemaker store.
3.42 Table 12 compares the expenditure attracted by St Helier Town Centre and hence sales,
with existing shop floorspace. The top line of Table 12 (spending by catchment area
residents) is taken from the bottom line of Table 9. An uplift for visitor expenditure is then
added in, as described above. As appropriate, an allowance (of 1.5% pa for comparison
goods) is made for the average sales density of the existing shops to increase in real
terms, following the trend towards higher town centre sales densities in most town
centres, and to help ensure the long term prosperity of the existing town centre.
3.43 A similar arrangement of tables for Scenario 1 applies to the non-central shops and
stores in Jersey (Tables 13 to 21 in Appendix 6).
3.44 Tables 22 and 23 set out the combined market shares of total Island expenditure
attracted by St Helier Town Centre and the Non-central Shopping. They show the high
market shares, between 72 and 94% from different catchment zones for convenience
goods, as in Table 23, and amounting to 87.7% for Jersey as a whole; and between 90
and 98% overall for the 8 comparison goods categories, as in Table 22, amounting to
93.9% for the Island as a whole. The balances of market shares are accounted for by
Jersey Retail Study 2008
43
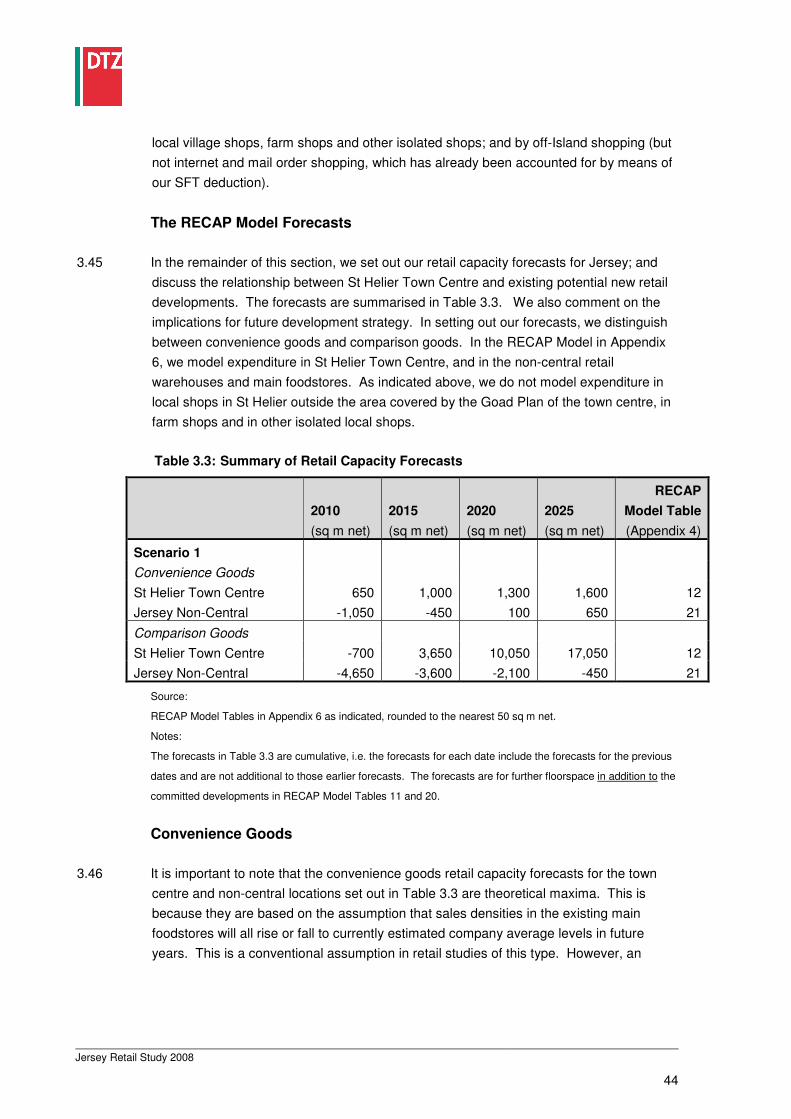
Table 3.3: Summary of Retail Capacity Forecasts
Scenario/Goods/Location
2010
(sq m net)
2015
(sq m net)
2020
(sq m net)
2025
(sq m net)
RECAP
Model Table
(Appendix 4)
Scenario 1
Convenience Goods
St Helier Town Centre
Jersey Non-Central
650
-1,050
1,000
-450
1,300
100
1,600
650
12
21
Comparison Goods
St Helier Town Centre
Jersey Non-Central
-700
-4,650
3,650
-3,600
10,050
-2,100
17,050
-450
12
21
local village shops, farm shops and other isolated shops; and by off-Island shopping (but
not internet and mail order shopping, which has already been accounted for by means of
our SFT deduction).
The RECAP Model Forecasts
3.45 In the remainder of this section, we set out our retail capacity forecasts for Jersey; and
discuss the relationship between St Helier Town Centre and existing potential new retail
developments. The forecasts are summarised in Table 3.3. We also comment on the
implications for future development strategy. In setting out our forecasts, we distinguish
between convenience goods and comparison goods. In the RECAP Model in Appendix
6, we model expenditure in St Helier Town Centre, and in the non-central retail
warehouses and main foodstores. As indicated above, we do not model expenditure in
local shops in St Helier outside the area covered by the Goad Plan of the town centre, in
farm shops and in other isolated local shops.
Source:
RECAP Model Tables in Appendix 6 as indicated, rounded to the nearest 50 sq m net.
Notes:
The forecasts in Table 3.3 are cumulative, i.e. the forecasts for each date include the forecasts for the previous
dates and are not additional to those earlier forecasts. The forecasts are for further floorspace in addition to the
committed developments in RECAP Model Tables 11 and 20.
Convenience Goods
3.46 It is important to note that the convenience goods retail capacity forecasts for the town
centre and non-central locations set out in Table 3.3 are theoretical maxima. This is
because they are based on the assumption that sales densities in the existing main
foodstores will all rise or fall to currently estimated company average levels in future
years. This is a conventional assumption in retail studies of this type. However, an
Jersey Retail Study 2008
44
average is only an average; and the more attractive stores will continue to trade at levels
above the company average, whilst others may trade successfully below the average. In
addition, company average sales densities may well rise as food retailers become more
efficient. It would therefore not be realistic to plan on the basis that such an across the
board reduction in sales densities should or would occur.
3.47 It is also important to note that the capacity for non-central floorspace in Jersey was
forecast separately from that for St Helier Town Centre merely for forecasting
convenience and reliability. In deciding how these forecast needs should be
accommodated therefore, other spatial and economic issues should be taken into
account. In the interests of sustainability and social inclusion and to support St Helier
Town Centre, it would be desirable to give priority to town centre and edge-of-centre
sites, over out-of-centre locations. The town centre is the location most accessible by
public transport from the whole Island, thus enabling access by those who do not have
the use of a car, and facilitating switching from car to public transport. It is also the
location where one journey can serve several purposes, thus helping to minimise the
need to travel.
St Helier Town Centre
3.48 Scenario 1, RECAP Model Table 12 shows that in 2008, we estimate that the main
foodstores and other conveniences goods shops in St Helier Town Centre were
achieving combined sales of £57.4m; at a combined average sales density of £8,747 per
sq m net. Table 10 shows that based on the ‘benchmark’ sales densities (described
above), the combined sales density of these stores in 2008 would be £7,164 per sq m
net. Thus, these stores as a group are estimated to be trading at somewhat above the
‘benchmark’ level.
3.49 In Table 12, we have allowed for sales in the existing convenience goods shops as a
group, to fall to the level based on the ‘benchmark’ level. On this basis, summary Table
3.3 above shows that there will be capacity for about 650 sq m net of additional
convenience goods floorspace in 2010 in St Helier Town Centre. This should rise to
about 1,600 sq m net in 2025, if forecast trends occur.
3.50 These forecasts are on the basis that the additional floorspace would be provided in the
form of modern food superstore floorspace, trading at £13,000 per sq m net, which would
be a realistic level for the food superstore retailers which have expressed interest in
operating stores on Jersey. However, the format of the store(s) and identity of the
operator(s) would alter the forecast capacity. In the event that the additional floorspace
was provided solely in the form of deep discount supermarkets, for example, the capacity
would be more than double the forecasts, because of the lower sales densities achieved
Jersey Retail Study 2008
45
by such retailers (in the UK, the average of the estimated convenience goods company
average sales densities for Aldi, Lidl and Netto was £5,432 in 2006).
Jersey Non-Central Stores
3.51 Scenario 1, Table 21 shows that in 2008, the main non-central foodstores in Jersey were
estimated to be achieving combined sales of £105.0m; at a combined average sales
density of £8,174 per sq m net. This is somewhat below the ‘benchmark’ level of £8,942
per sq m net, indicated in Table 18. Thus, these stores as a group are estimated to be
trading at slightly below the level based on estimated UK company averages. This is
broadly corroborated by confidential information provided to us by retailers.
3.52 In Table 21, we have allowed for sales in the existing convenience goods shops as a
group, to rise to the ‘benchmark’ level. On this basis, summary Table 3.3 above shows
that capacity for additional floorspace will not start to arise until about 2020, if forecast
trends occur. Indeed, Table 3.3 shows that there is currently a moderate over-supply of
convenience goods floorspace in non-central stores, which will reduce over time as a
result of growth in population and per capita expenditure.
3.53 Taking Jersey as a whole, the convenience goods forecasts in Table 3.3 for St Helier
Town Centre and the Non-central stores show that there is no expenditure-based
capacity to support additional convenience goods floorspace on the Island at the present
time.6
Capacity will not start to arise until about 2012; but by 2025 forecast capacity will
be approaching that required to support a new superstore of 5,000 sq m gross, if forecast
trends occur. However, this should be reviewed and such a need validated much nearer
to that date, taking account of changes in the forecasting variables which had occurred in
the meantime.
3.54 This conclusion that there is currently no quantitative need for any additional foodstores is
broadly corroborated by a comparison with the Isle of Wight. The latter currently has
0.12 sq m net sales area of main foodstores per resident for a population of 138,500,
compared with Jersey’s 0.14 sq m per resident for a population of 90,800.
3.55 A new superstore of about 5,000 sq m gross would be likely to generate convenience
goods sales of about £35m. RECAP Model Tables 12 and 21 show that the total
convenience goods sales in the existing main food stores and other convenience goods
shops included in the Model would be almost £179m in 2015. Because Jersey is an
island and so modelled market shares cannot be increased (except at the expense of the
6 Since we undertook the Household Interview Survey and completed the forecasts, an Iceland frozen foods store has opened
in part of a Wine Warehouse in St Helier. This is one of the isolated convenience goods outlets not included in the RECAP Model; and is in any case replacement of one form of convenience goods outlet with another, with no increase in floorspace. However, because it is an additional small foodstore, it reinforces our conclusion that there is no quantitative need for additional foodstores on the Island.
Jersey Retail Study 2008
46
small village convenience goods stores and other isolated shops not included in the
Model), if a new superstore of this size was opened in 2015, it would have an average
impact on the existing main food stores included in the Model of almost 20% of their
forecast 2015 sales. If it opened significantly earlier than 2015, the impact would be
greater (almost 21% at 2010). Of course, this impact would be uneven, and would be
likely to fall disproportionately upon the large supermarkets, some of which would suffer a
much greater impact (with lesser impacts upon the smaller foodstores).
3.56 To assess the sensitivity of the forecasts to variations in the ‘benchmark’ sales densities,
we have tested the ‘benchmark’ sales densities in the existing main foodstores which
would be implied by the development of a 5,000 sq m gross food superstore opening in
2010. For our forecasts to demonstrate sufficient expenditure to support such a store in
full by that date, the ‘benchmark’ average sales density for the large and small foodstores
included in the RECAP Model would have to fall to £5,835 per sq m net, which is slightly
below the 2006 average for UK Co-op stores. This would be about 7% lower than the
benchmark’ figure we have used for the small stores, and about 42% below the figure
which we have used for the large stores, both as described above. This implies impacts
of about those levels on the small and large stores respectively.
3.57 UK Co-op stores are mainly much smaller than the 6 large supermarkets on Jersey (4 of
which are operated by Sandpiper rather than the Jersey Co-op) and fulfil mainly a local
‘top-up’ convenience shopping role, rather than a main food shopping role. In contrast,
the large supermarkets on Jersey are used substantially for main food shopping. They
are not therefore comparable with UK Co-op stores. In view of the size and nature of
these six larger stores (five non-central and Checkers Express in St Helier Town Centre),
we consider that such a low ‘benchmark’ would be wholly unrealistic; and would amount
to a very substantial impact upon them. Use of such a low ‘benchmark’ sales density for
the existing stores would mean that our forecast would no longer be a forecast of
quantitative need for new floorspace, because it would contain a large amount of impact
on existing stores. None of these is substantially overtrading, and some are undertrading
when assessed against realistic ‘benchmarks’.
3.58 This means that if a new food superstore was to be developed in the next few years, at
least one of the existing large non-central foodstores would be highly likely to close.
There may also be closure of some local village convenience stores and some small food
specialists. We estimate that in retail capacity terms, a new superstore would require a
population increase of about 20,000 above the increases already included in the RECAP
Model (almost 7,000 people from 2008 to 2025) to support it fully without adverse impact
on the existing foodstores. However, as discussed in Section 4 below, there is a
qualitative need case for one or two deep discount supermarkets at an early date, despite
the absence of forecast capacity to support them.
Jersey Retail Study 2008
47
Comparison Goods
St Helier Town Centre
3.59 In Appendix 6, Scenario 1, Table 12 shows that we estimate St Helier Town Centre to be
achieving an average sales density for comparison goods in 2008 of about £4,105 per sq
m net. Based on our retail studies of a large number of other town centres, we consider
that this is a low sales density for a centre the size and nature of St Helier. This is
generally corroborated by our interviews with retailers and the results of our postal survey
of retailers, which suggest that there is too much retail floorspace for current needs,
following the decline in visitors to the Island. On this basis, Table 3.3 shows that after
allowing for the Liberty Wharf development there will be a small theoretical oversupply of
comparison goods floorspace of about 700 sq m net in 2010, falling to a balance between
supply and demand by 2011, if forecast trends occur. Capacity for additional comparison
goods floorspace in St Helier Town Centre will start to arise thereafter, and will reach
about 17,050 sq m net by 2025 in addition to the comparison goods floorspace in the
Liberty Wharf development, if forecast trends occur.
3.60 These capacity forecasts are on the basis that sales in the existing town centre
floorspace will grow at 1.5% per annum (in real terms) throughout the forecasting period,
from the current low base of £4,105 per sq m net. In view of this current low average
sales density for the town centre as a whole, it might perhaps be considered that the
existing retail floorspace has the capacity to grow its sales at a greater rate than 1.5% per
annum, thus reducing the retail capacity forecasts below those set out in Table 3.3.
However, much of the existing stock of floorspace is in the form of small shops in old
buildings, which do not provide the size of floorplates required by modern multiple
retailers. This constrains the potential for sales density increases in the existing shops.
It also means that new multiple retailers cannot easily be attracted without development
of new floorspace. We therefore consider that an allowance of 1.5% per annum for
sales density increases in the existing shops is realistic; and will allocate sufficient
expenditure to new floorspace to make the attraction of new retailers possible in due
course.
Non-central Locations
3.61 RECAP Model Table 21 shows that the non-central retail warehouses and comparison
goods floorspace in the 5 large supermarkets as a group are achieving combined
comparison goods sales of £30.1m, at an average sales density of £2,255 per sq m net.
This is a little less than the ‘benchmark’ average sales density for these stores in 2004,
£2,451 per sq m net, in Table 19. Thus these stores as a group are slightly undertrading.
In Table 21, we have allowed the average sales density of the existing stores as a group
to rise to the ‘benchmark’ level (increased from the 2004 figure in Table 19 at 1.5% per
Jersey Retail Study 2008
48
annum in real terms), before allocating expenditure to support new floorspace. Table 3.3
shows that on this basis (and after allowing for committed developments), there will be no
capacity for additional comparison goods floorspace in non-central food stores and retail
warehouses throughout the forecasting period to 2025. Indeed, the forecasts show that
after allowing for the committed developments, there is currently a moderate theoretical
oversupply of non-central comparison goods floorspace, most of which will be steadily
made good throughout the forecasting period, if forecast trends occur.
Comparison Goods Retail Sector Analysis
3.62 To assist with assessing the need for additional retail floorspace in St Helier and
elsewhere in Jersey, we have undertaken an analysis of the market shares of catchment
area expenditure on each of the eight sub-categories of comparison goods, which each
shopping destination is attracting from the catchment area in 2008. RECAP Model Table
4 in Appendix 6 sets out the available catchment area expenditure on each of the eight
comparison goods categories. Tables 6 and 14 indicate the pattern of market shares of
such goods which the Household Interview Survey indicates as being attracted from the
catchment area by St Helier Town Centre, and by retail warehouses and non-central food
stores respectively. The product of these Tables with Table 4 is set out in Tables 8 and
16. These latter tables also indicate the overall market share of expenditure on each
comparison goods sub-category, which is estimated to be attracted by each shopping
destination. These market shares are repeated (rounded to integers) in Table 22.
3.63 Table 22 shows that there is some variation between the market shares attracted by St
Helier Town Centre for each of the eight comparison goods categories. The highest is
the ‘all other comparison goods’ category, for which the town centre attracts 94% of total
Island expenditure in retail shops; followed by clothing and footwear with 86% of
expenditure attracted. All the above categories are lower but still above 70%, with the
exception of hardware DIY and garden goods, for which St Helier Town Centre attracts
only 44% of expenditure. This is not surprising, because the retail warehouses are
attracting significant expenditure on these ‘bulky goods’ categories, in particular the B&Q
store for DIY and garden goods. Table 22 therefore shows the market dominance of the
town centre for comparison goods, and non-bulky comparison goods in particular; and its
somewhat more limited role (in common with most town centres) as a location for ‘bulky
goods’ shopping.
3.64 The pattern of attraction of expenditure by non-central stores is approximately a ‘mirror
image’ of that for the town centre, with negligible market shares for the non-bulky goods
categories of clothing and footwear, and ‘other comparison goods’ respectively; and
higher market shares for the ‘bulky goods’ categories.
Jersey Retail Study 2008
49
3.65 When the market shares attracted by the town centre are combined with those attracted
by retail warehouses and non-central superstores, the overall market shares retained on
the Island as a whole vary from 90% (clothing and footwear) to 98% (household
appliances). These are high market shares. The balance of 100% is accounted for by
local shops in St Helier outside the Goad Plan area, small shops in village centres, farm
shops and other isolated shops, which are not included in the RECAP Model; and off-
Island shopping. Being 90% or more, these high combined market shares do not
indicated any conspicuous weakness in the availability of particular comparison goods
categories on the Island. They suggest that the retail market has been working well to
deliver a wide and balanced range of comparison goods from a variety of retail formats.
USE AND REVIEW OF THE FORECASTS
3.66 Finally, and in accordance with our usual practice, we must emphasise that all
expenditure based forecasts of future shop floorspace capacity are based on imperfect
data and contain a number of assumptions. Our forecasts set out in this report are based
on the most up-to-date and reliable information currently available to us. However, they
are intended as an indication of the likely order of magnitude of future shop floorspace
capacity (if forecast trends are realised) rather than as growth targets or rigid limits to
future growth. The forecasts should be periodically revised as necessary in the light of
actual population and expenditure growth, and as development proceeds and its effects
become measurable.
Jersey Retail Study 2008
50
4 Qualitative Retail and Town Centre Needs
4.1 In this Section, we discuss qualitative retail planning and development needs in Jersey,
based principally on our visits to the Island, our inspections of St Helier Town Centre and
other retailing, and our extensive experience elsewhere. However, we have also taken
account of the results of our surveys and consultations.
Convenience Goods Shopping
4.2 There is now a large number of shops and stores on Jersey selling food and other
convenience goods. These include:
• Five large non-central supermarkets selling a wide range of foodstuffs covering
the mass middle market and together attracting a substantial proportion of all
households’ expenditure on main food shopping (approximately half).
• Five Marks & Spencer stores (including the store in St Helier Town Centre)
selling high quality prepared foods.
• A substantial number of small supermarkets and local convenience stores both in
St Helier Town Centre and in village centres and elsewhere, selling mass middle
market foodstuffs.
• One specialist Iceland frozen foods store, with others planned for incorporation
into existing food outlets.
• A number of small specialist food shops, mainly in St Helier Town Centre, but
including out-of-centre wine shops.
• Market stalls in Central and Beresford Markets selling a range of specialist foods,
some of high quality, such as the fish shops in Beresford Market.
• Farm shops in the rural areas selling increasing ranges of local fresh and
preserved foods.
4.3 Together, these outlets provide a wide range of foods covering the upper and middle-
mass markets. However, there are no deep discount foodstores on the Island at present.
In the UK and continental Europe, these are typically of up to about 1,300 sq m gross,
operated by companies such as Aldi, Lidl and Netto. They sell limited ranges of foods
(typically several hundred lines, compared with many thousands in large supermarkets
and superstores); together with increasing ranges of non-food goods. The absence of
such stores on Jersey means that this segment of the food shopping market is not
currently served by the existing outlets. We therefore consider that there is a
conspicuous qualitative need for one or more deep discount supermarkets on Jersey, to
Jersey Retail Study 2008
51
enable a full range of food shopping opportunities to be provided, and to complete the
convenience goods retail offer.
4.4 Typically, such discount supermarkets achieve convenience goods sales of around £4m
each per annum (compared with about £35m typically needed by a superstore of about
5,000 sq m gross operated by one of the front ranking UK food retailers). Being of
modest scale, whilst they would have an impact on existing foodstores, two such discount
supermarkets developed in the next few years would be very unlikely to cause closure of
any of the existing large supermarkets, or other main foodstores.
4.5 There is also both a need and an opportunity to improve the Central and Beresford
Markets for food shopping in St Helier Town Centre. Both occupy attractive buildings, but
which need refurbishment and improved ongoing maintenance. Central Market contains
a mixture of food stalls, cafes and unrelated non-food stalls. It appears to have no clear
food-focused merchandising strategy; and in our view, does not achieve its full potential
as a destination in the town centre for high quality specialist foods. With the initiatives
outlined below, we believe Central and Beresford Markets together could become a
highly attractive destination for such shopping, akin to Borough Market in Southwark,
London – which has been a significant engine of regeneration on that part of the South
Bank.
4.6 In terms of spatial distribution, Jersey’s foodstores are well distributed around the Island.
The five large non-central supermarkets are located in or close to the largest
concentrations of population, thus obviating the need to drive to one central location for
main food shopping. All the village centres have at least one small supermarket or
convenience goods store, providing local walk-in top-up food shopping facilities. The five
Marks & Spencer Simply Food stores are reasonably well distributed around the Island
and close to the main population concentrations. Most of the specialist food shops and
the Markets are in St Helier Town Centre, where they can be used by people working in
the town centre or visiting it for other purposes. We therefore consider that the existing
arrangements represent a well distributed spatial provision, which has evolved in
response to consumer needs. There are no conspicuous deficiencies in the spatial
distribution of food shopping facilities.
Comparison Goods Shopping
4.7 Comparison goods shopping is very largely concentrated in St Helier Town Centre. This
is a substantial town centre comprising a large number of shops and stores, including UK
multiple retailers, two local independent department stores, a large number of local
independent retailers, financial and personal services, and many cafes, restaurants and
public houses. Comparison goods retailing covers almost the full spectrum of such
goods; and somewhat unusually for a town centre, includes a wide range of shops and
Jersey Retail Study 2008
52
stores selling ‘bulky’ comparison goods such as furniture, carpets and other floor
coverings, household textiles and soft furnishings and domestic appliances. In terms of
the availability of comparison goods therefore, there are no conspicuous weaknesses in
the retail offer of St Helier Town Centre.
4.8 Elsewhere on the Island, there are two large retail warehouses: B&Q selling DIY goods,
decorating and home improvement goods, and garden products; and the JE store selling
a wide range of goods, including furniture, electrical goods, toys, household goods and
art supplies. There are also smaller non-central outlets selling carpets, computers, and
Marks & Spencer clothing and homewares. In addition, the 5 large non-central
supermarkets sell limited ranges of general non-food goods; and farm shops and garden
centres sell garden products and other comparison goods. In comparison with most UK
towns with similar catchment populations to that of Jersey, the Island is somewhat
lacking in traditional ‘bulky goods’ retail warehouses. However, this is because most
retailing of such goods is still in St Helier Town Centre; where it contributes to a rounded
and full spectrum retail offer, and is accessible by public transport and on foot as well as
by private car, thus contributing to sustainability and social inclusion.
4.9 Our Retail Sector Analysis described in Section 3 above shows that on the Island as a
whole, there are currently no conspicuous weaknesses in the comparison goods retail
offer. We therefore consider that ‘bulky goods’ retailing should only be decentralised to
new non-central retail warehouses if doing so would release suitable sites in St Helier
Town Centre for redevelopment or re-use for non-bulky comparison goods retail
development; and if this is the only way in which the latter can be accommodated in the
town centre once sufficient expenditure has grown to support it. Since this is not yet the
case, we do not see any urgent qualitative need to identify sites for new retail
warehouses. In the longer term (probably from about 2020), it might become necessary
to consider some such decentralisation in the interests of creating new non-bulky
comparison goods retailing in modern shops and stores closely linked to the prime retail
area in the town centre. However, this would need to be checked and validated at that
time.
St Helier Town Centre
4.10 St Helier Town Centre is densely developed, with the prime retailing located along King
Street and Queen Street, and substantial but more secondary streets of shops and
service businesses to the west, north and east of this area. The highest pedestrian flows
are in King Street and Queen Street, which is where most of the multiple retailers and the
two department stores are located.
4.11 King Street and Queen Street are both pedestrianised; as are Royal Square (not primarily
a retail area), Market Street and the part of Bath Street south of Beresford Street. Apart
Jersey Retail Study 2008
53
from these streets, traffic can penetrate close to and through the retail streets; and north
to south traffic divides the prime retail core at New Street/New Cut and Halkett Place.
Elsewhere in the town centre pedestrian/vehicular conflict is apparent at Broad
Street/Charing Cross, and at the Bath Street/Beresford Street/Peter Street junction, in
particular. Public car parks are located at various places around the retail core, e.g. at
Minden Place, Sand Street, Pier Road, Esplanade and Gas Place (although the latter is
to be replaced by a new public park).
4.12 Although there are a significant number of UK national multiple retailers in the town
centre, many are occupying premises which are smaller and less well configured than
they would normally require, and/or are in more secondary locations. This is because
there are few large modern shops and stores in the primary retail area. On the one hand
this means that St Helier retains a considerable charm as an historic town centre with
many small shops occupied by independent retailers; and is far from being a UK ‘clone
town’, thus helping to attract visitors, particularly from Britain and France. On the other
hand it constrains the ability of the town centre to attract modern multiple retailers to
provide access to popular brands. Such retailers will only be attracted if they are able to
occupy large modern stores and shop units which are in the prime retail area. There is
therefore a qualitative need to develop larger modern shops and stores by means of
extension of the prime retail area, provided that this can be done sensitively in a manner
which does not compromise the unique character of the town centre or create a
competing retail destination. This means that such development should only take place
when expenditure has grown sufficiently to support it without adverse impact upon the
existing shops and stores. The timing of new development will therefore be important.
4.13 It also strongly suggests that new comparison goods floorspace will need to be woven
into the existing urban fabric as far as possible, by means of selective redevelopment,
adaptive re-use of existing buildings, and extension and remodelling of existing retail
premises; rather than in the form of a single large scale redevelopment such as a new
retail mall. In Section 5 below, we discuss possible ways in which additional comparison
goods retail floorspace in modern unit sizes and types could be accommodated within the
town centre, and indicate the implications for planning policy to enable such development
to occur.
4.14 Traffic access and car parking were the two most important weaknesses of the town
centre which emerged from our consultations. We concur that these are problem areas,
and have identified some traffic issues above. We appreciate the great difficulties of
providing adequate vehicular access and parking, resolving pedestrian/vehicular
conflicts, and enabling adequate servicing access for shops and other businesses in a
densely developed historic town centre such as St Helier. However, this calls for
innovative solutions. We therefore consider that the whole traffic management
arrangements within the ring road should be reviewed. The objectives of any changes
Jersey Retail Study 2008
54
should be to reduce separation between different parts of the retail core of the town
centre, overcome pedestrian/vehicular conflict, extend pedestrianisation out from the
prime retail area, and improve access for service vehicles at appropriate times of the day.
It should also be to restrict general access traffic to the outer edges of the retail core,
whilst improving access to peripheral car parking.
4.15 A possible model for St Helier Town Centre could be the York City Centre ‘Footstreets
Zone’. York City Centre has some similiarities with St Helier, having a large number of
small shops occupied by independent retailers, a very attractive historic environment of
many small narrow streets, and insufficient large modern shops and stores for the needs
of multiple retailers. It is also a major visitor destination, and has very high pedestrian
flows in some streets. Almost the whole of the City Centre retail area has been
designated as a pedestrian only ‘Footstreets Zone’. In much of this area, the existing
pavements and carriageways remain, but the whole area is closed to almost all vehicles
during core shopping hours. These vary between different parts of the Zone and on
different days of the week, being closed for longer hours on Saturdays. The only
exceptions are vehicles registered with the Local Authority on the basis that access
during the hours of closure is essential to the user’s business.
4.16 Such an arrangement could have significant advantages for St Helier. In particular, it
could result in improved conditions for pedestrians during the core shopping hours across
a wider part of the town centre, whilst giving better vehicular access for businesses
outside these hours. Thus for example, outside the core hours service vehicles would be
able to enter streets such as Halkett Street, which is currently fully pedestrianised. If
appropriate, such an arrangement could be applied flexibly, for example only during the
summer months and leading up to Christmas, if pedestrian flows did not justify it at other
times of the year. It would not require substantial capital expenditure for its introduction,
as it would need only appropriate new signage, together with movable barriers such as
rising bollards or lockable gates. It would not be necessary to renew pavement and
carriageway surfaces. For its efficient operation, however, it would require substantial
publicity, and effective management and enforcement.
4.17 As in most town centres, the limited availability of car parking is a weakness in St Helier.
Opportunities to increase it in close proximity to the retail core of the town centre, and
where it is easily reached from the ring road, should be taken wherever possible. We
also consider that the current scratchcard charging arrangements are a major
inconvenience for users. We consider that the charging method in all the public car parks
should be changed to pay on exit, which would be likely to result in greater dwell times in
the town centre, and would remove the stresses of not having appropriate scratchcards
or not having correctly anticipated one’s length of stay and thus suffering penalties.
Jersey Retail Study 2008
55
4.18 From observation of the town centre, it appears that there may be insufficient parking
space for motorcycles, since all the bays observed were full at the time, and some
informal parking was evident. It also appears that within the retail core there may not be
enough cycle racks to which cycles can be locked. Again, all those observed were fully
occupied and some cycles were informally secured to railings and posts.
4.19 The Central and Beresford Markets are a very important attraction in the town centre, and
provide a range of high quality foods in an undercover market stalls environment.
However:
• The Buildings and fitments are in need of some repair and refurbishment;
• Central Market comprises a somewhat disparate mix of food stalls, cafes and
non-food stalls, with no clear merchandising strategy;
• Signage to the markets is not adequate to bring them to the attention of visitors to
St Helier;
• There is no dedicated car parking available in close proximity.
4.20 We therefore consider that the Markets need improvement if they are to fulfil their
potential as important specialist food shopping attractions. We suggest that the buildings
and stalls should be sensitively refurbished and cleaned so as to retain their undoubted
character. Without refurbishment followed by ongoing planned maintenance, the Markets
will inevitably decline, and the income from them with it. We believe that these markets
should then be focused on high quality specialist food shopping, akin to Borough Market
in Southwark, London; and that the non-food stalls should be removed from Central
Market as soon as new specialist food traders and cafes can be found to occupy their
stalls. Alternatively or in addition, retailers selling food related non-food goods, such as
specialist kitchenwares or cookery books, could replace the existing unrelated non-food
stalls, thus contributing to the food-focused theme. New signage to the Markets should
be installed in the town centre. Whilst the lack of dedicated parking cannot be overcome,
we suggest that Minden Place car park be linked to the Markets, both through direct
signage, and by a promotional initiative such as reduced car park charges for customers
of the Markets. Once these improvements are in place (but not before, since promotion
is not an effective substitute for improvement action), a promotional campaign needs to
be inaugurated, together with ongoing promotionally focused management.
4.21 Although the results of our Survey of Businesses suggested some concerns about street
cleansing in the town centre, this was not significantly corroborated by the results of our
On-street Interview Survey of Shoppers and other town centre users. From our
inspections of the town centre, it appeared to be generally clean and well cared for. In
the prime retail areas of King Street and Queen Street and in some other streets,
Jersey Retail Study 2008
56
pavement surfaces and street furniture is high quality and in generally good condition.
There are also some attractive pieces of public sculpture, for example ‘Jongleurs’, the
Jersey Cows and the amphibian on the column at Charing Cross. However, there are
some pockets within the town centre which would benefit from improved street cleaning,
for example regular pressure washing of pedestrian surfaces and seats where people sit
out to eat and drink. West Centre off Bath Street is one such location.
4.22 Most of the buildings in St Helier Town Centre are in good repair, and together present an
attractive streetscape. However, some are showing signs of inadequate repair and
maintenance. A campaign to co-ordinate repair and painting of facades throughout the
town centre, coupled with cleaning and maintenance of street furniture and pavement
surfaces, would be a good way of further raising the standard of the streetscape and the
attractiveness of the town centre as a whole. Some older buildings have shopfronts
which are architecturally unsympathetic to the building, thus compromising the historic
environment. A campaign for restoration of historic shopfronts, backed by grants if
possible, would help to improve conservation and strengthen St Helier as an attractive
historic destination for visitors.
4.23 Some of the initiatives outlined above fall within the ambit of Town Centre Management
(TCM). If not already in existence, we suggest the formation of a formal TCM Partnership
between the private sector and the States of Jersey; and the appointment by the
Partnership of a Town Centre Manager with executive powers and a budget, tasked with
the role of increasing the attractiveness of the town centre through physical
improvements, higher standards of management, and promotional initiatives. Such an
approach has been shown to provide economic benefits in many town and city centres in
the UK and elsewhere in the world. The Association of Town Centre Management in the
UK can provide model terms for such a partnership, and other advice and support.
Jersey Retail Study 2008
57
5 Accommodating Identified Retail Needs
5.1 In this section, we discuss how the retail development needs which we have identified
can be accommodated on the Island, in a way which would accord with sustainability and
social inclusion objectives. Whilst we have not identified a need for a new food/non-food
superstore, we are aware that such a development (of about 5,000 sq m gross) has been
proposed in principal. We therefore also consider whether such a superstore could be
accommodated satisfactorily.
5.2 In advising on the suitability of potential sites for new retail development, we have not
undertaken any detailed assessment of issues such as traffic generation and highway
capacity, environmental impact, urban design, etc. These are matters which would need
to be checked before planning permission is granted. Our review of potential sites is
principally of their commercial suitability, but has regard in broad terms to issues of
accessibility and site planning, which would affect retailers’ commercial decisions about
site acceptability. We have also not undertaken any financial appraisals – but have again
had regard to general principles of financial viability in assessing commercial suitability.
Again, developers and retailers would need to satisfy themselves that their proposed
developments would be financially viable.
5.3 In reviewing potential sites, we have had regard to the planning principles for sustainable
retail location; and those for social inclusion. Both of these objectives mean that new
retail development should if possible be located where it is accessible by a choice of
means of transport, so as to make possible switching from cars to public transport and
meeting the needs of shoppers who do not have cars; and where one journey can serve
more than one purpose, thus reducing the need to travel. In practice, this means
locations in or on the edge of existing centres, particularly town centres; which are the
locations best served by public transport, and where the greatest concentration of
complementary attractions is located. We consider that these principles should also be
applied to site selection in Jersey. In addition to benefitting sustainability and social
inclusion, they also increase the prospects of new retail development reinforcing existing
shopping facilities, for mutual commercial prosperity. It means that sites in or on the
edge of St Helier Town Centre should be preferred to those on out-of-centre sites.
Food Stores
5.4 We have identified a qualitative need for one or two new deep discount supermarkets of
about 1,300 sq m gross, for development in the next few years. Such retailers normally
prefer free-standing stores built to their standard format, with adjacent surface car
Jersey Retail Study 2008
58
parking for up to about 100 cars, thus necessitating a site of not less than about 0.4
hectares. In order to be able to operate their deep discount format, these stores need to
be built on relatively low cost land, so are not normally constructed on sites which have
abnormal development costs. Ideally from the retailers’ perspective, sites should be
visible from main roads and have good car access, together with public transport access.
Former Odeon Cinema site and adjacent land
5.5 Because it is so densely developed, there are few sites in and on the edge of St Helier
Town Centre which would comply with these criteria. One such site is the land adjacent
to the former Odeon Cinema between Bath Street and James Street. We estimate that
this site is approximately 0.5 hectares, excluding the former cinema which we understand
may now be listed for preservation. This flat site would therefore be large enough to
accommodate a deep discount supermarket and surface car park, together with limited
other uses. In contrast, even if the former Cinema was to be demolished, the surface car
park on the north-west corner of the site included and a new superstore built on two
levels with decked car parking, we doubt that the site would be large enough for a 5,000
sq m gross food superstore.
5.6 The site is within a short walk of the primary retail area and a new supermarket would
effectively extend the secondary retail area. As such it should help to generate increased
pedestrian flows in the northern part of the town centre. Although some way from the bus
station on Esplanade, it would be accessible to shoppers who had come to the town
centre by bus. It would also be accessible to shoppers coming on foot from the high
density residential areas to the north (45.9% of people we interviewed on-street in St
Helier Town Centre had arrived on foot). However, this site is almost centrally located
within the ring road, meaning that it has somewhat indirect car access (which would be
greater problem for a superstore, with its much greater traffic generation). It is therefore
not certain that it would attract a deep discount supermarket retailer. Even if it proved
possible physically to accommodate a superstore and its car park, we consider that its
location would make it unattractive to retailers for such a store – bearing in mind that the
store would have to take most of its trade from the existing large supermarkets on the
Island, and to do so would require a more accessible location than they occupy.
Green Street car park and adjacent land
5.7 A small site exists to the south of Green Street car park, which although comprising a
deep valley, could have the potential to be decked over with a new development above,
served by the existing car park. It would be highly visible from La Route Du Fort, and
accessible from the ring road via the existing car park. We estimate that this site is about
0.125 hectares, which would be too small for a deep discount store and its service
access, even though no new car parking would be needed. The need to deck over the
Jersey Retail Study 2008
59
site to create a level platform for the store would increase the site development costs,
and may make it financially unviable for a new foodstore. The presence of the existing
car park would obviate the costs of creating a new car park for the store; but the retailer
would require an exclusivity agreement with the owner for free use of the ground floor for
its customers. On balance, because of the small size of this site and the probable high
construction costs, we consider it unlikely that this site could in practice attract a deep
discount supermarket.
Land at the Waterfront
5.8 We are aware that apart from the Esplanade site, there are some undeveloped or
apparently underused parcels of land in the port/waterfront area of St Helier. We believe
it should be possible to identify a sufficiently large site in this area for a deep discount
supermarket and car park, particularly if some land used for port-related uses could be
released, and/or car parking for the new foodstore could be shared with car parking for
other uses such as the cinema (since the highest parking demand for the latter is at
different times of the day than for the foodstore). We consider that a site in this area
would be attractive to retailers in locational terms. It would also be centrally located for
the Island’s population and very accessible by car. However, a deep discount
supermarket would be a somewhat low value use for high value land at the
port/waterfront; and may not fit well with the development vision for the wider waterfront
area.
5.9 Having reviewed potentially available sites in and around St Helier, we consider that the
Esplanade Square site is the only site which would be large enough and suitable for a
new superstore of about 5,000 sq m gross; if the States of Jersey decides that it wishes
to attract such a development and is prepared to accept the closure of other foodstores
which we strongly expect to result. This site would be one of the most central for the
most people on the Island; and would be easily accessible by car and well served by
public transport (being almost adjacent to the new Bus Station). Being an edge-of-centre
site, it would create opportunities for linked trips food and non-food shopping with the
town centre; thus potentially helping to reinforce the town centre and contributing to
sustainability. We understand that the Masterplan for the Esplanade site does not
include provision for such a food superstore, and has recently been adopted as States
policy. It would therefore be necessary to amend the Masterplan if a food superstore was
also to be included on this site, for example at ground and first floors as part of a mixed
use development, with underground or decked parking. However, we are advised that
there is no prospect whatsoever of the Masterplan being amended to allow this to
happen.
Jersey Retail Study 2008
60
Out-of-centre sites
5.10 We understand that sites on the north-east edge of St Helier (a former dairy) and south
of the Airport have been canvassed as potential sites for a new food superstore. We
consider that these sites would be unsuitable, because a superstore on either site (which
would include comparison goods sales as well as convenience goods sales) would act as
a competing shopping destination for St Helier Town Centre rather than helping to
reinforce it; and because (being out-of-centre and having relatively poor public transport
access) it would run counter to the principles of sustainability and social inclusion. Car
access for either site is also poor relative to the Esplanade site. The Airport site is also
not well located for a large traffic generating use such as a food superstore, because it is
some distance from the largest concentrations of population on the Island. However, it
could be a suitable site for a second deep discount supermarket (which has much lower
traffic generation than a superstore), where it could serve the population on the western
side of the Island (with one in St Helier serving the eastern side).
Comparison Goods Development
5.11 We have identified a quantitative need for new comparison goods retail development,
which will start to arise from about 2011 and grow steadily thereafter. We have also
identified a qualitative need for this to be mainly in the form of large modern stores and
shops, so as to attract multiple retailers. Such a development must be in or on the
immediate edge of the primary shopping area (such that it extends the latter), if it is to
attract such retailers and reinforce the existing town centre shopping; rather than being a
new competing shopping destination adversely impacting upon the existing town centre.
Land between Broad Street and the Bus Station
5.12 This block is bounded by Broad Street, Conway Street, Esplanade and Castle Street; and
is divided into two unequal parts by Commercial Street. It is located between the primary
shopping area of King Street, and the new Bus Station and Liberty Wharf shopping
centre (the latter being under construction). The site is therefore very well located for a
new prime retail development to connect the town centre retail core to the Waterfront.
However, there are substantial obstacles to such a development. The block is already
densely developed, including high value uses such as the Post Office and a Bank,
together with modern offices and other recently developed uses. This means that only
parts of the block may be available for redevelopment, making it very difficult to achieve a
scheme which would include the right mix of stores and shops in a financially viable
development. Whilst it may still be possible to create a new retail route through to the
Bus Station and Liberty Wharf, this would be of limited benefit in terms of strengthening
the existing retail core. It would be unlikely to create an effective new retail circuit which
would link to the existing primary shopping area at both ends, and be properly ‘anchored’
Jersey Retail Study 2008
61
by major new stores, so as to generate sufficient pedestrian flows to make the scheme a
commercial success. It is unlikely that a retail link to the waterfront on its own would be
sufficient to achieve commercial success
5.13 We consider that conversion to retail use of the best existing buildings fronting onto
Broad Street, together with redevelopment of those of lower quality to create large
modern stores and shops, would be more realistic than a retail scheme in depth linking
Broad Street to the waterfront. A frontage development of this type could occur more
incrementally as demand builds up and existing buildings become available, and would
substantially strengthen Broad Street as a retail destination, without compromising old
listed warehouse buildings behind. It may also be possible to include a new shopping
street of smaller shops linking to the waterfront, but this would not be a major scheme
accommodating many multiple retailers.
Esplanade Square
5.14 We understand that the recently adopted Masterplan for the Esplanade Square site
envisages mainly offices and residential development, but with retail and catering uses to
provide active ground floor frontages and support the office and residential occupiers.
The scale of new offices proposed should be able to support significant new retail
development of this type. However, we consider it important that this area does not
become a major prime retail development area. Whilst an edge-of-centre site, it is
detached from the primary shopping area by Esplanade and non-retail uses. If it was to
include major new stores and shops on a substantial scale, therefore, it would form an
alternative shopping destination to the existing town centre, rather than reinforcing it to
mutual benefit. The result could well be decline in the vitality and viability of the eastern
end of the town centre, in particular Queen Street, as some retailers relocate into
Esplanade Square to achieve larger and more modern premises. We therefore consider
that Esplanade Square should be limited to smaller scale support retailing and services
associated with the new office and residential developments.
Land North of King Street
5.15 We consider that the area north of King Street could provide some opportunities for new
prime retail development on a fairly substantial scale. The small block at the extreme
west end of King Street, west of Pitt Street and north-east of Charing Cross, has potential
for redevelopment for new prime retailing. The block bounded by York Street, Dumaresq
Street, Union Street and Old Street is occupied by Romerills furniture and homewares
store and other uses, but is less densely developed than some other parts of the town
centre close to the primary shopping area. Some of the buildings on this block are
architecturally undistinguished. The area to the north of De Gruchy and Voisins
department stores is occupied by a variety of uses, some of which could be susceptible
Jersey Retail Study 2008
62

to redevelopment. Thus for example, if the northern ends of the these two department
stores could be incorporated (with their lost ground floor space replaced at a new upper
floor level) a new retail circuit could potentially be created linking Charing Cross, via the
Romerills block (with new ‘anchor’ stores at that end), behind De Gruchy and Voisins,
and through to Don Street, Halkett Place and Central Market, thus increasing pedestrian
flow to the latter.
5.16 We do not underestimate the difficulties of creating a new prime retail development in this
area. The area is in a variety of ownerships, and there are ‘hard’ uses such as a
community centre and a church which could be obstacles to satisfactory redevelopment.
A new development to create a new retail circuit (as opposed to a simpler redevelopment
of a single block such as the Co-op foodstore block) would be likely to necessitate public
sector site assembly. It would also present a considerable design challenge to create a
scheme with the right mix of modern stores and shops, properly serviced, which respects
conservation constraints and is financially viable. Nevertheless, we consider that it
represents a realistic long term retail development opportunity, which could eventually be
realised (perhaps in phases) by an experienced town centre retail developer working in
partnership with the States. This would necessitate identification of the area as a
potential prime retail development area, coupled with planning policies supporting such
an initiative. It would also necessitate preventing other developments in the area which
would inhibit or prevent such a more comprehensive approach to increasing prime retail
floorspace.
5.17 The next step would be for an Architect with substantial experience in shopping centre
design to prepare an indicative ‘masterplan’ for the area, to explore and if possible prove
the concept in more detail, and develop it as the basis for a new planning policy for this
area. If the outcome of this process is positive, a Planning and Development Brief should
then be prepared based on the indicative masterplan, setting out the States’
requirements for the development. The principles of this Brief should also be
incorporated into the Island Plan, so as to provide policy support for site assembly and
the grant of planning permission in due course. At an appropriate time as expenditure
support grows, the development opportunity would need to be marketed by the States, an
experienced development partner appointed, the site acquired, and the development
undertaken.
Former Odeon Cinema site and adjacent land
5.18 In the event that this site is not used for a new deep discount foodstore, we consider that
it would be suitable for certain forms of comparison goods retail development. These are
principally stores which need large floorplans but do not need (and cannot afford to pay
for) the highest rented prime retail locations in the town centre. Examples are stores
selling ‘bulky goods’ such as furniture, floorcoverings and household textiles, domestic
Jersey Retail Study 2008
63
appliances, camping and boating equipment, together with sports goods shops, pet
supplies, computers, audio-visual equipment; rather than prime retailing in the fashion
goods and lifestyle sectors. This site is large enough to accommodate several such
stores, as part of a retail-led mixed use development. As an edge-of-centre location, we
consider that such a scheme (which would not need large scale car parking) would
contribute to the vitality and viability of the town centre as a whole, and would help to
strengthen pedestrian flows in the north-east part of the town centre. It could also
accommodate some non-prime retail uses relocating to make way for a new prime retail
development north of King Street, thus helping to facilitate the latter.
Out-of-centre sites
5.19 We have not identified any need for additional out-of-centre retail warehouses. We
therefore consider that such stores should only be developed in circumstances where
they are to accommodate ‘bulky goods’ retailing decentralising from St Helier Town
Centre in order to make way for new prime retail development – and where this is the
only way in which such town centre development can be effected. The principal out-of
centre site of which we are aware is land immediately south of the Airport. This could be
attractive to retailers for new ‘bulky goods’ retail warehouses, subject to the road access
being adequate, perhaps associated with a new deep discount food supermarket.
However, it will vital to ensure that the scale of new bulky goods retailing is limited to that
needed to facilitate new prime retail development in St Helier Town Centre; and that any
planning permissions are strictly limited to this, and conditioned to permit ‘bulky goods’
retailing only.
Jersey Retail Study 2008
64
6 Conclusions for the Retail Planning Strategy
6.1 In this section, we summarise the principal conclusions arising from the Study, and set
out our recommendations for the Jersey Retail Planning Strategy. In doing so, we
distinguish between a strategy for the development of new foodstores and new
comparison goods retail floorspace (although new foodstores, particularly a food
superstore, would sell significant amounts of comparison goods).
Foodstores
6.2 From the retail capacity forecasts, it is clear that there is no forecast quantitative capacity
for additional foodstore floorspace (beyond current commitments) up to about 2012.
Thereafter, capacity will grow modestly to 2025, if forecast trends occur. This means that
if a new food superstore of a size needed to attract a front rank UK or French food retailer
(about 5,000 sq m gross) was to be developed in the next few years, it would be highly
likely to cause the closure of at least one of the existing large supermarkets and perhaps
also some of the smaller local foodstores. In quantitative terms therefore, there will be no
need for any more large foodstores on the Island in addition to the existing stores and
already committed developments, for the foreseeable future. This conclusion accords
with the results of our independent consultations with retailers and the Chamber of
Commerce; and we are not aware of any up-to-date and reliable evidence from other
parties that there will be sufficient expenditure support and thus a quantitative need for a
new superstore in the next few years.
6.3 There is however a qualitative need for about two deep discount supermarkets of up to
about 1,300 sq m gross each. This is because all other segments of the food shopping
market are already well served in terms of availability of goods, but there are no deep
discount supermarkets on the Island. Being of much smaller scale than a superstore,
and generating very much lower sales, two such supermarkets could be developed in the
next few years without a serious adverse impact on the existing foodstores, and with a
low probability of causing closures of existing stores. Development of two such stores
would round off and complete the food retail offer.
6.4 The existing foodstores on the Island are well distributed to serve the main
concentrations of population, both for main food shopping and local walk-in shopping.
There are therefore no conspicuous weaknesses in terms of the spatial distribution of
foodstores. Any new deep discount foodstores should be located where they can serve
the greatest numbers of people with minimum car usage. This indicates a new store in or
Jersey Retail Study 2008
65
on the edge of St Helier Town Centre, and one on the west of the Island, for example
south of the Airport or (if a site could be created) at Red Houses (St Brelade).
6.5 There are few sites in or on the edge of St Helier Town Centre which would be
commercially suitable for a deep discount supermarket. The best prospects are land
between Bath Street and James Street adjacent to the former Odeon Cinema; and
various possible sites in the waterfront/port area (particularly if port related uses can be
given up, and/or car parking can be shared with the new leisure developments in this
area). A store on the land adjacent to the Odeon Cinema would bring benefits to the
north-east part of St Helier Town Centre; whilst a site in the waterfront/port area would
probably be more attractive to retailers, being more accessible by car and probably closer
to the Bus Station. On the west side of the Island, a (greenfield) site exists immediately
south of the Airport which could be suitable for a second deep discount supermarket,
subject to the capacity of the highway network to accommodate the additional traffic
generated.
6.6 In the event that the States of Jersey decides it wishes to proceed with a new food
superstore, accepting the closure of existing stores which would be highly likely to result,
we consider that the only suitable location would be the Esplanade Square site on the
waterfront at St Helier. This site is the most accessible from the whole Island by car and
public transport. Being an edge-of-centre site, it would provide opportunities for food
shopping journeys to be linked with non-food shopping and use of services in the town
centre; thus contributing to sustainability – or at least helping to offset the effects of the
more concentrated pattern of food shopping which it would cause. However, we
understand that this site is now subject to a recently adopted Masterplan for an office and
residential development with supporting retail and catering uses at ground floor level, and
that this Masterplan does not make provision for a food superstore and its car park. We
have been advised that there is no prospect whatsoever of the Masterplan being
amended to allow this to happen.
Comparison Goods
6.7 In the case of comparison goods in St Helier Town Centre, the new Liberty Wharf
development will accommodate forecast needs for more floorspace until about 2011.
After that date, rising expenditure will create a growing need for more comparison goods
floorspace, which should reach about 3,650 sq m net sales area by 2015, 10,050 sq m
net by 2020 and 17,050 sq m net by 2025, if forecast trends occur. Liberty Wharf will
therefore provide a short ‘breathing space’ in which to plan for and work up proposals for
the next phase of town centre retail development. Such new developments can take
many years from inception to completion, so it will be important that the States is pro
active in using this time to prepare such proposals. Applying the principles of
Jersey Retail Study 2008
66
sustainability and social inclusion, we consider that such new retail development should
be in or on the edge of St Helier Town Centre, in preference to out-of-centre locations.
6.8 St Helier Town Centre is a very attractive historic centre, providing almost a full range of
comparison goods shopping, together with a wide range of catering outlets and other
services. We estimate that as a whole, it is trading only moderately however. This was
corroborated by retailers, who suggested that it has too much floorspace for current
demands, in view of the decline in the number of visitors to the Island. Much of that
floorspace is in small shops in historic buildings, which are unsuitable for the needs of
modern multiple retailers. Thus the town centre includes a large number of independent
retailers, and relatively few multiples. If the retail offer is to be rebalanced therefore,
without adverse impact on the existing shops and stores, it will be important that new
floorspace is provided in locations and formats capable of attracting multiples; and that it
only occurs when fully supportable by growth in expenditure, and is subject to a detailed
impact assessment at that time.
6.9 Providing new floorspace which can attract multiple retailers will mean locating it where it
is very closely linked to the existing primary shopping area of King Street (rather than at
Esplanade Square for example), and where it can effectively expand that prime area.
Frontage properties on the south side of Broad Street may provide some opportunities to
create large modern shops and stores in an incremental fashion, as demand grows and
buildings become available, thus making Broad Street an increasingly prime shopping
street. It may also be possible to provide a new retail link to the Bus Station, Liberty
Wharf and the waterfront through this area; but it is unlikely that such a link could provide
large stores and shops capable of accommodating multiple retailers.
6.10 Elsewhere in the town centre, we consider that there is a potential opportunity to create
by means of well designed redevelopment a new retail circuit on the north side of King
Street, to extend the primary shopping area and attract new multiple retailers to St Helier.
This could run from Charing Cross via the Romerills block, then to the rear of De Gruchy
and Voisins (and incorporating the rear parts of those stores, probably replacing their lost
ground floor space at upper floor level), through to Don Street and Halkett Place.
Achieving this would require the States to work in partnership with an experienced town
centre shopping developer, to assemble the site and deliver a new development, if
necessary in phases as demand grows. It would require supportive planning policies,
together with restriction of any piecemeal developments in this area which would inhibit
or prevent such a scheme occurring in future years.
6.11 The proposed Esplanade Square site is an edge-of-centre site in retail planning terms. It
is too far removed from the existing prime retail area to form an extension of it. If
developed for large prime retail shops and stores therefore, it would not complement and
reinforce the existing town centre, but would be likely to act as an alternative shopping
Jersey Retail Study 2008
67
destination adversely impacting on the vitality and viability of the existing centre. We
therefore recommend that it be limited to smaller scale retailing, catering and other
services, to support the proposed new office and residential development on the site.
6.12 There is no forecast capacity in terms of expenditure support for additional non-central
retail warehouse floorspace and comparison goods floorspace in large food stores over
the forecasting period to 2025. There is also no conspicuous qualitative need, because
St Helier Town Centre still retains almost a full spectrum of comparison goods retailing,
including ‘bulky goods’ retailing. If substantial new retail warehouse development
occurred, or development of a large food/non-food superstore, therefore, it would be
likely to result in closure of some of the existing shops and stores in St Helier Town
Centre. These impacts would depend on the scale and occupancy of the new non-
central stores; but would be most likely to fall on shops selling goods such as furniture,
carpets and other homewares, domestic appliances, sports goods, audio-visual
equipment, pet supplies.
6.13 New non-central retail warehouses would therefore only be justified in terms of qualitative
need if it was necessary to decentralise some ‘bulky goods’ retailing from the town centre
in order to create sites for new comparison goods stores and shops in the fashion and
lifestyle goods sectors. We recommend that the first choice site for any such relocations
should be the land adjacent to the former Odeon Cinema in St Helier Town Centre, if this
site is not used for a new discount supermarket. Otherwise, we consider that the
greenfield site immediately south of the Airport would be commercially suitable for such
relocations, subject to the capacity of the highway network to accommodate the traffic
generated. We recommend that any such new out-of-centre retail warehouses be limited
to those necessary to accommodate retailers relocating from the town centre in order to
make way for new prime retail development there, and be strictly conditioned to ‘bulky
goods’ retailing only.
Other needs in St Helier Town Centre
6.14 St Helier Town Centre is a very attractive historic centre, with a wide range of retailing
and services. We consider that it is providing well for the needs of shoppers and other
town centre users in most respects. This is supported by the results of our On-street
Interview Survey of shoppers and other town centre users, which showed a good positive
balance of likes over dislikes, and positive ratings of a number of aspects of the town
centre. Their principal concerns include traffic congestion and the difficulty and cost of
car parking, perceived poor range of shops, and perceived poor value for money or high
prices. However, there is only a limited desire for large new stores operated by UK
multiple retailers. The cafes, pubs and restaurants are significant attractions and are
widely used. Street cleansing and safety and security are seen as generally good.
Jersey Retail Study 2008
68

6.15 We have identified some needs and opportunities for improvement of the town centre.
Apart from the above identified future need for new shops and stores to attract multiple
retailers, we consider that:
• The traffic management arrangements inside the ring road should be reviewed,
with the aim of improving accessibility to car parks, and for service vehicles
outside core shopping hours, whilst reducing pedestrian-vehicular conflicts.
• A wider pedestrian zone covering the great majority of the primary and secondary
shopping streets during the core shopping hours (similar to the York City Centre
‘Footstreets Zone’) could be a practical way of achieving this objective.
• Any opportunities to improve car parking for shoppers close to the shopping core
of the town centre should be pursued.
• The scratchcard charging method for the car parks should be changed to pay on
exit.
• The Central and Beresford Markets should be refurbished, non-food retailers
removed, and these markets themed for and promoted as a key destination for
speciality food shopping and cafes; supported by improved signage to them
within the town centre, and promotional linkage with Minden Place car park.
• Additional parking for cycles and motorcycles should be provided if possible.
• Town centre management should be formalised, and a number of improvements
initiated, covering management and promotion of the town centre.
6.16 We believe that together these initiatives would significantly improve St Helier Town
Centre, and help to make it more attractive to residents and visitors, with benefits for its
overall prosperity.
Signed: Date: 25 July 2008
Name: Jonathan Baldock Position: Director – Head of Retail Planning
For and on behalf of DTZ
Jersey Retail Study 2008
69

Appendix 1 Businesses Survey questionnaire and results
Appendix 2 Key stakeholders interviewed
Appendix 3 On-street Interview Survey Results
Appendix 4 Catchment Zones map and Household Interview Survey results
Appendix 5 Description of the RECAP Model
Appendix 6 Jersey RECAP Model 2008
APPENDICES

Appendix 1 – Businesses Survey questionnaire and results

Appendix 2 – Key stakeholders interviewed

Appendix 3 – On-street Interview Survey Results

Appendix 4 – Catchment Zones map and Household Interview
Survey results

Appendix 5 – Description of the RECAP Model

Appendix 6 – Jersey RECAP Model 2008