Embed Size (px)
Citation preview

Half Year Review
six months to 31 December 2015
For
per
sona
l use
onl
y

2
First Half 2016 (1H16) Financial Year Summary
Net Software revenue grew by 2% ($16.8m) versus the same period last year ($16.4m)
Software annuity (maintenance) revenue increased by 15% ($7.8m) over 2H15 ($6.8m) and 13% over 1H15 ($6.9m)
Advisory returned a neutral contribution ($0m) and GeoGAS a positive contribution ($0.7m) despite very difficult trading conditions
Research and Development (R&D) investment rose by 44% to $5.6m (1H15: $3.9m) a $1.7m increase over the same period last year
Expenses (excluding R&D) decreased by 17% ($22.8m) against 2H15 ($27.5m) and 15% versus 1H15 ($26.7m)
EBITDA of $0m (1H15: $1.5m) which includes a $1.7m increase in R&D investment over the same period last year
Net Loss after Tax improved to $1.1m (2H15: $3.9m, 1H15: $2.9m)
Between 18 December 2015 and 17 February 2016, the Company acquired 4,864,650 of its own shares at an average cost of 40.7 cents
On 31 January 2016 the Company had $19.1m cash in the bank and no debt
A number of significant XERAS for Enterprise deals slid from 1H16 into 2H16
For
per
sona
l use
onl
y

3
First Half 2016 (1H16) Operational Highlights
The 2016 maintenance renewal season has seen a very pleasing increase in Customer retention rates
The Advisory business had a strong November, December and January
Since the start of this Financial Year, the Company has released three new software products (XERAS Enterprise, Plan Manager
and Open Cut Phosphate) as well as provided major functional upgrades to fourteen (14) other software products
Two new Business Partners were appointed (Russia and Turkey) and the Company agreed to amicably wind up its incorporated
Indian Joint Venture
On 16 December 2015, the Company entered into a Global Strategic Partnership Agreement with Schneider Electric
In December 2015 the Company agreed to terms for a Global Framework Agreement for Software, Consulting, Training and
Advisory services with Glencore International AG
The Company’s CTO has been appointed as a full voting member of the International Society of Automation (ISA) 95 Committee to
support the mining industry’s move to the ISA-95 enterprise to control system integration standard
For
per
sona
l use
onl
y

Financial Analysis
4
For
per
sona
l use
onl
y

Revenue By Division
Total net operating revenue of
$27.6m was 8% down on 1H15 due
to a decline in Advisory and GeoGAS
revenue
Software revenue of $16.8m
increased by 2% from 1H15
Advisory revenue of $8.3m was
down 20% on 1H15
GeoGAS revenue of $2.0m was
down 17% on 1H15
Software revenue now accounts for
61% of net revenue (1H15 : 55%)
5
Division 1H16 2H15 $'var %'var 1H15 $'var %'var
Software 16.8 19.8 (3.0) (15)% 16.4 0.4 2%
Advisory 8.3 9.9 (1.6) (16)% 10.4 (2.1) (20)%
GeoGAS 2.0 1.8 0.2 11% 2.4 (0.4) (17)%
Other 0.5 0.5 - 0% 0.8 (0.3) (38)%
Net Operating Revenue 27.6 32.0 (4.4) (14)% 30.0 (2.4) (8)%
For
per
sona
l use
onl
y

Financial Results Summary
6
A$'m 1H16 2H15 $ Var % Var 1H15 $ Var % Var
Revenue 29.4 34.5 (5.1) (15)% 33.1 (3.7) (11)%
Direct Costs (1.8) (2.5) 0.7 28% (3.1) 1.3 42%
Net Operating Revenue 27.6 32.0 (4.4) (14)% 30.0 (2.4) (8)%
Field Expenses (17.8) (20.7) 2.9 14% (19.7) 1.9 10%
Product & Development Expenses (5.6) (5.1) (0.5) (10)% (3.9) (1.7) (44)%
Corporate Expenses (4.2) (5.1) 0.9 18% (4.9) 0.7 14%
Operating EBITDA - 1.1 (1.1) - 1.5 (1.5) -
Depreciation & Amortisation (1.0) (1.9) 0.9 47% (2.2) 1.2 55%
Net Finance Costs 0.2 0.2 - - 0.1 0.1 100%
Operating Profit/(Loss) Before Tax (0.8) (0.6) (0.2) (33)% (0.6) (0.2) (33)%
Significant One-off Items:Impairment of Advisory Goodwill - (2.5) 2.5 - - - -
Restructure - Staff & Office Leases (0.2) (0.9) 0.7 78% (2.3) 2.1 91%
Total Significant Items (0.2) (3.4) 3.2 94% (2.3) 2.1 91%
Loss before Tax (1.0) (4.0) 3.0 75% (2.9) 1.9 66%
Net Loss After Tax (1.1) (3.9) 2.8 72% (2.9) 1.8 62%
Net Cash/(Debt) 18.4 22.6 (4.2) (19)% 20.4 (2.0) (10)%
For
per
sona
l use
onl
y

Software Division
License sales down 10% on 1H15 to $5.5m
• $4.2m of Enterprise and Commodity
Solutions product sales (1H15: $4.5m)
• $1.3m of Desktop product sales (1H15:
$1.6m)
Maintenance revenue up 15% on 2H15 to $7.8m,
highest ever half-year result for the Company
Services revenue remains consistent - from lower
headcount
Released three new software products
• XERAS Enterprise (Norton Goldfields)
• Plan Manager (BHPB Iron Ore)
• Open Cut Phosphate Solution
7
A$'m 1H16 2H15 $ Var % Var 1H15 $ Var % Var
Software revenue 17.2 20.4 (3.2) (16)% 17.0 0.2 1%
Direct expenses (0.4) (0.6) 0.2 33% (0.6) 0.2 33%
Net Revenue 16.8 19.8 (3.0) (15)% 16.4 0.4 2%
Operating expenses (8.2) (9.7) 1.5 15% (8.3) 0.1 1%
Gross Contribution 8.6 10.1 (1.5) (15)% 8.1 0.5 6%
Product & Development (5.6) (5.1) (0.5) (10)% (3.9) (1.7) (44)%
Contribution 3.0 5.0 (2.0) (40)% 4.2 (1.2) (29)%
For
per
sona
l use
onl
y

Advisory Division
Australian sourced revenue down 40% to
$2.7m
Asian sourced revenue up 10% to $4.6m
Advisory division returned a neutral
contribution (before corporate costs) in 1H16
as a result of a 15% reduction in operating
expenses arising from staff reductions
Advisory pipeline expected to remain lumpy in
the foreseeable future
Management believes it has again gained
market share, particularly in Coal
8
A$'m 1H16 2H15 $ Var % Var 1H15 $ Var % Var
Australia 2.7 4.5 (1.8) (40)% 3.8 (1.1) (29)%
Americas 2.7 3.4 (0.7) (21)% 3.1 (0.4) (13)%
Asia 4.6 4.2 0.4 10% 6.2 (1.6) (26)%
Advisory Revenue 10.0 12.1 (2.1) (17)% 13.1 (3.1) (24)%
Direct expenses (1.7) (2.3) 0.6 26% (2.6) 0.9 35%
Net Revenue 8.3 9.8 (1.5) (15)% 10.5 (2.2) (21)%
Operating expenses (8.3) (9.6) 1.3 14% (9.8) 1.5 15%
Contribution - 0.2 (0.2) (100)% 0.7 (0.7) (100)%
For
per
sona
l use
onl
y

GeoGAS Division
Revenue up 17% from 2H15 to $2.1m
Contribution of $0.7m up 133% on prior half
GeoGAS received NATA certification for its gas
content desorption testing
A$'m 1H16 2H15 $ Var % Var 1H15 $ Var % Var
Laboratory 1.6 1.6 - - 2.0 (0.4) (20)%
Consulting 0.5 0.2 0.3 150% 0.4 0.1 25%
GeoGAS revenue 2.1 1.8 0.3 17% 2.4 (0.3) (13)%
Operating expenses (1.4) (1.5) 0.1 7% (1.5) 0.1 7%
Contribution 0.7 0.3 0.4 133% 0.9 (0.2) (22)%
9
For
per
sona
l use
onl
y

Cash Flow
10
$'m1H16 2H15 1H15
Net Cash opening 22.6 20.4 7.5
Cash from Operations (3.0) 6.1 (6.2)
Payments for:
Restructure Costs - Staff (0.4) (0.7) (0.3)
Restructure Costs - Premises (0.6) (1.1) (0.4)
Make Good - Brisbane Office - (1.0) -
(1.0) (2.8) (0.7)
Payments for:
Property Plant & Equipment (0.3) (0.2) (0.1)
Software Acquisitions - (1.3) (1.3)
(0.3) (1.5) (1.4)
Proceeds from /Payments for:
Capital Raising - - 21.0
Share buy back (0.1) - -
(0.1) - 21.0
Net Increase in Cash (4.4) 1.8 12.7
FX Restatement 0.2 0.4 0.2
Net Cash Closing 18.4 22.6 20.4
For
per
sona
l use
onl
y

Software Progress Update
11
For
per
sona
l use
onl
y

Standardise, Simplify and Integrate
Deliver a complete Commercial off the
Shelf (COTS) Enterprise planning
platform built on open industry standards
Release a suite of simplified,
standardised and integrated solutions
for different commodities and mining
methods built on the same product
architecture
Provide software solutions that deliver a
step change in mine planning, execution
and value chain optimisation through
investments in visual innovation
12
For
per
sona
l use
onl
y

Enterprise Integration Layer
Plan Manager
Organisational
Visibility
Data Visualisations
BI Solution
Location Service
Master Data MgtAuthentication Service Auditing & ValidationFinancial
Consolidation
Solution
Model Repository BI Generation
RPM Enterprise Planning Framework
Enterprise ServicesSpatial Data
RepositoryMaster Equipment
LibraryIAS 95 Services
Design Financials
XERAS Enterprise
XERAS Enterprise 2
Execution
XECUTE 1.1
Simulation
SIMULATE
HAULSIM 1.3, 2.0
Scheduling
Solutions 1.5, 1.6, 1.7
RESERVER 2.3
Phosphate Solution
Desktop
TALPAC 11.1
DRAGSIM 4.9.1
XERAS 8.5
HAULNET 2.2
Costing Calculation
Service
13
New Software Released - this Financial Year-to-Date (red)F
or p
erso
nal u
se o
nly

Enterprise Planning
Framework
New Product Adoption - 2016 Financial Year To Date
14
Global Framework Agreement
Plan Manager
For
per
sona
l use
onl
y

Open Cut Phosphate Solution - Finished
15
For
per
sona
l use
onl
y

XERAS Enterprise - Finished
16
For
per
sona
l use
onl
y
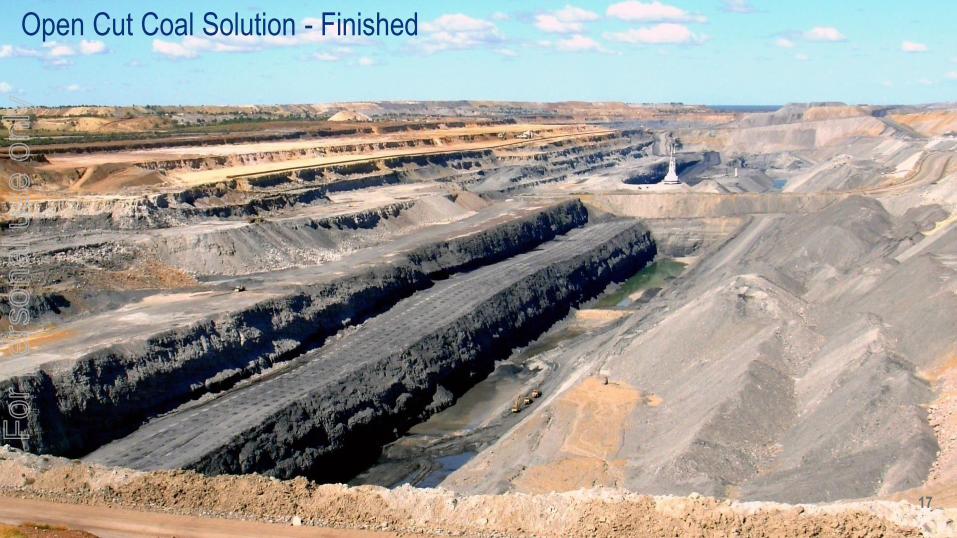
Open Cut Coal Solution - Finished
17
For
per
sona
l use
onl
y

Next Scheduling Solutions Focus - Underground Metals
18
For
per
sona
l use
onl
y
DISCLAIMER
The material in this presentation is a summary of the results of RungePincockMinarco Limited (RPM) for the six months ended 31 December 2015 including historical financial information from prior half year’s results as announced to the market and an update on RPM’s business and activities and is current at the date of preparation, 22 February 2016. Further details are provided in RPM’s Appendix 4D - Half Yearly Results - 31 December 2015 released on 22 February 2016 and RPM’s Appendix 4E and Annual Report for the full year ended 30 June 2015 released on 13 August 2015.
This presentation provides information in summary form only and is not intended to be complete. It is not intended to be relied upon as advice to investors or potential investors and does not take into account the investment objectives, financial situationor needs of any particular investor.
No representation, express or implied, is made as to the fairness, accuracy, completeness or correctness of information contained in this presentation, including the accuracy, likelihood of achievement or reasonableness of any forecasts, prospects,returns or statements in relation to future matters contained in the presentation (“forward-looking statements”). Such forward-looking statements are by their nature subject to significant uncertainties and contingencies and are based on a number of estimates and assumptions that are subject to change (and in many cases are outside the control of RPM and its Directors and Officers) which may cause the actual results or performance of RPM to be materially different from any future results or performance expressed or implied by such forward-looking statements.
Due care and consideration should be undertaken when considering and analysing RPM’s financial performance. All references to dollars are to Australian Dollars unless otherwise stated.
To the maximum extent permitted by law, neither RPM nor its related corporations, Directors, Officers, employees or agents, nor any other person, accepts any liability, including, without limitation, any liability arising from fault or negligence, for any loss arising from the use of this presentation or its contents or otherwise arising in connection with it. This presentation should be read in conjunction with other publicly available material including but not limited to RPM’s Appendix 4D - Half Yearly Results - 31 December 2015 released on 22 February 2016 and RPM’s Appendix 4E and Annual Report for the full year ended 30 June 2015 released on 13 August 2015. Further information including historical results and a description of the activities of RPM is available on our website, www.rpmglobal.com.
RungePincockMinarco and the RPM software products and services referenced in this presentation are the registered and unregistered trademarks of RungePincockMinarco Limited. The material in this presentation is the copyright of RungePincockMinarco Limited and may not be re-used in whole or in part without the prior consent of RPM.
19
For
per
sona
l use
onl
y