Embed Size (px)
Citation preview
Transforming world class gold assets into an outstanding businessDenver Gold Forum 2016, Denver Colorado USA – Tuesday 20 September, 2016F
or p
erso
nal u
se o
nly
2
Cautionary Statement
This presentation includes certain statements, estimates and projections with respect to the future performances of Resolute. Such statements, estimates and projections reflect various assumptions concerning anticipated results, which assumptions may prove not to be correct. The projections are merely estimates by Resolute, of the anticipated future performance of Resolute’s business based on interpretations of existing circumstances, and factual information and certain assumptions of economic results, which may prove to be incorrect. Such projections and estimates are not necessarily indicative of future performance, which may be significantly less favourable than as reflected herein. Accordingly, no representations are made as to the fairness, accuracy, correctness or completeness of the information contained in this presentation including estimates or projections and such statements, estimates and projections should not be relied upon as indicative of future value, or as a guarantee of value of future results. This presentation does not constitute an offer, invitation or recommendation to subscribe for or purchase securities in Resolute Mining Limited.
The information in this report that relates to the Exploration Results, Mineral Resources and Ore Reserves is based on information compiled by Mr Richard Bray who is a Registered Professional Geologist with the Australian Institute of Geoscientists and Mr Andrew Goode, a member of The Australasian Institute of Mining and Metallurgy. Mr Richard Bray and Mr Andrew Goode both have more than 5 years’ experience relevant to the styles of mineralisation and type of deposit under consideration and to the activity which they are undertaking to qualify as a Competent Person, as defined in the 2012 Edition of the “Australasian Code for Reporting of Exploration Results, Mineral Resources and Ore Reserves”. Mr Richard Bray and Mr Andrew Goode are full time employees of Resolute Mining Limited Group and each hold equity securities in the Company. They have consented to the inclusion of the matters in this report based on their information in the form and context in which it appears. This information was prepared and first disclosed under the JORC Code 2004. Except where noted, it has not been updated since to comply with the JORC Code 2012 on the basis that the information has not materially changed since it was last reported.
In providing this presentation, Resolute has not considered the objectives, financial position or the needs of the recipient. The recipient should obtain and rely on its own financial advice from its tax legal accounting and other professional advisers in respect of the recipients objectives financial position and needs. To the maximum extent permitted by law neither Resolute nor its related corporations ,directors, employees or agents nor any other person accepts liability for any loss arising from the use of this presentation or its contents or otherwise arising in connection with it. You represent and confirm by attending and or retaining this presentation that you accept the above conditions.
For
per
sona
l use
onl
y
3
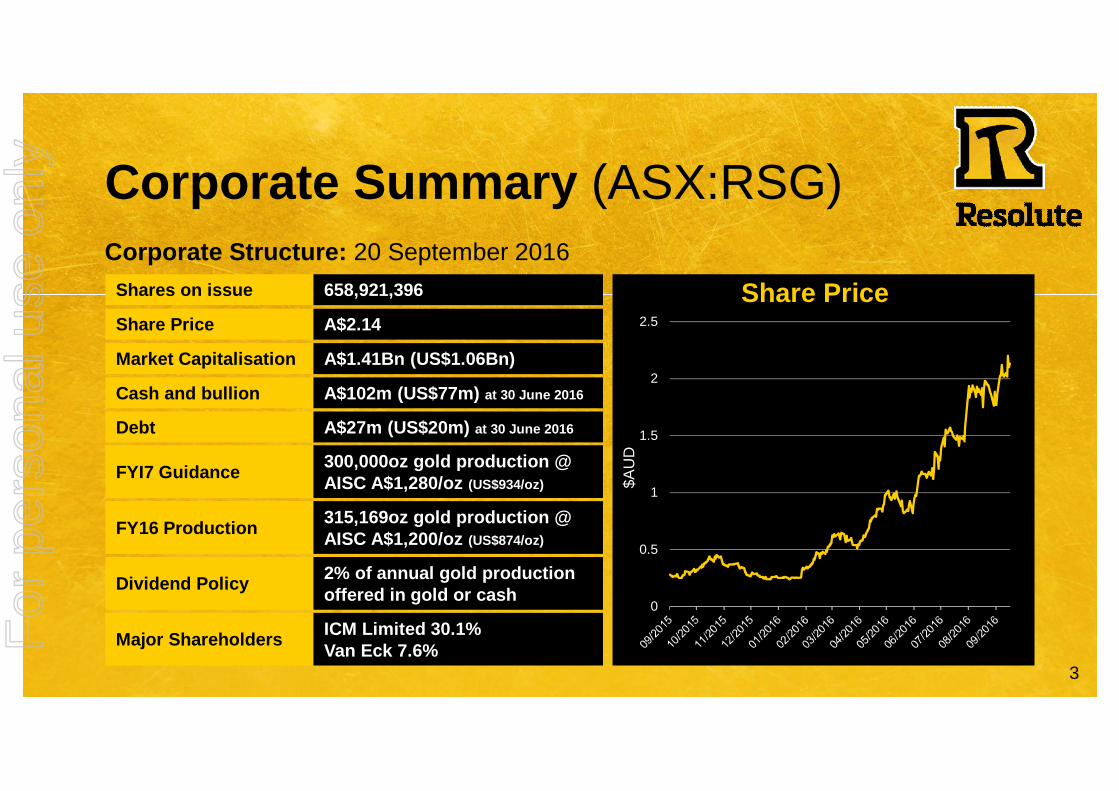
Corporate Summary (ASX:RSG)
0
0.5
1
1.5
2
2.5
$AU
D
Share PriceCorporate Structure: 20 September 2016
Shares on issue 658,921,396
Share Price A$2.14
Market Capitalisation A$1.41Bn (US$1.06Bn)
Cash and bullion A$102m (US$77m) at 30 June 2016
Debt A$27m (US$20m) at 30 June 2016
FYI7 Guidance 300,000oz gold production @ AISC A$1,280/oz (US$934/oz)
FY16 Production 315,169oz gold production @ AISC A$1,200/oz (US$874/oz)
Dividend Policy 2% of annual gold productionoffered in gold or cash
Major Shareholders ICM Limited 30.1%Van Eck 7.6%F
or p
erso
nal u
se o
nly
4
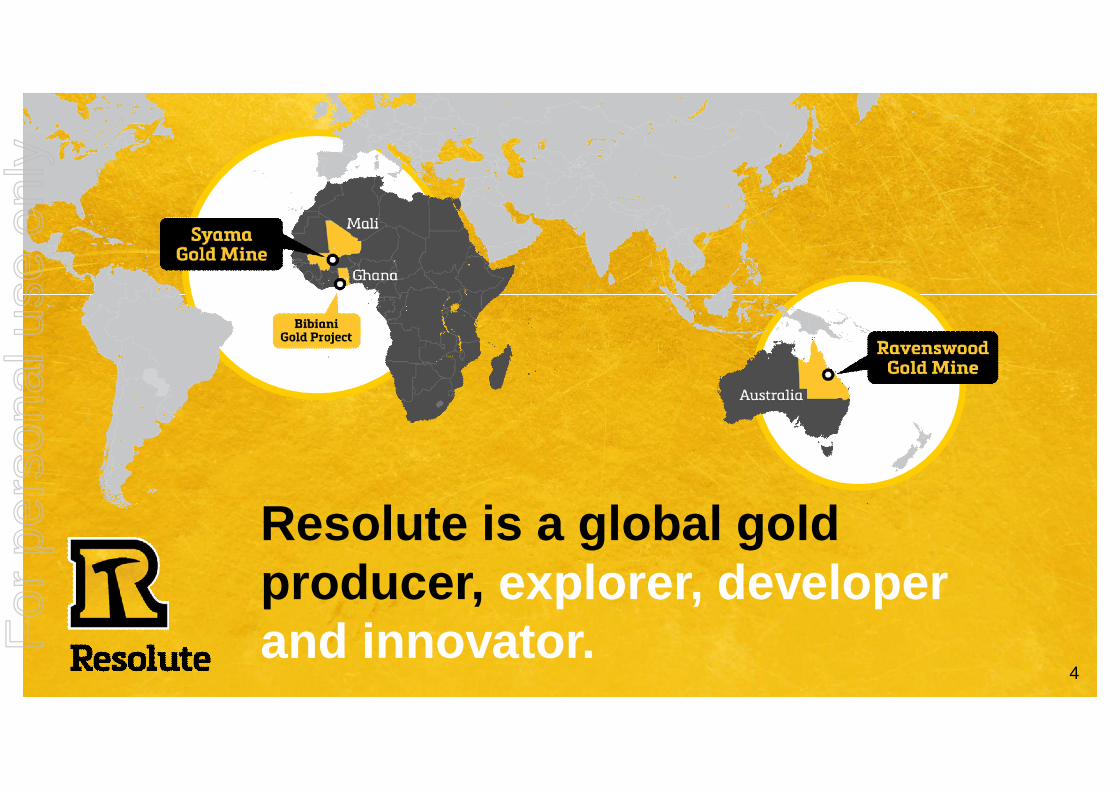
Resolute is a global gold producer, explorer, developer and innovator.F
or p
erso
nal u
se o
nly
50
1,000,000
2,000,000
3,000,000
4,000,000
5,000,000
6,000,000
7,000,000
8,000,000
1993 1994 1995 1996 1997 1998 1999 2000 2001 2002 2003 2004 2005 2006 2007 2008 2009 2010 2011 2012 2013 2014 2015 2016
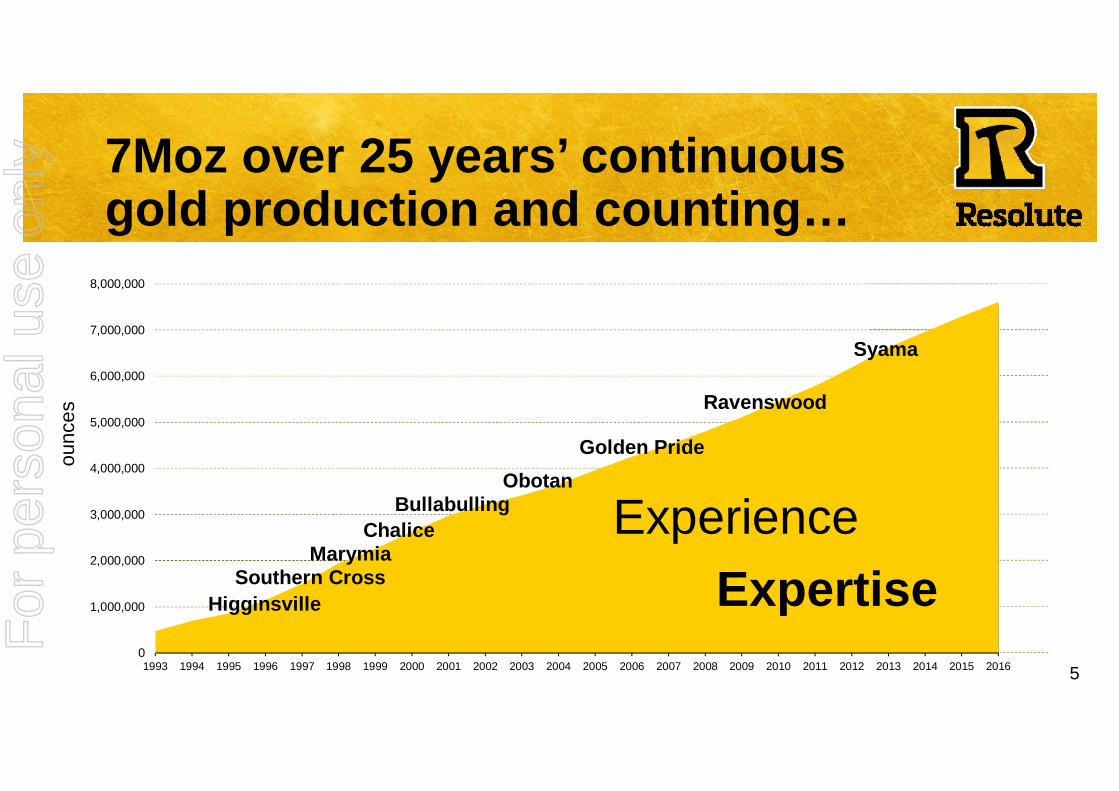
7Moz over 25 years’ continuous gold production and counting…
HigginsvilleSouthern Cross
MarymiaChalice
BullabullingObotan
Golden Pride
Ravenswood
Syama
ExperienceExpertise
ounc
esF
or p
erso
nal u
se o
nly
6
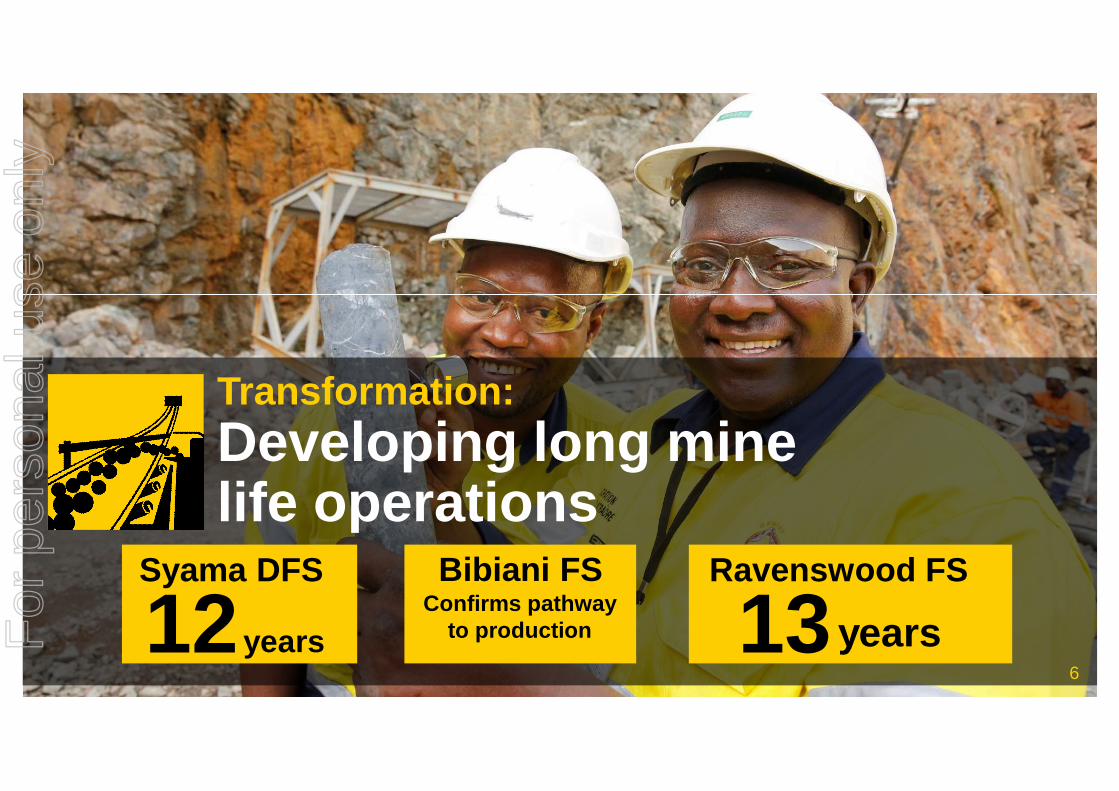
Transformation:Developing long mine life operations
Syama DFS
12yearsConfirms pathway
to production
Bibiani FS Ravenswood FS
13years6
For
per
sona
l use
onl
y
7
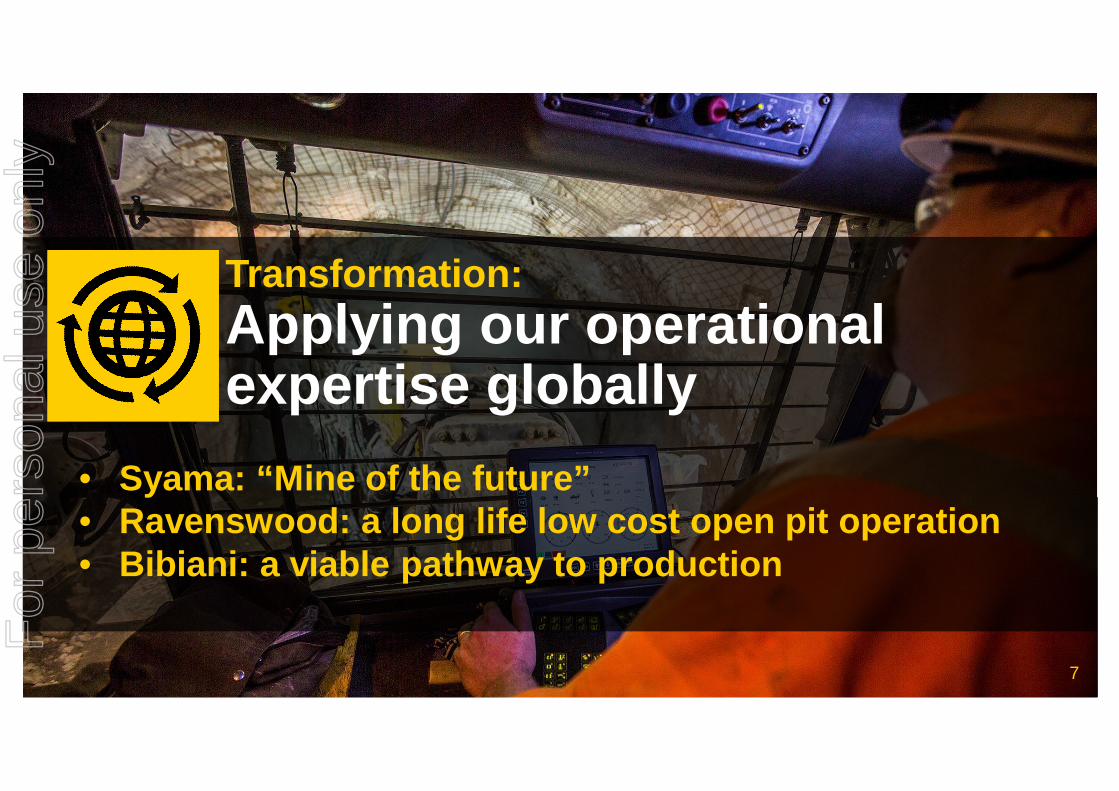
Transformation:Applying our operational expertise globally
• Syama: “Mine of the future”• Ravenswood: a long life low cost open pit operation• Bibiani: a viable pathway to production
7
For
per
sona
l use
onl
y
8
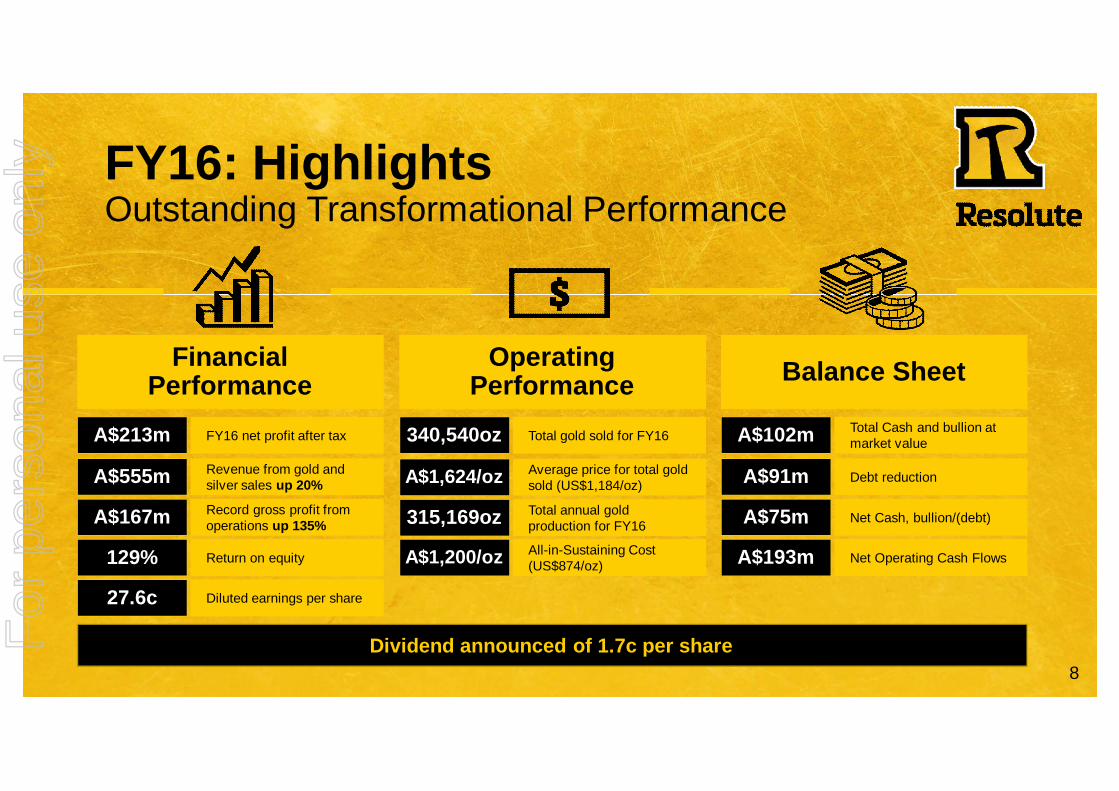
FY16: HighlightsOutstanding Transformational Performance
Dividend announced of 1.7c per share
Financial Performance
Operating Performance Balance Sheet
A$213m FY16 net profit after tax
A$555m Revenue from gold and silver sales up 20%
A$167m Record gross profit from operations up 135%
129% Return on equity
27.6c Diluted earnings per share
340,540oz Total gold sold for FY16
A$1,624/oz Average price for total gold sold (US$1,184/oz)
315,169oz Total annual gold production for FY16
A$1,200/oz All-in-Sustaining Cost (US$874/oz)
A$102m Total Cash and bullion at market value
A$91m Debt reduction
A$75m Net Cash, bullion/(debt)
A$193m Net Operating Cash Flows
For
per
sona
l use
onl
y
9
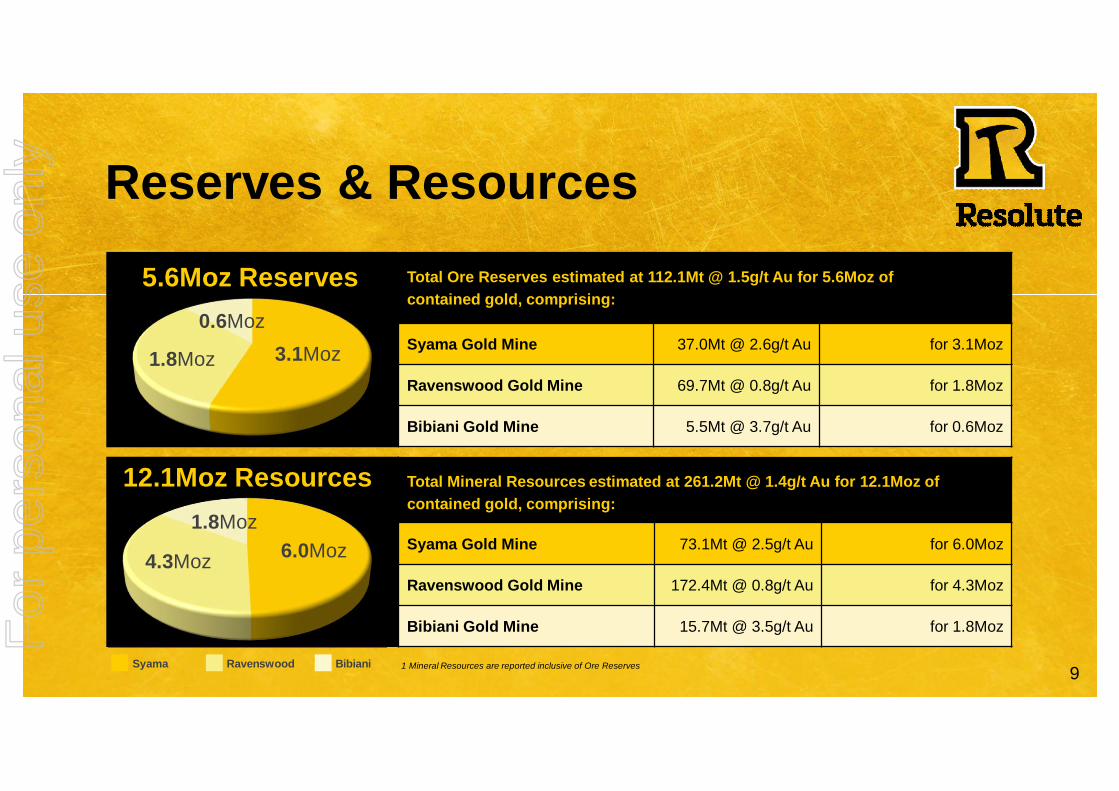
Reserves & Resources
1 Mineral Resources are reported inclusive of Ore Reserves
12.1Moz Resources
4.3Moz
1.8Moz6.0Moz
Syama Ravenswood Bibiani
1.8Moz
0.6Moz3.1Moz
5.6Moz Reserves Total Ore Reserves estimated at 112.1Mt @ 1.5g/t Au for 5.6Moz of contained gold, comprising:
Syama Gold Mine 37.0Mt @ 2.6g/t Au for 3.1Moz
Ravenswood Gold Mine 69.7Mt @ 0.8g/t Au for 1.8Moz
Bibiani Gold Mine 5.5Mt @ 3.7g/t Au for 0.6Moz
Total Mineral Resources estimated at 261.2Mt @ 1.4g/t Au for 12.1Moz of contained gold, comprising:
Syama Gold Mine 73.1Mt @ 2.5g/t Au for 6.0Moz
Ravenswood Gold Mine 172.4Mt @ 0.8g/t Au for 4.3Moz
Bibiani Gold Mine 15.7Mt @ 3.5g/t Au for 1.8MozFor
per
sona
l use
onl
y
10
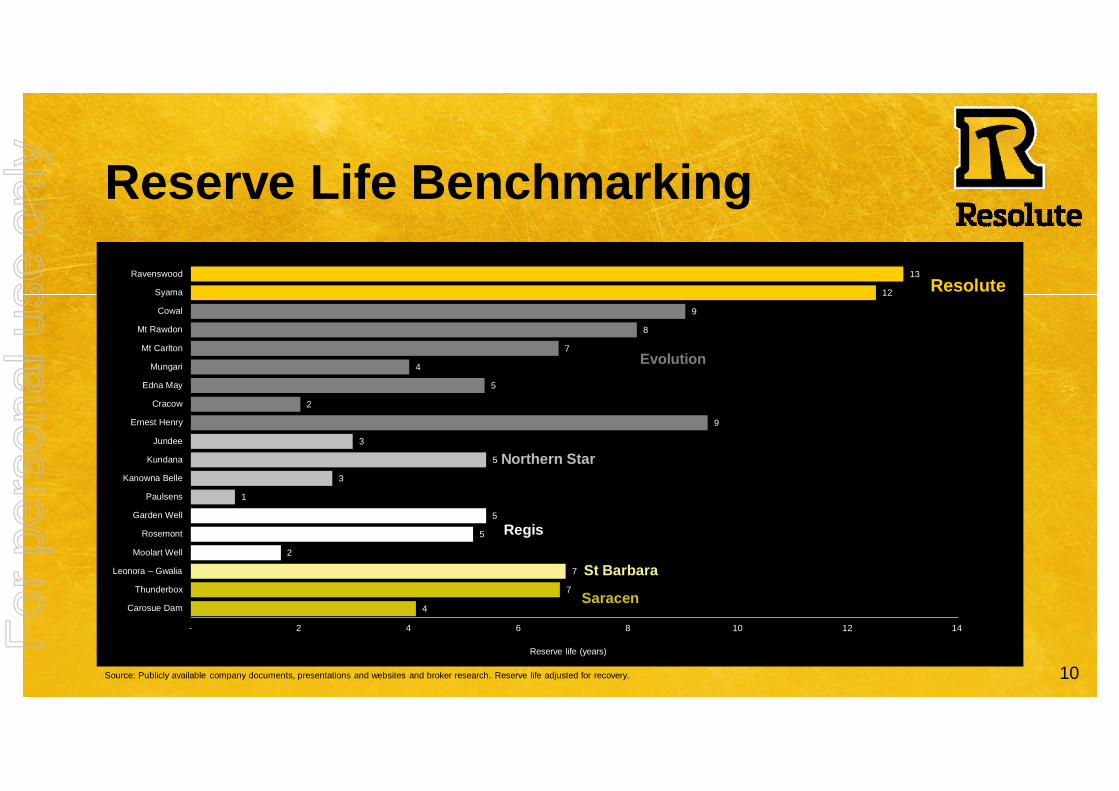
Reserve Life Benchmarking13
12
9
8
7
4
5
2
9
3
5
3
1
5
5
2
7
7
4
- 2 4 6 8 10 12 14
Ravenswood
Syama
Cowal
Mt Rawdon
Mt Carlton
Mungari
Edna May
Cracow
Ernest Henry
Jundee
Kundana
Kanowna Belle
Paulsens
Garden Well
Rosemont
Moolart Well
Leonora – Gwalia
Thunderbox
Carosue Dam
Reserve life (years)
Resolute
Evolution
Northern Star
Regis
St Barbara
Saracen
Source: Publicly available company documents, presentations and websites and broker research. Reserve life adjusted for recovery.
For
per
sona
l use
onl
y
11
1,13
4
851
777
722
704
632
598
503
482
396
382
372
248
239
230
224
172
150
73
Nor
ther
n St
ar
Reg
is
Rox
gold
Evol
utio
n
Sara
cen
Cen
tam
in
Oce
anaG
old
B2G
old
SEM
AFO
Ende
avou
r
Acac
ia
St. B
arba
ra
Met
als
X
IAM
GO
LD
Asan
ko
Res
olut
e
Nor
d G
old
Alac
er
Pers
eus
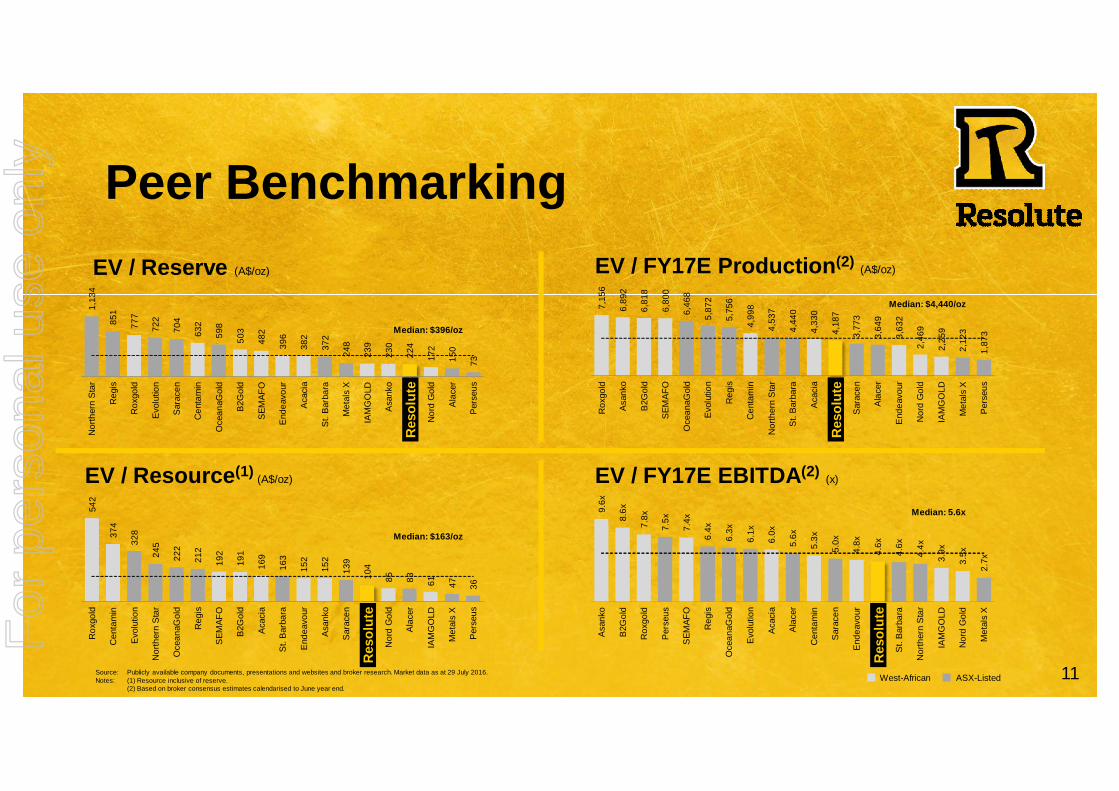
Peer Benchmarking
9.6x
8.6x
7.8x
7.5x
7.4x
6.4x
6.3x
6.1x
6.0x
5.6x
5.3x
5.0x
4.8x
4.6x
4.6x
4.4x
3.9x
3.5x
2.7x
Asan
ko
B2G
old
Rox
gold
Pers
eus
SEM
AFO
Reg
is
Oce
anaG
old
Evol
utio
n
Acac
ia
Alac
er
Cen
tam
in
Sara
cen
Ende
avou
r
Res
olut
e
St. B
arba
ra
Nor
ther
n St
ar
IAM
GO
LD
Nor
d G
old
Met
als
X
542
374
328
245
222
212
192
191
169
163
152
152
139
104
85 83 61 47 36
Rox
gold
Cen
tam
in
Evol
utio
n
Nor
ther
n St
ar
Oce
anaG
old
Reg
is
SEM
AFO
B2G
old
Acac
ia
St. B
arba
ra
Ende
avou
r
Asan
ko
Sara
cen
Res
olut
e
Nor
d G
old
Alac
er
IAM
GO
LD
Met
als
X
Pers
eus
7,15
6
6,89
2
6,81
8
6,80
0
6,46
8
5,87
2
5,75
6
4,99
8
4,53
7
4,44
0
4,33
0
4,18
7
3,77
3
3,64
9
3,63
2
2,46
9
2,25
9
2,12
3
1,87
3
Rox
gold
Asan
ko
B2G
old
SEM
AFO
Oce
anaG
old
Evol
utio
n
Reg
is
Cen
tam
in
Nor
ther
n St
ar
St. B
arba
ra
Acac
ia
Res
olut
e
Sara
cen
Alac
er
Ende
avou
r
Nor
d G
old
IAM
GO
LD
Met
als
X
Pers
eus
Source: Publicly available company documents, presentations and websites and broker research. Market data as at 29 July 2016.Notes: (1) Resource inclusive of reserve.
(2) Based on broker consensus estimates calendarised to June year end.West-African ASX-Listed
EV / FY17E Production(2) (A$/oz)
Median: $4,440/oz
EV / Resource(1) (A$/oz)
Median: $163/oz
EV / FY17E EBITDA(2) (x)
Median: 5.6x
EV / Reserve (A$/oz)
Median: $396/oz
Reso
lute
Reso
lute
Reso
lute
Reso
lute
For
per
sona
l use
onl
y
12
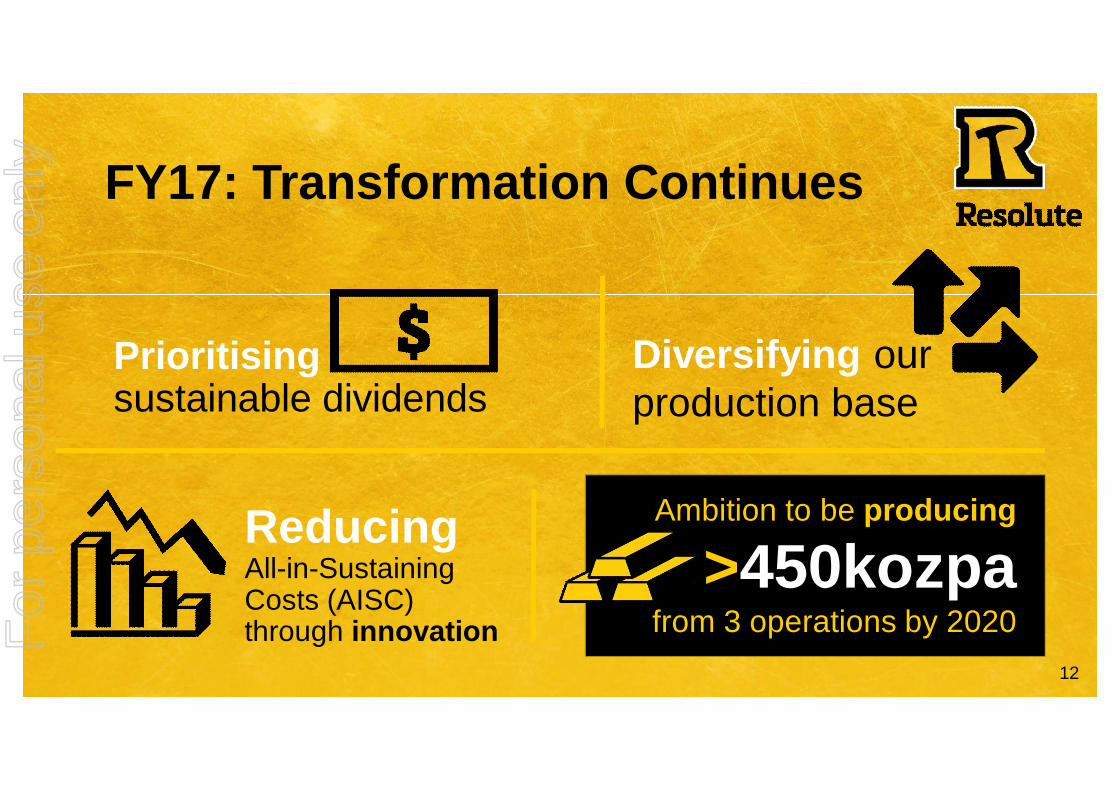
FY17: Transformation Continues
ReducingAll-in-Sustaining Costs (AISC) through innovation
Diversifying our production base
Ambition to be producing
>450kozpafrom 3 operations by 2020
Prioritisingsustainable dividends
For
per
sona
l use
onl
y
13
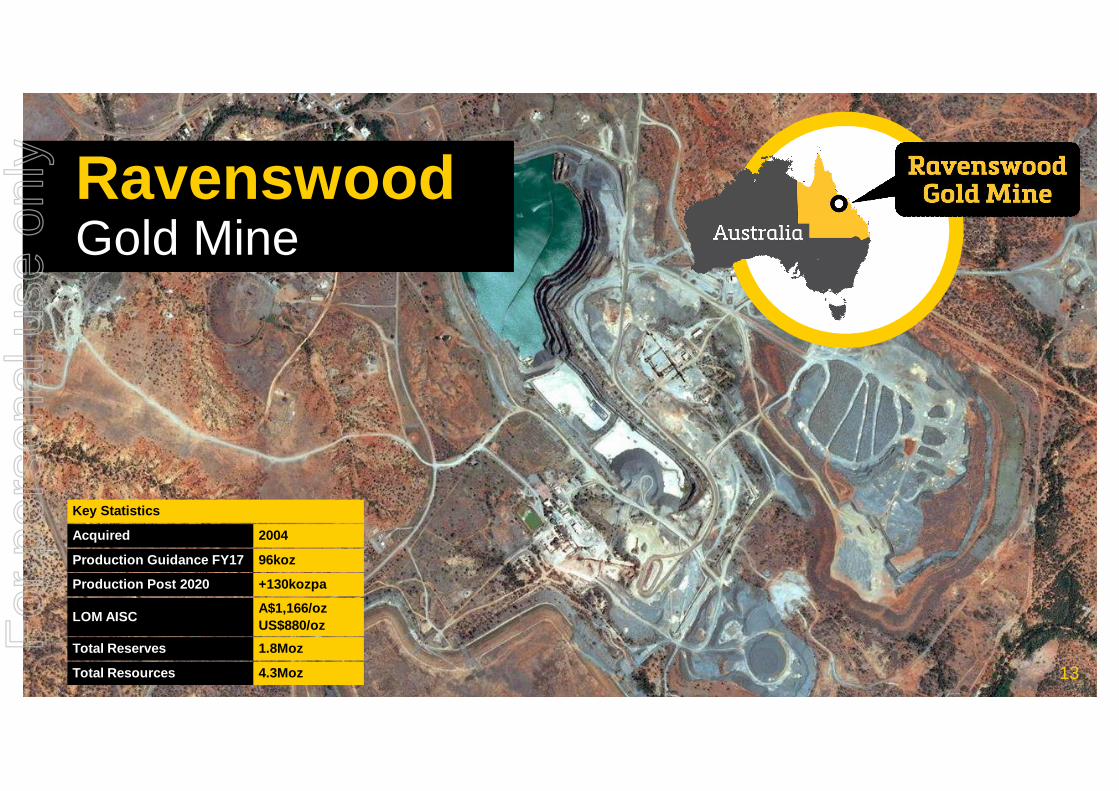
RavenswoodGold Mine
13
Acquired 2004
Production Guidance FY17 96koz
LOM AISC A$1,166/ozUS$880/oz
Total Reserves 1.8Moz
Total Resources 4.3Moz
Key Statistics
Production Post 2020 +130kozpa
For
per
sona
l use
onl
y
140
25,000
50,000
75,000
100,000
125,000
150,000
10/11 11/12 12/13 13/14 14/15 15/16
ounc
es
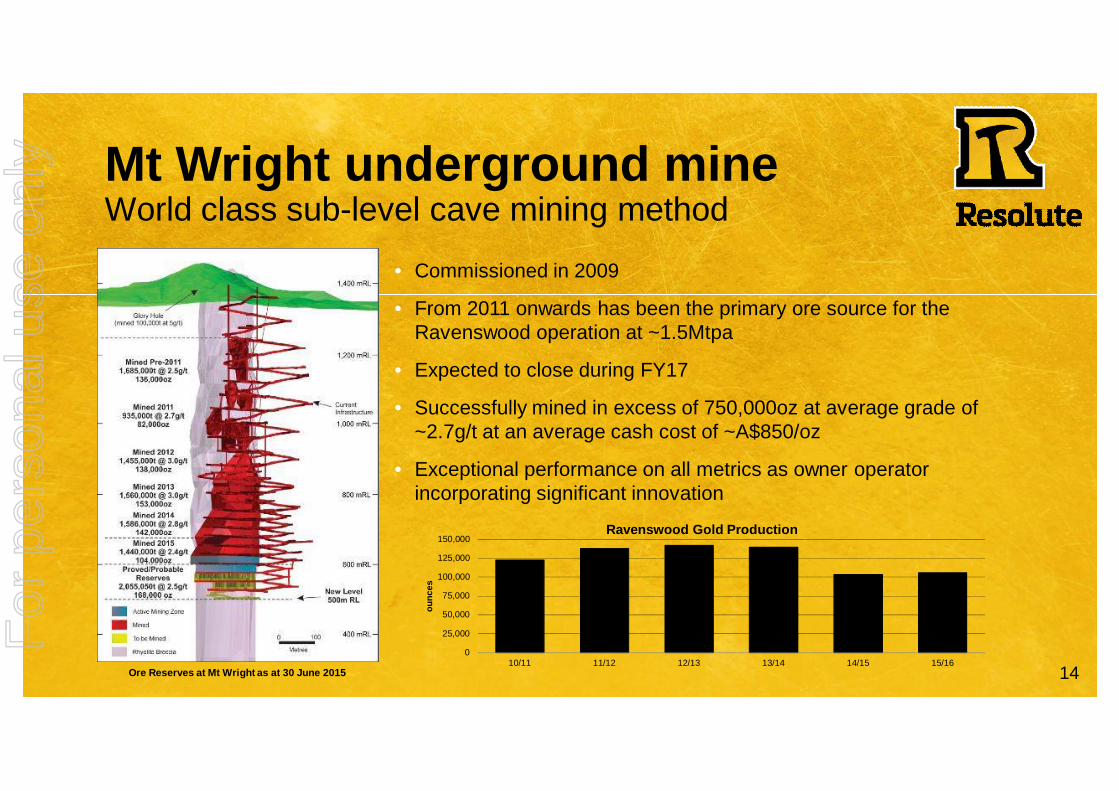
Ravenswood Gold Production
Mt Wright underground mineWorld class sub-level cave mining method
• Commissioned in 2009
• From 2011 onwards has been the primary ore source for the Ravenswood operation at ~1.5Mtpa
• Expected to close during FY17
• Successfully mined in excess of 750,000oz at average grade of ~2.7g/t at an average cash cost of ~A$850/oz
• Exceptional performance on all metrics as owner operator incorporating significant innovation
Ore Reserves at Mt Wright as at 30 June 2015
For
per
sona
l use
onl
y
15
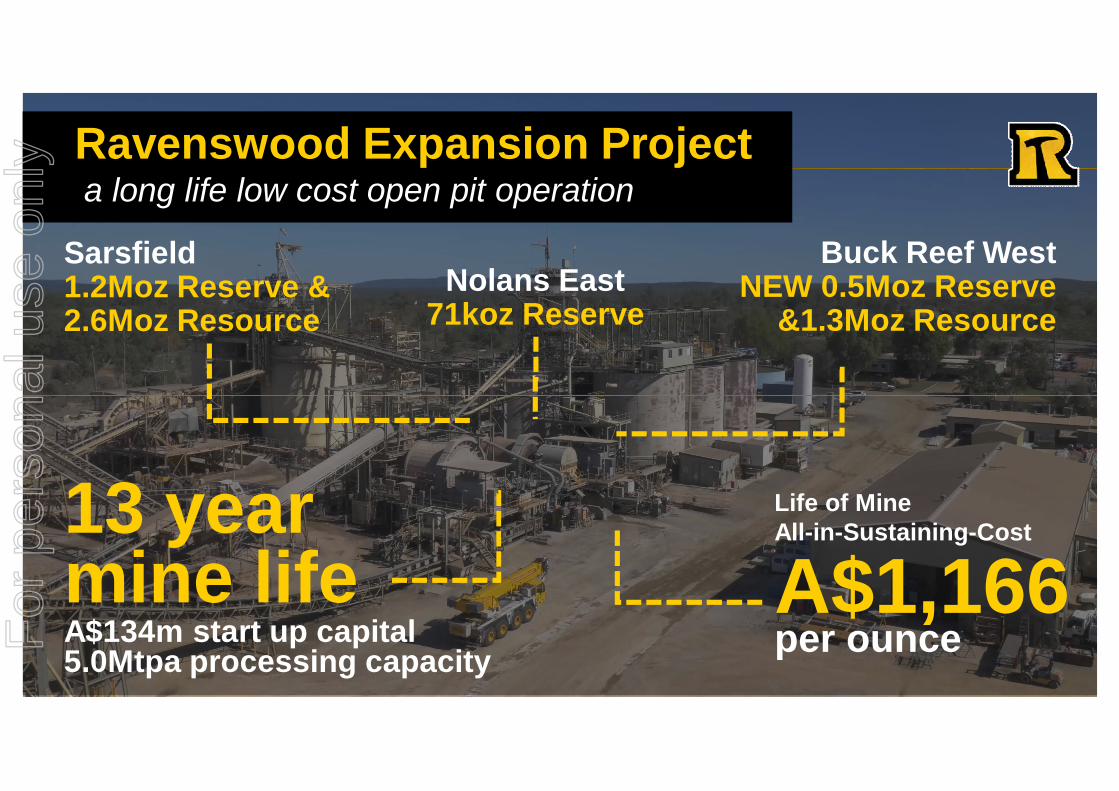
Ravenswood Expansion Projecta long life low cost open pit operation
Sarsfield1.2Moz Reserve &2.6Moz Resource
Buck Reef WestNEW 0.5Moz Reserve
&1.3Moz Resource
13 year mine lifeA$134m start up capital5.0Mtpa processing capacity
Nolans East71koz Reserve
Life of Mine All-in-Sustaining-Cost
A$1,166per ounceF
or p
erso
nal u
se o
nly
16
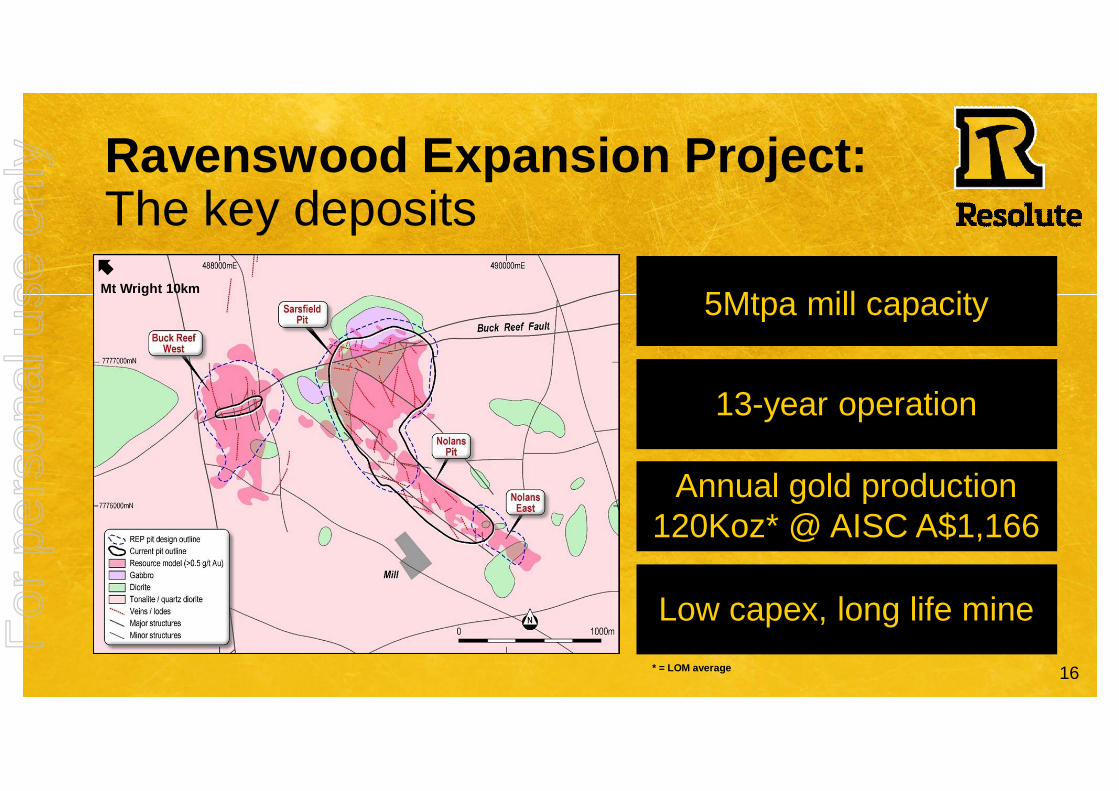
Mt Wright 10km
Ravenswood Expansion Project: The key deposits
5Mtpa mill capacity
13-year operation
Annual gold production 120Koz* @ AISC A$1,166
Low capex, long life mine* = LOM average
For
per
sona
l use
onl
y
17
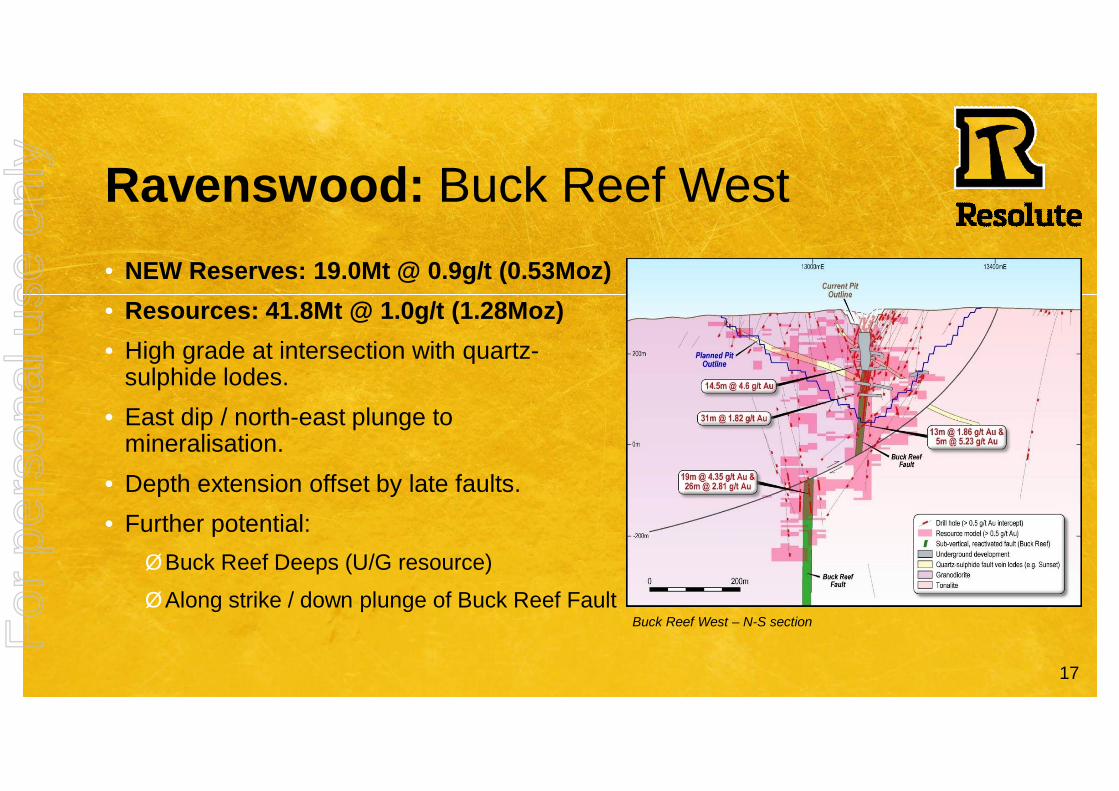
Ravenswood: Buck Reef West• NEW Reserves: 19.0Mt @ 0.9g/t (0.53Moz)• Resources: 41.8Mt @ 1.0g/t (1.28Moz)• High grade at intersection with quartz-
sulphide lodes.• East dip / north-east plunge to
mineralisation.• Depth extension offset by late faults.• Further potential:ØBuck Reef Deeps (U/G resource)ØAlong strike / down plunge of Buck Reef Fault
Buck Reef West – N-S sectionFor
per
sona
l use
onl
y
18
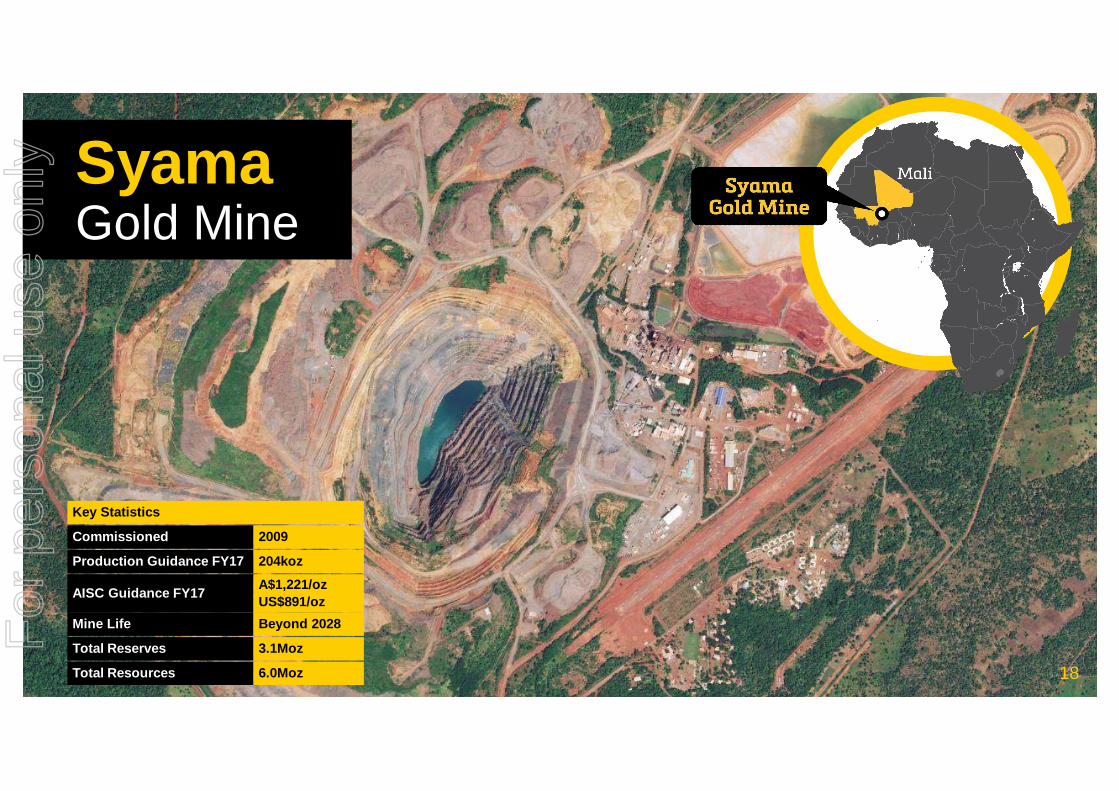
SyamaGold Mine
18
Commissioned 2009
Production Guidance FY17 204koz
AISC Guidance FY17 A$1,221/ozUS$891/oz
Total Reserves 3.1Moz
Total Resources 6.0Moz
Key Statistics
Mine Life Beyond 2028For
per
sona
l use
onl
y
19
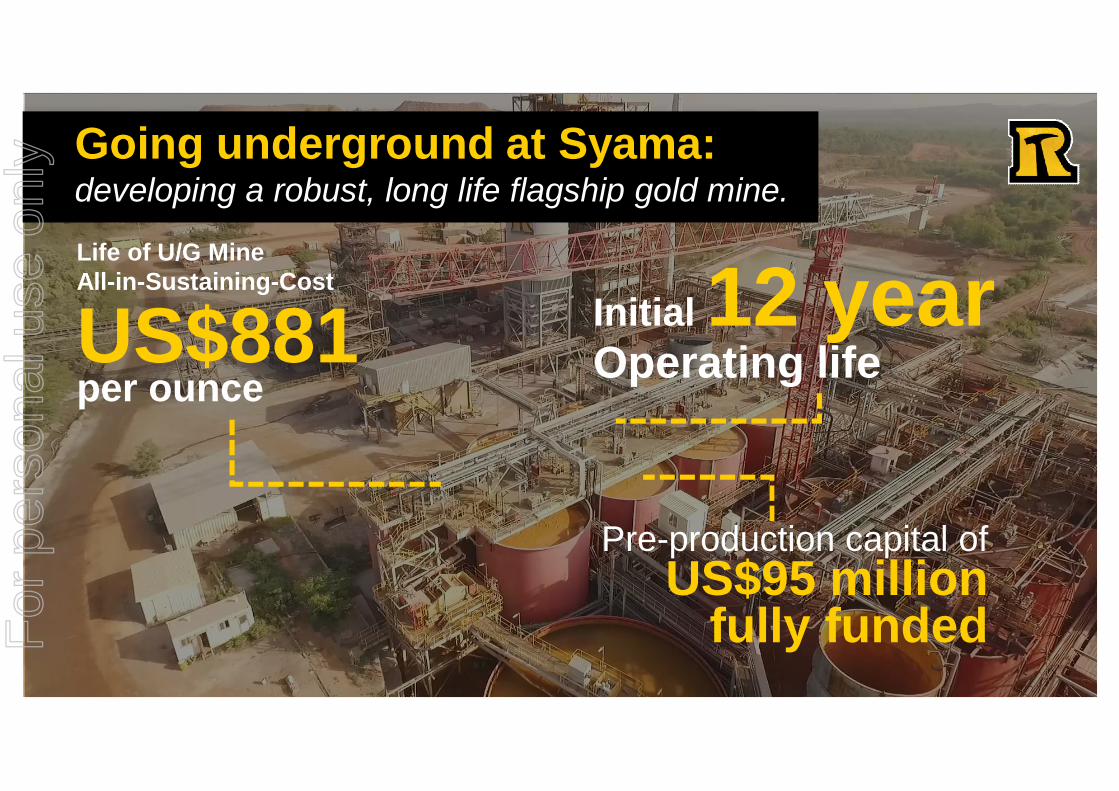
Going underground at Syama:developing a robust, long life flagship gold mine.
Life of U/G Mine All-in-Sustaining-Cost
US$881 per ounce
Initial 12 yearOperating life
Pre-production capital of US$95 million
fully fundedFor
per
sona
l use
onl
y
20
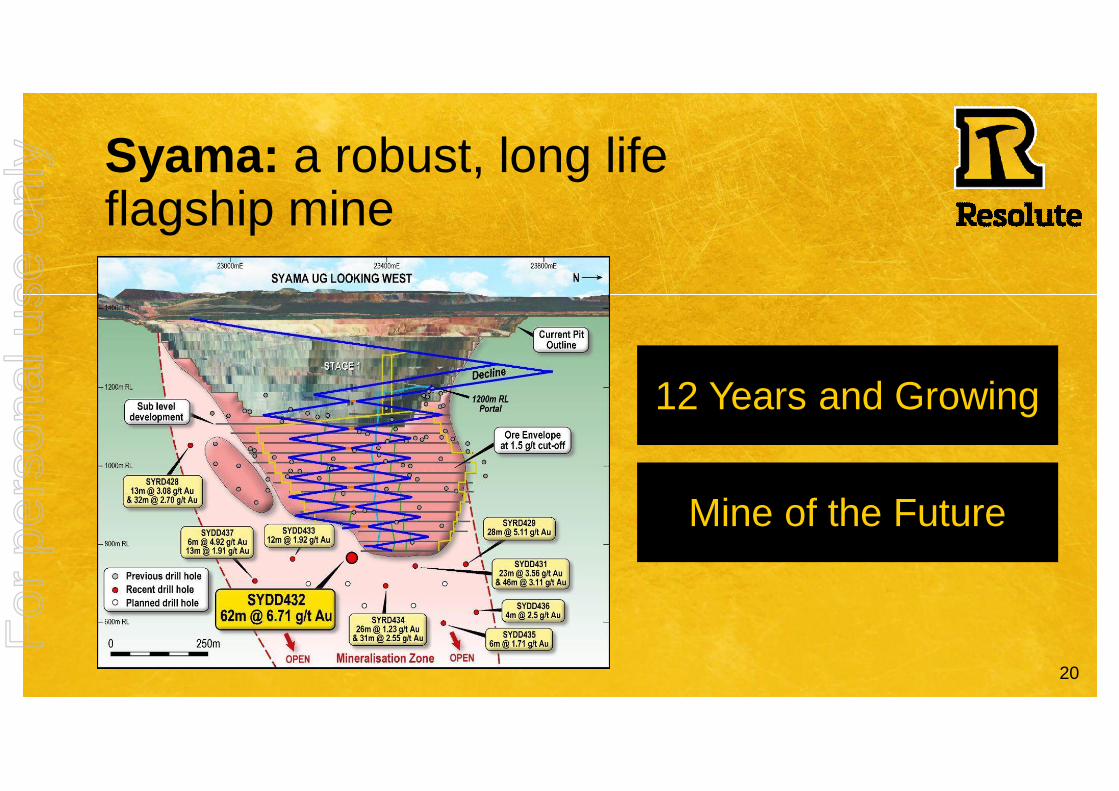
Syama: a robust, long life flagship mine
12 Years and Growing
Mine of the Future
For
per
sona
l use
onl
y
21
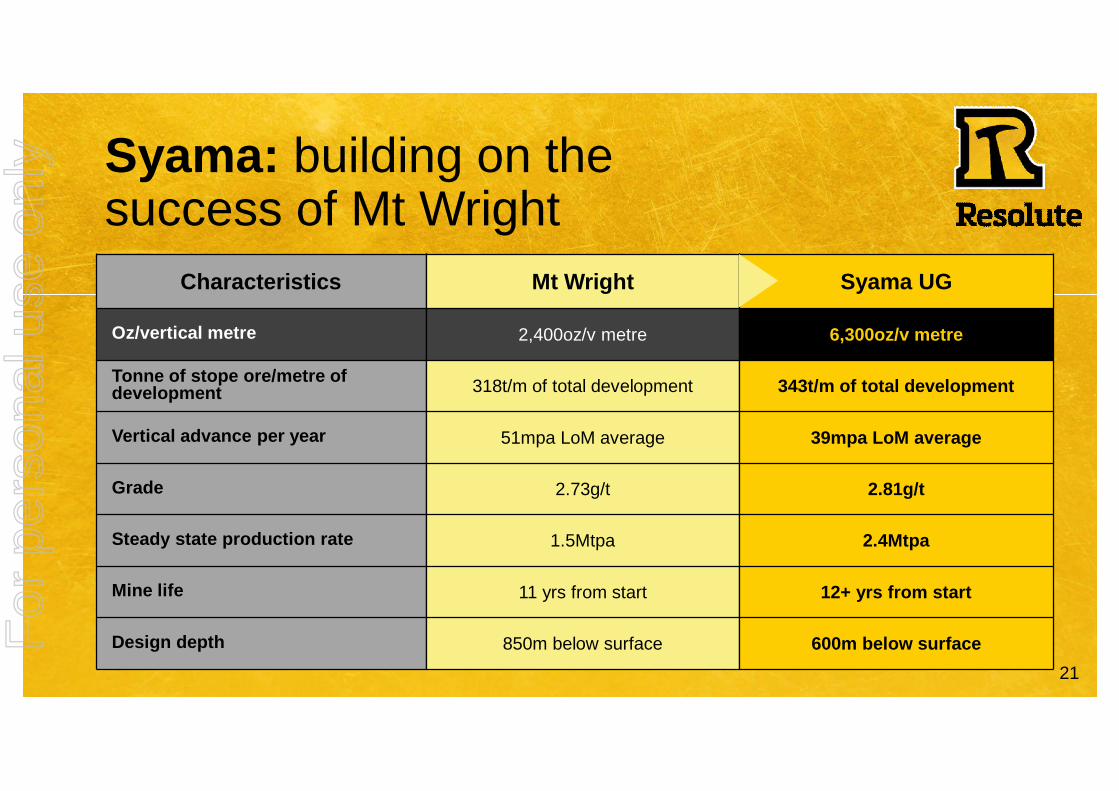
Syama: building on the success of Mt Wright
Characteristics
Oz/vertical metre
Tonne of stope ore/metre of development
Vertical advance per year
Grade
Steady state production rate
Mine life
Design depth
Mt Wright
2,400oz/v metre
318t/m of total development
51mpa LoM average
2.73g/t
1.5Mtpa
11 yrs from start
850m below surface
Syama UG
6,300oz/v metre
343t/m of total development
39mpa LoM average
2.81g/t
2.4Mtpa
12+ yrs from start
600m below surfaceFor
per
sona
l use
onl
y
22
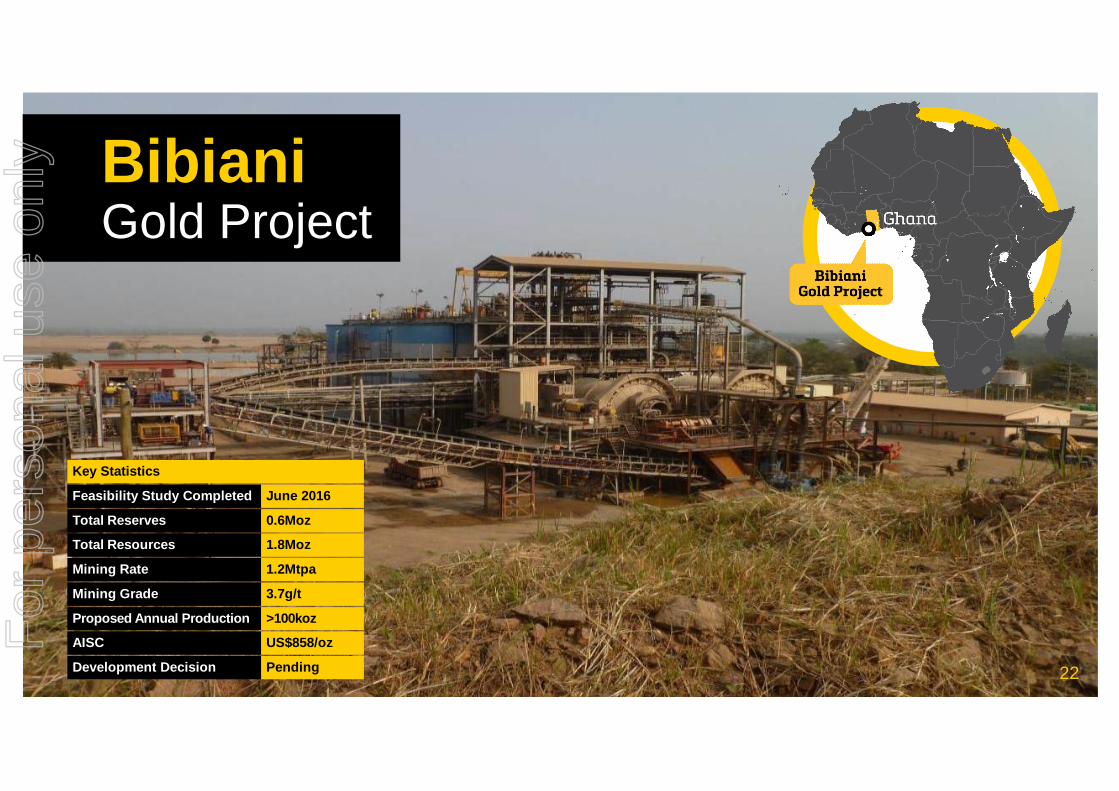
BibianiGold Project
22
Feasibility Study Completed June 2016
Key Statistics
Total Reserves 0.6Moz
Total Resources 1.8Moz
Mining Rate 1.2Mtpa
Mining Grade 3.7g/t
Proposed Annual Production >100koz
AISC US$858/oz
Development Decision Pending
For
per
sona
l use
onl
y
23
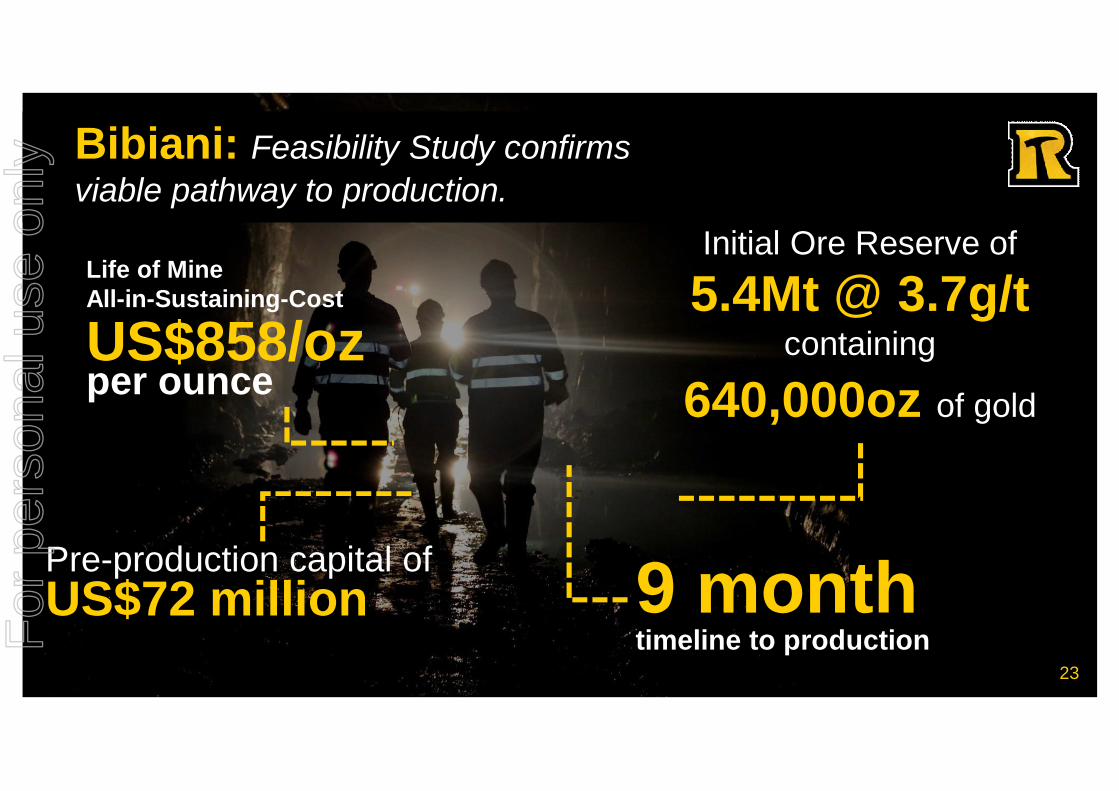
Bibiani: Feasibility Study confirms viable pathway to production.
Life of Mine All-in-Sustaining-Cost
US$858/ozper ounce
Initial Ore Reserve of 5.4Mt @ 3.7g/t
containing
640,000oz of gold
9 monthtimeline to production
Pre-production capital of US$72 million
23
For
per
sona
l use
onl
y
24
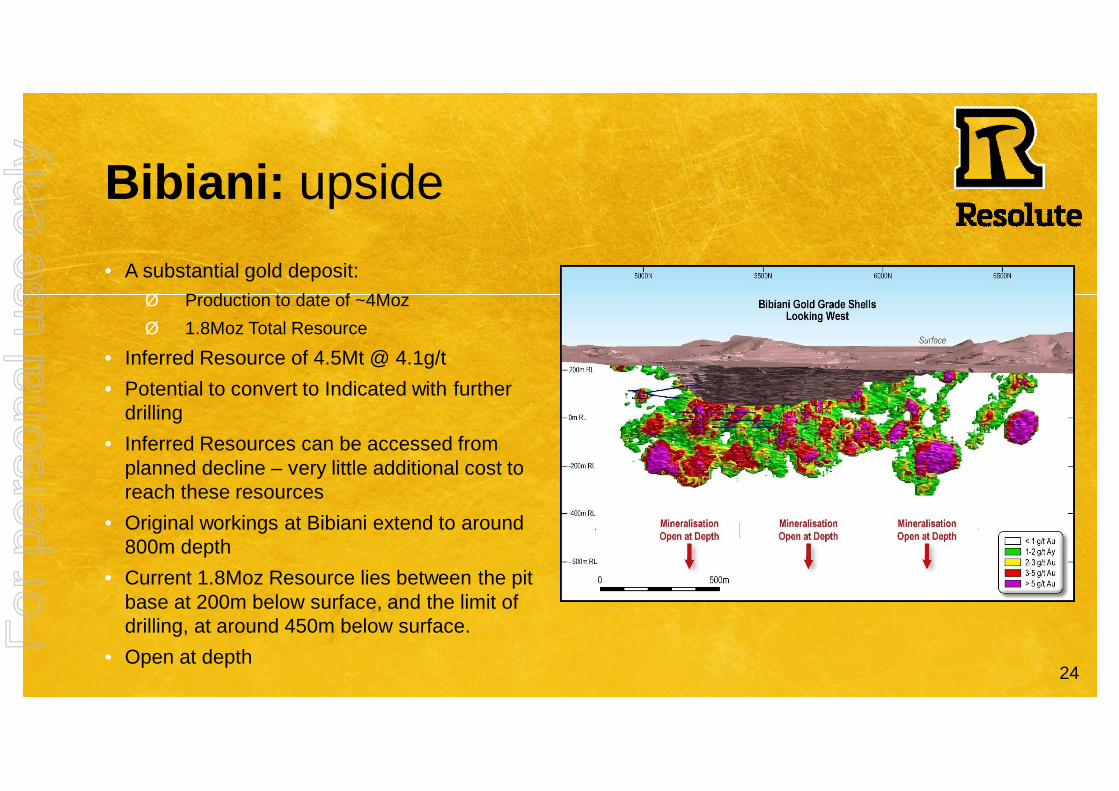
Bibiani: upside• A substantial gold deposit:
Ø Production to date of ~4MozØ 1.8Moz Total Resource
• Inferred Resource of 4.5Mt @ 4.1g/t• Potential to convert to Indicated with further
drilling• Inferred Resources can be accessed from
planned decline – very little additional cost to reach these resources
• Original workings at Bibiani extend to around 800m depth
• Current 1.8Moz Resource lies between the pit base at 200m below surface, and the limit of drilling, at around 450m below surface.
• Open at depthFor
per
sona
l use
onl
y
25
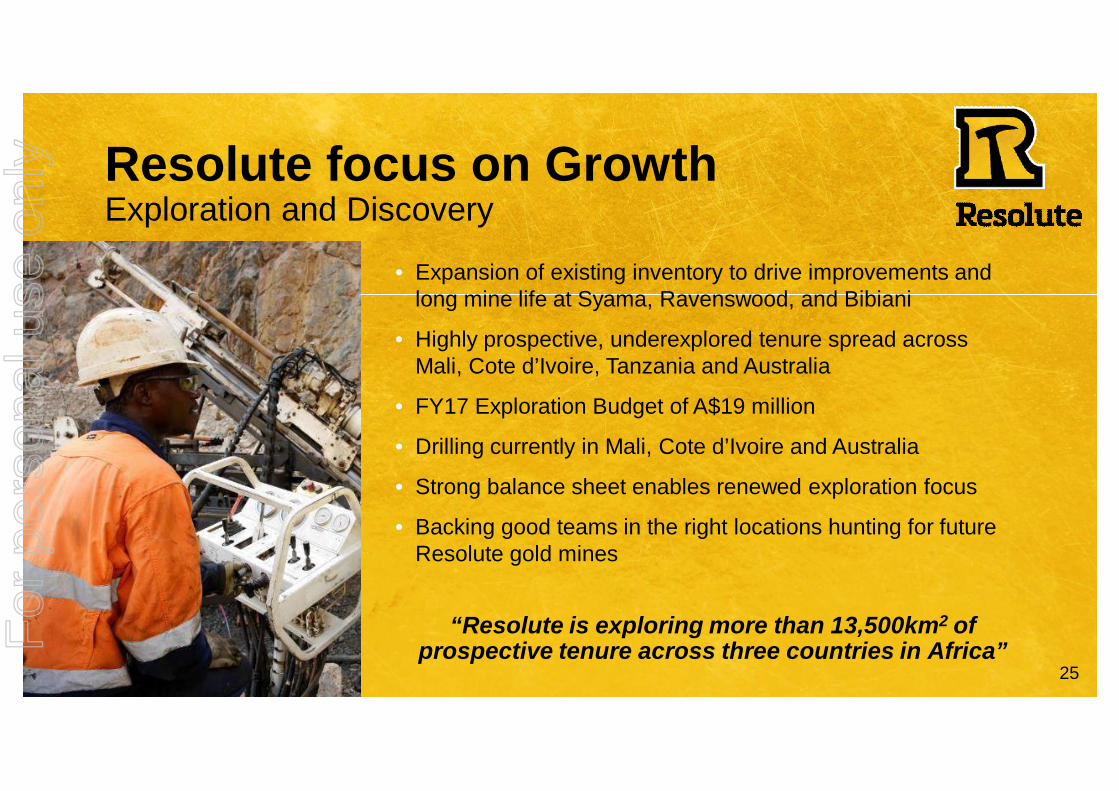
Resolute focus on GrowthExploration and Discovery
• Expansion of existing inventory to drive improvements and long mine life at Syama, Ravenswood, and Bibiani
• Highly prospective, underexplored tenure spread across Mali, Cote d’Ivoire, Tanzania and Australia
• FY17 Exploration Budget of A$19 million
• Drilling currently in Mali, Cote d’Ivoire and Australia
• Strong balance sheet enables renewed exploration focus
• Backing good teams in the right locations hunting for future Resolute gold mines
“Resolute is exploring more than 13,500km2 of prospective tenure across three countries in Africa”F
or p
erso
nal u
se o
nly
26
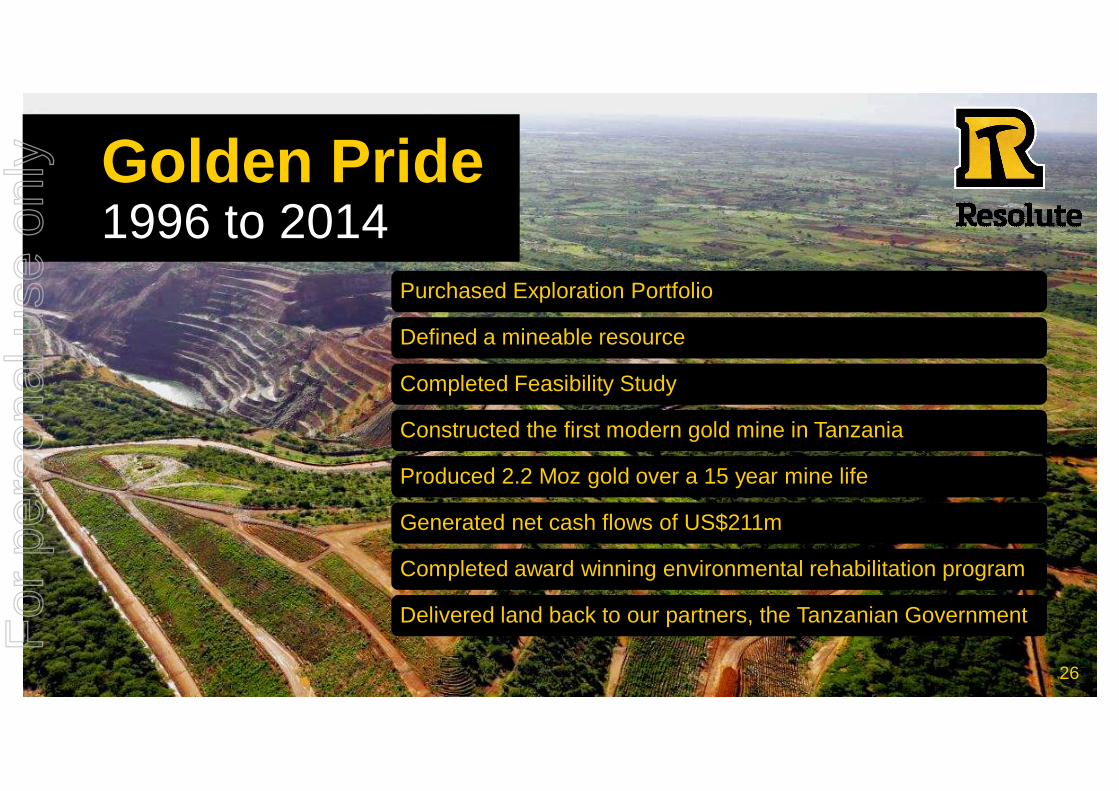
Purchased Exploration Portfolio
Defined a mineable resource
Completed Feasibility Study
Constructed the first modern gold mine in Tanzania
Produced 2.2 Moz gold over a 15 year mine life
Generated net cash flows of US$211m
Completed award winning environmental rehabilitation program
Delivered land back to our partners, the Tanzanian Government
Golden Pride1996 to 2014
26
For
per
sona
l use
onl
y
27
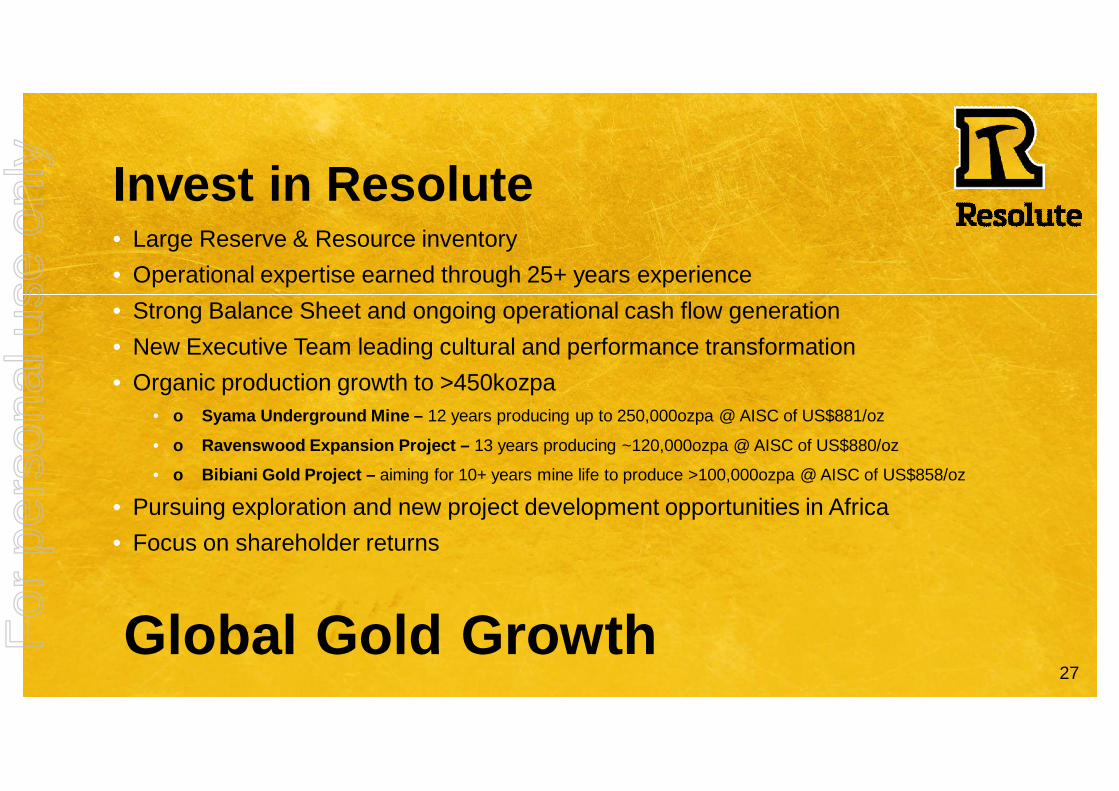
Invest in Resolute• Large Reserve & Resource inventory• Operational expertise earned through 25+ years experience• Strong Balance Sheet and ongoing operational cash flow generation• New Executive Team leading cultural and performance transformation• Organic production growth to >450kozpa
• o Syama Underground Mine – 12 years producing up to 250,000ozpa @ AISC of US$881/oz
• o Ravenswood Expansion Project – 13 years producing ~120,000ozpa @ AISC of US$880/oz
• o Bibiani Gold Project – aiming for 10+ years mine life to produce >100,000ozpa @ AISC of US$858/oz
• Pursuing exploration and new project development opportunities in Africa• Focus on shareholder returns
Global Gold GrowthFor
per
sona
l use
onl
y
28
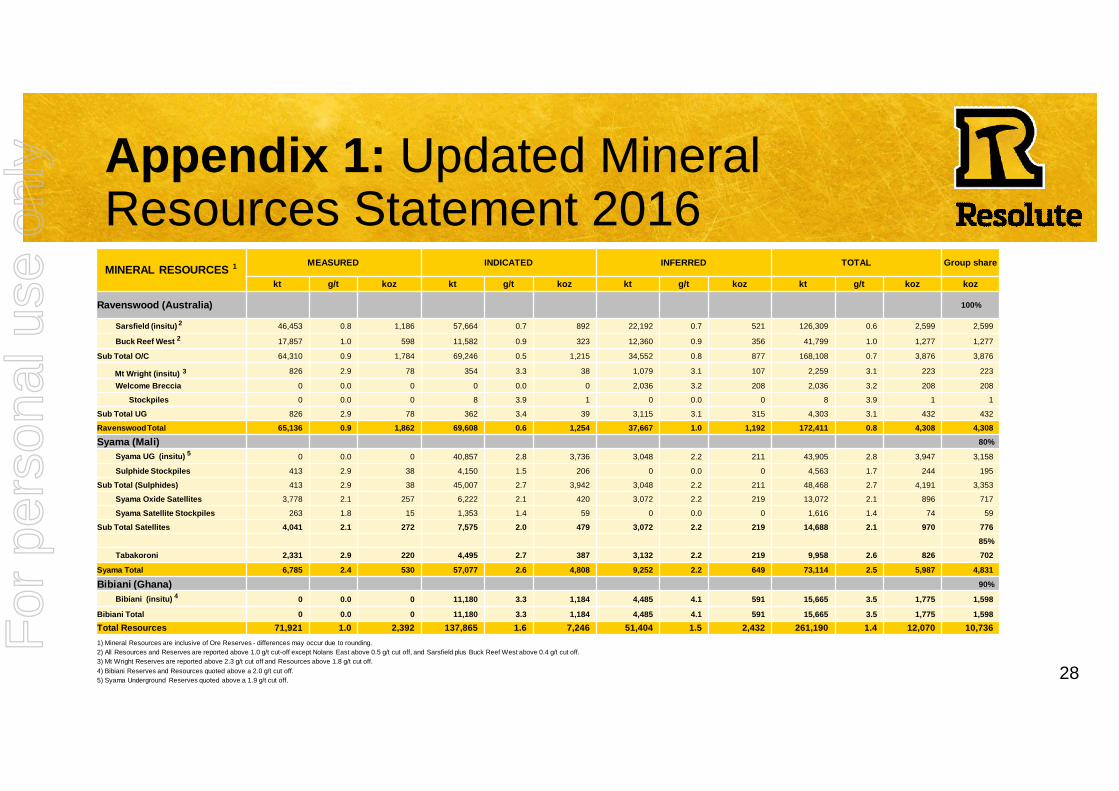
Appendix 1: Updated Mineral Resources Statement 2016MINERAL RESOURCES 1 MEASURED INDICATED INFERRED TOTAL Group share
kt g/t koz kt g/t koz kt g/t koz kt g/t koz koz
Ravenswood (Australia) 100%
Sarsfield (insitu) 2 46,453 0.8 1,186 57,664 0.7 892 22,192 0.7 521 126,309 0.6 2,599 2,599
Buck Reef West 2 17,857 1.0 598 11,582 0.9 323 12,360 0.9 356 41,799 1.0 1,277 1,277
Sub Total O/C 64,310 0.9 1,784 69,246 0.5 1,215 34,552 0.8 877 168,108 0.7 3,876 3,876
Mt Wright (insitu) 3 826 2.9 78 354 3.3 38 1,079 3.1 107 2,259 3.1 223 223
Welcome Breccia 0 0.0 0 0 0.0 0 2,036 3.2 208 2,036 3.2 208 208
Stockpiles 0 0.0 0 8 3.9 1 0 0.0 0 8 3.9 1 1
Sub Total UG 826 2.9 78 362 3.4 39 3,115 3.1 315 4,303 3.1 432 432
Ravenswood Total 65,136 0.9 1,862 69,608 0.6 1,254 37,667 1.0 1,192 172,411 0.8 4,308 4,308
Syama (Mali) 80%
Syama UG (insitu) 5 0 0.0 0 40,857 2.8 3,736 3,048 2.2 211 43,905 2.8 3,947 3,158
Sulphide Stockpiles 413 2.9 38 4,150 1.5 206 0 0.0 0 4,563 1.7 244 195
Sub Total (Sulphides) 413 2.9 38 45,007 2.7 3,942 3,048 2.2 211 48,468 2.7 4,191 3,353
Syama Oxide Satellites 3,778 2.1 257 6,222 2.1 420 3,072 2.2 219 13,072 2.1 896 717
Syama Satellite Stockpiles 263 1.8 15 1,353 1.4 59 0 0.0 0 1,616 1.4 74 59
Sub Total Satellites 4,041 2.1 272 7,575 2.0 479 3,072 2.2 219 14,688 2.1 970 77685%
Tabakoroni 2,331 2.9 220 4,495 2.7 387 3,132 2.2 219 9,958 2.6 826 702
Syama Total 6,785 2.4 530 57,077 2.6 4,808 9,252 2.2 649 73,114 2.5 5,987 4,831
Bibiani (Ghana) 90%
Bibiani (insitu) 4 0 0.0 0 11,180 3.3 1,184 4,485 4.1 591 15,665 3.5 1,775 1,598
Bibiani Total 0 0.0 0 11,180 3.3 1,184 4,485 4.1 591 15,665 3.5 1,775 1,598Total Resources 71,921 1.0 2,392 137,865 1.6 7,246 51,404 1.5 2,432 261,190 1.4 12,070 10,7361) Mineral Resources are inclusive of Ore Reserves - differences may occur due to rounding.2) All Resources and Reserves are reported above 1.0 g/t cut-off except Nolans East above 0.5 g/t cut off, and Sarsfield plus Buck Reef West above 0.4 g/t cut off.3) Mt Wright Reserves are reported above 2.3 g/t cut off and Resources above 1.8 g/t cut off.4) Bibiani Reserves and Resources quoted above a 2.0 g/t cut off.5) Syama Underground Reserves quoted above a 1.9 g/t cut off.
For
per
sona
l use
onl
y
29
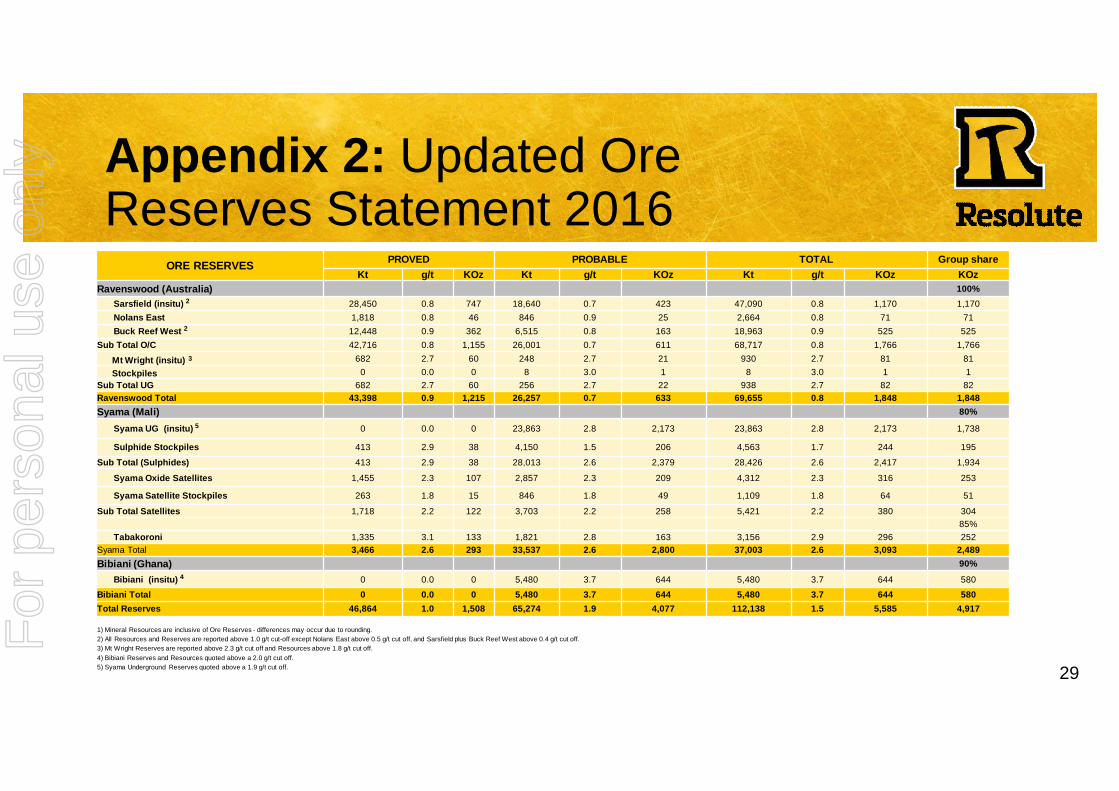
Appendix 2: Updated Ore Reserves Statement 2016
ORE RESERVES PROVED PROBABLE TOTAL Group shareKt g/t KOz Kt g/t KOz Kt g/t KOz KOz
Ravenswood (Australia) 100%Sarsfield (insitu) 2 28,450 0.8 747 18,640 0.7 423 47,090 0.8 1,170 1,170Nolans East 1,818 0.8 46 846 0.9 25 2,664 0.8 71 71Buck Reef West 2 12,448 0.9 362 6,515 0.8 163 18,963 0.9 525 525
Sub Total O/C 42,716 0.8 1,155 26,001 0.7 611 68,717 0.8 1,766 1,766
Mt Wright (insitu) 3 682 2.7 60 248 2.7 21 930 2.7 81 81Stockpiles 0 0.0 0 8 3.0 1 8 3.0 1 1
Sub Total UG 682 2.7 60 256 2.7 22 938 2.7 82 82Ravenswood Total 43,398 0.9 1,215 26,257 0.7 633 69,655 0.8 1,848 1,848Syama (Mali) 80%
Syama UG (insitu) 5 0 0.0 0 23,863 2.8 2,173 23,863 2.8 2,173 1,738
Sulphide Stockpiles 413 2.9 38 4,150 1.5 206 4,563 1.7 244 195
Sub Total (Sulphides) 413 2.9 38 28,013 2.6 2,379 28,426 2.6 2,417 1,934
Syama Oxide Satellites 1,455 2.3 107 2,857 2.3 209 4,312 2.3 316 253
Syama Satellite Stockpiles 263 1.8 15 846 1.8 49 1,109 1.8 64 51
Sub Total Satellites 1,718 2.2 122 3,703 2.2 258 5,421 2.2 380 30485%
Tabakoroni 1,335 3.1 133 1,821 2.8 163 3,156 2.9 296 252Syama Total 3,466 2.6 293 33,537 2.6 2,800 37,003 2.6 3,093 2,489Bibiani (Ghana) 90%
Bibiani (insitu) 4 0 0.0 0 5,480 3.7 644 5,480 3.7 644 580Bibiani Total 0 0.0 0 5,480 3.7 644 5,480 3.7 644 580Total Reserves 46,864 1.0 1,508 65,274 1.9 4,077 112,138 1.5 5,585 4,917
1) Mineral Resources are inclusive of Ore Reserves - differences may occur due to rounding.2) All Resources and Reserves are reported above 1.0 g/t cut-off except Nolans East above 0.5 g/t cut off, and Sarsfield plus Buck Reef West above 0.4 g/t cut off.3) Mt Wright Reserves are reported above 2.3 g/t cut off and Resources above 1.8 g/t cut off.4) Bibiani Reserves and Resources quoted above a 2.0 g/t cut off.5) Syama Underground Reserves quoted above a 1.9 g/t cut off.
For
per
sona
l use
onl
y