Embed Size (px)
Citation preview

Annual Report 2016for year ended 30 June 2016
BKI INVESTMENTCOMPANY LIMITED
ABN 23 106 719 868
For
per
sona
l use
onl
y
BKI INVESTMENT COMPANY LIMITED
ABN: 23 106 719 868
CORPORATE DIRECTORY
DirectorsRobert Dobson Millner Non-Executive ChairmanDavid Capp Hall AM Independent Non-Executive DirectorAlexander James Payne Non-Executive DirectorIan Thomas Huntley Independent Non-Executive Director
Chief Executive OfficerThomas Charles Dobson Millner
Portfolio ManagerWilliam Culbert
Company SecretariesJaime PintoLarina Tcherkezian (Alternate)
Registered OfficeLevel 2160 Pitt Street MallSydney NSW 2000Telephone: (02) 9210 7000Facsimile: (02) 9210 7099
Postal Address:GPO Box 5015Sydney 2001
AuditorsMGI Sydney Assurance Services Pty Ltd5th Floor, 6 O’Connell StreetSydney NSW 2000
Share RegistryAdvanced Share Registry Services Limited150 Stirling HighwayNedlands, WA 6009Telephone: (08) 9389 8033
Australian Stock Exchange CodeOrdinary Shares BKI
Websitewww.bkilimited.com.au
For
per
sona
l use
onl
y
BKI INVESTMENT COMPANY LIMITED
1
Contents Page No.
Financial Highlights 2
List of Securities as at 30 June 2016 3
Group Profile 5
Chairman’s Address 6
Directors’ Report 10
Consolidated Income Statement 21
Consolidated Statement of Other Comprehensive Income 22
Consolidated Statement of Financial Position 23
Consolidated Statement of Changes in Equity 24
Consolidated Cash Flow Statement 25
Notes to the Financial Statements 26
Directors’ Declaration 43
Independent Auditor’s Report 44
Auditor’s Independence Declaration 46
ASX Additional Information 47
For
per
sona
l use
onl
y
BKI INVESTMENT COMPANY LIMITED
FINANCIAL HIGHLIGHTS
2
Jun 2016 Jun 2015
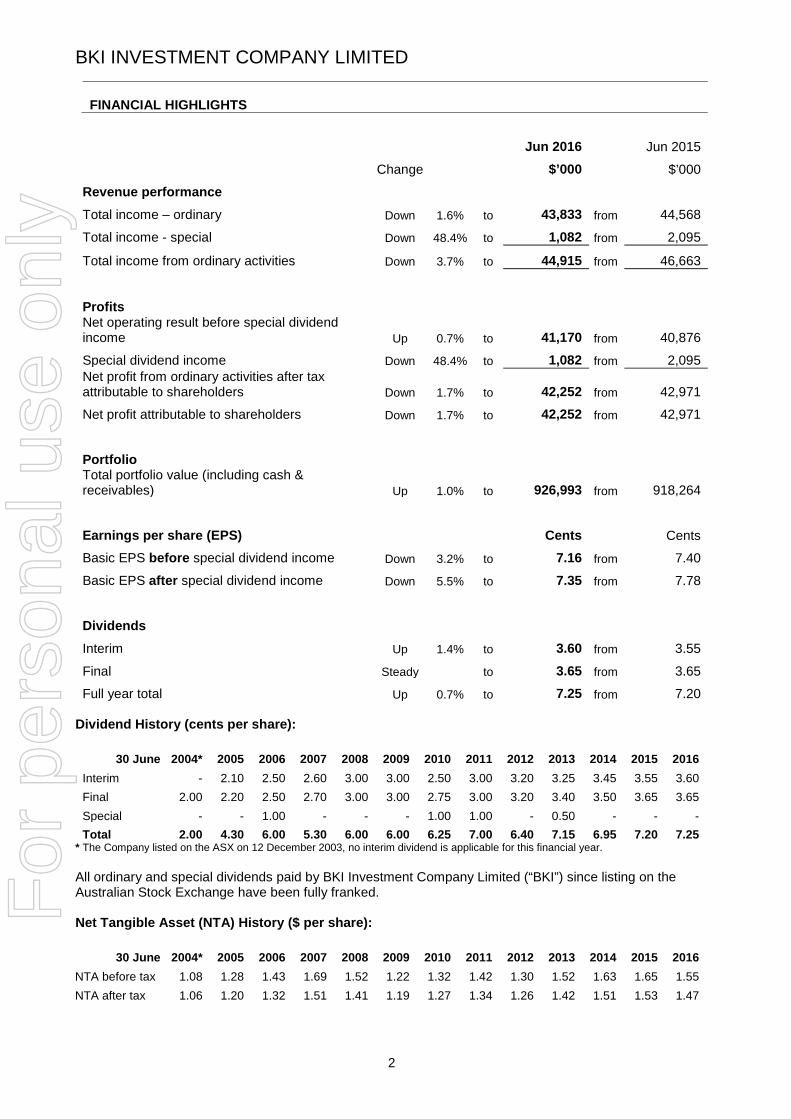
Change $’000 $’000Revenue performanceTotal income – ordinary Down 1.6% to 43,833 from 44,568
Total income - special Down 48.4% to 1,082 from 2,095
Total income from ordinary activities Down 3.7% to 44,915 from 46,663
ProfitsNet operating result before special dividendincome Up 0.7% to 41,170 from 40,876
Special dividend income Down 48.4% to 1,082 from 2,095Net profit from ordinary activities after taxattributable to shareholders Down 1.7% to 42,252 from 42,971Net profit attributable to shareholders Down 1.7% to 42,252 from 42,971
PortfolioTotal portfolio value (including cash &receivables) Up 1.0% to 926,993 from 918,264
Earnings per share (EPS) Cents CentsBasic EPS before special dividend income Down 3.2% to 7.16 from 7.40Basic EPS after special dividend income Down 5.5% to 7.35 from 7.78
DividendsInterim Up 1.4% to 3.60 from 3.55
Final Steady to 3.65 from 3.65Full year total Up 0.7% to 7.25 from 7.20
Dividend History (cents per share):
30 June 2004* 2005 2006 2007 2008 2009 2010 2011 2012 2013 2014 2015 2016Interim - 2.10 2.50 2.60 3.00 3.00 2.50 3.00 3.20 3.25 3.45 3.55 3.60Final 2.00 2.20 2.50 2.70 3.00 3.00 2.75 3.00 3.20 3.40 3.50 3.65 3.65Special - - 1.00 - - - 1.00 1.00 - 0.50 - - -Total 2.00 4.30 6.00 5.30 6.00 6.00 6.25 7.00 6.40 7.15 6.95 7.20 7.25
* The Company listed on the ASX on 12 December 2003, no interim dividend is applicable for this financial year.
All ordinary and special dividends paid by BKI Investment Company Limited (“BKI”) since listing on theAustralian Stock Exchange have been fully franked.
Net Tangible Asset (NTA) History ($ per share):
30 June 2004* 2005 2006 2007 2008 2009 2010 2011 2012 2013 2014 2015 2016NTA before tax 1.08 1.28 1.43 1.69 1.52 1.22 1.32 1.42 1.30 1.52 1.63 1.65 1.55NTA after tax 1.06 1.20 1.32 1.51 1.41 1.19 1.27 1.34 1.26 1.42 1.51 1.53 1.47
For
per
sona
l use
onl
y

BKI INVESTMENT COMPANY LIMITED
FINANCIAL HIGHLIGHTS - Continued
3
Securities Held and their Market value as at 30 June 2016
Number ofshares held
Market value$’000
Portfolioweight
%FinancialsCommonwealth Bank 1,102,477 81,991 8.83National Australia Bank 2,686,976 68,330 7.73Westpac Banking Corporation 2,262,015 66,503 7.17ANZ Banking Group 1,560,624 37,642 4.06IAG Limited 3,157,370 17,208 1.86ASX Limited 375,500 17,183 1.85Suncorp Group 1,196,094 14,568 1.57Macquarie Group 170,370 11,738 1.27AMP Limited 1,872,946 9,664 1.04Milton Corporation 2,103,640 9,004 0.97Bank of Queensland 810,000 8,578 0.93Challenger Limited 935,000 8,069 0.87Perpetual Limited 181,751 7,474 0.81IOOF Holdings 609,094 4,769 0.51Equity Trustees 162,961 2,679 0.29
365,401 39.40TelecommunicationsTPG Telecom 4,420,000 52,598 5.67Telstra Corporation 9,191,404 51,104 5.51
103,702 11.18IndustrialsTransurban Group 2,218,205 26,596 2.87Sydney Airport 2,045,427 14,195 1.53Brambles Limited 1,045,576 12,955 1.40Qube Holdings 4,652,747 10,283 1.11Seek Limited 537,500 8,175 0.88Lindsay Australia 16,341,631 7,762 0.84Programmed Maintenance Services 354,654 622 0.07Salmat Limited 1,080,088 475 0.05
81,064 8.74Consumer StaplesWesfarmers Limited 1,002,753 40,210 4.34Woolworths Limited 1,050,244 21,940 2.37Coca Cola Limited 1,233,894 10,155 1.10Graincorp Limited 93,444 806 0.09Amcor 14,388 215 0.02
73,326 7.91UtilitiesAPA Group 3,659,452 33,813 3.65AGL Energy Limited 1,250,708 24,126 2.60
57,939 6.25
For
per
sona
l use
onl
y
BKI INVESTMENT COMPANY LIMITED
FINANCIAL HIGHLIGHTS - Continued
4
List of Securities (Continued)
Number ofshares held
Market value$’000
Portfolioweight
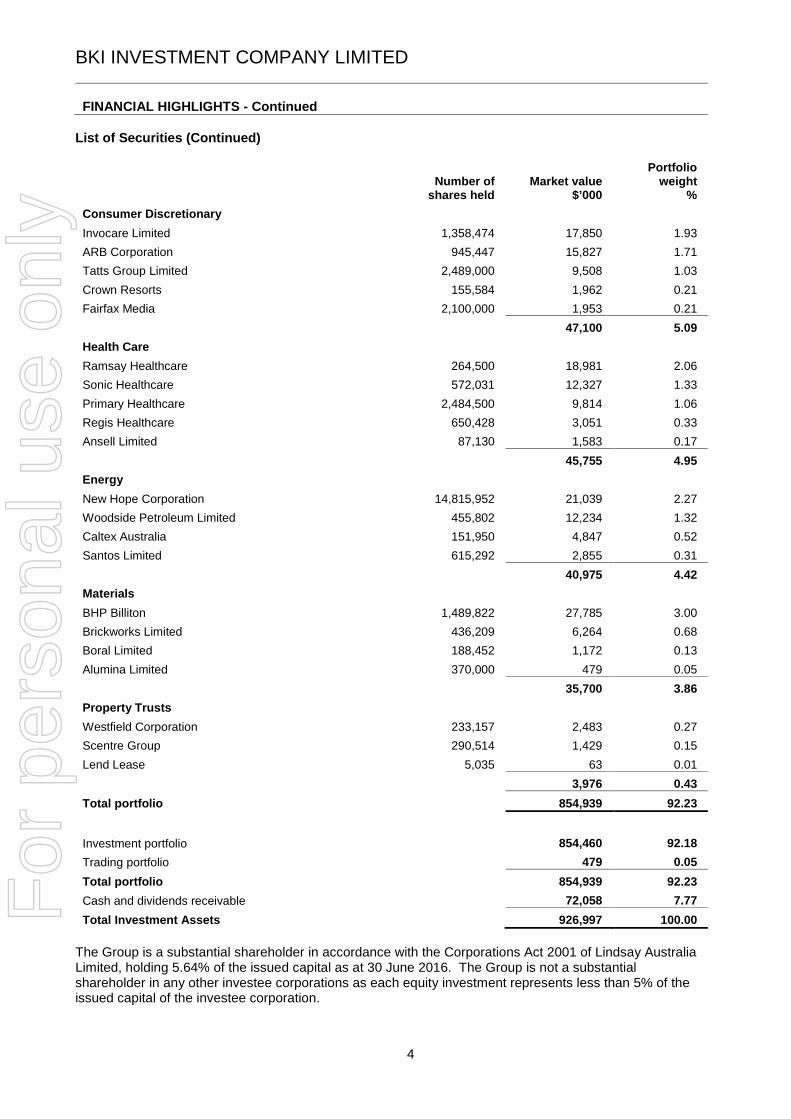
%Consumer DiscretionaryInvocare Limited 1,358,474 17,850 1.93ARB Corporation 945,447 15,827 1.71Tatts Group Limited 2,489,000 9,508 1.03Crown Resorts 155,584 1,962 0.21Fairfax Media 2,100,000 1,953 0.21
47,100 5.09Health CareRamsay Healthcare 264,500 18,981 2.06Sonic Healthcare 572,031 12,327 1.33Primary Healthcare 2,484,500 9,814 1.06Regis Healthcare 650,428 3,051 0.33Ansell Limited 87,130 1,583 0.17
45,755 4.95EnergyNew Hope Corporation 14,815,952 21,039 2.27Woodside Petroleum Limited 455,802 12,234 1.32Caltex Australia 151,950 4,847 0.52Santos Limited 615,292 2,855 0.31
40,975 4.42MaterialsBHP Billiton 1,489,822 27,785 3.00Brickworks Limited 436,209 6,264 0.68Boral Limited 188,452 1,172 0.13Alumina Limited 370,000 479 0.05
35,700 3.86Property TrustsWestfield Corporation 233,157 2,483 0.27Scentre Group 290,514 1,429 0.15Lend Lease 5,035 63 0.01
3,976 0.43Total portfolio 854,939 92.23
Investment portfolio 854,460 92.18Trading portfolio 479 0.05Total portfolio 854,939 92.23Cash and dividends receivable 72,058 7.77Total Investment Assets 926,997 100.00
The Group is a substantial shareholder in accordance with the Corporations Act 2001 of Lindsay AustraliaLimited, holding 5.64% of the issued capital as at 30 June 2016. The Group is not a substantialshareholder in any other investee corporations as each equity investment represents less than 5% of theissued capital of the investee corporation.
For
per
sona
l use
onl
y
BKI INVESTMENT COMPANY LIMITED
GROUP PROFILE
5
BKI Investment Company Limited (“BKI” or “the Group”) is a Listed Investment Company on the AustralianStock Exchange. The Group invests in a diversified portfolio of Australian shares, trusts and interest bearingsecurities.
BKI shares were listed on the Australian Stock Exchange Limited commencing 12 December 2003.
Corporate Objectives
The Group aims to generate an increasing income stream for distribution to shareholders in the form of fullyfranked dividends to the extent of available imputation tax credits, through long-term investment in a portfolioof assets that are also able to deliver long term capital growth to shareholders.
Investment Strategy
The Group is a research driven, long term manager focusing on well managed companies, with a profitablehistory and that offer attractive dividend yields. Stock selection is bottom up, focusing on the merits ofindividual companies rather than market and economic trends.
Dividend Policy
Having respect to prudent business practices, and ensuring the business retains sufficient working capital toallow the achievement of the Group’s Corporate Objectives and Business Strategy, the Group will pay themaximum amount of realised profits after tax for that year to shareholders as fully franked dividends to theextent permitted by the Corporations Act and the Income Tax Assessment Act.
Ordinary dividends will be declared by the Board of Directors out of the Company’s Net Operating Result,after tax but before special investment revenue.
In circumstances where the Group accumulates sufficient special investment revenue after ensuring thebusiness retains sufficient working capital in accordance with its capital management objectives, the Boardwill consider declaring special fully franked dividends to the extent permitted by the Corporations Act and theIncome Tax Assessment Act.
In circumstances where the Group generates sufficient qualifying capital gains, LIC Gains will be distributedto shareholders to the extent permitted by the Corporations Act and the Income Tax Assessment Act.
Management
The Group has an internal portfolio management function comprising the CEO, Mr Tom Millner and PortfolioManager, Mr Will Culbert.
The Group also engages Corporate & Administrative Services Pty Ltd to provide accounting and groupsecretarial services. These services are overseen by the BKI Company Secretary, Mr Jaime Pinto.
For
per
sona
l use
onl
y
BKI INVESTMENT COMPANY LIMITED
CHAIRMAN’S ADDRESS
6
Dear Shareholders,
I am pleased to enclose the 13th Annual Report of BKI Investment Company Limited (BKI) for the year to 30June 2016.
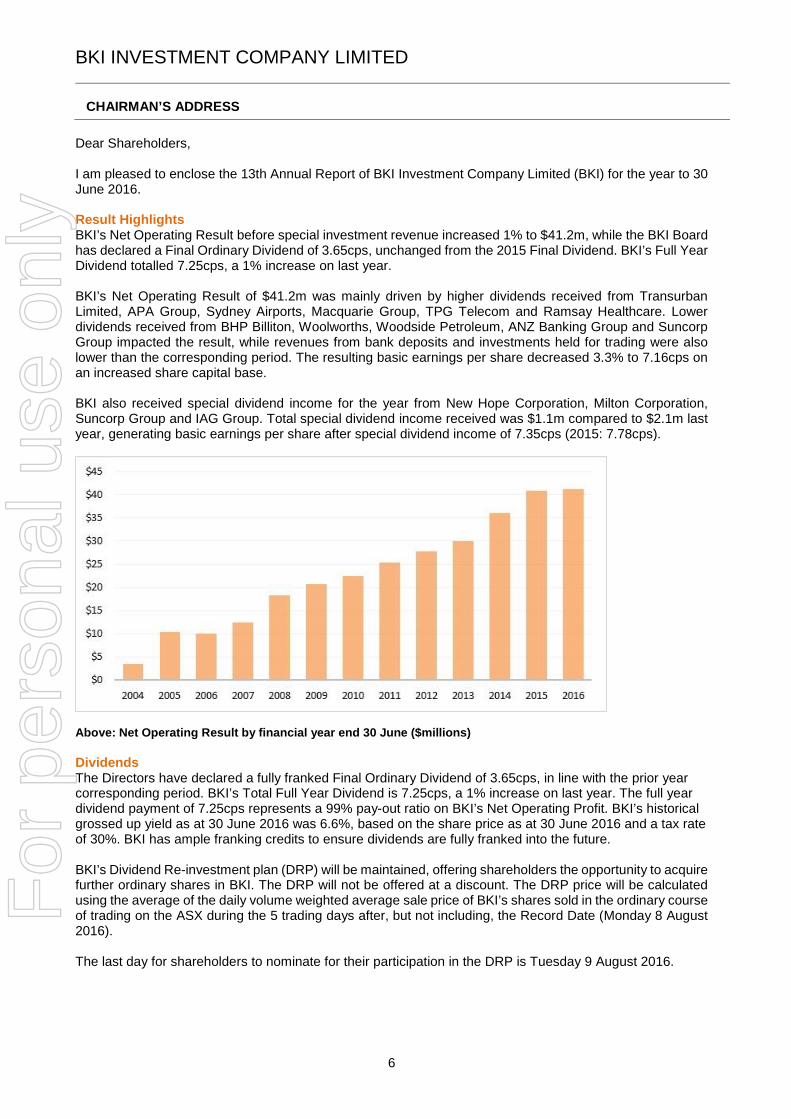
Result HighlightsBKI’s Net Operating Result before special investment revenue increased 1% to $41.2m, while the BKI Boardhas declared a Final Ordinary Dividend of 3.65cps, unchanged from the 2015 Final Dividend. BKI’s Full YearDividend totalled 7.25cps, a 1% increase on last year.
BKI’s Net Operating Result of $41.2m was mainly driven by higher dividends received from TransurbanLimited, APA Group, Sydney Airports, Macquarie Group, TPG Telecom and Ramsay Healthcare. Lowerdividends received from BHP Billiton, Woolworths, Woodside Petroleum, ANZ Banking Group and SuncorpGroup impacted the result, while revenues from bank deposits and investments held for trading were alsolower than the corresponding period. The resulting basic earnings per share decreased 3.3% to 7.16cps onan increased share capital base.
BKI also received special dividend income for the year from New Hope Corporation, Milton Corporation,Suncorp Group and IAG Group. Total special dividend income received was $1.1m compared to $2.1m lastyear, generating basic earnings per share after special dividend income of 7.35cps (2015: 7.78cps).
Above: Net Operating Result by financial year end 30 June ($millions)
DividendsThe Directors have declared a fully franked Final Ordinary Dividend of 3.65cps, in line with the prior yearcorresponding period. BKI’s Total Full Year Dividend is 7.25cps, a 1% increase on last year. The full yeardividend payment of 7.25cps represents a 99% pay-out ratio on BKI’s Net Operating Profit. BKI’s historicalgrossed up yield as at 30 June 2016 was 6.6%, based on the share price as at 30 June 2016 and a tax rateof 30%. BKI has ample franking credits to ensure dividends are fully franked into the future.
BKI’s Dividend Re-investment plan (DRP) will be maintained, offering shareholders the opportunity to acquirefurther ordinary shares in BKI. The DRP will not be offered at a discount. The DRP price will be calculatedusing the average of the daily volume weighted average sale price of BKI’s shares sold in the ordinary courseof trading on the ASX during the 5 trading days after, but not including, the Record Date (Monday 8 August2016).
The last day for shareholders to nominate for their participation in the DRP is Tuesday 9 August 2016.
For
per
sona
l use
onl
y
BKI INVESTMENT COMPANY LIMITED
CHAIRMAN’S ADDRESS - Continued
7
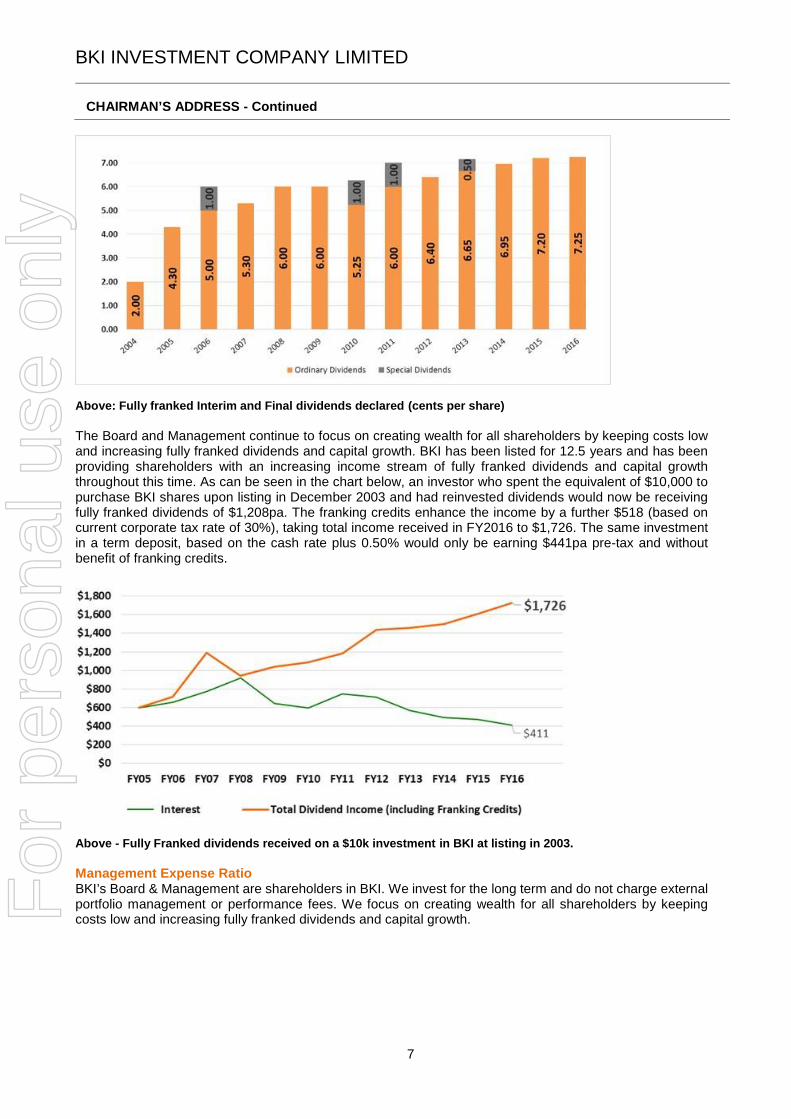
Above: Fully franked Interim and Final dividends declared (cents per share)
The Board and Management continue to focus on creating wealth for all shareholders by keeping costs lowand increasing fully franked dividends and capital growth. BKI has been listed for 12.5 years and has beenproviding shareholders with an increasing income stream of fully franked dividends and capital growththroughout this time. As can be seen in the chart below, an investor who spent the equivalent of $10,000 topurchase BKI shares upon listing in December 2003 and had reinvested dividends would now be receivingfully franked dividends of $1,208pa. The franking credits enhance the income by a further $518 (based oncurrent corporate tax rate of 30%), taking total income received in FY2016 to $1,726. The same investmentin a term deposit, based on the cash rate plus 0.50% would only be earning $441pa pre-tax and withoutbenefit of franking credits.
Above - Fully Franked dividends received on a $10k investment in BKI at listing in 2003.
Management Expense RatioBKI’s Board & Management are shareholders in BKI. We invest for the long term and do not charge externalportfolio management or performance fees. We focus on creating wealth for all shareholders by keepingcosts low and increasing fully franked dividends and capital growth.F
or p
erso
nal u
se o
nly

BKI INVESTMENT COMPANY LIMITED
CHAIRMAN’S ADDRESS - Continued
8
Above: Historical MER achieved by BKI.
PerformanceBKI’s Total Shareholder Return (including the reinvestment of dividends) for the year to 30 June 2016 wasnegative 0.8%, compared to the S&P/ASX 300 Accumulation Index which returned positive 0.9% over thesame period. BKI’s Total Shareholder Return for 5 years, 10 years and 12 years outperformed the Index by3.5% per annum, 2.0% per annum and 1.2% per annum respectively.
BKI’s Net Portfolio Return (after all operating expenses, provision and payment of both income and capitalgains tax and the reinvestment of dividends) for the year to 30 June 2016 was negative 1.4%.
BKI Performance 1 Year 3 Yrs 5 Yrs 7 Yrs 10 Yrs 12 Yrsas at 30 June 2016 (pa) (pa) (pa) (pa) (pa)S&P/ASX 300 ACC INDEX (XKOAI) 0.9% 7.7% 7.2% 8.7% 4.8% 7.9%
BKI Total Shareholder Return (TSR) (0.8%) 8.2% 10.7% 11.3% 6.7% 9.1%BKI TSR Outperformance V's XKOAI (1.7%) 0.5% 3.5% 2.6% 2.0% 1.2%BKI Portfolio Performance (1.4%) 5.2% 6.6% 8.3% 5.7% 7.6%BKI Portfolio Outperformance V's XKOAI (2.3%) (2.5%) (0.6%) (0.4%) 0.9% (0.3%)
BKI Performance 1 Year 3 Yrs 5 Yrs 7 Yrs 10 Yrs 12 YrsIncluding Franking Credits (pa) (pa) (pa) (pa) (pa)S&P/ASX 300 ACC INDEX (XKOAI) - 80% Franked 2.4% 9.3% 9.0% 10.5% 6.5% 9.6%BKI Total Shareholder Return - 100% Franked 1.1% 10.1% 13.0% 13.6% 9.0% 11.3%
The following chart shows BKI’s Total Shareholder Return including Franking Credits. The S&P/ASX 300Accumulation Index has been franked at approximately 80% over this period.
Above - BKI Total Shareholder Return Including Franking Credits as at 30 June 2016
For
per
sona
l use
onl
y

BKI INVESTMENT COMPANY LIMITED
CHAIRMAN’S ADDRESS - Continued
9
BKI’s Total Shareholder Return including Franking Credits for 5 years, 10 years and 12 years outperformedthe Index by 4.0% per annum, 2.5% per annum and 1.7% per annum respectively.
Portfolio MovementsBKI’s net investment over FY2016 was approximately $76m, with major long term investments made incompanies including; Commonwealth Bank, ANZ Banking Group, Westpac Banking Corporation, NationalAustralia Bank, Macquarie Group, Qube Logistics, Telstra Corporation, Ramsay Healthcare, Caltex Australia,APA Group and Sydney Airports. The main disposals from BKI’s investment portfolio included Bendigo andAdelaide Bank, Clydesdale Bank, RioTinto Limited and the partial sell-down of our position in BHP Billiton.
During the year BKI completed the acquisition of all the issued capital of three unlisted investment companieswith net assets of approximately $32m. The private companies acquired were a good fit with BKI’s existingportfolio. An investment in BKI provides the vendors with administration simplicity as well as access to a lowcost diversified equity portfolio, increasing fully franked dividend distributions and capital growth. This bringsthe number of transactions of this nature completed by BKI to four, which will benefit existing BKIshareholders by increasing the size of BKI’s portfolio in a cost-effective manner. The BKI Board looks forwardto engaging in similar transactions in the future.
OutlookTwelve months ago, we said that we expected fiscal 2016 to be an interesting year for equity markets. Whilethe broad market return was flat, there was significant volatility in equities. This has created a sense ofuncertainty.
Investor sentiment is downbeat and much of the news flow is focused on the negative. Slowing consumptionand manufacturing growth rates in Asia continue to impact sentiment as does the uncertain politicallandscape in many major economies. The Australian Dollar traded sideways in fiscal 2016, which impacteda number of our export facing industries. Many Australian resources companies continue to be challengedby the imbalance between supply and demand of commodities.
Last year we lamented that many Australian listed companies were focused on cost out strategies rather thangrowth initiatives. The benign Australian economy has seen that behaviour continue. The subdued investorsentiment is yet to translate into a broad based sell-off of the market. We do not necessarily expect one.There is little incentive for investors to transition into cash. Australia’s historically low interest rateenvironment continues to drive investors to chase yield. Well managed companies offering quality andsustainable dividend yields continue to trade at lofty multiples. We remain cautious on those companiestrading on high earnings multiples that will struggle to deliver sustainable growth. We also remain cautiouson companies with unsustainable dividend payout ratios.
While we recognise the challenges in the economy, we believe the BKI portfolio is well placed for the long-term. We think there is cause for optimism. As long-term investors, we welcome periods of volatility wherewe can add to the holdings of those businesses that we deem to be superior. We continually look forbusinesses that are managed by capable executives, are appropriately geared, have a favourable outlookand are appropriately priced. A sustainable income stream remains a core tenet of our disciplined investmentcriteria.
BKI remains in a strong financial position with no debt, and cash and cash equivalents representingapproximately 8% of the portfolio.Yours sincerely,
Robert MillnerChairmanSydney, 19 July 2016
For
per
sona
l use
onl
y

BKI INVESTMENT COMPANY LIMITED
DIRECTORS’ REPORT
10
The Directors of BKI Investment Company Limited (“the Company”, or “BKI”) present the following report onthe Company and its controlled entities (“the Group”) for the year to 30 June 2016.
1. Directors
The following persons were Directors since the start of the financial year and up to the date of this report:
Robert Dobson Millner, FAICD – Non-Executive Director and Chairman
Mr Millner was appointed Non-executive Chairman upon the Company’s formation in October 2003. MrMillner has over 30 years’ experience as a Company Director and extensive experience in the investmentindustry, and is currently a Director of the following ASX listed companies:
Washington H Soul Pattinson and Company Limited (appointed 1984, Chairman since 1998) New Hope Corporation Limited (appointed 1995, Chairman since 1998) Brickworks Limited (appointed 1997, Chairman since 1999) Milton Corporation Limited (appointed 1998, Chairman since 2002) Apex Healthcare Berhad (Appointed 2000) Australian Pharmaceutical Industries Limited (Appointed 2000) TPG Telecom Limited (appointed 2000)
Special Responsibilities: Chairman of the Board Chairman of the Investment Committee Member of the Remuneration Committee Member of the Nomination Committee
David Capp Hall, AM, FCA, FAICD – Independent Non-Executive Director
Mr Hall was appointed a Non-executive Director and Chair of the Audit Committee upon the Company’sformation in October 2003. Mr Hall is a Chartered Accountant with experience in corporate management,finance and as a Company Director, holding Directorships in other companies for more than 30 years.
Special Responsibilities: Chairman of the Audit Committee Member of the Remuneration Committee Member of the Nomination Committee
Ian Thomas Huntley, BA – Independent Non-Executive Director
Mr Huntley joined the Board as a Non-executive Director in February 2009. After a career in financialjournalism Mr Huntley acquired “Your Money Weekly” newsletter in 1973. Over the following 33 years, MrHuntley built the Your Money Weekly newsletter into one of Australia’s best known investment advisorypublications. He and partners sold the business to Morningstar Inc of the USA in mid 2006.
Special Responsibilities: Member of the Investment Committee Member of the Remuneration Committee Member of the Audit Committee Member of the Nomination CommitteeF
or p
erso
nal u
se o
nly
BKI INVESTMENT COMPANY LIMITED
DIRECTORS’ REPORT - Continued
11
1. Directors (continued)
Alexander James Payne, B.Comm, Dip Cm, FCPA, FCIS, FCIM –Non-Executive Director
Mr Payne was appointed a Non-executive Director upon the Company’s formation in October 2003, and hasbeen a member of the Audit Committee since then. Mr Payne is Chief Financial Officer of Brickworks Limitedand has considerable experience in finance and investment.
Special Responsibilities: Member of the Audit Committee Member of the Investment Committee Chairman of the Remuneration Committee
2. Key Management Personnel
Thomas Charles Dobson Millner, B.Des (Industrial), GDipAppFin, F Fin, GAICD – Chief ExecutiveOfficer
Mr Millner joined the Company in December 2008 from Souls Funds Management (SFM). Mr Millner heldvarious roles with SFM covering research, analysis and business development, and during this time wasresponsible for the Investment Portfolio of BKI Investment Company Limited. Prior to this Mr Millner was aninvestment analyst with Republic Securities Limited, manager of the Investment Portfolio of Pacific StrategicInvestments. Mr Millner is also currently a director of Washington H Soul Pattinson and Company Limited,New Hope Corporation Limited and PM Capital Global Opportunities Fund Limited, providing him withadditional insight into Australian and Global investment markets.
Special Responsibilities Member of the Investment Committee
Jaime Pinto, BComm, CA - Company Secretary
Mr Pinto is a Chartered Accountant with over 20 years’ experience in both professional practice and in seniorcommercial roles across a broad range of industries. Jaime is currently Company Secretary of QuickstepHoldings Limited (ASX:QHL) and Clover Corporation Limited (ASX: CLV), and is Company Secretary andCFO of a number of unlisted investment and industrial companies.
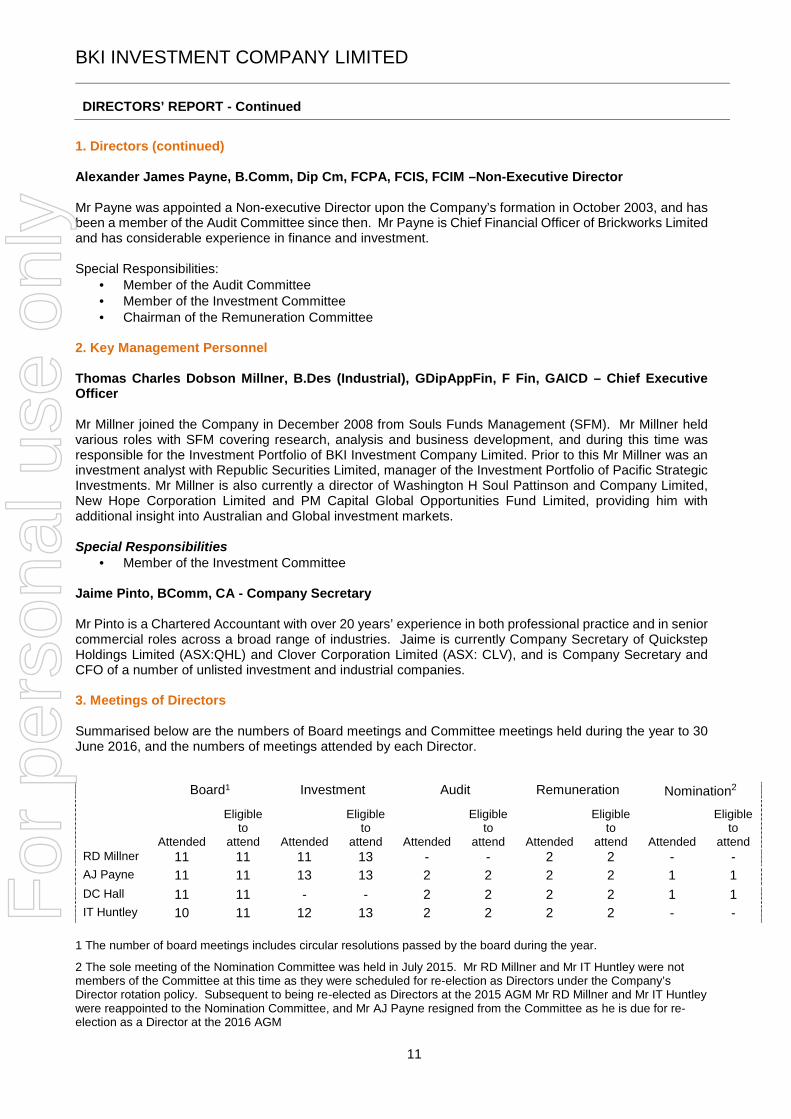
3. Meetings of Directors
Summarised below are the numbers of Board meetings and Committee meetings held during the year to 30June 2016, and the numbers of meetings attended by each Director.
1 The number of board meetings includes circular resolutions passed by the board during the year.
2 The sole meeting of the Nomination Committee was held in July 2015. Mr RD Millner and Mr IT Huntley were notmembers of the Committee at this time as they were scheduled for re-election as Directors under the Company’sDirector rotation policy. Subsequent to being re-elected as Directors at the 2015 AGM Mr RD Millner and Mr IT Huntleywere reappointed to the Nomination Committee, and Mr AJ Payne resigned from the Committee as he is due for re-election as a Director at the 2016 AGM
Board1 Investment Audit Remuneration Nomination2
Attended
Eligibleto
attend Attended
Eligibleto
attend Attended
Eligibleto
attend Attended
Eligibleto
attend Attended
Eligibleto
attendRD Millner 11 11 11 13 - - 2 2 - -AJ Payne 11 11 13 13 2 2 2 2 1 1DC Hall 11 11 - - 2 2 2 2 1 1IT Huntley 10 11 12 13 2 2 2 2 - -F
or p
erso
nal u
se o
nly

BKI INVESTMENT COMPANY LIMITED
DIRECTORS’ REPORT - Continued
12
4. Principal Activities
Principal activities of the Group are that of a Listed Investment Company (LIC) primarily focused on long terminvestment in ASX listed securities. There were no significant changes in the nature of those activities duringthe year.
5. Operating Results
BKI’s Net Operating Result before special investment revenue increased 1% to $41.2m (2015: $40.9m),supported by higher dividends received from Transurban Limited, APA Group, Sydney Airports, MacquarieGroup, TPG Telecom and Ramsay Healthcare. Lower dividends received from BHP Billiton, Woolworths,Woodside Petroleum, ANZ Banking Group and Suncorp Group reduced the result, while revenues from bankdeposits and investments held for trading were also lower than the previous year. The resulting basicearnings per share decreased 3.3% to 7.16cps on an increased share capital base.
BKI also received special dividend income for the year from New Hope Corporation, Milton Corporation,Suncorp Group and IAG Group. Total special dividend income received was $1.1m compared to $2.1m in2015FY, resulting in a basic earnings per share after special dividend income of 7.35cps (2015: 7.78cps).
BKI’s Total Shareholder Return for the year to 30 June 2016 was negative 0.8%, compared to the S&P/ASX300 Accumulation Index which returned positive 0.9% over the same period. BKI’s 12 year Total ShareholderReturn including the benefit of franking credits was 11.3% pa as at 30 June 2016.
6. Review of Operations
Operating expenses decreased $0.13m to $1.48m (2015: $1.61m). This, combined with an increase in theaverage Total Portfolio Value during the year, lowered BKI’s MER to 0.16% (2015: 0.18%).
BKI’s net investment over FY2016 was approximately $76m, with major long term investments made incompanies including; Commonwealth Bank, ANZ Banking Group, Westpac Banking Corporation, NationalAustralia Bank, Macquarie Group, Qube Logistics, Telstra Corporation, Ramsay Healthcare, Caltex Australia,APA Group and Sydney Airports. The main disposals from BKI’s investment portfolio included Bendigo andAdelaide Bank, Clydesdale Bank, RioTinto Limited and a partial disposal of BHP Billiton.
During the year BKI completed the acquisition of three unlisted investment companies with net assets ofapproximately $32m. The private companies acquired were a strong fit with BKI’s existing portfolio. Thisbrings the number of transactions of this nature completed by BKI to four, which benefit existing BKIshareholders by increasing the size of BKI’s portfolio in a cost-effective manner.
7. Financial Position
Net assets of the Group increased during the financial year by $26.7m to $880.0m. Acquisitions of unlistedinvestment entities increased assets by a combined $32m during the year and the SPP in May 2016increased funds by an additional $28.2m. This was affected by a net decrease of $33.9m in the market valueof the investment portfolio.
8. Employees
The Group has two employees as at 30 June 2016 (2015: two).For
per
sona
l use
onl
y

BKI INVESTMENT COMPANY LIMITED
DIRECTORS’ REPORT - Continued
13
9. Significant Changes in the State of Affairs
Other than as stated above and in the accompanying Financial Report, there were no significant changes inthe state of affairs of the Group during the reporting year.
10. Likely Developments and Expected Results
The operations of the Group will continue with planned long term investments in Australian equities and fixedinterest securities. Neither the expected results of those operations nor the strategy for particular investmentshave been included in this report as, in the opinion of the Directors, this information would prejudice theinterests of the Group if included.
11. Significant Events after Balance Date
The Directors are not aware of any matter or circumstance that has arisen since the end of the year to thedate of this report that has significantly affected or may significantly affect:
i. the operations of the Company and the entities that it controls;
ii. the results of those operations; or
iii. the state of affairs of the Group in subsequent years.
12. Dividends
There were two dividend payments made during the year to 30 June 2016:
On 27 August 2015, a final total dividend of $20,314,465 (ordinary dividend of 3.65 cents per sharefully franked) was paid out of retained profits at 30 June 2015.
On 26 February 2016, an interim total dividend of $20,473,202 (ordinary dividend of 3.60 cents pershare, fully franked) was paid out of retained profits at 31 December 2015.
In addition, the Directors declared a final ordinary dividend of 3.65 cents per share fully franked payable on26 August 2016.
At 30 June 2016 there are $15,714,362 of franking credits available to the Group (2015: $13,847,692) afterallowing for payment of the final, fully franked ordinary dividend.
13. Environmental Regulations
The Group’s operations are not materially affected by environmental regulations.
14. Directors’ and Officers’ Indemnity
The Constitution of the Company provides indemnity against liability and legal costs incurred by Directorsand Officers to the extent permitted by the Corporations Act.
During the year to 30 June 2016, the Group paid premiums in respect of an insurance contract to insure eachof the officers against all liabilities and expenses arising as a result of work performed in their respectivecapacities. The Directors have not included details of the nature of liabilities covered or the amount ofpremium paid in respect of the insurance contract as such disclosure is prohibited under the terms of thecontract.
For
per
sona
l use
onl
y

BKI INVESTMENT COMPANY LIMITED
DIRECTORS’ REPORT - Continued
14
15. Proceedings on Behalf of the Group
No person has applied for leave of the Court to bring proceedings on behalf of the Group or intervene in anyproceedings to which the Group is a party for the purpose of taking responsibility on behalf of the Group forall or any part of those proceedings.
The Group was not a party to any such proceedings during the year.
16. Non-audit Services
The external auditor, MGI Sydney Assurance Services Pty Limited (“MGI Sydney”), did not provide anynon-audit services to the Group during the year to 30 June 2016, nor did the Group pay any fees for suchservices.
18. Auditor’s Independence Declaration
The Auditor’s Independence Declaration for the year to 30 June 2016 is on page 46.
19. Beneficial and Relevant Interest of Directors and Other Key Management Personnel in Shares
As at the date of this report, details of Directors and Other Key Management Personnel who hold shares fortheir own benefit or who have an interest in holdings through a third party and the total number of such sharesheld are listed as follows:
Name Number of SharesRD Millner* 8,555,552DC Hall 297,326AJ Payne 295,872IT Huntley 11,224,980TCD Millner* 7,660,745J Pinto 77,937
* Common to RD Millner and TCD Millner are 7,260,805 shares (2015: 7,231,771) held in related companies and trusts in which bothhold beneficial interests.
20. Corporate Governance Statement
BKI’s Corporate Governance Statement can be found on the Company’s website at the following address:http://bkilimited.com.au/about-us/corporate-governance/#cgs
For
per
sona
l use
onl
y

BKI INVESTMENT COMPANY LIMITED
DIRECTORS’ REPORT - Continued
15
21. Remuneration Report (Audited)
This remuneration report outlines the Director and Executive remuneration arrangements of the Group inaccordance with the requirements of the Corporations Act 2001 and its Regulations. For the purposes of thisreport, Key Management Personnel of the Group are defined as those persons having authority andresponsibility for planning, directing and controlling the major activities of the Group, directly or indirectly.
Remuneration Policy
The Board is responsible for determining and reviewing remuneration arrangements, including performanceincentives, for the Directors themselves, the Chief Executive Officer, the Senior Investment Analyst and theCompany Secretary. It is the Group’s objective to provide maximum shareholder benefit from the retentionof a high quality Board and Executive team by remunerating Directors and Key Executives fairly andappropriately with reference to relevant employment market conditions, their performance, experience andexpertise.
Elements of Director and Executive remuneration
The Board’s policy for determining the nature and amount of remuneration for Key Management Personneland other Key Executives of the Group is as follows:
The remuneration policy is developed by the Remuneration Committee and approved by the Board afterprofessional advice is sought from independent external consultants.
All Key Management Personnel and other Key Executives receive a base salary or fee, superannuationand performance incentives.
Performance incentives are only paid once predetermined key performance indicators have been met. Incentives paid in the form of shares are intended to align the interests of the Key Management Personnel
and other Key Executives with those of the shareholders. The Remuneration Committee reviews the remuneration packages of Key Management Personnel and
other Key Executives annually by reference to the Group’s performance, Executive performance andcomparable information from industry sectors.
The performance of Key Management Personnel and other Key Executives is measured against relativemarket indices and financial and strategic goals approved by the Board and as agreed with each Executive.Performance is measured on an ongoing basis using management reporting tools. Performance for theassessment of incentives is performed annually, based predominantly on the growth of shareholder andportfolio returns. The Board may exercise discretion in relation to approving incentives and can recommendchanges to the Committee’s recommendations. Any changes must be justified by reference to measurableperformance criteria. The policy is designed to attract the highest calibre of executives and reward them forperformance results leading to long-term growth in shareholder wealth.
All remuneration paid to Key Management Personnel and other Key Executives is valued at the cost to theGroup and expensed.
The Board’s policy is to remunerate Non-Executive Directors at market rates for time, commitment andresponsibilities. The Remuneration Committee determines payments to the Non-Executive Directors andreviews their remuneration annually, based on market practice, duties and accountability. Independentexternal advice is sought when required. The maximum aggregate amount of fees that can be paid to Non-Executive Directors is subject to approval by shareholders at the Annual General Meeting.
Performance-based Remuneration
BKI has established a Short Term and a Long Term Incentive Scheme. The participants in this scheme arethe CEO, Mr Thomas Millner, the Portfolio Manager, Mr William Culbert, and the Company Secretary, MrJaime Pinto. Mr Thomas Millner and Mr Jaime Pinto are classified as Key Management Personnel, whereasMr William Culbert is classified as an Other Key Executive.
For
per
sona
l use
onl
y
BKI INVESTMENT COMPANY LIMITED
DIRECTORS’ REPORT - Continued
16
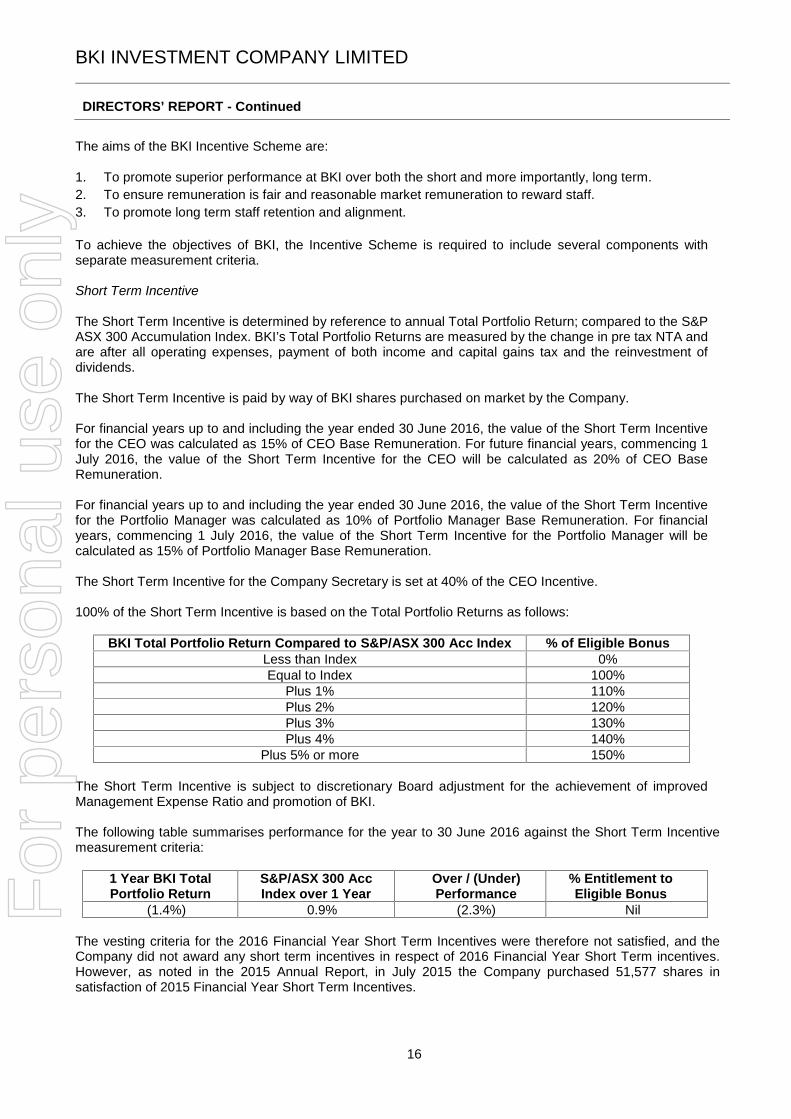
The aims of the BKI Incentive Scheme are:
1. To promote superior performance at BKI over both the short and more importantly, long term.2. To ensure remuneration is fair and reasonable market remuneration to reward staff.3. To promote long term staff retention and alignment.
To achieve the objectives of BKI, the Incentive Scheme is required to include several components withseparate measurement criteria.
Short Term Incentive
The Short Term Incentive is determined by reference to annual Total Portfolio Return; compared to the S&PASX 300 Accumulation Index. BKI’s Total Portfolio Returns are measured by the change in pre tax NTA andare after all operating expenses, payment of both income and capital gains tax and the reinvestment ofdividends.
The Short Term Incentive is paid by way of BKI shares purchased on market by the Company.
For financial years up to and including the year ended 30 June 2016, the value of the Short Term Incentivefor the CEO was calculated as 15% of CEO Base Remuneration. For future financial years, commencing 1July 2016, the value of the Short Term Incentive for the CEO will be calculated as 20% of CEO BaseRemuneration.
For financial years up to and including the year ended 30 June 2016, the value of the Short Term Incentivefor the Portfolio Manager was calculated as 10% of Portfolio Manager Base Remuneration. For financialyears, commencing 1 July 2016, the value of the Short Term Incentive for the Portfolio Manager will becalculated as 15% of Portfolio Manager Base Remuneration.
The Short Term Incentive for the Company Secretary is set at 40% of the CEO Incentive.
100% of the Short Term Incentive is based on the Total Portfolio Returns as follows:
BKI Total Portfolio Return Compared to S&P/ASX 300 Acc Index % of Eligible BonusLess than Index 0%Equal to Index 100%
Plus 1% 110%Plus 2% 120%Plus 3% 130%Plus 4% 140%
Plus 5% or more 150%
The Short Term Incentive is subject to discretionary Board adjustment for the achievement of improvedManagement Expense Ratio and promotion of BKI.
The following table summarises performance for the year to 30 June 2016 against the Short Term Incentivemeasurement criteria:
1 Year BKI TotalPortfolio Return
S&P/ASX 300 AccIndex over 1 Year
Over / (Under)Performance
% Entitlement toEligible Bonus
(1.4%) 0.9% (2.3%) Nil
The vesting criteria for the 2016 Financial Year Short Term Incentives were therefore not satisfied, and theCompany did not award any short term incentives in respect of 2016 Financial Year Short Term incentives.However, as noted in the 2015 Annual Report, in July 2015 the Company purchased 51,577 shares insatisfaction of 2015 Financial Year Short Term Incentives.
For
per
sona
l use
onl
y

BKI INVESTMENT COMPANY LIMITED
DIRECTORS’ REPORT - Continued
17
Long Term Incentive
The Long Term Incentive is determined by reference to annual Total Shareholder Returns; compared to theS&P/ASX 300 Accumulation Index. Total Shareholder Returns are based on the change in BKI Share Priceand include the reinvestment of dividends.
For financial years up to and including the year ended 30 June 2016, the CEO’s Long Term Incentive wascalculated on 25% of the Base Remuneration of the CEO. For future financial years, commencing 1 July2016, the Long Term Incentive for the CEO will be calculated as 30% of CEO Base Remuneration.
For financial years up to and including the year ended 30 June 2016, the Portfolio Manager’s Long TermIncentive was calculated on 15% of the Base Remuneration of the Portfolio Manager. For future financialyears commencing 1 July 2016, the Long Term Incentive for the Portfolio Manager will be calculated as 20%of Portfolio Manager Base Remuneration.
For the Company Secretary, the Long Term Incentive is to be set at 40% of the CEO Long Term Incentiveand subject to the same vesting conditions.
All outstanding incentives granted are to be awarded to the above executives after 4 years, provided thatBKI’s 4 year Total Shareholder Returns exceed the S&P/ASX 300 Accumulation Index over the same period.Should that test fail on the day it is to be retested in Year 5.
The Long Term Incentive Scheme is to be paid by way of BKI shares purchased on market by the Companyshould the incentive targets be met. The Company has accrued as an expense the appropriate portion ofthese future costs in the 2016 financial year, and has included these costs in the disclosed remuneration ofthe CEO and Company Secretary.
During the 2016 Financial Year the following outstanding Long Term Incentives granted by the Companybecame eligible for vesting:
Incentive issue Issue date
Number ofrights
granted
Value ofinitialgrant
Initialvesting
dateExpiry
date
Number ofrights
vested
Number ofrights yet
to vest/lapse
J Pinto 2012 13/12/2011 18,010 $21,450 12/12/2015 11/12/2016 18,010 -T Millner 2013 01/07/2012 64,230 $74,250 30/06/2016 30/06/2017 64,230 -J Pinto 2013 01/07/2012 25,692 $29,700 30/06/2016 30/06/2017 25,692 -
The table below summarises the performance for each relevant four year period against the Long TermIncentive measurement criteria:
Period
4 year BKI totalshareholder
return
S&P/ASX 300accumulation
index over 4 yearsOver/ (Under)performance
% Entitlement toeligible bonus
13/12/2011 to 12/12/2015 14.6% 9.2% 5.3% 100%1/07/2012 to 30/06/2016 13.1% 11.1% 2.0% 100%
Based on the above performance:- the vesting criteria for Long Term incentives issued on 13 December 2011 were satisfied, and during
the 30 June 2016 Financial Year the Company purchased on market 18,010 shares on behalf ofexecutives.
- The vesting criteria for Long Term Incentives issued on 1 July 2012 were satisfied, and subsequent to30 June 2016 the Company will purchase on market 89,922 shares on behalf of executives.
For
per
sona
l use
onl
y
BKI INVESTMENT COMPANY LIMITED
DIRECTORS’ REPORT - Continued
18
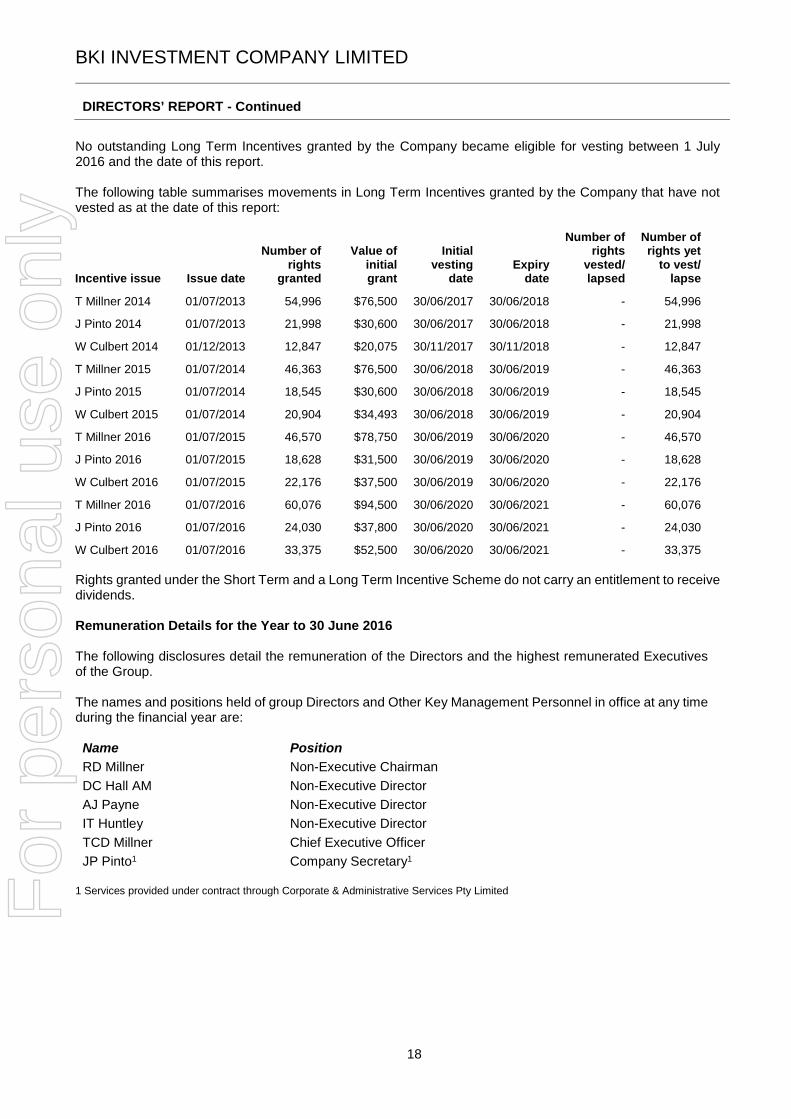
No outstanding Long Term Incentives granted by the Company became eligible for vesting between 1 July2016 and the date of this report.
The following table summarises movements in Long Term Incentives granted by the Company that have notvested as at the date of this report:
Incentive issue Issue date
Number ofrights
granted
Value ofinitialgrant
Initialvesting
dateExpiry
date
Number ofrights
vested/lapsed
Number ofrights yet
to vest/lapse
T Millner 2014 01/07/2013 54,996 $76,500 30/06/2017 30/06/2018 - 54,996
J Pinto 2014 01/07/2013 21,998 $30,600 30/06/2017 30/06/2018 - 21,998
W Culbert 2014 01/12/2013 12,847 $20,075 30/11/2017 30/11/2018 - 12,847
T Millner 2015 01/07/2014 46,363 $76,500 30/06/2018 30/06/2019 - 46,363
J Pinto 2015 01/07/2014 18,545 $30,600 30/06/2018 30/06/2019 - 18,545
W Culbert 2015 01/07/2014 20,904 $34,493 30/06/2018 30/06/2019 - 20,904
T Millner 2016 01/07/2015 46,570 $78,750 30/06/2019 30/06/2020 - 46,570
J Pinto 2016 01/07/2015 18,628 $31,500 30/06/2019 30/06/2020 - 18,628
W Culbert 2016 01/07/2015 22,176 $37,500 30/06/2019 30/06/2020 - 22,176
T Millner 2016 01/07/2016 60,076 $94,500 30/06/2020 30/06/2021 - 60,076
J Pinto 2016 01/07/2016 24,030 $37,800 30/06/2020 30/06/2021 - 24,030
W Culbert 2016 01/07/2016 33,375 $52,500 30/06/2020 30/06/2021 - 33,375
Rights granted under the Short Term and a Long Term Incentive Scheme do not carry an entitlement to receivedividends.
Remuneration Details for the Year to 30 June 2016
The following disclosures detail the remuneration of the Directors and the highest remunerated Executivesof the Group.
The names and positions held of group Directors and Other Key Management Personnel in office at any timeduring the financial year are:
Name PositionRD Millner Non-Executive ChairmanDC Hall AM Non-Executive DirectorAJ Payne Non-Executive DirectorIT Huntley Non-Executive DirectorTCD Millner Chief Executive OfficerJP Pinto1 Company Secretary1
1 Services provided under contract through Corporate & Administrative Services Pty LimitedFor
per
sona
l use
onl
y

BKI INVESTMENT COMPANY LIMITED
DIRECTORS’ REPORT - Continued
19
Details of the nature and amount of each Non–Executive Director’s and Other Key Management Personnel’semoluments from the Parent and its controlled entities in respect of the year to 30 June are as follows:
Directors:
Primary fee Superannuation Total$ $ $
2015RD Millner 62,100 5,900 68,000DC Hall 48,173 4,576 52,750AJ Payne 39,383 3,741 43,125IT Huntley 39,383 3,741 43,125Total 189,041 17,959 207,000
2016RD Millner 63,699 6,051 69,750DC Hall 49,315 4,685 54,000AJ Payne 40,297 3,828 44,125IT Huntley 40,297 3,828 44,125Total 193,608 18,392 212,000
The combined annual payment to all Non-Executive Directors is capped at $300,000 until shareholders, byordinary resolution, approve some other fixed sum amount. This amount is to be divided among the Directorsas they may determine.
Other Key Management Personnel:
Fixed remunerationShare based performance related
remunerationTotal
RemunerationSalarySuper-
annuation Total STI LTI Total2015TCD Millner 291,717 18,783 310,500 45,900 91,746 137,646 448,146J Pinto - - - 18,360 51,948 70,308 70,308Total 291,717 18,783 310,500 64,260 143,694 207,954 518,454
2016TCD Millner 295,692 19,308 315,000 - 75,132 75,132 390,132J Pinto - - - - 31,178 31,178 31,178Total 295,692 19,308 315,000 - 106,310 106,310 421,310
The value included in the preceding table for share based performance related remuneration (STI and LTI)is the portion of the estimated value of the performance rights which has been allocated as an expense ineach relevant reporting period.
The relative proportions of Total Remuneration that are fixed or linked to performance are as follows:
Fixed remuneration Performance-related - STI Performance-related - LTI2016 2015 2016 2015 2016 2015
TCD Millner 80.7% 69.3% 0% 10.2% 19.3% 20.5%J Pinto 0% 0% 0% 26.1% 100% 73.9%
There were no retirement allowances provided for the retirement of Non-Executive Directors or Other KeyManagement Personnel.
For
per
sona
l use
onl
y

BKI INVESTMENT COMPANY LIMITED
DIRECTORS’ REPORT - Continued
20
Contract of Employment
Mr TCD Millner is employed by the Company under a contract of employment. This is an open endedcontract with a notice period of one month required to terminate employment. Base Remuneration iscurrently $315,000 per annum inclusive of superannuation.
Remuneration is reviewed annually by the Remuneration Committee.
Mr JP Pinto provides Company Secretarial services under contract through Corporate & AdministrativeServices Pty Limited. This is an open ended contract with a notice period of one month required toterminate.
This report is made in accordance with a resolution of the Directors.
Robert D MillnerDirector
Sydney19 July 2016
For
per
sona
l use
onl
y
BKI INVESTMENT COMPANY LIMITED
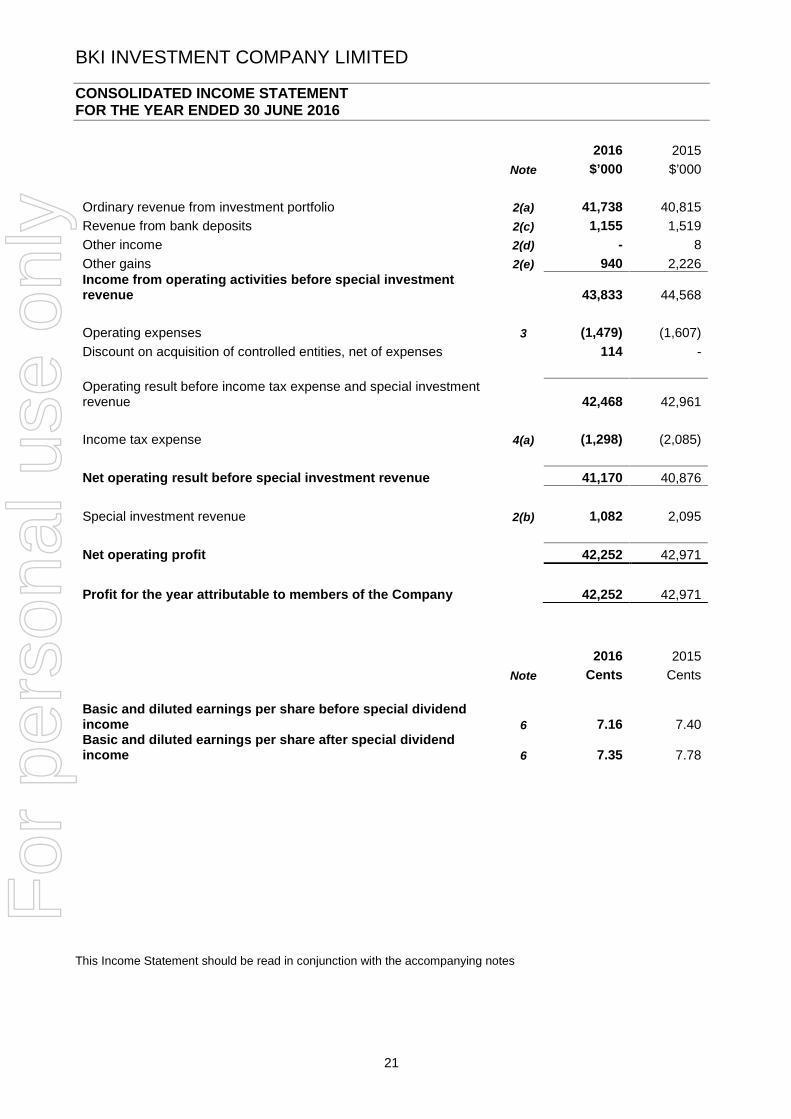
CONSOLIDATED INCOME STATEMENTFOR THE YEAR ENDED 30 JUNE 2016
21
This Income Statement should be read in conjunction with the accompanying notes
2016 2015Note $’000 $’000
Ordinary revenue from investment portfolio 2(a) 41,738 40,815Revenue from bank deposits 2(c) 1,155 1,519Other income 2(d) - 8Other gains 2(e) 940 2,226Income from operating activities before special investmentrevenue 43,833 44,568
Operating expenses 3 (1,479) (1,607)Discount on acquisition of controlled entities, net of expenses 114 -
Operating result before income tax expense and special investmentrevenue 42,468 42,961
Income tax expense 4(a) (1,298) (2,085)
Net operating result before special investment revenue 41,170 40,876
Special investment revenue 2(b) 1,082 2,095
Net operating profit 42,252 42,971
Profit for the year attributable to members of the Company 42,252 42,971
2016 2015Note Cents Cents
Basic and diluted earnings per share before special dividendincome 6 7.16 7.40Basic and diluted earnings per share after special dividendincome 6 7.35 7.78
For
per
sona
l use
onl
y
BKI INVESTMENT COMPANY LIMITED
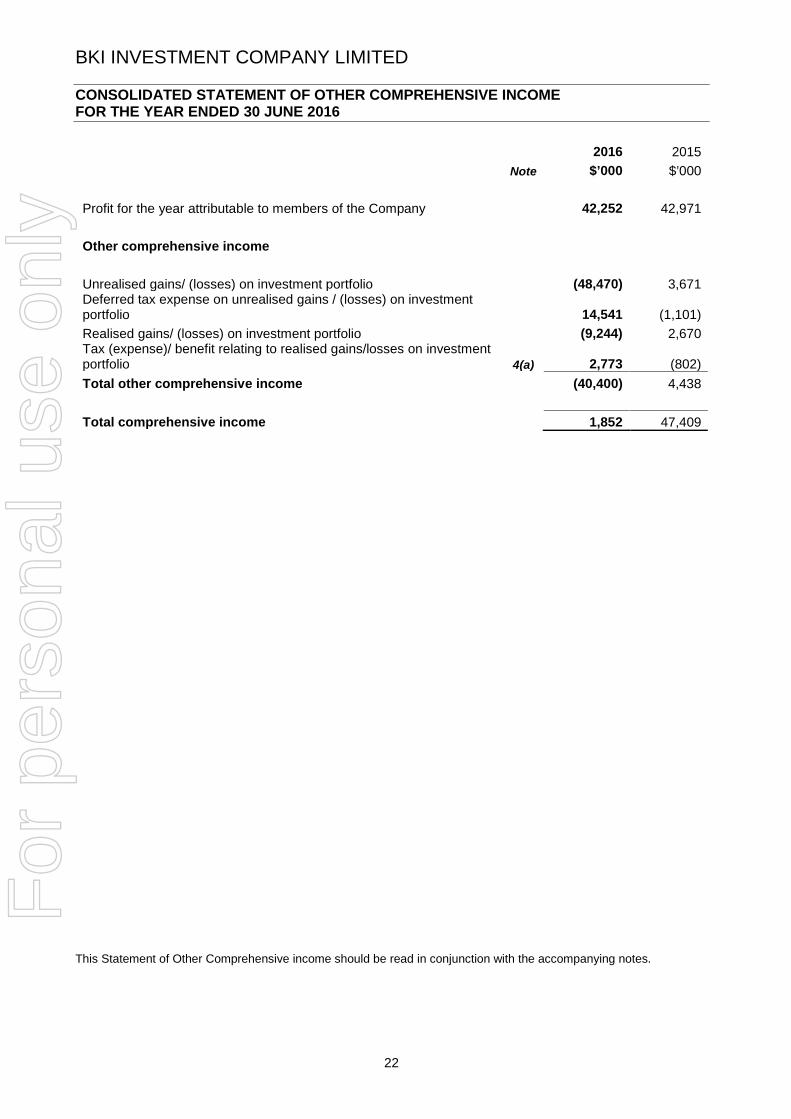
CONSOLIDATED STATEMENT OF OTHER COMPREHENSIVE INCOMEFOR THE YEAR ENDED 30 JUNE 2016
22
This Statement of Other Comprehensive income should be read in conjunction with the accompanying notes.
2016 2015Note $’000 $’000
Profit for the year attributable to members of the Company 42,252 42,971
Other comprehensive income
Unrealised gains/ (losses) on investment portfolio (48,470) 3,671Deferred tax expense on unrealised gains / (losses) on investmentportfolio 14,541 (1,101)Realised gains/ (losses) on investment portfolio (9,244) 2,670Tax (expense)/ benefit relating to realised gains/losses on investmentportfolio 4(a) 2,773 (802)Total other comprehensive income (40,400) 4,438
Total comprehensive income 1,852 47,409
For
per
sona
l use
onl
y
BKI INVESTMENT COMPANY LIMITED
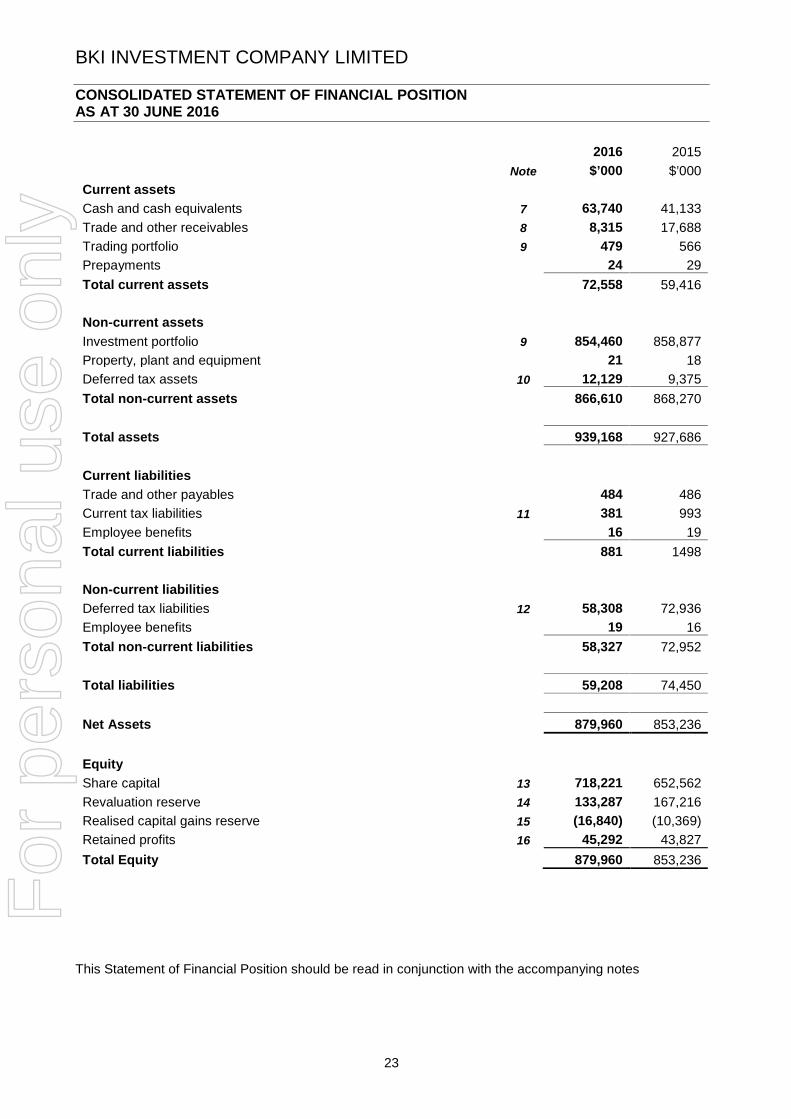
CONSOLIDATED STATEMENT OF FINANCIAL POSITIONAS AT 30 JUNE 2016
23
This Statement of Financial Position should be read in conjunction with the accompanying notes
2016 2015Note $’000 $’000
Current assetsCash and cash equivalents 7 63,740 41,133Trade and other receivables 8 8,315 17,688Trading portfolio 9 479 566Prepayments 24 29Total current assets 72,558 59,416
Non-current assetsInvestment portfolio 9 854,460 858,877Property, plant and equipment 21 18Deferred tax assets 10 12,129 9,375Total non-current assets 866,610 868,270
Total assets 939,168 927,686
Current liabilitiesTrade and other payables 484 486Current tax liabilities 11 381 993Employee benefits 16 19Total current liabilities 881 1498
Non-current liabilitiesDeferred tax liabilities 12 58,308 72,936Employee benefits 19 16Total non-current liabilities 58,327 72,952
Total liabilities 59,208 74,450
Net Assets 879,960 853,236
EquityShare capital 13 718,221 652,562Revaluation reserve 14 133,287 167,216Realised capital gains reserve 15 (16,840) (10,369)Retained profits 16 45,292 43,827Total Equity 879,960 853,236
For
per
sona
l use
onl
y
BKI INVESTMENT COMPANY LIMITED
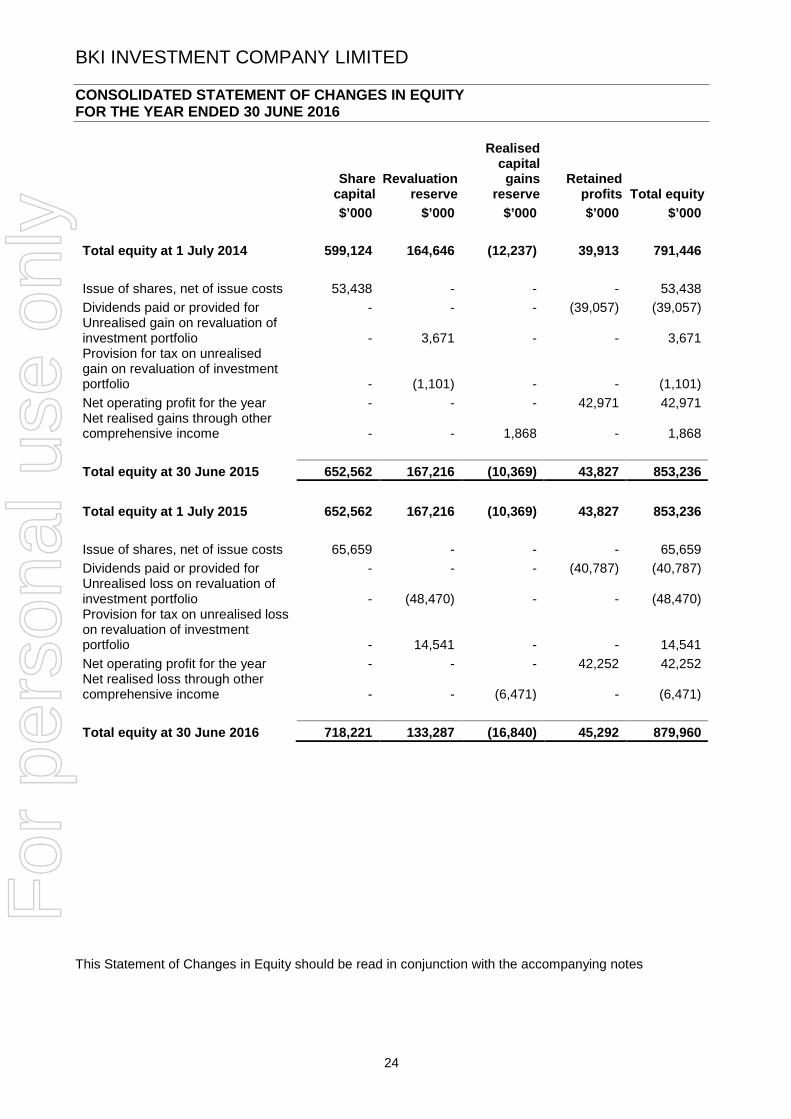
CONSOLIDATED STATEMENT OF CHANGES IN EQUITYFOR THE YEAR ENDED 30 JUNE 2016
24
This Statement of Changes in Equity should be read in conjunction with the accompanying notes
Sharecapital
Revaluationreserve
Realisedcapital
gainsreserve
Retainedprofits Total equity
$’000 $’000 $’000 $’000 $’000
Total equity at 1 July 2014 599,124 164,646 (12,237) 39,913 791,446
Issue of shares, net of issue costs 53,438 - - - 53,438Dividends paid or provided for - - - (39,057) (39,057)Unrealised gain on revaluation ofinvestment portfolio - 3,671 - - 3,671Provision for tax on unrealisedgain on revaluation of investmentportfolio - (1,101) - - (1,101)Net operating profit for the year - - - 42,971 42,971Net realised gains through othercomprehensive income - - 1,868 - 1,868
Total equity at 30 June 2015 652,562 167,216 (10,369) 43,827 853,236
Total equity at 1 July 2015 652,562 167,216 (10,369) 43,827 853,236
Issue of shares, net of issue costs 65,659 - - - 65,659Dividends paid or provided for - - - (40,787) (40,787)Unrealised loss on revaluation ofinvestment portfolio - (48,470) - - (48,470)Provision for tax on unrealised losson revaluation of investmentportfolio - 14,541 - - 14,541Net operating profit for the year - - - 42,252 42,252Net realised loss through othercomprehensive income - - (6,471) - (6,471)
Total equity at 30 June 2016 718,221 133,287 (16,840) 45,292 879,960
For
per
sona
l use
onl
y

BKI INVESTMENT COMPANY LIMITED
CONSOLIDATED CASH FLOW STATEMENTFOR THE YEAR ENDED 30 JUNE 2016
25
This Cash Flow Statement should be read in conjunction with the accompanying notes
2016 2015Note $’000 $’000
Cash flows from operating activitiesDividends and distributions received 42,242 42,398Other receipts in the course of operations - 8Payments to suppliers and employees (1,474) (1,409)Proceeds from sale of trading portfolio 2,748 10,629Payments for trading portfolio - (8,763)Interest received 1,292 1,655Income tax paid (1,881) (986)Net cash inflow from operating activities 17(a) 42,927 43,532
Cash flows from investing activitiesCash acquired on acquisition of controlled entities 137 -Proceeds from sale of investment portfolio 29,886 33,270Capital returns received from investment portfolio - 1,930Payments for investment portfolio (43,451) (92,833)Payments for plant and equipment (9) (14)Net cash outflow from investing activities (13,437) (57,647)
Cash flows from financing activitiesProceeds from issues of ordinary shares less issue costs 27,883 47,482Dividends paid 5(b) (34,766) (33,194)Net cash inflow/ (outflow) from financing activities (6,883) 14,288
Net increase in cash held 22,607 173
Cash at the beginning of the year 41,133 40,960
Cash at the end of the year 7 63,740 41,133
For
per
sona
l use
onl
y
BKI INVESTMENT COMPANY LIMITED
NOTES TO THE FINANCIAL STATEMENTSFOR THE YEAR ENDED 30 JUNE 2016
26
1. Summary of Significant Accounting Policies
The financial report is a general purpose financial report that has been prepared in accordance withAustralian Accounting Standards, Australian Accounting Interpretations, other authoritative pronouncementsof the Australian Accounting Standards Board and the Corporations Act 2001.
The financial report covers the parent entity of BKI Investment Company Limited and its controlled entities,with information relating to BKI Investment Company Limited as an individual parent entity summarised inNote 27. BKI Investment Company Limited is a listed public company, incorporated and domiciled inAustralia.
The financial report complies with all International Financial Reporting Standards (IFRS) in their entirety.
The following is a summary of the material accounting policies adopted by the Group in the preparation ofthe financial report. The accounting policies have been consistently applied, unless otherwise stated.
Basis of PreparationThe accounting policies set out below have been consistently applied to all years presented.
The Group has attempted to improve the transparency of its reporting by adopting ‘plain English’ wherepossible. Key ‘plain English’ phrases and their equivalent AASB terminology are as follows:
Phrase AASB TerminologyMarket Value Fair Value for Actively Traded SecuritiesCash Cash and Cash EquivalentsShare Capital Contributed Equity
Reporting Basis and ConventionsThe financial report has been prepared on an accruals basis and is based on historical costs modified by therevaluation of selected non-current assets, financial assets and financial liabilities for which the fair valuebasis of accounting has been applied.
Accounting Policiesa. Principles of Consolidation
A controlled entity is any entity BKI Investment Company Limited has the power to control the financialand operating policies of so as to obtain benefits from its activities.A list of controlled entities is contained in Note 21(i) to the financial statements. All controlled entitieshave a June financial year-end.All inter-company balances and transactions between entities in the Group, including any unrealisedprofits or losses, have been eliminated on consolidation. Accounting policies of subsidiaries have beenchanged where necessary to ensure consistencies with those policies applied by the parent entity.Where controlled entities have entered or left the Group during the year, their operating results havebeen included/excluded from the date control was obtained or until the date control ceased.Minority equity interests in the equity and results of the entities that are controlled are shown as aseparate item in the consolidated financial report.F
or p
erso
nal u
se o
nly
BKI INVESTMENT COMPANY LIMITED
NOTES TO THE FINANCIAL STATEMENTSFOR THE YEAR ENDED 30 JUNE 2016
27
1. Summary of Significant Accounting Policies (continued)
b. Income TaxThe charge for current income tax expense is based on the profit for the year adjusted for any non-assessable or disallowed items. It is calculated using the tax rates that have been enacted or aresubstantially enacted by the balance sheet date.
Deferred tax is accounted for using the balance sheet liability method in respect of temporarydifferences arising between the tax bases of assets and liabilities and their carrying amounts in thefinancial statements. No deferred income tax will be recognised from the initial recognition of an assetor liability, excluding a business combination, where there is no effect on accounting or taxable profitor loss.
Deferred tax is calculated at the tax rates that are expected to apply to the period when the asset isrealised or liability is settled. Deferred tax is credited in the income statement except where it relatesto items that may be credited directly to equity, in which case the deferred tax is adjusted directlyagainst equity.
Deferred income tax assets are recognised to the extent that it is probable that future tax profits willbe available against which deductible temporary differences can be utilised.
The amount of benefits brought to account or which may be realised in the future is based on theassumption that no adverse change will occur in income taxation legislation and the anticipation thatthe group will derive sufficient future assessable income to enable the benefit to be realised and complywith the conditions of deductibility imposed by the law.
BKI Investment Company Limited and its wholly-owned Australian subsidiaries have formed an incometax consolidated group under the tax consolidation regime. Each entity in the group recognises its owncurrent and deferred tax liabilities, except for any deferred tax balances resulting from unused taxlosses and tax credits, which are immediately assumed by the parent entity. The current tax liability ofeach group entity is then subsequently assumed by the parent entity. The group notified the AustralianTax Office that it had formed an income tax consolidated group to apply from 12 December 2003. Thetax consolidated group has entered a tax sharing agreement whereby each entity in the groupcontributes to the income tax payable in proportion to their contribution to the net profit before tax ofthe tax consolidated group.
c. Financial InstrumentsRecognitionFinancial instruments are initially measured at cost on trade date, which includes transaction costs,when the related contractual rights or obligations exist. Subsequent to initial recognition theseinstruments are measured as set out below.
The Group has two portfolios of securities, the investment portfolio and the trading portfolio. Theinvestment portfolio relates to holdings of securities which the Directors intend to retain on a long-termbasis and the trading portfolio comprises securities held for short term trading purposes.
Securities within the investment portfolio are classified as ‘financial assets measured at fair valuethrough other comprehensive income’, and are designated as such upon initial recognition. Securitiesheld within the trading portfolio are classified as ‘mandatorily measured at fair value through profit orloss in accordance with AASB 9’.
For
per
sona
l use
onl
y
BKI INVESTMENT COMPANY LIMITED
NOTES TO THE FINANCIAL STATEMENTSFOR THE YEAR ENDED 30 JUNE 2016
28
1. Summary of Significant Accounting Policies (continued)
c. Financial Instruments (continued)Valuation of investment portfolioListed securities are initially brought to account at market value, which is the cost of acquisition, andare re-valued to market values continuously. Movements in carrying values of securities arerecognised as Other Comprehensive Income and taken to the Revaluation Reserve.Where disposal of an investment occurs, any revaluation increment or decrement relating to it istransferred from the Revaluation Reserve to the Realised Capital Gains Reserve.
Valuation of trading portfolioListed securities are initially brought to account at market value, which is the cost of acquisition, andare re-valued to market values continuously.Movements in carrying values of securities in the trading portfolio are taken to Profit or Loss throughthe Income Statement.
d. Employee Benefits(i) Wages, salaries and annual leaveLiabilities for wages and salaries, including annual leave, expected to be settled within 12 months ofbalance date are recognised as current provisions in respect of employees’ services up to balancedate and are measured at the amounts expected to be paid when the liabilities are settled.(ii) Long service leaveIn calculating the value of long service leave, where the total long service leave liability becomesmaterial, consideration is given to expected future wage and salary levels, experience of employeedepartures and periods of service. In such circumstances, expected future payments are discountedusing market yields at balance date on long term corporate bonds with terms to maturity and currencythat match, as closely as possible, the estimated future cash outflows.(iii) Share incentivesShare incentives are provided under the Short and Long Term Incentive Plans.The Short Term Incentive Plan is settled in shares, but based on a cash amount. A provision for theamount payable under the Short Term Incentive plan is recognised on the Balance Sheet.For the Long Term Incentive Plan, the incentives are based on the performance of the Group over aminimum four year period. The incentives are settled in shares. Expenses are recognised over theassessment period based on the amount expected to be payable under this plan, resulting in aprovision for incentive payable being built up on the balance sheet over the assessment period.In the event that the executive does not complete the period of service, the cumulative expense isreversed.
Fair valueFair value is determined based on last sale price for all quoted investments.
e. RevenueSale of investments occurs when the control of the right to equity has passed to the buyer.Interest revenue is recognised on a proportional basis taking into account the interest rates applicableto the financial assets.Dividend and distribution revenue is recognised when the right to receive a dividend or distribution hasbeen established.All revenue is stated net of the amount of goods and services tax (GST).
For
per
sona
l use
onl
y

BKI INVESTMENT COMPANY LIMITED
NOTES TO THE FINANCIAL STATEMENTSFOR THE YEAR ENDED 30 JUNE 2016
29
1. Summary of Significant Accounting Policies (continued)f. Cash and Cash Equivalents
Cash and cash equivalents include cash on hand, deposits held at call with banks, other short-termhighly liquid investments with original maturities of 12 months or less, and bank overdrafts.
j. Comparative FiguresWhen required by Accounting Standards, comparative figures have been adjusted to conform tochanges in presentation for the current financial year. Where a retrospective restatement of items inthe statement of financial position has occurred, presentation of the statement as at the beginning ofthe earliest comparative period has been included.
k. Rounding of AmountsThe parent has applied the relief available to it under ASIC Corporations Instrument (Rounding inFinancial / Directors’ Reports) 2016/191 and accordingly, amounts in the financial report andDirectors’ report have been rounded off to the nearest $1,000.
l. Critical Accounting Estimates and JudgmentsDeferred Tax BalancesThe preparation of this financial report requires the use of certain critical estimates based on historicalknowledge and best available current information. This requires the Directors and management toexercise their judgement in the process of applying the Group’s accounting policies.The carrying amounts of certain assets and liabilities are often determined based on estimates andassumptions of future events. In accordance with AASB 112: Income Taxes deferred tax liabilitieshave been recognised for Capital Gains Tax on unrealised gains in the investment portfolio at thecurrent tax rate of 30%.As the Group does not intend to dispose of the portfolio, this tax liability may not be crystallised atthe amount disclosed in Note 12. In addition, the tax liability that arises on disposal of those securitiesmay be impacted by changes in tax legislation relating to treatment of capital gains and the rate oftaxation applicable to such gains at the time of disposal.Apart from this, there are no other key assumptions or sources of estimation uncertainty that have arisk of causing a material adjustment to the carrying amount of certain assets and liabilities within thenext reporting period.
g. Plant and EquipmentPlant and equipment represents the costs of furniture and computer equipment and is depreciatedover its useful life, a period of between 3 and 5 years.
h. Goods and Services Tax (GST)Revenues, expenses and assets are recognised net of the amount of GST, except where the amountof GST incurred is not recoverable from the Australian Tax Office. In these circumstances the GST isrecognised as part of the cost of acquisition of the asset or as part of an item of the expense.Receivables and payables in the balance sheet are shown inclusive of GST.Cash flows are presented in the cash flow statement on a gross basis, except for the GST componentof investing and financing activities, which are disclosed as operating cash flows.
i. Segment ReportingOperating segments are reported in a manner consistent with the internal reporting used by the chiefoperating decision-maker. The Board has been identified as the chief operating decision-maker, as itis responsible for allocating resources and assessing performance of the operating segments. TheGroup operates solely in the securities industry in Australia and has no reportable segments.
For
per
sona
l use
onl
y

BKI INVESTMENT COMPANY LIMITED
NOTES TO THE FINANCIAL STATEMENTSFOR THE YEAR ENDED 30 JUNE 2016
30
1. Summary of Significant Accounting Policies (continued)
m. Australian Accounting Standards not yet effectiveThe Group has not applied any Australian Accounting Standards or UIG interpretations that havebeen issued as at balance date but are not yet operative for the year ended 30 June 2016 (“theinoperative standards”). The impact of the inoperative standards has been assessed and the impacthas been identified as not being material. The Group only intends to adopt inoperative standards atthe date at which their adoption becomes mandatory.
2016 2015$’000 $’000
2. Revenues
(a) Ordinary revenue from investment portfolioFully franked dividends 37,220 36,785Unfranked dividends 1,431 1,034Trust distributions 3,087 2,996
Total ordinary revenue from investment portfolio 41,738 40,815
(b) Special investment revenueFully franked dividends 1,082 2,095
(c) Revenue from bank depositsInterest received 1,155 1,519
(d) Other incomeOther revenue - 8
(e) Other gainsNet realised gain on sale of investment held for trading 1,027 2,163Net unrealised gain/ (loss) on investments held for trading (87) 63
Total other gains 940 2,226
Total income 44,915 46,663
3. Operating expenses
Administration expenses 376 352Occupancy expenses 13 13Employment expenses 930 1,075Professional fees 153 160Depreciation 7 7
Total operating expenses 1,479 1,607
For
per
sona
l use
onl
y
BKI INVESTMENT COMPANY LIMITED
NOTES TO THE FINANCIAL STATEMENTSFOR THE YEAR ENDED 30 JUNE 2016
31
2016 2015$’000 $’000
4. Tax expense(a) Reconciliation of income tax expense
The aggregated amount of income tax expense attributable to the yeardiffers from the amounts prima facie payable on profits from ordinaryactivities. The difference is reconciled as follows:
Operating profit before income tax expense, including gross gains oninvestment portfolio 43,550 45,056
Tax calculated at 30% (2015: 30%) 13,065 13,517
Tax effect of amounts which are not deductible (taxable) in calculatingtaxable income:- Franked dividends and distributions received (11,491) (11,664)- Permanent difference to reset tax cost base of investments acquired
on acquisition of subsidiaries (195) -- Discount on acquisition of subsidiaries, net of expenses (34) -- Prior year (over)/ under provision (47) 232Net income tax expense on operating profit before net gains oninvestments 1,298 2,085
Net realised gains/(losses) on investment portfolio (9,244) 2,670
Tax calculated at 30% (2015: 30%) (2,773) 802
Total tax expense/ (benefit) (1,474) 2,887
(b) The components of tax expense comprise:Current tax 1,264 1,531Deferred tax (2,692) 1,124Prior year (over)/ under provision (47) 232
Total tax expense/ (benefit) (1,474) 2,887
5. Dividends(a) Dividends paid during the year
Final dividend for the year ended 30 June 2015 of 3.65 cents per share(2014 final: 3.50 cents per share) fully franked at the tax rate of 30%,paid on 27 August 2015 20,314 19,359
Interim dividend for the year ended 30 June 2016 of 3.60 cents pershare (2015 interim: 3.55 cents per share) fully franked at the tax rate of30%, paid on 26 February 2016 20,473 19,698
Total dividends paid 40,787 39,057
For
per
sona
l use
onl
y

BKI INVESTMENT COMPANY LIMITED
NOTES TO THE FINANCIAL STATEMENTSFOR THE YEAR ENDED 30 JUNE 2016
32
(d) Dividends declared after balance date
Since the end of the year the Directors have declared a final ordinary dividend for the year ended 30 June2016 of 3.65 cents per share fully franked at the tax rate of 30% (2015: final ordinary dividend of 3.65 centsper share fully franked at the tax rate of 30%), payable on 26 August 2016, but not recognised as a liabilityat the year end.
2016 2015$’000 $’000
5. Dividends (continued)(b) Reconciliation of total dividends paid to dividends paid in cash:
Total dividends paid 40,787 39,057Less: Dividends reinvested in shares via DRP (6,021) (5,863)
Dividends paid in cash 34,766 33,194
(c) Franking account balanceBalance of the franking account after allowing for tax payable in respectof the current year’s profits and the receipt of dividends recognised asreceivables 24,703 22,554Estimated impact on the franking account of dividends declared but notrecognised as a liability at the end of the financial year (refer below) (8,989) (8,076)
Net imputation credits available for future dividends 15,714 13,848
Maximum fully franked dividends payable from available frankingcredits at the tax rate of 30% (2015: 30%) 36,667 32,311
6. Earnings per shareNet operating profit 42,252 42,971Earnings used in calculating basic and diluted earnings per share beforespecial dividend income 41,170 40,876Earnings used in calculating basic and diluted earnings per share afterspecial dividend income 42,252 42,971
2016 2015No. (’000) No. (’000)
Weighted average number of ordinary shares used in calculating basic anddiluted earnings per share 574,631 552,158
2016 2015Cents Cents
Basic and diluted earnings per share before special dividend income 7.16 7.40Basic and diluted earnings per share after special dividend income 7.35 7.78F
or p
erso
nal u
se o
nly

BKI INVESTMENT COMPANY LIMITED
NOTES TO THE FINANCIAL STATEMENTSFOR THE YEAR ENDED 30 JUNE 2016
33
Fair Value MeasurementBKI measures the fair value of its trading portfolio and investment portfolio with reference to the followingfair value measurement hierarchy mandated by accounting standards:
Level 1: quoted prices (unadjusted) in active markets for identical assets or liabilitiesLevel 2: inputs other than quoted prices included within Level 1 that are observable for the asset or
liability, either directly (as prices) or indirectly (derived from prices); andLevel 3: inputs for the assets or liabilities that are not based on observable market data (unobservable
inputs).
Both the trading portfolio and investment portfolio are classified as Level 1, and are measured inaccordance with the policy outlined in Note 1.c.
2016 2015$’000 $’000
7. Cash and cash equivalentsCash at bank 15,740 2,633Short term bank deposits 48,000 38,500
63,740 41,133
8. Trade and other receivablesDividends and distributions receivable 8,091 7,537Interest receivable 184 321Outstanding settlements (3) 9,821Other 43 9
8,315 17,688
9. Financial Assets – Investment PortfolioTrading portfolio – currentListed securities at fair value held for trading 479 566
Investment portfolio – non-currentListed securities at fair value available for sale 854,460 858,877
Total investment portfolio 854,939 859,443
10. Deferred tax assetsThe deferred tax asset balance comprises the following timingdifferences and unused tax losses:Transaction costs on equity issues 371 444Accrued expenses 121 119Realised capital tax losses 11,637 8,812
Total 12,129 9,375
For
per
sona
l use
onl
y
BKI INVESTMENT COMPANY LIMITED
NOTES TO THE FINANCIAL STATEMENTSFOR THE YEAR ENDED 30 JUNE 2016
34
10. Deferred tax assets (continued)
Movements in deferred tax assets
Openingbalance
Credited/(charged) tostatement of
comprehensiveincome
Credited/(charged) to
equityClosingbalance
$’000 $’000 $’000 $’000
Transaction costs on equity issues 499 (147) 92 444Accrued expenses 56 63 - 119Realised capital tax losses 9,797 (985) - 8,812
Balance as at 30 June 2015 10,352 (1,069) 92 9,375
Transaction costs on equity issues 444 (165) 92 371Accrued expenses 119 2 - 121Realised capital tax losses 8,812 2,825 - 11,637
Balance as at 30 June 2016 9,375 2,662 92 12,129
2016 2015$’000 $’000
11 Current tax liabilitiesProvision for income tax 381 993
12. Deferred tax liabilitiesThe deferred tax asset balance comprises the following timingdifferences:Revaluation of investments held 57,710 72,308Non rebateable dividends receivable and interest receivable 598 628
Total 58,308 72,936
Movements in deferred tax liabilities
Openingbalance
(Credited)/charged to
statement ofcomprehensive
income
(Credited)/charged to
equityClosingbalance
$’000 $’000 $’000 $’000
Revaluation of investment portfolio 71,196 - 1,112 72,308Unfranked dividends receivable andinterest receivable 573 55 - 628
Balance as at 30 June 2015 71,769 55 1,112 72,936
Revaluation of investment portfolio 72,308 - (14,598) 57,710Unfranked dividends receivable andinterest receivable 628 (30) - 598
Balance as at 30 June 2016 72,936 (30) (14,598) 58,308
For
per
sona
l use
onl
y
BKI INVESTMENT COMPANY LIMITED
NOTES TO THE FINANCIAL STATEMENTSFOR THE YEAR ENDED 30 JUNE 2016
35
The Parent does not have an authorised share capital and the ordinary shares on issue have no par value.
Holders of ordinary shares participate in dividends and the proceeds on a winding up of the parent entity inproportion to the number of shares held.
At shareholders’ meetings each ordinary share is entitled to one vote when a poll is called, otherwise eachshareholder has one vote on a show of hands.
(c) Capital Management
The Group’s objective in managing capital is to provide shareholders with attractive investment returnsthrough access to a steady stream of fully-franked dividends and enhancement of capital invested, with goalsof paying an enhanced level of dividends and providing attractive total returns over the medium to long term.
The Group recognises that its capital will fluctuate in accordance with market conditions and in order tomaintain or adjust the capital structure, may adjust the amount of dividends paid, issue new shares from time-to-time or return capital to shareholders.
The Group’s capital consists of shareholders’ equity plus net debt. The movement in equity is shown in theConsolidated Statement of Changes in Equity. At 30 June 2016 net debt was $Nil (2015: $Nil).
(d) Acquisition of controlled entities
During the 2016FY the Company acquired 100% of the shares of three unlisted investment companies(2015FY: No acquisitions were made). The Company issued 20,006,472 new shares in BKI InvestmentCompany Limited in total as consideration for the three acquisitions, having a combined fair value of $32M.These acquisitions benefit BKI shareholders by increasing the size of BKI’s portfolio in a cost-effectivemanner, and at the same time reducing the per share cost of managing the portfolio.
The acquisitions resulted in BKI achieving a discount on acquisition, which is not allocated against assets ofthe companies purchased because only financial assets were purchased. The discount has therefore beenincluded in “Discount on acquisition of controlled entities, net of expenses” in the “Consolidated IncomeStatement”.
2016 2015$’000 $’000
13. Share Capital(a) Issued and paid-up capital
598,420,148 ordinary shares fully paid (2015: 556,560,509) 718,221 652,562
(b) Movement in ordinary shares2016 2015
Number ofshares $’000
Number ofshares $’000
Beginning of financial year 556,560,509 652,562 524,240,486 599,124Issued during the year:- dividend reinvestment plan 3,663,370 6,021 3,440,622 5,864
- share purchase plan 18,189,797 28,192 28,879,401 47,790- acquisition of controlled entities 20,006,472 31,662 - -
Gross funds raised 53,654- less net transaction costs (216) (216)
End of financial year 598,420,148 718,221 556,560,509 652,562
For
per
sona
l use
onl
y
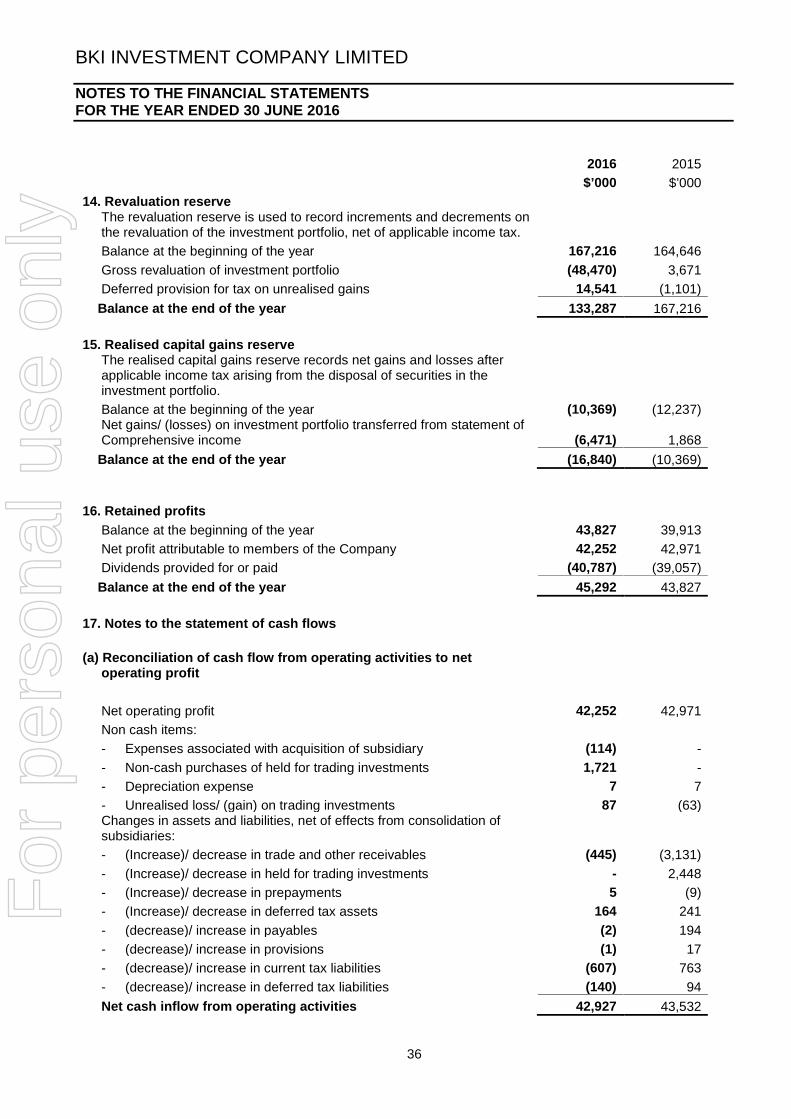
BKI INVESTMENT COMPANY LIMITED
NOTES TO THE FINANCIAL STATEMENTSFOR THE YEAR ENDED 30 JUNE 2016
36
2016 2015$’000 $’000
14. Revaluation reserveThe revaluation reserve is used to record increments and decrements onthe revaluation of the investment portfolio, net of applicable income tax.Balance at the beginning of the year 167,216 164,646Gross revaluation of investment portfolio (48,470) 3,671Deferred provision for tax on unrealised gains 14,541 (1,101)
Balance at the end of the year 133,287 167,216
15. Realised capital gains reserveThe realised capital gains reserve records net gains and losses afterapplicable income tax arising from the disposal of securities in theinvestment portfolio.Balance at the beginning of the year (10,369) (12,237)Net gains/ (losses) on investment portfolio transferred from statement ofComprehensive income (6,471) 1,868
Balance at the end of the year (16,840) (10,369)
16. Retained profitsBalance at the beginning of the year 43,827 39,913Net profit attributable to members of the Company 42,252 42,971Dividends provided for or paid (40,787) (39,057)
Balance at the end of the year 45,292 43,827
17. Notes to the statement of cash flows
(a) Reconciliation of cash flow from operating activities to netoperating profit
Net operating profit 42,252 42,971Non cash items:- Expenses associated with acquisition of subsidiary (114) -- Non-cash purchases of held for trading investments 1,721 -- Depreciation expense 7 7- Unrealised loss/ (gain) on trading investments 87 (63)Changes in assets and liabilities, net of effects from consolidation ofsubsidiaries:- (Increase)/ decrease in trade and other receivables (445) (3,131)- (Increase)/ decrease in held for trading investments - 2,448- (Increase)/ decrease in prepayments 5 (9)- (Increase)/ decrease in deferred tax assets 164 241- (decrease)/ increase in payables (2) 194- (decrease)/ increase in provisions (1) 17- (decrease)/ increase in current tax liabilities (607) 763- (decrease)/ increase in deferred tax liabilities (140) 94Net cash inflow from operating activities 42,927 43,532
For
per
sona
l use
onl
y

BKI INVESTMENT COMPANY LIMITED
NOTES TO THE FINANCIAL STATEMENTSFOR THE YEAR ENDED 30 JUNE 2016
37
17. Notes to the statement of cash flows (continued)
(b) Non-cash financing and investing activities
(i) Dividend reinvestment planUnder the terms of the dividend reinvestment plan, $6,021,000 (2015: $5,864,000) of dividendswere paid via the issue of 3,663,370 shares (2015: 3,440,622).
(ii) Acquisition of controlled entitiesDuring the year the Company Group acquired shares in three unlisted investment companies viathe issue of 20,006,472 new shares in BKI (refer Note 13 (d)).
18. Management of Financial Risk
The risks associated with the holding of financial instruments such as investments, cash, bank bills andborrowings include market risk, credit risk and liquidity risk. The Board has approved the policies andprocedures that have been established to manage these risks. The effectiveness of these policies andprocedures is reviewed by the Audit Committee.
a. Financial instruments’ terms, conditions and accounting policiesThe Group’s accounting policies are included in note 1, while the terms and conditions of each classof financial asset, financial liability and equity instrument, both recognised and unrecognised at thebalance date, are included under the appropriate note for that instrument.
b. Net fair valuesThe carrying amounts of financial instruments in the balance sheets approximate their net fair valuedetermined in accordance with the accounting policies disclosed in note 1 to the accounts.
c. Credit riskThe risk that a financial loss will occur because counterparty to a financial instrument fails to dischargean obligation is known as credit risk.
The credit risk on the Group’s financial assets, excluding investments, is the carrying amount of thoseassets. The Group’s principal credit risk exposures arise from the investment in liquid assets, such ascash and bank bills, and income receivable.
Cash and bank bills are reviewed monthly by the Board to ensure cash is only placed with pre-approvedfinancial institutions with low risk profiles (primarily “Big 4” banks) and that the spread of cash and bankbills between banks is within agreed limits. Income receivable is comprised of accrued interest anddividends and distributions which were brought to account on the date the shares or units traded ex-dividend.
There are no financial instruments overdue or considered to be impaired.
d. Market riskMarket risk is the risk that changes in market prices will affect the fair value of a financial instrument.
The Group is a long term investor in companies and trusts and is therefore exposed to market riskthrough the movement of the share/unit prices of the companies and trusts in which it is invested.
The market value of the portfolio changes continuously because the market value of individualcompanies within the portfolio fluctuates throughout the day. The change in the market value of theportfolio is recognised through the Revaluation Reserve. Listed Investments represent 91% (2015:93%) of total assets.
For
per
sona
l use
onl
y
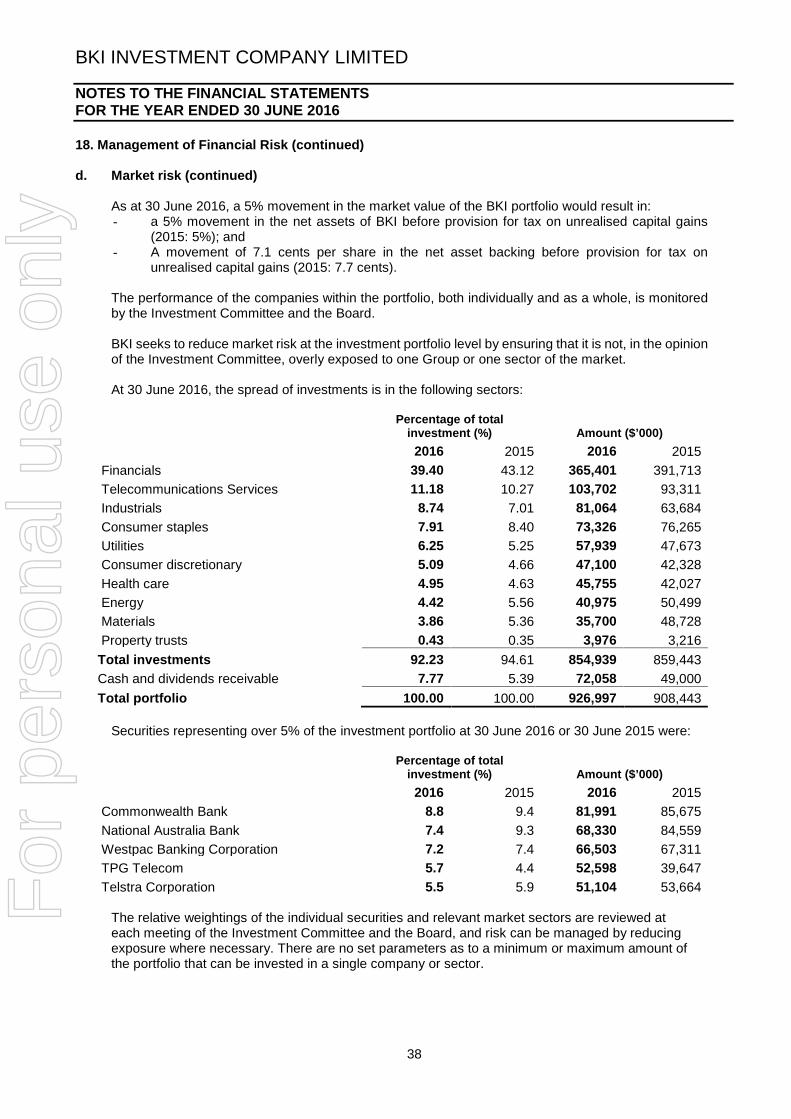
BKI INVESTMENT COMPANY LIMITED
NOTES TO THE FINANCIAL STATEMENTSFOR THE YEAR ENDED 30 JUNE 2016
38
18. Management of Financial Risk (continued)
d. Market risk (continued)
As at 30 June 2016, a 5% movement in the market value of the BKI portfolio would result in:- a 5% movement in the net assets of BKI before provision for tax on unrealised capital gains
(2015: 5%); and- A movement of 7.1 cents per share in the net asset backing before provision for tax on
unrealised capital gains (2015: 7.7 cents).
The performance of the companies within the portfolio, both individually and as a whole, is monitoredby the Investment Committee and the Board.
BKI seeks to reduce market risk at the investment portfolio level by ensuring that it is not, in the opinionof the Investment Committee, overly exposed to one Group or one sector of the market.
At 30 June 2016, the spread of investments is in the following sectors:
Securities representing over 5% of the investment portfolio at 30 June 2016 or 30 June 2015 were:
The relative weightings of the individual securities and relevant market sectors are reviewed ateach meeting of the Investment Committee and the Board, and risk can be managed by reducingexposure where necessary. There are no set parameters as to a minimum or maximum amount ofthe portfolio that can be invested in a single company or sector.
Percentage of totalinvestment (%) Amount ($’000)2016 2015 2016 2015
Financials 39.40 43.12 365,401 391,713Telecommunications Services 11.18 10.27 103,702 93,311Industrials 8.74 7.01 81,064 63,684Consumer staples 7.91 8.40 73,326 76,265Utilities 6.25 5.25 57,939 47,673Consumer discretionary 5.09 4.66 47,100 42,328Health care 4.95 4.63 45,755 42,027Energy 4.42 5.56 40,975 50,499Materials 3.86 5.36 35,700 48,728Property trusts 0.43 0.35 3,976 3,216
Total investments 92.23 94.61 854,939 859,443Cash and dividends receivable 7.77 5.39 72,058 49,000Total portfolio 100.00 100.00 926,997 908,443
Percentage of totalinvestment (%) Amount ($’000)2016 2015 2016 2015
Commonwealth Bank 8.8 9.4 81,991 85,675National Australia Bank 7.4 9.3 68,330 84,559Westpac Banking Corporation 7.2 7.4 66,503 67,311TPG Telecom 5.7 4.4 52,598 39,647Telstra Corporation 5.5 5.9 51,104 53,664F
or p
erso
nal u
se o
nly
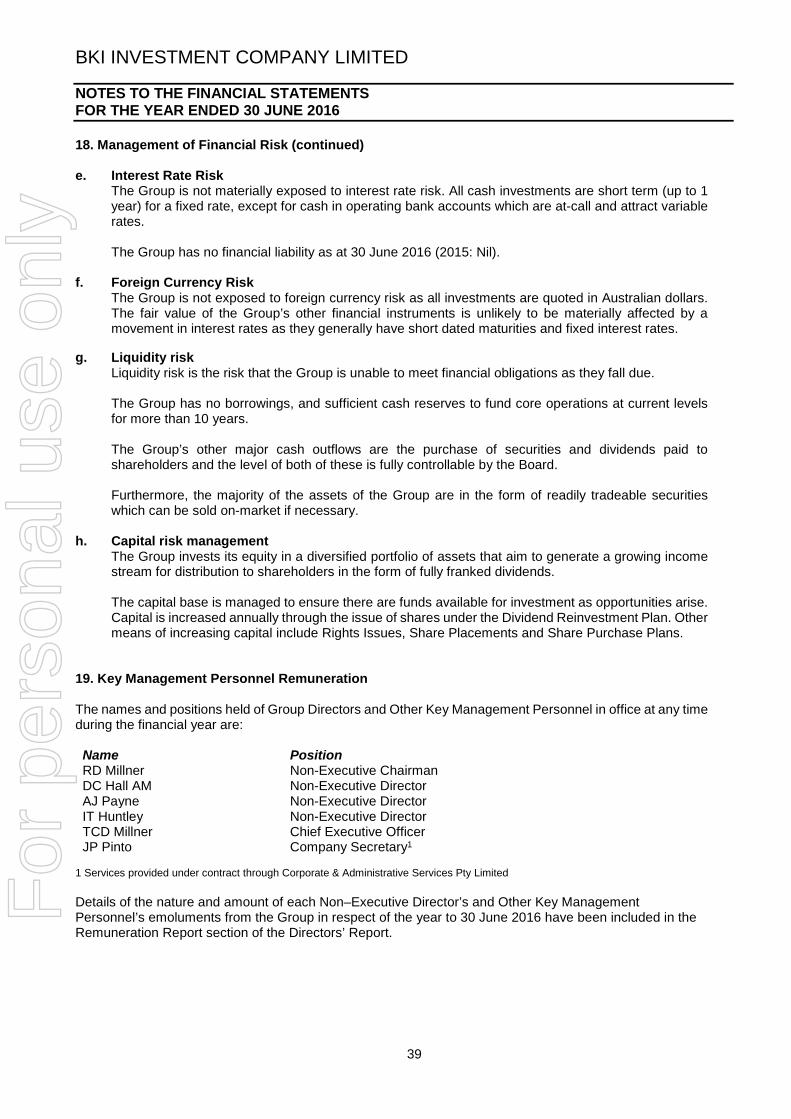
BKI INVESTMENT COMPANY LIMITED
NOTES TO THE FINANCIAL STATEMENTSFOR THE YEAR ENDED 30 JUNE 2016
39
18. Management of Financial Risk (continued)
e. Interest Rate RiskThe Group is not materially exposed to interest rate risk. All cash investments are short term (up to 1year) for a fixed rate, except for cash in operating bank accounts which are at-call and attract variablerates.
The Group has no financial liability as at 30 June 2016 (2015: Nil).
f. Foreign Currency RiskThe Group is not exposed to foreign currency risk as all investments are quoted in Australian dollars.The fair value of the Group’s other financial instruments is unlikely to be materially affected by amovement in interest rates as they generally have short dated maturities and fixed interest rates.
g. Liquidity riskLiquidity risk is the risk that the Group is unable to meet financial obligations as they fall due.
The Group has no borrowings, and sufficient cash reserves to fund core operations at current levelsfor more than 10 years.
The Group’s other major cash outflows are the purchase of securities and dividends paid toshareholders and the level of both of these is fully controllable by the Board.
Furthermore, the majority of the assets of the Group are in the form of readily tradeable securitieswhich can be sold on-market if necessary.
h. Capital risk managementThe Group invests its equity in a diversified portfolio of assets that aim to generate a growing incomestream for distribution to shareholders in the form of fully franked dividends.
The capital base is managed to ensure there are funds available for investment as opportunities arise.Capital is increased annually through the issue of shares under the Dividend Reinvestment Plan. Othermeans of increasing capital include Rights Issues, Share Placements and Share Purchase Plans.
19. Key Management Personnel Remuneration
The names and positions held of Group Directors and Other Key Management Personnel in office at any timeduring the financial year are:
Name PositionRD Millner Non-Executive ChairmanDC Hall AM Non-Executive DirectorAJ Payne Non-Executive DirectorIT Huntley Non-Executive DirectorTCD Millner Chief Executive OfficerJP Pinto Company Secretary1
1 Services provided under contract through Corporate & Administrative Services Pty Limited
Details of the nature and amount of each Non–Executive Director’s and Other Key ManagementPersonnel’s emoluments from the Group in respect of the year to 30 June 2016 have been included in theRemuneration Report section of the Directors’ Report.
For
per
sona
l use
onl
y
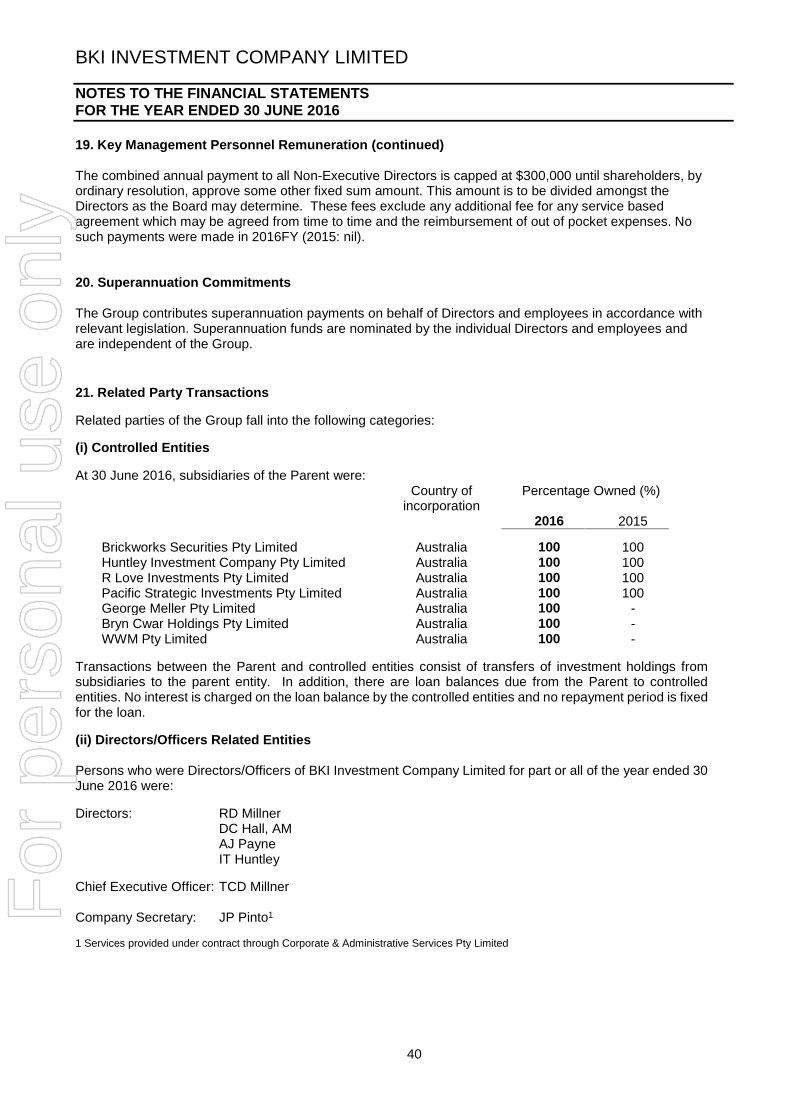
BKI INVESTMENT COMPANY LIMITED
NOTES TO THE FINANCIAL STATEMENTSFOR THE YEAR ENDED 30 JUNE 2016
40
19. Key Management Personnel Remuneration (continued)
The combined annual payment to all Non-Executive Directors is capped at $300,000 until shareholders, byordinary resolution, approve some other fixed sum amount. This amount is to be divided amongst theDirectors as the Board may determine. These fees exclude any additional fee for any service basedagreement which may be agreed from time to time and the reimbursement of out of pocket expenses. Nosuch payments were made in 2016FY (2015: nil).
20. Superannuation Commitments
The Group contributes superannuation payments on behalf of Directors and employees in accordance withrelevant legislation. Superannuation funds are nominated by the individual Directors and employees andare independent of the Group.
21. Related Party Transactions
Related parties of the Group fall into the following categories:
(i) Controlled Entities
At 30 June 2016, subsidiaries of the Parent were:Country of
incorporationPercentage Owned (%)
2016 2015
Brickworks Securities Pty Limited Australia 100 100Huntley Investment Company Pty Limited Australia 100 100R Love Investments Pty Limited Australia 100 100Pacific Strategic Investments Pty Limited Australia 100 100George Meller Pty Limited Australia 100 -Bryn Cwar Holdings Pty Limited Australia 100 -WWM Pty Limited Australia 100 -
Transactions between the Parent and controlled entities consist of transfers of investment holdings fromsubsidiaries to the parent entity. In addition, there are loan balances due from the Parent to controlledentities. No interest is charged on the loan balance by the controlled entities and no repayment period is fixedfor the loan.
(ii) Directors/Officers Related Entities
Persons who were Directors/Officers of BKI Investment Company Limited for part or all of the year ended 30June 2016 were:
Directors: RD MillnerDC Hall, AMAJ PayneIT Huntley
Chief Executive Officer: TCD Millner
Company Secretary: JP Pinto1
1 Services provided under contract through Corporate & Administrative Services Pty Limited
For
per
sona
l use
onl
y
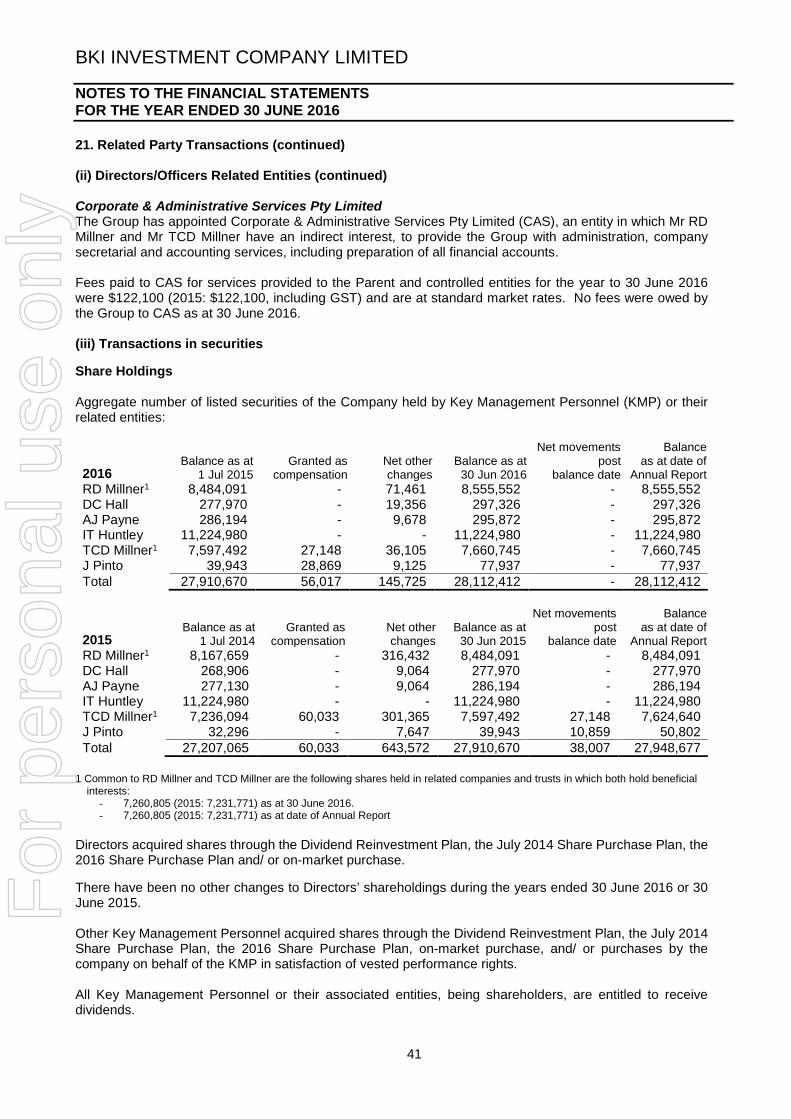
BKI INVESTMENT COMPANY LIMITED
NOTES TO THE FINANCIAL STATEMENTSFOR THE YEAR ENDED 30 JUNE 2016
41
21. Related Party Transactions (continued)
(ii) Directors/Officers Related Entities (continued)
Corporate & Administrative Services Pty LimitedThe Group has appointed Corporate & Administrative Services Pty Limited (CAS), an entity in which Mr RDMillner and Mr TCD Millner have an indirect interest, to provide the Group with administration, companysecretarial and accounting services, including preparation of all financial accounts.
Fees paid to CAS for services provided to the Parent and controlled entities for the year to 30 June 2016were $122,100 (2015: $122,100, including GST) and are at standard market rates. No fees were owed bythe Group to CAS as at 30 June 2016.
(iii) Transactions in securities
Share Holdings
Aggregate number of listed securities of the Company held by Key Management Personnel (KMP) or theirrelated entities:
2016Balance as at
1 Jul 2015Granted as
compensationNet otherchanges
Balance as at30 Jun 2016
Net movementspost
balance date
Balanceas at date of
Annual ReportRD Millner1 8,484,091 - 71,461 8,555,552 - 8,555,552DC Hall 277,970 - 19,356 297,326 - 297,326AJ Payne 286,194 - 9,678 295,872 - 295,872IT Huntley 11,224,980 - - 11,224,980 - 11,224,980TCD Millner1 7,597,492 27,148 36,105 7,660,745 - 7,660,745J Pinto 39,943 28,869 9,125 77,937 - 77,937Total 27,910,670 56,017 145,725 28,112,412 - 28,112,412
2015Balance as at
1 Jul 2014Granted as
compensationNet otherchanges
Balance as at30 Jun 2015
Net movementspost
balance date
Balanceas at date of
Annual ReportRD Millner1 8,167,659 - 316,432 8,484,091 - 8,484,091DC Hall 268,906 - 9,064 277,970 - 277,970AJ Payne 277,130 - 9,064 286,194 - 286,194IT Huntley 11,224,980 - - 11,224,980 - 11,224,980TCD Millner1 7,236,094 60,033 301,365 7,597,492 27,148 7,624,640J Pinto 32,296 - 7,647 39,943 10,859 50,802Total 27,207,065 60,033 643,572 27,910,670 38,007 27,948,677
1 Common to RD Millner and TCD Millner are the following shares held in related companies and trusts in which both hold beneficialinterests:
- 7,260,805 (2015: 7,231,771) as at 30 June 2016.- 7,260,805 (2015: 7,231,771) as at date of Annual Report
Directors acquired shares through the Dividend Reinvestment Plan, the July 2014 Share Purchase Plan, the2016 Share Purchase Plan and/ or on-market purchase.
There have been no other changes to Directors’ shareholdings during the years ended 30 June 2016 or 30June 2015.
Other Key Management Personnel acquired shares through the Dividend Reinvestment Plan, the July 2014Share Purchase Plan, the 2016 Share Purchase Plan, on-market purchase, and/ or purchases by thecompany on behalf of the KMP in satisfaction of vested performance rights.
All Key Management Personnel or their associated entities, being shareholders, are entitled to receivedividends.
For
per
sona
l use
onl
y

BKI INVESTMENT COMPANY LIMITED
NOTES TO THE FINANCIAL STATEMENTSFOR THE YEAR ENDED 30 JUNE 2016
42
The parent company has no contingent liabilities as at 30 June 2016.
23. Capital and Leasing Commitments
The Group has no capital and leasing commitments as at 30 June 2016.
24. Auditors’ Remuneration
25. Contingent Liabilities
The Group has no contingent liabilities as at 30 June 2016.
26. Authorisation
The financial report was authorised for issue on 19 July 2016 by the Board of Directors.
2016 2015$’000 $’000
22. Parent company information
Information relating to the parent entity of the Group, BKI InvestmentCompany Limited:Current assets 72,335 59,409Non-current assets 1,099,808 1,069,620Total assets 1,172,143 1,129,029Current liabilities 803 1,416Non-current liabilities 299,629 282,338Total liabilities 300,432 283,754Issued capital 718,221 652,562Reserves 153,510 192,713Total shareholders’ equity 871,712 845,275
Net operating profit 41,968 42,973Total other comprehensive income (40,402) 4,439
Remuneration of the auditor of the parent entity for auditing the financialreport of the Parent and the controlled entities 24 23
For
per
sona
l use
onl
y

BKI INVESTMENT COMPANY LIMITED
DIRECTORS’ DECLARATION
43
DIRECTORS’ DECLARATION
The Directors of BKI Investment Company Limited declare that:1. the financial statements and notes, as set out on pages 21 to 42, are in accordance with the
Corporations Act 2001 and:
a. comply with Accounting Standards and the Corporations Regulations; and
b. comply with International Financial Reporting Standards, as stated in note 1 to the financialstatements
c. give a true and fair view of the financial position as at 30 June 2016 and of the performancefor the year ended on that date of the consolidated entity;
2. in the Directors’ opinion there are reasonable grounds to believe that the company will be able topay its debts as and when they become due and payable.
3. this declaration has been made after receiving the declaration required to be made to the Directorsin accordance with section 295A of the Corporations Act 2001 for the financial year ending 30 June2016.
This declaration is made in accordance with a resolution of the Board of Directors.
Robert D MillnerDirector
Sydney19 July 2016
For
per
sona
l use
onl
y

For
per
sona
l use
onl
y

For
per
sona
l use
onl
y
For
per
sona
l use
onl
y

BKI INVESTMENT COMPANY LIMITED
ASX ADDITIONAL INFORMATION
47
1) Equity Holders
At 30 June 2016 there were 14,358 holders of ordinary shares in the capital of the Parent. Theseholders were distributed as follow:
Number of shares heldNumber of
shareholders1 – 1,000 9471,001 – 5,000 1,9575,001 – 10,000 2,11610,001 – 100,000 8,438100,001 and over 900Total 14,358
Holding less than a marketable parcel of 316 shares 521
The 20 largest holdings of the Parent’s share as at 30 June 2016 are listed below:
NameNumber ofshare held %
Washington H Soul Pattinson and Company Limited 61,759,383 10.32Huntley Group Investments Pty Ltd <Huntley Group Investments AC> 8,523,274 1.42J S Millner Holdings Pty Limited 5,208,913 0.87Jeanneau Cloud Nine Pty Limited 4,909,012 0.82GM Pty Limited (GM Family A/C> 3,785,690 0.63I R McDonald Pty Limited 3,000,000 0.50Nulis Nominees (Australia) Limited 2,499,965 0.42Navigator Australia Limited 1,842,704 0.31Stuart Llewellyn Gwyn Morgan + Margaret Patricia Morgan 1,646,089 0.28Huntley Group Investments Pty Ltd <Ian Huntley Super Fund A/c> 1,630,711 0.27Fennybentley Pty Limited 1,554,678 0.26Farjoy Pty Limited 1,450,800 0.24Stuart Llewellyn Gwyn Morgan 1,399,588 0.23HSBC Custody Nominees (Australia) Limited 1,377,299 0.23T N Phillips Investments Pty Limited 1,366,807 0.23K C Perks Investments Pty Ltd <Kym Perks S/F A/C> 1,332,494 0.22Mr Mark Southwell-Keely 1,281,720 0.21Mr Warwick Douglas Moppett 1,281,720 0.21Mr Peter Graydon Moppett 1,281,720 0.21T G Millner Holdings Pty Limited 1,261,483 0.21
For
per
sona
l use
onl
y
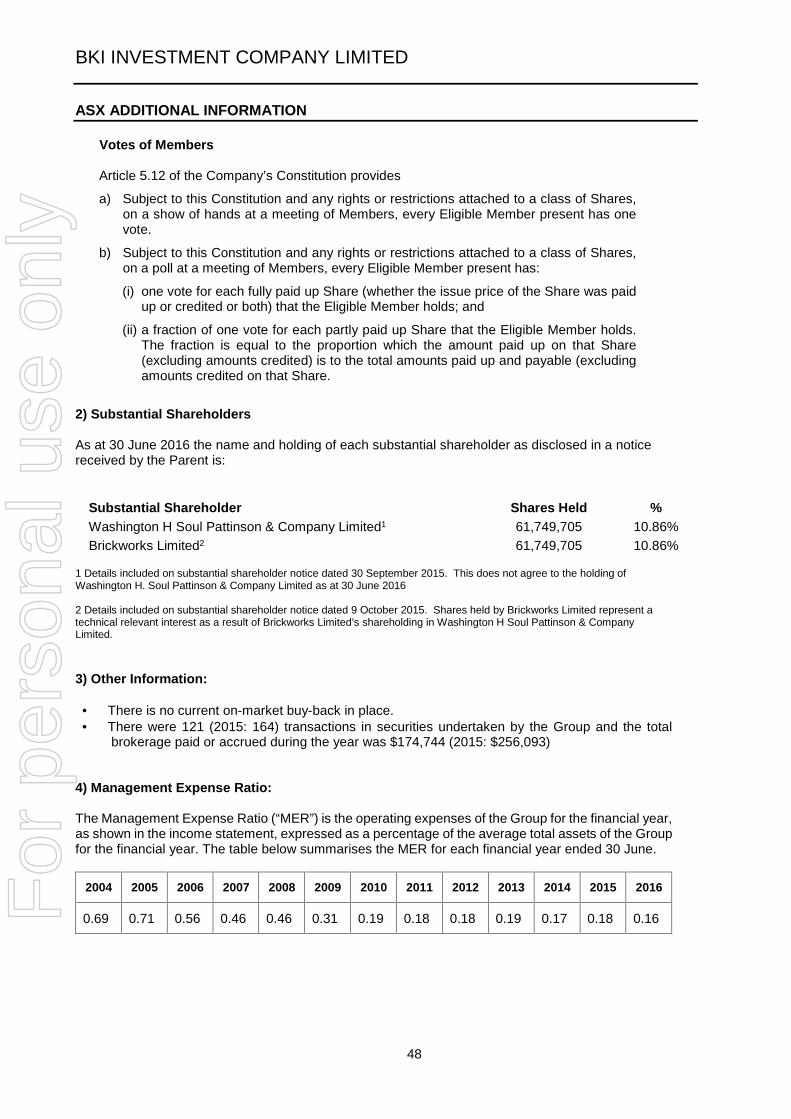
BKI INVESTMENT COMPANY LIMITED
ASX ADDITIONAL INFORMATION
48
Votes of Members
Article 5.12 of the Company’s Constitution provides
a) Subject to this Constitution and any rights or restrictions attached to a class of Shares,on a show of hands at a meeting of Members, every Eligible Member present has onevote.
b) Subject to this Constitution and any rights or restrictions attached to a class of Shares,on a poll at a meeting of Members, every Eligible Member present has:
(i) one vote for each fully paid up Share (whether the issue price of the Share was paidup or credited or both) that the Eligible Member holds; and
(ii) a fraction of one vote for each partly paid up Share that the Eligible Member holds.The fraction is equal to the proportion which the amount paid up on that Share(excluding amounts credited) is to the total amounts paid up and payable (excludingamounts credited on that Share.
2) Substantial Shareholders
As at 30 June 2016 the name and holding of each substantial shareholder as disclosed in a noticereceived by the Parent is:
Substantial Shareholder Shares Held %Washington H Soul Pattinson & Company Limited1 61,749,705 10.86%Brickworks Limited2 61,749,705 10.86%
1 Details included on substantial shareholder notice dated 30 September 2015. This does not agree to the holding ofWashington H. Soul Pattinson & Company Limited as at 30 June 2016
2 Details included on substantial shareholder notice dated 9 October 2015. Shares held by Brickworks Limited represent atechnical relevant interest as a result of Brickworks Limited’s shareholding in Washington H Soul Pattinson & CompanyLimited.
3) Other Information:
There is no current on-market buy-back in place. There were 121 (2015: 164) transactions in securities undertaken by the Group and the total
brokerage paid or accrued during the year was $174,744 (2015: $256,093)
4) Management Expense Ratio:
The Management Expense Ratio (“MER”) is the operating expenses of the Group for the financial year,as shown in the income statement, expressed as a percentage of the average total assets of the Groupfor the financial year. The table below summarises the MER for each financial year ended 30 June.
2004 2005 2006 2007 2008 2009 2010 2011 2012 2013 2014 2015 2016
0.69 0.71 0.56 0.46 0.46 0.31 0.19 0.18 0.18 0.19 0.17 0.18 0.16For
per
sona
l use
onl
y