Embed Size (px)
Citation preview

ANNUAL REPORT 2016
For
per
sona
l use
onl
y

10.6
5.4
8.3
FY12 FY13 FY15FY14
FY16
10.7
(4.2)
Revenue
OUR FUTURE
In FY16, LogiCamms focused on providing competitive core engineering, maintenance and consulting services to our traditional hydrocarbons and minerals and metals markets, and positioned the business for growth in infrastructure markets.
PERFORMANCE HIGHLIGHTS
FY12 FY13 FY15FY14
123.1 129.5 133.8127.9
FY16
108.2
14.1
12.1
6.7
FY12 FY13 FY15FY14
FY16*
11.3
(38.1)
EBITDAI ($m)* Underlying EBITDA
excludes onerous leases and impairment charges
NPAT ($m)* Includes impairment to goodwill
of $28.1m and onerous lease provisions of $2.9m (post tax)F
or p
erso
nal u
se o
nly

Our Business02
Financial Statements
12
Our Work04
Directors’ Declaration
62
Chairman’s Report
06Independent Auditor’s Report
63
Managing Director’s Report
08Lead Auditor’s Independence Declaration
65
Board and Management
10ASX Information66
LogiCamms supports owners and operators in the hydrocarbons, minerals and metals, and infrastructure sectors with solutions to optimise the performance of their assets. Our core business is focused on operating (brownfield) facilities and comprises engineering consulting, project delivery, asset performance and maintenance services that aim to reduce costs, improve performance and enhance value. LogiCamms operates primarily in Australia and New Zealand employing 450 people, and is listed on the Australian Stock Exchange (ASX: LCM).
CONTENTSENGINEERING A BETTER TOMORROW
OUR VISION OUR PURPOSE OUR VALUESTo be a market leader delivering outstanding customer solutions
To enhance the value and performance of assets
Can Do Approach Teamwork Integrity Delivering Quality Results Commitment to People
For
per
sona
l use
onl
y

DeliverDelivery of engineering projects
MaintainSite based implementation, maintenance, completions, testing and shutdowns
ConsultHigh value solutions tailored to customer needs
• Offshore topsides
• Onshore processing facilities
• Compressor stations
• Coal seam gas, natural gas, LNG
• Petrochemical
HYDROCARBONS MINERALS & METALS
• Materials handling & minerals processing
• Iron ore
• Coal
• Precious metals (gold)
• Base metals (copper)
• Rare earths
• Uranium
• Phosphates
INFRASTRUCTURE
• Power generation
• Water and wastewater treatment / production
• Onshore pipelines
• Environmental/approvals
• Specialist consultancy
We deliver multi-discipline professional engineering, consulting and maintenance services to optimise the value and performance of our customers’ assets. Our Consult Deliver Maintain business model applies across our core markets of Hydrocarbons, Minerals and Metals and Infrastructure. The model allows us to address a diverse range of our customers' needs and continue to develop our own growth opportunities.
OUR BUSINESS
LogiCamms 2016 Annual Report2
For
per
sona
l use
onl
y

OUR STRATEGY FOR GROWTH
Each line of business in our Consult Deliver Maintain model complements the others, providing opportunities to offer a more comprehensive range of services for our customers. This differentiates LogiCamms from our competition and increases growth opportunities across our business.
• Customised professional and technical training solutions and competency assurance services
• Environmental consulting, approvals and assessment
• Strategic asset management
Asset Performance
• Maintenance and reliability engineering
• Maintenance system build and optimisation
• Shutdown management
Multidiscipline Engineering
• Engineering and project delivery with strategic focus on brownfield sustaining capital / optimisation projects
• Leading provider of EI&C systems
Project Delivery
• EPC, EPCM and D&C delivery models
Site Audits
• Specialist site audits, implementation, maintenance and completions
Site Implementation
• Maintenance planning and scheduling
Maintenance Planning
• Shutdown and turnaround execution
Site Support
• On-site support
Unique and differentiated capability with opportunities to grow.
Solid base with expansion potential.
Growing interest with solid growth opportunities.
CONSULT DELIVER MAINTAIN
3LogiCamms 2016 Annual Report
For
per
sona
l use
onl
y

LogiCamms has a diverse portfolio of projects that spans the breadth of our Consult Deliver Maintain services, and the domestic and international operations of our customers.
KEY CONTRACTS FY16
CUSTOMER CONTRACT SCOPE VALUE CREATION FOR CLIENT
Roy Hill Control systems integration, IT infrastructure, condition monitoring at the Roy Hill Mine Site, and subsequent Commissioning scope
• Project delivered safely. Automated code development tools enabled rapid, high quality implementation of the software.
SA Water Portfolio of projects associated with improving the reliability of water supply
• Projects delivered safely, on time and within budget working in a collaborative contracting arrangement
BP Refinery Kwinana (BPRK)
Sustaining capital micro delivery program • Program of works being delivered safely using site and home office resources via our fast track micro methodology
OUR WORKF
or p
erso
nal u
se o
nly

KEY CUSTOMERS
Portion of work from brownfield (operating) facilities and projects.
80%People trained during FY16 by LogiCamms’ registered training organisation, Competency Training.
5000+
5LogiCamms 2016 Annual Report
For
per
sona
l use
onl
y

LogiCamms has responded to sustained market pressures by restructuring the business and adapting our operating model to continue to provide competitive core engineering, maintenance and consulting services to our traditional hydrocarbons and minerals and metals markets, and position the business for growth in infrastructure markets.
LogiCamms reported a statutory loss after tax of $38.1 million for the 2016 financial year, compared with a net profit after tax of $8.3 million last financial year. The statutory loss includes an impairment to goodwill of $28.1 million, as well as onerous lease provisions and accelerated depreciation of leasehold assets. The costs of a restructure of the business and substantial redundancy costs were also accounted for in the 2016 financial year.
Based on financial performance over the period and to ensure the Company retains balance sheet flexibility, the Board has determined that no final dividend will be declared for the 2016 financial year.
LogiCamms reported a net cash position at the year-end of $6.6 million, with no outstanding borrowings. The Company also expanded its bank guarantee and bonding facilities from $7 million to $17 million during the year, in anticipation of a substantial pipeline of new project opportunities. LogiCamms maintains a robust cash collection cycle and a conservative position in relation to project provisions and contingencies, and has no material bad or doubtful debts.
The Company has responded to continuing market pressures by refining our operating model and reducing by 18% annual operational and overhead costs from the business. Restructuring the business has increased the Company’s capacity to deliver competitive services at cost effective rates for clients that are enduring margin pressures resulting from falls in key commodity prices.
The changes to our operating model have improved our competitive position and opened new opportunities in our key sectors of hydrocarbons, minerals and metals, and infrastructure. The infrastructure market has been particularly positive for LogiCamms and this is becoming an increasingly important element of the Company’s revenue mix after a number of new project wins particularly for government and private sector gas and water utilities across Australia and in New Zealand.
The market outlook remains challenging across our key sectors of hydrocarbons, minerals and metals, and infrastructure. Producers and service providers in hydrocarbons and minerals and metals continue to experience significant margin pressures on both greenfield and brownfield projects.
Safety performance is central to the way we operate our business and our clients expect the highest standards in this area. Our Zero Harm philosophy is part of the organisational culture and underpins our decision making and actions.
The Board has reduced in size to three non-executives and one executive during the period with the retirement of Giles Everist as a non-executive director in December 2015. Giles joined the Board of LogiCamms in 2011 and made a significant contribution to the Company including as Chairman of the Audit and Risk Committee. On behalf of the Board, I would like to thank Giles for his service and wish him well for his future endeavours.
During the 2016 financial year, LogiCamms again demonstrated its capacity to deliver high quality engineering solutions for clients and at the same time, entered into new infrastructure markets. This is a testament to our people and I thank them for their continuing efforts. I would also like to acknowledge our executive team and the directors for their hard work and guidance throughout the year. I am confident that over the course of the coming year and beyond, LogiCamms will continue to deliver on its commitments to clients and shareholders.
Peter Watson Non-executive Chairman
CHAIRMAN’S REPORT
LogiCamms 2016 Annual Report6
For
per
sona
l use
onl
y

The changes to our operating model have improved our competitive position and opened new opportunities in our key sectors of hydrocarbons, minerals and metals, and infrastructure.
For
per
sona
l use
onl
y

LogiCamms maintained solid gross margins and a cost-competitive client offering after refining its operating model to address continued challenges in market conditions
LogiCamms reported an earnings before interest, tax, depreciation, amortisation, goodwill impairment and losses on onerous leases (EBITDAI) loss of $4.2 million for financial year 2016. This compares with an EBITDA result of $8.3 million last financial year, and allows for a number of one-off restructuring and related charges during the financial year.
LogiCamms reported revenue of $108.2 million (FY2015: $133.8 million). The decrease resulted largely from increased delivery timeframes for committed projects and extended lead times for clients to confirm new project awards. These delays negatively impacted earning outcomes.
During the second half of the financial year, the Company implemented a program to reduce annual operational and overhead costs. This program was substantially completed in March 2016 and resulted in a reduction of 18% to the Company's cost base.
Gross margins remained solid at 32.3 per cent compared with 38.4 per cent in 2015, despite margin pressures across all of LogiCamms’ key sectors. With a more competitive pricing model, the business is also experiencing an upturn in new project opportunities across all three sectors.
Staff numbers within the business were reduced to approximately 450 people as we adjusted our resources to align with market conditions. In parallel with this reduction in our permanent workforce, we have refined our operating model to ensure we remain cost-efficient and flexible to respond to our clients’ needs. We retain a substantial base of engineering staff and expertise within the business, complemented with specialist contractors as required on a project basis. We have developed methodologies to more effectively and seamlessly share client work across our offices to optimise our productive capacity and continue to deliver high quality engineering solutions.
LogiCamms is widely recognised by clients for our track record in brownfield asset performance and optimisation services, and during the financial year our site implementation, commissioning and maintenance business has generated new growth opportunities. The combination of Petromod, which was acquired on 1 July 2015, and the Company’s existing maintenance team in the Pilbara has expanded to address both hydrocarbons and minerals and metals projects, and represents approximately 16 per cent of total revenue. Through our existing relationship with Samsung C&T, new teams have been deployed to the Roy Hill mine site to provide on-site maintenance services. We also established a presence for our maintenance business in the Hunter Valley in January 2016, which services the local coal industry.
The Competency Training business is recognised as a market leader in specialised training services to support our clients to meet their regulatory and statutory obligations. The business continues to perform well and has expanded into Asia through strategic partnerships in Korea and Singapore.
The Company’s position in the infrastructure sector strengthened during the year with a number of new project opportunities and contracts, particularly with water and power utilities including SEQ Water, Queensland Urban Utilities, SA Water and Sydney Water. We have also made measured investments in technical and business development resources in the sector to support this strategy. This market has an orientation towards pre-qualified panel arrangements that support longer term client relationships, and we expect that infrastructure will represent a growing proportion of LogiCamms’ revenue and earnings.
Excellence in safety performance is fundamental to our business and LogiCamms reported a Total Recordable Injury Frequency Rate of 2.28 per million hours worked during the year. Our continued strong performance in this area is supported by an accredited health and safety management system and an ongoing focus on embedding safety principles into the culture throughout the organisation.
MANAGING DIRECTOR’S REPORT
Our operating model gives us a distinct competitive advantage through the flexibility to offer high quality, cost-efficient services, as clients manage their own market challenges.
LogiCamms 2016 Annual Report8
For
per
sona
l use
onl
y

LogiCamms expects market conditions in its key sectors to remain difficult throughout 2016-17 with clients continuing to focus on operational efficiencies. However, LogiCamms remains positioned to effectively service client requirements and capture new opportunities as a result of the strategic decision to maintain the Company’s core capabilities and refine the operating model.
Throughout another year of challenging market conditions, the people of LogiCamms have remained focused on delivering high quality engineering solutions for our clients. This has provided a foundation for the business to adapt and position itself for continued success, and I thank our people for their dedication and hard work. I would also like to acknowledge the Board and leadership team for their ongoing guidance and support throughout the year
Steve Banning Managing Director
For
per
sona
l use
onl
y

PAUL BOWKERDirector Corporate Development & Company Secretary
Paul has an extensive background in corporate development, acquisitions and regulatory roles, with a focus on the energy sector.
• Director of Corporate Development and Company Secretary of LogiCamms, joining in 2011
• Former corporate lawyer at AGL Energy, Linklaters in London, and the Australian Securities and Investments Commission
PETER WALLNon-Executive Director
Peter is a founding Board member and brings decades of experience in management and directorship positions, with a focus on human resources and corporate governance.
• Joined LogiCamms in 2007• Long standing tenure at S. Smith & Sons
(The Yalumba Wine Company) and role in international trade facilitation for the wine industry
RICHARD ROBINSON Non-Executive Director
Richard has extensive experience in the Oil & Gas industry in Australia and Papua New Guinea within project management, operations and commercial in both the upstream and downstream sectors, providing consulting services to the Oil & Gas, engineering and construction sectors.
• Joined LogiCamms in 2015• Former Executive General Manager
at Oil Search• Chairman of Kina Petroleum Limited
(ASX:KPL)
PETER WATSONNon-Executive Chairman
Peter is a business leader with over 30 years of experience in engineering, construction and services. He brings a strong background in achieving growth for businesses on a local and global scale.
• Joined LogiCamms 2011
• Former CEO at Transfield Services (ASX:TSE)
• Chairman, Regional Rail Link Victoria and AssetCo
Our Board and Management group are a results-driven team with a drive to build a sustainable, successful and inspiring organisation. The group offers decades of experience in resources and energy sectors on both client-side and consultant-side.
STEVE BANNINGManaging Director
Steve is a seasoned management professional with over 20 years of experience in resources and energy businesses. He brings a strong understanding of strategy as well as Australia’s gas markets to his executive position at LogiCamms.
• Managing Director of LogiCamms, joining in 2011
• Former CEO at Epic Energy, owned by Hastings Diversified Utilities Fund (ASX:HDF)
• Former Group Manager for Duke Energy
BOARD AND MANAGEMENT
LogiCamms 2016 Annual Report10
For
per
sona
l use
onl
y

The LogiCamms leadership team brings together extensive market knowledge, diverse skill sets and experience, and a commitment to the ongoing development of capability, services, and opportunities for our clients and our people.
LogiCamms’ leadership team is collectively accountable for overall business performance, the effective implementation of key strategic and operational initiatives, developing people and services, enabling enhanced knowledge share between our people, customers, and industry, and demonstrating LogiCamms’ core values in action.
Together the leadership team brings a diverse skill set to clients and the business comprising:
• Market knowledge, with experience on both contractor-side and operator-side;
• Commercial acumen, including experience managing and building businesses of varying sizes; and
• People and team development, with a background in building high performing teams.
STEVE BANNINGManaging Director
IULIUS MINCUDirector Hydrocarbons
PAUL BOWKERDirector Corporate Development
CLAUDE D'CRUZDirector Minerals and Metals
FLORA FURNESSDirector Deliver
STEVE LONTONDirector Competency Training and Maintain
11LogiCamms 2016 Annual Report
For
per
sona
l use
onl
y

LOGICAMMS LIMITED FINANCIAL STATEMENTSFor the year ended 30 June 2016
FINANCIAL STATEMENTS
DIRECTORS' REPORT
SIGNED REPORTS
Directors declaration
62Independent auditor’s report
63Lead Auditor’s Independence Declaration
65
Consolidated statement of profit or loss and other comprehensive income
30Consolidated statement of financial position
31Consolidated statement of changes in equity
32Consolidated statement of cash flows
33Notes to the financial statements
34
Director's Report
13
Operations
Investment in long term assets Capital Risk
Corporate and group
Unrecognised items
Results for the year
Operating assets and liabilities
i. Revenue i. Cash and cash equivalents
i. Property, plant and equipment
i. Share capital and reserves
i. Financial instruments
i. Group entities i. Subsequent events
ii. Other income ii. Trade and other receivables
ii. Intangible assets
ii. Financial risk management
ii. Equity accounted investees
ii. Operating Leases
iii. Finance income iii. Trade and other payables
iii. Impairment iii. Acquisitions
iv. Expenses iv. Deferred income
iv. Related parties
v. Taxation v. Employee benefits
v. Share based payments
vi. Earnings per share
vi. Provisions
vii. Segment Reporting
viii. Auditor’s remuneration
For
per
sona
l use
onl
y

Your directors present their report on LogiCamms Limited (“the Company”) and its controlled entities (“the Group”) for the financial year ended 30 June 2016.
Principal Activities LogiCamms is a provider of professional engineering and consulting services. It works with leading owners and operators of hydrocarbons, minerals and metals and infrastructure assets to enhance productivity and efficiency through improved performance, increasing the value of customers’ operations. LogiCamms’ core business units include engineering consulting, project delivery, maintenance and commissioning and asset performance services.
These services are provided across Australia, New Zealand and Papua New Guinea through office locations in Brisbane, Perth, Adelaide, Melbourne and New Plymouth in New Zealand, as well as through regional offices in Gladstone, Mackay and Whyalla.
Operating and Financial Reviewa. Financial Performance Overview
A summary of the Group’s operating results for the year ended 30 June 2016 is below:
2016 $’000
2015 $’000
Revenue 108,187 133,838
(Loss) / Profit before tax (40,581) 10,227
Income tax benefit / (expense) 2,442 (1,899)
(Loss )/ Profit for the year attributable to equity holders in the Company (38,139) 8,328
Basic earnings per share (cents per share) (55.5) 12.0
Diluted earnings per share (cents per share) (55.5) 12.0
The Group’s financial results in 2016 decreased across the following key metrics:
• Revenue decreased to $108.2 million (down from $133.8 million in 2015, a decrease of 19%)
• (Loss)/Profit before tax decreased to ($40.6) million (down from $10.2 million in 2015, a decrease of 497%)
• (Loss)/Profit after tax decreased to ($38.1) million (down from $8.3 million in 2015, a decrease of 558%)
• Earnings before interest, tax, depreciation, amortisation and impairment (EBITDAI)1 was ($8.4) million (down from $12.1 million in 2015, a decrease of 169%)
• Underlying EBITDAI2 was ($4.2) million
• EBITDA as a percentage of revenue was (3.9%) (down from 9.0% in 2015).
The key impacts on revenue and earnings over the prior corresponding period were:
• Sustained market pressure on margins, partly offset by a restructure to reduce the cost structure of the business which was completed during the reporting period and has reduced annual overheads by 18%.
• Impairment of goodwill of $28.1 million
• Onerous lease charges of $4.2 million
Throughout 2016, competitive pressures continued across the Company’s range of services and industries in which it operates, particularly in the hydrocarbons and minerals and metals sectors. The market for infrastructure continues to grow and although competitive, the Company has made significant further inroads into that sector, particularly in water infrastructures.
DIRECTORS’ REPORTFor the year ended 30 June 2016
1 The reference to EBITDAI is unaudited and is unreviewed and is intended to provide a measure of financial performance before the impact of non-cash items such as depreciation and amortisation, as well as interest income and expenses. EBITDA references in this Directors Report include profit from equity accounted investments.
2 Underlying EBITDAI excludes charges resulting from increases in the onerous lease provision and impairment
13LogiCamms 2016 Annual Report
For
per
sona
l use
onl
y

DIRECTORS’ REPORTFor the year ended 30 June 2016
During FY16, the Company delivered reduced revenue of $108m, compared to $134m in FY15. As a result, a restructure of the operations was undertaken that resulted in reduced staff numbers as the business continued to adjust its workforce profile in line with market conditions. The Company’s workforce currently stands at approximately 450 people, down from 550 at the end of the 2015 financial year.
The key drivers for supporting future revenue and earnings growth will continue to be the following key strategic initiatives;
• A strong focus on optimisation of brownfield assets – working closely with customers to enhance the performance of their operations;
• adapting to opportunities in the market, including the continued expansion into the infrastructure sector and investment in additional capabilities and services, including the Company’s increased presence in infield maintenance capability;
• Continued growth of capabilities within key sectors, such as the midstream hydrocarbons sector (pipelines) and water and power infrastructure; and
• continued investment into technology and enhancing the Company’s IP, including existing projects in Geographical Information Systems (GIS), drones and operational technology lead through the Company’s market leading position in control systems integration.
b. Performance Across Markets
The Company operates across three key markets, being hydrocarbons, minerals and metals and infrastructure. During the reporting period approximately 80% of the Company’s revenue was derived from brownfield (sustaining) works as part of our ongoing strategy to focus in this area. Hydrocarbons again formed the majority of work at 48% of revenue (down from 65% the previous year) which reflected continued work in the gas pipeline sector, through clients including EPIC Energy, APA group and Jemena, and upstream gas producers such as Santos and Origin Energy.
The strongest growth as a proportion of revenue was achieved through the Company’s continued expansion of its services into the infrastructure sector. Notably, a significant volume of work was carried out for water utilities, including SA Water and Watercorp. Infrastructure now accounts for 13% of revenue, up from 6% in FY15 and continues to grow.
The Company’s work in international markets was focused primarily around existing operations in New Zealand through ITL, as well as an increasing workflow out of PNG. Ad hoc projects were conducted in Asia, predominately through Competency Training, our wholly owned Registered Training Organisation.
c. Market Review and Outlook
The market for services to the hydrocarbons and minerals and metals markets continues to be highly competitive, particularly given the decline in underlying commodity values over FY16. However, within those markets, there remain significant opportunities for LogiCamms to apply its asset performance services to allow its customers to extract more value from existing assets. This has been evident particularly in the upstream and midstream services in the hydrocarbons sector.
As a result of the restructure process undertaken in FY16, the Company is well positioned to deliver cost effective solutions to its customers in line with expectations in the current challenged market environment.
LogiCamms’ continued focus on optimising brownfield operations, presents ongoing opportunities for both our customers and LogiCamms to outperform in a challenged environment.
The outlook in the hydrocarbons and minerals and metals sectors in Australia and New Zealand remains positive in relation to ongoing maintenance and optimisation of existing assets, although under continued margin pressure. Greenfield and brownfield opportunities in infrastructure are a core focus of the Company in FY17.
d. Working Capital Management
The Company has had a strong focus on working capital management during the year. There has been negative operating cash flow of ($15.2) million (2015: $18.6 million) primarily as a result of less favourable trading results, but also partly impacted by the payment of dividend and the acquisition of Petromod.
The Company continues to operate its business out of positive cash reserves, with $6.6m in net cash at 30 June 2016.
Operating and Financial Review (continued)a. Financial Performance Overview (continued)
LogiCamms 2016 Annual Report14
For
per
sona
l use
onl
y

DIRECTORS’ REPORTFor the year ended 30 June 2016
Operating and Financial Review (continued)e. Statement of Financial Position
The Company’s total assets decreased to $68.5 million in 2016 (2015: $108.4 million) primarily from the impairment of goodwill. The end of year cash balance of $6.6 million was reduced from $21.9 million in 2015.
The net assets of the Group have reduced to $43.6 million at 30 June 2016 from $82.9 million at 30 June 2015. This decrease is primarily the net result of the impairment to goodwill combined with the onerous lease provision increase to $4.2 million and dividends declared and paid during the year of $2.4 million.
The Company’s total liabilities decreased to $24.9 million (2015: $25.5 million).
The Company continues to operate debt-free, and has utilised $7.4 million of its current $17.0 million bank guarantee and bonding facilities (2015: utilised $4.9 million of $22.0 million).
Dividends paid or declared by the Company to members since the end of the previous financial year were:
Cents per share
Total amount $’000
Franked/unfranked
Date of payment
Declared and paid during the year 2016
Final ordinary for the year ended 30 June 2015 3.5 2,410 Franked 50% 25 Sept 15
Franked dividends declared and paid during the year were franked at the rate of 30 per cent.
Declared after end of year
No dividends were declared after the balance sheet date. There are no events in the Directors’ opinion subsequent to the balance sheet date that require disclosure.
f. Key Strategic Goals
The Company operates various business lines, including Deliver (core engineering services), Maintain (onsite maintenance, installation and commissioning services) and specialist businesses, including Asset Performance, Competency Training and Monarc Environmental.
The bulk of the Company’s work is carried out in the Deliver business line, which includes engineering, project delivery, and EPC and EPCM capabilities across Australia and New Zealand. The Company has also reinforced its presence in Papua New Guinea to provide Deliver services particularly to the growing oil and gas industry, as well as Consult services in training and asset performance.
The Maintain line of business comprises all of the Company’s site implementation, commissioning and maintenance activities. This capability has been expanded with the acquisition of specialist oil and gas electrical and installation business, Petromod, effective 1 July 2015 and other opportunities are being pursued.
The Company is well positioned to leverage its experience as the onshore LNG sector moves into the commissioning stage, based on its established hydrocarbons track record and focus on brownfield asset performance and optimisation. The Company is also continuing to build on its strong capabilities and existing contracts to deliver effectively to the midstream sector, including gas pipelines and storage. The company’s acknowledged market leadership in control systems integration and automation presents opportunities in the minerals and metals sector, in the context of the industry’s heightened drive for brownfield efficiencies and plant optimisation.
g. Significant Risks
The Company is subject to a number of external, business, financial and operational risks. As LogiCamms is a service provider to the hydrocarbons, minerals and metals and infrastructure industries, any exposure that those industries have to risk factors will have some impact on LogiCamms’ business. Although LogiCamms has in place strategies to mitigate the impact of this, such as industry and service diversification, the volatility and uncertainty from such events may impact the nature and timing of work under contract.
LogiCamms is also subject to other external risks such as currency exchange movements, changes in demand for key commodities (including iron ore, oil and gas) and political risk. The majority of LogiCamms’ revenues are based in Australia and New Zealand and denominated in Australian and New Zealand dollars, and as such, foreign currency risks are somewhat reduced.
As a professional services business, the attraction, retention and investment in our people is critical to the success of the business. LogiCamms manages the risks associated with a people-based business through significant investment in training, attraction and retention strategies.
15LogiCamms 2016 Annual Report
For
per
sona
l use
onl
y

The Company also faces risks in its relationship with customers. In order to optimise the delivery of services to customers, the Company has in place a robust risk management and governance framework that applies to the assessment, tender and delivery of customer projects.
LogiCamms is exposed to financial risks, which are partly inter-dependant on the external and business risks mentioned above. Significant investment has occurred in the development of risk and financial management systems and processes available to the business. Further, LogiCamms manages working capital closely to ensure minimal volatility in results and the appropriate delivery of services within commercial agreed terms. Although LogiCamms does not currently have any borrowings, its ability to fund future expansion and acquisitions may be dependent on the availability of debt facilities on suitable terms.
In relation to the operational risks to the business, LogiCamms has a strong focus on ensuring that work is carried out on terms that satisfy the Company’s internal policies relevant to appropriate return and risk. LogiCamms has a focus on long term sustainable projects and relationships and applies margins to work accordingly.
The Company also has detailed procedures in place to ensure that the Company is staffed efficiently and that its people are working at a level of business that balances the goal of strong margins with that of ensuring the Company’s people are working in an environment that encourages sustainable personal development and growth opportunities.
The Company maintains a register of key risks and has in place crisis management and disaster recovery plans.
Information on Directors
The directors in office at any time during or since the end of the year were:
Mr Peter Watson Independent Non-Executive Director and Chairman
Appointed 2 June 2011. Year last re-elected: 2013.
Experience Peter Watson has 30 years of international experience in the engineering, construction and services industries. As former Chief Executive Officer of Global Services Group, Transfield Services (ASX:TSE) from 1999 to 2009, Peter stewarded the company through its listing in 2001 and led its transformation from a local operator to a global business. Prior to his tenure as Chief Executive, Peter undertook a variety of project and management roles with Transfield Services and Transfield Construction.
Peter is a member of the Nomination and Remuneration Committee, a member of the Audit and Risk Committee and a member of the Projects Committee
Current directorships held in other listed entities
None
Mr Giles Everist Independent Non-Executive Director,
Appointed 5 April 2011 and resigned on 4 December 2015.
Experience Giles Everist is a Chartered Accountant and a member of the Institute of Chartered Accountants (England and Wales). Giles joined the Group in 2011 bringing over 20 years’ experience. He has held senior executive roles with Coopers and Lybrand, Rio Tinto, Fluor Australia, and more recently Monadelphous Group where he was Chief Financial Officer from 2003 to 2009, during which the company experienced significant growth and development. Since that tenure Giles has joined a number of Boards in the public, private and not for profit sectors including as Non-Executive Director of Decmil Group Limited, Non-Executive Director of McMahon Holdings Limited, Non-Executive Director of Austal Limited, Chairman of Surton Technologies and Chairman of Perth Home Care Services.
Giles is a member of the Nomination & Remuneration Committee and Chair of the Audit and Risk Committee.
Current directorships held in other listed entities
Non-Executive Director of Decmil Group since December 2009, Non-Executive Director of McMahon Holdings Limited since June 2013 and Non-Executive Director of Austal Limited since November 2013.
DIRECTORS’ REPORTFor the year ended 30 June 2016
Operating and Financial Review (continued)g. Significant Risks (continued)
LogiCamms 2016 Annual Report16
For
per
sona
l use
onl
y

Mr Peter Wall Independent Non-Executive Director
Appointed 8 October 2007. Year last re-elected: 2015.
Experience Peter has extensive management expertise, including a focus on human resources and corporate governance. Peter had a long tenure at S. Smith & Son (The Yalumba Wine Company); is a former board member of SA WorkCover Corporation and Chairman of the South Australian Vocational Employment Education & Training Board. Peter is Chair of the Nomination & Remuneration Committee and a member of the Audit and Risk Committee.
Current directorships held in other listed entities
None
Mr Steve Banning Managing Director
Reappointed 2 March 2015. Year last re-elected: not applicable.
Experience Steve Banning has extensive experience across the resources and energy industry. Prior to his role as Managing Director at LogiCamms, he was Managing Director of Epic Energy from 2007 until 2011. In his role as MD of Epic Energy, Steve led the business through a period of significant growth. Steve’s other roles have included General Manager Commercial of Epic Energy, Group Manager of Duke Energy and various roles within ExxonMobil.
Steve has a Bachelor of Science (Honours).
Steve Banning was re-appointed as Managing Director on 2 March 2015.
Current directorships held in other listed entities
None
Mr Richard Robinson Independent Non-Executive Director
Appointed 26 May 2015. Year last re-elected: 2015.
Experience Richard Robinson has more than 35 years’ experience in the Oil & Gas industry in Australia and Papua New Guinea. Richard’s experience covers project management, operations and commercial in both the upstream and downstream sectors. Richard held senior roles for more than 10 years at Oil Search Limited, retiring from his role as Executive General Manager in 2013. He has held a number of roles providing consulting services to the Oil & Gas, engineering and construction sectors.
Current directorships held in other listed entities
Chairman of Kina Petroleum Limited having been appointed as a Non-Executive director in 2013.
DIRECTORS’ REPORTFor the year ended 30 June 2016
Operating and Financial Review (continued)Information on Directors (continued)
17LogiCamms 2016 Annual Report
For
per
sona
l use
onl
y

Information on Company Secretary
Paul Bowker was appointed to the position of Company Secretary on 18 July 2011 and also holds the position of Director – Corporate Development. Paul holds a Bachelor of Laws, Master of Laws, Master of Applied Finance and Investment and a Graduate Diploma of Applied Corporate Governance. Paul has a legal, compliance and corporate finance background gained from working in the government and corporate sectors in Australia and the United Kingdom, including with AGL Energy, Linklaters Lawyers and the Australian Securities & Investments Commission.
The number of directors’ meetings (including meetings of committees of directors) and number of meetings attended by each of the directors of the Company during the financial year are:
Director Board MeetingsAudit & Risk
Committee Meetings
Nomination and Remuneration
Committee MeetingsProject Committee
Meetings
A B A B A B A B
Peter Watson 16 16 4 4 3 3 0 0
Richard Robinson 16 16 3 4 2 3 0 0
Giles Everist 9 9 2 2 1 1 0 0
Peter Wall 16 16 4 4 3 3 0 0
Steve Banning 16 16 4 0 3 0 0 0
A – Number of meetings attended
B – Number of meetings held during the time the director was a member of the Board or Committee
Corporate governance statement
LogiCamms Limited and the board are committed to achieving and demonstrating the highest standards of corporate governance. LogiCamms Limited has reviewed its corporate governance practices against the Corporate Governance Principles and Recommendations (3rd edition) published by the ASX Corporate Governance Council. The 2016 corporate governance statement is dated as at 30 June 2016 and reflects the corporate governance practices in place throughout the 2016 financial year. The 2016 corporate governance statement was approved by the board on 24 August 2015. A description of the group’s current corporate governance practices is set out in the group’s corporate governance statement which can be viewed at www.logicamms.com.au/investor-relations/corporategovernance.
DIRECTORS’ REPORTFor the year ended 30 June 2016
Operating and Financial Review (continued)
LogiCamms 2016 Annual Report18
For
per
sona
l use
onl
y

DIRECTORS’ REPORTRemuneration report – audited
This Remuneration Report outlines the Key Management Personnel (KMP) remuneration arrangements of the Group in accordance with the requirements of the Corporations Act 2001 and its Regulations. For the purpose of this report KMP of the Group are defined as those persons having authority and responsibility for planning, directing and controlling the major activities of the Group, directly or indirectly, including any directors (whether executive or otherwise).
Contents
The report includes:
• an overview of the Company’s approach to executive reward;
• the governance of remuneration arrangements;
• the components of executive remuneration;
• the remuneration outcomes for the 2016 financial year and the links between remuneration and company performance;
• an overview of executive service agreements;
• remuneration for the 2016 financial year; and
• Non-Executive Director remuneration.
Overview of the Company’s approach to executive reward
The Board has adopted a remuneration policy that takes into account the current size and nature of the Company’s operations.
Remuneration of KMPs is set at levels to reflect market conditions and encourage the continued services of KMP’s including by benchmarking KMP remuneration to determine where roles are currently positioned, reviewing base salary, short-term incentives and long-term incentives.
The Group’s remuneration strategy recognises and rewards performance in a way that is consistent with general practices in the markets in which the Group operates. The Group’s remuneration philosophy is focused on the following key principles:
• Alignment to sustainable long-term value creation
• Assist the attraction and retention of highly skilled employees
• Be competitive within the global markets in which the Group operates
• Alignment is best achieved through high levels of equity ownership
• Provide high rewards for true outperformance
• Simple and transparent remuneration framework
• Consistent remuneration framework across the organisation
• Strategically align talent and succession planning for future growth
Governance of remuneration arrangements
To determine the remuneration of its KMP the Company has a Nomination and Remuneration Committee. The Committee makes recommendations to the Board in relation to the remuneration of KMP, including the fixed and at risk components of remuneration. Based on the information and recommendations provided by the Committee, the Board applies its discretion to determine remuneration, including any changes to fixed components of KMP remuneration as well as any awards under the STI and LTI Plans. The Committee assists the Board in establishing human resources and compensation policies and practices including the specific remuneration (including base pay, incentive payments, bonuses, equity awards, superannuation, retirement rights, termination payments and services contracts) of the Managing Director and other KMP. The proceedings of each Committee meeting are reported directly to the Board. The Chairman of the Committee shall be a Non-Executive Director, with all other members being members of the Board. The Managing Director is invited to attend Committee meetings.
2016 Executive Remuneration Framework
The primary objective of LogiCamms’ executive remuneration strategy is creating a framework that supports sustainable growth over the long term, recognising that this is in the interest of all stakeholders. This framework seeks to reward, retain, and motivate senior executives in a manner aligned with shareholders.
LogiCamms 2016 financial year saw earnings decrease compared to the 2015 financial year. For the 2016 financial year, Profit after tax decreased to ($38.1) million loss (down from $8.3 million profit in 2015) and Earnings before interest, tax, depreciation, amortisation and impairment (EBITDAI)1 was ($8.4) million loss (down from $12.1 million profit in 2015). Underlying EBITDAI2 was ($4.2) million loss. Under the Key Executive Remuneration Framework the STI and LTI outcomes for 2016 were as follows:
Incentive Remuneration Outcomes
Short Term Incentive Outcomes
No STI payments were awarded for performance in 2016. Refer to the table on page 22 for the proportion of fixed and at risk remuneration for those KMP’s who were participants in the STI in 2016.
Long Term Incentive Outcomes
LTI payments were awarded for performance in 2016. Refer to the table on page 22 for the proportion of fixed and at risk remuneration for those KMP’s who were participants in the LTI in 2016.
1 The reference to EBITDAI is unaudited and is unreviewed and is intended to provide a measure of financial performance before the impact of non-cash items such as depreciation, amortisation and impairment, as well as interest income and expenses. EBITDAI references in this Directors Report include profit from equity accounted investments.
2 Underlying EBITDAI is defined as EBITDA excluding onerous lease and impairment charges in year.
19LogiCamms 2016 Annual Report
For
per
sona
l use
onl
y

This report specifically sets out remuneration information for the key people who can directly influence the long term strategic direction of the Company and had the authority for planning, directing and controlling the affairs of the Group during the financial year ended 30 June 2016. They include the Managing Director and other key executives and Non-Executive Directors, of the Company as set out below:
Name Title
Non-Executive Directors
Peter Watson Chairman
Giles EveristA Director
Peter Wall Director
Richard Robinson Director
Executive KMP
Steve Banning Managing Director
Paul Bowker Director – Corporate Development
David HarrisB Director – Finance
Flora FurnessC Director – Deliver
Iulius MincuD Director – Hydrocarbons
A Giles Everist resigned as Non-Executive Director on 4 December 2015.
B David Harris resigned on 2 April 2016.
C Flora Furness was appointed on 1 July 2015.
D Iulius Mincu ceased to be KMP from 1 July 2016.
Except as noted, the named persons held their current position for the whole of the financial year and since the end of the financial year.
Components of Executive Remuneration
Remuneration and other terms of employment for the Managing Director and other executive KMP are formalised in Executive Service Agreements and incentive plans. The total remuneration packages for these KMP contain:
• A fixed component – Base salary including superannuation. This is expressed as a specific amount that the executive may take in a form agreed with the Company and is determined based on market reference, the scope and nature of the individual’s role, their performance and experience.
• At risk components – The Board considers that the financial and operational performance and prospects of the Company are strongly linked to creating shareholder wealth. Accordingly, the Board has put in place at-risk components to remuneration based on success in delivering on pre-defined targets. For 2016, at-risk components were in the form of:
• Short Term Incentive (STI) – payable in cash and ordinary shares. Outcomes based on LogiCamms financial and operational performance over the 2016 financial period, in addition to individual performance measures; and
• Long Term Incentives (LTI) – payable through the issue ofPerformance Rights. These LTI instruments are issued for the purposes of aligning KMP interests with those of shareholders by rewarding long term sustainable shareholder value creation. LTI outcomes for 2016 were based on strategic performance measures.
Fixed Remuneration
The fixed remuneration component of salaries includes a base salary and superannuation. Fixed remuneration may be allocated at the executive’s discretion to cash, superannuation (subject to legislative minimum), motor vehicles and certain other benefits. The fixed remuneration component is determined based on the scope and nature of the individual’s role, their performance and experience.
Short Term Incentive (STI)
Under the terms of the STI for 2016, each participant had an annual target STI award based on a percentage of base salary for the year. Payment of the individual’s target STI was dependent on performance against the key metrics set out in the table below.
For financial year 2016, KMP had a maximum STI opportunity ranging from 20% to 50% of their fixed remuneration where targets are met. However, if the threshold performance for a measure is not met, the payment may be reduced.
The STI payment is subject to the participant being employed with the Company at the time the STI is due to be paid.
STI awards are determined after a review of performance against the key performance drivers by the Board at the end of the financial year.
DIRECTORS’ REPORTRemuneration report – audited
LogiCamms 2016 Annual Report20
For
per
sona
l use
onl
y

Award Criteria for STI and Performance
The award criteria for the STI are based on achievement against the Performance Objectives for the Company for the 2016 financial year. The table below sets out the criteria and performance against those criteria:
FY16 Scorecard Weight Metric and Weighting Performance Achieved
Financial 50% EBITDA 40% 0%
Cash Management 10% 8%
Operational 30% People 10% 8%
Sales Inputs 20% 5%
Individual Performance 20% Discretionary 20% Individual basis
The Nomination and Remuneration Committee have reviewed the performance of the KMP against the above criteria. The EBITDA target for FY16 was not met and the Board exercised its discretion to reduce the STI awarded to zero.
The award criteria for the 2017 STI are based on achievement against the Performance Objectives for the Company for the 2017 financial year. Awards under the 2017 STI are to be paid in the form of cash and ordinary shares in a combination to be determined by the Board. The table below sets out the award criteria:
FY17 Scorecard Weight Metric
Financial 50% Revenue, EBITDA, Capital and Cash Management
Operational 50% Reimbursability (proportion of billable hours), Staff Turnover, Training and Diversity
The Board has discretion to make a determination on individual performance of a KMP and apply such determination as a modifier to increase or decrease the STI payable.
Long Term Incentive (LTI)
For the 2016 financial year, each of the executive KMP listed above were participants in the LTI Plan, awards for which are made in the form of Performance Rights.
Award Criteria for LTI and Performance
The award criteria for the 2016 LTI are based on achievement against the Strategic Objectives for the Company for the 2016 financial year. The table below sets out the criteria and performance against those criteria:
FY16 Strategic Objectives Maximum Performance percentage Performance Achieved
Geographic extension of hydrocarbons presence 20% 15%Expansion of Core Engineering Competencies 20% 5%Extension of EPC offering 20% 5%Extension of technical consulting services 20% 15%Expansion Asset Performance Service capability and geography 10% 8%Monetisation of existing and future partnerships and alliances 10% 0%
FY16 was a very challenging year for the Group and the markets within which we operate. Notwithstanding, the Company was able to both implement our planned strategy and react quickly to market changes in a way that allowed us to enter FY17 with a revised corporate and overhead structure and a cost base structured to return the business to a sustainable profit position. Based on the achievement of this outcome, the Board has decided to award 100% of the FY16 LTI to the KMP.
Awards for the FY17 LTI will include options exercisable into ordinary shares over a pre-defined vesting period. Options will be subject to achievement of pre-determined strategic and financial performance targets.
DIRECTORS’ REPORTRemuneration report – audited
21LogiCamms 2016 Annual Report
For
per
sona
l use
onl
y

The Nomination and Remuneration Committee have reviewed the performance of the KMP against the above criteria and following that review have made recommendations on the awards to be made under the LTI Plan, which were awarded on 28 September 2016.
Name Key Management Personnel Title
LTI Award (Performance Rights
Vesting 30 June 2017)
LTI Award (Performance Rights
Vesting 30 June 2018
Percentage of Target Award Achieved (%)
Steve Banning1 Managing Director $135,000 $135,000 100%
Paul Bowker Director – Corporate Development $54,000 $54,000 100%
Flora Furness Director – Deliver $54,000 $54,000 100%
Iulius Mincu Director – Hydrocarbons $52,500 $52,000 100%
1 The Performance Rights to be issued to Steve Banning as part of the 2016 LTI Award will be issued subject to a resolution to be put the shareholders at the Company’s 2016 Annual General Meeting.
The vesting criteria with respect to the 2016 LTI are included in the table below.
Vesting Criteria Detail
Performance Period The performance period with respect to the 2016 LTI awards is the year from 1 July 2015 to 30 June 2016.
Vesting The Performance Rights vest into shares for no further consideration on a 1 for 1 basis as 50% of the number issued on 30 June 2017 and the remaining 50% on 30 June 2018, subject to tenure at the time of vesting.
Other terms
The LTI dollar value determined for each executive is calculated based on a percentage of the executive’s annual fixed remuneration and ranges from 20% to 50%. This level of LTI is in line with current market practice. The number of Performance Rights awarded to each executive is calculated by reference to the 5 day VWAP to 30 June 2016.
Performance Rights granted under the LTI Plan carry no voting or dividend entitlements. Currently, based on the number of Performance Rights issued and held pursuant to the LTI Plan, should all of these securities convert to shares they would represent 2.3% of the Company’s issued share capital.
Proportions of fixed and at risk remuneration
The table below sets out LogiCamms’ target mix of fixed and at risk (STI & LTI) components for each of the executive KMP for FY16 as a percentage of total remuneration:
Name Title Fixed Remuneration STI LTI
Steve Banning Managing Director 50% 25% 25%
Paul Bowker Director – Corporate Development 62.5% 18.75% 18.75%
Flora Furness Director – Deliver 62.5% 18.75% 18.75%
Iulius Mincu Director – Hydrocarbons 62.5% 18.75% 18.75%
DIRECTORS’ REPORTRemuneration report – audited
LogiCamms 2016 Annual Report22
For
per
sona
l use
onl
y

Consequences of performance on shareholder wealth
In considering the Group’s performance and benefits for shareholder wealth, the Nomination and Remuneration Committee has had regard to a number of factors including profit (as determined under Australian Accounting Standards), dividends, earnings per share (EPS), return on equity and the performance of the share price.
The Nomination and Remuneration Committee has regard to the following indices in respect of the 2016 financial year and the previous four financial years.
2016 2015 2014 2013 2012
Profit attributable to owners of the Company (‘000’s) (38,139) $8,336 $5,006 $11,096 $10,689
Dividends paid (‘000’s) $2,410 $4,884 $4,545 $6,307 $3,208
Change in share price -$0.31 -$0.13 -$0.48 $0.21 $0.08
Return on equity -87.4% 10.2% 6.2% 14.2% 15.6%
EPS (cps) -55.5 12.1 7.2 16.6 15.8
Profit is considered as one of the financial performance targets in setting the STI. Profit amounts for 2012 to 2016 have been calculated in accordance with Australian Accounting Standards (AASBs).
The overall level of executive KMP compensation takes into account these and other factors in assessing the performance of the Group and executive KMP over a number of years. When comparing financial year 2016 to financial year 2015, which are the most relevant years to the current set of executive KMP, the Group’s profit from ordinary activities after tax decreased by 549%, primarily due to impairment and onerous leases.
On Market Purchases
All shares underpinning equity awards may be purchased on market, or be newly issued shares or a combination of both. As at 1 July 2015, the LogiCamms Employee Share Trust held 693,435 ordinary LogiCamms shares which had been purchased on market in prior periods. During the 2016 financial year, the LogiCamms Employee Share Trust acquired 598,262 shares on market and allocated 1,021,103 shares.
Overview of the Group’s Current Service Contracts with Key Management Personnel
It is the Group’s policy that service contracts for executive KMP (excluding the Managing Director), are unlimited in term but capable of termination on 6 months’ notice. The Group retains the right to terminate a KMP contract immediately by making payment of between 6 and 9 months’ pay in lieu of notice. The KMP are also entitled to receive on termination of employment their statutory entitlements of accrued annual and long service leave, together with any superannuation benefits.
The KMP have no entitlement to termination payment in the event of removal for misconduct.
Name & KMP TitleTerm of Agreement and Notice Period
Base Salary Including Superannuation ($) Termination Payments
Steve Banning, Managing Director No fixed term 9 Months $540,000 –
Paul Bowker, Director Corporate Development No fixed term 6 Months $360,000 –
Flora Furness, Director Deliver No fixed term 6 months $360,000 –
DIRECTORS’ REPORTRemuneration report – audited
LogiCamms 2016 Annual Report 23
For
per
sona
l use
onl
y

Overview of the Company’s service contract with Steve Banning, Managing Director
Mr Banning was appointed to the Managing Director position on 2 March 2015, for a term with no fixed end date, LogiCamms may terminate Mr Banning’s employment by giving 9 months’ notice or a lesser period of time by making a payment in lieu of notice for the difference between that amount of time and 9 months. On termination with notice by LogiCamms, Mr Banning will be entitled to:
a) payment of accrued but untaken annual leave;
b) the total incentive for target performance under the STI and LTI, pro rata for the period of notice given by the Company; and
c) subject to applicable performance hurdles being met, all shares to which Mr Banning is entitled under the STI and LTI and other rights (such shares will vest within three months of termination).
Mr Banning may terminate his employment by 2 weeks’ notice to LogiCamms if LogiCamms commits a material breach of the Services Agreement, or if his role and duties are materially reduced at the instigation of the Board by comparison to his role and duties as contemplated under the Service Agreement. If the employment is terminated by Mr Banning on either of these grounds, then Mr Banning will be entitled to 9 months’ remuneration on termination. Mr Banning may terminate his employment by giving 9 months’ notice to LogiCamms. On termination by Mr Banning, Mr Banning will be entitled to:
a) payment of accrued but untaken annual leave;
b) the total incentive for target performance under the STI and LTI, pro rata for the period of notice given by the Company; and
c) all Shares to which Mr Banning is entitled under the STI and LTI and other rights (such Shares will vest within three months of termination).
LogiCamms may terminate Mr Banning’s employment immediately in the case of misconduct and in certain other circumstances. In this event, Mr Banning will not be entitled to any payment or award under the Company’s incentive plans, but will be entitled to payment in lieu of accrued but untaken annual leave.
Non-executive director remuneration
Remuneration Policy
The Board seeks to set aggregate remuneration of non-executive directors at a level that provides the Group with the ability to attract and retain directors of appropriate calibre, whilst incurring a cost that is acceptable to shareholders.
The amount of aggregate remuneration sought to be approved by shareholders and the fee structure is reviewed annually against fees paid to non-executive directors (NEDs) of comparable companies.
The Company’s constitution and the ASX listing rules specify that the NED fee pool shall be determined from time to time by a general meeting. The latest determination by shareholders approved an aggregate fee pool of up to $600,000 with such fees to be allocated to the Directors as the Board of Directors may determine.
Structure
The remuneration of NEDs consists of directors’ fees and committee fees. NEDs do not receive retirement benefits.
Mr Richard Robinson received a base fee of $75,000 inclusive of superannuation for being a director of the Group. The Board Chairman, Mr Peter Watson, received a base fee of $140,000 inclusive of superannuation for the period. Mr Giles Everist received a base fee of $42,500 inclusive of superannuation up to the date of his resignation on 4 December 2015. Mr Peter Wall received a base fee of $80,323 inclusive of superannuation due to an additional fee being payable as chair of the Audit Committee and Nomination and Remuneration Committee.
An additional fee may be payable for a director (except for the Board Chairman) who is a chair of a Board committee. The payment of additional fees for serving on a committee recognises the additional time commitment required by NEDs who serve on sub-committees. NEDs do not participate in the Company’s STI or LTI plans.
DIRECTORS’ REPORTRemuneration report – audited
LogiCamms 2016 Annual Report24
For
per
sona
l use
onl
y

Dire
ctor
s’ an
d ex
ecut
ive
office
rs’ r
emun
erat
ion
(Con
solid
ated
) – a
udite
d
Det
ails
of t
he n
atur
e an
d am
ount
of e
ach
maj
or e
lem
ent o
f rem
uner
atio
n of
eac
h Ke
y M
anag
emen
t Per
sonn
el a
re:
Shor
t-te
rmPo
st-
empl
oym
ent
Oth
er
long
term
Term
inat
ion
bene
fits $
Shar
e-ba
sed
paym
ents
Tota
l $
Prop
ortio
n of
re
mun
erat
ion
perf
orm
ance
re
late
d %
Valu
e of
opt
ions
an
d ri
ghts
as
prop
ortio
n of
re
mun
erat
ion %
Sala
ry
& fe
e $
Cash
bo
nus $
Non
-m
onet
ary
bene
fits $
Tota
l $
Supe
r-an
nuat
ion
bene
fit $
$
Opt
ions
and
ri
ghts
$D
irect
ors
Non
-Exe
cutiv
e D
irect
ors
Pete
r Wat
son
2016
140,
000
––
140,
000
––
–10
,955
150,
955
–7.
3%20
1514
0,00
0–
_14
0,00
0–
––
25,8
4816
5,84
8–
15.6
%G
iles
Ever
ist
(resi
gned
5 D
ecem
ber 2
015)
2016
42,5
00–
–42
,500
––
––
42,5
00–
–
2015
85,0
00–
_85
,000
––
––
85,0
00–
–Pe
ter W
all
2016
80,3
23–
–80
,323
––
––
80,3
23–
–20
1568
,650
–_
68,6
506,
350
––
–75
,000
––
Rich
ard
Robi
nson
(a
ppoi
nted
26
May
201
5)20
1675
,000
––
75,0
00–
––
–75
,000
––
2015
7,25
8–
–7,
258
––
––
7,25
8–
–Ex
ecut
ive
Dire
ctor
sSt
eve
Bann
ing
(A)
2016
504,
592
––
504,
592
36,2
48–
–16
4,30
970
5,14
923
.3%
23.3
%20
1521
7,84
676
,103
_29
3,94
95,
780
3,72
9–
54,8
5635
8,31
437
.8%
15.3
%M
atth
ew A
dam
o, M
anag
ing
Dire
ctor
(re
sign
ed 2
Mar
ch 2
015)
2016
––
––
––
––
––
–20
1532
4,52
3–
–32
4,52
330
,664
5,92
040
6,47
5(1
33,6
63)
633,
919
(21.
1%)
(21.
1%)
Exec
utiv
esPa
ul B
owke
r, D
irect
or –
Co
rpor
ate
Dev
elop
men
t (B)
2016
307,
630
––
307,
630
30,7
84–
–45
,750
384,
164
11.9
%11
.9%
2015
300,
874
26,7
12_
327,
586
28,5
835,
491
–54
,290
415,
950
20.0
%13
.1%
Kars
ten
Gus
ter,
Dire
ctor
– S
trat
egy
(C)
(no
long
er K
MP
from
1 Ju
ly 2
015)
2016
––
––
––
––
––
–20
1533
5,61
145
,000
_38
0,61
117
,704
5,88
9–
66,5
4847
0,75
223
.7%
14.1
%D
avid
Har
ris, D
irect
or –
Fin
ance
(D)
2016
235,
383
––
235,
383
15,7
73–
166,
460
–41
7,61
6–
–20
1568
,973
16,6
67_
85,6
404,
095
1,21
8–
9,47
910
0,43
216
,1%
9.4%
Iuliu
s M
incu
, Dire
ctor
– H
ydro
carb
ons
(no
long
er a
KM
P fr
om 1
July
201
6)20
1631
9,63
5–
–31
9,63
530
,365
––
35,0
0038
5,00
09.
1%9.
1%20
1565
,156
–_
65,1
567,
536
1,21
2–
–73
,904
––
Geo
ff Je
nkin
s, D
irect
or –
Maj
or P
roje
cts
(no
long
er a
KM
P fr
om 1
July
201
5)20
16–
––
––
––
––
––
2015
336,
150
27,7
50_
363,
900
30,7
066,
114
–77
,277
477,
997
22.0
%16
.2%
Flor
a Fu
rnes
s, D
irect
or D
eliv
er (E
) (A
ppoi
nted
1 Ju
ly 2
015)
2016
318,
901
––
318,
901
22,0
00–
–36
,000
376,
901
9.6%
9.6%
2015
––
––
––
––
––
–To
tal D
irect
ors a
nd E
xecu
tive
Offi
cers
2016
2,02
3,96
30
02,
023,
963
135,
170
016
6,46
029
2,01
42,61
7,60
7Re
mun
erat
ion
2015
1,95
0,04
119
2,23
20
2,14
2,27
313
1,41
829
,573
406,
475
154,
635
2,86
4,37
4
(A)
Stev
e Ba
nnin
g w
as th
e M
anag
ing
Dire
ctor
unt
il 12
May
201
4 an
d th
en b
ecam
e a
Non
-Exe
cutiv
e D
irect
or. O
n 2
Mar
ch 2
015
Stev
e Ba
nnin
g w
as re
-app
oint
ed M
anag
ing
Dire
ctor
. The
rem
uner
atio
n sh
own
abov
e fo
r 201
5 is
his
tota
l rem
uner
atio
n fr
om b
oth
role
s. Th
e fo
rm o
f the
sha
re b
ased
pay
men
ts fo
r 201
6 ar
e su
bjec
t to
appr
oval
by
reso
lutio
n of
the
shar
ehol
ders
at t
he 2
016
AGM
.(B
) Pa
ul B
owke
r was
app
oint
ed a
s D
irect
or –
Cor
pora
te D
evel
opm
ent o
n 26
Mar
ch 2
015.
Pre
viou
sly
Paul
was
the
Chie
f Fin
anci
al O
ffice
r.(C
) Ka
rste
n G
ust e
r res
igne
d 3
June
201
6(D
) D
avid
Har
r is re
sign
ed 1
Apr
il 20
16.
(E)
Flor
a Fu
rnes
s w
as a
ppoi
nted
1 Ju
ly 2
015.
DIRECTORS’ REPORTRemuneration report – audited
LogiCamms 2016 Annual Report 25
For
per
sona
l use
onl
y

Equity instruments
KMP disclosed below were issued Performance Rights as detailed below that impact on compensation in the 2016 or subsequent reporting periods. The service or performance criteria used to determine the number of Performance Rights issued is set out earlier in this report in the discussion of the Company’s LTI Plan.
No terms of equity-settled share-based payment transactions have been altered or modified by the issuing entity since the date of grant. All Performance Rights were provided at no cost to the recipients. Performance Rights expire on the earlier of their expiry date or termination of the individual’s employment.
Analysis of Incentives included in remuneration
Details of the vesting profile of the Performance Rights granted to KMP and impacting on compensation in the 2016 reporting period as at the date of this report, or subsequent reporting periods that are still outstanding are detailed below.
Instrument Number Grant Date
Fair value per instrument at grant date ($)
% Vested in Year
% Forfeited in Year
Number at date of
reporting
Financial Years in which
Grant Vests
Peter Watson Performance Rights 133,333 10–Nov–11 $0.81 100% – – 2016
Steve Banning Performance Rights 250,000 2–Mar–15 $0.80 33% – 166,667 2017–8
Performance Rights 63,131 27–Aug–15 $0.66 100% – – 2016
Performance Rights 69,644 26–Aug–15 $0.60 – – 69,644 2017
Performance Rights 346,154 28–Sep–16 $0.39 – – 346,154 2017
Performance Rights 346,154 28–Sep–16 $0.39 – – 346,154 2018
Paul Bowker Performance Rights 44,318 26–Aug–15 $0.66 100% – – 2016
Performance Rights 48,750 26–Aug–15 $0.60 – – 48,750 2017
Performance Rights 138,462 28–Sep–16 $0.39 – – 138,462 2017
Performance Rights 138,462 28–Sep–16 $0.39 – – 138,462 2018
Flora Furness Performance Rights 138,462 28–Sep–16 $0.39 – – 138,462 2017
Performance Rights 138,462 28–Sep–16 $0.39 – – 138,462 2018
Iulius Mincu Performance Rights 134,615 28–Sep–16 $0.39 – – 134,615 2017
Performance Rights 134,615 28–Sep–16 $0.39 – – 134,615 2018
The performance period for rights issued 26-27 August 2015, shown above, under the 2015 LTI awards is the year from 1 July 2014 to 30 June 2015. The performance period for rights issued 28 September 2016, shown above, under the 2016 LTI awards is the year from 1 July 2015 to 30 June 2016. The Performance Rights vest into shares for no further consideration on a 1 for 1 basis subject to tenure at the time of vesting. The form of the share based payments for Steve Banning for 2016 are subject to approval by resolution of the shareholders at the 2016 AGM.
Other terms
The LTI dollar value determined for each executive is calculated based on a percentage of the executive’s annual fixed remuneration and for the executive KMP for FY16 ranges from 30% to 50%.
The number of Performance Rights awarded to each executive was calculated by reference to the fair value of each Performance Right at 30 June on the financial year to which the award relates, except for FY2016 where the Performance Rights are face value based on a 5 day VWAP to 30 June 2016.
Performance Rights granted under the LTI Plan carry no voting or dividend entitlements. Currently, based on the number of Performance Rights issued and held pursuant to the LTI Plan, should all of these securities convert to shares they would represent 2.6% of the Company’s issued share capital.
DIRECTORS’ REPORTRemuneration report – audited
LogiCamms 2016 Annual Report26
For
per
sona
l use
onl
y

Exercise of options or Performance Rights
During the reporting period 83,333 shares were issued to Steve Banning with a fair value at grant date of $0.80 and 63,131 with a fair value at grant date of $0.66 and 44,318 shares were issued to Paul Bowker with a fair value at grant date of $0.60. All shares issued were on the conversion of Performance Rights granted in prior years as compensation. No exercise price was payable on the conversion of the Performance Rights. The Performance Rights were all STI awards. 58,069 Performance Rights issued to David Harris were forfeited on cessation of employment. No other Performance Rights previously granted to KMPs were exercised during the reporting period.
Movements in shares
The movement during the reporting year in the number of ordinary shares in the Company held directly, indirectly or beneficially, by KMP, is as follows:
Held at 1 July 2015 Purchases
Received on exercise
of options of Rights Sales
Held at 30 June 2016
Directors
Steve Banning 29,363 – 146,464 – 175,827
Peter Watson 811,029 – – – 811,029
Giles Everist1 510,000 – – – 510,000
Peter Wall 127,001 73,000 – – 200,001
Richard Robinson – – – – –
Executives –
Paul Bowker 243,490 – 84,386 – 327,876
David Harris2 28,071 – 25,000 – 53,071
Iulius Mincu – – – – –
Flora Furness – – – – –
1 Resigned during the period, representative of shareholding at 5 December 2015.
2 Resigned during the period, representative of shareholding at 1 April 2016.
Directors’ interests
The relevant interest of each Director in the shares, and Performance Rights issued by the Company at the date of this report is as follows:
DirectorOrdinary
sharesPerformance
Rights
Peter Watson 877,695 –
Peter Wall 200,001 –
Steve Banning 175,827 928,619
Richard Robinson – –
Options and rights granted to directors and officers of the Company
During or since the end of the financial year, the Company granted no additional rights over unissued ordinary shares in the Company to the Key Management Personnel.
The Performance Rights require the holder to remain employed by the Company prior to vesting. Performance Rights over unissued ordinary shares in the Company granted in the previous financial year were detailed in the previous Annual Report.
Unissued shares under options
At the date of this report there are no other unissued ordinary shares of the Company under option.
DIRECTORS’ REPORTRemuneration report – audited
27LogiCamms 2016 Annual Report
For
per
sona
l use
onl
y

Indemnification and insurance of officers and auditorsInsurance premiums
Under the Company’s Constitution, the Company indemnifies each current and former officer of the Group against certain liabilities and costs incurred by them as an officer of the Group, except where the liability arises out of conduct involving a lack of good faith. The Company also indemnifies each current and former officer of the Group against certain liabilities and costs incurred when the officer acts as an officer of another body corporate at the Company’s request and the liability or cost is incurred in that capacity. Neither indemnity extends to liabilities or costs from which the Company is prohibited from indemnifying current or former officers under the Corporations Act.
In addition the Company has entered into Deeds of Access, Indemnity and Insurance with certain officers of the Group. Under those Deeds, the Company agrees to matters including the following:
• Indemnify the officer to the extent permitted by law and under the Company’s Constitution; and
• Maintain a Director’s and Officer’s insurance policy.
Since the end of the previous financial year the Group has paid insurance premiums of $90,981.14 (2015: $43,130.65) in respect of directors’ and officers’ liability insurance policies.
Non-audit servicesDuring the year PwC, the Group’s auditor, has performed certain other services in addition to their statutory duties.
The Board has considered the non-audit services provided during the year by the auditor and in accordance with written advice provided by resolution of the audit committee, is satisfied that the provision of those non-audit services during the year by the auditor is compatible with, and did not compromise, the auditor independence requirements of the Corporations Act 2001 for the following reasons:
• all non-audit services were subject to the corporate governance procedures adopted by the Company and have been reviewed by the Audit and Risk Committee to ensure they do not impact the integrity and objectivity of the auditor; and
• the non-audit services provided do not undermine the general principles relating to auditor independence as set out in APES 110 Code of Ethics for Professional Accountants, as they did not involve reviewing or auditing the auditor’s own work, acting in a management or decision making capacity for the Company, acting as an advocate for the Company or jointly sharing risks and rewards.
Details of the amounts paid to the auditor of the Group, PwC, and its related practices for audit and non-audit services provided during the year are set out below. In addition, amounts paid to other auditors for the statutory audit have been disclosed:
Consolidated 2016
$
Consolidated 2015
$
Services other than statutory audit:
Other services – (PricewaterhouseCoopers) 14,280 5,000
14,280 5,000
DIRECTORS’ REPORT
LogiCamms 2016 Annual Report28
For
per
sona
l use
onl
y

DIRECTORS’ REPORT
After Balance Date Events Since the end of the financial year, the directors are not aware of any matters or circumstances not otherwise dealt with in this report or the financial statements that have, or may, significantly affect the operations or state of affairs of the Group in future years.
Environmental Regulation and Performance The Group’s operations are subject to Australian Commonwealth and State environmental legislation as well as legislation in New Zealand. The Group has appropriate environmental management systems in place to monitor and manage compliance with existing environmental regulations and new regulations as they come into force. LogiCamms has not been fined or prosecuted for any significant breaches of environmental regulations during the financial year.
Proceedings on behalf of the CompanyNo person has applied to the court under section 237 of the Corporations Act 2001 for leave to bring proceedings on behalf of the Company, or to intervene in any proceedings to which the Company is a party, for the purpose of taking responsibility on behalf of the Company for all or part of those proceedings. No proceedings have been brought or intervened in on behalf of the Company with leave of the court under section 237 of the Corporations Act 2001.
Auditor’s independence declarationThe auditor’s independence declaration is set out on page 65 and forms part of the directors’ report for the financial year ended 30 June 2016.
Rounding off of amountsThe Company is of a kind referred to in ASIC Corporations (Rounding in Financial/Directors’ Reports) Instrument 2016/191 dated 24 March 2016 and in accordance with that Instrument, amounts in the financial report and directors’ report have been rounded off to the nearest thousand dollars, unless otherwise stated.
This report is made in accordance with a resolution of the directors:
Peter Watson Chairman
Dated at Brisbane, Queensland this 29th day of September, 2016.
LogiCamms 2016 Annual Report 29
For
per
sona
l use
onl
y

CONSOLIDATED STATEMENT OF PROFIT OR LOSS AND OTHER COMPREHENSIVE INCOME For the year ended 30 June 2016
Note2016
$’0002015
$’000
Revenue 4(i) 108,187 133,838
Cost of sales (73,520) (82,468)
Gross profit 34,667 51,370
Other income 4(ii) 2,001 1,346
Business development expenses (7,370) (4,512)
Other expenses (37,476) (37,227)
(8,178) 10,977
Onerous lease expense (4,200) (1,300)
Results from operating activities (12,378) 9,677
Finance income 4(iii) 81 287
Finance expenses 4(iv) (151) (1)
Net finance income (70) 286
Share of (loss) / profit of equity accounted investees 9(ii) (33) 264
Impairment charge (28,100)
(Loss) / profit before income tax (40,581) 10,227
Income tax benefit / (expense) 4(v) 2,442 (1,899)
(Loss) / profit for the year attributable to owners of the Company (38,139) 8,328
Other comprehensive income for the year, net of income tax
Items that may be reclassified subsequently to profit and loss:
Foreign currency translation differences 1,434 (932)
Other comprehensive income for the period, net of tax 1,434 (932)
Total comprehensive income for the year attributable to owners of the Company (36,705) 7,396
Earnings per share:
Basic earnings per share (cents per share AUD) 4(vi) (55.5) 12.0
Diluted earnings per share (cents per share AUD) 4(vi) (55.5) 12.0
The above Consolidated statement of profit or loss and other comprehensive income should be read in conjunction with the accompanying notes.
LogiCamms 2016 Annual Report30
For
per
sona
l use
onl
y

CONSOLIDATED STATEMENT OF FINANCIAL POSITION As at 30 June 2016
Note2016
$’0002015
$’000
Assets
Cash and cash equivalents 5(i) 6,637 21,851
Trade and other receivables 5(ii) 20,832 22,976
Current tax asset 4(v) 508 377
Total current assets 27,977 45,204
Investments in equity accounted investees 9(ii) 15 243
Property, plant and equipment 6(i) 1,851 4,153
Deferred tax assets 4(v) 4,713 2,370
Intangible assets 6(ii) 33,801 56,305
Other non-current assets 125 125
Total non-current assets 40,505 63,196
Total assets 68,482 108,400
Liabilities
Trade and other payables 5(iii) 10,312 12,642
Employee benefits 5(v) 4,499 5,356
Provisions 5(vi) 3,966 312
Deferred income 5(iv) 681 1,494
Total current liabilities 19,458 19,804
Trade and other payables 5(iii) 961 955
Employee benefits 5(v) 878 1,137
Provisions 5(vi) 3,560 3,590
Total non-current liabilities 5,399 5,682
24,857 25,486
Total liabilities
Net assets 43,625 82,914
Equity
Share capital 53,163 53,416
Reserves 2,435 1,001
Retained earnings (11,973) 28,497
Total equity attributable to owners of the Company 43,625 82,914
The above Consolidated statement of financial position should be read in conjunction with the accompanying notes.
LogiCamms 2016 Annual Report 31
For
per
sona
l use
onl
y

CONSOLIDATED STATEMENT OF CHANGES IN EQUITY For the year ended 30 June 2016
NoteShare capital
$’000Reserves
$’000
Retained earnings
$’000 Total
$’000
Balance at 1 July 2015 53,416 1,001 28,497 82,914
Profit for the year – – (38,139) (38,139)
Other comprehensive income for the year, net of income tax – 1,434 – 1,434
Total comprehensive income – 1,434 (38,139) (36,705)
Buy-back of shares 7(i) – – –
Treasury shares (253) – (253)
Issuance of shares – – –
Dividends paid 7(i) – – (2,410) (2,410)
Share-based payments 9(v) – – 79 79
Balance at 30 June 2016 53,163 2,435 (11,973) 43,625
For the year ended 30 June 2015
NoteShare capital
$’000Reserves
$’000
Retained earnings
$’000 Total
$’000
Balance at 1 July 2014 54,901 1,933 24,009 80,843
Profit for the year – – 8,328 8,328
Other comprehensive income for the year, net of income tax – (932) – (932)
Total comprehensive income – (932) 8,328 7,396
Buy-back of shares 7(i) (1,975) – – (1,975)
Issuance of shares 490 – – 490
Dividends paid 7(i) – – (4,884) (4,884)
Share-based payments 9(v) – – 1,044 1,044
Balance at 30 June 2015 53,416 1,001 28,497 82,914
The above Consolidated statement of changes in equity should be read in conjunction with the accompanying notes.
LogiCamms 2016 Annual Report32
For
per
sona
l use
onl
y

CONSOLIDATED STATEMENT OF CASH FLOWS For the year ended 30 June 2016
Note2016
$’0002015
$’000
Cash flows from operating activities
Receipts from customers 110,568 137,958
Payments to suppliers and employees (118,784) (118,583)
(8,216) 19,375
Interest paid (22) (1)
Income tax paid (82) (750)
Net cash inflow from operating activities 5(i) (8,320) 18,624
Cash flows from investing activities
Interest received 81 287
Proceeds from sale of property, plant and equipment – 34
Dividends and return of capital from equity accounted investee 228 600
Acquisition of a business 9(iii) (1,835) (1,808)
Payment of earn out (500) –
Acquisition of property, plant and equipment 6(i) (295) (212)
Acquisition of intangible assets 6(ii) (1,910) (965)
Net cash outflow from investing activities (4,231) (2,064)
Cash flows from financing activities
Proceeds from issue of share capital – –
Repayment of borrowings – –
Acquisition of shares bought back (253) (1,975)
Dividends paid to the shareholders of the Company 7(i) (2,410) (4,884)
Net cash outflow from financing activities (2,663) (6,859)
Net decrease in cash and cash equivalents (15,214) 9,701
Cash and cash equivalents at beginning of financial year 21,851 12,150
Cash and cash equivalents at end of financial year 5(i) 6,637 21,851
The above Consolidated statement of cash flows should be read in conjunction with the accompanying notes.
LogiCamms 2016 Annual Report 33
For
per
sona
l use
onl
y

NOTES TO THE FINANCIAL STATEMENTS For the year ended 30 June 2016
1. General informationLogiCamms Limited (the “Company”) is a company domiciled in Australia. The address of the Company’s registered office is 433 Boundary Street, Brisbane, Australia. The Consolidated financial statements of the Company as at and for the year ended 30 June 2016 comprise the Company and its subsidiaries (together referred to as the “Group” and individually as “Group entities”) and the Group’s interest in associates and jointly controlled entities.
The Group is primarily involved with the energy, resources and infrastructure sectors providing engineering project delivery and asset performance services primarily in Australia and New Zealand. Comparative information has been reclassified where appropriate to enhance comparability.
The financial statements were approved by the Board of Directors on 29 September 2016.
2. Basis of preparationThe financial statements have been prepared on a going concern basis, which contemplates that the Group will continue to meet its commitments, realise its assets and settle its liabilities in the normal course of business.
As at 30 June 2016, the net cash position was $6.6m. The Company operates its business through management of its cash reserves and operating cash flows. The Company continues to have a strong cash collection and billing cycle over its debtor and work in progress (WIP) profile with minimal debts being written off during the course of FY16.
The Company expects to continue to fund its business out of cash reserves and operating cashflow. Based on the current cash flow forecast, which takes into account the profile of work in hand and proposals, the Company expects to continue to be able to operate its business without the requirement for debt facilities to be put in place. However, in order to provide additional support to its current cash position, the Company since 30 June has secured a Corporate Credit Line Facility of up to $10m. The facility agreement allows the Company to obtain funding against debtor invoices as they are issued.
The nature of the Company’s work requires that bank guarantees or bonds are issued in relation to certain projects. At 30 June, the Company had on issue $7.4m in bank guarantees and bonding. These requirements are met out of an existing $7m bank guarantee facility with NAB and a $10m bonding facility with SwissRe. The Facility Agreement in place with NAB is currently being renegotiated to put in place a more flexible approach to covenant requirements. The Company has received a waiver from NAB in relation to covenant compliance for the period to 30 June 2016 while these negotiations take place. The Company believes that the $9.6m headroom in these facilities is sufficient to meet the requirements of any currently identified projects or proposals.
Based on the current cash position, facilities in place and under negotiation, as well as the Company’s work in hand and proposal pipeline, the Directors believe that the Group will continue to meet its debts as and when they fall due, and accordingly, have prepared the financial report on a going concern basis.
(i) Statement of complianceThe consolidated financial statements are general purpose financial statements which have been prepared in accordance with Australian Accounting Standards (“AASBs”) (including Australian Interpretations adopted by the Australian Accounting Standards Board (“AASB”)) and the Corporations Act 2001. The consolidated financial statements comply with International Financial Reporting Standards (“IFRSs”) and interpretations adopted by the International Accounting Standards Board.
(ii) Basis of measurement and presentation currency
The Consolidated financial statements have been prepared on the historical cost basis, except for specific assets and liabilities to be measured at fair values.
The Consolidated financial statements are presented in Australian dollars, which is the Company’s functional currency.
The Company is of a kind referred to in ASIC Class Order 98/100 dated 10 July 1998 and in accordance with that Class Order, all financial information presented in Australian dollars has been rounded to the nearest thousand unless otherwise stated.
(iii) Use of estimates and judgementsThe preparation of financial statements requires management to make judgements, estimates and assumptions that affect the application of accounting policies and the reported amounts of assets, liabilities, income and expenses. Actual results may differ from these estimates.
Estimates and underlying assumptions are reviewed on an on-going basis. Revisions to accounting estimates are recognised in the period in which the estimate is revised and in any future periods affected.
In particular, information about significant areas of estimation uncertainty and critical judgements in applying accounting policies that have the most significant effect on amounts recognised in the financial statements are included in the following notes:
• Notes 4(i) and 5(ii) – revenue recognition and project work in progress
• Note 4(v) – tax loss recognition
• Note 6(ii) – measurement of the recoverable amounts of cash-generating units containing goodwill
• Note 5(iv) – measurement of deferred consideration
• Note 5(vi) – onerous leases and warranty provisions
• Note 9(v) – measurement of share-based payments
3. Significant accounting policiesThe accounting policies set out below have been applied consistently to all periods presented in these consolidated financial statements, and have been applied consistently by the Group.
(i) Goods and services taxRevenue, expenses and assets are recognised net of the amount of goods and services tax (GST), except where the amount of GST incurred is not recoverable from the taxation authority. In these circumstances, the GST is recognised as part of the cost of acquisition of the asset or as part of the expense.
LogiCamms 2016 Annual Report34
For
per
sona
l use
onl
y

NOTES TO THE FINANCIAL STATEMENTS For the year ended 30 June 2016
(ii) Foreign currencyForeign currency transactions
Transactions in foreign currencies are translated to the respective functional currencies of Group entities at exchange rates at the dates of the transactions.
Monetary assets and liabilities denominated in foreign currencies at the reporting date are retranslated to the functional currency at the exchange rate at that date. The foreign currency gain or loss on monetary items is the difference between amortised cost in the functional currency at the beginning of the year, adjusted for effective interest and payments during the year, and the amortised cost in foreign currency translated at the exchange rate at the end of the year.
Non-monetary assets and liabilities that are measured at fair value in a foreign currency are retranslated to the functional currency at the exchange rate at the date that the fair value was determined. Non-monetary items that are measured based on historical cost in a foreign currency are translated using the exchange rate at the date of the transaction.
Foreign currency differences arising on retranslation are generally recognised in profit or loss.
Foreign operations
The assets and liabilities of foreign operations, including goodwill and fair value adjustments arising on acquisition, are translated to the presentation currency at exchange rates at the reporting date. The income and expenses of foreign operations are translated to Australian dollars at exchange rates at the dates of the transactions. Foreign currency differences are recognised in other comprehensive income, and presented in the foreign currency translation reserve (translation reserve) in equity.
When the settlement of a monetary item receivable from or payable to a foreign operation is neither planned nor likely in the foreseeable future, foreign exchange gains and losses arising from such items are considered to form part of the net investment in the foreign operation and are recognised in other comprehensive income, and presented in the translation reserve in equity.
(iii) New standards and interpretations not yet adoptedA number of new standards, amendments to standards and interpretations are effective for annual periods beginning after 1 July 2015. None of these have had a significant effect on the consolidated financial statements of the Group.
The Group has not elected to adopt early any accounting standards and/or amendments.
At the date of authorisation of the financial statements, the Standards and Interpretations listed below were in issue but not yet effective:
Standard/Interpretation
Effective for annual reporting
periods beginning on or after
Expected to be initially applied in the financial
year ending
AASB 9 ‘Financial Instruments’, and the relevant amending standards 1 January 2018 30 June 2019
AASB 15 ‘Revenue from Contracts with Customers’ and AASB 2014-5 ‘Amendments to Australian Accounting Standards arising from AASB 15’ 1
1 January 2018 30 June 2019
AASB 16 ‘Leases’ 2 1 January 2019 30 June 2020
AASB 2014-4 ‘Amendments to Australian Accounting Standards – Clarification of Acceptable Methods of Depreciation and Amortisation’
1 January 2016 30 June 2017
AASB 2014-10 ‘Amendments to Australian Accounting Standards – Sale or Contribution of Assets between an Investor and its Associate or Joint Venture’
1 January 2016 30 June 2017
AASB 2015 – 1 ‘Amendments to Australian Accounting Standards – Annual Improvements to Australian Accounting Standards 2012–2014 Cycle’
1 January 2016 30 June 2017
AASB 2015 – 2 ‘Amendments to Australian Accounting Standards – Disclosure Initiative: Amendments to AASB 101’
1 January 2016 30 June 2017
1 The AASB has issued a new standard for the recognition of revenue (AASB 15). The new standard is based on the principle that revenue is recognised when control of a good or service transfers to a customer. The Group has not yet considered the impact of the new rules on its revenue recognition policies and will undertake a detailed assessment in the near future. The Group expects to adopt the new standard from 1 July 2018.
2 The AASB has issued a new standard for accounting for leases (AASB 16). The new standard introduces a single basis for accounting for leases and entities will be required to recognise all assets and liabilities for all leases longer than 12 months. The Group has not yet considered the impact of the new rules and will undertake a detailed assessment in the near future. The Group expects to adopt the new standard from 1 July 2019.
3. Significant accounting policies (continued)
LogiCamms 2016 Annual Report 35
For
per
sona
l use
onl
y

NOTES TO THE FINANCIAL STATEMENTS For the year ended 30 June 2016
(iv) Other accounting policies Significant and other accounting policies that summarise the measurement basis used and are relevant to an understanding of the financial statements are provided throughout the notes to the financial statements.
4. Operations – results for the year
(i) Revenue 2016 $’000
2015 $’000
Project and services revenue 101,086 125,123
Training courses 7,101 8,715
108,187 133,838
Revenue from projects and services
With respect of fixed price contracts, revenue is recognised depending on the stage of completion of those services. The Group estimate the percentage of costs based on the portion that contract costs incurred for work performed to date bear to the estimated total contract costs.
Contract revenue includes the initial amount agreed in the contract plus any variations in contract work, claims and incentive payments to the extent that it is probable that they will result in revenue and can be measured reliably.
When the outcome of a contract cannot be estimated reliably, contract revenue is recognised only to the extent of contract costs incurred that are likely to be recoverable. An expected loss on a contract is recognised immediately in profit or loss.
Revenue from training courses
Revenue from training courses is recognised when the course is completed.
(ii) Other Income 2016 $’000
2015 $’000
Reduction in earn out payable 5(iii) 2,000 1,328
Other 1 18
2,001 1,346
(iii) Finance income 2016 $’000
2015 $’000
Interest income on bank deposits 81 287
81 287
3. Significant accounting policies (continued)
LogiCamms 2016 Annual Report36
For
per
sona
l use
onl
y

NOTES TO THE FINANCIAL STATEMENTS For the year ended 30 June 2016
(iv) ExpensesThe statement of comprehensive income includes the following specific expenses: 2016
$’0002015
$’000
Personnel expenses 68,416 68,482
Contractor expenses 17,183 12,898
Contributions to defined contribution superannuation funds 4,511 4,577
Operating leases 3,223 4,648
Depreciation 2,543 1,072
Amortisation 1,459 1,044
Interest expense on financial liabilities 151 1
Personnel expenses and Contributions to defined contribution superannuation funds
The Group’s accounting policy for liabilities associated with employee benefits is set out in Note 5(v). The majority of employees in Australia and New Zealand are party to a defined contribution scheme and receive fixed contributions from the Group and the Group’s legal or constructive obligation is limited to these contributions. Contributions to defined contribution funds are recognised as an expense as they become payable.
Operating leases
Payments made under operating leases are recognised in profit or loss on a straight-line basis over the term of the lease. Lease incentives received are recognised as an integral part of the total lease expense, over the term of the lease.
Depreciation and Amortisation
The Group’s accounting policy for depreciation and amortisation is set out in Notes 6(i) and 6(ii).
4. Operations – results for the year (continued)
LogiCamms 2016 Annual Report 37
For
per
sona
l use
onl
y

NOTES TO THE FINANCIAL STATEMENTS For the year ended 30 June 2016
4. Operations – results for the year (continued)(v) TaxationIncome tax expense comprises current and deferred tax. Current and deferred tax is recognised in profit or loss except to the extent that it relates to items recognised directly in equity, in which case it is recognised in equity or in other comprehensive income.
Income Tax Expense 2016 $’000
2015 $’000
Current tax expense
Current year (473) 819
Withholdings tax paid 78 150
Adjustments for prior year (tax incentives) (240) 67
(635) 1,036
Deferred tax expense
Origination and reversal of temporary differences (1,807) 863
Total income tax (benefit) / expense (2,442) 1,899
Numerical reconciliation between tax expense and pre-tax accounting profit 2,016 $’000
2,015 $’000
(Loss) / profit for the year (38,139) 8,328
Total income tax (benefit) / expense (2,442) 1,899
Profit before income tax (40,581) 10,227
Income tax using the Company’s domestic tax rate of 30% (12,174) 3,068
Effect of tax rates in foreign jurisdictions 15 (17)
Tax incentives – current financial year (310) (900)
Previous financial year adjustment (240) 67
Non-deductible expenses 8,211 59
Non-assessable income (600) (398)
Franking credit offset (58) (17)
Tax losses and incentive not recognised 2,641 –
Witholding taxes paid 73 –
Other – 37
Total income tax (benefit) / expense (2,442) 1,899
The difference between the actual income tax expense and the income tax expense using the Company’s domestic rate of 30% is mainly attributable to tax losses and incentives not recognised combined with goodwill impairment.
Current tax assets and liabilities
Current tax is the expected tax payable or receivable on the taxable income for the year, using tax rates enacted or substantively enacted at the reporting date, and any adjustment to tax payable in respect of previous years.
2016 $’000
2015 $’000
Current assets
Current financial year tax refundable 508 377
LogiCamms 2016 Annual Report38
For
per
sona
l use
onl
y

NOTES TO THE FINANCIAL STATEMENTS For the year ended 30 June 2016
Tax assets and liabilities – recognised deferred tax assets and liabilities
A deferred tax asset is recognised to the extent that it is probable that future taxable profits will be available against which the temporary difference can be utilised. Deferred tax assets are reviewed at each reporting date and are reduced to the extent that it is no longer probable that the related tax benefit will be realised.
Deferred tax is based upon the expected manner of realisation or settlement of the carrying amount of assets and liabilities using the applicable tax rates. Deferred tax is recognised in respect of temporary differences between the carrying amounts of assets and liabilities for financial reporting purposes and the amounts used for taxation purposes.
Deferred tax assets and liabilities are offset if there is a legally enforceable right to offset current tax liabilities and assets; and they relate to income taxes levied by the same tax authority on the same taxable entity, or on different tax entities, but they intend to settle current tax liabilities and assets on a net basis or their tax assets and liabilities will be realised simultaneously.
Assets Liabilities Net
2016 $’000
2015 $’000
2016 $’000
2015 $’000
2016 $’000
2015 $’000
Trade receivables 51 185 – – 51 185
Work in progress – (477) (1,249) (477) (1,249)
Equity accounted investee – (24) (93) (24) (93)
Fixed assets 258 9 – – 258 9
Employee benefits 1,606 1,938 – – 1,606 1,938
Other payables 1,170 623 – – 1,170 623
Revenue received in advance 8 22 – – 8 22
Provisions 2,080 879 – – 2,080 1,101
Share based payments 41 56 – – 41 56
Transaction costs – – – – – –
Income tax loss – – – – – –
Tax assets / (liabilities) 5,214 3,712 (501) (1,342) 4,713 2,370
Tax assets and liabilities – movement in temporary differences during the year
Balance 1 Jul 14
$’000
Recognised in profit or loss
$’000
Balance 30 Jun 15
$’000
Balance 1 Jul 15
$’000
Recognised in profit or loss
$’000
Balance 30 June 2016
$’000
Trade receivables 441 (256) 185 185 (134) 51
Work in progress (881) (368) (1,249) (1,249) 772 (477)
Equity accounted investee (197) 104 (93) (93) 69 (24)
Fixed assets 18 (9) 9 9 249 258
Employee benefits 1,888 50 1,938 1,938 (332) 1,606
Other payables 372 251 623 623 547 1,170
Revenue received in advance 39 (17) 22 22 (14) 8
Provisions 792 87 879 879 1,201 2,080
Share based payments (257) 313 56 56 (15) 41
Transaction costs 28 (28) – – – –
Income tax loss 990 (990) – – – –
3,233 (863) 2,370 2,370 2,343 4,713
4. Operations – results for the year (continued)(v) Taxation (continued)
LogiCamms 2016 Annual Report 39
For
per
sona
l use
onl
y

NOTES TO THE FINANCIAL STATEMENTS For the year ended 30 June 2016
4. Operations – results for the year (continued)(v) Taxation (continued)Deferred tax is not recognised for the following temporary differences:
• Initial recognition of assets or liabilities in a transaction that is not a business combination and that affects neither accounting nor taxable profit;
• Differences relating to investments in subsidiaries and jointly controlled entities to the extent that it is probable that they will not reverse in the foreseeable future; and
• Initial recognition of goodwill.
At 30 June 2016 there were unrecognised and unused tax losses of $3.1m
Tax Consolidation
The company and its wholly-owned Australian resident entities are part of a Tax Consolidated Group (TCG). As a consequence, all members of the tax-consolidated Group are taxed as a single entity. The head entity within the tax-consolidated Group is LogiCamms Limited.
(vi) Earnings per share (EPS) 2016
$’0002015
$’000
Profit for the year (38,139) 8,328
WANOS1 used to calculate basic EPS (shares) 68,741 69,422
WANOS1 used to calculate diluted EPS (shares) 69,193 69,571
Basic EPS (cents per share) (55.5) 12.0
Diluted EPS (cents per share) (55.5) 12.0
1 Weighted average number of ordinary shares
2016 2015
WANOS used to calculate basic EPS (shares) 68,741 69,422
Effect of performance rights on issue 452 149
Effect of share appreciation rights on issue – –
WANOS used to calculate diluted EPS (shares) 69,193 69,571
There have been no transactions involving ordinary shares between the reporting date and the date of completion of these financial statements which would impact on the above EPS calculations
Calculation of earnings per share
Basic earnings per share
Basic earnings per share is calculated as net profit attributable to members of the parent, adjusted to exclude any costs of servicing equity (other than dividends), divided by the weighted average number of ordinary shares, adjusted for any bonus elements.
Diluted earnings per share
Diluted earnings per share are calculated as net profit attributable to members of the parent, adjusted for:
• Cost of servicing equity (other than dividends)
• the after-tax effect of dividends and interest associated with dilutive potential ordinary shares that have been recognised as expenses; and
• other non-discretionary changes in revenue or expenses during the year that would result from the dilution of potential ordinary shares
divided by the weighted average number of ordinary shares and dilutive potential ordinary shares, adjusted for any bonus element.
LogiCamms 2016 Annual Report40
For
per
sona
l use
onl
y

NOTES TO THE FINANCIAL STATEMENTS For the year ended 30 June 2016
(vii) Segment reportingThe Group has a single reportable segment in which it operates, being engineering services, this is based on information that is internally provided to the Managing Director for assessing performance and making operating decisions. Therefore no additional disclosures in relation to the revenues, profit or loss, assets and liabilities and other material items have been made.
The Company is domiciled in Australia, with operations located across Australia and in New Zealand. Revenue and non-current assets are attributed to the above regions based on the revenue earned and non-current assets owned by the subsidiaries domiciled in each region and are as follows:
2016 $’000
2015 $’000
Revenue
Australia 93,230 110,121
New Zealand 14,957 23,717
108,187 133,838
Non-current assets excluding deferred tax assets
Australia 35,341 60,195
New Zealand 451 631
35,792 60,826
Revenue from one customer of the Group amounts to greater than 10% of the Group’s total revenues for the year ended 30 June 2016. One customer in the Minerals and Metals sector amounts to $19.4m (2015: one customer in the Hydrocarbons sector $19.7m and one customer in the Minerals and Metals sector $13.5m).
(viii) Auditor's remuneration2016
$2015
$
Audit services
PricewaterhouseCoopers in respect of
Audit of the Company’s Financial Report 185,000 185,000
185,000 185,000
Non-audit services
PricewaterhouseCoopers in respect of
Other services 14,280 5,000
14,280 5,000
Total auditors’ remuneration 199,280 190,000
4. Operations – results for the year (continued)
LogiCamms 2016 Annual Report 41
For
per
sona
l use
onl
y

NOTES TO THE FINANCIAL STATEMENTS For the year ended 30 June 2016
5. Operations – Operating assets and liabilities(i) Cash and cash equivalentsCash balances reconcile to the amount of cash shown in the statement of cash flows at the end of the financial year.
The Group’s exposure to interest rate risk and a sensitivity analysis for financial assets and liabilities is disclosed in Note 8(ii).
Reconciliation of cash flows from operating activities
Cash flows are included in the statement of cash flows on a gross basis. The GST components of cash flows arising from investing and financing activities which are recoverable from, or payable to, the ATO are classified as operating cash flows.
Note2016
$’0002015
$’000
Cash flow from operating activities
Profit for the year (38,139) 8,328
Adjustments for:
Depreciation 6(i) 2,543 1,072
Amortisation of intangible assets 6(ii) 1,459 1,044
Impairment 6(ii) 28,100 –
Net finance benefit 70 (286)
Share of (profit) / loss of equity accounted investees 9(ii) 33 (264)
Loss on sale of property, plant and equipment 23 12
Equity-settled share-based payment transactions 9(v) 31 1,044
Income tax (benefit) / expense 4(v) (2,442) 1,899
Interest paid (22) (1)
Income taxes paid (83) (750)
Operating profit before changes in working capital and provisions (8,427) 12,098
Change in trade and other receivables 2,557 6,246
Change in trade and other payables (1,567) 2,716
Change in deferred income (813) (2,648)
Change in provisions and employee benefits (70) 212
Net cash from operating activities (8,320) 18,624
(ii) Trade and other receivables2016
$’0002015
$’000
Current
Trade receivables 10,970 14,905
Provision for impairment of trade receivables (170) (487)
Project work in progress 9,369 7,899
Prepayments and sundry debtors 663 659
20,832 22,976
LogiCamms 2016 Annual Report42
For
per
sona
l use
onl
y

NOTES TO THE FINANCIAL STATEMENTS For the year ended 30 June 2016
Trade and other receivables
Trade and other receivables are recognised initially at fair value and subsequently at amortised cost using the effective interest method, less any impairment losses. At 30 June 2016 trade receivables include retentions of $161,000 relating to contracts in progress (2015: $216,000). The Group’s exposure to credit risk and impairment losses related to Trade and other receivables (excluding project work in progress) are disclosed in Note 8(ii).
Project work in progress
Project work in progress represents the gross unbilled amount expected to be collected from customers for contract work performed to date. It is measured at cost plus profit recognised to date less progress billings and recognised losses. Cost includes all expenditure related directly to specific projects and an allocation of fixed and variable overheads incurred in the Group’s contract activities based on normal operating capacity. If payments received from customers exceed the income recognised, then the difference is presented as deferred income in the balance sheet.
(iii) Trade and other payables
Note2016
$’0002015
$’000
Current
Trade payables 3,775 4,136
GST payable 464 544
Deferred consideration – earn out payable 4(ii) – 1031
Accrued expenses 6,073 6,931
10,312 12,642
Non–Current
Lease incentives 661 955
Deferred consideration – earn out payable 4(ii) 300 –
961 955
Trade and other payables are recognised initially at fair value less transaction costs and subsequently at amortised cost using the effective interest method.
The Group’s exposure to currency and liquidity risk related to Trade and other payables is disclosed in Note 8(ii). The deferred consideration is level 3 on the fair value hierarchy and it is valued based on likelihood Petromod achieving certain EBIT performance hurdles. The Group has considered reasonable sensitivities in relation to the achievement of these targets. $300,000 was retained being the deferred consideration related to the Petromod acquisition. Refer to Note 9 (iii) for further information.
Minimum lease payments made under finance leases are apportioned between the finance expense and the reduction of the outstanding liability. The finance expense is allocated to each period during the lease term so as to produce a constant periodic rate of interest on the remaining balance of the liability.
Receivables and payables are stated with the amount of GST included. The net amount of GST recoverable from, or payable to, the ATO is included as a current asset or liability in the statement of financial position.
(iv) Deferred income2016
$’0002015
$’000
Billings in advance – 1,421
Prepaid revenue 681 73
681 1,494
5. Operations – Operating assets and liabilities (continued)(ii) Trade and other receivables (continued)
LogiCamms 2016 Annual Report 43
For
per
sona
l use
onl
y

NOTES TO THE FINANCIAL STATEMENTS For the year ended 30 June 2016
(v) Employee benefits2016
$’0002015
$’000
Current
Liability for annual leave 2,801 3,611
Liability for long service leave 1,437 1,288
Liability for time off in lieu 261 457
4,499 5,356
Non-Current
Liability for long service leave 878 1,137
Annual leave, long service leave and time off in lieu
The liability for annual leave, long service leave and time off in lieu is measured as the present value of expected future payments (including on-costs) for the service provided by employees up to the reporting date. Expected future payments are discounted using the yield on high quality corporate bonds that have maturity dates approximating the terms of the Group’s obligations.
(vi) Provisions2016
$’0002015
$’000
Current
Onerous lease 1,983
Lease make good 625
Warranty 1,358 312
3,966 312
Non-Current
Lease make good 491 1190
Onerous lease 3,069 2,400
3,560 3,590
The movement in the onerous lease provision for the period is shown below:
2016 $’000
Carrying amount at 1 July 2015 2,400
New provisions raised 4,200
Unwind of provision to profit and loss statement (1,548)
Carrying amount at 30 June 2016 5,052
A provision is recognised if as a result of a past event, the Group has a present legal or constructive obligation that can be estimated reliably, and it is probable that an outflow of economic benefits will be required to settle the obligation. Provisions are determined by discounting the expected future cash flows at a pre-tax rate that reflects current market assessments of the time value of money and the risks specific to the liability.
Warranty
A provision for warranty is usually recognised per project at its conclusion. At each reporting date, the overall provision is set based on average historical warranty related expenses and the usual contractual terms for warranties made.
Onerous leases
A provision for onerous leases is recognised when the expected benefits (expected lease inflows) to be derived by the Group from a lease are lower than the unavoidable cost of meeting its obligations under the lease. The provision is measured at the present value of the lower of the expected cost of terminating the lease and the expected net cost of continuing the lease. Before a provision is established, the Group recognises any impairment loss on the assets associated with the lease.
5. Operations – Operating assets and liabilities (continued)
LogiCamms 2016 Annual Report44
For
per
sona
l use
onl
y
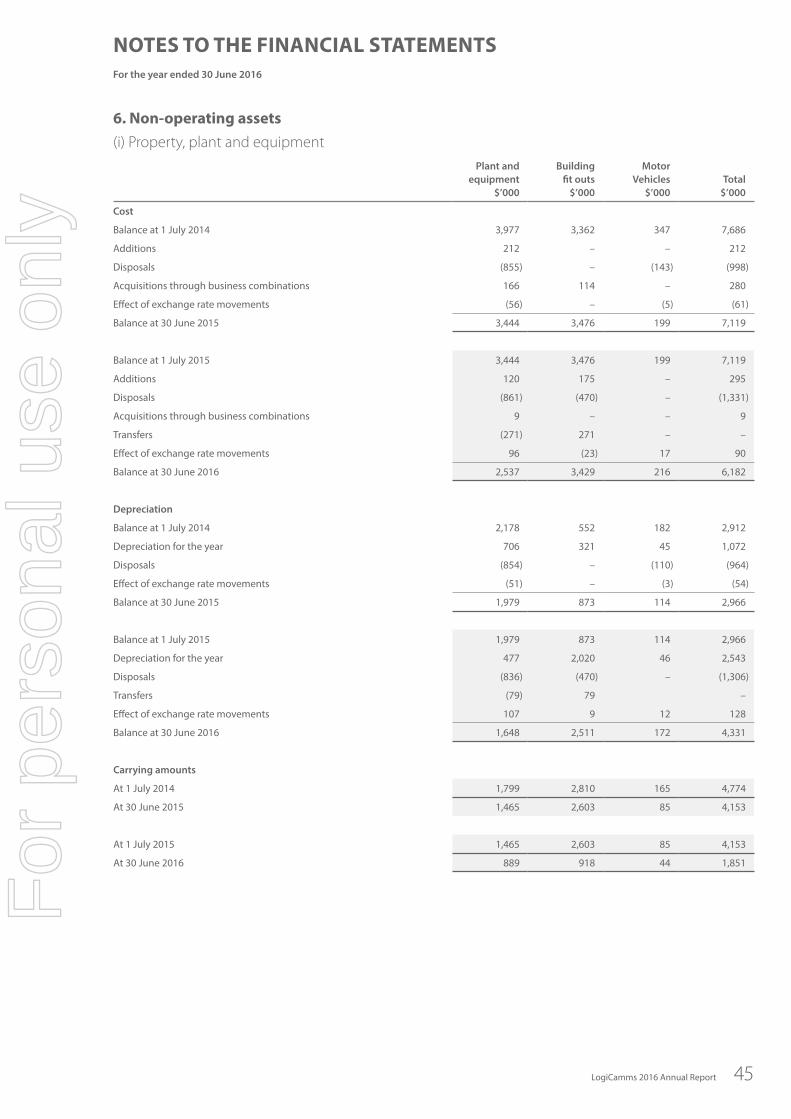
NOTES TO THE FINANCIAL STATEMENTS For the year ended 30 June 2016
6. Non-operating assets (i) Property, plant and equipment
Plant and equipment
$’000
Building fit outs
$’000
Motor Vehicles
$’000Total
$’000
Cost
Balance at 1 July 2014 3,977 3,362 347 7,686
Additions 212 – – 212
Disposals (855) – (143) (998)
Acquisitions through business combinations 166 114 – 280
Effect of exchange rate movements (56) – (5) (61)
Balance at 30 June 2015 3,444 3,476 199 7,119
Balance at 1 July 2015 3,444 3,476 199 7,119
Additions 120 175 – 295
Disposals (861) (470) – (1,331)
Acquisitions through business combinations 9 – – 9
Transfers (271) 271 – –
Effect of exchange rate movements 96 (23) 17 90
Balance at 30 June 2016 2,537 3,429 216 6,182
Depreciation
Balance at 1 July 2014 2,178 552 182 2,912
Depreciation for the year 706 321 45 1,072
Disposals (854) – (110) (964)
Effect of exchange rate movements (51) – (3) (54)
Balance at 30 June 2015 1,979 873 114 2,966
Balance at 1 July 2015 1,979 873 114 2,966
Depreciation for the year 477 2,020 46 2,543
Disposals (836) (470) – (1,306)
Transfers (79) 79 –
Effect of exchange rate movements 107 9 12 128
Balance at 30 June 2016 1,648 2,511 172 4,331
Carrying amounts
At 1 July 2014 1,799 2,810 165 4,774
At 30 June 2015 1,465 2,603 85 4,153
At 1 July 2015 1,465 2,603 85 4,153
At 30 June 2016 889 918 44 1,851
LogiCamms 2016 Annual Report 45
For
per
sona
l use
onl
y

NOTES TO THE FINANCIAL STATEMENTS For the year ended 30 June 2016
Recognition and measurement
Items of property, plant and equipment are measured at cost less accumulated depreciation. Cost includes expenditure that is directly attributable to the acquisition of the asset. Purchased software that is integral to the functionality of the related equipment is capitalised as part of that equipment.
When parts of an item of property, plant and equipment have different useful lives, they are accounted for as separate items (major components) of property, plant and equipment. Any gain or loss from derecognising the assets (the difference between the proceeds of disposal and the carrying amount of the asset) is included in “Other income” in the period the asset is derecognised.
Depreciation
Depreciation is recognised in profit or loss on a straight-line basis over the estimated useful lives of each part of an item of property, plant and equipment. Leased assets are depreciated over the shorter of the lease term and their useful lives unless it is reasonably certain that the Group will obtain ownership by the end of the lease term. Land is not depreciated. Depreciation methods, useful lives and residual values are reviewed at each reporting date.
The estimated useful lives for the current and comparative periods are as follows:
• Plant and equipment 3 – 10 years
• Building fit out costs 4 – 7 years
• Motor vehicles 4 – 5 years
Leased assets
Leases in terms of which the Group assumes substantially all the risks and rewards of ownership are classified as finance leases. Upon initial recognition the leased asset is measured at an amount equal to the lower of its fair value and the present value of the minimum lease payments. Subsequent to initial recognition, the asset is accounted for in accordance with the accounting policy applicable to that asset. Other leases are operating leases and the leased assets are not recognised on the Group’s consolidated statement of financial position.
6. Non-operating assets (continued)(i) Property, plant and equipment (continued)
LogiCamms 2016 Annual Report46
For
per
sona
l use
onl
y

NOTES TO THE FINANCIAL STATEMENTS For the year ended 30 June 2016
(ii) Intangible assets
NoteGoodwill
$’000
Software & Systems
$’000Total
$’000
Cost
Balance at 1 July 2014 51,913 3,750 55,963
Additions 2,490 965 3,455
Effect of exchange rate movements (757) – (757)
Disposals – (66) (66)
Balance at 30 June 2015 53,646 4,649 58,595
Balance at 1 July 2015 53,646 4,649 58,595
Additions 3,681 2,077 5,758
Effect of exchange rate movements 1,221 101 1,322
Disposals – (218) (218)
Balance at 30 June 2016 58,548 6,609 65,457
Amortisation and impairment losses
Balance at 1 July 2014 – 1,007 1,307
Amortisation – 1,044 1,044
Disposals – (60) (60)
Impairment 8 (ii)
Balance at 30 June 2015 – 1,991 2,291
Balance at 1 July 2015 – 1,991 2,291
Amortisation – 1,459 1,459
Disposals – (218) (218)
Impairment 8 (ii) 28,100 24 28,124
Balance at 30 June 2016 28,100 3,256 31,656
Carrying amounts
Balance at 1 July 2014 51,913 2,743 54,656
Balance at 30 June 2015 53,646 2,658 56,304
Balance at 1 July 2015 53,646 2,658 56,304
At 30 June 2016 30,448 3,353 33,801
Goodwill
Goodwill acquired in a business combination is initially measured at cost. Goodwill is measured at cost of the acquisition less the net fair value of the identifiable assets, liabilities and contingent liabilities. Following initial recognition, goodwill is measured at cost less accumulated impairment losses. In respect of equity accounted investees, the carrying amount of goodwill is included in the carrying amount of the investment.
Software and Systems
Capitalised software expenditure is measured on initial recognition at cost. The expenditure capitalised includes the direct labour and overhead costs that are directly attributable to preparing the asset for its intended use. Following initial recognition, software and systems are carried at cost less amortisation and any impairment losses. Amortisation is recognised in profit or loss on a straight-line basis over the estimated useful lives of intangible assets, other than goodwill, from the date that they are available for use. The estimated useful life applied is usually 4 years.
6. Non-operating assets (continued)
LogiCamms 2016 Annual Report 47
For
per
sona
l use
onl
y

NOTES TO THE FINANCIAL STATEMENTS For the year ended 30 June 2016
7. Capital and reserves(i) Share capital and reservesShare capital
Number of Ordinary
Shares 2016 ‘000
Number of Ordinary
Shares 2015 ‘000
On issue at 1 July 69,117 71,214
Issued in business combinations – 671
Bought back – (2,768)
Exercise of performance rights 313 –
On issue at 30 June – fully paid 69,430 69,117
Ordinary shares are classified as equity. Incremental costs directly attributable to the issue of ordinary shares and share options are recognised as a deduction from equity, net of any tax effects.
The Company does not have authorised capital or par value in respect of its issued shares. The holders of ordinary shares are entitled to receive dividends as declared from time to time and are entitled to one vote per share at meetings of the Company. All shares rank equally with regard to the Company’s residual assets.
Where share capital recognised as equity is repurchased, the amount of consideration paid, which includes directly attributable costs, net of any tax effects, is recognised as a deduction from equity.
As at 30 June 2016, 598,282 (2015: 693,435) treasury shares were included in the consolidated statements of financial position and changes in equity relate to shares acquired on-market by the Employee Share Trust (EST). These shares will be held by the EST to meet future obligations to employees under the incentive plans upon vesting of granted Performance and Share Appreciation Rights (refer Note 9(v)).
The Group has also issued Performance Rights and Share Appreciation Rights (refer Note 9(v)).
LogiCamms 2016 Annual Report48
For
per
sona
l use
onl
y

NOTES TO THE FINANCIAL STATEMENTS For the year ended 30 June 2016
Dividends
Dividends are recognised as a liability in the period in which they are declared.
Declared and paid during the period
2016 $’000
2015 $’000
Final dividend for 2015: $0.035 50% franked (2015: $0.035, 100% franked) 2,410 2,492
Interim dividend for 2016: $0.00 (2015: $0.035, 50% franked) – 2,445
Less dividends received on LogiCamms shares held by Employee Share Trust – (53)
2,410 4,884
Proposed and unrecognised as a liability
2016 $’000
2015 $’000
Final dividend for 2016: $0.000, 50% franked (2015: $0.035, 50% franked) – 2,419
– 2,419
Franking credit balance
2016 $’000
2015 $’000
30% franking credits available to shareholders of the Company for subsequent financial years (189) (508)
All dividends were franked at 30%. The ability to utilise the franking credits is dependent upon there being sufficient available profits to declare dividends. Income tax instalments expected to be paid during the financial year ending 30 June 2017 will return the franking account to a credit balance by 30 June 2017.
7. Capital and reserves (continued)(i) Share capital and reserves (continued)
LogiCamms 2016 Annual Report 49
For
per
sona
l use
onl
y

NOTES TO THE FINANCIAL STATEMENTS For the year ended 30 June 2016
8. Risk (i) Financial instrumentsNon-derivative financial instruments
Non-derivative financial instruments comprise investments in equity securities, trade and other receivables, cash and cash equivalents, and trade and other payables.
Non-derivative financial instruments are recognised initially at fair value plus, for instruments not at fair value through profit or loss, any directly attributable transaction costs. Subsequent to initial recognition non-derivative financial instruments are measured as described below.
A financial instrument is recognised if the Group becomes a party to the contractual provisions of the instrument. Financial assets are derecognised if the Group’s contractual rights to the cash flows from the financial assets expire or if the Group transfers the financial asset to another party without retaining control or substantially all risks and rewards of the asset. Regular way purchases and sales of financial assets are accounted for at trade date, i.e., the date that the Group commits itself to purchase or sell the asset. Financial liabilities are derecognised if the Group’s obligations specified in the contract expire or are discharged or cancelled.
Cash and cash equivalents comprise cash balances and term deposits.
Other non-derivative financial instruments are measured at amortised cost using the effective interest method, less any impairment losses.
(ii) Financial risk managementOverview
The Group has exposure to the following risks from its use of financial instruments:
• Credit risk
• Liquidity risk
• Market risk
This note presents information about the Group’s exposure to each of the above risks, their objectives, policies and processes for measuring and managing risk, and the management of capital.
Risk management framework
To discharge their obligation to establish and exercise oversight of the Group’s risk management framework the board of directors have delegated to the Audit and Risk Committee the responsibility to exercise oversight of how management monitor and reviews the adequacy of the risk management framework.
The Group’s risk management policies are established to identify and analyse the risks faced by the Group, to set appropriate risk limits and controls, and to monitor risks and adherence to limits. Risk management policies and systems are reviewed regularly to reflect changes in market conditions and the Group’s activities.
Credit risk
Credit risk is the risk of financial loss to the Group if a contracting entity fails to meet its obligations under a financial instrument or customer contract that will result in a financial loss to the Group. The Group is exposed to credit risk from its operating activities (principally from customer receivables and financial guarantees granted to customers) and financing activities including deposits with financial institutions.
LogiCamms 2016 Annual Report50
For
per
sona
l use
onl
y

NOTES TO THE FINANCIAL STATEMENTS For the year ended 30 June 2016
Exposure to credit risk
The carrying amount of the Group’s financial assets represents the maximum credit exposure. The Group’s maximum exposure to credit risk at the end of the reporting period was:
2016 $’000
Trade receivables (net of provision for impairment) 10.800
Sundry debtors and prepayments 663
Project work in progress 9,369
20,832
Cash and cash equivalents 6,637
27,469
Credit risks related to trade receivables
The Group trades with recognised, creditworthy third parties such as government bodies, large contracting companies or customers whom the Group has established trading history with. Customer credit risk is managed based on established policies, procedures and controls relating to customer credit risk management. This includes:
• for new customers – performing a creditworthiness assessment before credit terms are allowed and including the performance of a credit checks if required
• prior to signing a large contract – credit worthiness is assessed as part of the process of submitting the bid and negotiating terms and conditions
• purchase limits – outside special terms required for large contracts, credit limits are established for each customer
Customers that fail to meet the Group’s benchmark creditworthiness may transact only on a prepayment basis.
In addition, the recoverability of receivable balances are regularly monitored as part of the monthly commercial and performance reviews of each major project by senior management to ensure that the trade receivables and the carrying value of each project’s work in progress is recoverable. In extreme cases, the Group may consider ceasing work until any aged outstanding receivables or disputed amounts are paid / resolved.
The Group has established an allowance for impairment that represents their estimate of incurred losses in respect of trade and other receivables.
The maximum exposure to credit risk for Trade and other receivables (excluding provision for doubtful debts) by geographic region is as follows.
2016 $’000
Australia 8,519
New Zealand 1,594
Other regions 857
10,970
Details of the Group’s most significant customer receivable balances at 30 June 2016 are shown in the following table. The most significant single customer at 30 June 2016 is a large, Australian based company in the energy sector.
Carrying amount
2016 $’000
% of trade receivables
2016
Carrying amount
2015 $’000
% of trade receivables
2015
Most significant single customer 1,291 13% 1,183 8%
Top ten most significant customers 6,058 60% 6,614 46%
8. Risk (continued)(ii) Financial risk management (continued)
LogiCamms 2016 Annual Report 51
For
per
sona
l use
onl
y

NOTES TO THE FINANCIAL STATEMENTS For the year ended 30 June 2016
8. Risk (continued)(ii) Financial risk management (continued)Impairment losses
The aging of the Group’s Trade receivables at the reporting date was:
Gross 2016
$’000
Impairment 2016
$’000
Gross 2015
$’000
Impairment 2015
$’000
Not past due 5,140 – 9,484 –
Past due 0-30 days 3,623 – 2,041 –
Past due 31-120 days 1,886 (72) 860 –
Past due 121 days to one year 158 (96) 406 –
More than one year 2 (2) 1,021 (487)
Retentions (not past due) 161 – 216 –
10,970 (170) 14,028 (487)
The movement in the allowance for impairment in respect of Trade receivables during the year was as follows:
2016 $’000
2015 $’000
Balance at start of year 487 1,517
Recoveries of previous year impairments (75) (183)
Impairment losses recognised 130 636
Amounts written off as non-recoverable (372) (1,483)
Balance at 30 June 170 487
The impairment loss at 30 June 2016 relates to specific invoices that the Group considers are at risk of being recovered. The allowance account in respect of trade receivables is used to record impairment losses unless the Group is satisfied that no recovery of the amount owing is possible; at that point the amount is considered irrecoverable and is written off against the financial asset directly.
The impairment provision related to debts that are not past due is based on current uncertainties and related risks within the industries in which the Group trades. The Group will continue to strongly pursue all debts provided for.
Credit risks related to financial instruments and cash deposits
Credit risk from balances with banks and financial institutions is managed by the Group’s Finance team. Investments of surplus funds are made with the Group’s bankers who have a credit rating by Standard & Poor’s rating agency of AA- or higher.
Liquidity risk
Liquidity risk is the risk that the Group will not be able to meet its financial obligations as they fall due.
The Group manages this risk by ensuring, as far as possible, that it always has sufficient liquidity to meet its liabilities when due, under both normal and stressed conditions. The Group ensures that it has sufficient cash on demand to meet expected operational commitments in the short term including the servicing of financial obligations. The Group regularly forecasts cash flows to assess future liquidity requirements with sufficient time to hold discussions with the Group’s bankers, if such discussions are required.
LogiCamms 2016 Annual Report52
For
per
sona
l use
onl
y

NOTES TO THE FINANCIAL STATEMENTS For the year ended 30 June 2016
The following are the contractual maturities of the Group’s liabilities, including estimated interest payments and excluding the impact of netting agreements:
Carrying amount
$’000
Contractual cash flows
$’000
Less than 1 year $’000
1-2 years $’000
2-5 years $’000
Balance at 30 June 2015
Financial liabilities
Trade and other payables 13,597 12,642 12,642 955 –
13,597 12,642 12,642 955 –
Balance at 30 June 2016
Financial liabilities 11,273 12,416 10,855 1,561 –
Trade and other payables 11,273 12,416 10,855 1,561 –
Market risk
Market risk is the risk that changes in market prices, such as foreign exchange rates, interest rates and equity prices will affect the Group’s income or the value of its holdings of financial instruments. The objective of market risk management is to manage and control market risk exposures within acceptable parameters, while optimising the return.
Currency risk
The Group has no significant exposure with currency risk.
Interest rate risk
The Group’s borrowings are on fixed interest rates (finance leases). Interest rate risk is managed by ensuring that total interest rate cover is well in excess of minimum bank covenant requirements, to ensure the Group retains a high level of flexibility to absorb any adverse movements in interest rates.
Profile
At reporting date the interest rate profile of the Group’s interest-bearing financial instruments was:
Carrying amount
2016 $’000
2015 $’000
Variable rate instruments
Financial assets 6,600 21,851
Financial liabilities – –
6,600 21,851
Cash flow sensitivity analysis for variable rate instruments
A change of 200 basis points in interest rates would have increased (decreased) equity and profit by the amounts shown below. A sensitivity of 2% (2015: 2%) has been selected as this is considered reasonably possible. The Directors cannot nor do not seek to predict movements in interest rates. These sensitivities are shown for illustrative purposes only.
8. Risk (continued)(ii) Financial risk management (continued)
LogiCamms 2016 Annual Report 53
For
per
sona
l use
onl
y

NOTES TO THE FINANCIAL STATEMENTS For the year ended 30 June 2016
8. Risk (continued)(ii) Financial risk management (continued)
2016 $’000
2015 $’000
Effect on profit increase/(decrease)
If interest rates were 2% higher (2015: 2%) 243 437
If interest rates were 2% lower (2015: 2%) (243) (437)
Effect on profit after tax increase/(decrease)
If interest rates were 2% higher (2015: 2%) 170 306
If interest rates were 2% lower (2015: 2%) (170) (306)
Effect on shareholders’ equity increase/(decrease)
If interest rates were 2% higher (2015: 2%) 170 306
If interest rates were 2% lower (2015: 2%) (170) (306)
Fair values versus carrying amounts
The fair values and carrying amounts of financial assets and liabilities shown in the balance sheet were not materially different at 30 June 2016 due to the short term nature of these financial assets and liabilities.
The Group has no financial instruments carried at fair value and therefore has not disclosed the fair value hierarchy.
Capital management
The Board’s policy is to maintain a strong capital base so as to maintain investor, creditor and market confidence and to sustain future development of the business. The Board of Directors monitors the return on capital, which the Group defines as net operating income divided by total shareholders’ equity. The Board of Directors also monitors the level of dividends to ordinary shareholders.
The Company will aim to distribute 40% – 60% of net profit after tax in the form of dividends. The ultimate dividend paid will be determined by the board after consideration of general business and financial conditions, working capital requirements, taxation position, and future capital expenditure requirements.
As at the balance date the Group had no drawn debt facilities and had a bank guarantee facility of $7,000,000 (utilised $6,057,409) (2015: $7,000,000 (utilised $3,569,336)). This facility was secured by a fixed and floating charge over all the Company, its subsidiaries and all assets of the Group. The bank’s financial covenants imposed on the Group were as follows and were not met having been impacted by impairments to goodwill, onerous lease provisions and earnings:
1. Operating leverage: total liabilities to be less than 2.0 times the previous twelve months’ EBITDA;
2. Capital adequacy ratio: tangible net assets divided by total tangible assets to exceed 40 percent; and
3. Current ratio: current assets divided by current liabilities to be greater than 2.0 times.
The bank have provided a covenant waiver for FY16 and the Company is currently in negotiations for a new covenant arrangement. Since 30 June, the Company has secured a Corporate Credit Line Facility of up to $10m.
The Group also had in place a bonding facility outside the bank facility of $10,000,000 (utilised $1,361,000) (2015: $15,000,000 (utilised $1,361,000)).
(iii) Impairment Financial assets
A financial asset is assessed at each reporting date to determine whether there is any objective evidence that it is impaired. A financial asset is considered to be impaired if objective evidence indicates that one or more events have had a negative effect on the estimated future cash flows of that asset.
An impairment loss in respect of a financial asset measured at amortised cost is calculated as the difference between its carrying amount, and the present value of the estimated future cash flows discounted at the original effective interest rate. An impairment loss in respect of an available-for-sale financial asset is calculated by reference to its fair value.
Individually significant financial assets are tested for impairment on an individual basis. The remaining financial assets are assessed collectively in Groups that share similar credit risk characteristics.
All impairment losses are recognised in profit or loss.
LogiCamms 2016 Annual Report54
For
per
sona
l use
onl
y

NOTES TO THE FINANCIAL STATEMENTS For the year ended 30 June 2016
Non-financial assets
Testing for impairment
The Group tests non-financial assets for impairment:
• At least annually for indefinite life intangible assets and goodwill; and
• Where there is an indication that the asset may be impaired (which is assessed at least each reporting period); or
• Where there is an indication that previously recognised impairment (on assets other than goodwill) may have changed.
If any such indication exists then the asset’s recoverable amount is estimated, being the greater of its value in use and its fair value less costs to sell.
For the purpose of impairment testing, assets are grouped together into the smallest group of assets that generates cash inflows from continuing use that are largely independent of the cash inflows of other assets or groups of assets (the “cash-generating unit”). The Group considers that it has one cash generating unit for the purpose of impairment testing of goodwill.
Inputs to impairment calculations
The Value In Use calculation uses cash flow projections based on the Group’s corporate plans and business forecasts prepared by management and approved by the Board. The corporate plans are developed annually and on the understanding that actual outcomes may differ from the assumptions used. For these calculations, adjustments are incorporated for the relevant industry metrics. In the circumstances that the Cash Generating Unit (“CGU”) is unable to achieve the forecast growth in earnings, there is a risk that the carrying value of the CGU would exceed its recoverable amount.
Cash flow projections over the five year period, which are based on Group estimates, take into consideration historical performance as well as expected long term operating conditions. Growth rates do not materially exceed the consensus forecasts of the long term average growth rate for the market sector in which the CGU operates.
The pre-tax discount rates are based on the weighted average cost of capital determined by prevailing or benchmarked market inputs, risk adjusted where necessary, and other assumptions are determined with reference to external sources of information and use consistent, conservative estimates for variables such as terminal cash flow multiples. Increases in discount rates or changes in other key assumptions, such as operating conditions or financial performance, may cause the recoverable amounts to fall below carrying values.
EBITDA and projected margins are based on actual performance in prior years adjusted for expected efficiency improvements and cost reductions as a result of the recent business restructure.
Impairment Charge
The Group has conducted an assessment of the carrying value of its net assets and has determined that it is appropriate to recognise an impairment to goodwill of $6,000,000, reducing the goodwill balance to $30,448,000 (2015: $53,646,000). This amount is in addition to the impairment charge recognised as at 31 December 2015 of $22,100,000.
There were a number of factors that indicated an impairment of goodwill as at 30 June 2016, including:
• Financial performance across the business in the six months to 30 June 2016 was lower than expected
• Slow recovery of key commodities markets in the six months to 30 June 2016 have continued to impact on client capital and operating expenditure
• The requirement for the Group to implement a program of restructure to reduce overhead and operational costs during March 2016
Impairment calculations
Assets are impaired if their carrying value exceeds their recoverable amount. The recoverable amount of an asset or CGU is determined as the higher of its fair value less costs of disposal or Value In Use.
The recoverable amount of the goodwill is based on a Value In Use calculation with respect to the CGU and was determined by applying a five year net present value calculation of projected cash flows and a terminal value at the end of the fifth year. The calculation of Value In Use was determined having regard to the following key assumptions:
• A pre-tax discount rate applied to cash flows of 19.29% (2015: 17.94%) and reflect a change to the risk premium from the prior period
• Expected future profits for the first year based on internal financial forecasts and reflect management’s expectations of nominal growth
• Cost savings from the recent business restructure
• Future nominal revenue growth of 4% per year for years three to four and 8% for year five (2015: 5.0% for years two to five)
• After the fifth year a terminal value was applied using a growth rate of 2.5% (2015: 2.5%)
The recoverable value of the CGU is particularly sensitive to the changes in discount rate, the level of EBITDA over the 5 year forecast period, and the forecast long-term EBITDA that drives terminal value. As the goodwill for the LogiCamms CGU is carried at its Value In Use assessment, any variation to the key assumptions used to determine Value In Use, may result in an impairment of goodwill.
Sensitivity to changes in assumptions
Management recognises that there are various reasons the estimates used in these assumptions may vary. For cash generating units, there are possible changes in key assumptions that could cause the carrying value of the CGU to exceed its recoverable amount.
8. Risk (continued)(iii) Impairment (continued)
LogiCamms 2016 Annual Report 55
For
per
sona
l use
onl
y

NOTES TO THE FINANCIAL STATEMENTS For the year ended 30 June 2016
9. Corporate and Group
(i) Group entitiesParent and ultimate controlling party
As at, and throughout, the financial year ended 30 June 2016 the parent company of the Group and ultimate controlling party in the Group was LogiCamms Ltd. The subsidiary companies are listed below:
Country of incorporation Ownership interest
2016 2015
LogiCamms Holding Pty Ltd Australia 100% 100%
LogiCamms (WA) Pty Ltd Australia 100% 100%
LogiCamms Consultants Trust Australia 100% 100%
LogiCamms (PNG) Pty Ltd Australia 100% 100%
Competency Training Pty Ltd Australia 100% 100%
LogiCamms Australia Pty Ltd (formerly LogiCamms Northern Pty Ltd) Australia 100% 100%
LogiCamms (CGH) Pty Ltd Australia 100% 100%
LogiCamms (Central) Pty Ltd Australia 100% 100%
LogiCamms Shared Services Pty Ltd Australia 100% 100%
LogiCamms Consulting Pty Ltd Australia 100% 100%
Petromod Pty Ltd Australia 100% -
Independent Technology Limited New Zealand 100% 100%
Independent Technology Holdings Limited New Zealand 100% 100%
ITL Engineering New Zealand Limited New Zealand 100% 100%
ITL Limited New Zealand 100% 100%
Subsidiaries are all entities over which the Group has control. The Group controls an entity when the Group is exposed to, or has rights to, variable returns from its involvement with the entity and has the ability to affect those returns through its power to direct the activities of the entity. Subsidiaries are fully consolidated from the date on which control is transferred to the Group and are deconsolidated from the date that control ceases.
LogiCamms 2016 Annual Report56
For
per
sona
l use
onl
y

NOTES TO THE FINANCIAL STATEMENTS For the year ended 30 June 2016
Parent entity disclosures
2016 $’000
2015 $’000
Result of the parent entity
(Loss)/Profit and comprehensive income for the year (30,245) 4,632
Financial position of parent entity at year end
Current assets 8,746 18,998
Total assets 63,768 96,530
Current liabilities 5,426 4,767
Total liabilities 6,808 7,204
Net assets 56,960 89,325
Total equity of the parent entity comprising of
Share capital 64,462 65,442
Reserves 2,092 886
Retained earnings (9,593) 22,997
56,960 89,325
Parent entity contingencies
GST liabilities of other entities within the GST Group 475 467
Tax (assets) / liabilities of other entities within the Tax Consolidated Group (809) (271)
(ii) Equity accounted investees (joint venture)The Group’s share of profits in its equity accounted investee, the LogiCamms-Electro 80 joint venture, for the year is set out below in the summary financial information:
2016 $’000
2015 $’000
Ownership % 50% 50%
Current assets 31 633
Non-current assets – –
Total assets 31 633
Current liabilities 2 147
Non-current liabilities – –
Total liabilities 2 147
Net assets 29 486
Group’s share of net assets 15 243
Revenues 64 1,985
Expenses (130) (1,456)
Profit / (loss) (66) 529
Group share of (loss) / profit at 50% (33) 264
9. Corporate and Group (continued)(i) Group entities (continued)
LogiCamms 2016 Annual Report 57
For
per
sona
l use
onl
y
NOTES TO THE FINANCIAL STATEMENTS For the year ended 30 June 2016
During the year the Group received $200,000 (2015: $600,000) in dividends and returns of capital from its equity accounted investee. Interests in joint ventures are accounted for using the equity method. Under the equity method of accounting, the investments are initially recognised at cost and adjusted thereafter to recognise the Group’s share of the post-acquisition profits or losses of the investee in profit or loss, and the Group’s share of movements in other comprehensive income of the investee in other comprehensive income. Dividends received or receivable from associates and joint ventures are recognised as a reduction in the carrying amount of the investment.
When the Group’s share of losses in an equity-accounted investment equals or exceeds its interest in the entity, including any other unsecured long-term receivables, the Group does not recognise further losses, unless it has incurred obligations or made payments on behalf of the other entity.
Unrealised gains on transactions between the Group and its associates and joint ventures are eliminated to the extent of the Group’s interest in these entities. Unrealised losses are also eliminated unless the transaction provides evidence of an impairment of the asset transferred. Accounting policies of equity accounted investees have been changed where necessary to ensure consistency with the policies adopted by the Group.
(iii) Acquisitions Business combinations are accounted for using the acquisition method as at the acquisition date, which is the date on which control is transferred to the Group.
Petromod Pty Ltd
On 8 July 2015, the Group acquired 100% of a business called Petromod Pty Ltd (“Petromod”) for $3,998,000. The consideration paid was comprised of $2,198,000 cash and the accrual of a profit earn out of $1,800,000. Cash acquired was $363,000 leaving a net cash outflow for the acquisition of $1,835,000. The fair value of identifiable net assets acquired totalled $417,000 and acquired goodwill totalled $3,581,000. The earn out is contingent upon achievement of earnings above historical levels to drive out-performance. The acquisition is expected to provide the Group with expertise in maintenance services in the Hydrocarbons industry.
The Group has subsequently considered reasonable sensitivities in relation to the achievement of the performance targets and, based on those sensitivities, a reduction of $1,500,000 was made to deferred consideration payable to Petromod. The deferred consideration payable at period end was $300,000, which is included in non-current trade and other payables. The deferred consideration is level 3 on the fair value hierarchy. There have been no changes to the preliminary fair values in the current period.
Monarc Environmental
Monarc Environmental was acquired by the Group in the previous financial year. There have been no changes to the preliminary fair values during the current period.
The Group has subsequently considered reasonable sensitivities in relation to the achievement of the performance targets related to the performance earn out accrued in the prior period, and, based on those sensitivities, the accrual was released.
For acquisitions, the Group measures goodwill at the acquisition date as: the fair value of the consideration transferred; plus the recognised amount of any non-controlling interests in the acquiree; plus if the business combination is achieved in stages, the fair value of the existing equity interest in the acquiree; less the net recognised amount (generally fair value) of the identifiable assets acquired and liabilities assumed.
The consideration transferred does not include amounts related to the settlement of pre-existing relationships. Such amounts are generally recognised in profit or loss. Costs related to the acquisition, other than those associated with the issue of debt or equity securities, that the Group incur in connection with a business combination are expensed as incurred.
Any contingent consideration payable is recognised at fair value at the acquisition date. If the contingent consideration is classified as equity, it is not re-measured and settlement is accounted for within equity. Otherwise, subsequent changes to the fair value of the contingent consideration are recognised in profit or loss.
9. Corporate and Group (continued)(ii) Equity accounted investees (joint venture)
(continued)
LogiCamms 2016 Annual Report58
For
per
sona
l use
onl
y

NOTES TO THE FINANCIAL STATEMENTS For the year ended 30 June 2016
(iv) Related partiesKey Management Personnel compensation
The Key Management Personnel compensation included in ‘Personnel expenses’ (see Note 4(iv)) is as follows
2016 $
2015 $
Short-term employee benefits 2,023,963 2,140,287
Other long term benefits – 29,573
Post-employment benefits 135,170 131,418
Share-based payments 292,014 154,635
Termination benefits 166,460 406,475
2,617,607 2,862,388
Individual directors and executives compensation disclosures
Information regarding individual Directors' and executives' compensation and some equity instruments disclosures as required by Corporations Regulations 2M.3.03 are provided in the Remuneration Report section of the Directors’ Report. Apart from the details disclosed in this note, no Director has entered into a material contract with the Group since the end of the previous financial year and there were no material contracts involving Directors’ interests existing at year-end.
Key Management Personnel and their related parties
No loans were made to Key Management Personnel and their related parties during the year. The Group has not advanced loans to key management persons or their related parties.
396,464 of ordinary shares were granted to Key Management Personnel during the reporting period upon exercise of rights granted as compensation in prior periods (2015: 437,147).
The movement during the reporting year in the number of ordinary shares in the Company held, directly, indirectly or beneficially, by Key Management Personnel is detailed in the Remuneration Report.
The terms and conditions of these transactions with management persons and their related parties were no more favourable than those available, or which might reasonably be expected to be available, on similar transactions to non-director related entities on an arm’s length basis.
Non-Key Management Personnel disclosures
There were no transactions with non-Key Management Personnel during the year that require disclosure.
Acquisition of shares from related parties
There were no acquisitions of shares from related parties in the 2016 financial year.
Subsidiaries
There is a related party relationship between the parent, LogiCamms Limited, and each of its subsidiaries listed in Note 9(i).
9. Corporate and Group (continued)
LogiCamms 2016 Annual Report 59
For
per
sona
l use
onl
y

NOTES TO THE FINANCIAL STATEMENTS For the year ended 30 June 2016
9. Corporate and Group (continued)(v) Share-based paymentsLong Term Incentive Plan
During the year ended 30 June 2011 the Group established a Long Term Incentive Plan under which the Board at its discretion can offer Performance Rights and Share Appreciation Rights to Key Management Personnel.
In addition, there remains a tranche of Performance Rights issued on 10 November 2011 which did not form part of the Long Term Incentive Plan. The terms and conditions of the Rights are as follows:
Grant date / employees entitled
Remaining number of
instrumentsVesting
conditionsContractual life of rights
Performance Rights issued on 10 November 2011 66,666 66,666 on or after
2 June 2016
4.5 years
Total Performance Rights 66,666
Total Rights at 30 June 2016 66,666
The terms of the Performance Rights issued on 10 November 2011 require that the recipient must remain in the continuous employment of the Company until the vesting date. These Rights have no exercise price and are to be settled by physical delivery of shares at a conversion ratio of 1:1.
In addition to the tenure condition noted above, the terms of the other Performance and Share Appreciation Rights have two performance conditions:
• A relative total shareholder return measure over the performance period
• An absolute earnings per share growth target over the performance period
The performance measures are mutually exclusive. Performance will be assessed over a period of three years. The exercise price for these Performance Rights is nil, while the effective exercise price of the Share Appreciation Rights is equal to the share price at grant, and the payoff is equivalent to the difference between the price at the end of the performance period, and the allocation share price, with the value settled in shares at the end of the performance period. No dividends are received on shares during the performance period.
The movement in the share rights for the year is as follows:
Outstanding at 1 July 2015 Granted
Forfeited or Cancelled (A) Exercised
Outstanding at 30 June
2016Exercisable at 30 June 2016
Performance Rights
Issued on 10 November 2011 66,666 – – – 66,666 –
66,666 – – – 66,666 –
(A) The forfeitures and cancellations relate to:
(1) the cancellation of the FY2014 long term incentive scheme and
(2) the forfeiture of rights relating to FY2012, FY2013 and FY2014 for two scheme participants who left the employ of the Group and received a cash settlement in lieu of their rights entitlements. No incremental fair value was granted. The net effect of these transactions was to reduce administration expenses in 2014 by $244,000).
LogiCamms 2016 Annual Report60
For
per
sona
l use
onl
y

NOTES TO THE FINANCIAL STATEMENTS For the year ended 30 June 2016
Employee expenses relating to equity settled share based payments
2016 $’000
2015 $’000
Shares granted to employees – 563
Performance Rights 292 638
Share Appreciation Rights – (157)
Total expense recognised as employee costs 292 1,044
Share-based payment transactions
The grant-date fair value of options, Performance Rights or Share Appreciation Rights granted to employees is recognised as an employee expense over the contractual life of the option or right that the employees become unconditionally entitled to the awards. The amount recognised as an expense is adjusted to reflect the number of awards for which the related service and non-market performance conditions are expected to be met, such that the amount ultimately recognised as an expense is based on the number of awards that meet the related service and non-market performance conditions at the vesting date. For share-based payment awards with non-vesting conditions, the grant-date fair value of the share-based payment is measured to reflect such conditions and there is no true-up for differences between expected and actual outcomes.
10. Unrecognised Items (i) Subsequent eventsOther than securing the Corporate Credit Line Facility (refer Note 8(ii)) there are no material events subsequent to balance date that management is aware of that require disclosure.
(ii) Operating leases
Leases as lessee2016 $’000
2015 $’000
Non-cancellable operating lease rentals are payable as follows:
Less than one year 3,942 4,556
Between one and five years 7,459 7,476
More than five years 235 –
11,636 12,032
The Group leases properties in Brisbane, Perth, Melbourne and Adelaide as well as in several regional locations and one in New Zealand. The leases typically run for a period of 2 to 10 years, with options to renew. Most leases increase annually to reflect market rentals or movement in the consumer price index. During the year ended 30 June 2016 $7,322,000 (2015 $5,148,000), inclusive of the increase in the provision for onerous lease of $4,200,000 (2015: $1,300,000), was recognised as an expense in the income statement in respect of operating leases.
9. Corporate and Group (continued)(v) Share-based payments (continued)
LogiCamms 2016 Annual Report 61
For
per
sona
l use
onl
y

DIRECTORS’ DECLARATIONAs at 30 June 2016
1 In the opinion of the directors of LogiCamms Ltd (‘the Company’):
(a) the consolidated financial statements and notes set out on pages 30 to 61, and the Remuneration report in the Directors' report, set out on pages 19 to 27, are in accordance with the Corporations Act 2001, including:
(i) giving a true and fair view of the Group’s financial position as at 30 June 2016 and of its performance for the financial period ended on that date; and
(ii) complying with Australian Accounting Standards and the Corporations Regulations 2001;
(b) the financial report also complies with International Financial Reporting Standards as disclosed in note 2(a);
(c) there are reasonable grounds to believe that the Company will be able to pay its debts as and when they become due and payable.
2 The directors have been given the declarations required by Section 295A of the Corporations Act 2001 from the managing director and chief financial officer for the financial year ended 30 June 2016.
Signed in accordance with a resolution of the directors:
Dated at Brisbane, Queensland, this 29th day of September 2016.
Peter Watson Chairman
LogiCamms 2016 Annual Report62
For
per
sona
l use
onl
y

INDEPENDENT AUDITOR’S REPORT
PricewaterhouseCoopers, ABN 52 780 433 757480 Queen Street, BRISBANE QLD 4000, GPO Box 150, BRISBANE QLD 4001T: +61 7 3257 5000, F: +61 7 3257 5999, www.pwc.com.au
Liability limited by a scheme approved under Professional Standards Legislation.
Independent auditor’s report to the members of LogiCammsLimited
Report on the financial reportWe have audited the accompanying financial report of LogiCamms Limited (the company), whichcomprises the consolidated statement of financial position as at 30 June 2016, the consolidatedstatement of profit or loss and other comprehensive income, consolidated statement of changes inequity and consolidated statement of cash flows for the year ended on that date, a summary ofsignificant accounting policies, other explanatory notes and the directors’ declaration for LogiCammsLimited (the consolidated entity). The consolidated entity comprises the company and the entities itcontrolled at year’s end or from time to time during the financial year.
Directors' responsibility for the financial reportThe directors of the company are responsible for the preparation of the financial report that gives atrue and fair view in accordance with Australian Accounting Standards and the Corporations Act 2001and for such internal control as the directors determine is necessary to enable the preparation of thefinancial report that is free from material misstatement, whether due to fraud or error. In Note 1, thedirectors also state, in accordance with Accounting Standard AASB 101 Presentation of FinancialStatements, that the financial statements comply with International Financial Reporting Standards.
Auditor’s responsibilityOur responsibility is to express an opinion on the financial report based on our audit. We conductedour audit in accordance with Australian Auditing Standards. Those standards require that we complywith relevant ethical requirements relating to audit engagements and plan and perform the audit toobtain reasonable assurance whether the financial report is free from material misstatement.
An audit involves performing procedures to obtain audit evidence about the amounts and disclosuresin the financial report. The procedures selected depend on the auditor’s judgement, including theassessment of the risks of material misstatement of the financial report, whether due to fraud or error.In making those risk assessments, the auditor considers internal control relevant to the consolidatedentity’s preparation and fair presentation of the financial report in order to design audit proceduresthat are appropriate in the circumstances, but not for the purpose of expressing an opinion on theeffectiveness of the entity’s internal control. An audit also includes evaluating the appropriateness ofaccounting policies used and the reasonableness of accounting estimates made by the directors, as wellas evaluating the overall presentation of the financial report.
We believe that the audit evidence we have obtained is sufficient and appropriate to provide a basis forour audit opinion.
IndependenceIn conducting our audit, we have complied with the independence requirements of the CorporationsAct 2001.
LogiCamms 2016 Annual Report 63
For
per
sona
l use
onl
y

INDEPENDENT AUDITOR’S REPORT
Auditor’s opinionIn our opinion:
(a) the financial report of LogiCamms Limited is in accordance with the Corporations Act 2001,including:
(i) giving a true and fair view of the consolidated entity's financial position as at 30 June2016 and of its performance for the year ended on that date; and
(ii) complying with Australian Accounting Standards and the Corporations Regulations2001.
(b) the financial report and notes also comply with International Financial Reporting Standards asdisclosed in Note 1.
Report on the Remuneration ReportWe have audited the remuneration report included in pages 19 to 27 of the directors’ report for theyear ended 30 June 2016. The directors of the company are responsible for the preparation andpresentation of the remuneration report in accordance with section 300A of the Corporations Act2001. Our responsibility is to express an opinion on the remuneration report, based on our auditconducted in accordance with Australian Auditing Standards.
Auditor’s opinionIn our opinion, the remuneration report of LogiCamms Limited for the year ended 30 June 2016complies with section 300A of the Corporations Act 2001.
PricewaterhouseCoopers
Michael ShewanPartner
Brisbane30 September 2016
LogiCamms 2016 Annual Report64
For
per
sona
l use
onl
y

LEAD AUDITOR’S INDEPENDENCE DECLARATION
PricewaterhouseCoopers, ABN 52 780 433 757480 Queen Street, BRISBANE QLD 4000, GPO Box 150, BRISBANE QLD 4001T: +61 7 3257 5000, F: +61 7 3257 5999, www.pwc.com.au
Liability limited by a scheme approved under Professional Standards Legislation.
Auditor’s Independence Declaration
As lead auditor for the audit of LogiCamms Limited for the year ended 30 June 2016, I declare that tothe best of my knowledge and belief, there have been:
1. no contraventions of the auditor independence requirements of the Corporations Act 2001 inrelation to the audit; and
2. no contraventions of any applicable code of professional conduct in relation to the audit.
This declaration is in respect of LogiCamms Limited and the entities it controlled during the period.
Michael Shewan BrisbanePartnerPricewaterhouseCoopers
30 September 2016
LogiCamms 2016 Annual Report 65
For
per
sona
l use
onl
y

Additional information required by the ASX Limited Listing Rules and not disclosed elsewhere in this report is set out below. The information is correct at 29 September 2016.
Shareholdings
Twenty largest shareholders
The number of shares held by substantial shareholders and their associates are set out below:
Shareholder Units % of Units
HSBC CUSTODY NOMINEES (AUSTRALIA) LIMITED 8397481 12.09
NATIONAL NOMINEES LIMITED 5252192 7.56
UBS NOMINEES PTY LTD 4328922 6.23
CANDYBLOSSOM PTY LTD 2605720 3.75
J P MORGAN NOMINEES AUSTRALIA LIMITED 2313430 3.33
AMW CONSULTANCY SERVICES PTY LTD 2000000 2.88
MR ADAM ROBERT KEATS & MRS NATASHA ELIZABETH KEATS 1414126 2.04
MR GRAHAM JOHN GILKISON & MS JOANNE KIM GILKISON & MR ANDREW JOHN WELDON SMITH 1099320 1.58
MR ANDREW JOHN WELDON SMITH & MS SUZANNE ELIZABETH SMITH & MS JULIA YVONNE MUSTARD 1099320 1.58
ABN AMRO CLEARING SYDNEY NOMINEES PTY LTD 1062156 1.53
BOND STREET CUSTODIANS LIMITED 992524 1.43
CITICORP NOMINEES PTY LIMITED 840984 1.21
BFA SUPER PTY LTD 680000 0.98
MONARC ENVIRONMENTAL PTY LTD 671141 0.97
MR IAN HAMILTON PATERSON 624702 0.90
PACIFIC CUSTODIANS PTY LIMITED 609918 0.88
MR PAUL DAVID WALKER 593149 0.85
MR ADAM MURRAY HORE & MS MEAGHAN LEE ROWE 527989 0.76
MR ALAN JOHN HOOKER & MS BEVERLEY JANETTE TATHAM 471137 0.68
MR PETER JAMES MCDONALD & RT MCDONALD TRUSTEE LIMITED 471137 0.68
Total 36055348 51.93
Balance of Register 33374266 48.07
Grand Total 69,429,614 100
Substantial Shareholders
Shareholder Units % of Units
Tiga Trading Pty Ltd & Related Parties 9,600,000 13.90%
Forager Funds Management 4,687,722 6.80%
Range of Shares
Ordinary Fully Paid Shares
Range Total Holders Units% of issued
capital
100,001 and Over 70 45,350,165 65.32
50,001 to 100,000 85 6,134,573 8.84
10,001 to 50,000 530 12,619,696 18.18
5,001 to 10,000 403 3,289,157 4.74
1,001 to 5,000 565 1,855,897 2.67
1 to 1,000 262 180,126 0.26
TOTAL 1915 69,429,614 100
ASX INFORMATION
LogiCamms 2016 Annual Report66
For
per
sona
l use
onl
y

ASX INFORMATION
Unmarketable Parcels
There were 286 holders of unmarketable parcels of less than $500.
Voluntary Escrow
Registered NameShares Escrowed
Until 06/03/17
MONARC ENVIRONMENTAL PTY LTD 335,571
Total
Unlisted Securities – Performance Rights
Issue Date Vesting Date Number of Shares
10 November 2011 After 2 June 2016 66,666
The Performance Rights are exercisable into shares for nil consideration. The terms of the Performance Rights require that the recipient must remain in the continuous employment of the Company until the vesting date.
Unlisted Securities – Options
Nil
Unlisted Securities – Share Appreciation Rights
Nil
The effective exercise price of the share appreciation rights is equal to the share price at the date of grant and the payoff is equivalent to the difference between the price at the end of the performance period and the allocation share price, with the value settled in shares at the end of an additional 1 year period.
Securities Exchange
The Company is listed on the Australian Securities Exchange. The Home exchange is Perth, Western Australia.
Other information
LogiCamms Ltd, incorporated and domiciled in Australia, is a publicly listed company limited by shares.
Buy Back
There is no current on-market buy-back.
Voting rights
Ordinary shares
The voting rights attached to the ordinary shares are governed by the Constitution. On a show of hands every person present who is a member or representative of a member shall have one vote and on a poll, every member present in person or by proxy or by attorney or duly authorised representative shall have one vote for each share held.
Options
There are no options.
LogiCamms 2016 Annual Report 67
For
per
sona
l use
onl
y

NOTES
LogiCamms 2016 Annual Report68
For
per
sona
l use
onl
y

For
per
sona
l use
onl
y

LogiCamms Limited
ASX:LCMACN 127 897 689ABN 90 127 897 689
Registered Office
200 Mary Street, BrisbaneQueensland, Australia 4000Tel. + 61 7 3058 7000
www.logicamms.com.au
Location of Share Registry
Computershare Investor Services Limited45 St Georges Terrace, West Perth,Western Australia 6000Tel. + 61 8 9323 2000
For
per
sona
l use
onl
y