Embed Size (px)
Citation preview

1
REGIS RESOURCES LTD
ANNUAL GENERAL MEETING18 NOVEMBER 2016
1F
or p
erso
nal u
se o
nly

2DISCLAIMER & COMPETENT PERSONS STATEMENT
This presentation contains only a brief overview of Regis Resources Limited and its associated entities (“Regis or RRL") and their respective activitiesand operations. The contents of this presentation, including matters relating to the geology of Regis’ projects, may rely on various assumptions andsubjective interpretations which it is not possible to detail in this presentation and which have not been subject to any independent verification.
This presentation contains a number of forward-looking statements. Known and unknown risks and uncertainties, and factors outside of Regis’ control,may cause the actual results, performance and achievements of Regis to differ materially from those expressed or implied in this presentation. To themaximum extent permitted by law, Regis does not warrant the accuracy, currency or completeness of the information in this presentation, nor thefuture performance of Regis, and will not be responsible for any loss or damage arising from the use of the information. The information contained inthis presentation is not a substitute for detailed investigation or analysis of any particular issue. Current and potential investors and shareholdersshould seek independent advice before making any investment decision in regard to Regis or its activities.
The information in this presentation that relates to Exploration Results is extracted from the ASX announcement released 14 October 2016 entitled“Quarterly Report to 30 September 2016” and for which Competent Person’s consents were obtained. The Competent Person’s consents remain inplace for subsequent releases by the Company of the same information in the same form and context, until the consent is withdrawn or replaced by asubsequent report and accompanying consent.
The information in this presentation that relates to Mineral Resources or Ore Reserves is extracted from the Mineral Resource and Ore ReserveStatement released to the Australian Securities Exchange on 7 July 2016 and the ASX announcement released on 29 July 2016 entitled “MaidenResource of 547,000 Ounces at Tooheys Well” and for which Competent Person’s consents were obtained. The Competent Person’s consents remain inplace for subsequent releases by the Company of the same information in the same form and context, until the consent is withdrawn or replaced by asubsequent report and accompanying consent.
The Company confirms that it is not aware of any new information or data that materially affects the information included in the original ASXannouncements released on 7 July 2016, 29 July 2016 and 14 October 2016 and, in the case of estimates or Mineral Resources or Ore Reserves, that allmaterial assumptions and technical parameters underpinning the estimates in the original ASX announcements continue to apply and have notmaterially changed. The Company confirms that the form and context in which the Competent Person’s findings are presented have not beenmaterially modified from the original ASX announcement.
ASX announcements are available on the Company’s website at www.regisresources.com.au
2F
or p
erso
nal u
se o
nly

3CORPORATECAPITAL STRUCTURE
Shares on issue 500mLast price $2.83Market capitalisation A$1,487mDaily turnover (no. shares) 7mUnlisted options 11.5m
FINANCIALSCash & bullion (30 Sept 16) $101mQ1FY17 Cashflow from ops $60m2015 Dividend 6cps ($30m paid Oct15)2016 Interim div 4cps ($20m paid Feb16)2016 Final div 9cps ($45m paid Aug16)
OPERATIONS SNAPSHOTDuketon operations (WA) 10Mtpa for >300kozpaMcPhillamys project (NSW) 2.2Moz resourceResources (total) 8.6MozReserves 2.1Moz
3
BOARD & MANAGEMENTMark Clark Executive Chairman & CEOPaul Thomas Executive Director & COOMark Okeby Non Executive Deputy ChairmanRoss Kestel Non Executive DirectorJames Mactier Non Executive Director
0
5
10
15
20
25
30
00.5
11.5
22.5
33.5
44.5
vOLU
ME
(Mill
ions
)
SHAR
E PR
ICE
A$)
SHARE PRICE & VOLUME
For
per
sona
l use
onl
y

4GOLD PRICE 4
1,000
1,100
1,200
1,300
1,400
1,500
1,600
1,700
1,800
1,900
ONE YEAR GOLD PRICE PERFORMANCE
AUD$ GOLD PRICE UP 6% TO $1,613
USD$ GOLD PRICE UP 12% TO $1,218
For
per
sona
l use
onl
y

5IRRESPECTIVE OF GOLD PRICE -CONTROL THE THINGS WE CAN
WITHIN OUR CONTROL Increase gold production over the medium term Maintain low costs relative to industry peer group Grow reserves through exploration and generate a development pipeline
5
OUTSIDE OF OUR CONTROL
For
per
sona
l use
onl
y

6OPERATIONS OUTLOOK
Organic growth at Duketon to deliver increasing production profile over medium term
6
2017 – 2019 DUKETON PROJECT PRODUCTION GUIDANCE & TARGETS
Midpoint of cumulative 2017-2019 production guidance/target range is based on 98% Probable Ore Reserves and 2% Inferred Mineral Resources (IMR). No Exploration Targets included.Cautionary statement: there is a low level of geological confidence associated with IMR and there is no certainty that further exploration work will result in the determination of Indicated Mineral Resources or that the production target itself will be realised.
2016ACTUAL305,084
300,000
320,000
340,000330,000
350,000
370,000
200,000
220,000
240,000
260,000
280,000
300,000
320,000
340,000
360,000
380,000
2016 2017 2018 2019
GOLD
PRO
DUCT
ION
(OU
NCE
S)
2017GUIDANCE
2018TARGET
2019TARGET
For
per
sona
l use
onl
y

7MACQUARIE RESEARCH GLOBAL GOLD COVERAGEAISC COST CURVE
Source: Macquarie Research note “Australian Gold Miners” 12 September 2016
7
400
500
600
700
800
900
1,000
1,100
1,200
1,300
1,400
US$
per
oun
ce
FY2016 ALL IN SUSTAINING COSTS (US$/OUNCE)
For
per
sona
l use
onl
y

8MACQUARIE RESEARCH GLOBAL GOLD COVERAGEFORECAST EX AISC 2017 CAPEX COST CURVE
Source: Macquarie Research note “Australian Gold Miners” 12 September 2016
8
0
100
200
300
400
500
600
700
800
900
1,000
US$
/OU
NCE
FORECAST FY2017 CAPEX SPEND (US$/OUNCE)
For
per
sona
l use
onl
y

9DUKETON RESERVE GROWTH
445,000 ounce (22%) increase in Ore Reserves in FY2016 net of depletion: Maiden Ore Reserves of 226,000 ounces at Gloster and 136,000 ounces at Baneygo; Addition of 81,000 ounces at Rosemont through extensional drilling and improved
optimisations; and Addition of 27,000 ounces at Moolart Well through infill drilling.
Tooheys Well discovery to progress through resource & reserve estimation in FY2017
9
Full breakdown of JORC compliant Ore Reserves is included in Appendix 1
Total Ore ReserveTonnes
(Mt)Gold Grade
(g/t)Gold Metal
(koz)31 March 2015 59.1 1.06 2,006
Depleted by Mining to 31/3/16 -10.6 0.96 -326
31 March 2015 Net of Depletion 48.5 1.08 1,68031 March 2016 60.8 1.09 2,125Increase net of Depletion +21% +22%
RESERVES INCREASE TO 2.13Moz – MORE THAN REPLACING FY16 PRODUCTION
For
per
sona
l use
onl
y

1010DUKETON EXPLORATION
Huge exploration effort in FY16: 155,000 metres drilled 20 projects ≈$15m spend
Delivering big rewards: +1.4Moz resources added/upgraded
Gloster, Baneygo & TW +400Koz reserves added
Gloster, Baneygo & Ops
Large tenure positionProximity to 10mtpa mill capacityKnown gold hosting structuresShallow & poorly tested
►Strong extensions expected to continue
DUKETON KEEPS GIVING
10F
or p
erso
nal u
se o
nly

11TOOHEYS WELL 11
Further details on maiden Tooheys Well Inferred Resource can be found in ASX announcement of 29 July 2016
Tonnes(Mt)
Gold Grade(g/t)
Gold Metal(koz)
Tooheys Well Inferred Mineral Resource at 0.4g/t lower cut 14.6 1.16 547
ORGANIC GROWTH CONTINUES – 547,000 OUNCE MAIDEN RESOURCE
For
per
sona
l use
onl
y

12TOOHEYS WELL
Resource above 1.0g/t cut-off is 6.7Mt at 1.77g/t for 379,000 ounces – 70% of quoted resource Indicative of the regular, wide intercepts of high grade mineralisation
Only 2.5km south of 5mtpa Garden Well processing plant and on a granted mining lease Clearly a compelling substantial, high grade mill feed satellite project opportunity for GW Infill drilling underway to update resource and form basis of Reserve estimation later in 2016
Tooheys Well shear zone extends 2kms north and 1km south and is poorly explored Prospective geology currently being drilled to north and south
Broader Garden Well shear zone extends 30km north of GW and 10km south Application of exploration methodology to broader package where the bulk of historic drilling
is ineffective (<50m hole depths) Less than $6 per resource ounce discovery cost
Cheapest growth option is in our own back yard
Tooheys Well maiden resource is confirmation of the value creation proposition presented by Regis’ targeted and aggressive organic growth strategy at Duketon
12
Further details on maiden Tooheys Well Inferred Resource can be found in ASX announcement of 29 July 2016
Tonnes(Mt)
Gold Grade(g/t)
Gold Metal(koz)
Tooheys Well Inferred Mineral Resource at 0.4g/t lower cut 14.6 1.16 547
ORGANIC GROWTH CONTINUES – 547,000 OUNCE MAIDEN RESOURCE
For
per
sona
l use
onl
y
1313
Steep E dipping high grade gold shear
Chert BIF and shale host rocks Weathered 80-160m Significant intercepts 39m @ 2.86g/t from 53m 17m @1.90g/t from 95m 27m @ 2.48g/t from 55m 50m @ 2.75g/t from 85m 53m @ 1.72g/t from 245m 34m @ 1.45g/t from 203m 17m @ 1.92g/t from 155m Fresh rock intersections Good widths of mineralisation
at depth
13TOOHEYS WELL GOLD PROSPECT
DRILLING CROSS SECTION6909340mN
For
per
sona
l use
onl
y

141414EXPLORATION UPSIDETOOHEYS WELL-GARDEN WELL CORRIDOR
UNTESTED POTENTIAL NORTH & SOUTH OF TOOHEYS WELL
North TW structure interpreted to join gold shear
zones at Chert Ridge (GW) 2.5km north. Early drilling encouraging: 15m @1.15g/t & 25m @ 1.41g/t
Drilling planned for Q2 4 lines, 320m strike, 22 holes +3,000m
South TW mineralisation located on the northern
flank of a >1km long magnetic high Southern half of MAG high under cover and
poorly drilled Q1 - 9 holes (1,264m) 300m south of TW EM survey in Q2 to help refine model &
locate pyrrhotite host unit within BIF Follow with better targeted drilling in Q3
For
per
sona
l use
onl
y

15
REGIS RESOURCES LTD
PAUL THOMASCHIEF OPERATING OFFICER
15F
or p
erso
nal u
se o
nly
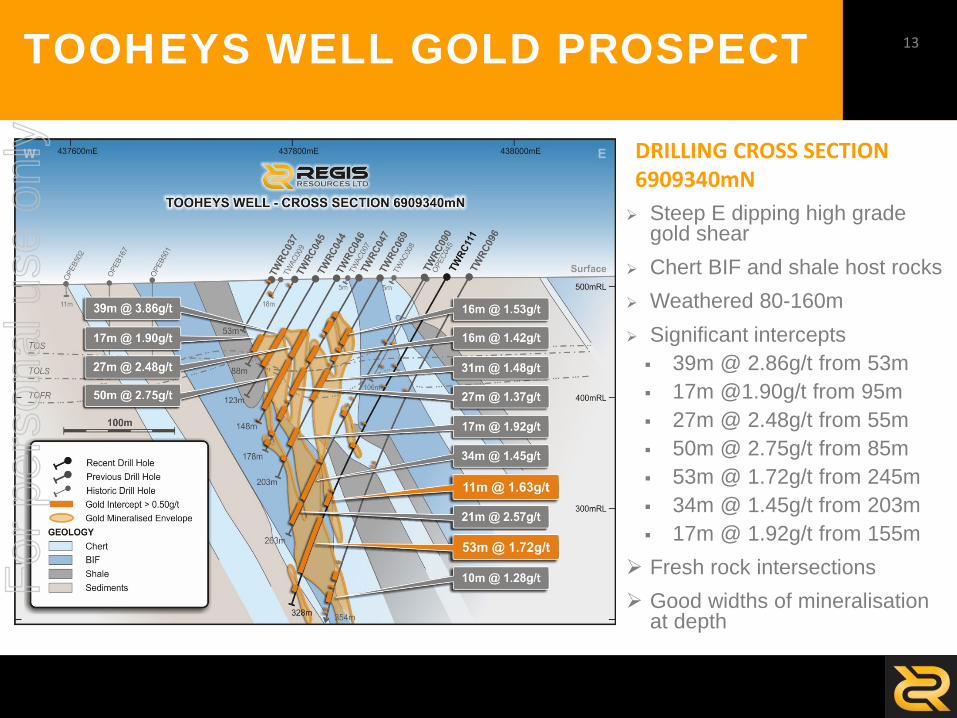
16REVIEW OF FY2016 OPERATIONS
PRODUCTION ABOVE GUIDANCE & DELIVERING STRONG CASHFLOW
OPERATIONS FY16 production 305,084 ounces
Slightly lower (2%) than FY15 due to lower scheduled grade, particularly at Moolart Well
Above upper end of FY16 guidance of 275-305koz
COSTS FY16 cash costs $773/oz & AISC $927/oz
Both 6% lower than FY15 - cost efficiencies continue Below lower end of FY16 guidance
OPERATING CASH-FLOW FY16 operating cashflow $233.4m (FY15: $150.9m)
16
FY16 FY15
Ore mined (Mbcm) 4.63 4.65
Waste mined (Mbcm) 22.62 23.70
Stripping ratio (w:o) 4.89 5.10
Ore mined (Mtonnes) 10.79 11.07
Ore milled (Mtonnes) 10.25 9.84
Head grade (g/t) 1.03 1.11
Recovery (%) 90 88
Gold production (ounces ‘000) 305 310
Cash cost (A$/oz) 773 826
Cash cost inc royalty (A$/oz) 845 891
All in Sustaining Cost (A$/oz)1 927 994
1 AISC calculated on a per ounce of production basis.2 Operating cash flow is quoted under the Appendix 5B classification protocol and as such does not include payments for pre-strip and
deferred mining costs as these are classified as investing activities.
For
per
sona
l use
onl
y

17OPERATIONS OUTLOOK
FY2017 GUIDANCE Gold production 300,000 – 330,000 ounces Cash costs $840 – $910 per ounce AISC $980 – $1,050 per ounce
Growth Capex: $27mMajor components of growth capital:• Gloster pre-production capital $7m• Erlistoun pre-production capital $2m• Erlistoun pre-production mining $7m• Rosemont expansion mine cutback $7m
FY17 production guidance higher than FY16 range of 275-305koz and FY2016 actual of 305koz Impact of positive grade impact of new operations Optimisation to steady state of current operations
FY17 AISC guidance consistent with FY16 range of A$970-A$1,070 Guidance range slightly higher than FY16 actual A$927/oz
due to early waste stripping requirements of start up operations Gloster and Erlistoun.
17F
or p
erso
nal u
se o
nly

1818FAMOUS BLUE GEOLOGY
Simple low strip open cut mining and road haulage operation
Low startup capex - $7m in FY2017. More than 3 years additional mill feed
to the Moolart Well processing plant Expected to contribute approx. 50koz
of production in FY2017 AISC in FY17 < $1,000/oz
GLOSTER GOLD PROJECT 18
MOVING TOWARDS PRODUCTION
All statutory approvals for development in place
Road construction, MW camp expansion and haulage laydown complete
Mining underway and first pass grade control drilling completed
Ore stockpiling and haulage to Moolart Well processing plant commenced
Production in Q2
Ore haulage road construction underway
For
per
sona
l use
onl
y

19EXPLORATION
Completed 51,268m (Q4: 37,179m) of drilling on 12 gold projects Tooheys Well – 2.5km S of Garden Well
• RC drilling continues to return high grades• EM survey & extensional drilling in Q2
Rosemont South• Strong intercepts outside current reserves• Opportunity to add O/P & U/G inventory• Drilling continuing (6,000m)
Rosemont Main• 14,000m programme underway to test U/G
targets below pit design Gloster – 26km W of Moolart Well
• Extensional 10m @ 3.95g/t to follow up Q2 DGE JV
• 19,000m drilled & follow up on drilling & lag soil anomalies
SIGNIFICANT RESULTS AT DUKETON IN SEPT16Q
19
Proximity to 10mtpa milling infrastructure presents excellent exploration opportunity
For
per
sona
l use
onl
y

202020ROSEMONT SOUTH PROJECT
POTENTIAL FOR OPEN PIT & UNDERGROUND MINING INVENTORY EXTENSION Testing high grade shoots 50-300m below surface over 500m strike, some outside reserves Drilled 47 holes for 4,643m in Q1 Significant results pointing to both open pit and underground opportunities 10 holes (2,000m) remaining in phase 1 programme then 12 holes for 4,000m in phase 2
For
per
sona
l use
onl
y

2121
* Intercept is outside current reserves
21ROSEMONT SOUTH PROJECT
DRILL RESULTS IN Q1Gold hosted in a steeply east dipping 345°
trending quartz-dolerite unit Gold mineralised quartz-dolerite unit is
approx 80m wide.Q1 Results 10m @ 30.11g/t Au from 48m 4m @ 7.72g/t Au from 52m 2m @ 18.48g/t Au from 74m 13m @ 2.61g/t Au from 126m* 17m @ 4.41g/t Au from 153m* 29m @ 3.81g/t Au from 175m*, including:
• 5m @ 8.54g/t Au from 175m*• 6m @ 4.95g/t Au from 188m*• 3m @ 6.92g/t Au from 201m*
9m @ 3.60g/t Au from 107m
For
per
sona
l use
onl
y
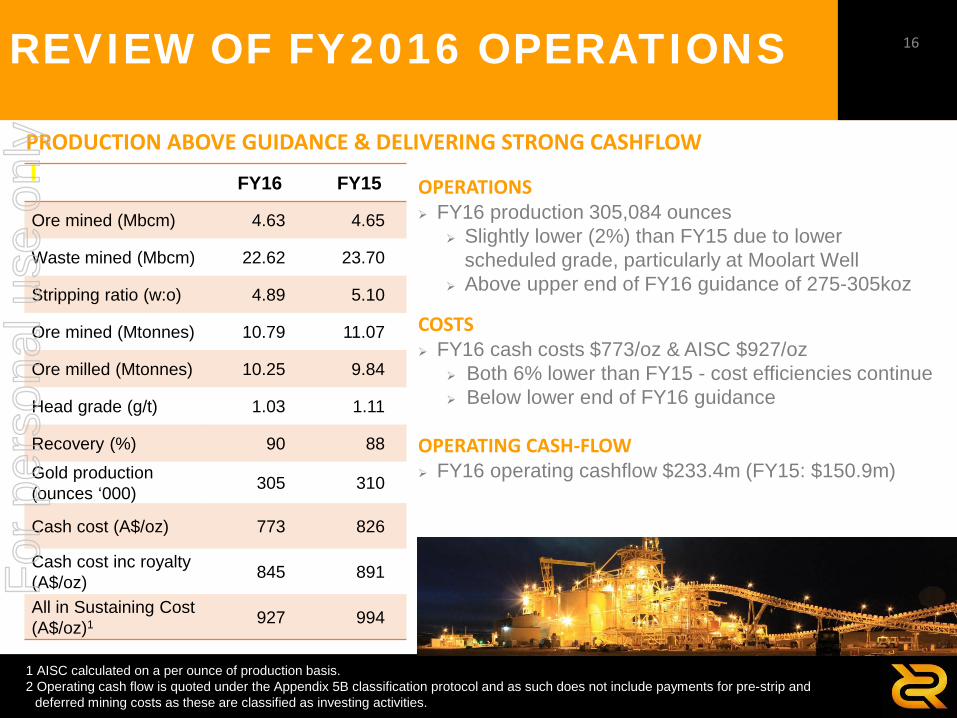
222222ROSEMONT - UNDERGROUND
DRILLING UNDERWAY TO TEST UNDERGROUND POTENTIAL BELOW ROSEMONT MAIN PIT Numerous high grade exploration and resource-def intercepts below RMT pit design Good understanding of orientation and control of high grade zones in mining grade control Drilling from within pit - shorten holes and can use RC rather than DD – save time & $$ 62 hole programme for ≈ 14,000m underway
3D long section from south east showing planned Rosemont South & Main drilling, phase 1 and 2
For
per
sona
l use
onl
y

23
REGIS RESOURCES LTD
KIM MASSEYCHIEF FINANCIAL OFFICER
23F
or p
erso
nal u
se o
nly

242016 FINANCIAL HIGHLIGHTS 24
NPAT up 29% to $112 million
Revenue up 8% to $502 million
EBITDA up 29% to $234 million
Net cash and bullion increased
by $78 million
Full year dividend of 13 cents per share
For
per
sona
l use
onl
y

25STRONG PERFORMANCE ON ALL PROFIT MEASURES
FY2014 NPAT, EBITDA & EPS adjusted to underlying result by excluding $202.7m after tax impairment charge
25
372465 502
0
100
200
300
400
500
600
2014 2015 2016
$ M
ILLI
ON
S
Revenue
55
87
112
0
20
40
60
80
100
120
2014 2015 2016
$ M
ILLI
ON
S
Net Profit After Tax
141181
234
37.9% 39.0%
46.7%
35%
40%
45%
50%
050
100150200250
2014 2015 2016 EBIT
DA/R
EVEN
UE
(%)
$ M
ILLI
ON
S
EBITDA
EBITDA EBITDA Margin (%)
11.0
17.4
22.4
0
6
13
0
10
20
30
2014 2015 2016
CEN
TS P
ER S
HARE
Earnings & Dividend Per Share
EPS Dividend per share
For
per
sona
l use
onl
y

26STRONG OPERATING MARGIN 26
Growing operating margin from disciplined cost control and increasing AUD gold price.
Renegotiation of mining contract and hedging of diesel.
Over 12 months of gold hedging available to maintain operating margin.
$0/oz
$400/oz
$800/oz
$1,200/oz
$1,600/oz
Jun 15 Sep-15 Dec-15 Mar-16 Jun-16 Sep-16
Operating Margin
Cash cost after royalty AISC gold price hedge price
For
per
sona
l use
onl
y

27CASHFLOW WATERFALL
1 Operating cash flow differs from the statutory Statement of Cash Flow “net cash from operating activities” as it is quoted under the Appendix 5B classification protocol and includes movement in gold bullion on hand.
27
$64.5m
$123.3m
$233.4m 1 ($50.0m)
($35.2m)
($20.0m)($18.1m)
($21.3m)($22.9m)
($1.8m) ($5.2m)
-
$50m
$100m
$150m
$200m
$250m
$300m
$350m Cash & Gold on Hand Movements - FY2016
Strong cash-flow from operations of $233.4m for FY2016 allowed full debt repayment ($20m) and dividend payment ($50m).
For
per
sona
l use
onl
y

28DIVIDEND
2016
Final dividend declared 9 cents per share fully franked ($45 million)Paid 31 August 2016
Interim dividend 4 cps fully franked ($20m paid February 2016)
Full year (13cps) payout key metrics: 13% of FY16 revenue 3.2% basic dividend yield* 4.6% grossed up (for 100% franking) dividend yield*
* Based on share price of $4.03
Regis has paid 34 cps - $170 million in dividends since 2013 Regis is an Australian gold industry leader on dividend payment metrics
28
COMMITMENT TO DIVIDENDS
For
per
sona
l use
onl
y

29
REGIS RESOURCES LTD
MARK CLARKEXECUTIVE CHAIRMAN
29F
or p
erso
nal u
se o
nly

30McPHILLAMYS (NSW) 30
Bathurst
WWTW
McPhillamys Gold Project
For
per
sona
l use
onl
y

31McPHILLAMYS (NSW)INFILL DRILLING UNDERWAY FOR PFS Located Central-West NSW
• Well established gold mining district• Cadia, Cowal, Northparkes +45Moz*
Gold resource 2.2Moz - 100% Regis Conceptual studies show viable project Infill Drilling Underway
• 25,000m ($3m) infill drill programme• 2 diamond rigs working & 1 RC to follow• Weather hampered Q1 drilling• 5-6 month programme• Reduce drill pattern to 50x25m (nominal)• Basis for resource update & ultimately reserve
estimate• DD core for metallurgical studies
Moving towards PFS• Focus on securing key infrastructure• Advancing other long lead PFS/EIS works
Medium term development proposition
31
* Recent quoted resources from public information
For
per
sona
l use
onl
y

32REGIS TARGETS & OUTLOOK2016 GoalsProduction 275-305koz
AISC $970-1,050/ozOperating cashflow $150mOrganic reserve growth
Exploration-resource pipeline
Regional Duketon acquisitions
Commitment to dividends
McPhillamys development
32
2016 ActualProduction 305.1kozFY17 guidance 300,000 – 330,000 ouncesMedium term production targets risingAISC $927/ozOperating cashflow $233.4mAdded 445koz (+22% net of depletion)More than replacing productionMost recently +547koz resource at Tooheys WellInfill drilling underway & maiden Reserve pendingDrilling TW for extensions & other shear zonesBought Gloster for $1.5m + royaltyNow mining – reserve 226koz @ AISC c$1,000/oz$95m dividends paid & declaredIndustry leading yieldProgress made on infrastructure but not boltedProgressing to PFS - $3m of works approved
Regis is very well positioned to continue growth and shareholder returns
For
per
sona
l use
onl
y
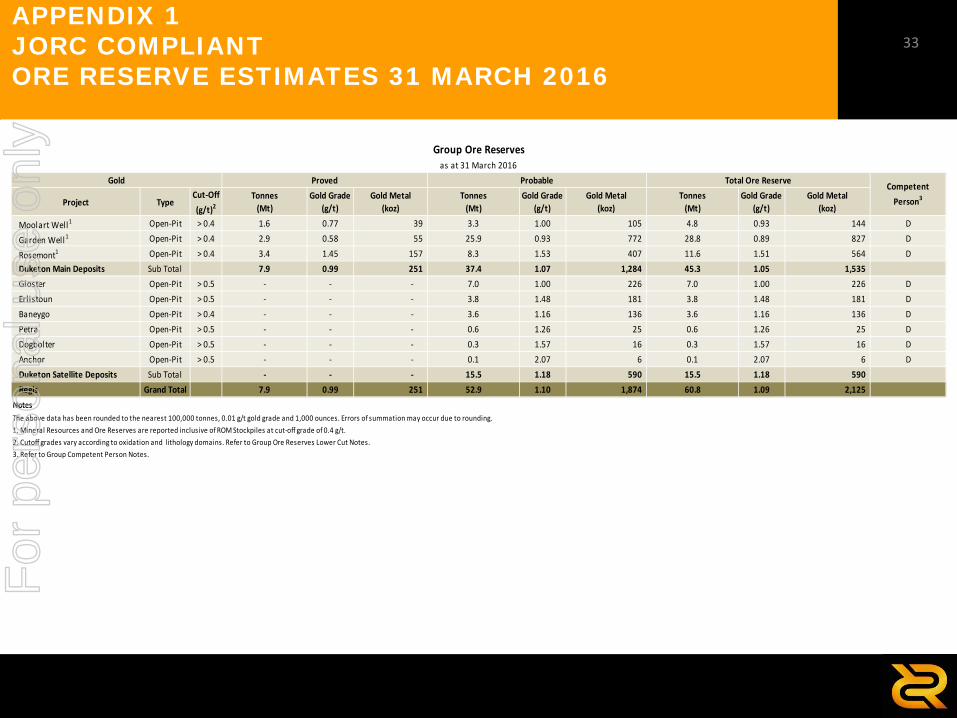
33APPENDIX 1JORC COMPLIANTORE RESERVE ESTIMATES 31 MARCH 2016
33
Project TypeCut-Off(g/t)2
Tonnes(Mt)
Gold Grade(g/t)
Gold Metal(koz)
Tonnes(Mt)
Gold Grade(g/t)
Gold Metal(koz)
Tonnes(Mt)
Gold Grade(g/t)
Gold Metal(koz)
Moolart Well1 Open-Pit > 0.4 1.6 0.77 39 3.3 1.00 105 4.8 0.93 144 D
Garden Well1 Open-Pit > 0.4 2.9 0.58 55 25.9 0.93 772 28.8 0.89 827 D
Rosemont1 Open-Pit > 0.4 3.4 1.45 157 8.3 1.53 407 11.6 1.51 564 DDuketon Main Deposits Sub Total 7.9 0.99 251 37.4 1.07 1,284 45.3 1.05 1,535 Gloster Open-Pit > 0.5 - - - 7.0 1.00 226 7.0 1.00 226 DErlistoun Open-Pit > 0.5 - - - 3.8 1.48 181 3.8 1.48 181 DBaneygo Open-Pit > 0.4 - - - 3.6 1.16 136 3.6 1.16 136 DPetra Open-Pit > 0.5 - - - 0.6 1.26 25 0.6 1.26 25 DDogbolter Open-Pit > 0.5 - - - 0.3 1.57 16 0.3 1.57 16 DAnchor Open-Pit > 0.5 - - - 0.1 2.07 6 0.1 2.07 6 DDuketon Satellite Deposits Sub Total - - - 15.5 1.18 590 15.5 1.18 590 Regis Grand Total 7.9 0.99 251 52.9 1.10 1,874 60.8 1.09 2,125
Notes
3. Refer to Group Competent Person Notes.2. Cutoff grades vary according to oxidation and lithology domains. Refer to Group Ore Reserves Lower Cut Notes.1. Mineral Resources and Ore Reserves are reported inclusive of ROM Stockpiles at cut-off grade of 0.4 g/t.
Group Ore Reserves
Gold Proved Probable Total Ore Reserve Competent Person3
as at 31 March 2016
The above data has been rounded to the nearest 100,000 tonnes, 0.01 g/t gold grade and 1,000 ounces. Errors of summation may occur due to rounding.
For
per
sona
l use
onl
y

34APPENDIX 2JORC COMPLIANT MINERAL RESOURCES 31 MARCH 2016
34
Project Type Cut-Off(g/t)
Tonnes(Mt)
Gold Grade(g/t)
Gold Metal(koz)
Tonnes(Mt)
Gold Grade(g/t)
Gold Metal(koz)
Tonnes(Mt)
Gold Grade(g/t)
Gold Metal(koz)
Tonnes(Mt)
Gold Grade(g/t)
Gold Metal(koz)
Moolart Well1 Open-Pit 0.4 1.9 0.72 45 24.9 0.74 596 9.3 0.62 184 36.1 0.71 825 A
Garden Well1 Open-Pit 0.4 2.9 0.58 55 64.8 0.89 1,859 8.0 0.89 228 75.8 0.88 2,141 B
Rosemont1 Open-Pit 0.4 4.5 1.42 204 20.5 1.42 938 3.0 1.95 189 28.0 1.48 1,331 BDuketon Main Deposits Sub Total 9.4 1.01 303 110.2 0.96 3,393 20.3 0.92 600 139.8 0.96 4,297
Tooheys Well3 Open-Pit 0.0 - - - - - - 14.6 1.16 547 14.6 1.16 547 AGloster Open-Pit 0.4 - - - 14.7 0.79 374 6.6 0.73 154 21.3 0.77 528 ABaneygo Open-Pit 0.4 - - - 9.2 0.96 283 1.9 0.95 57 11.1 0.96 340 AErlistoun Open-Pit 0.4 - - - 5.7 1.34 247 1.1 1.00 37 6.9 1.28 284 ADogbolter Open-Pit 0.4 - - - 3.5 1.11 128 0.5 1.02 16 4.0 1.10 144 ARussells Find Open-Pit 0.4 - - - 2.1 1.07 71 0.3 0.90 10 2.4 1.05 81 APetra Open-Pit 0.4 - - - 1.2 1.08 42 0.1 1.09 2 1.3 1.08 44 AKing John Open-Pit 0.4 - - - - - - 0.8 1.56 42 0.8 1.56 42 AReichelts Find Open-Pit 0.4 - - - - - - 0.8 1.11 28 0.8 1.11 28 AAnchor Open-Pit 0.4 - - - 0.2 1.75 9 0.1 0.95 2 0.2 1.53 11 ADuketon Satellite Deposits Sub Total - - - 36.6 0.98 1,155 26.8 1.04 895 63.4 1.01 2,049 Duketon Total 9.4 1.01 303 146.8 0.96 4,548 47.1 0.99 1,495 203.2 0.97 6,346 McPhillamys Total 0.4 - - - 69.2 0.94 2,087 3.9 0.98 123 73.2 0.94 2,210 BRegis Grand Total 9.4 1.01 303 216.0 0.96 6,635 51.0 0.99 1,618 276.4 0.96 8,556
NotesThe above data has been rounded to the nearest 100,000 tonnes, 0.01 g/t gold grade and 1,000 ounces. Errors of summation may occur due to rounding.All Mineral Resources are reported inclusive of Ore Reserves to JORC Code 2012 unless otherwise noted.
Group Mineral Resourcesas at 31 March 2016
Gold Measured Indicated Inferred Total Resource Competent Person2
1. Mineral Resources and Ore Reserves are reported inclusive of ROM Stockpiles at cut-off grade of 0.4 g/t.2. Refer to Group Competent Person Notes.3. As reported 29th July 2016
For
per
sona
l use
onl
y