Embed Size (px)
Citation preview
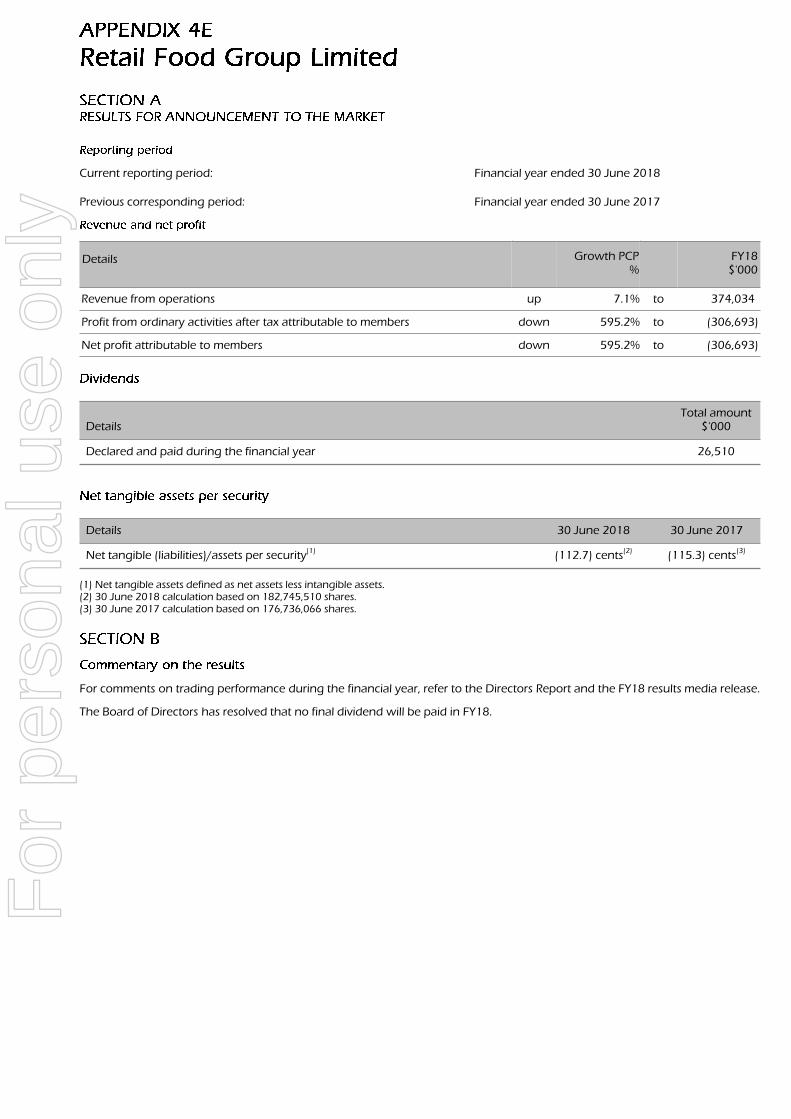
Current reporting period: Financial year ended 30 June 2018
Previous corresponding period: Financial year ended 30 June 2017
Details Growth PCP%
FY18$'000
Revenue from operations up 7.1% to 374,034
Profit from ordinary activities after tax attributable to members down 595.2% to (306,693)
Net profit attributable to members down 595.2% to (306,693)
DetailsTotal amount
$'000
Declared and paid during the financial year 26,510
Details 30 June 2018 30 June 2017
Net tangible (liabilities)/assets per security(1) (112.7) cents(2) (115.3) cents(3)
(1) Net tangible assets defined as net assets less intangible assets.(2) 30 June 2018 calculation based on 182,745,510 shares.(3) 30 June 2017 calculation based on 176,736,066 shares.
For comments on trading performance during the financial year, refer to the Directors Report and the FY18 results media release.
The Board of Directors has resolved that no final dividend will be paid in FY18.
For
per
sona
l use
onl
y
Retail Food Group Limited ACN 106 840 082Annual Financial Report - Financial Year Ended 30 June 2018
PageSUMMARY FINANCIAL INFORMATION 1CORPORATE DIRECTORY 2DIRECTORS' REPORT 3AUDITOR'S INDEPENDENCE DECLARATION 27CONSOLIDATED STATEMENT OF PROFIT OR LOSS AND OTHER COMPREHENSIVE INCOME 28CONSOLIDATED STATEMENT OF FINANCIAL POSITION 29CONSOLIDATED STATEMENT OF CHANGES IN EQUITY 30CONSOLIDATED STATEMENT OF CASH FLOWS 31NOTES TO THE FINANCIAL STATEMENTS 32ADDITIONAL STOCK EXCHANGE INFORMATION 100
For
per
sona
l use
onl
y
SUMMARY FINANCIAL INFORMATION
Retail Food Group Limited – Annual Report – Financial Year Ended 30 June 2018 Page 1
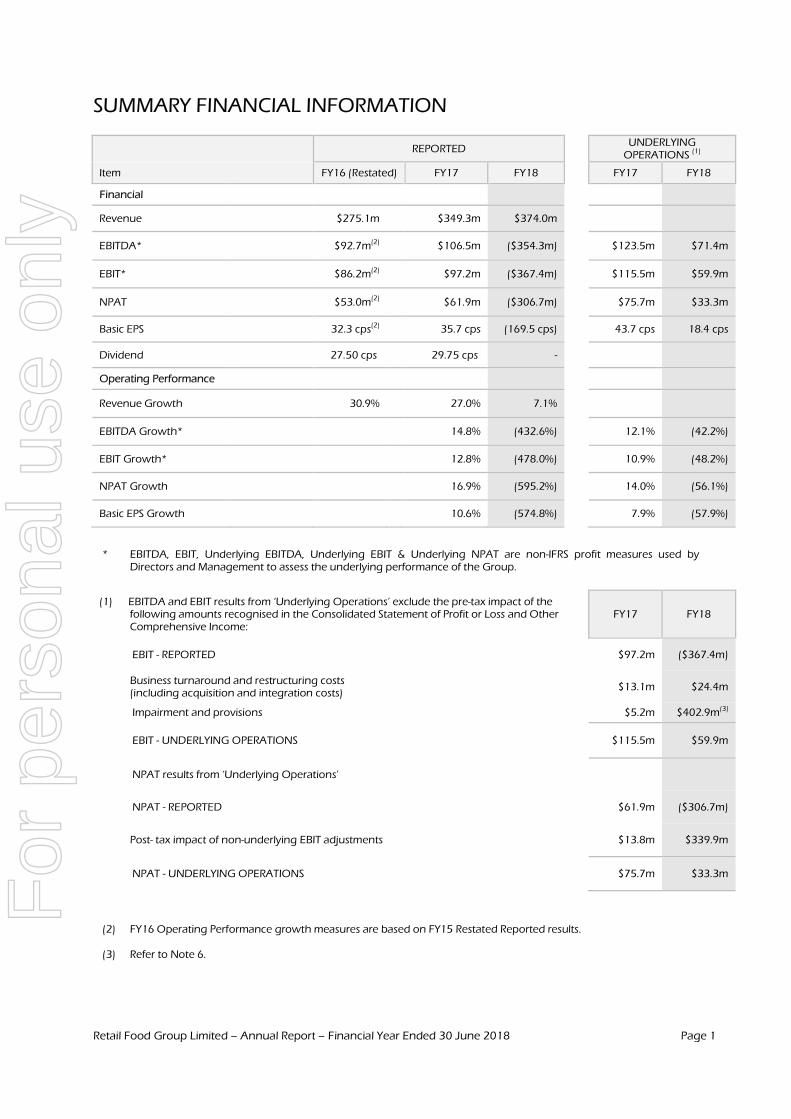
REPORTED UNDERLYING
OPERATIONS (1)
Item FY16 (Restated) FY17 FY18 FY17 FY18
Financial
Revenue $275.1m $349.3m $374.0m
EBITDA* $92.7m(2) $106.5m ($354.3m) $123.5m $71.4m
EBIT* $86.2m(2) $97.2m ($367.4m) $115.5m $59.9m
NPAT $53.0m(2) $61.9m ($306.7m) $75.7m $33.3m
Basic EPS 32.3 cps(2) 35.7 cps (169.5 cps) 43.7 cps 18.4 cps
Dividend 27.50 cps 29.75 cps -
Operating Performance
Revenue Growth 30.9% 27.0% 7.1%
EBITDA Growth* 14.8% (432.6%) 12.1% (42.2%)
EBIT Growth* 12.8% (478.0%) 10.9% (48.2%)
NPAT Growth 16.9% (595.2%) 14.0% (56.1%)
Basic EPS Growth 10.6% (574.8%) 7.9% (57.9%)
* EBITDA, EBIT, Underlying EBITDA, Underlying EBIT & Underlying NPAT are non-IFRS profit measures used by Directors and Management to assess the underlying performance of the Group.
(1) EBITDA and EBIT results from ‘Underlying Operations’ exclude the pre-tax impact of the following amounts recognised in the Consolidated Statement of Profit or Loss and Other Comprehensive Income:
FY17 FY18
EBIT - REPORTED
$97.2m ($367.4m)
Business turnaround and restructuring costs (including acquisition and integration costs)
$13.1m $24.4m
Impairment and provisions
$5.2m $402.9m(3)
EBIT - UNDERLYING OPERATIONS
$115.5m $59.9m
NPAT results from ‘Underlying Operations’
NPAT - REPORTED
$61.9m ($306.7m)
Post- tax impact of non-underlying EBIT adjustments
$13.8m $339.9m
NPAT - UNDERLYING OPERATIONS
$75.7m $33.3m
(2) FY16 Operating Performance growth measures are based on FY15 Restated Reported results.
(3) Refer to Note 6.
For
per
sona
l use
onl
y
Mr Colin ArcherChairman and Independent Non-Executive Director
Ms Jessica BuchananIndependent Non-Executive Director
Mr Stephen LonieIndependent Non-Executive Director
Ms Kerry RyanIndependent Non-Executive Director
Mr Russell ShieldsIndependent Non-Executive Director
Mr Anthony (Tony) AlfordNon-Independent Non-Executive Director - Resigned 3 July2017
Mr Andre NellExecutive Managing Director - Resigned 29 May 2018
Mr Anthony Mark Connors LLB
RFG House1 Olympic CircuitSouthport QLD 4215
Computershare Investor ServicesLevel 1200 Mary StreetBrisbane QLD 4000
McCullough Robertson LawyersLevel 11, 66 Eagle StreetBrisbane QLD 4000
PricewaterhouseCoopers480 Queen StBrisbane QLD 4000
National Australia Bank LimitedLevel 20, 100 Creek StreetBrisbane QLD 4000
Westpac Banking CorporationLevel 7, 260 Queen StreetBrisbane QLD 4000
Retail Food Group Limited (ASX: RFG) shares are listed on theAustralian Securities Exchange
www.rfg.com.au
Retail Food Group Limited - Annual Report - Financial Year Ended 30 June 2018 Page 2
For
per
sona
l use
onl
y
The Directors of Retail Food Group Limited (referred to hereafter as the Company) submit herewith the Annual Report of theCompany for the financial year ended 30 June 2018 in accordance with the provisions of the .
Name ParticularsMr Colin Archer Independent Non-Executive Director and Chairman, Bachelor of Economics, Dip. Financial
Planning, Chartered Accountant. Mr Archer joined the Board on 12 April 2006 and wasappointed Chairman of the Board on 30 April 2013. Mr Archer is a member of the Company’sAudit and Risk Management Committee and Chairman of the Nominations and RemunerationCommittees. Mr Archer was re-elected to the Board at the Company’s AGM held on 30 November2017, following retirement by rotations.
Ms Jessica Buchanan Independent Non-Executive Director. Ms Buchanan joined the Board on 29 May 2012. MsBuchanan has circa 20 years’ experience in branding, marketing and advertising, havingcommenced her career in the advertising industry working with multi-national agencies such asWunderman, Young & Rubicam Mattingly and EHS Brann (UK). Ms Buchanan also managedcampaigns for various blue chip companies including Ericsson, Tabcorp, Du Pont, CadburySchweppes, The Australian Defence Force, British Gas and BMW. Ms Buchanan then went on tobecome Brand Director at Boost Juice, helping that business grow from 20 to 120 outlets.Subsequently, Ms Buchanan established and then sold a brand agency and digital researchbusiness that worked predominantly with retail and franchised groups, including Woolworths,Cotton On Group, Katies, Millers, Healthy Habits, Wasabi Warriors, Mr Rental, Oriental Teahouse,Hairhouse Warehouse and others. Ms Buchanan currently sits on the advisory boards of NarellanPools (a franchised business) and YomConnect (a Digital Agency), and is a former non-executivedirector of bakery franchisor Banjo’s Bakehouse. Ms Buchanan is a member of the Company’sNominations and Remuneration Committees, and was last re-elected to the Board at theCompany’s AGM held on 26 November 2015, following retirement by rotations.
Mr Stephen Lonie Independent Non-Executive Director, Bachelor of Commerce, MBA, FCA, FFin, FAICD, FIMCA. MrLonie joined the Board on 24 June 2013. Mr Lonie is a Chartered Accountant by profession andDirector of listed corporations, MyState Limited, Corporate Travel Management Limited and ApolloTourism & Leisure Limited. Mr Lonie is the Chairman of the Company’s Audit and RiskManagement Committee and a member of the Nominations and Remuneration Committees. MrLonie was last re-elected to the Board at the Company’s AGM held on 30 November 2016,following retirement by rotations.
Ms Kerry Ryan Independent Non-Executive Director, Bachelor of Laws and Bachelor of Arts (major ininternational relations). Ms Ryan joined the Board on 27 August 2015. Ms Ryan's professionalbackground is in commercial law, and she has extensive experience across international marketsin the retail and franchise areas. She is a Director of the Richmond Football Club and its healthand fitness business Aligned Leisure, and she is a member of the Advisory Board of Lexvoco, alegal services and consultancy business. Ms Ryan is a Fellow of the Australian Institute of CompanyDirectors and a Fellow of the Governance Institute of Australia. She is a member of the LawInstitute of Victoria.
Mr Russell Shields Independent Non-Executive Director, Fellow of The Australian Institute of Company Directors,Director of Eclipx and Aquis Entertainment. Mr Shields joined the Board on 18 December 2015.Mr Shields is an experienced banker with extensive knowledge of retail, corporate, institutionaland investment banking both in Australia and Asia. Mr Shields has in excess of 35 years'experience in the finance, economics and property industries. Mr Shields is a member of theCompany's Audit & Risk Management Committee.
Mr Anthony (Tony) Alford Non-Independent Non-Executive Director, Bachelor of Business (Accountancy), CPA and CTA. MrAlford joined the Board on 28 October 2003. Mr Alford was a Chartered Accountant and has inexcess of 20 years' experience in public practice. Mr Alford commenced his involvement withRetail Food Group Limited in 1994 in an advisory role, thereafter becoming the Group FinancialController. Mr Alford was appointed Executive Managing Director of the Group in December1999, a position held until his transition to Non-Independent Non-Executive Director on 1 July2016. Mr Alford resigned from the Board on 3 July 2017.
Mr Andre Nell Executive Managing Director. Mr Nell joined the Board on 1 July 2016. Mr Nell commenced hisinvolvement with Retail Food Group Limited in 2007 following the Group’s acquisition of Michel’sPatisserie, and subsequently held a variety of key roles within the Company, including Head ofCommercial, Chief Operating Officer and Chief Executive Officer – Franchise prior to hisappointment to Managing Director on 1 July 2016. Mr Nell is a Chartered Accountant and has awealth of experience in the successful operation and expansion of franchise networksinternationally. Mr Nell resigned from the Board on 29 May 2018.
Retail Food Group Limited - Annual Report - Financial Year Ended 30 June 2018 Page 3
For
per
sona
l use
onl
y
Directorships of other listed companies held by Directors in the 3 years immediately before the end of the financial year are asfollows:
Name Company Period of Directorship
Mr Stephen Lonie Corporate Travel Management Limited 23 June 2010 to present
MyState Limited 12 December 2011 to present
Apollo Tourism & Leisure Limited 20 September 2016 to present
Mr Russell Shields Eclipx Group Limited 24 March 2015 to present
Aquis Entertainment Limited 7 August 2015 to present
The following table sets out each Director’s relevant interest in shares and options in shares of the Company as at the date of thisreport:
Directors Fully paid ordinaryshares
Number
Mr Colin Archer 391,084
Ms Jessica Buchanan 11,628
Mr Stephen Lonie 54,195
Ms Kerry Ryan 10,000
Mr Russell Shields 7,752
Information about the remuneration of Directors and Key Management Personnel is set out in the Remuneration Report of thisDirectors' Report.
During and since the end of the financial year, there were no share options granted to the Directors and senior executivemanagement of the Company as part of their remuneration.
Performance Rights were granted to senior executive management on 14 July 2016 under the Company's former PerformanceRights Plan with respect to the FY16, FY17, FY18 and FY19 performance periods.
The following table sets out the number of Directors’ meetings, including meetings of standing Committees of Directors, heldduring the financial year and the number of meetings attended by each Director, while they were a Director or Committeemember. During the financial year, 26 Board meetings, 12 Audit and Risk Management Committee meetings, 4 RemunerationCommittee meetings and 5 Nominations Committee meetings were held.
Directors Board of Directors Audit Committee RemunerationCommittee
NominationsCommittee
Held Attended Held Attended Held Attended Held Attended
Mr Colin Archer 26 25 12 11 4 4 5 5
Ms Jessica Buchanan 26 26 - - 4 4 5 5
Mr Stephen Lonie 26 19 12 11 4 3 5 4
Ms Kerry Ryan 26 26 12 12 - - - -
Mr Russell Shields 26 23 12 11 - - - -
Mr Andre Nell 25 24 - - - - - -
Mr Anthony Alford - - - - - - - -
Retail Food Group Limited - Annual Report - Financial Year Ended 30 June 2018 Page 4
For
per
sona
l use
onl
y
The Company Secretary is Mr Anthony Mark Connors. Mr Connors was appointed as Company Secretary on 26 April 2006,having prior to that time and until 2 June 2015 acted as the Company’s Legal Counsel. Mr Connors also held the role of ChiefOperating Officer, from 2 June 2015 to 9 March 2016 until he was appointed to the role of Director of Corporate Services on 10March 2016.
The Company is committed to achieving and demonstrating the highest standards of corporate governance. The Company hasreviewed its corporate governance practices against the Corporate Governance Principles and Recommendations (3rd edition)published by the ASX Corporate Governance Council. The 2018 Corporate Governance Statement is dated as at 30 June 2018and reflects the corporate governance practices in place throughout the 2018 financial year. The 2018 Corporate GovernanceStatement was approved by the Board on 31 August 2018. A description of the Group's current Corporate Governance Practicesis set out in the Group's Corporate Governance Statement which can be viewed at www.rfg.com.au.
The Group’s principal activities during the course of the financial year were:
• Intellectual property ownership of the Donut King, bb’s café, Brumby’s Bakery, Michel’s Patisserie, Esquires Coffee Houses(Australia & New Zealand), Pizza Capers Gourmet Kitchen, Crust Gourmet Pizza Bar, The Coffee Guy, Café2U, Gloria Jean’sCoffees, It’s A Grind and Di Bella Coffee Brand Systems;
• Development and management of the Donut King, bb’s café, Brumby’s Bakery, Michel’s Patisserie, Esquires Coffee Houses(Australia & New Zealand), Pizza Capers Gourmet Kitchen, Crust Gourmet Pizza Bar, The Coffee Guy, Café2U, Gloria Jean’sCoffees, It’s A Grind and Di Bella Coffee Brand Systems throughout the world, whether directly managed and/or aslicensor for all Brand Systems;
• Development and management of the coffee roasting facilities and the wholesale supply of coffee and allied products tothe existing Brand Systems and third party accounts under the Di Bella Coffee brand; and
• Development and management of the procurement, warehousing, manufacturing and distribution business under theHudson Pacific Food Service, Dairy Country, Bakery Fresh and Associated Food Service brands.
Retail Food Group Limited - Annual Report - Financial Year Ended 30 June 2018 Page 5
For
per
sona
l use
onl
y
This review contains forward looking statements, including statements of current intention, statements of opinion andpredictions as to possible future events and future financial prospects. Such statements are not statements of fact and there canbe no certainty of outcome in relation to the matters to which the statements relate. Forward looking statements involve knownand unknown risks, uncertainties, assumptions and other important factors that could cause the actual outcomes to be materiallydifferent from the events or results expressed or implied by such statements, and the outcomes are not all within the control ofRFG. Statements about past performance are not necessarily indicative of future performance.
Neither RFG nor any of its subsidiaries, affiliates and associated companies (or any of their respective officers, employees oragents) (the ‘Relevant Persons’) makes any representation, assurance or guarantee as to the accuracy or likelihood of fulfilmentof any forward looking statement or any outcomes expressed or implied in any forward looking statement. The forward lookingstatements in this review reflect views held only at the date hereof and except as required by applicable law or the ASX ListingRules, the Relevant Persons disclaim any obligation or undertaking to publicly update any forward looking statements, ordiscussion of future financial prospects, whether as a result of new information or future events.
This review refers to RFG’s financial results, including RFG’s statutory performance and underlying performance. RFG’s statutoryperformance contains a number of items that when excluded provide a different perspective on the financial and operationalperformance of the business. Income Statement amounts, presented on an underlying basis such as Underlying NPAT, arenon-IFRS financial measures, and exclude the impact of these items consistent with the manner in which senior managementreviews the financial and operating performance of the business. Each underlying measure disclosed has been adjusted toremove the impact of these items on a consistent basis. A reconciliation and description of the items that contribute to thedifference between statutory performance and underlying performance is provided in the Summary of Financial Informationattached to this report.
Certain other non-IFRS financial measures are also included in this review. These non-IFRS financial measures are used internallyby management to assess the performance of RFG’s business and make decisions on allocation of resources. Non-IFRS measureshave not been subject to audit or review. Certain comparative amounts from the prior corresponding period have beenre-presented to conform to the current period’s presentation.
The following table summarises the Group’s results for the financial years ending 30 June 2018 and 30 June 2017:
Item FY18 FY17 Change
Revenue $374.0m $349.3m $24.7m
NPAT ($306.7m) $61.9m ($368.6m)
NPAT (Underlying) $33.3m $75.7m ($42.4m)
EBITDA ($354.3m) $106.5m ($460.8m)
EBITDA (Underlying) $71.4m $123.5m ($52.1m)
EPS (169.50 cps) 35.70 cps (205.20 cps)
EPS (Underlying) 18.40 cps 43.70 cps (25.30 cps)
Dividend per Share (DPS) - 29.75 cps (29.75 cps)
RFG commenced FY18 with a focus on consolidating the Group’s diversified business platform, with an emphasis on theimproving efficiency of the franchise system supply chain and internal Group structure.
In June 2017, RFG had commissioned a business wide review, with the purpose of identifying business improvementopportunities and strengthening RFG’s operating model, to better assure a long term future for its business, its franchisees, aswell as other stakeholders. This comprehensive review progressed in FY18 and particularly included focus on:
• Examining the Group’s cost base, effecting supply chain consolidation, and expediting synergies; and• Initiating strategic review of the Group’s domestic franchise operations.
Other external factors were also affecting franchisee sentiment and commitment through FY18, particularly:
• Fair Work Australia inquiries into other major retail franchise systems and regulatory change arising as a consequence ofthat; and
• Adverse publicity about franchising in the local and national media.
An adverse public profile for franchising led ultimately to the current Parliamentary Joint Committee on Corporations & FinancialServices’ Inquiry into the operation and effectiveness of the Franchising Code of Conduct, which is still in progress at the date ofthis report.
Retail Food Group Limited - Annual Report - Financial Year Ended 30 June 2018 Page 6
For
per
sona
l use
onl
y
As CY17 progressed, it became evident that trading results were not meeting management’s expectation, impacted bychallenging retail market trading conditions, especially within shopping centre locations, negative market sentiment towardsfranchising and RFG in particular, the cumulative impact of 2H17/1H18 store closures, and internal challenges in themanagement of RFG’s business model.
These factors, together with concerns regarding franchisee sentiment and engagement, and the Group’s supply chainperformance, also contributed to a decline in new store growth, resale and renewal activity, and the number of outlets beingpassed to RFG management.
At the half year ended 31 December 2017, the Directors reported on:
• The outcome of management’s initial review of RFG’s retail franchise leases, and the identification of 160 to 200 domesticretail leases which were provisioned for closure;
• The revised outlook for the business in the light of its retail lease review, resulting in a significant impairment write downat 31 December 2017; and
• The trading result and cash flow performance for the first half of the 2018 financial year.
The Directors also determined RFG needed a clear turnaround process to be executed in three stages:
• Stage 1 - the business and return it to a profitable platform, which is still in progress;• Stage 2 - the core business operations and enhance both RFG and franchisee profitability and return on capital
outcomes; and• Stage 3 - the business, in the retail food franchise systems by developing and operating new stores in
selected locations, and in the coffee business by expanding its operation into new market channels in food service andcorporate business.
As part of this turnaround strategy, the Board also initiated a management transition within the Group, with the departure offormer Managing Director, Andre Nell, and the appointments of Richard Hinson as Group Chief Executive and Chief Executive ofRFG’s Brand Systems and commercial division, and Darren Dench as Chief Executive of Di Bella Coffee, RFG’s coffee business.
The Board is satisfied that RFG's management team is working with its franchisees and customers to improve the underlying andsustainable performance of each of RFG’s businesses, and remains confident in the capacity of these businesses to compete in achallenging market place.
Your Directors consider that RFG’s core strategic direction lies with its coffee and retail food franchise systems, which, ifsupported appropriately by RFG and an energised franchisee network, should be able to generate acceptable future returns forboth its franchisees and RFG’s shareholders.
Clearly, RFG remains challenged today and has much work to do to return to an acceptable level of profitability but, at itsessence, the Board sees a robust future for the business where:
• RFG focuses on where RFG and its franchisees can be profitable;• Di Bella Coffee continues to supply RFG’s Brand Systems, and expands its retail and wholesale customer base, both across
Australia and internationally;• RFG delivers a store experience and product fulfilment that its consumers will enjoy, at a cost to franchisees that produces
profits for all stakeholders;• RFG removes internal complexity and simplifies how it does business.
In FY19, RFG expects to see each of RFG’s Brand Systems stabilise to a core of profitable, well-run franchisee stores, supported bya field services and supply chain that delivers operational and economic support for RFG’s franchisees and other customers.
In the immediate term, RFG’s trading results will likely remain subdued until the full impact of RFG’s lease restructuring andproduct and supply chain initiatives deliver the anticipated benefits to RFG’s Brand Systems and coffee business.
Cash flow and working capital management also remain a major priority as management pursues outstanding debts andminimises the working capital invested in the Group’s manufacturing and logistics chain, as well as improving the velocity ofcash flow settlements within each retail food franchise system and the DiBella and Hudson Pacific operations.
RFG’s two relationship banks, NAB and Westpac, appropriately continue to closely monitor the Group’s turnaround strategy. TheBoard and senior management are working closely with them and their advisers to this end.
RFG’s current market capitalisation at 24 August 2018 was approximately $113 million.
In assessing RFG’s financial position as at 30 June 2018, and, in particular, the carrying value of RFG's Brand Systems, theDirectors have taken a conservative approach, basing their assessment and subsequent impairment position to reflect both theGroup’s expected FY19 sustainable earnings and the risk profile inherent in RFG’s current challenges. The outcome of thisassessment was an impairment charge of $402.9 million for the year, which reduces shareholder funds to $158.0 million,representing an implied value of $0.86 per share.
Retail Food Group Limited - Annual Report - Financial Year Ended 30 June 2018 Page 7
For
per
sona
l use
onl
y
In the Directors’ report to shareholders for the half year ended 31 December 2017, the Directors identified a number ofrecapitalisation initiatives that RFG was minded to pursue and, in conjunction with RFG’s advisers, RFG continues to explorethese options, together with the continuation of the core business turnaround strategy.
At this date, your Directors are confident that RFG has a feasible turnaround strategy, the management team to implement itsuccessfully, the core franchisee cohort to support their own and the Group’s investments in the respective Brand Systems, andthe current support of RFG’s bankers and other key stakeholders to complete the turnaround job.
Shareholders will particularly take note of the classification of RFG’s core debt as current as at 30 June 2018 on the basis of thecurrent revised covenant relief conditions provided by the Group’s relationship bankers, NAB and Westpac, as at 30 June 2018.
RFG will be seeking to reduce its debt through a combination of its turnaround strategy, potential asset sales and plans to obtainfunding (by way, for example, of a market recapitalisation when the business performance has stabilised). Work on all theseoptions commenced some time ago and continues, but, at this date, the Board has no definitive position on which options arepreferable.
These financial statements have been prepared on the basis that RFG is a going concern, able to realise assets in the ordinarycourse of business and settle liabilities as and when they are due.
The Group has experienced challenging operating conditions over the year and as announced with the release of its operatingresults for the half-year ended 31 December 2017, has instituted a restructure of its franchise brand systems networks toright-size the operation base of its respective businesses and set a course for growth in both domestic and international franchiseactivities. During the year ended 30 June 2018, the Group incurred a loss before income tax of $306.7 million, which includedbusiness turnaround, restructuring costs and impairment losses of $427.3 million as a result of the provisioning for the closure ofcirca 250 franchise stores and the impairment impacts arising from the revised profitability forecasts associated with the resetfranchise networks going forward. The Group has a net current liability position of $231.3 million at balance date. Despite thesechallenges, the Group generated a positive cashflow from operating activities of $10.8 million and a positive Underlying EBITDAof $71.4 million. Management and the Board are focussed on implementing the restructuring plan through FY19 and continuingto execute initiatives which are expected to boost operating earnings and reduce costs in future periods.
As referred to in Note 19 of the Financial Statements, the Group’s secured syndicated loans totalling $265 million are classified ascurrent liabilities at the balance date. The Group had breached one of its lending covenants under its syndicated lending facilityagreement at 30 June 2018. However, the Group has received a conditional waiver from the syndicate lenders. In addition,subsequent to the year end, agreement has been reached between the Company and its lenders to reset the covenants effectivefrom 31 August 2018 for covenant testing periods commencing 1 July 2018. The Group’s syndicated loan facility reduced from$309 million to $265 million and the maturity date was brought forward to 31 October 2019.
Despite the program to restructure the franchise businesses and build confidence in the franchise brands by consumers andpotential franchise investors, there remains significant risk that the Group may breach financial covenant thresholds under itsfinancing agreements within the next twelve months. A breach of one or more of these financial covenants may result in all thesyndicated debt becoming due and payable. The continuing viability of the Group and its ability to continue as a going concernis dependent upon the Group maintaining the continuing support of the syndicated lenders, and managing the covenants andthe terms of the renegotiated facility.
Achieving this outcome also depends upon:
(1) The Group’s ability to implement successfully an asset sales program over the next twelve months to realise funds to assistin paying down the syndicated debt;
(2) The Group’s ability to obtain additional funding (by way, for example, of a capital raising or accessing alternative sourcesof finance);
(3) The Group’s ability to execute successfully the restructuring initiatives previously referred to.
As a result, there is a material uncertainty that may cast significant doubt on whether the Group will continue as a goingconcern and, therefore, whether it will realise its assets and settle its liabilities and commitments in the normal course of businessand at the amounts stated in the financial report. However, the Directors, after taking into account all relevant factors, haveconcluded that there are reasonable grounds to believe both that the secured syndicate financiers will continue to support theGroup and that the business will remain a going concern for the next twelve months.
Accordingly, the Directors have prepared the financial report on a going concern basis. As a consequence, no furtheradjustments have been made to the financial report relating to the recoverability and classification of the assets carryingamounts or the amounts and classifications of liabilities that might be necessary should the Group not continue as a goingconcern.
RFG’s auditor continues to work with the Board and management through these issues and has included an emphasis of matterparagraph in its audit opinion on the financial statements as at 30 June 2018 on the basis of material uncertainty associated withthe syndicated debt facility and the various recapitalisation initiatives. Your Directors understand and accept the position takenby the auditor at this date, as RFG’s relationship bankers are still considering the impacts of RFG’s turnaround strategies that arecurrently in progress.
Retail Food Group Limited - Annual Report - Financial Year Ended 30 June 2018 Page 8
For
per
sona
l use
onl
y
Revenue for FY18 was $374.0 million, representing a 7.1% increase (or $24.7 million) on the prior corresponding period (PCP).The increase in revenue is primarily attributable to the following factors:
• A $66.5 million increase from a full 12 months of Commercial Food Services segment revenue from both the HPC and AFSacquisitions; offset by
• A $10.0 million decrease in Di Bella Coffee revenue, primarily attributable to competitive conditions in the contractroasting sector, and exit of low-margin Grocery contracts; and
• A $31.8 million decrease in Brand System segment revenues (Bakery/Café, QSR and Coffee Retail), attributable tosignificantly lower transactional revenues from new outlet growth and franchisee renewals, and a decrease in BrandSystem coffee and allied product sales compared to the PCP.
The reported EBITDA loss of $354.3 million and reported NPAT loss of $306.7 million was significantly attributable to the $402.9million (pre-tax) non-cash provisioning and impairment as discussed previously. Underlying EBITDA of $71.4 million andUnderlying NPAT of $33.3 million for FY18 excludes $22.8 million (pre-tax) in restructuring costs associated with thebusiness-wide review, and acquisition and integration costs attributable to the Hudson Pacific Corporation (HPC) and AssociatedFoodservice (AFS) acquisitions, $1.6 million amortisation of acquired intangible assets. The FY18 costs excluded from UnderlyingEBITDA also include $402.9 million (pre-tax) of non-cash provisioning and impairment of assets as discussed previously.
Net Assets of $158.0 million have decreased by $307.1 million (or 66%) from 30 June 2017, primarily as a result of non-cashprovisioning and impairment of assets. Further details on these adjustments are included in Note 6 of the financial statements asat 30 June 2018.
Cash inflows from operating activities for FY18 were $10.8 million (FY17: $63.8 million), with the decrease in net operating cashinflow attributable to cash outflows arising from business turnaround and restructuring costs incurred in the year, as well as asignificant increase in working capital balances as a result of the growth in wholesale customer sales in the Commercial FoodServices segment. The cash conversion to EBITDA ratio for the year was affected by the significant $402.9 million non-cashprovisioning and impairment of assets mentioned previously.
The Group received $22.0 million (before costs) in cash arising from the issue of shares from the DRP Shortfall Placement on 17October 2017.
As at 30 June 2018, the Group’s total gross debt increased to $273.9 million, including ancillary facilities. The increase in grossdebt was predominantly due to the timing of working capital cash flows, continued investment in property, plant and equipmentand acquisition earn out payments for the Di Bella and Hudson Pacific Corporation acquisitions attended to during FY18.
In December 2017, the Group extended its three-year debt facilities totalling $150 million, due to mature in December 2018, intolonger dated maturities as follows:
• $100 million extended to facilities maturing in January 2020; and• $50 million extended to facilities maturing in December 2020.
In addition, RFG reduced the existing debt facilities, maturing in December 2020, by $25 million.
The Group received a conditional waiver from its senior debt lenders on 29 June 2018, for testing of financial covenants for theperiod ended 30 June 2018.
Subsequent to 30 June 2018, the Company further negotiated its financial covenants attaching to the Group’s debt facilities thatsupport the Group’s restructuring plans with its senior debt lenders. Agreement has been reached between the Company and itslenders to reset the covenants effective from 31 August 2018 for covenant testing periods commencing 1 July 2018.
Retail Food Group Limited - Annual Report - Financial Year Ended 30 June 2018 Page 9
For
per
sona
l use
onl
y
The key terms of the covenant reset are:
Financial covenants and conditions Revised 31 August 2018 Previous covenants
Covenant testing Quarterly on 31 March, 30 June, 30September and 31 December
Quarterly on 31 March, 30 June, 30September and 31 December
Operating Leverage ratio(Secured Net Debt/EBITDA)
5.0x to December 2018;4.5x to March 2019;
4.0x from 1 April 2019 onwards;
3.0x to December 2018;2.5x from 1 January 2019;
Interest cover ratio 3.0x 4.0x
Gearing ratio Covenant removed Less than 50%
Financial Guarantor EBITDA and Assets ratios Covenant removed Greater than 90%
EBITDA performance to budget Covenant removed 20% variance to budget
Mandatory prepayment – asset sales 100% of net proceeds 60% of net proceeds
Mandatory amortisation Requirement removed $12.5m repayment by 2 March 2019
Total senior debt facilities $285 million $309 million
Tenor of facilities 31 October 2019 January 2020 and December 2020
In addition, the Group's restructuring program is subject to a review process with the lenders after 31 December 2018.
These revised banking arrangements will also come at an increased cost to the Group, which has been factored into future cashflows.
The Group is managed through five major reportable segments under AASB 8, as follows:
• Bakery/Café Division (incorporating Michel’s Patisserie, Donut King, and Brumby’s Bakery Brand Systems);• QSR Division (incorporating Crust Gourmet Pizza and Pizza Capers Brand Systems);• Coffee Retail Division (incorporating Gloria Jean’s Coffees, Esquires, Café2U and The Coffee Guy Brand Systems);• Di Bella Coffee (incorporating Wholesale Coffee operations); and• Commercial Food Services Division (incorporating procurement, warehousing, manufacturing and distribution
operations).
All Brand System segments, with the exception of Di Bella Coffee, and Commercial Food Services, are referred to collectively bymanagement as Franchise Operations.
Underlying Franchise Operations EBITDA for FY18 was $53.3 million (FY17: $97.5 million), representing a decline of 45.3% (or$44.2 million).
FY18 new outlets established comprised of 101 in total, including 93 in international territories, and 8 domestically, with theprevailing negative sentiment surrounding the franchise industry, resulting in no new outlets being recognised in 2H18.
FY18 outlet closures were 305 in total, including 83 in international territories, 217 domestic traditional outlets, and 15 mobilevans. Domestic outlet closures are discussed in further detail under the heading
Same Store Sales (SSS) and Average Transaction Value (ATV) metrics for FY18 exclude the contribution from stores closed in thecomprehensive domestic outlet network analysis.
Operationally, weighted Same Store Sales (SSS) and Average Transaction Value (ATV) growth of -1.4% and +2.7% represented adisappointing outcome, heavily impacted by the performance of those Brand Systems with significant shopping centre exposure,most significantly the Michel’s Patisserie network.
This performance is contrasted with the QSR Division’s performance, where credible SSS and ATV metrics of +2.0% and +2.9%were underpinned by disciplined pricing, menu innovation, alignment with delivery aggregators and a focus on operationalexcellence.
In 2H18, management implemented many of the initiatives, noted previously, in the review of domestic franchise operations andcontinued extensive engagement with the franchisee community, including:
• A restructuring of the Company’s field support model, including employment of additional field based personnel fullyoperational;
Retail Food Group Limited - Annual Report - Financial Year Ended 30 June 2018 Page 10
For
per
sona
l use
onl
y
• Further enhancing RFG’s franchisee wage entitlement audit framework and compliance activities;• Delivering cost of goods savings to franchisees;• Offering discounted new store and renewal term franchise fee structures;• Commencing store closure and landlord negotiation programs; and• Continued reduction in head office and shared service resources;
Group Chief Executive Officer, Richard Hinson, completed an extensive Franchisee roadshow in July 2018, visiting 6 cities and c.700 franchisees, communicating the future direction of the Group’s franchise operations.
To improve the underlying and sustainable performance of each of its Brand Systems, “concept store” pilots have also beenlaunched in the Michel’s Patisserie, Brumby’s Bakery, Donut King and Gloria Jeans Brands.
As announced in March 2018, a comprehensive domestic outlet network analysis was undertaken in February 2018, referencingthree-year quantitative sales, lease and performance information and qualitative store-by-store assessment. As a result of thatanalysis, the company was forecasting in March 2018 (as announced) that between 160 and 200 outlets were not sustainableand would therefore likely close (or their leases would not be renewed) on or before 30 June 2019. The domestic outlet networkanalysis was recently revisited, having regard to the franchisee assistance activities and landlord rental negotiations undertakenin 2H18. The Company is now forecasting, as a consequence, that by 30 June 2019, circa 250 of the existing outlets will close (ortheir leases will not be renewed on expiry).
In July 2018 the domestic outlet network analysis was revisited, including consideration of franchisee assistance activities, andlandlord rental negotiations undertaken in 2H18. As a result of the July 2018 review, circa 250 outlets are now forecast to eitherbe closed or lease renewal not sought on expiry, on or before 30 June 2019.
RFG is seeking to renegotiate improved rental outcomes, where possible, to minimise closures, and will work constructively withimpacted stakeholders.
During FY18, the Group granted 9 new international master licenses, most notably the Donut King and Crust Brand Systems inthe United Kingdom and Gloria Jean’s in Germany, bolstering growth prospects in Western European markets.
Development of the UAE joint venture arrangements has been suspended indefinitely by mutual consent, to be reviewed atsuch time when RFG’s turnaround strategy is further progressed. The joint venture arrangements were entered into in 1H18, toaccelerate Brand System expansion within the Gulf, and establish a coffee enterprise throughout the Middle East & North Africa(MENA) region.
RFG now has 87 international licensed territories across 11 Brand Systems and, while many of these territories are in the earlystages of their development cycle, they are expected to provide growing recurrent revenue streams as they mature.
During FY18, the Group appointed a new Chief Executive, Darren Dench, to take control of what was Retail Food Group’s Coffeeand Allied Beverages (CAB) division, and is now the Company’s consolidated Di Bella Coffee business.
Underlying Di Bella Coffee Operations EBITDA for FY18 was $8.1 million (FY17: $14.2 million), representing a decrease of $6.1million on PCP. The decrease in EBITDA on PCP was due to $2.6 million loss of margin in the contract roasting sector on newcustomer acquisition and cost pressures, and exit of low-margin Grocery contracts, with $3.5 million due to non-recurring gainsin FY17, and losses on sale of assets in FY18.
During FY18, RFG completed the restructuring and alignment activities which underpin the 1H18 repositioning of its CABDivision under the Di Bella Coffee brand, consolidating the Group’s four coffee businesses into a single, integrated coffeeenterprise under the Di Bella Coffee name.
Ongoing activity is focused on strengthening critical commercial and operational capabilities under a single leadership team,implementing financial and operational initiatives across supply chain and procurement to improve gross margins and cash flowgeneration, positioning the business to be commercially competitive.
RFG will ultimately exit its existing low-margin capsule operations, following non-renewal of the Group’s domestic capsule supplyagreement and a failure to achieve adequate business for the professional machine program, which has been significantlyimpacted by technical and manufacturer related issues.
The Commercial Food Services Division EBITDA was $10.0 million (FY17: $11.8 million), primarily attributable to costs associatedwith carrying additional sites to allow for integration of the May 2017 AFS acquisition.
Retail Food Group Limited - Annual Report - Financial Year Ended 30 June 2018 Page 11
For
per
sona
l use
onl
y
Investment in sales and management capability has driven an increase in foodservice customers since 30 June 2017, and newbusiness secured for Dairy Country, largely commencing in 2H18. New product innovation and customer acquisition also drovegrowth in Bakery Fresh throughput to c.4.6 million kg for the period.
The integration of the Associated Food Services acquisition into the existing Hudson Pacific facilities was completed in Q418,with the resultant logistical, lease exit, asset disposal and redundancy costs included in Integration Costs for the year.
Significant investment in new production capacity was completed during FY18, including:
• Commencing operations at a second facility for Dairy Country, including a $5.2 million capital investment in newproduction lines, with additional cold storage. Operating and overhead costs of this additional facility commenced duringthe year;
• Upgrading equipment to increase efficiency and capacity, including a $1.1 million capital investment at the existing DairyCountry facility;
The business continues to tender for additional production volumes with existing and new customers to drive economic returnsfrom this asset investment.
In recent years, RFG rapidly expanded through acquisitive activity. This growth has delivered many benefits, but has also led to acomplexity which impacted focus on RFG’s franchise business and has affected head office and shared service resource efficiencyand effectiveness.
A key focus of the business-wide review has been the reduction of duplication and inefficiency, better integration of supportstructures, and improving alignment of the Company’s resources with core revenue drivers.
The review resulted in a range of operational cost saving initiatives being undertaken in FY18, the impact of which is likely to befelt in FY19. Further efficiencies will be delivered in FY19.
Your Directors are not in a position to provide any specific guidance on the 2019 financial year at this date, although we doremain confident in the strategies being pursued by management and the other options to reduce debt being considered byRFG and its advisers.
The focus will remain to then and then the performance of the business.
Under its current arrangements with its relationship banks, NAB and Westpac, and its underlying trading results, there will be nodividend for RFG as at 30 June 2018, nor is a dividend payment likely in the foreseeable 12 month outlook, until RFG’sturnaround strategy returns the business to an acceptable profitable position.
Your Directors have also reflected on their performance in this difficult past twelve months and note that they have beenproactive in both identifying the performance issues within the business and taking the initiative to address them, including thedevelopment of a feasible turnaround strategy and the appointment of a new senior leadership team that can develop andimplement this plan successfully.
Your Directors have also taken the opportunity to seek out new talent to join the Board, and your Directors hope that they willbe able to announce some new appointments once the 30 June 2018 financial year reporting process has been cleared.
It has been a challenging and disappointing year for RFG and its shareholders and your Directors can only assure you that theyare trying to regenerate the underlying value that they consider RFG represents, but also accept that the proof is ultimately inthe results RFG delivers and, with a depressed share price and no dividend on offer, there is much value to recreate.
RFGs’ management team and its many staff have continued to work hard with us to identify and address the many challengesdragging the business down and we acknowledge and praise their efforts, and note management’s optimism that RFG has apositive and profitable future.
Retail Food Group Limited - Annual Report - Financial Year Ended 30 June 2018 Page 12
For
per
sona
l use
onl
y
Dividends paid or declared by the Company to members since the end of the previous financial year were:
FY18 FY17
Company Cents pershare
Total$'000
Cents pershare
Total$'000
Fully paid ordinary sharesFinal dividend - fully franked at 30% tax rate
[1]15.00 26,510 14.50 23,920
Interim dividend - fully franked at 30% tax rate[2] - - 14.75 25,968
15.00 26,510 29.25 49,888
Fully paid ordinary sharesFinal dividend - fully franked at 30% tax rate[3] - - 15.00 26,510
(1) In respect of the financial year ended 30 June 2017, as detailed in the Directors' Report for that financial year, a finaldividend of 15.00 cents per share, based on 176,736,066 shares on issue at 29 August 2017, franked to 100% at 30%corporate income tax rate, was paid on 17 October 2017 . The final dividend was approved by the Directors on 29 August2017 and, therefore, was not provided for in the Company's financial report. It was resolved that the 2017 final dividendwould constitute an eligible dividend for the purpose of the Company's Dividend Reinvestment Plan. The issue price of theshares was $4.47.
(2) The Directors resolved not to declare an interim dividend in FY18.
(3) The Directors have resolved that no final dividend will be paid in respect of FY18.
The Group, due to the nature of its operations, is not required to be environmentally licensed nor is it subject to any conditionswhich have been imposed by an environmental regulator specifically related to the Group or its operations.
In circumstances where the nature of the Group’s operations requires, the Group is committed to compliance with all prescribedenvironmental laws and regulations.
During the financial year, the Company entered into a contract insuring the Directors of the Company, the Company Secretary,and all executive officers of the Company and of any related body corporate against a liability incurred as a Director, Secretary orexecutive officer to the extent permitted by the . The contract of insurance prohibits disclosure of thenature of the liability and the amount of the premium.
The Company has also entered into a Deed indemnifying the Directors, officers and certain other parties in respect of certainclaims that may be raised against them relative to the operations of the Company, its former and current subsidiaries.
To the maximum extent permitted by the , the Deed indemnifies those persons from liabilities incurred asa consequence of the acts of those persons.
The Company has not, otherwise, during or since the end of the financial year, indemnified or agreed to indemnify an officer orauditor of the Company or of any related body corporate against a liability incurred as such an officer or auditor.
Details of the amounts paid or payable to the auditor for non-audit services provided during the year by the auditor are outlinedin Note 34 to the financial statements.
The Directors are satisfied that the provision of non-audit services, during the year, by the auditor, or by another person or firmon the auditor’s behalf, is compatible with the general standard of independence for auditors imposed by the
.
The Directors are of the opinion that the services, as disclosed in Note 34 to the financial statements, do not compromise theexternal auditor’s independence, based on advice received from the Audit and Risk Committee, for the following reasons:
• All non-audit services have been reviewed and approved to ensure that they do not impact the integrity and objectivity ofthe auditor; and
Retail Food Group Limited - Annual Report - Financial Year Ended 30 June 2018 Page 13
For
per
sona
l use
onl
y
• None of the services undermine the general principles relating to auditor independence, as set out in Code of ConductAPES 110 Code of Ethics for Professional Accountants issued by the Accounting Professional & Ethical Standards Board,including reviewing or auditing the auditor’s own work, acting in a management or decision-making capacity for theCompany, acting as advocate for the Company or jointly sharing economic risks and rewards.
The auditor’s independence declaration is included on page 27 of the financial report.
The Company is a company of the kind referred to in and, in accordance with that ClassOrder, amounts in the Directors' Report and the Financial Report are rounded off to the nearest thousand dollars, unlessotherwise indicated.
The Directors present the Retail Food Group Limited 2018 remuneration report, outlining key aspects of the Company'sremuneration policy and framework, and remuneration awarded this year.
This Remuneration Report, which forms part of the Directors’ Report, sets out information about the remuneration of Retail FoodGroup Limited’s Directors and its senior executive management for the financial year ended 30 June 2018.
The prescribed details for each person covered by this report are contained below under the following headings:
• Key Management Personnel;• Remuneration Policy;• Relationship between Remuneration Policy and Group Performance;• Remuneration of Directors and Senior Executive Management;• Key Management Personnel equity holdings;• Key terms of employment contracts;• Loans to Key Management Personnel; and• Other transactions with Key Management Personnel and Directors of the Group.
The Company does not directly remunerate any of its Directors, Key Management Personnel or specific executives. Rather, theDirectors, Key Management Personnel and specific executives are remunerated through subsidiaries of the Company.
The Directors and other Key Management Personnel of the consolidated entity during or since the end of the financial yearwere:
Mr Colin Archer Chairman and Independent Non-Executive DirectorMs Jessica Buchanan Independent Non-Executive DirectorMr Stephen Lonie Independent Non-Executive DirectorMs Kerry Ryan Independent Non-Executive DirectorMr Russell Shields Independent Non-Executive DirectorMr Anthony (Tony) Alford Non-Independent Non-Executive Director - Resigned 3 July 2017Mr Andre Nell Executive Managing Director - Resigned 29 May 2018
Mr Richard Hinson Group Chief Executive Officer - Appointed 29 May 2018Mr Peter McGettigan Chief Financial OfficerMr Anthony Mark Connors Company Secretary, Director Corporate ServicesMr Michael Gilbert Chief Executive - International - Resigned 13 June 2018Mr Gary Alford Chief Executive Officer - Resigned 15 September 2017Mr Darren Dench Chief Executive Officer - Di Bella Coffee - Appointed 4 December 2017
The term ‘senior executive management’ is used in this Remuneration Report to refer to these persons.
These named persons were senior executive management throughout the financial year and since the end of the financial year.
Mr Richard Hinson was appointed to Chief Executive Australia on 22 January 2018, and was promoted to Group Chief ExecutiveOfficer on 29 May 2018.
Mr Michael Gilbert was appointed to Chief Executive - International on 21 June 2017. Prior to this appointment, he held theposition of Chief Franchise Officer (was not classified as KMP) and resigned from this position on 13 June 2018. He will ceaseemployment on 12 September 2018.
Mr Anthony (Tony) Alford became a Non-Independent Non-Executive Director on 1 July 2016 and resigned from this positionon 3 July 2017.
Mr Andre Nell was appointed executive Managing Director on 1 July 2016, and resigned from this position on 29 May 2018.
Retail Food Group Limited - Annual Report - Financial Year Ended 30 June 2018 Page 14
For
per
sona
l use
onl
y
Mr Gary Alford was appointed as Chief Executive Officer of the Company on 1 July 2016, and retired from this position on 15September 2017.
Mr Darren Dench was appointed to Global Head of Coffee on 4 December 2017. He was subsequently appointed ChiefExecutive Officer - Di Bella Coffee on 29 May 2018.
The Board considers that it is critical to its long term success, and the building of shareholder value, that it attracts, retains andmotivates appropriate personnel to lead, manage and serve the Group in an increasingly competitive marketplace for seniorexecutive talent.
The objectives of the Group’s remuneration policy are to:
• Motivate executive and non-executive personnel to successfully lead and manage the Group, with a focus on driving longterm growth and shareholder value;
• Drive successful performance and achievement of long and short term goals and otherwise reinforce the objectives of theGroup;
• Deliver competitive remuneration packages necessary to attract and retain appropriate personnel;• Ensure fair remuneration, having regard to duties, responsibilities and other demands;• Ensure flexibility, to enable the Group to cope with planned or unforeseen threats and opportunities;• Ensure compliance with relevant laws; and• Ensure sustainable value for all stakeholders.
When determining executive remuneration packages, the Board may have regard to:
• The need to attract, retain and motivate appropriate personnel;• Market practices;• Alternative benefits including incentive programs, fringe benefits and equity schemes;• Assessment of individual performance against set goals and targets; and• The scope of responsibility, duties and other demands.
Executive remuneration shall generally take the form of a base salary plus superannuation, however, may comprise performancebonuses and other benefits or rewards in certain circumstances.
When determining non-executive remuneration packages, the Board may have regard to:
• The need to attract, retain and motivate appropriately qualified and experienced Directors with diverse backgrounds andexperiences to ensure the Board is comprised of a range of skills necessary to properly understand the businessenvironment in which the Group operates;
• The scope and complexity of the responsibilities assumed by such Directors in connection with the oversight andleadership of the Group;
• Comparative market practices;• Assessment of individual performance against set goals and targets; and• Alternative benefits, including equity schemes.
The Board has a Remuneration Committee to assist the Board and report to it on remuneration and issues relevant toremuneration policies and practices, including those policies and practices for senior executive management and non-executiveDirectors.
The functions performed by the Remuneration Committee are to:
• Review and evaluate the market practices and trends on remuneration matters;• Make recommendations to the Board in relation to the Group’s remuneration policies and practices;• Oversight of the performance of the Managing Director, Chief Executive Officer, Chief Financial Officer and other
members of senior executive management and non-executive Directors; and• Make recommendations to the Board in relation to the remuneration of senior executive management and non-executive
Directors.
The Remuneration Committee has adopted the following policies to which it will continue to have regard when determiningthe remuneration of executives and senior executive management members, being to:
• Annually review executive and senior executive management member packages by reference to Group performance,executive performance, comparable information from industry sectors and other listed companies;
• Reward performance which results in long-term growth in shareholder value;• Link all bonuses and incentives to pre-determined performance criteria; and• Reference any changes to measurable performance criteria.
Retail Food Group Limited - Annual Report - Financial Year Ended 30 June 2018 Page 15
For
per
sona
l use
onl
y
The following compensation structures are designed to attract suitably qualified executives, reward the achievement of strategicobjectives and achieve the broader outcome of long-term success and the building of shareholder value. The compensationstructures take into account:
• The capability and experience of the executive;• The executive’s ability to manage and deliver the Group’s forecast results;• The attainment of pre-determined KPIs developed specially for the executive’s role;• The Group’s overall performance including:
- The Group’s earnings;- The growth in earnings per share and return on shareholder wealth; and
• The relative size of incentives within each executive’s remuneration package.
Remuneration packages include a mix of fixed and variable compensation and short-term and long-term performance-basedincentives. The mix of these components is based on the role the individual performs.
In addition to their salaries, the Group also provides non-cash benefits to its executives and contributes to a post-employmentsuperannuation plan on their behalf, in accordance with its statutory obligations.
Fixed compensation consists of base compensation, which is calculated on a total cost basis and includes any fringe benefits tax(FBT) charges related to employee benefits including motor vehicles, as well as employer contributions to superannuation funds.
Compensation levels are reviewed annually by the Remuneration Committee and the Group Chief Executive Officer (andformerly, the executive Managing Director), through a process that considers the individual responsibilities and the achievementof pre-determined KPIs, and the overall performance of the Group.
Remuneration is also reviewed on promotion.
Executives receive a superannuation guarantee contribution required by the Government, which is currently 9.5% (2017: 9.5%)and do not receive any other retirement benefits. Some individuals, however, have chosen to sacrifice a further part of theirsalary to increase payments towards superannuation.
Performance linked compensation includes both short-term and long-term incentives and is designed to reward executives formeeting or exceeding their defined role objectives. The short-term incentive (STI) is an ‘at risk’ bonus provided in the form ofcash, while the long-term incentive (LTI) is provided as performance rights which can convert to ordinary shares of the Companyon vesting under the rules of the Company’s Performance Rights Plan. The decision to grant Rights to executives is based on pastperformance. In respect of the Performance Rights granted, there are performance criteria required to be achieved in order forthe Performance Rights to vest.
Each year, the Remuneration Committee sets pre-determined key performance indicators (KPIs) for certain key executives. TheKPIs generally include performance measures relating to the Group and the individual and include financial, people, customer,strategy and risk measures. The measures chosen directly align the individual’s reward to the KPIs of the Group and to its strategyand performance. The Group undertakes a rigorous and detailed annual forecasting and budget process. The Board considersthat the achievement of the annual forecast and budget is, therefore, the most relevant short-term performance condition.
The financial performance objectives may include but not be limited to “Net Profit”, “Revenue”, “Franchise Revenue”, “CorporateExpenditure“ and “Minimum Earnings Per Share“ compared to budget and forecast amounts. The non-financial objectives varywith position and responsibility and include measures such as achieving strategic objectives, compliance with governance andregulatory requirements, new store commissions, growth in network sales from effective brand marketing and promotions,growth in average weekly sales, growth in customer counts, customer satisfaction and staff development.
At the end of the financial year, the Remuneration Committee assesses the actual performance of the Group and the relevantindividual against the KPIs set at the beginning of the financial year. No bonus is awarded where performance objectives are notachieved. The Group Chief Executive Officer, recommends to the Remuneration Committee, the performance bonus amounts forindividuals, for approval by the Board. This method of assessment was chosen as it provides the Remuneration Committee withan objective assessment of the individual’s performance.
Retail Food Group Limited - Annual Report - Financial Year Ended 30 June 2018 Page 16
For
per
sona
l use
onl
y
In terms of long term incentive arrangements, in August 2015 the Directors approved and adopted a Performance Rights Plan.Under this plan, Performance Rights were granted to certain Key Management Personnel on 14 July 2016 with respect to theFY16, FY17, FY18 and FY19 performance periods. Shareholders also approved the grant of Performance Rights to formerManaging Director, Andre Nell, at the Company’s 2016 Annual General Meeting. In any case, the following Key ManagementPersonnel were granted Performance Rights under the above plan:
• Mr Andre Nell;• Mr Gary Alford;• Mr Peter McGettigan;• Mr Anthony Mark Connors; and• Mr Michael Gilbert.
The Plan was designed to focus executives on delivering long-term shareholder returns. Under the plan, participants are onlygranted shares if performance conditions pertaining to the earnings per share (EPS) growth and relative total shareholder return(TSR) are met and the employee is still employed at the end of the vesting period.
The Directors have determined that performance conditions have not been met for the FY16, FY17 and FY18 rights performanceperiods, and accordingly nil performance rights eligible for vesting 1 July 2018 will vest.
Whereas the above Plan will continue to operate in respect of historical Performance Rights which may have been grantedunder it, in the 1H18 the Directors approved a replacement Rights Plan (Replacement Plan) in connection with future long termincentive remuneration. The Replacement Plan contemplates the grant of performance rights which are measured over a threeyear performance period commencing on 1 July in the financial year in respect to which the incentive is granted, and are subjectto vesting conditionings based (in equal measure) on indexed total shareholder return and return on equity. A copy of theGroup’s Long Term Incentive Plan Policy & Procedure, and RFG’s Rights Plan Rules, which apply under the Replacement Plan, areavailable on the Company’s website, www.rfg.com.au.
At the Company’s 2017 Annual General Meeting, shareholders approved the proposed grant to former Managing DirectorAndre Nell of 117,014 performance rights under the Replacement Plan. Despite shareholder approval, the aforesaid rights werenot granted to Mr Nell having regard to the performance and circumstances of the Group. Following Mr Nell’s departure, therequirement to issue the approved rights became redundant.
The Company’s arrangements with senior executive management contemplate the grant of Performance Rights under theReplacement Plan which equates to 30% of the relevant executive’s total fixed remuneration. Having regard to recentperformance of the Group, Performance Rights in respect to FY18 long term incentive remuneration have yet to be granted as atthe date of this Report.
Participation in the Plan was at the Board’s absolute discretion and no individual has a contractual right to participate in the Plan.
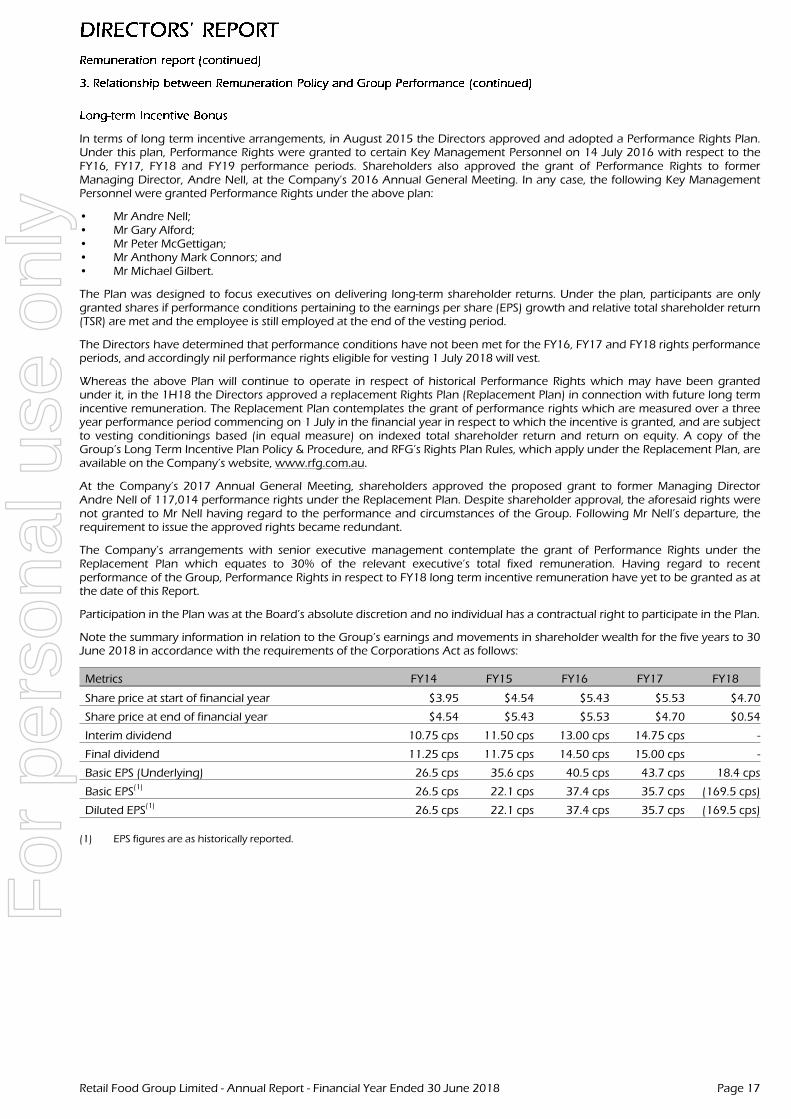
Note the summary information in relation to the Group’s earnings and movements in shareholder wealth for the five years to 30June 2018 in accordance with the requirements of the Corporations Act as follows:
Metrics FY14 FY15 FY16 FY17 FY18
Share price at start of financial year $3.95 $4.54 $5.43 $5.53 $4.70
Share price at end of financial year $4.54 $5.43 $5.53 $4.70 $0.54
Interim dividend 10.75 cps 11.50 cps 13.00 cps 14.75 cps -
Final dividend 11.25 cps 11.75 cps 14.50 cps 15.00 cps -
Basic EPS (Underlying) 26.5 cps 35.6 cps 40.5 cps 43.7 cps 18.4 cps
Basic EPS(1)
26.5 cps 22.1 cps 37.4 cps 35.7 cps (169.5 cps)
Diluted EPS(1)
26.5 cps 22.1 cps 37.4 cps 35.7 cps (169.5 cps)
(1) EPS figures are as historically reported.
Retail Food Group Limited - Annual Report - Financial Year Ended 30 June 2018 Page 17
For
per
sona
l use
onl
y
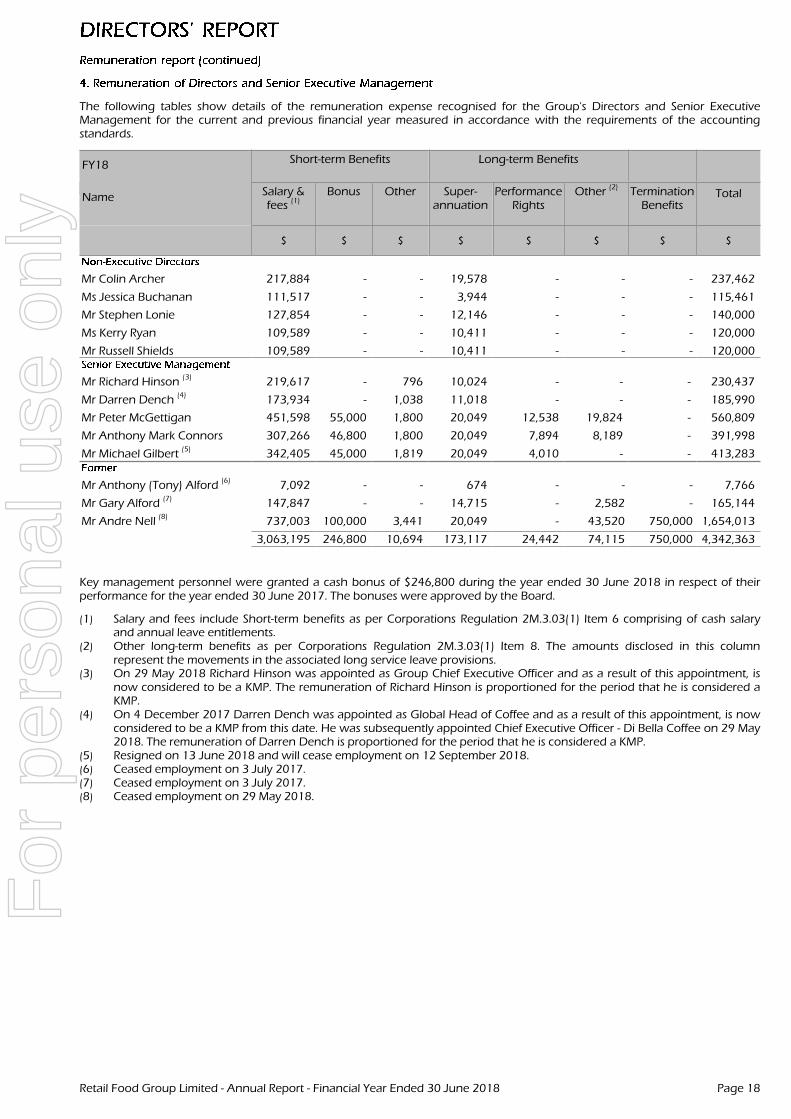
The following tables show details of the remuneration expense recognised for the Group's Directors and Senior ExecutiveManagement for the current and previous financial year measured in accordance with the requirements of the accountingstandards.
FY18 Short-term Benefits Long-term Benefits
Name Salary &fees
(1)Bonus Other Super-
annuationPerformance
RightsOther (2) Termination
BenefitsTotal
$ $ $ $ $ $ $ $
Mr Colin Archer 217,884 - - 19,578 - - - 237,462
Ms Jessica Buchanan 111,517 - - 3,944 - - - 115,461
Mr Stephen Lonie 127,854 - - 12,146 - - - 140,000
Ms Kerry Ryan 109,589 - - 10,411 - - - 120,000
Mr Russell Shields 109,589 - - 10,411 - - - 120,000
Mr Richard Hinson(3)
219,617 - 796 10,024 - - - 230,437
Mr Darren Dench(4)
173,934 - 1,038 11,018 - - - 185,990
Mr Peter McGettigan 451,598 55,000 1,800 20,049 12,538 19,824 - 560,809
Mr Anthony Mark Connors 307,266 46,800 1,800 20,049 7,894 8,189 - 391,998
Mr Michael Gilbert(5)
342,405 45,000 1,819 20,049 4,010 - - 413,283
Mr Anthony (Tony) Alford(6)
7,092 - - 674 - - - 7,766
Mr Gary Alford(7)
147,847 - - 14,715 - 2,582 - 165,144
Mr Andre Nell(8)
737,003 100,000 3,441 20,049 - 43,520 750,000 1,654,013
3,063,195 246,800 10,694 173,117 24,442 74,115 750,000 4,342,363
Key management personnel were granted a cash bonus of $246,800 during the year ended 30 June 2018 in respect of theirperformance for the year ended 30 June 2017. The bonuses were approved by the Board.
(1) Salary and fees include Short-term benefits as per Corporations Regulation 2M.3.03(1) Item 6 comprising of cash salaryand annual leave entitlements.
(2) Other long-term benefits as per Corporations Regulation 2M.3.03(1) Item 8. The amounts disclosed in this columnrepresent the movements in the associated long service leave provisions.
(3) On 29 May 2018 Richard Hinson was appointed as Group Chief Executive Officer and as a result of this appointment, isnow considered to be a KMP. The remuneration of Richard Hinson is proportioned for the period that he is considered aKMP.
(4) On 4 December 2017 Darren Dench was appointed as Global Head of Coffee and as a result of this appointment, is nowconsidered to be a KMP from this date. He was subsequently appointed Chief Executive Officer - Di Bella Coffee on 29 May2018. The remuneration of Darren Dench is proportioned for the period that he is considered a KMP.
(5) Resigned on 13 June 2018 and will cease employment on 12 September 2018.(6) Ceased employment on 3 July 2017.(7) Ceased employment on 3 July 2017.(8) Ceased employment on 29 May 2018.
Retail Food Group Limited - Annual Report - Financial Year Ended 30 June 2018 Page 18
For
per
sona
l use
onl
y
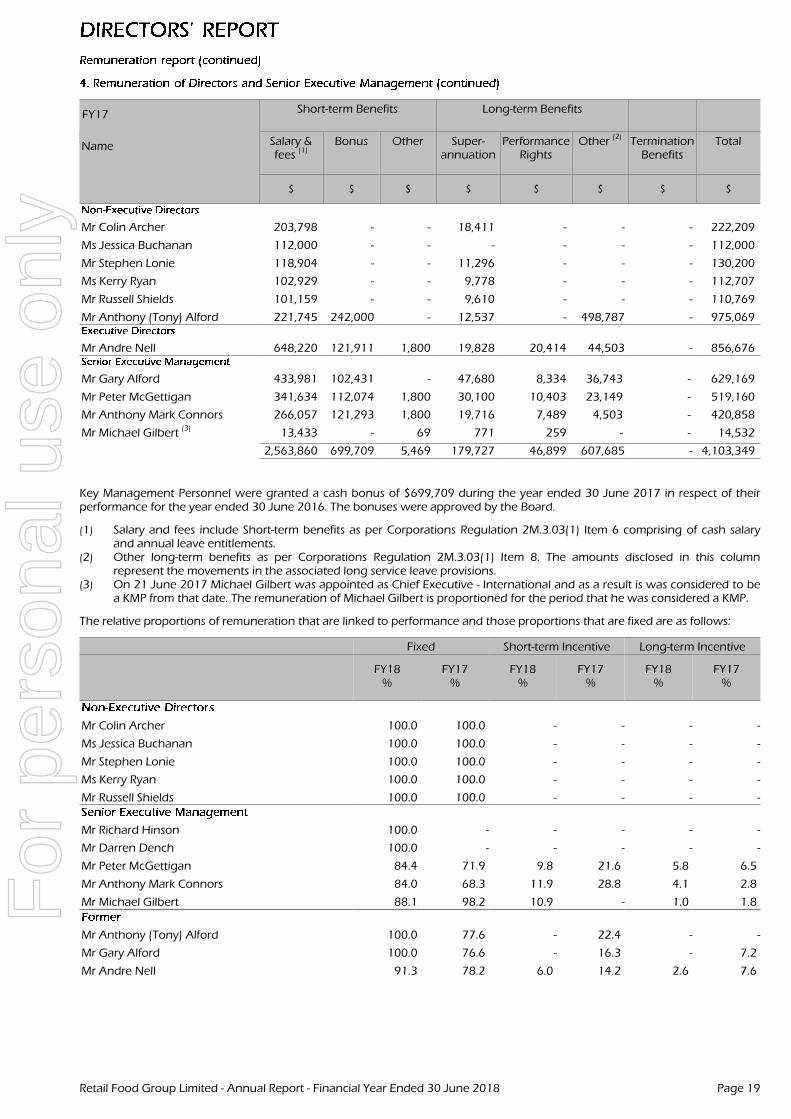
FY17 Short-term Benefits Long-term Benefits
Name Salary &fees (1)
Bonus Other Super-annuation
PerformanceRights
Other(2)
TerminationBenefits
Total
$ $ $ $ $ $ $ $
Mr Colin Archer 203,798 - - 18,411 - - - 222,209
Ms Jessica Buchanan 112,000 - - - - - - 112,000
Mr Stephen Lonie 118,904 - - 11,296 - - - 130,200
Ms Kerry Ryan 102,929 - - 9,778 - - - 112,707
Mr Russell Shields 101,159 - - 9,610 - - - 110,769
Mr Anthony (Tony) Alford 221,745 242,000 - 12,537 - 498,787 - 975,069
Mr Andre Nell 648,220 121,911 1,800 19,828 20,414 44,503 - 856,676
Mr Gary Alford 433,981 102,431 - 47,680 8,334 36,743 - 629,169
Mr Peter McGettigan 341,634 112,074 1,800 30,100 10,403 23,149 - 519,160
Mr Anthony Mark Connors 266,057 121,293 1,800 19,716 7,489 4,503 - 420,858
Mr Michael Gilbert(3)
13,433 - 69 771 259 - - 14,532
2,563,860 699,709 5,469 179,727 46,899 607,685 - 4,103,349
Key Management Personnel were granted a cash bonus of $699,709 during the year ended 30 June 2017 in respect of theirperformance for the year ended 30 June 2016. The bonuses were approved by the Board.
(1) Salary and fees include Short-term benefits as per Corporations Regulation 2M.3.03(1) Item 6 comprising of cash salaryand annual leave entitlements.
(2) Other long-term benefits as per Corporations Regulation 2M.3.03(1) Item 8. The amounts disclosed in this columnrepresent the movements in the associated long service leave provisions.
(3) On 21 June 2017 Michael Gilbert was appointed as Chief Executive - International and as a result is was considered to bea KMP from that date. The remuneration of Michael Gilbert is proportioned for the period that he was considered a KMP.
The relative proportions of remuneration that are linked to performance and those proportions that are fixed are as follows:
Fixed Short-term Incentive Long-term Incentive
FY18%
FY17%
FY18%
FY17%
FY18%
FY17%
Mr Colin Archer 100.0 100.0 - - - -
Ms Jessica Buchanan 100.0 100.0 - - - -
Mr Stephen Lonie 100.0 100.0 - - - -
Ms Kerry Ryan 100.0 100.0 - - - -
Mr Russell Shields 100.0 100.0 - - - -
Mr Richard Hinson 100.0 - - - - -
Mr Darren Dench 100.0 - - - - -
Mr Peter McGettigan 84.4 71.9 9.8 21.6 5.8 6.5
Mr Anthony Mark Connors 84.0 68.3 11.9 28.8 4.1 2.8
Mr Michael Gilbert 88.1 98.2 10.9 - 1.0 1.8
Mr Anthony (Tony) Alford 100.0 77.6 - 22.4 - -
Mr Gary Alford 100.0 76.6 - 16.3 - 7.2
Mr Andre Nell 91.3 78.2 6.0 14.2 2.6 7.6
Retail Food Group Limited - Annual Report - Financial Year Ended 30 June 2018 Page 19
For
per
sona
l use
onl
y
Under the Group's original Performance Rights Plan (refer above), Rights will only vest if performance conditions pertaining tothe earnings per share (EPS) growth and relative total shareholder return (TSR) vesting conditions are met and the employee isstill employed at the end of the vesting period.
Participating employees do not receive any dividends and are not entitled to vote in relation to the Rights during the vestingperiod.
Participation in the Performance Rights plan was at the Board’s absolute discretion and no individual has a contractual right toparticipate in the plan. Once vested, a participant will be deemed to have automatically exercised all vested performance rightsand the Company will settle its obligation in line with the Performance Rights Plan.
There is no consideration payable by the participant upon exercising of vested performance rights. Upon vesting, the conversionof a performance right to an equity or cash based settlement, is determined using a formula referencing the relevant share pricesof the Company, the number of rights exercised, and is at the Board’s sole discretion.
Performance Rights granted under the Performance Rights Plan are divided into three (3) equal tranches, with each respectivetranche having a 12 month performance period aligned to successive financial years.
Each tranche of Rights is dependent on satisfaction of two discrete performance measures:1. Earnings per Share (EPS) representing 50% of each tranche (EPS Measure); and2. Relative Total Shareholder Return (TSR) representing 50% of each tranche (TSR Measure).
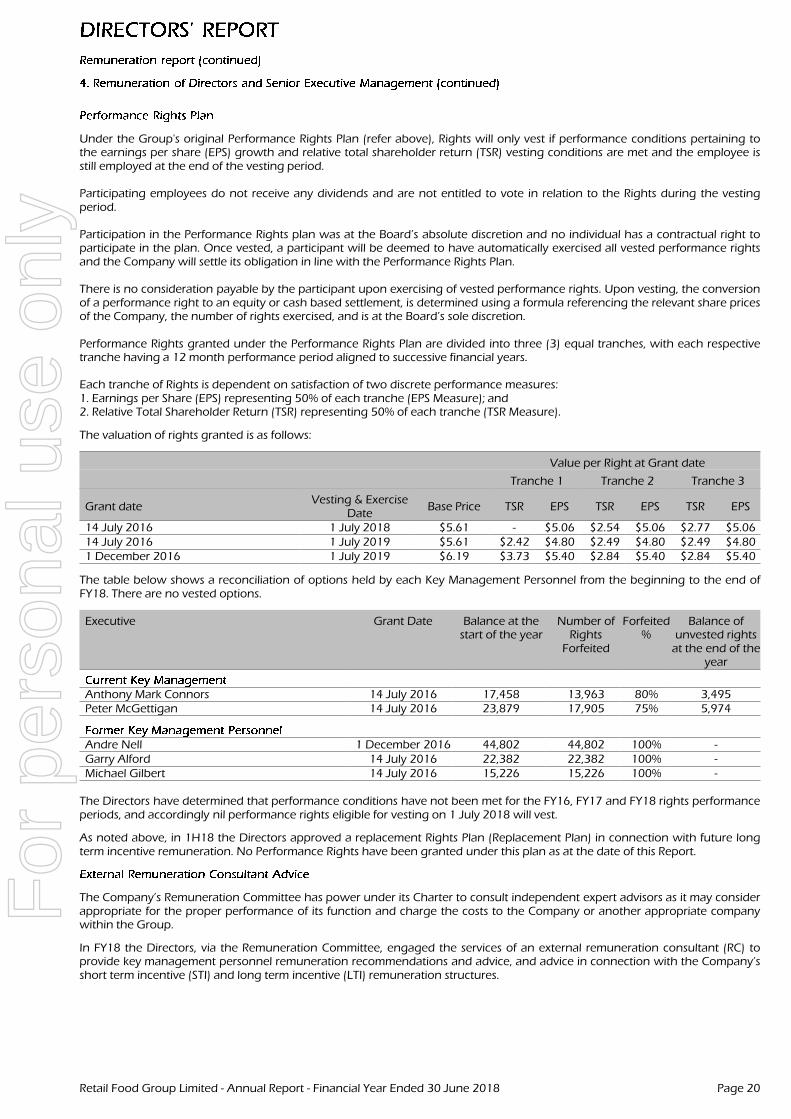
The valuation of rights granted is as follows:
Value per Right at Grant date
Tranche 1 Tranche 2 Tranche 3
Grant dateVesting & Exercise
DateBase Price TSR EPS TSR EPS TSR EPS
14 July 2016 1 July 2018 $5.61 - $5.06 $2.54 $5.06 $2.77 $5.0614 July 2016 1 July 2019 $5.61 $2.42 $4.80 $2.49 $4.80 $2.49 $4.801 December 2016 1 July 2019 $6.19 $3.73 $5.40 $2.84 $5.40 $2.84 $5.40
The table below shows a reconciliation of options held by each Key Management Personnel from the beginning to the end ofFY18. There are no vested options.
Executive Grant Date Balance at thestart of the year
Number ofRights
Forfeited
Forfeited%
Balance ofunvested rights
at the end of theyear
Anthony Mark Connors 14 July 2016 17,458 13,963 80% 3,495Peter McGettigan 14 July 2016 23,879 17,905 75% 5,974
Andre Nell 1 December 2016 44,802 44,802 100% -Garry Alford 14 July 2016 22,382 22,382 100% -Michael Gilbert 14 July 2016 15,226 15,226 100% -
The Directors have determined that performance conditions have not been met for the FY16, FY17 and FY18 rights performanceperiods, and accordingly nil performance rights eligible for vesting on 1 July 2018 will vest.
As noted above, in 1H18 the Directors approved a replacement Rights Plan (Replacement Plan) in connection with future longterm incentive remuneration. No Performance Rights have been granted under this plan as at the date of this Report.
The Company’s Remuneration Committee has power under its Charter to consult independent expert advisors as it may considerappropriate for the proper performance of its function and charge the costs to the Company or another appropriate companywithin the Group.
In FY18 the Directors, via the Remuneration Committee, engaged the services of an external remuneration consultant (RC) toprovide key management personnel remuneration recommendations and advice, and advice in connection with the Company’sshort term incentive (STI) and long term incentive (LTI) remuneration structures.
Retail Food Group Limited - Annual Report - Financial Year Ended 30 June 2018 Page 20
For
per
sona
l use
onl
y
Benchmarking market competitiveness of Group’s remuneration practices for certain key management personnel & advice inconnection with STI and LTI structures: $32,000
The Remuneration Consultant submitted its findings and recommendations in relation to benchmarking the marketcompetitiveness of the Group’s remuneration practices for key management personnel, together with its recommendations inconnection with the Company’s STI and LTI structures.
The Directors did not implement the Remuneration Consultant’s full recommendations in connection with key managementpersonnel remuneration, instead, taking a more conservative approach to remuneration review than recommended. TheDirectors otherwise engaged with the Remuneration Consultant in connection with the development of RFG’s revised STI andLTI structures (note copies of the Company’s Long Term Incentive Policy & Procedure, RFG Rights Plan Rules, and the Rules of theRFG Limited Short Term Incentive Plan are available on the Company’s website, www.rfg.com.au).
So as to ensure key management personnel remuneration recommendations were free from undue influence from keymanagement personnel to whom they relate, the Company established practices to ensure that:
• Key management personnel remuneration recommendations might only be received from consultants who have beenapproved by the Remuneration Committee, being a committee of the Board which has functions relating to remunerationof the key management personnel of the Company;
• As required by law, the Remuneration Consultant did not provide its recommendation to an executive director, or aperson who is neither a director nor a member of remuneration committee; and
• The Remuneration Committee controls the Company’s engagement with the Remuneration Consultant.
The Board is satisfied that the key management personnel remuneration recommendations received were free from undueinfluence from key management personnel to whom they recommendations related. The reasons the Board is so satisfiedinclude that it is confident that the practices referenced above operated effectively and as intended, the RemunerationCommittee and Board has been closely involved in all dealings with the Remuneration Consultant, and the RemunerationConsultant’s remuneration recommendation received during the reporting period was accompanied by a legal declaration fromthe Remuneration Consultant, in accordance with s206M of the Corporations Act 2001 (Cth), that the said recommendation wasprovided free from undue influence by any key management personnel to whom the recommendation relates.
Retail Food Group Limited - Annual Report - Financial Year Ended 30 June 2018 Page 21
For
per
sona
l use
onl
y
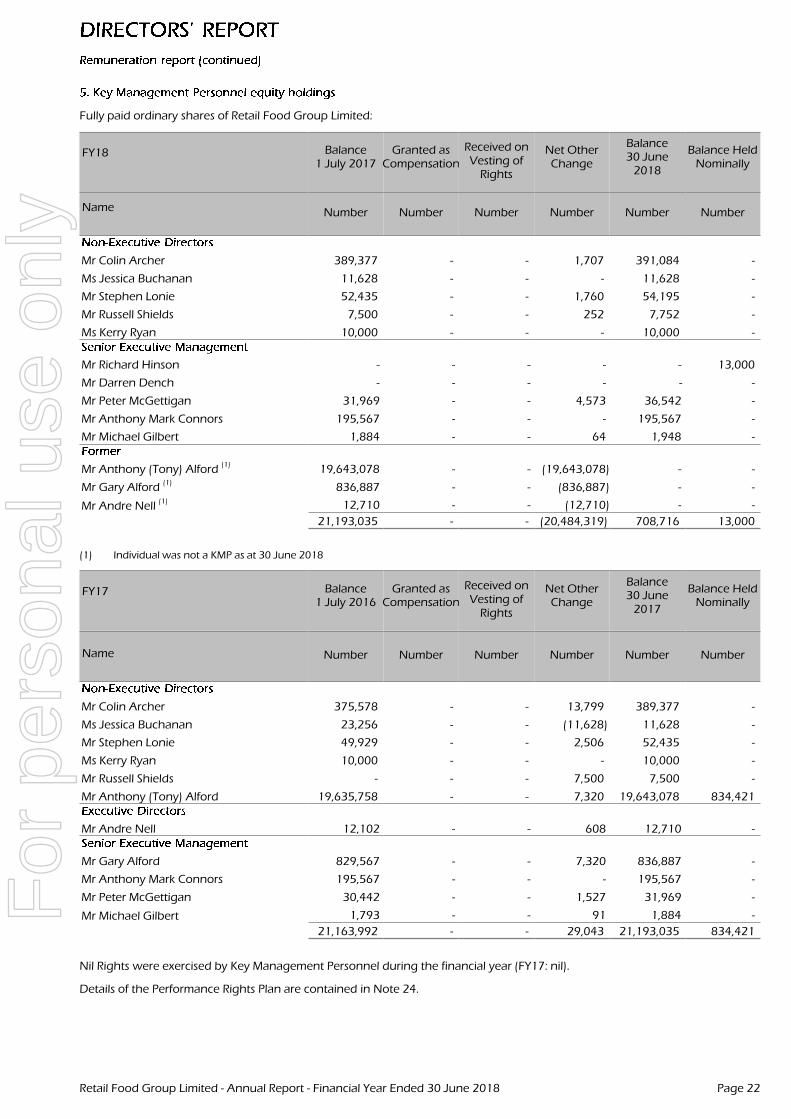
Fully paid ordinary shares of Retail Food Group Limited:
FY18 Balance1 July 2017
Granted asCompensation
Received onVesting of
Rights
Net OtherChange
Balance30 June
2018
Balance HeldNominally
Name Number Number Number Number Number Number
Mr Colin Archer 389,377 - - 1,707 391,084 -
Ms Jessica Buchanan 11,628 - - - 11,628 -
Mr Stephen Lonie 52,435 - - 1,760 54,195 -
Mr Russell Shields 7,500 - - 252 7,752 -
Ms Kerry Ryan 10,000 - - - 10,000 -
Mr Richard Hinson - - - - - 13,000
Mr Darren Dench - - - - - -
Mr Peter McGettigan 31,969 - - 4,573 36,542 -
Mr Anthony Mark Connors 195,567 - - - 195,567 -
Mr Michael Gilbert 1,884 - - 64 1,948 -
Mr Anthony (Tony) Alford(1)
19,643,078 - - (19,643,078) - -
Mr Gary Alford(1)
836,887 - - (836,887) - -
Mr Andre Nell(1) 12,710 - - (12,710) - -
21,193,035 - - (20,484,319) 708,716 13,000
(1) Individual was not a KMP as at 30 June 2018
FY17 Balance1 July 2016
Granted asCompensation
Received onVesting of
Rights
Net OtherChange
Balance30 June
2017
Balance HeldNominally
Name Number Number Number Number Number Number
Mr Colin Archer 375,578 - - 13,799 389,377 -
Ms Jessica Buchanan 23,256 - - (11,628) 11,628 -
Mr Stephen Lonie 49,929 - - 2,506 52,435 -
Ms Kerry Ryan 10,000 - - - 10,000 -
Mr Russell Shields - - - 7,500 7,500 -
Mr Anthony (Tony) Alford 19,635,758 - - 7,320 19,643,078 834,421
Mr Andre Nell 12,102 - - 608 12,710 -
Mr Gary Alford 829,567 - - 7,320 836,887 -
Mr Anthony Mark Connors 195,567 - - - 195,567 -
Mr Peter McGettigan 30,442 - - 1,527 31,969 -
Mr Michael Gilbert 1,793 - - 91 1,884 -
21,163,992 - - 29,043 21,193,035 834,421
Nil Rights were exercised by Key Management Personnel during the financial year (FY17: nil).
Details of the Performance Rights Plan are contained in Note 24.
Retail Food Group Limited - Annual Report - Financial Year Ended 30 June 2018 Page 22
For
per
sona
l use
onl
y
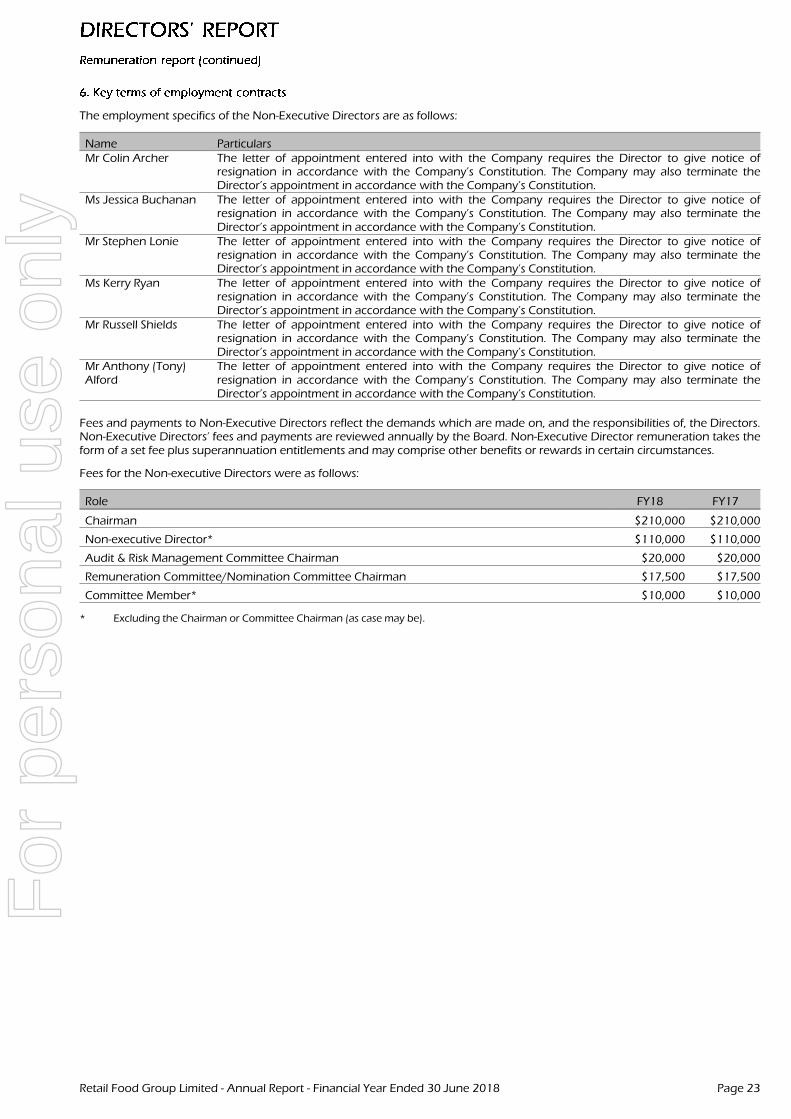
The employment specifics of the Non-Executive Directors are as follows:
Name ParticularsMr Colin Archer The letter of appointment entered into with the Company requires the Director to give notice of
resignation in accordance with the Company’s Constitution. The Company may also terminate theDirector’s appointment in accordance with the Company’s Constitution.
Ms Jessica Buchanan The letter of appointment entered into with the Company requires the Director to give notice ofresignation in accordance with the Company’s Constitution. The Company may also terminate theDirector’s appointment in accordance with the Company’s Constitution.
Mr Stephen Lonie The letter of appointment entered into with the Company requires the Director to give notice ofresignation in accordance with the Company’s Constitution. The Company may also terminate theDirector’s appointment in accordance with the Company’s Constitution.
Ms Kerry Ryan The letter of appointment entered into with the Company requires the Director to give notice ofresignation in accordance with the Company’s Constitution. The Company may also terminate theDirector’s appointment in accordance with the Company’s Constitution.
Mr Russell Shields The letter of appointment entered into with the Company requires the Director to give notice ofresignation in accordance with the Company’s Constitution. The Company may also terminate theDirector’s appointment in accordance with the Company’s Constitution.
Mr Anthony (Tony)Alford
The letter of appointment entered into with the Company requires the Director to give notice ofresignation in accordance with the Company’s Constitution. The Company may also terminate theDirector’s appointment in accordance with the Company’s Constitution.
Fees and payments to Non-Executive Directors reflect the demands which are made on, and the responsibilities of, the Directors.Non-Executive Directors’ fees and payments are reviewed annually by the Board. Non-Executive Director remuneration takes theform of a set fee plus superannuation entitlements and may comprise other benefits or rewards in certain circumstances.
Fees for the Non-executive Directors were as follows:
Role FY18 FY17
Chairman $210,000 $210,000
Non-executive Director* $110,000 $110,000
Audit & Risk Management Committee Chairman $20,000 $20,000
Remuneration Committee/Nomination Committee Chairman $17,500 $17,500
Committee Member* $10,000 $10,000
* Excluding the Chairman or Committee Chairman (as case may be).
Retail Food Group Limited - Annual Report - Financial Year Ended 30 June 2018 Page 23
For
per
sona
l use
onl
y
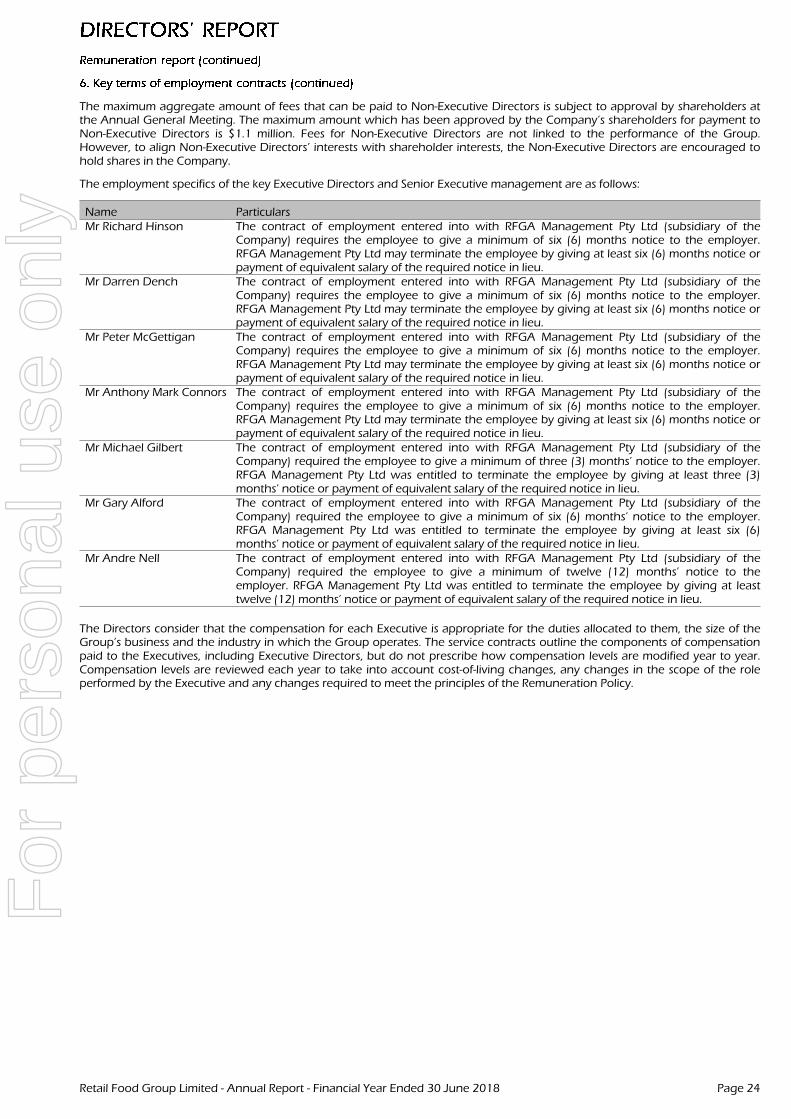
The maximum aggregate amount of fees that can be paid to Non-Executive Directors is subject to approval by shareholders atthe Annual General Meeting. The maximum amount which has been approved by the Company’s shareholders for payment toNon-Executive Directors is $1.1 million. Fees for Non-Executive Directors are not linked to the performance of the Group.However, to align Non-Executive Directors’ interests with shareholder interests, the Non-Executive Directors are encouraged tohold shares in the Company.
The employment specifics of the key Executive Directors and Senior Executive management are as follows:
Name ParticularsMr Richard Hinson The contract of employment entered into with RFGA Management Pty Ltd (subsidiary of the
Company) requires the employee to give a minimum of six (6) months notice to the employer.RFGA Management Pty Ltd may terminate the employee by giving at least six (6) months notice orpayment of equivalent salary of the required notice in lieu.
Mr Darren Dench The contract of employment entered into with RFGA Management Pty Ltd (subsidiary of theCompany) requires the employee to give a minimum of six (6) months notice to the employer.RFGA Management Pty Ltd may terminate the employee by giving at least six (6) months notice orpayment of equivalent salary of the required notice in lieu.
Mr Peter McGettigan The contract of employment entered into with RFGA Management Pty Ltd (subsidiary of theCompany) requires the employee to give a minimum of six (6) months notice to the employer.RFGA Management Pty Ltd may terminate the employee by giving at least six (6) months notice orpayment of equivalent salary of the required notice in lieu.
Mr Anthony Mark Connors The contract of employment entered into with RFGA Management Pty Ltd (subsidiary of theCompany) requires the employee to give a minimum of six (6) months notice to the employer.RFGA Management Pty Ltd may terminate the employee by giving at least six (6) months notice orpayment of equivalent salary of the required notice in lieu.
Mr Michael Gilbert The contract of employment entered into with RFGA Management Pty Ltd (subsidiary of theCompany) required the employee to give a minimum of three (3) months’ notice to the employer.RFGA Management Pty Ltd was entitled to terminate the employee by giving at least three (3)months’ notice or payment of equivalent salary of the required notice in lieu.
Mr Gary Alford The contract of employment entered into with RFGA Management Pty Ltd (subsidiary of theCompany) required the employee to give a minimum of six (6) months’ notice to the employer.RFGA Management Pty Ltd was entitled to terminate the employee by giving at least six (6)months’ notice or payment of equivalent salary of the required notice in lieu.
Mr Andre Nell The contract of employment entered into with RFGA Management Pty Ltd (subsidiary of theCompany) required the employee to give a minimum of twelve (12) months’ notice to theemployer. RFGA Management Pty Ltd was entitled to terminate the employee by giving at leasttwelve (12) months’ notice or payment of equivalent salary of the required notice in lieu.
The Directors consider that the compensation for each Executive is appropriate for the duties allocated to them, the size of theGroup’s business and the industry in which the Group operates. The service contracts outline the components of compensationpaid to the Executives, including Executive Directors, but do not prescribe how compensation levels are modified year to year.Compensation levels are reviewed each year to take into account cost-of-living changes, any changes in the scope of the roleperformed by the Executive and any changes required to meet the principles of the Remuneration Policy.
Retail Food Group Limited - Annual Report - Financial Year Ended 30 June 2018 Page 24
For
per
sona
l use
onl
y
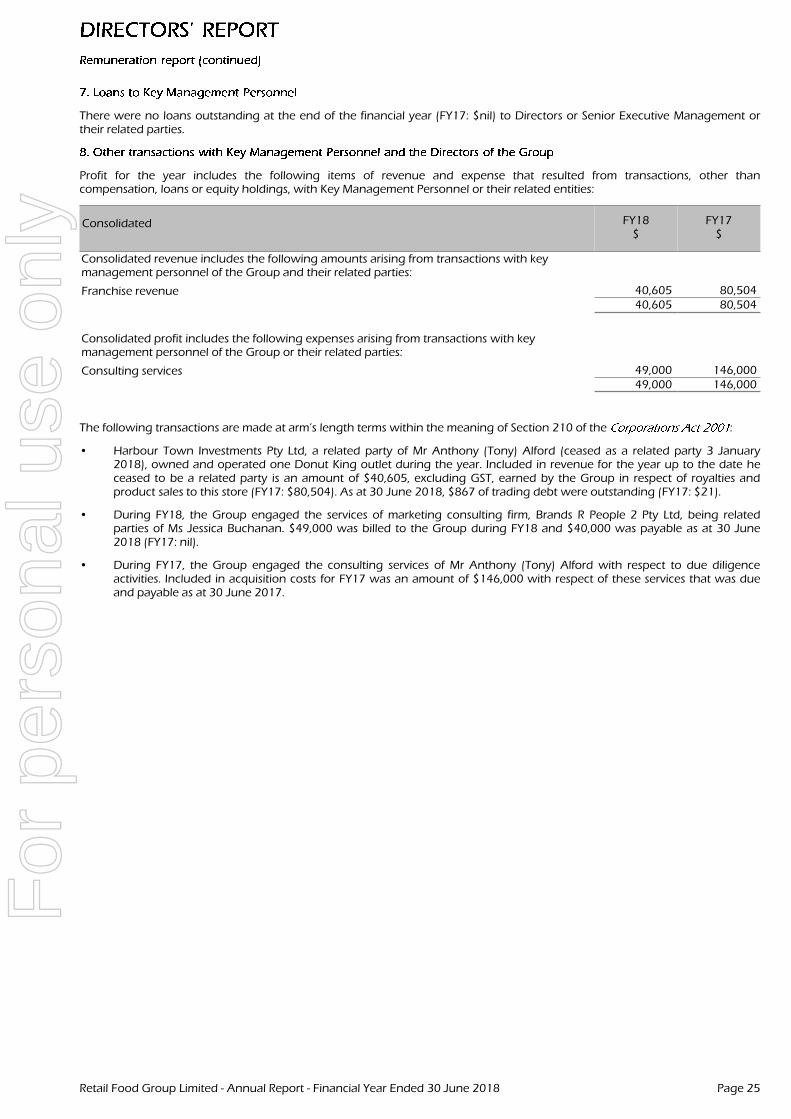
There were no loans outstanding at the end of the financial year (FY17: $nil) to Directors or Senior Executive Management ortheir related parties.
Profit for the year includes the following items of revenue and expense that resulted from transactions, other thancompensation, loans or equity holdings, with Key Management Personnel or their related entities:
Consolidated FY18$
FY17$
Consolidated revenue includes the following amounts arising from transactions with keymanagement personnel of the Group and their related parties:
Franchise revenue 40,605 80,50440,605 80,504
Consolidated profit includes the following expenses arising from transactions with keymanagement personnel of the Group or their related parties:
Consulting services 49,000 146,00049,000 146,000
The following transactions are made at arm’s length terms within the meaning of Section 210 of the :
• Harbour Town Investments Pty Ltd, a related party of Mr Anthony (Tony) Alford (ceased as a related party 3 January2018), owned and operated one Donut King outlet during the year. Included in revenue for the year up to the date heceased to be a related party is an amount of $40,605, excluding GST, earned by the Group in respect of royalties andproduct sales to this store (FY17: $80,504). As at 30 June 2018, $867 of trading debt were outstanding (FY17: $21).
• During FY18, the Group engaged the services of marketing consulting firm, Brands R People 2 Pty Ltd, being relatedparties of Ms Jessica Buchanan. $49,000 was billed to the Group during FY18 and $40,000 was payable as at 30 June2018 (FY17: nil).
• During FY17, the Group engaged the consulting services of Mr Anthony (Tony) Alford with respect to due diligenceactivities. Included in acquisition costs for FY17 was an amount of $146,000 with respect of these services that was dueand payable as at 30 June 2017.
Retail Food Group Limited - Annual Report - Financial Year Ended 30 June 2018 Page 25
For
per
sona
l use
onl
y
This Directors’ report is signed in accordance with a resolution of Directors made pursuant to s.298 (2) of the.
Mr Colin ArcherChairman and Independent Non-Executive Director
Southport31 August 2018
Retail Food Group Limited - Annual Report - Financial Year Ended 30 June 2018 Page 26
For
per
sona
l use
onl
y
PricewaterhouseCoopers, ABN 52 780 433 757 480 Queen Street, BRISBANE QLD 4000, GPO Box 150, BRISBANE QLD 4001 T: +61 7 3257 5000, F: +61 7 3257 5999, www.pwc.com.au
Liability limited by a scheme approved under Professional Standards Legislation.
27
Auditor’s Independence Declaration As lead auditor for the audit of Retail Food Group Limited for the year ended 30 June 2018, I declare that to the best of my knowledge and belief, there have been:
(a) no contraventions of the auditor independence requirements of the Corporations Act 2001 in relation to the audit; and
(b) no contraventions of any applicable code of professional conduct in relation to the audit.
This declaration is in respect of Retail Food Group Limited and the entities it controlled during the period.
Steven Bosiljevac Brisbane Partner PricewaterhouseCoopers
31 August 2018
For
per
sona
l use
onl
y
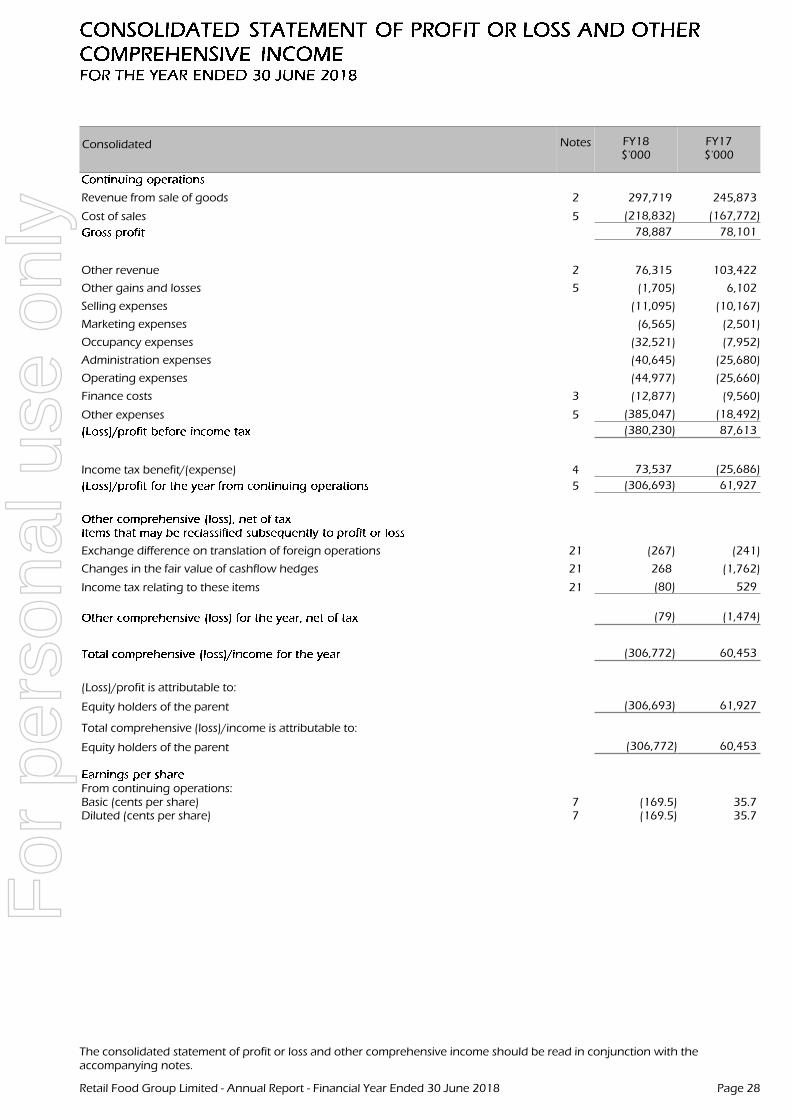
Consolidated Notes FY18$'000
FY17$'000
Revenue from sale of goods 2 297,719 245,873
Cost of sales 5 (218,832) (167,772)
78,887 78,101
Other revenue 2 76,315 103,422
Other gains and losses 5 (1,705) 6,102
Selling expenses (11,095) (10,167)
Marketing expenses (6,565) (2,501)
Occupancy expenses (32,521) (7,952)
Administration expenses (40,645) (25,680)
Operating expenses (44,977) (25,660)
Finance costs 3 (12,877) (9,560)
Other expenses 5 (385,047) (18,492)
(380,230) 87,613
Income tax benefit/(expense) 4 73,537 (25,686)
5 (306,693) 61,927
Exchange difference on translation of foreign operations 21 (267) (241)
Changes in the fair value of cashflow hedges 21 268 (1,762)
Income tax relating to these items 21 (80) 529Blank
(79) (1,474)
(306,772) 60,453
(Loss)/profit is attributable to:
Equity holders of the parent (306,693) 61,927
Total comprehensive (loss)/income is attributable to:
Equity holders of the parent (306,772) 60,453
space
From continuing operations:Basic (cents per share) 7 (169.5) 35.7Diluted (cents per share) 7 (169.5) 35.7
The consolidated statement of profit or loss and other comprehensive income should be read in conjunction with theaccompanying notes.
Retail Food Group Limited - Annual Report - Financial Year Ended 30 June 2018 Page 28
For
per
sona
l use
onl
y
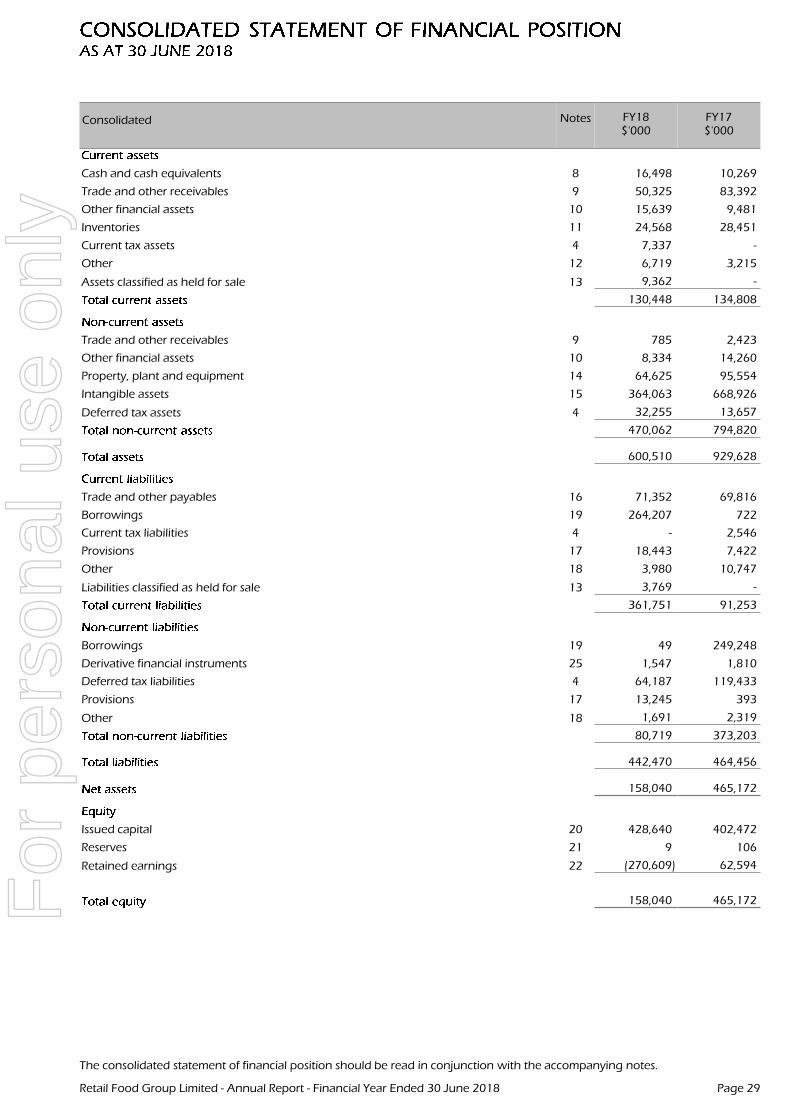
Consolidated Notes FY18$'000
FY17$'000
Cash and cash equivalents 8 16,498 10,269
Trade and other receivables 9 50,325 83,392
Other financial assets 10 15,639 9,481
Inventories 11 24,568 28,451
Current tax assets 4 7,337 -
Other 12 6,719 3,215
Assets classified as held for sale 13 9,362 -
130,448 134,808
Trade and other receivables 9 785 2,423
Other financial assets 10 8,334 14,260
Property, plant and equipment 14 64,625 95,554
Intangible assets 15 364,063 668,926
Deferred tax assets 4 32,255 13,657
470,062 794,820
600,510 929,628
Trade and other payables 16 71,352 69,816
Borrowings 19 264,207 722
Current tax liabilities 4 - 2,546
Provisions 17 18,443 7,422
Other 18 3,980 10,747
Liabilities classified as held for sale 13 3,769 -
361,751 91,253
Borrowings 19 49 249,248
Derivative financial instruments 25 1,547 1,810
Deferred tax liabilities 4 64,187 119,433
Provisions 17 13,245 393
Other 18 1,691 2,319
80,719 373,203
442,470 464,456
158,040 465,172
Issued capital 20 428,640 402,472
Reserves 21 9 106
Retained earnings 22 (270,609) 62,594
158,040 465,172
The consolidated statement of financial position should be read in conjunction with the accompanying notes.
Retail Food Group Limited - Annual Report - Financial Year Ended 30 June 2018 Page 29
For
per
sona
l use
onl
y
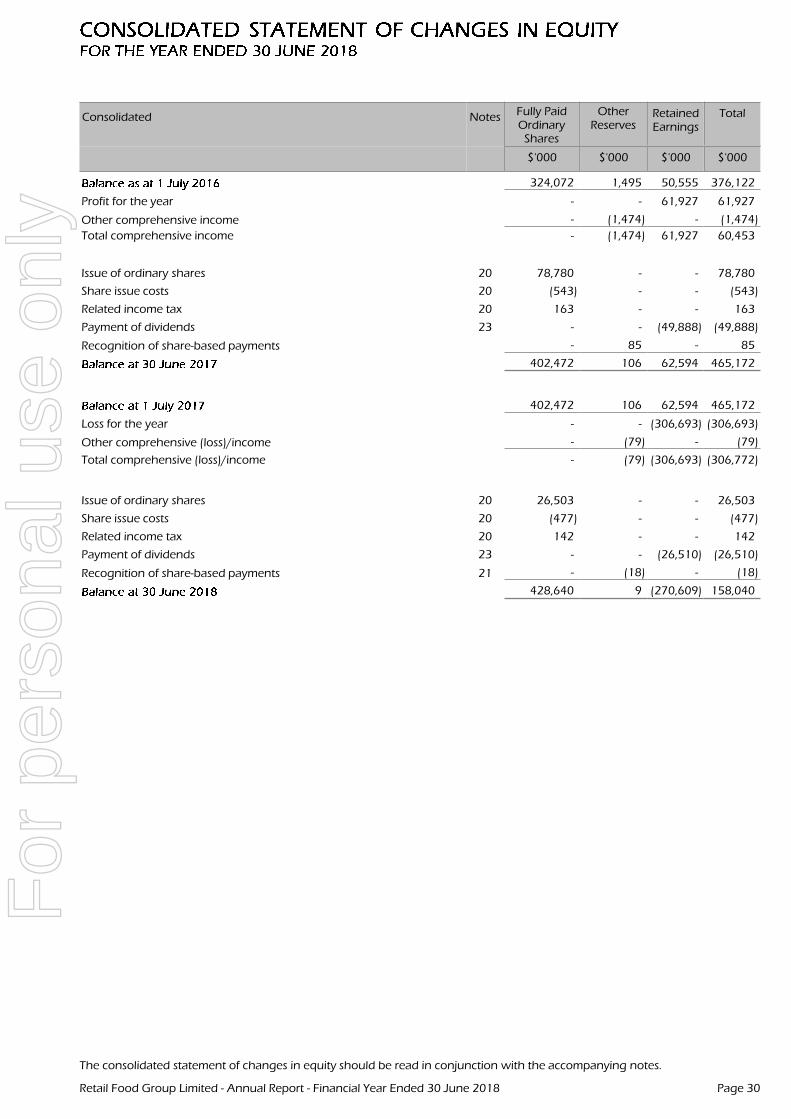
Consolidated Notes Fully PaidOrdinary
Shares
OtherReserves
RetainedEarnings
Total
$'000 $'000 $'000 $'000
324,072 1,495 50,555 376,122
Profit for the year - - 61,927 61,927
Other comprehensive income - (1,474) - (1,474)
Total comprehensive income - (1,474) 61,927 60,453
Issue of ordinary shares 20 78,780 - - 78,780
Share issue costs 20 (543) - - (543)
Related income tax 20 163 - - 163
Payment of dividends 23 - - (49,888) (49,888)
Recognition of share-based payments - 85 - 85
402,472 106 62,594 465,172
402,472 106 62,594 465,172
Loss for the year - - (306,693) (306,693)
Other comprehensive (loss)/income - (79) - (79)
Total comprehensive (loss)/income - (79) (306,693) (306,772)
Issue of ordinary shares 20 26,503 - - 26,503
Share issue costs 20 (477) - - (477)
Related income tax 20 142 - - 142
Payment of dividends 23 - - (26,510) (26,510)
Recognition of share-based payments 21 - (18) - (18)
428,640 9 (270,609) 158,040
The consolidated statement of changes in equity should be read in conjunction with the accompanying notes.
Retail Food Group Limited - Annual Report - Financial Year Ended 30 June 2018 Page 30
For
per
sona
l use
onl
y
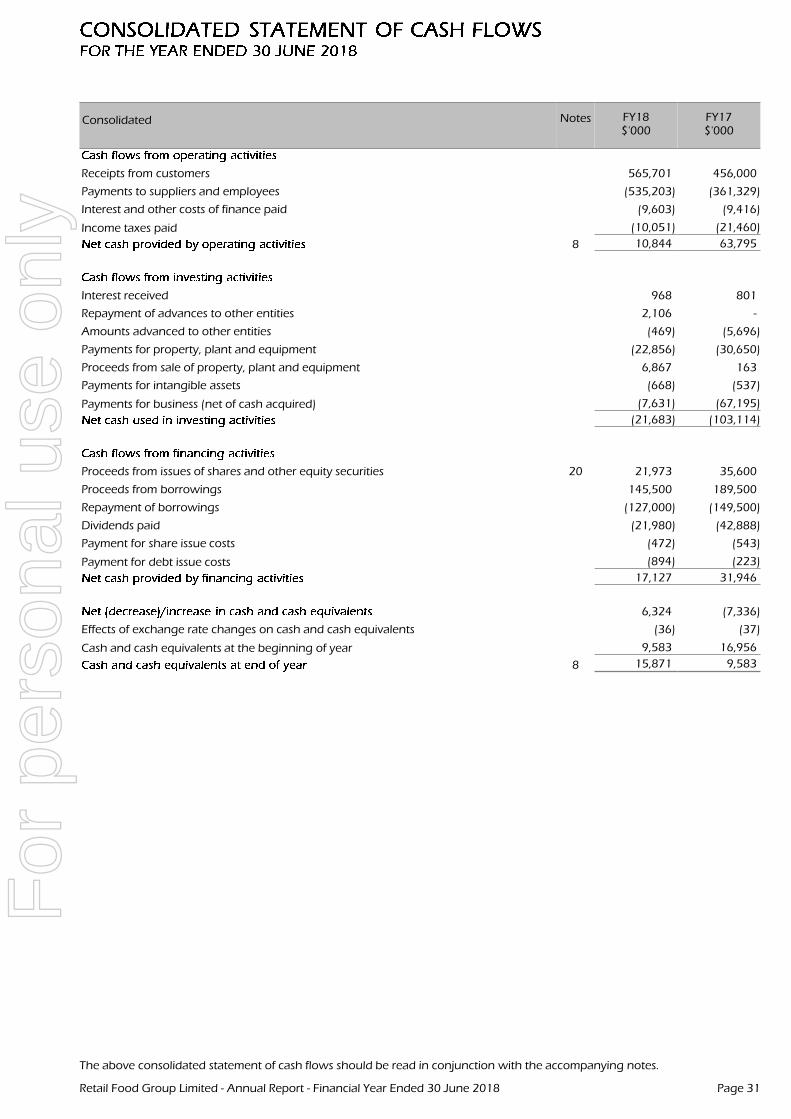
Consolidated Notes FY18$'000
FY17$'000
Receipts from customers 565,701 456,000
Payments to suppliers and employees (535,203) (361,329)
Interest and other costs of finance paid (9,603) (9,416)
Income taxes paid (10,051) (21,460)
8 10,844 63,795
Interest received 968 801
Repayment of advances to other entities 2,106 -
Amounts advanced to other entities (469) (5,696)
Payments for property, plant and equipment (22,856) (30,650)
Proceeds from sale of property, plant and equipment 6,867 163
Payments for intangible assets (668) (537)
Payments for business (net of cash acquired) (7,631) (67,195)
(21,683) (103,114)
Proceeds from issues of shares and other equity securities 20 21,973 35,600
Proceeds from borrowings 145,500 189,500
Repayment of borrowings (127,000) (149,500)
Dividends paid (21,980) (42,888)
Payment for share issue costs (472) (543)
Payment for debt issue costs (894) (223)
17,127 31,946
6,324 (7,336)
Effects of exchange rate changes on cash and cash equivalents (36) (37)
Cash and cash equivalents at the beginning of year 9,583 16,956
8 15,871 9,583
The above consolidated statement of cash flows should be read in conjunction with the accompanying notes.
Retail Food Group Limited - Annual Report - Financial Year Ended 30 June 2018 Page 31
For
per
sona
l use
onl
y
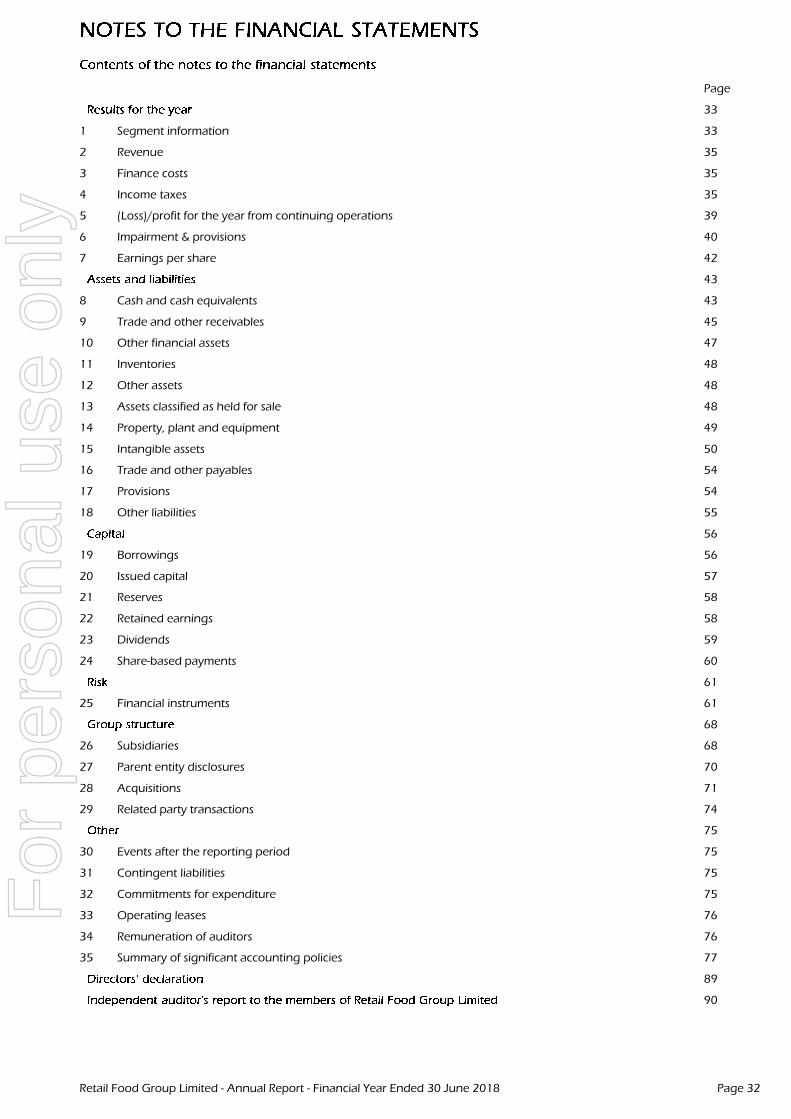
Page
33
1 Segment information 33
2 Revenue 35
3 Finance costs 35
4 Income taxes 35
5 (Loss)/profit for the year from continuing operations 39
6 Impairment & provisions 40
7 Earnings per share 42
43
8 Cash and cash equivalents 43
9 Trade and other receivables 45
10 Other financial assets 47
11 Inventories 48
12 Other assets 48
13 Assets classified as held for sale 48
14 Property, plant and equipment 49
15 Intangible assets 50
16 Trade and other payables 54
17 Provisions 54
18 Other liabilities 55
56
19 Borrowings 56
20 Issued capital 57
21 Reserves 58
22 Retained earnings 58
23 Dividends 59
24 Share-based payments 60
61
25 Financial instruments 61
68
26 Subsidiaries 68
27 Parent entity disclosures 70
28 Acquisitions 71
29 Related party transactions 74
75
30 Events after the reporting period 75
31 Contingent liabilities 75
32 Commitments for expenditure 75
33 Operating leases 76
34 Remuneration of auditors 76
35 Summary of significant accounting policies 77
89
90
Retail Food Group Limited - Annual Report - Financial Year Ended 30 June 2018 Page 32
For
per
sona
l use
onl
y
AASB 8 Operating Segments requires operating segments to be identified on the basis of internal reports about components ofthe Group that are reviewed regularly by the Chief Operating Decision Makers (CODMs), in order to allocate resources to thesegments and to assess their performance.
For management purposes, the Group is organised into five major operating divisions. These divisions are the basis upon whichthe Group reports its primary segment information. The Group’s reportable segments under AASB 8 are as follows:
• Bakery/Café Division (incorporating Michel's Patisserie, Donut King and Brumby's Bakery Brand Systems);• QSR Division (incorporating Crust Gourmet Pizza and Pizza Capers Brand Systems);• Coffee Retail Division (incorporating Gloria Jean's Coffees, Esquires, Café2U and The Coffee Guy Brand Systems);• Di Bella Coffee (incorporating wholesale coffee operations); and• Commercial Food Service (incorporating procurement, warehousing, manufacturing and distribution operations).
Revenue from external parties reported to the CODMs is measured in a manner consistent with that in the consolidatedstatement of comprehensive income. Sales between segments are carried out at arm’s length and are eliminated onconsolidation, and identified as Inter-segment revenue as presented in Note 1.3.
The CODMs assess the performance of the operating segments based on a measure of segment EBITDA.
Retail Food Group Limited - Annual Report - Financial Year Ended 30 June 2018 Page 33
For
per
sona
l use
onl
y
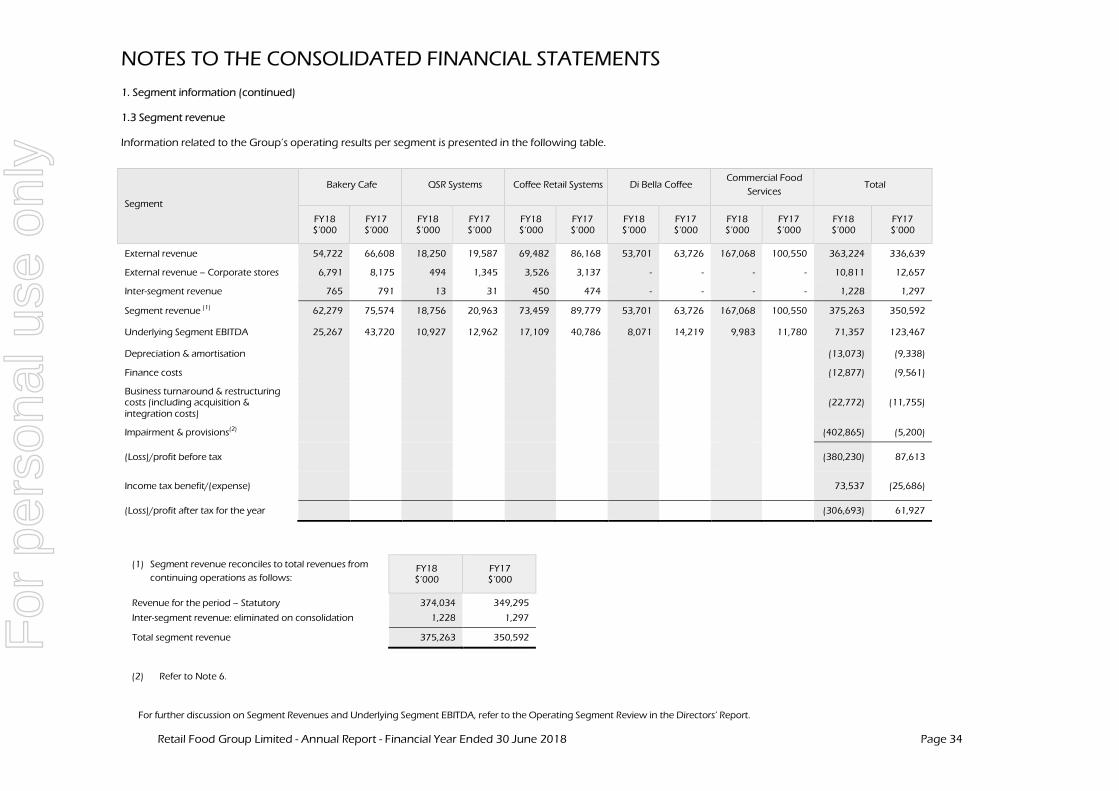
NOTES TO THE CONSOLIDATED FINANCIAL STATEMENTS
Retail Food Group Limited - Annual Report - Financial Year Ended 30 June 2018 Page 34
1. Segment information (continued) 1.3 Segment revenue Information related to the Group’s operating results per segment is presented in the following table.
Segment
Bakery Cafe QSR Systems Coffee Retail Systems Di Bella Coffee Commercial Food
Services Total
FY18 $’000
FY17 $’000
FY18 $’000
FY17 $’000
FY18 $’000
FY17 $’000
FY18 $’000
FY17 $’000
FY18 $’000
FY17 $’000
FY18 $’000
FY17 $’000
External revenue 54,722 66,608 18,250 19,587 69,482 86,168 53,701 63,726 167,068 100,550 363,224 336,639
External revenue – Corporate stores 6,791 8,175 494 1,345 3,526 3,137 - - - - 10,811 12,657
Inter-segment revenue 765 791 13 31 450 474 - - - - 1,228 1,297
Segment revenue (1) 62,279 75,574 18,756 20,963 73,459 89,779 53,701 63,726 167,068 100,550 375,263 350,592
Underlying Segment EBITDA 25,267 43,720 10,927 12,962 17,109 40,786 8,071 14,219 9,983 11,780 71,357 123,467
Depreciation & amortisation (13,073) (9,338)
Finance costs (12,877) (9,561)
Business turnaround & restructuring costs (including acquisition & integration costs)
(22,772) (11,755)
Impairment & provisions(2) (402,865) (5,200)
(Loss)/profit before tax
(380,230) 87,613
Income tax benefit/(expense)
73,537 (25,686)
(Loss)/profit after tax for the year (306,693) 61,927
(1) Segment revenue reconciles to total revenues from
continuing operations as follows: FY18 $’000
FY17 $’000
Revenue for the period – Statutory 374,034 349,295
Inter-segment revenue: eliminated on consolidation 1,228 1,297
Total segment revenue 375,263 350,592
(2) Refer to Note 6.
For further discussion on Segment Revenues and Underlying Segment EBITDA, refer to the Operating Segment Review in the Directors’ Report.
For
per
sona
l use
onl
y
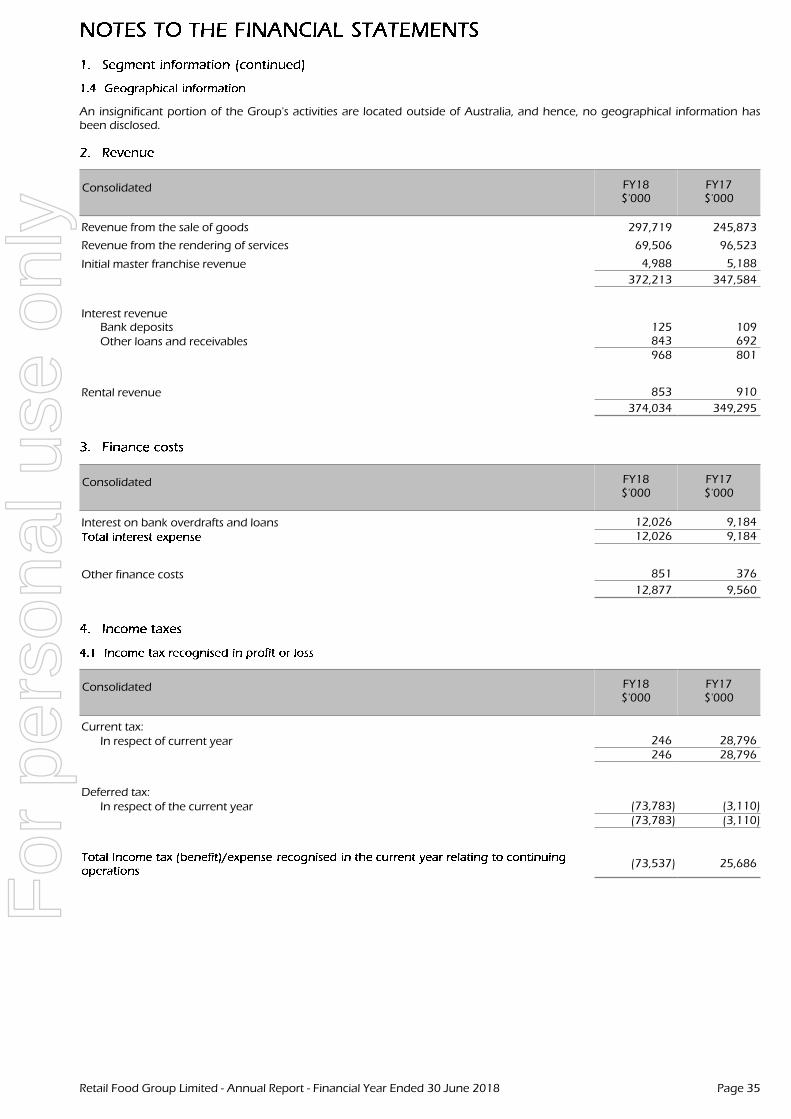
An insignificant portion of the Group's activities are located outside of Australia, and hence, no geographical information hasbeen disclosed.
Consolidated FY18$'000
FY17$'000
Revenue from the sale of goods 297,719 245,873
Revenue from the rendering of services 69,506 96,523
Initial master franchise revenue 4,988 5,188
372,213 347,584
Interest revenueBank deposits 125 109Other loans and receivables 843 692
968 801
Rental revenue 853 910
374,034 349,295
Consolidated FY18$'000
FY17$'000
Interest on bank overdrafts and loans 12,026 9,18412,026 9,184
Other finance costs 851 376
12,877 9,560
Consolidated FY18$'000
FY17$'000
Current tax:In respect of current year 246 28,796
246 28,796
Deferred tax:In respect of the current year (73,783) (3,110)
(73,783) (3,110)
(73,537) 25,686
Retail Food Group Limited - Annual Report - Financial Year Ended 30 June 2018 Page 35
For
per
sona
l use
onl
y
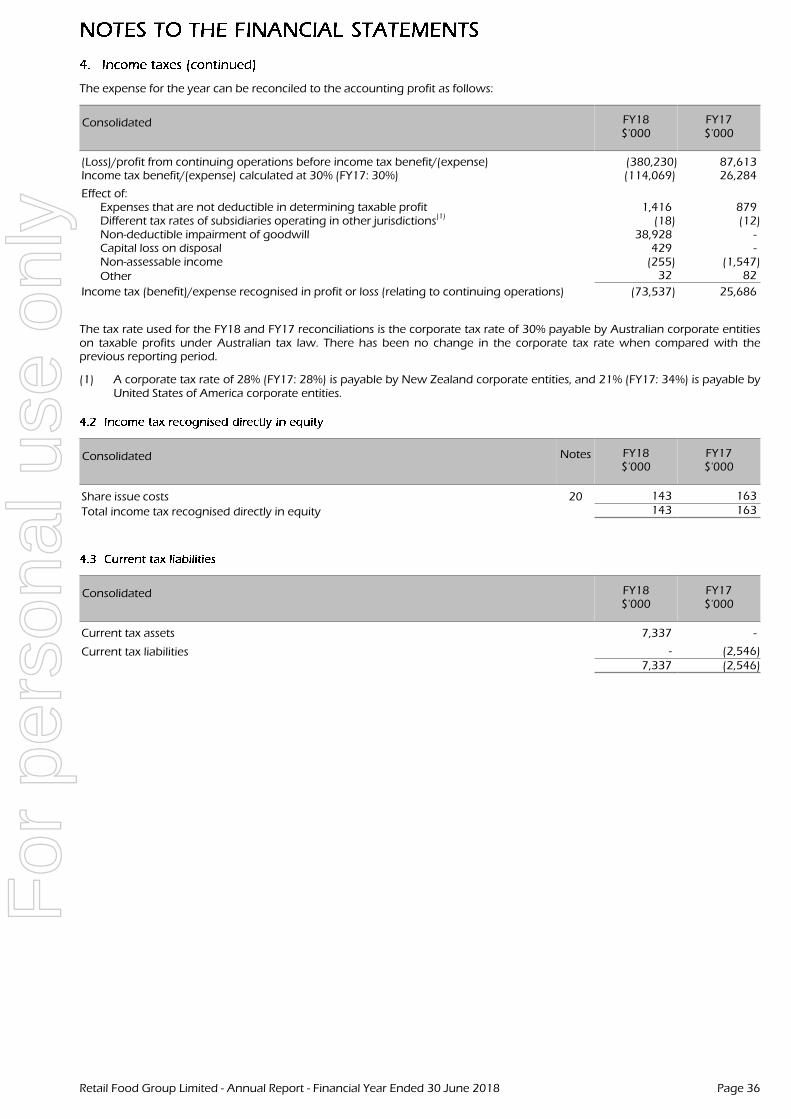
The expense for the year can be reconciled to the accounting profit as follows:
Consolidated FY18$'000
FY17$'000
(Loss)/profit from continuing operations before income tax benefit/(expense) (380,230) 87,613Income tax benefit/(expense) calculated at 30% (FY17: 30%) (114,069) 26,284
Effect of:Expenses that are not deductible in determining taxable profit 1,416 879Different tax rates of subsidiaries operating in other jurisdictions
(1)(18) (12)
Non-deductible impairment of goodwill 38,928 -Capital loss on disposal 429 -Non-assessable income (255) (1,547)Other 32 82
Income tax (benefit)/expense recognised in profit or loss (relating to continuing operations) (73,537) 25,686
The tax rate used for the FY18 and FY17 reconciliations is the corporate tax rate of 30% payable by Australian corporate entitieson taxable profits under Australian tax law. There has been no change in the corporate tax rate when compared with theprevious reporting period.
(1) A corporate tax rate of 28% (FY17: 28%) is payable by New Zealand corporate entities, and 21% (FY17: 34%) is payable byUnited States of America corporate entities.
Consolidated Notes FY18$'000
FY17$'000
Share issue costs 20 143 163
Total income tax recognised directly in equity 143 163
Consolidated FY18$'000
FY17$'000
Current tax assets 7,337 -
Current tax liabilities - (2,546)7,337 (2,546)
Retail Food Group Limited - Annual Report - Financial Year Ended 30 June 2018 Page 36
For
per
sona
l use
onl
y
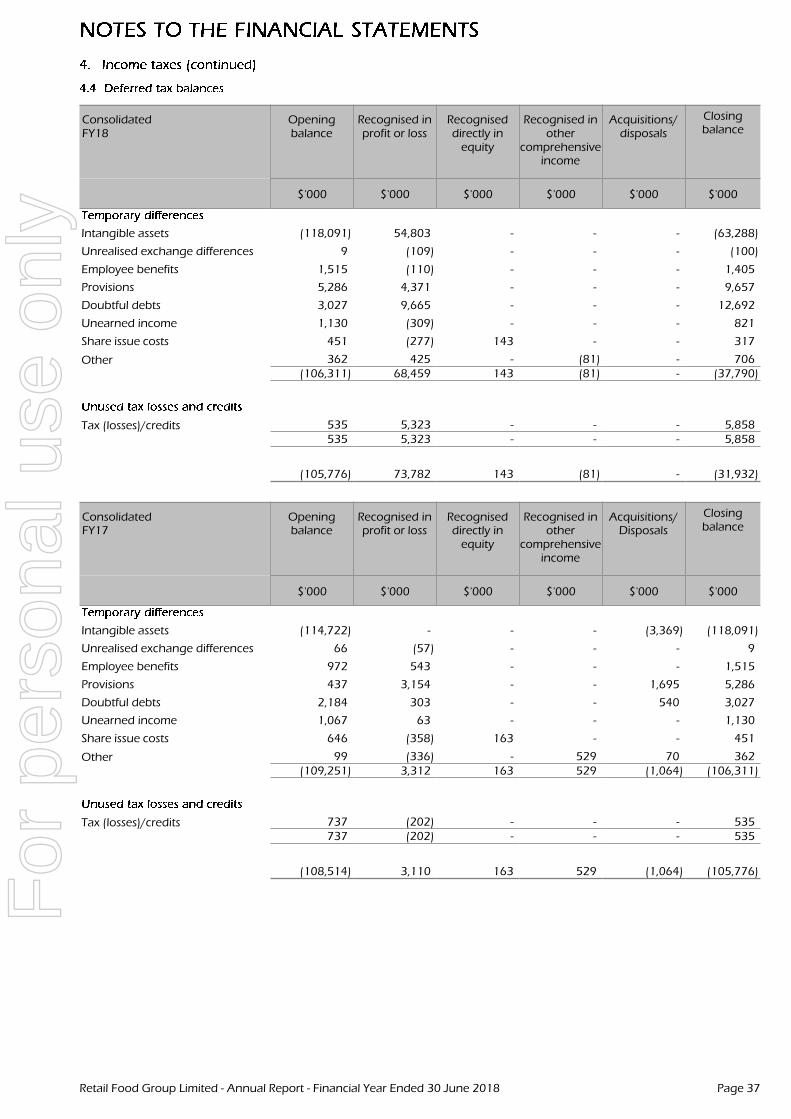
ConsolidatedFY18
Openingbalance
Recognised inprofit or loss
Recogniseddirectly in
equity
Recognised inother
comprehensiveincome
Acquisitions/disposals
Closingbalance
$'000 $'000 $'000 $'000 $'000 $'000
Intangible assets (118,091) 54,803 - - - (63,288)
Unrealised exchange differences 9 (109) - - - (100)
Employee benefits 1,515 (110) - - - 1,405
Provisions 5,286 4,371 - - - 9,657
Doubtful debts 3,027 9,665 - - - 12,692
Unearned income 1,130 (309) - - - 821
Share issue costs 451 (277) 143 - - 317
Other 362 425 - (81) - 706(106,311) 68,459 143 (81) - (37,790)
Tax (losses)/credits 535 5,323 - - - 5,858535 5,323 - - - 5,858
(105,776) 73,782 143 (81) - (31,932)
ConsolidatedFY17
Openingbalance
Recognised inprofit or loss
Recogniseddirectly in
equity
Recognised inother
comprehensiveincome
Acquisitions/Disposals
Closingbalance
$'000 $'000 $'000 $'000 $'000 $'000
Intangible assets (114,722) - - - (3,369) (118,091)
Unrealised exchange differences 66 (57) - - - 9
Employee benefits 972 543 - - - 1,515
Provisions 437 3,154 - - 1,695 5,286
Doubtful debts 2,184 303 - - 540 3,027
Unearned income 1,067 63 - - - 1,130
Share issue costs 646 (358) 163 - - 451
Other 99 (336) - 529 70 362(109,251) 3,312 163 529 (1,064) (106,311)
Tax (losses)/credits 737 (202) - - - 535737 (202) - - - 535
(108,514) 3,110 163 529 (1,064) (105,776)
Retail Food Group Limited - Annual Report - Financial Year Ended 30 June 2018 Page 37
For
per
sona
l use
onl
y
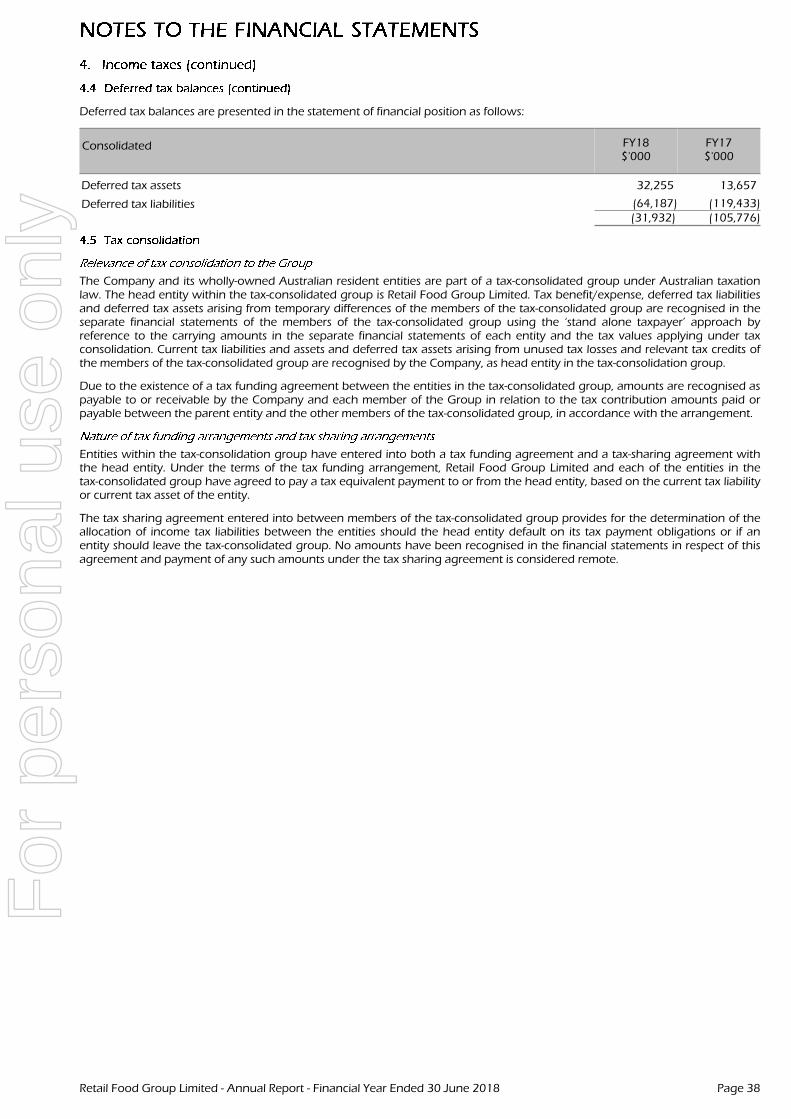
Deferred tax balances are presented in the statement of financial position as follows:
Consolidated FY18$'000
FY17$'000
Deferred tax assets 32,255 13,657
Deferred tax liabilities (64,187) (119,433)(31,932) (105,776)
The Company and its wholly-owned Australian resident entities are part of a tax-consolidated group under Australian taxationlaw. The head entity within the tax-consolidated group is Retail Food Group Limited. Tax benefit/expense, deferred tax liabilitiesand deferred tax assets arising from temporary differences of the members of the tax-consolidated group are recognised in theseparate financial statements of the members of the tax-consolidated group using the ‘stand alone taxpayer’ approach byreference to the carrying amounts in the separate financial statements of each entity and the tax values applying under taxconsolidation. Current tax liabilities and assets and deferred tax assets arising from unused tax losses and relevant tax credits ofthe members of the tax-consolidated group are recognised by the Company, as head entity in the tax-consolidation group.
Due to the existence of a tax funding agreement between the entities in the tax-consolidated group, amounts are recognised aspayable to or receivable by the Company and each member of the Group in relation to the tax contribution amounts paid orpayable between the parent entity and the other members of the tax-consolidated group, in accordance with the arrangement.
Entities within the tax-consolidation group have entered into both a tax funding agreement and a tax-sharing agreement withthe head entity. Under the terms of the tax funding arrangement, Retail Food Group Limited and each of the entities in thetax-consolidated group have agreed to pay a tax equivalent payment to or from the head entity, based on the current tax liabilityor current tax asset of the entity.
The tax sharing agreement entered into between members of the tax-consolidated group provides for the determination of theallocation of income tax liabilities between the entities should the head entity default on its tax payment obligations or if anentity should leave the tax-consolidated group. No amounts have been recognised in the financial statements in respect of thisagreement and payment of any such amounts under the tax sharing agreement is considered remote.
Retail Food Group Limited - Annual Report - Financial Year Ended 30 June 2018 Page 38
For
per
sona
l use
onl
y
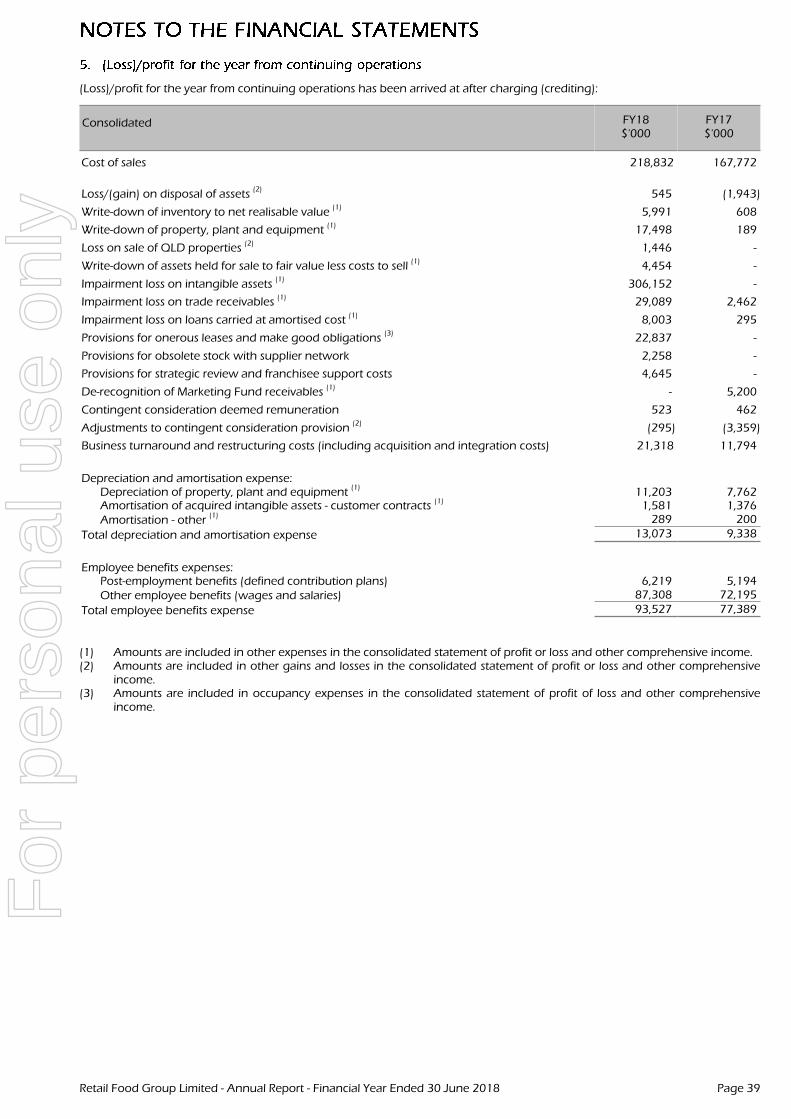
(Loss)/profit for the year from continuing operations has been arrived at after charging (crediting):
Consolidated FY18$'000
FY17$'000
Cost of sales 218,832 167,772
Loss/(gain) on disposal of assets(2)
545 (1,943)
Write-down of inventory to net realisable value(1)
5,991 608
Write-down of property, plant and equipment (1) 17,498 189
Loss on sale of QLD properties (2) 1,446 -
Write-down of assets held for sale to fair value less costs to sell(1)
4,454 -
Impairment loss on intangible assets(1)
306,152 -
Impairment loss on trade receivables (1) 29,089 2,462
Impairment loss on loans carried at amortised cost (1) 8,003 295
Provisions for onerous leases and make good obligations(3)
22,837 -
Provisions for obsolete stock with supplier network 2,258 -
Provisions for strategic review and franchisee support costs 4,645 -
De-recognition of Marketing Fund receivables (1) - 5,200
Contingent consideration deemed remuneration 523 462
Adjustments to contingent consideration provision(2)
(295) (3,359)
Business turnaround and restructuring costs (including acquisition and integration costs) 21,318 11,794
Depreciation and amortisation expense:Depreciation of property, plant and equipment
(1)11,203 7,762
Amortisation of acquired intangible assets - customer contracts (1) 1,581 1,376Amortisation - other
(1) 289 200
Total depreciation and amortisation expense 13,073 9,338
Employee benefits expenses:Post-employment benefits (defined contribution plans) 6,219 5,194Other employee benefits (wages and salaries) 87,308 72,195
Total employee benefits expense 93,527 77,389
(1) Amounts are included in other expenses in the consolidated statement of profit or loss and other comprehensive income.(2) Amounts are included in other gains and losses in the consolidated statement of profit or loss and other comprehensive
income.(3) Amounts are included in occupancy expenses in the consolidated statement of profit of loss and other comprehensive
income.
Retail Food Group Limited - Annual Report - Financial Year Ended 30 June 2018 Page 39
For
per
sona
l use
onl
y
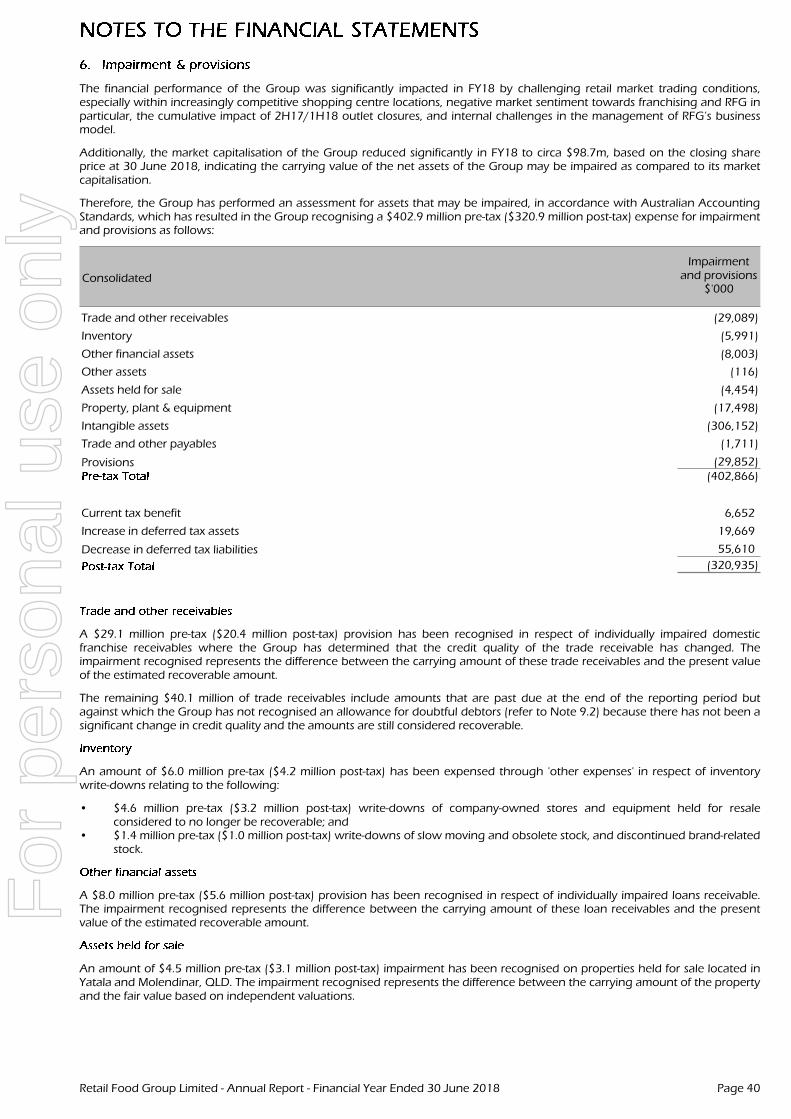
The financial performance of the Group was significantly impacted in FY18 by challenging retail market trading conditions,especially within increasingly competitive shopping centre locations, negative market sentiment towards franchising and RFG inparticular, the cumulative impact of 2H17/1H18 outlet closures, and internal challenges in the management of RFG’s businessmodel.
Additionally, the market capitalisation of the Group reduced significantly in FY18 to circa $98.7m, based on the closing shareprice at 30 June 2018, indicating the carrying value of the net assets of the Group may be impaired as compared to its marketcapitalisation.
Therefore, the Group has performed an assessment for assets that may be impaired, in accordance with Australian AccountingStandards, which has resulted in the Group recognising a $402.9 million pre-tax ($320.9 million post-tax) expense for impairmentand provisions as follows:
Consolidated
Impairmentand provisions
$'000
Trade and other receivables (29,089)
Inventory (5,991)
Other financial assets (8,003)
Other assets (116)
Assets held for sale (4,454)
Property, plant & equipment (17,498)
Intangible assets (306,152)
Trade and other payables (1,711)
Provisions (29,852)(402,866)
Current tax benefit 6,652
Increase in deferred tax assets 19,669
Decrease in deferred tax liabilities 55,610
(320,935)
A $29.1 million pre-tax ($20.4 million post-tax) provision has been recognised in respect of individually impaired domesticfranchise receivables where the Group has determined that the credit quality of the trade receivable has changed. Theimpairment recognised represents the difference between the carrying amount of these trade receivables and the present valueof the estimated recoverable amount.
The remaining $40.1 million of trade receivables include amounts that are past due at the end of the reporting period butagainst which the Group has not recognised an allowance for doubtful debtors (refer to Note 9.2) because there has not been asignificant change in credit quality and the amounts are still considered recoverable.
An amount of $6.0 million pre-tax ($4.2 million post-tax) has been expensed through 'other expenses' in respect of inventorywrite-downs relating to the following:
• $4.6 million pre-tax ($3.2 million post-tax) write-downs of company-owned stores and equipment held for resaleconsidered to no longer be recoverable; and
• $1.4 million pre-tax ($1.0 million post-tax) write-downs of slow moving and obsolete stock, and discontinued brand-relatedstock.
A $8.0 million pre-tax ($5.6 million post-tax) provision has been recognised in respect of individually impaired loans receivable.The impairment recognised represents the difference between the carrying amount of these loan receivables and the presentvalue of the estimated recoverable amount.
An amount of $4.5 million pre-tax ($3.1 million post-tax) impairment has been recognised on properties held for sale located inYatala and Molendinar, QLD. The impairment recognised represents the difference between the carrying amount of the propertyand the fair value based on independent valuations.
Retail Food Group Limited - Annual Report - Financial Year Ended 30 June 2018 Page 40
For
per
sona
l use
onl
y
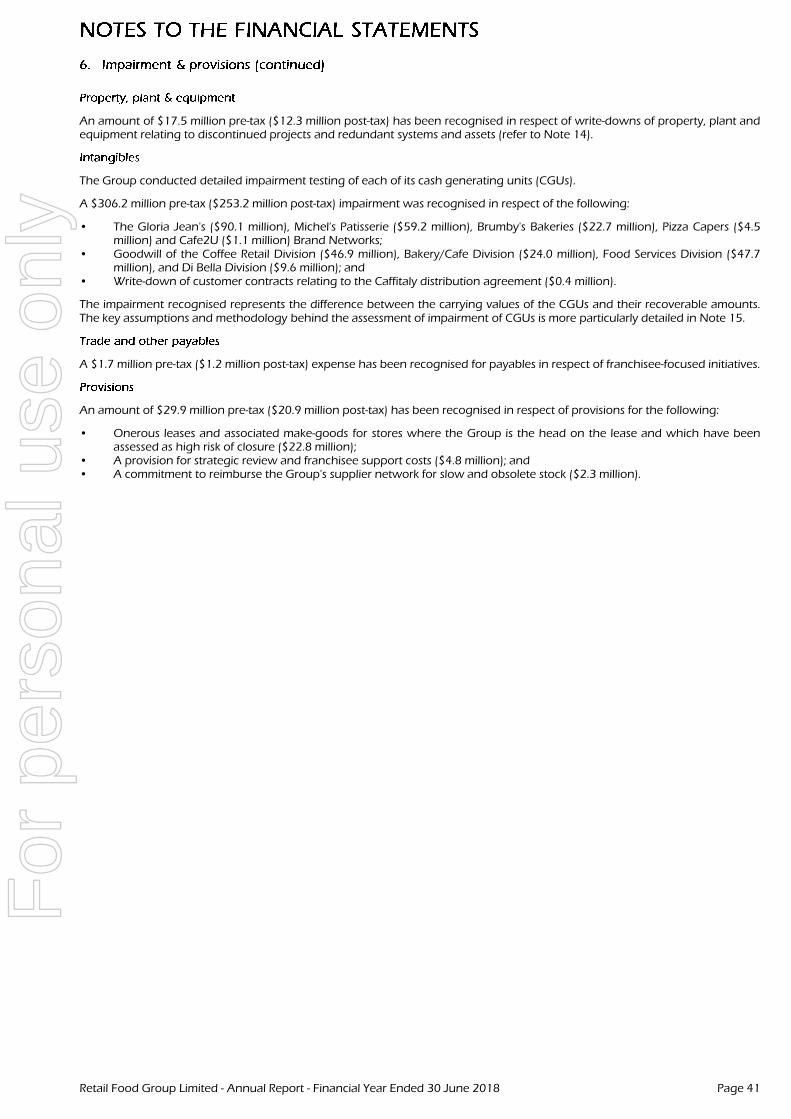
An amount of $17.5 million pre-tax ($12.3 million post-tax) has been recognised in respect of write-downs of property, plant andequipment relating to discontinued projects and redundant systems and assets (refer to Note 14).
The Group conducted detailed impairment testing of each of its cash generating units (CGUs).
A $306.2 million pre-tax ($253.2 million post-tax) impairment was recognised in respect of the following:
• The Gloria Jean's ($90.1 million), Michel's Patisserie ($59.2 million), Brumby's Bakeries ($22.7 million), Pizza Capers ($4.5million) and Cafe2U ($1.1 million) Brand Networks;
• Goodwill of the Coffee Retail Division ($46.9 million), Bakery/Cafe Division ($24.0 million), Food Services Division ($47.7million), and Di Bella Division ($9.6 million); and
• Write-down of customer contracts relating to the Caffitaly distribution agreement ($0.4 million).
The impairment recognised represents the difference between the carrying values of the CGUs and their recoverable amounts.The key assumptions and methodology behind the assessment of impairment of CGUs is more particularly detailed in Note 15.
A $1.7 million pre-tax ($1.2 million post-tax) expense has been recognised for payables in respect of franchisee-focused initiatives.
An amount of $29.9 million pre-tax ($20.9 million post-tax) has been recognised in respect of provisions for the following:
• Onerous leases and associated make-goods for stores where the Group is the head on the lease and which have beenassessed as high risk of closure ($22.8 million);
• A provision for strategic review and franchisee support costs ($4.8 million); and• A commitment to reimburse the Group's supplier network for slow and obsolete stock ($2.3 million).
Retail Food Group Limited - Annual Report - Financial Year Ended 30 June 2018 Page 41
For
per
sona
l use
onl
y
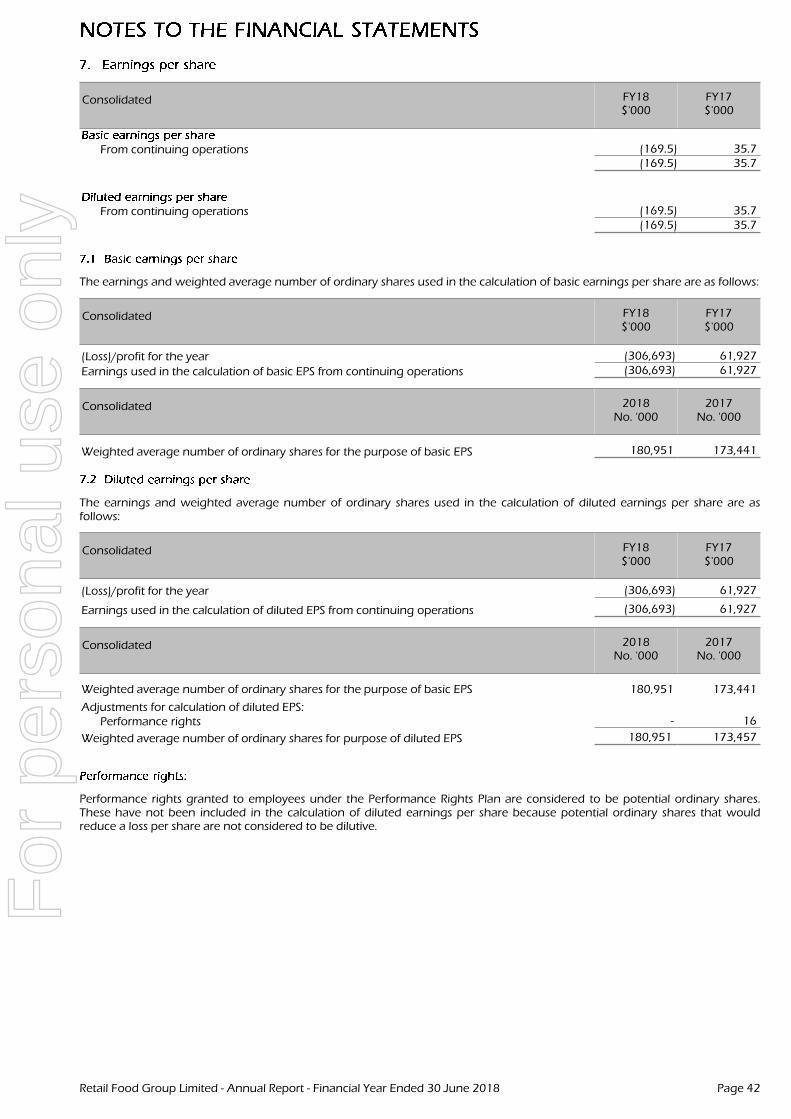
Consolidated FY18$'000
FY17$'000
From continuing operations (169.5) 35.7(169.5) 35.7
From continuing operations (169.5) 35.7(169.5) 35.7
The earnings and weighted average number of ordinary shares used in the calculation of basic earnings per share are as follows:
Consolidated FY18$'000
FY17$'000
(Loss)/profit for the year (306,693) 61,927
Earnings used in the calculation of basic EPS from continuing operations (306,693) 61,927
Consolidated 2018No. '000
2017No. '000
Weighted average number of ordinary shares for the purpose of basic EPS 180,951 173,441
The earnings and weighted average number of ordinary shares used in the calculation of diluted earnings per share are asfollows:
Consolidated FY18$'000
FY17$'000
(Loss)/profit for the year (306,693) 61,927
Earnings used in the calculation of diluted EPS from continuing operations (306,693) 61,927
Consolidated 2018No. '000
2017No. '000
Weighted average number of ordinary shares for the purpose of basic EPS 180,951 173,441
Adjustments for calculation of diluted EPS:Performance rights - 16
Weighted average number of ordinary shares for purpose of diluted EPS 180,951 173,457
Performance rights granted to employees under the Performance Rights Plan are considered to be potential ordinary shares.These have not been included in the calculation of diluted earnings per share because potential ordinary shares that wouldreduce a loss per share are not considered to be dilutive.
Retail Food Group Limited - Annual Report - Financial Year Ended 30 June 2018 Page 42
For
per
sona
l use
onl
y
For the purposes of the consolidated statement of cash flows, cash and cash equivalents includes cash on hand and in banksand investments in money market instruments, net of outstanding bank overdrafts. Cash and cash equivalents at the end of thereporting year as shown in the consolidated statement of cash flows can be reconciled to the related items in the consolidatedstatement of financial position as follows:
Consolidated FY18$'000
FY17$'000
Cash and bank balances 16,498 10,269
Less: cash not available for use (627) (686)15,871 9,583
Cash balances not available for use relate to unclaimed dividends. As at 30 June 2018, cash balances not available for usetotalled $627 thousand (2017: $686 thousand). These restricted cash balances have not been included in the period end cashbalances for the purposes of the consolidated statement of cash flows.
At 30 June 2018, the Group had unused facilities as detailed in the following table. Subsequent to the year end, the Grouprenegotiated its financing arrangements, resulting in a reduction in the financing facilities. Further details can be found in Notes19, 25 and 30.
The Group expects to meet its other obligations from operating cash flows and proceeds of maturing financial assets.
Consolidated FY18$'000
FY17$'000
Secured bank loan facility:Amount used (before deducting debt issue costs) 265,000 246,500Amount unused 44,000 87,500
309,000 334,000
Secured ancillary bank facilities (guarantees):Amount used 3,407 3,282Amount unused 593 718
4,000 4,000
Secured ancillary bank facilities (asset finance):Amount used 92 117Amount unused 2,408 883
2,500 1,000
Secured ancillary bank facilities (supply chain finance):Amount used 788 2,538Amount unused 3,212 1,462
4,000 4,000
Secured ancillary bank facilities (overdraft):Amount used - -Amount unused 1,000 1,000
1,000 1,000
Retail Food Group Limited - Annual Report - Financial Year Ended 30 June 2018 Page 43
For
per
sona
l use
onl
y
Consolidated FY18$'000
FY17$'000
(Loss)/profit for the year (306,693) 61,927Depreciation of non-current assets 11,203 7,762Amortisation 1,870 1,576Amounts invoiced to marketing funds written off 75 -Impairment loss on loans carried at amortised cost 8,003 5,496Writedown inventory to net realisable value 5,991 608Writedown of property, plant and equipment 17,498 189Impairment loss on intangible assets 306,152 -Impairment loss on assets held for sale 4,454 -Non-cash employee benefits expense-share based payments (18) 85Net foreign exchange gain 24 (130)Interest income (968) (801)Loss/(gain) on sale of PPE 545 (1,943)Loss on sale of QLD properties 1,446 -Non cash - vendor loan (324) (2,446)Non cash interest expense 3,350 376Contingent consideration deemed remuneration 523 462Adjustments to contingent consideration provision (295) (3,359)
Increase/(decrease) in Current tax liability (9,883) 7,107Increase/(decrease) in Deferred tax balances (74,003) (3,117)
Movements in working capital:(Increase)/decrease in Trade and other receivables 30,666 (14,286)(Increase)/decrease in Inventories (7,849) (1,489)(Increase)/decrease in Other assets (3,504) (535)Increase/(decrease) in Trade and other payables (170) 7,583Increase/(decrease) in Provisions 23,523 (463)
Increase/(decrease) in Other liabilities (772) (807)
Net cash generated by operating activities 10,844 63,795
Acquisition of property, plant and equipment by means of finance leases was nil (FY17: $3.8 million).
Changes in Liabilities for which cash flows are classified as financing activities in the statement of cash flows:
Consolidated
Current bankloans$'000
Current borrowingcosts$'000
Non-currentbank loans
$'000
Non-currentborrowing costs
$'000
- - 246,500 (726)
Repayment of borrowings - - (127,000) -
Proceeds from borrowings - - 145,500 -
Payment for debt issue costs - - - (894)
Amortisation of deferred borrowing costs - - - 807
Other non-cash movements 265,000 (813) (265,000) 813265,000 (813) - -
Retail Food Group Limited - Annual Report - Financial Year Ended 30 June 2018 Page 44
For
per
sona
l use
onl
y
Consolidated FY18$'000
FY17$'000
Trade receivables 71,248 81,286
Allowance for doubtful debts (31,101) (10,094)40,147 71,192
Accrued income 5,076 5,897
Sundry debtors 2,714 1,754
Other 1,778 4,549
Goods and services tax (GST) receivable 610 -
50,325 83,392
Trade receivables - 1,582
Sundry debtors 658 280
Other 127 561785 2,423
51,110 85,815
Trade receivables disclosed in this table are classified as loans and receivables and are therefore measured at amortised cost.
The average credit period on sales of goods and rendering of services is 30 days and no interest is charged. The Group hasrecognised an allowance for the estimated irrecoverable trade receivable amounts arising from the past sale of goods andrendering of services, determined by reference to past default experience.
Trade receivables disclosed in this table include amounts (disclosed in the following table) that are past due at the end of thereporting period but against which the Group has not recognised an allowance for doubtful debtors because there has notbeen a significant change in credit quality and the amounts are still considered recoverable. The Group holds collateral over themajority of these balances in the form of the franchised outlets.
Trade receivables under formal or contractual payment arrangements have been reclassified to Other financial assets and thecomparative period financial statements have been restated.
Consolidated FY18$'000
FY17$'000
31 – 60 days 3,973 3,121
61 – 90 days 1,654 1,729
91 + days 4,170 13,9729,797 18,822
Retail Food Group Limited - Annual Report - Financial Year Ended 30 June 2018 Page 45
For
per
sona
l use
onl
y
Consolidated FY18$'000
FY17$'000
Balance at the beginning of the year 10,094 8,001Reclassification to other receivables 147 43Amounts acquired through business combinations - 1,892Impairment losses recognised on receivables 29,089 2,462Amounts written off as uncollectable (8,229) (2,304)
Balance at the end of the year 31,101 10,094
In determining the recoverability of a trade receivable, the Group considers any change in the credit quality of the tradereceivable from the date credit was initially granted up to the end of the reporting period. The concentration of credit risk islimited due to the customer base being large and unrelated. Accordingly, the Directors consider that there is no further creditprovision required in excess of the allowance for doubtful debts.
The allowance for doubtful debts includes individually impaired trade receivables amounting to $31.1 million (FY17: $10.1million). The impairment recognised represents the difference between the carrying amount of these trade receivables and thepresent value of the estimated recoverable amount.
Consolidated FY18$'000
FY17$'000
0 – 30 days 2,538 479
31 – 60 days 976 873
61 – 90 days 1,107 590
91 + days 26,480 8,15231,101 10,094
Retail Food Group Limited - Annual Report - Financial Year Ended 30 June 2018 Page 46
For
per
sona
l use
onl
y
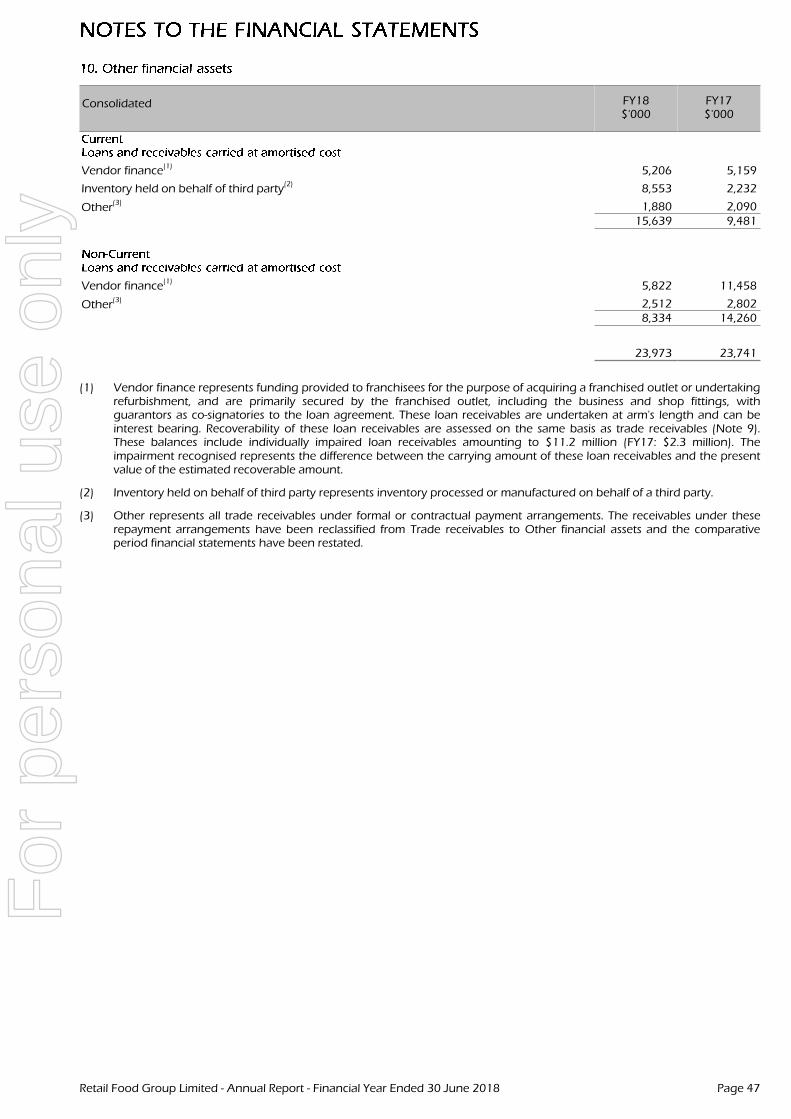
Consolidated FY18$'000
FY17$'000
Vendor finance(1) 5,206 5,159
Inventory held on behalf of third party(2)
8,553 2,232
Other(3) 1,880 2,090
15,639 9,481
Vendor finance(1)
5,822 11,458
Other(3) 2,512 2,802
8,334 14,260
23,973 23,741
(1) Vendor finance represents funding provided to franchisees for the purpose of acquiring a franchised outlet or undertakingrefurbishment, and are primarily secured by the franchised outlet, including the business and shop fittings, withguarantors as co-signatories to the loan agreement. These loan receivables are undertaken at arm's length and can beinterest bearing. Recoverability of these loan receivables are assessed on the same basis as trade receivables (Note 9).These balances include individually impaired loan receivables amounting to $11.2 million (FY17: $2.3 million). Theimpairment recognised represents the difference between the carrying amount of these loan receivables and the presentvalue of the estimated recoverable amount.
(2) Inventory held on behalf of third party represents inventory processed or manufactured on behalf of a third party.
(3) Other represents all trade receivables under formal or contractual payment arrangements. The receivables under theserepayment arrangements have been reclassified from Trade receivables to Other financial assets and the comparativeperiod financial statements have been restated.
Retail Food Group Limited - Annual Report - Financial Year Ended 30 June 2018 Page 47
For
per
sona
l use
onl
y
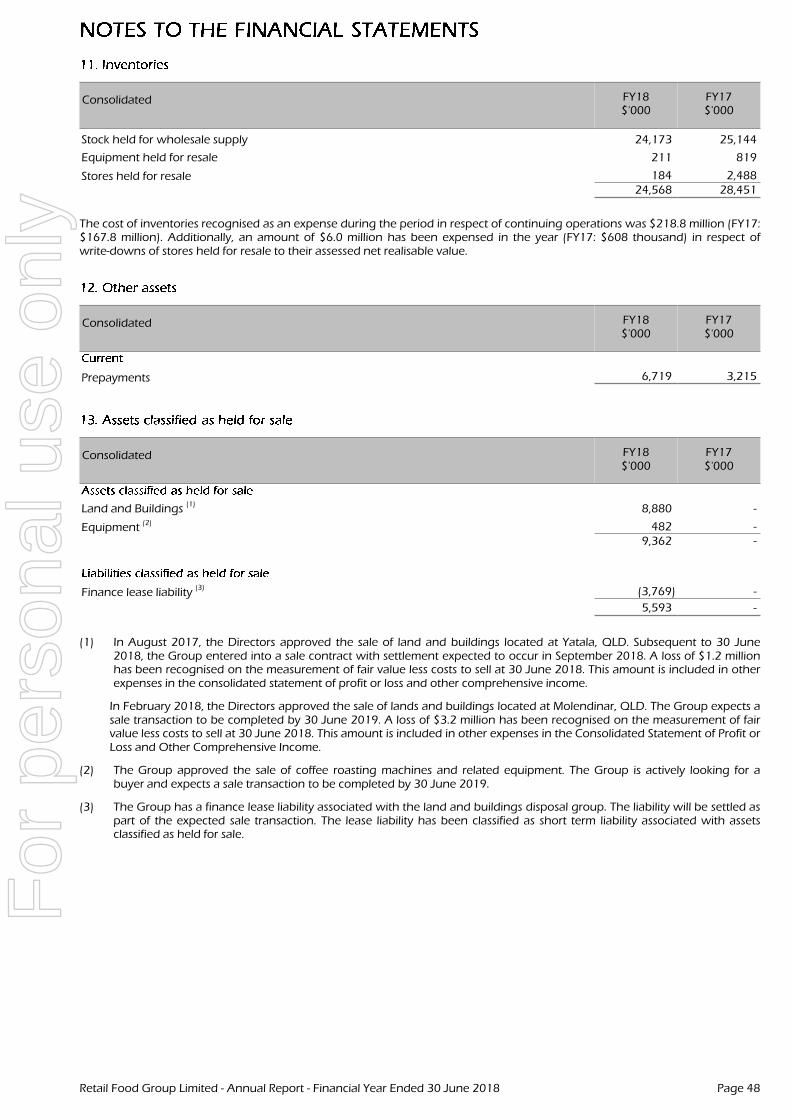
Consolidated FY18$'000
FY17$'000
Stock held for wholesale supply 24,173 25,144
Equipment held for resale 211 819
Stores held for resale 184 2,48824,568 28,451
The cost of inventories recognised as an expense during the period in respect of continuing operations was $218.8 million (FY17:$167.8 million). Additionally, an amount of $6.0 million has been expensed in the year (FY17: $608 thousand) in respect ofwrite-downs of stores held for resale to their assessed net realisable value.
Consolidated FY18$'000
FY17$'000
Prepayments 6,719 3,215
Consolidated FY18$'000
FY17$'000
Land and Buildings (1) 8,880 -
Equipment (2) 482 -9,362 -
Finance lease liability(3) (3,769) -
5,593 -
(1) In August 2017, the Directors approved the sale of land and buildings located at Yatala, QLD. Subsequent to 30 June2018, the Group entered into a sale contract with settlement expected to occur in September 2018. A loss of $1.2 millionhas been recognised on the measurement of fair value less costs to sell at 30 June 2018. This amount is included in otherexpenses in the consolidated statement of profit or loss and other comprehensive income.
In February 2018, the Directors approved the sale of lands and buildings located at Molendinar, QLD. The Group expects asale transaction to be completed by 30 June 2019. A loss of $3.2 million has been recognised on the measurement of fairvalue less costs to sell at 30 June 2018. This amount is included in other expenses in the Consolidated Statement of Profit orLoss and Other Comprehensive Income.
(2) The Group approved the sale of coffee roasting machines and related equipment. The Group is actively looking for abuyer and expects a sale transaction to be completed by 30 June 2019.
(3) The Group has a finance lease liability associated with the land and buildings disposal group. The liability will be settled aspart of the expected sale transaction. The lease liability has been classified as short term liability associated with assetsclassified as held for sale.
Retail Food Group Limited - Annual Report - Financial Year Ended 30 June 2018 Page 48
For
per
sona
l use
onl
y
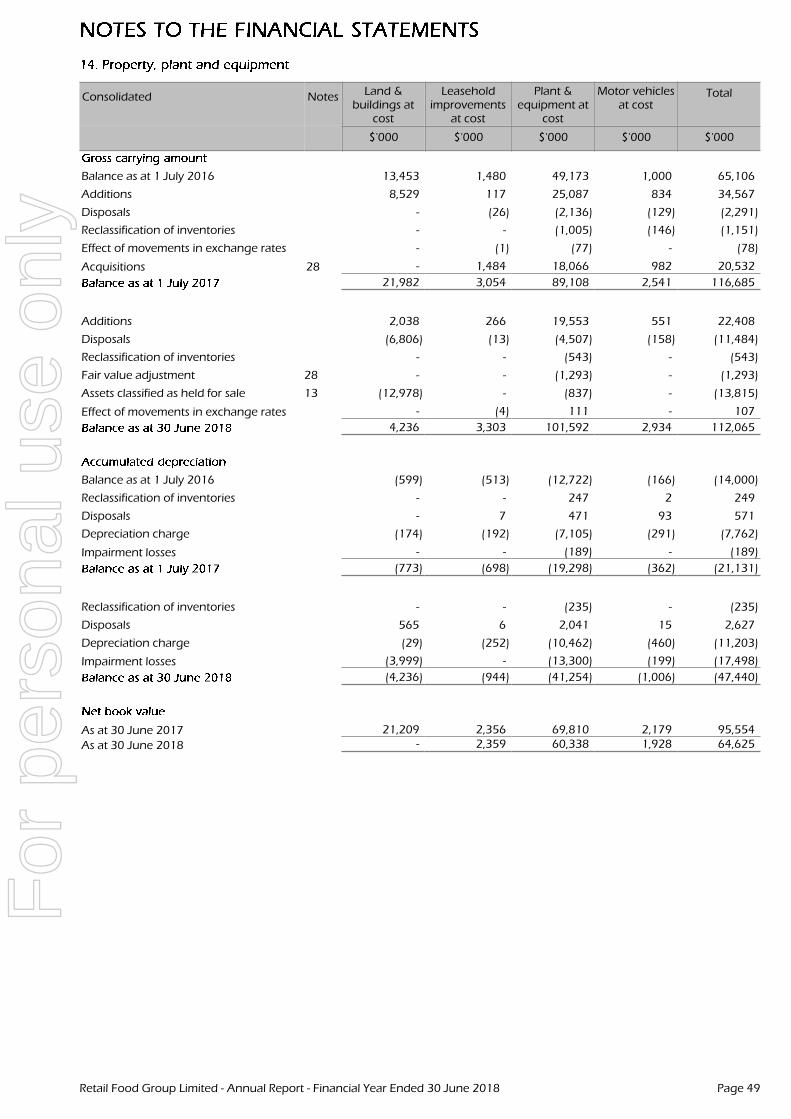
Consolidated Notes Land &buildings at
cost
Leaseholdimprovements
at cost
Plant &equipment at
cost
Motor vehiclesat cost
Total
$'000 $'000 $'000 $'000 $'000
Balance as at 1 July 2016 13,453 1,480 49,173 1,000 65,106
Additions 8,529 117 25,087 834 34,567
Disposals - (26) (2,136) (129) (2,291)
Reclassification of inventories - - (1,005) (146) (1,151)
Effect of movements in exchange rates - (1) (77) - (78)
Acquisitions 28 - 1,484 18,066 982 20,532
21,982 3,054 89,108 2,541 116,685
Additions 2,038 266 19,553 551 22,408
Disposals (6,806) (13) (4,507) (158) (11,484)
Reclassification of inventories - - (543) - (543)
Fair value adjustment 28 - - (1,293) - (1,293)
Assets classified as held for sale 13 (12,978) - (837) - (13,815)
Effect of movements in exchange rates - (4) 111 - 107
4,236 3,303 101,592 2,934 112,065
Balance as at 1 July 2016 (599) (513) (12,722) (166) (14,000)
Reclassification of inventories - - 247 2 249
Disposals - 7 471 93 571
Depreciation charge (174) (192) (7,105) (291) (7,762)
Impairment losses - - (189) - (189)
(773) (698) (19,298) (362) (21,131)
Reclassification of inventories - - (235) - (235)
Disposals 565 6 2,041 15 2,627
Depreciation charge (29) (252) (10,462) (460) (11,203)
Impairment losses (3,999) - (13,300) (199) (17,498)
(4,236) (944) (41,254) (1,006) (47,440)
As at 30 June 2017 21,209 2,356 69,810 2,179 95,554
As at 30 June 2018 - 2,359 60,338 1,928 64,625
Retail Food Group Limited - Annual Report - Financial Year Ended 30 June 2018 Page 49
For
per
sona
l use
onl
y
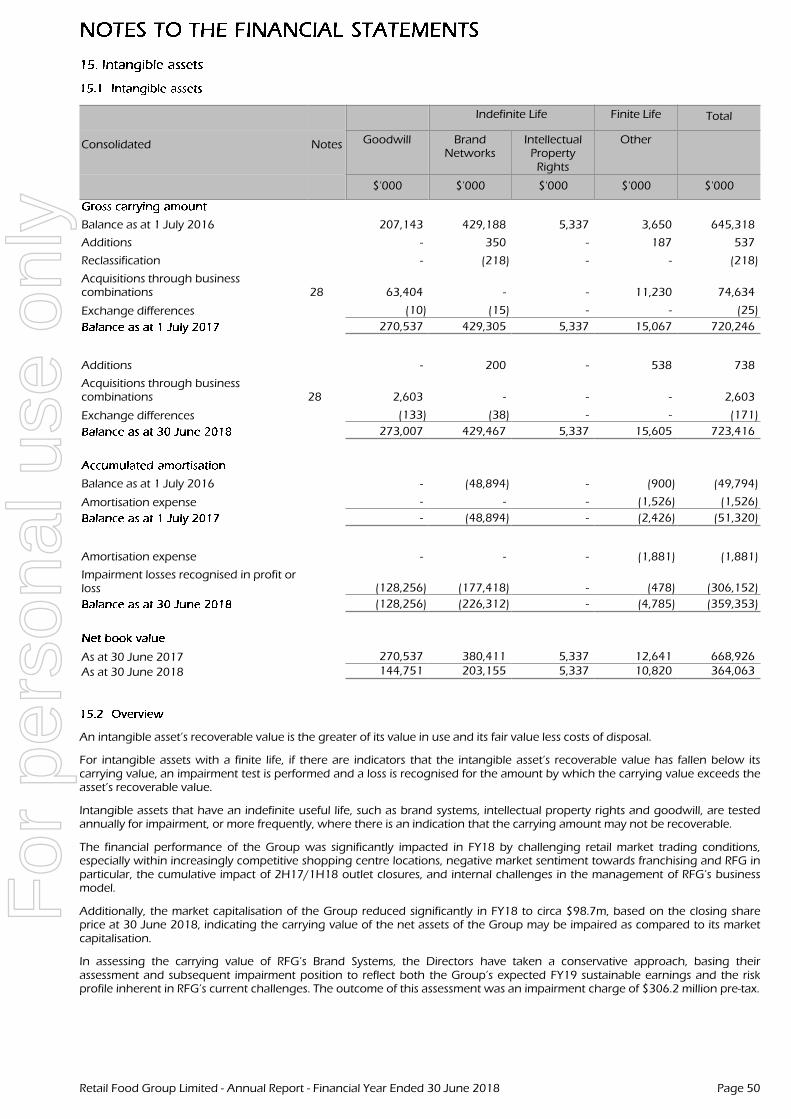
Indefinite Life Finite Life Total
Consolidated Notes Goodwill BrandNetworks
IntellectualProperty
Rights
Other
$'000 $'000 $'000 $'000 $'000
Balance as at 1 July 2016 207,143 429,188 5,337 3,650 645,318
Additions - 350 - 187 537
Reclassification - (218) - - (218)
Acquisitions through businesscombinations 28 63,404 - - 11,230 74,634
Exchange differences (10) (15) - - (25)
270,537 429,305 5,337 15,067 720,246
Additions - 200 - 538 738
Acquisitions through businesscombinations 28 2,603 - - - 2,603
Exchange differences (133) (38) - - (171)
273,007 429,467 5,337 15,605 723,416
Balance as at 1 July 2016 - (48,894) - (900) (49,794)
Amortisation expense - - - (1,526) (1,526)
- (48,894) - (2,426) (51,320)
Amortisation expense - - - (1,881) (1,881)
Impairment losses recognised in profit orloss (128,256) (177,418) - (478) (306,152)
(128,256) (226,312) - (4,785) (359,353)
As at 30 June 2017 270,537 380,411 5,337 12,641 668,926
As at 30 June 2018 144,751 203,155 5,337 10,820 364,063
An intangible asset’s recoverable value is the greater of its value in use and its fair value less costs of disposal.
For intangible assets with a finite life, if there are indicators that the intangible asset’s recoverable value has fallen below itscarrying value, an impairment test is performed and a loss is recognised for the amount by which the carrying value exceeds theasset’s recoverable value.
Intangible assets that have an indefinite useful life, such as brand systems, intellectual property rights and goodwill, are testedannually for impairment, or more frequently, where there is an indication that the carrying amount may not be recoverable.
The financial performance of the Group was significantly impacted in FY18 by challenging retail market trading conditions,especially within increasingly competitive shopping centre locations, negative market sentiment towards franchising and RFG inparticular, the cumulative impact of 2H17/1H18 outlet closures, and internal challenges in the management of RFG’s businessmodel.
Additionally, the market capitalisation of the Group reduced significantly in FY18 to circa $98.7m, based on the closing shareprice at 30 June 2018, indicating the carrying value of the net assets of the Group may be impaired as compared to its marketcapitalisation.
In assessing the carrying value of RFG’s Brand Systems, the Directors have taken a conservative approach, basing theirassessment and subsequent impairment position to reflect both the Group’s expected FY19 sustainable earnings and the riskprofile inherent in RFG’s current challenges. The outcome of this assessment was an impairment charge of $306.2 million pre-tax.
Retail Food Group Limited - Annual Report - Financial Year Ended 30 June 2018 Page 50
For
per
sona
l use
onl
y
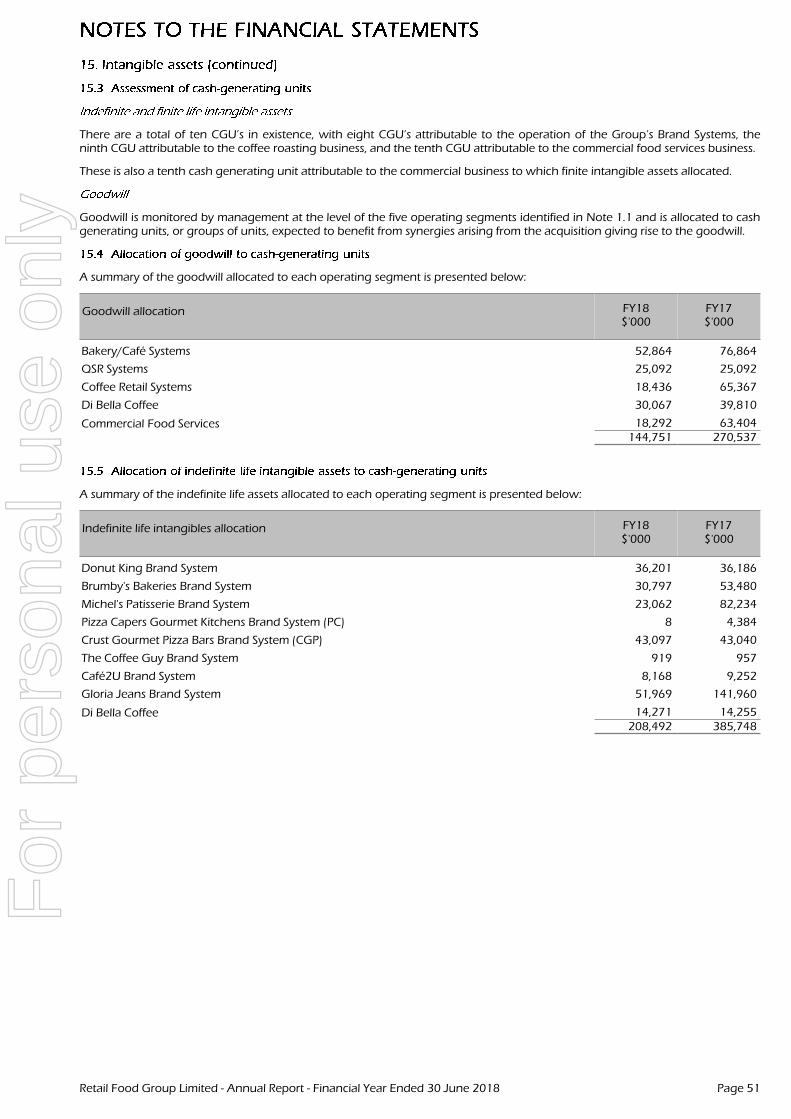
There are a total of ten CGU’s in existence, with eight CGU’s attributable to the operation of the Group’s Brand Systems, theninth CGU attributable to the coffee roasting business, and the tenth CGU attributable to the commercial food services business.
These is also a tenth cash generating unit attributable to the commercial business to which finite intangible assets allocated.
Goodwill is monitored by management at the level of the five operating segments identified in Note 1.1 and is allocated to cashgenerating units, or groups of units, expected to benefit from synergies arising from the acquisition giving rise to the goodwill.
A summary of the goodwill allocated to each operating segment is presented below:
Goodwill allocation FY18$'000
FY17$'000
Bakery/Café Systems 52,864 76,864
QSR Systems 25,092 25,092
Coffee Retail Systems 18,436 65,367
Di Bella Coffee 30,067 39,810
Commercial Food Services 18,292 63,404144,751 270,537
A summary of the indefinite life assets allocated to each operating segment is presented below:
Indefinite life intangibles allocation FY18$'000
FY17$'000
Donut King Brand System 36,201 36,186
Brumby's Bakeries Brand System 30,797 53,480
Michel's Patisserie Brand System 23,062 82,234
Pizza Capers Gourmet Kitchens Brand System (PC) 8 4,384
Crust Gourmet Pizza Bars Brand System (CGP) 43,097 43,040
The Coffee Guy Brand System 919 957
Café2U Brand System 8,168 9,252
Gloria Jeans Brand System 51,969 141,960
Di Bella Coffee 14,271 14,255208,492 385,748
Retail Food Group Limited - Annual Report - Financial Year Ended 30 June 2018 Page 51
For
per
sona
l use
onl
y
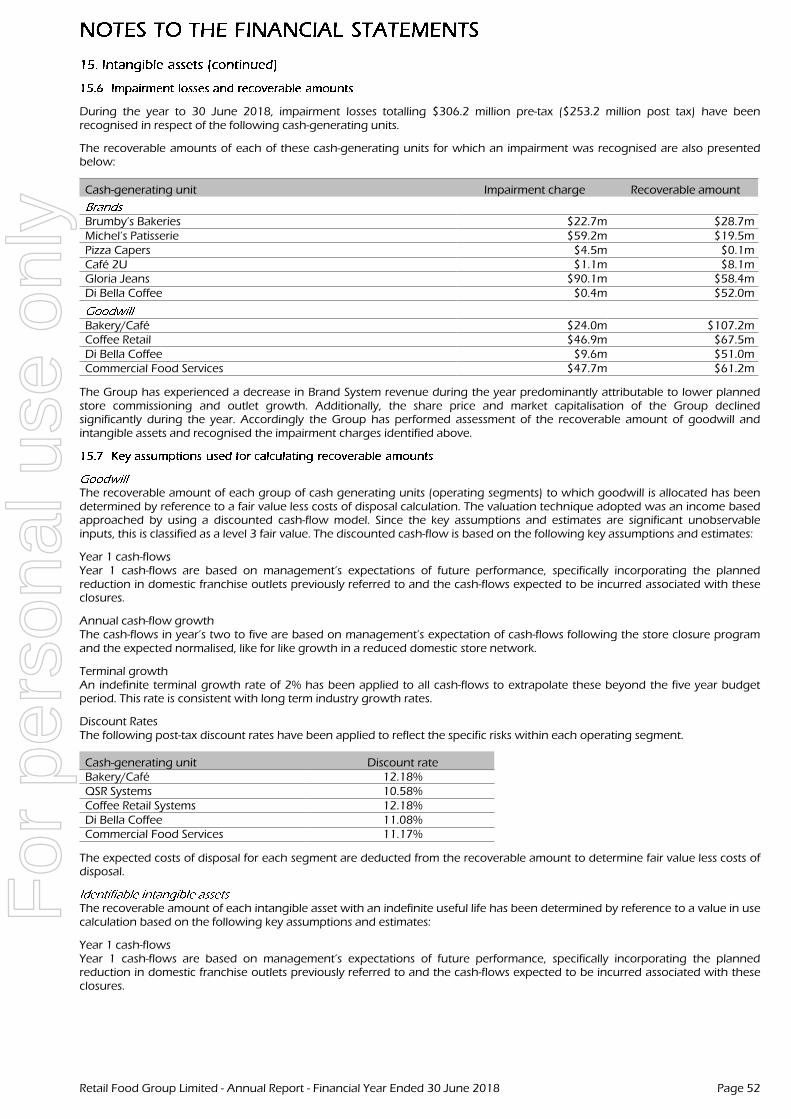
During the year to 30 June 2018, impairment losses totalling $306.2 million pre-tax ($253.2 million post tax) have beenrecognised in respect of the following cash-generating units.
The recoverable amounts of each of these cash-generating units for which an impairment was recognised are also presentedbelow:
Cash-generating unit Impairment charge Recoverable amount
Brumby’s Bakeries $22.7m $28.7mMichel’s Patisserie $59.2m $19.5mPizza Capers $4.5m $0.1mCafé 2U $1.1m $8.1mGloria Jeans $90.1m $58.4mDi Bella Coffee $0.4m $52.0m
Bakery/Café $24.0m $107.2mCoffee Retail $46.9m $67.5mDi Bella Coffee $9.6m $51.0mCommercial Food Services $47.7m $61.2m
The Group has experienced a decrease in Brand System revenue during the year predominantly attributable to lower plannedstore commissioning and outlet growth. Additionally, the share price and market capitalisation of the Group declinedsignificantly during the year. Accordingly the Group has performed assessment of the recoverable amount of goodwill andintangible assets and recognised the impairment charges identified above.
The recoverable amount of each group of cash generating units (operating segments) to which goodwill is allocated has beendetermined by reference to a fair value less costs of disposal calculation. The valuation technique adopted was an income basedapproached by using a discounted cash-flow model. Since the key assumptions and estimates are significant unobservableinputs, this is classified as a level 3 fair value. The discounted cash-flow is based on the following key assumptions and estimates:
Year 1 cash-flowsYear 1 cash-flows are based on management’s expectations of future performance, specifically incorporating the plannedreduction in domestic franchise outlets previously referred to and the cash-flows expected to be incurred associated with theseclosures.
Annual cash-flow growthThe cash-flows in year’s two to five are based on management’s expectation of cash-flows following the store closure programand the expected normalised, like for like growth in a reduced domestic store network.
Terminal growthAn indefinite terminal growth rate of 2% has been applied to all cash-flows to extrapolate these beyond the five year budgetperiod. This rate is consistent with long term industry growth rates.
Discount RatesThe following post-tax discount rates have been applied to reflect the specific risks within each operating segment.
Cash-generating unit Discount rateBakery/Café 12.18%QSR Systems 10.58%Coffee Retail Systems 12.18%Di Bella Coffee 11.08%Commercial Food Services 11.17%
The expected costs of disposal for each segment are deducted from the recoverable amount to determine fair value less costs ofdisposal.
The recoverable amount of each intangible asset with an indefinite useful life has been determined by reference to a value in usecalculation based on the following key assumptions and estimates:
Year 1 cash-flowsYear 1 cash-flows are based on management’s expectations of future performance, specifically incorporating the plannedreduction in domestic franchise outlets previously referred to and the cash-flows expected to be incurred associated with theseclosures.
Retail Food Group Limited - Annual Report - Financial Year Ended 30 June 2018 Page 52
For
per
sona
l use
onl
y
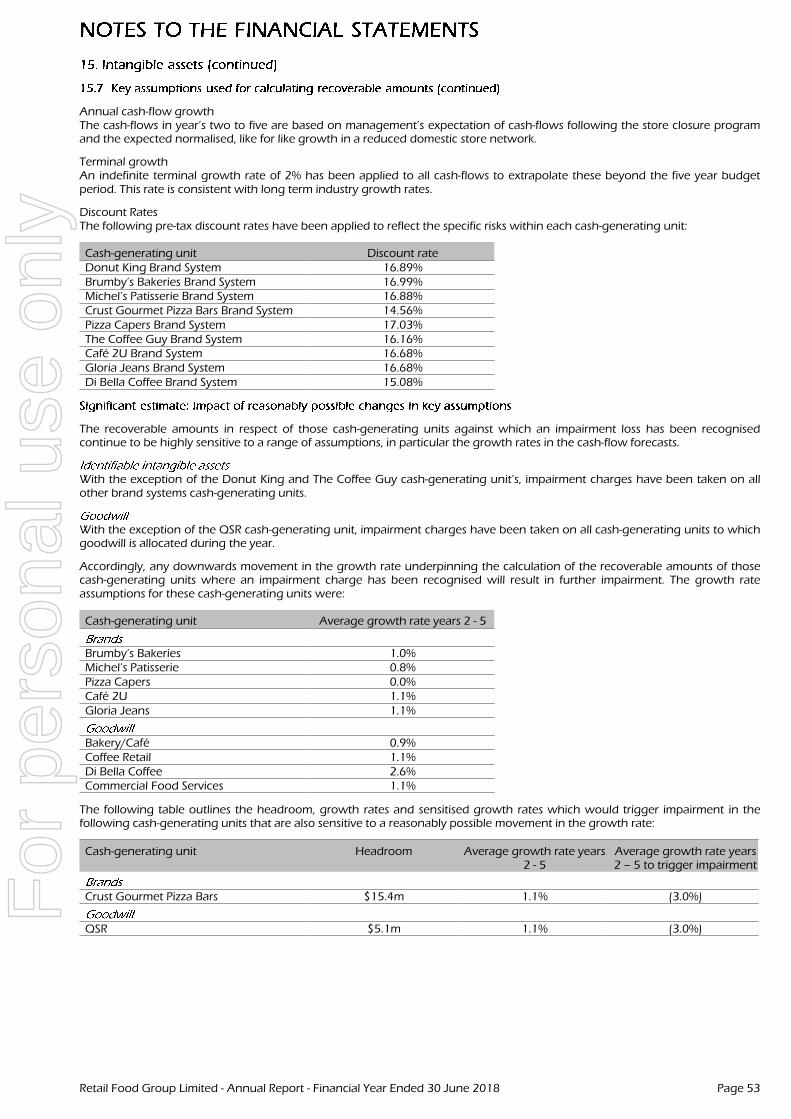
Annual cash-flow growthThe cash-flows in year’s two to five are based on management’s expectation of cash-flows following the store closure programand the expected normalised, like for like growth in a reduced domestic store network.
Terminal growthAn indefinite terminal growth rate of 2% has been applied to all cash-flows to extrapolate these beyond the five year budgetperiod. This rate is consistent with long term industry growth rates.
Discount RatesThe following pre-tax discount rates have been applied to reflect the specific risks within each cash-generating unit:
Cash-generating unit Discount rateDonut King Brand System 16.89%Brumby’s Bakeries Brand System 16.99%Michel’s Patisserie Brand System 16.88%Crust Gourmet Pizza Bars Brand System 14.56%Pizza Capers Brand System 17.03%The Coffee Guy Brand System 16.16%Café 2U Brand System 16.68%Gloria Jeans Brand System 16.68%Di Bella Coffee Brand System 15.08%
The recoverable amounts in respect of those cash-generating units against which an impairment loss has been recognisedcontinue to be highly sensitive to a range of assumptions, in particular the growth rates in the cash-flow forecasts.
With the exception of the Donut King and The Coffee Guy cash-generating unit’s, impairment charges have been taken on allother brand systems cash-generating units.
With the exception of the QSR cash-generating unit, impairment charges have been taken on all cash-generating units to whichgoodwill is allocated during the year.
Accordingly, any downwards movement in the growth rate underpinning the calculation of the recoverable amounts of thosecash-generating units where an impairment charge has been recognised will result in further impairment. The growth rateassumptions for these cash-generating units were:
Cash-generating unit Average growth rate years 2 - 5
Brumby’s Bakeries 1.0%Michel’s Patisserie 0.8%Pizza Capers 0.0%Café 2U 1.1%Gloria Jeans 1.1%
Bakery/Café 0.9%Coffee Retail 1.1%Di Bella Coffee 2.6%Commercial Food Services 1.1%
The following table outlines the headroom, growth rates and sensitised growth rates which would trigger impairment in thefollowing cash-generating units that are also sensitive to a reasonably possible movement in the growth rate:
Cash-generating unit Headroom Average growth rate years2 - 5
Average growth rate years2 – 5 to trigger impairment
Crust Gourmet Pizza Bars $15.4m 1.1% (3.0%)
QSR $5.1m 1.1% (3.0%)
Retail Food Group Limited - Annual Report - Financial Year Ended 30 June 2018 Page 53
For
per
sona
l use
onl
y
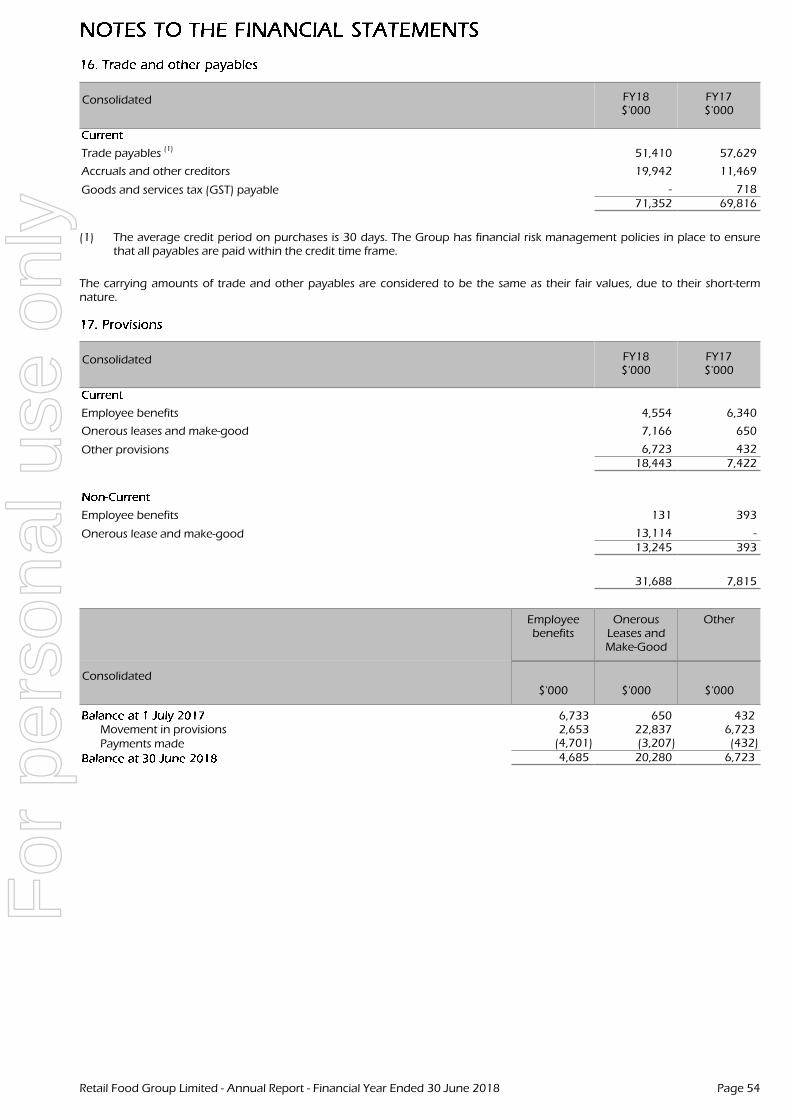
Consolidated FY18$'000
FY17$'000
Trade payables (1) 51,410 57,629
Accruals and other creditors 19,942 11,469
Goods and services tax (GST) payable - 71871,352 69,816
(1) The average credit period on purchases is 30 days. The Group has financial risk management policies in place to ensurethat all payables are paid within the credit time frame.
The carrying amounts of trade and other payables are considered to be the same as their fair values, due to their short-termnature.
Consolidated FY18$'000
FY17$'000
Employee benefits 4,554 6,340
Onerous leases and make-good 7,166 650
Other provisions 6,723 43218,443 7,422
Employee benefits 131 393
Onerous lease and make-good 13,114 -13,245 393
31,688 7,815
Employeebenefits
OnerousLeases andMake-Good
Other
Consolidated$'000 $'000 $'000
6,733 650 432Movement in provisions 2,653 22,837 6,723Payments made (4,701) (3,207) (432)
4,685 20,280 6,723
Retail Food Group Limited - Annual Report - Financial Year Ended 30 June 2018 Page 54
For
per
sona
l use
onl
y
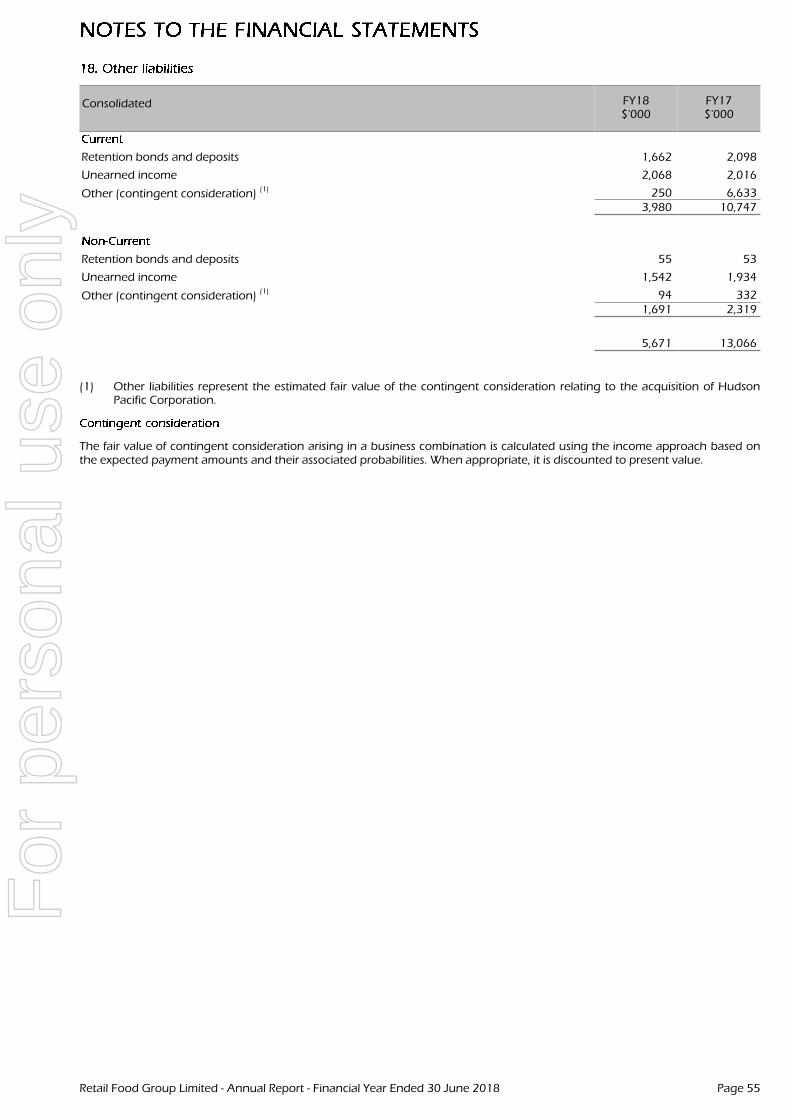
Consolidated FY18$'000
FY17$'000
Retention bonds and deposits 1,662 2,098
Unearned income 2,068 2,016
Other (contingent consideration) (1) 250 6,6333,980 10,747
Retention bonds and deposits 55 53
Unearned income 1,542 1,934
Other (contingent consideration) (1) 94 3321,691 2,319
5,671 13,066
(1) Other liabilities represent the estimated fair value of the contingent consideration relating to the acquisition of HudsonPacific Corporation.
The fair value of contingent consideration arising in a business combination is calculated using the income approach based onthe expected payment amounts and their associated probabilities. When appropriate, it is discounted to present value.
Retail Food Group Limited - Annual Report - Financial Year Ended 30 June 2018 Page 55
For
per
sona
l use
onl
y
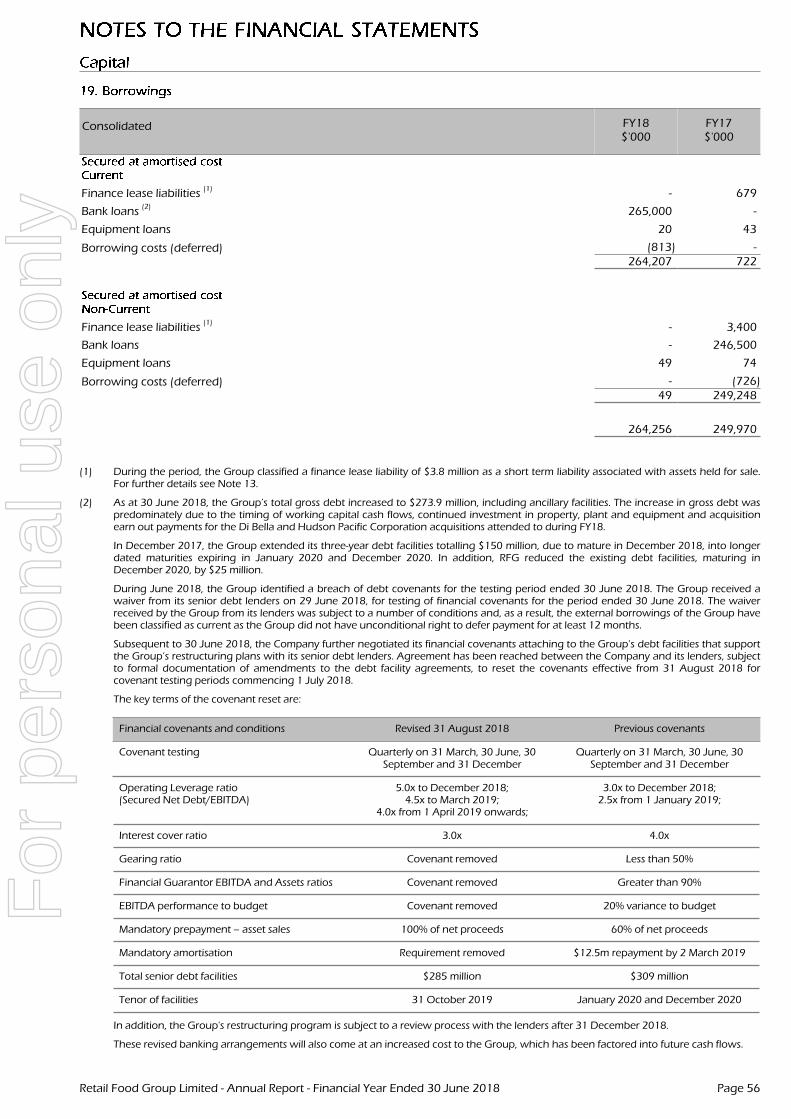
Consolidated FY18$'000
FY17$'000
Finance lease liabilities (1) - 679
Bank loans(2)
265,000 -
Equipment loans 20 43
Borrowing costs (deferred) (813) -264,207 722
Finance lease liabilities(1)
- 3,400
Bank loans - 246,500
Equipment loans 49 74
Borrowing costs (deferred) - (726)49 249,248
264,256 249,970
(1) During the period, the Group classified a finance lease liability of $3.8 million as a short term liability associated with assets held for sale.For further details see Note 13.
(2) As at 30 June 2018, the Group’s total gross debt increased to $273.9 million, including ancillary facilities. The increase in gross debt waspredominately due to the timing of working capital cash flows, continued investment in property, plant and equipment and acquisitionearn out payments for the Di Bella and Hudson Pacific Corporation acquisitions attended to during FY18.
In December 2017, the Group extended its three-year debt facilities totalling $150 million, due to mature in December 2018, into longerdated maturities expiring in January 2020 and December 2020. In addition, RFG reduced the existing debt facilities, maturing inDecember 2020, by $25 million.
During June 2018, the Group identified a breach of debt covenants for the testing period ended 30 June 2018. The Group received awaiver from its senior debt lenders on 29 June 2018, for testing of financial covenants for the period ended 30 June 2018. The waiverreceived by the Group from its lenders was subject to a number of conditions and, as a result, the external borrowings of the Group havebeen classified as current as the Group did not have unconditional right to defer payment for at least 12 months.
Subsequent to 30 June 2018, the Company further negotiated its financial covenants attaching to the Group’s debt facilities that supportthe Group’s restructuring plans with its senior debt lenders. Agreement has been reached between the Company and its lenders, subjectto formal documentation of amendments to the debt facility agreements, to reset the covenants effective from 31 August 2018 forcovenant testing periods commencing 1 July 2018.
The key terms of the covenant reset are:
Financial covenants and conditions Revised 31 August 2018 Previous covenants
Covenant testing Quarterly on 31 March, 30 June, 30September and 31 December
Quarterly on 31 March, 30 June, 30September and 31 December
Operating Leverage ratio(Secured Net Debt/EBITDA)
5.0x to December 2018;4.5x to March 2019;
4.0x from 1 April 2019 onwards;
3.0x to December 2018;2.5x from 1 January 2019;
Interest cover ratio 3.0x 4.0x
Gearing ratio Covenant removed Less than 50%
Financial Guarantor EBITDA and Assets ratios Covenant removed Greater than 90%
EBITDA performance to budget Covenant removed 20% variance to budget
Mandatory prepayment – asset sales 100% of net proceeds 60% of net proceeds
Mandatory amortisation Requirement removed $12.5m repayment by 2 March 2019
Total senior debt facilities $285 million $309 million
Tenor of facilities 31 October 2019 January 2020 and December 2020
In addition, the Group's restructuring program is subject to a review process with the lenders after 31 December 2018.
These revised banking arrangements will also come at an increased cost to the Group, which has been factored into future cash flows.
Retail Food Group Limited - Annual Report - Financial Year Ended 30 June 2018 Page 56
For
per
sona
l use
onl
y
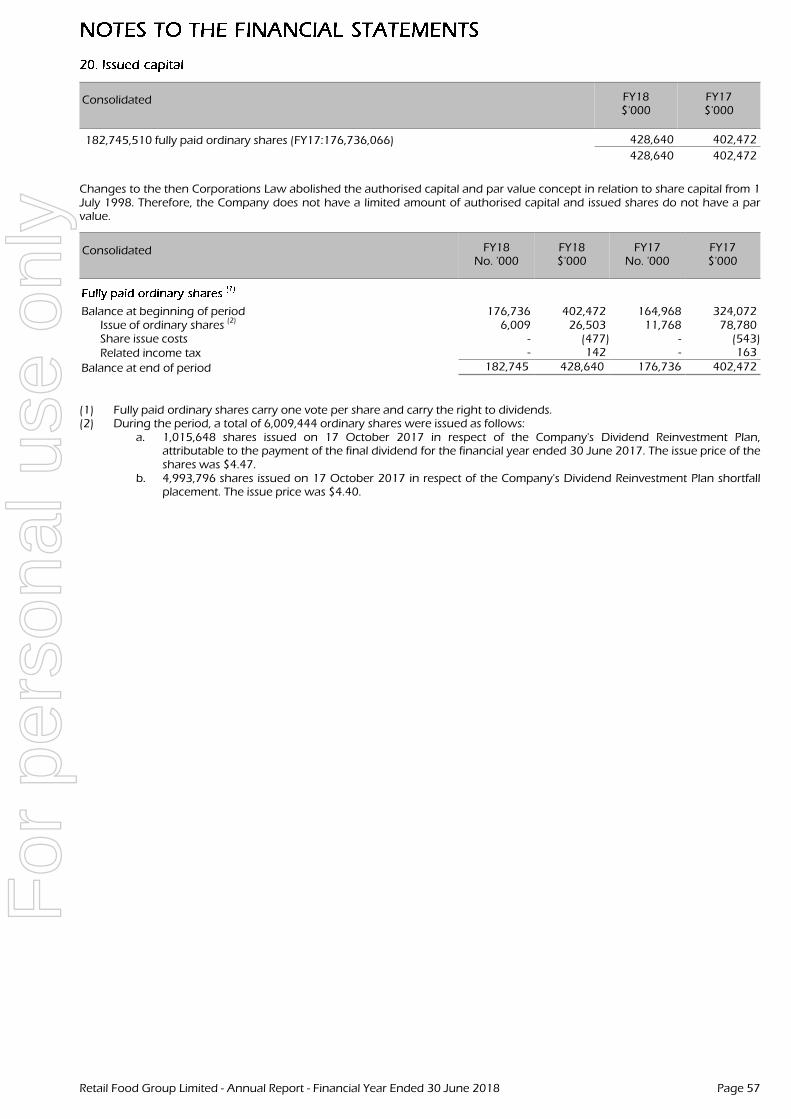
Consolidated FY18$'000
FY17$'000
182,745,510 fully paid ordinary shares (FY17:176,736,066) 428,640 402,472
428,640 402,472
Changes to the then Corporations Law abolished the authorised capital and par value concept in relation to share capital from 1July 1998. Therefore, the Company does not have a limited amount of authorised capital and issued shares do not have a parvalue.
Consolidated FY18No. '000
FY18$'000
FY17No. '000
FY17$'000
Balance at beginning of period 176,736 402,472 164,968 324,072Issue of ordinary shares
(2)6,009 26,503 11,768 78,780
Share issue costs - (477) - (543)Related income tax - 142 - 163
Balance at end of period 182,745 428,640 176,736 402,472
(1) Fully paid ordinary shares carry one vote per share and carry the right to dividends.(2) During the period, a total of 6,009,444 ordinary shares were issued as follows:
a. 1,015,648 shares issued on 17 October 2017 in respect of the Company's Dividend Reinvestment Plan,attributable to the payment of the final dividend for the financial year ended 30 June 2017. The issue price of theshares was $4.47.
b. 4,993,796 shares issued on 17 October 2017 in respect of the Company's Dividend Reinvestment Plan shortfallplacement. The issue price was $4.40.
Retail Food Group Limited - Annual Report - Financial Year Ended 30 June 2018 Page 57
For
per
sona
l use
onl
y
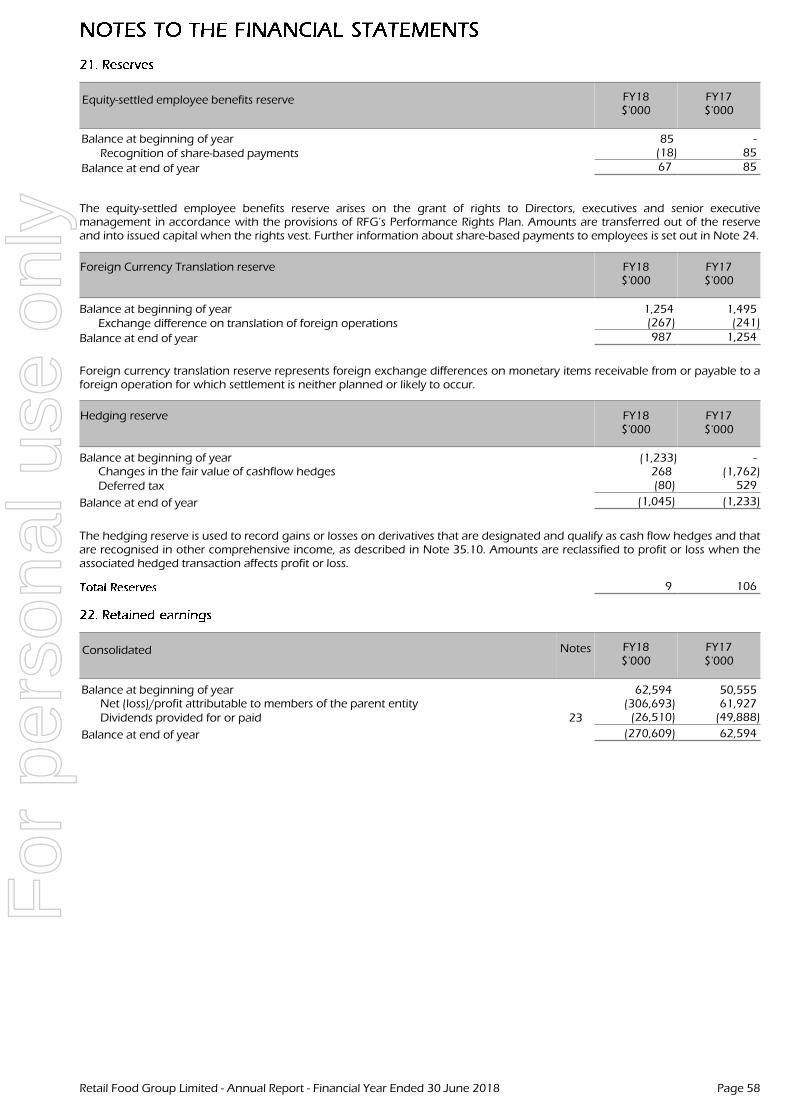
Equity-settled employee benefits reserve FY18$'000
FY17$'000
Balance at beginning of year 85 -Recognition of share-based payments (18) 85
Balance at end of year 67 85
The equity-settled employee benefits reserve arises on the grant of rights to Directors, executives and senior executivemanagement in accordance with the provisions of RFG’s Performance Rights Plan. Amounts are transferred out of the reserveand into issued capital when the rights vest. Further information about share-based payments to employees is set out in Note 24.
Foreign Currency Translation reserve FY18$'000
FY17$'000
Balance at beginning of year 1,254 1,495Exchange difference on translation of foreign operations (267) (241)
Balance at end of year 987 1,254
Foreign currency translation reserve represents foreign exchange differences on monetary items receivable from or payable to aforeign operation for which settlement is neither planned or likely to occur.
Hedging reserve FY18$'000
FY17$'000
Balance at beginning of year (1,233) -Changes in the fair value of cashflow hedges 268 (1,762)Deferred tax (80) 529
Balance at end of year (1,045) (1,233)
The hedging reserve is used to record gains or losses on derivatives that are designated and qualify as cash flow hedges and thatare recognised in other comprehensive income, as described in Note 35.10. Amounts are reclassified to profit or loss when theassociated hedged transaction affects profit or loss.
9 106
Consolidated Notes FY18$'000
FY17$'000
Balance at beginning of year 62,594 50,555Net (loss)/profit attributable to members of the parent entity (306,693) 61,927Dividends provided for or paid 23 (26,510) (49,888)
Balance at end of year (270,609) 62,594
Retail Food Group Limited - Annual Report - Financial Year Ended 30 June 2018 Page 58
For
per
sona
l use
onl
y
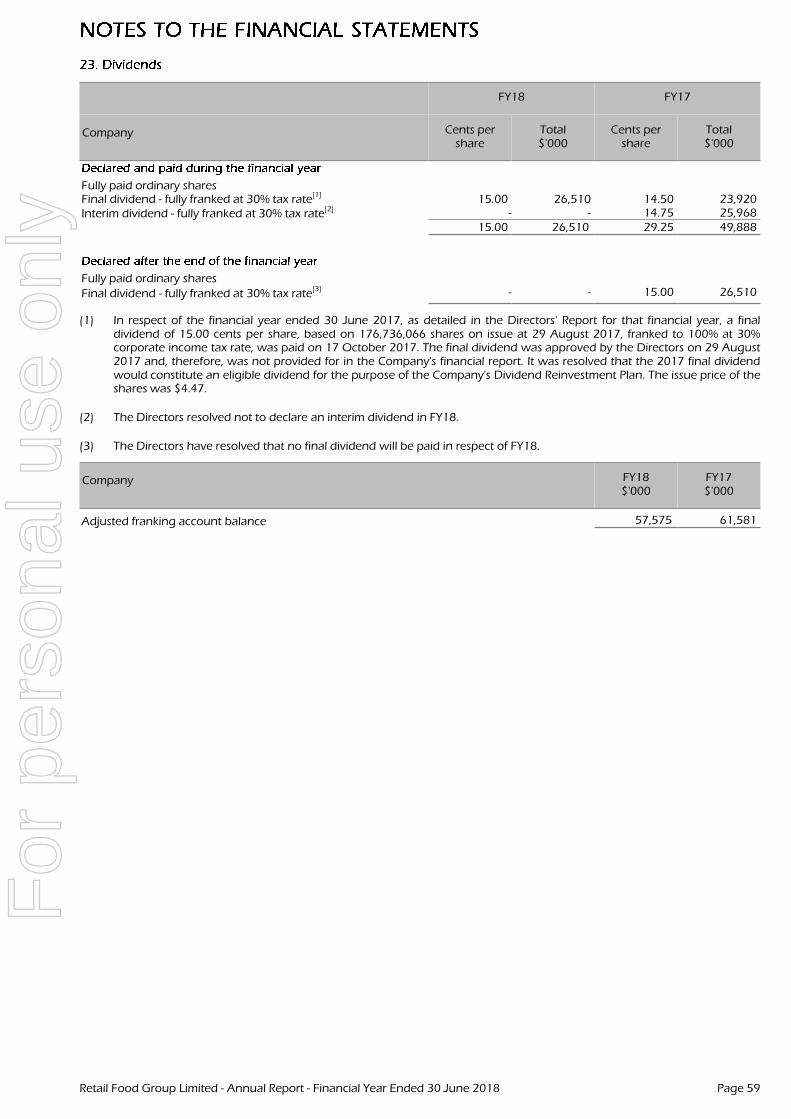
FY18 FY17
Company Cents pershare
Total$'000
Cents pershare
Total$'000
Fully paid ordinary sharesFinal dividend - fully franked at 30% tax rate[1] 15.00 26,510 14.50 23,920Interim dividend - fully franked at 30% tax rate[2] - - 14.75 25,968
15.00 26,510 29.25 49,888
Fully paid ordinary shares
Final dividend - fully franked at 30% tax rate[3] - - 15.00 26,510
(1) In respect of the financial year ended 30 June 2017, as detailed in the Directors' Report for that financial year, a finaldividend of 15.00 cents per share, based on 176,736,066 shares on issue at 29 August 2017, franked to 100% at 30%corporate income tax rate, was paid on 17 October 2017. The final dividend was approved by the Directors on 29 August2017 and, therefore, was not provided for in the Company's financial report. It was resolved that the 2017 final dividendwould constitute an eligible dividend for the purpose of the Company's Dividend Reinvestment Plan. The issue price of theshares was $4.47.
(2) The Directors resolved not to declare an interim dividend in FY18.
(3) The Directors have resolved that no final dividend will be paid in respect of FY18.
Company FY18$'000
FY17$'000
Adjusted franking account balance 57,575 61,581
Retail Food Group Limited - Annual Report - Financial Year Ended 30 June 2018 Page 59
For
per
sona
l use
onl
y
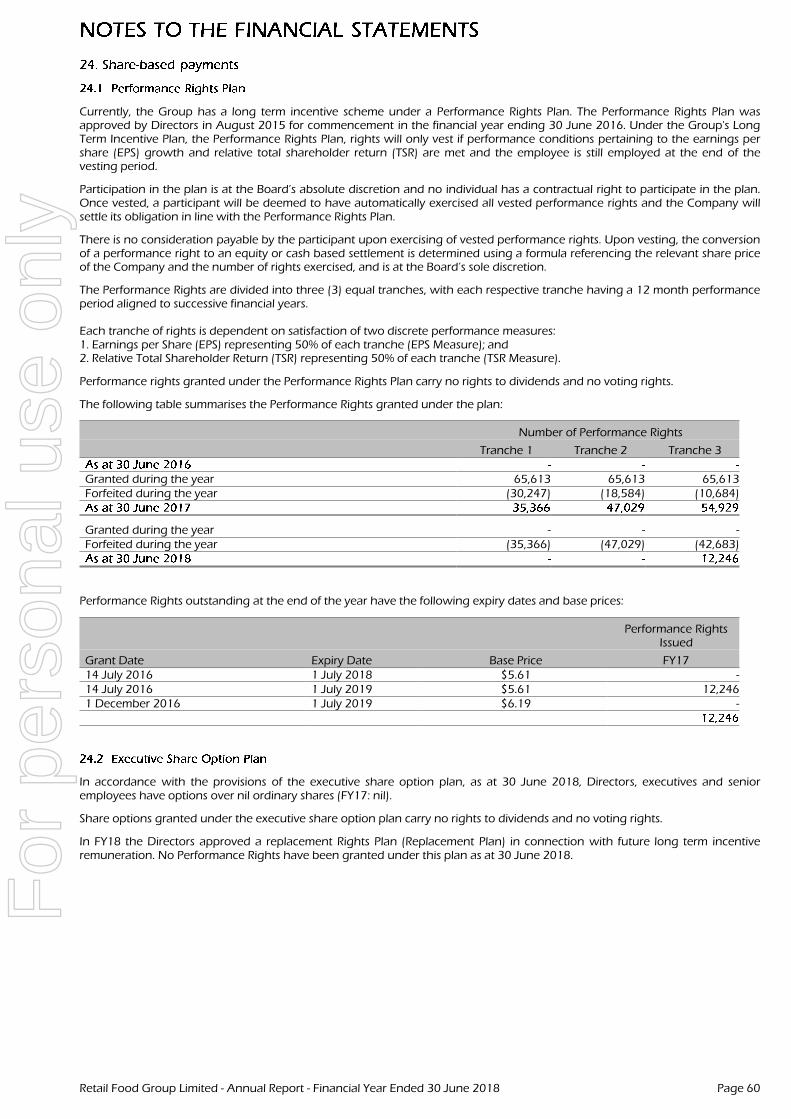
Currently, the Group has a long term incentive scheme under a Performance Rights Plan. The Performance Rights Plan wasapproved by Directors in August 2015 for commencement in the financial year ending 30 June 2016. Under the Group's LongTerm Incentive Plan, the Performance Rights Plan, rights will only vest if performance conditions pertaining to the earnings pershare (EPS) growth and relative total shareholder return (TSR) are met and the employee is still employed at the end of thevesting period.
Participation in the plan is at the Board’s absolute discretion and no individual has a contractual right to participate in the plan.Once vested, a participant will be deemed to have automatically exercised all vested performance rights and the Company willsettle its obligation in line with the Performance Rights Plan.
There is no consideration payable by the participant upon exercising of vested performance rights. Upon vesting, the conversionof a performance right to an equity or cash based settlement is determined using a formula referencing the relevant share priceof the Company and the number of rights exercised, and is at the Board’s sole discretion.
The Performance Rights are divided into three (3) equal tranches, with each respective tranche having a 12 month performanceperiod aligned to successive financial years.
Each tranche of rights is dependent on satisfaction of two discrete performance measures:1. Earnings per Share (EPS) representing 50% of each tranche (EPS Measure); and2. Relative Total Shareholder Return (TSR) representing 50% of each tranche (TSR Measure).
Performance rights granted under the Performance Rights Plan carry no rights to dividends and no voting rights.
The following table summarises the Performance Rights granted under the plan:
Number of Performance Rights
Tranche 1 Tranche 2 Tranche 3
Granted during the year 65,613 65,613 65,613Forfeited during the year (30,247) (18,584) (10,684)
Granted during the year - - -Forfeited during the year (35,366) (47,029) (42,683)
Performance Rights outstanding at the end of the year have the following expiry dates and base prices:
Performance RightsIssued
Grant Date Expiry Date Base Price FY1714 July 2016 1 July 2018 $5.61 -14 July 2016 1 July 2019 $5.61 12,2461 December 2016 1 July 2019 $6.19 -
In accordance with the provisions of the executive share option plan, as at 30 June 2018, Directors, executives and senioremployees have options over nil ordinary shares (FY17: nil).
Share options granted under the executive share option plan carry no rights to dividends and no voting rights.
In FY18 the Directors approved a replacement Rights Plan (Replacement Plan) in connection with future long term incentiveremuneration. No Performance Rights have been granted under this plan as at 30 June 2018.
Retail Food Group Limited - Annual Report - Financial Year Ended 30 June 2018 Page 60
For
per
sona
l use
onl
y
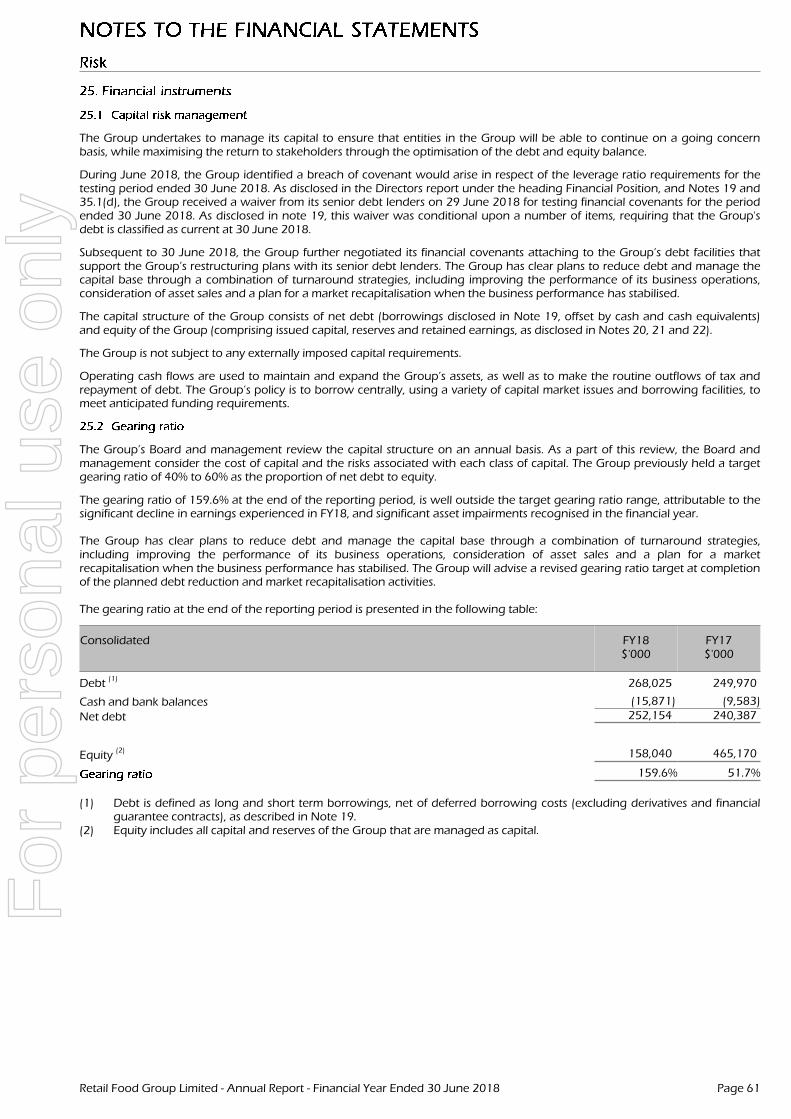
The Group undertakes to manage its capital to ensure that entities in the Group will be able to continue on a going concernbasis, while maximising the return to stakeholders through the optimisation of the debt and equity balance.
During June 2018, the Group identified a breach of covenant would arise in respect of the leverage ratio requirements for thetesting period ended 30 June 2018. As disclosed in the Directors report under the heading Financial Position, and Notes 19 and35.1(d), the Group received a waiver from its senior debt lenders on 29 June 2018 for testing financial covenants for the periodended 30 June 2018. As disclosed in note 19, this waiver was conditional upon a number of items, requiring that the Group'sdebt is classified as current at 30 June 2018.
Subsequent to 30 June 2018, the Group further negotiated its financial covenants attaching to the Group’s debt facilities thatsupport the Group’s restructuring plans with its senior debt lenders. The Group has clear plans to reduce debt and manage thecapital base through a combination of turnaround strategies, including improving the performance of its business operations,consideration of asset sales and a plan for a market recapitalisation when the business performance has stabilised.
The capital structure of the Group consists of net debt (borrowings disclosed in Note 19, offset by cash and cash equivalents)and equity of the Group (comprising issued capital, reserves and retained earnings, as disclosed in Notes 20, 21 and 22).
The Group is not subject to any externally imposed capital requirements.
Operating cash flows are used to maintain and expand the Group’s assets, as well as to make the routine outflows of tax andrepayment of debt. The Group’s policy is to borrow centrally, using a variety of capital market issues and borrowing facilities, tomeet anticipated funding requirements.
The Group’s Board and management review the capital structure on an annual basis. As a part of this review, the Board andmanagement consider the cost of capital and the risks associated with each class of capital. The Group previously held a targetgearing ratio of 40% to 60% as the proportion of net debt to equity.
The gearing ratio of 159.6% at the end of the reporting period, is well outside the target gearing ratio range, attributable to thesignificant decline in earnings experienced in FY18, and significant asset impairments recognised in the financial year.
The Group has clear plans to reduce debt and manage the capital base through a combination of turnaround strategies,including improving the performance of its business operations, consideration of asset sales and a plan for a marketrecapitalisation when the business performance has stabilised. The Group will advise a revised gearing ratio target at completionof the planned debt reduction and market recapitalisation activities.
The gearing ratio at the end of the reporting period is presented in the following table:
Consolidated FY18$'000
FY17$'000
Debt(1)
268,025 249,970
Cash and bank balances (15,871) (9,583)
Net debt 252,154 240,387
Equity(2) 158,040 465,170
159.6% 51.7%
(1) Debt is defined as long and short term borrowings, net of deferred borrowing costs (excluding derivatives and financialguarantee contracts), as described in Note 19.
(2) Equity includes all capital and reserves of the Group that are managed as capital.
Retail Food Group Limited - Annual Report - Financial Year Ended 30 June 2018 Page 61
For
per
sona
l use
onl
y
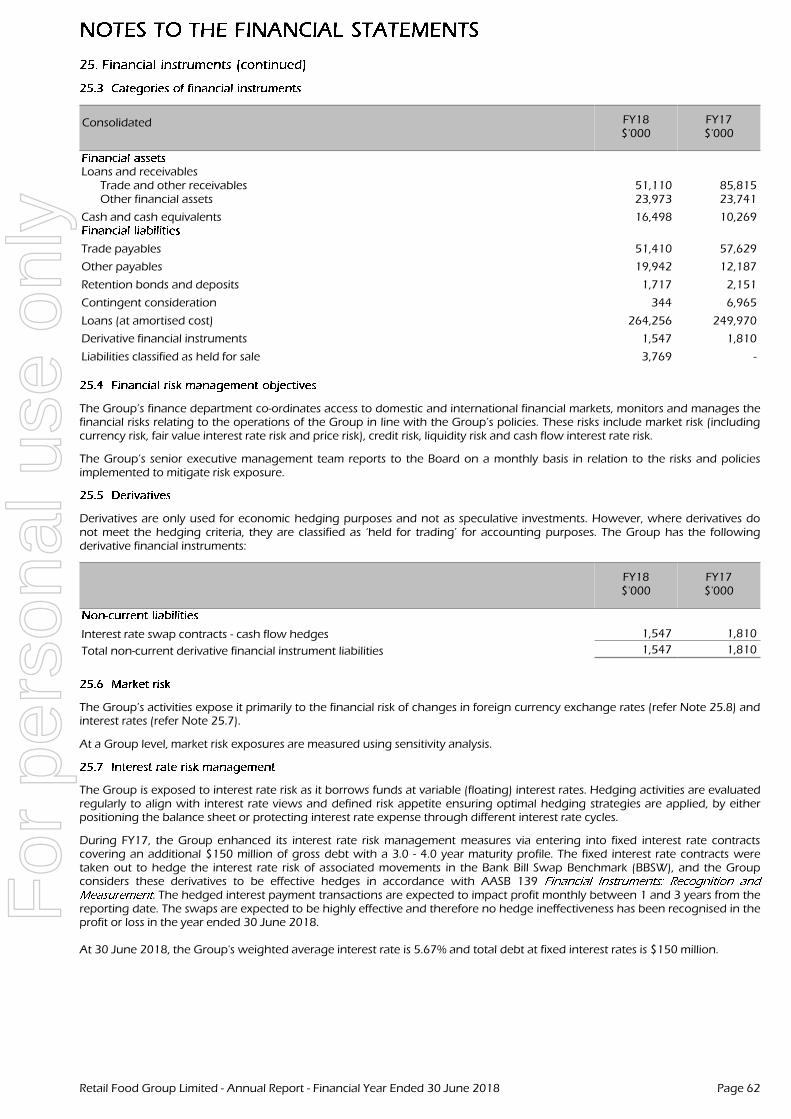
Consolidated FY18$'000
FY17$'000
Loans and receivablesTrade and other receivables 51,110 85,815Other financial assets 23,973 23,741
Cash and cash equivalents 16,498 10,269
Trade payables 51,410 57,629
Other payables 19,942 12,187
Retention bonds and deposits 1,717 2,151
Contingent consideration 344 6,965
Loans (at amortised cost) 264,256 249,970
Derivative financial instruments 1,547 1,810
Liabilities classified as held for sale 3,769 -
The Group’s finance department co-ordinates access to domestic and international financial markets, monitors and manages thefinancial risks relating to the operations of the Group in line with the Group’s policies. These risks include market risk (includingcurrency risk, fair value interest rate risk and price risk), credit risk, liquidity risk and cash flow interest rate risk.
The Group’s senior executive management team reports to the Board on a monthly basis in relation to the risks and policiesimplemented to mitigate risk exposure.
Derivatives are only used for economic hedging purposes and not as speculative investments. However, where derivatives donot meet the hedging criteria, they are classified as ‘held for trading’ for accounting purposes. The Group has the followingderivative financial instruments:
FY18$'000
FY17$'000
Interest rate swap contracts - cash flow hedges 1,547 1,810
Total non-current derivative financial instrument liabilities 1,547 1,810
The Group’s activities expose it primarily to the financial risk of changes in foreign currency exchange rates (refer Note 25.8) andinterest rates (refer Note 25.7).
At a Group level, market risk exposures are measured using sensitivity analysis.
The Group is exposed to interest rate risk as it borrows funds at variable (floating) interest rates. Hedging activities are evaluatedregularly to align with interest rate views and defined risk appetite ensuring optimal hedging strategies are applied, by eitherpositioning the balance sheet or protecting interest rate expense through different interest rate cycles.
During FY17, the Group enhanced its interest rate risk management measures via entering into fixed interest rate contractscovering an additional $150 million of gross debt with a 3.0 - 4.0 year maturity profile. The fixed interest rate contracts weretaken out to hedge the interest rate risk of associated movements in the Bank Bill Swap Benchmark (BBSW), and the Groupconsiders these derivatives to be effective hedges in accordance with AASB 139
. The hedged interest payment transactions are expected to impact profit monthly between 1 and 3 years from thereporting date. The swaps are expected to be highly effective and therefore no hedge ineffectiveness has been recognised in theprofit or loss in the year ended 30 June 2018.
At 30 June 2018, the Group's weighted average interest rate is 5.67% and total debt at fixed interest rates is $150 million.
Retail Food Group Limited - Annual Report - Financial Year Ended 30 June 2018 Page 62
For
per
sona
l use
onl
y
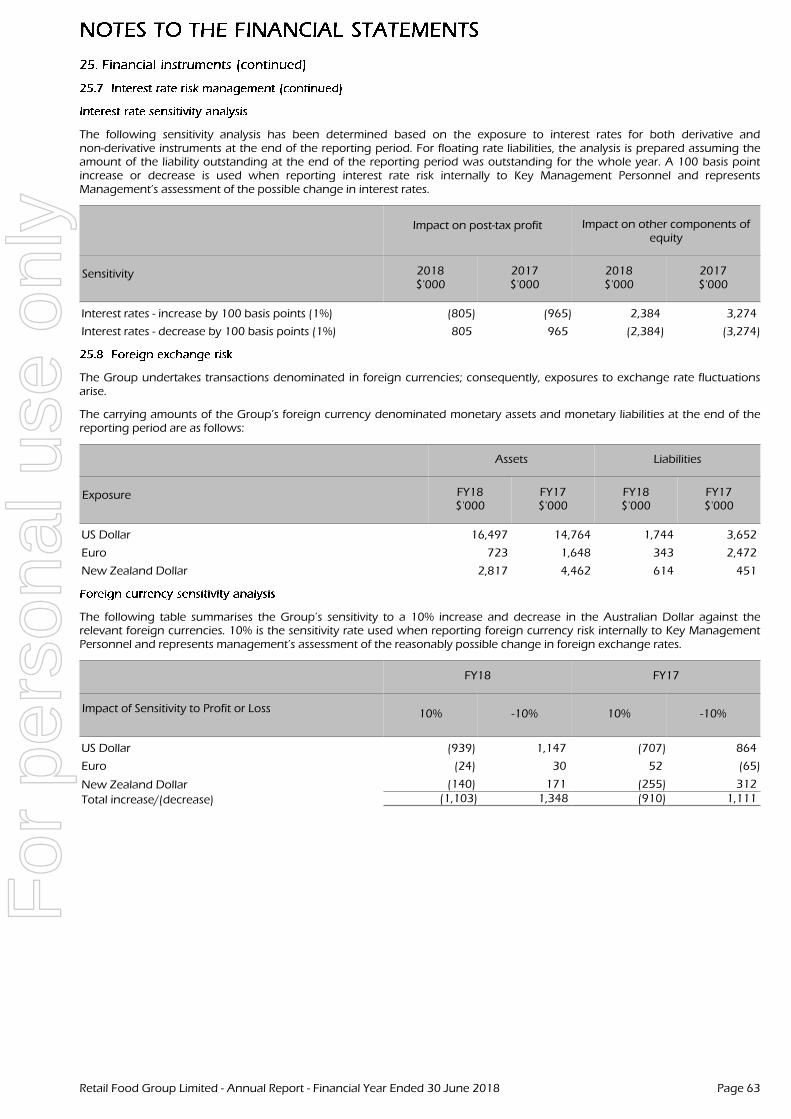
The following sensitivity analysis has been determined based on the exposure to interest rates for both derivative andnon-derivative instruments at the end of the reporting period. For floating rate liabilities, the analysis is prepared assuming theamount of the liability outstanding at the end of the reporting period was outstanding for the whole year. A 100 basis pointincrease or decrease is used when reporting interest rate risk internally to Key Management Personnel and representsManagement’s assessment of the possible change in interest rates.
Impact on post-tax profit Impact on other components ofequity
Sensitivity 2018$'000
2017$'000
2018$'000
2017$'000
Interest rates - increase by 100 basis points (1%) (805) (965) 2,384 3,274
Interest rates - decrease by 100 basis points (1%) 805 965 (2,384) (3,274)
The Group undertakes transactions denominated in foreign currencies; consequently, exposures to exchange rate fluctuationsarise.
The carrying amounts of the Group’s foreign currency denominated monetary assets and monetary liabilities at the end of thereporting period are as follows:
Assets Liabilities
Exposure FY18$'000
FY17$'000
FY18$'000
FY17$'000
US Dollar 16,497 14,764 1,744 3,652
Euro 723 1,648 343 2,472
New Zealand Dollar 2,817 4,462 614 451
The following table summarises the Group’s sensitivity to a 10% increase and decrease in the Australian Dollar against therelevant foreign currencies. 10% is the sensitivity rate used when reporting foreign currency risk internally to Key ManagementPersonnel and represents management’s assessment of the reasonably possible change in foreign exchange rates.
FY18 FY17
Impact of Sensitivity to Profit or Loss 10% -10% 10% -10%
US Dollar (939) 1,147 (707) 864
Euro (24) 30 52 (65)
New Zealand Dollar (140) 171 (255) 312
Total increase/(decrease) (1,103) 1,348 (910) 1,111
Retail Food Group Limited - Annual Report - Financial Year Ended 30 June 2018 Page 63
For
per
sona
l use
onl
y
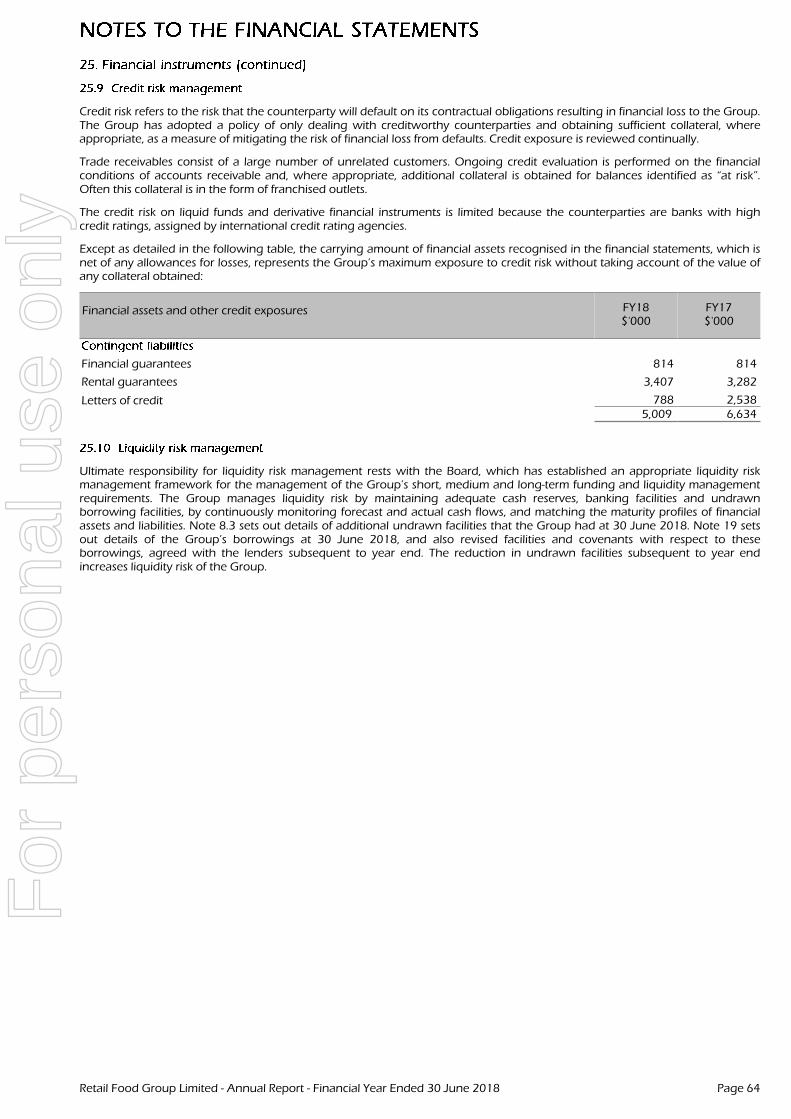
Credit risk refers to the risk that the counterparty will default on its contractual obligations resulting in financial loss to the Group.The Group has adopted a policy of only dealing with creditworthy counterparties and obtaining sufficient collateral, whereappropriate, as a measure of mitigating the risk of financial loss from defaults. Credit exposure is reviewed continually.
Trade receivables consist of a large number of unrelated customers. Ongoing credit evaluation is performed on the financialconditions of accounts receivable and, where appropriate, additional collateral is obtained for balances identified as “at risk”.Often this collateral is in the form of franchised outlets.
The credit risk on liquid funds and derivative financial instruments is limited because the counterparties are banks with highcredit ratings, assigned by international credit rating agencies.
Except as detailed in the following table, the carrying amount of financial assets recognised in the financial statements, which isnet of any allowances for losses, represents the Group’s maximum exposure to credit risk without taking account of the value ofany collateral obtained:
Financial assets and other credit exposures FY18$'000
FY17$'000
Financial guarantees 814 814
Rental guarantees 3,407 3,282
Letters of credit 788 2,5385,009 6,634
Ultimate responsibility for liquidity risk management rests with the Board, which has established an appropriate liquidity riskmanagement framework for the management of the Group’s short, medium and long-term funding and liquidity managementrequirements. The Group manages liquidity risk by maintaining adequate cash reserves, banking facilities and undrawnborrowing facilities, by continuously monitoring forecast and actual cash flows, and matching the maturity profiles of financialassets and liabilities. Note 8.3 sets out details of additional undrawn facilities that the Group had at 30 June 2018. Note 19 setsout details of the Group’s borrowings at 30 June 2018, and also revised facilities and covenants with respect to theseborrowings, agreed with the lenders subsequent to year end. The reduction in undrawn facilities subsequent to year endincreases liquidity risk of the Group.
Retail Food Group Limited - Annual Report - Financial Year Ended 30 June 2018 Page 64
For
per
sona
l use
onl
y
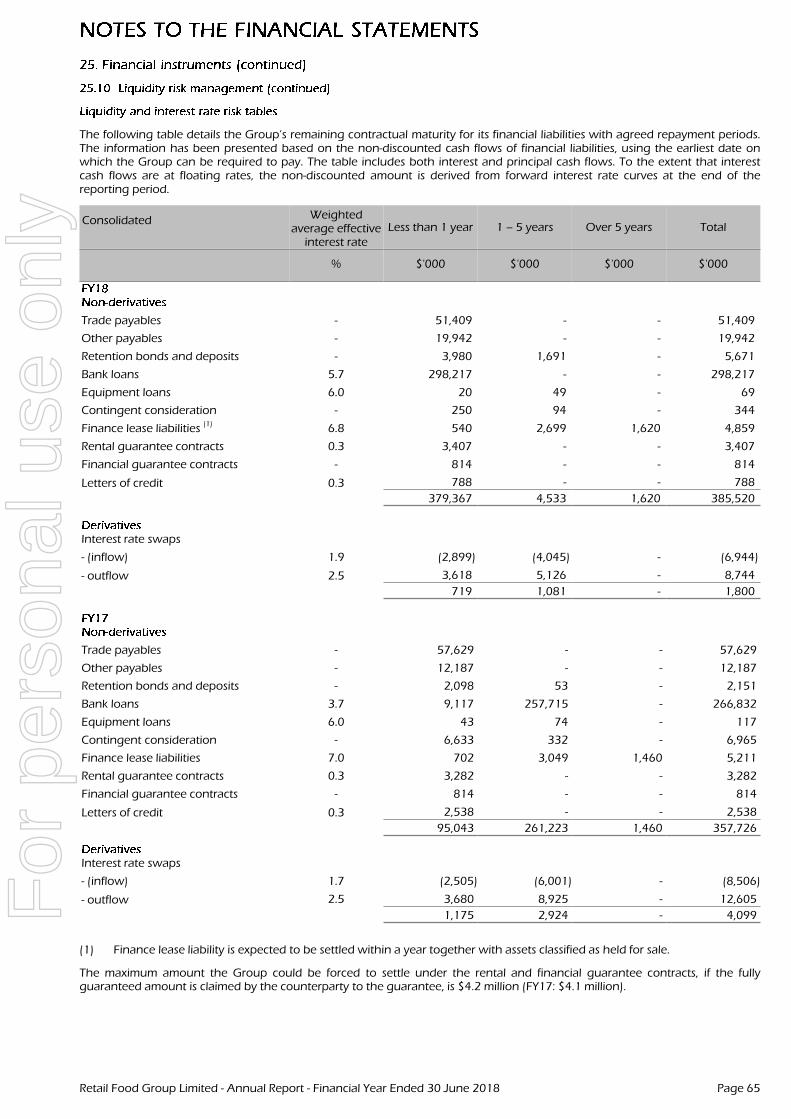
The following table details the Group’s remaining contractual maturity for its financial liabilities with agreed repayment periods.The information has been presented based on the non-discounted cash flows of financial liabilities, using the earliest date onwhich the Group can be required to pay. The table includes both interest and principal cash flows. To the extent that interestcash flows are at floating rates, the non-discounted amount is derived from forward interest rate curves at the end of thereporting period.
Consolidated Weightedaverage effective
interest rateLess than 1 year 1 – 5 years Over 5 years Total
% $'000 $'000 $'000 $'000
Trade payables - 51,409 - - 51,409
Other payables - 19,942 - - 19,942
Retention bonds and deposits - 3,980 1,691 - 5,671
Bank loans 5.7 298,217 - - 298,217
Equipment loans 6.0 20 49 - 69
Contingent consideration - 250 94 - 344
Finance lease liabilities (1) 6.8 540 2,699 1,620 4,859
Rental guarantee contracts 0.3 3,407 - - 3,407
Financial guarantee contracts - 814 - - 814
Letters of credit 0.3 788 - - 788
19.1 379,367 4,533 1,620 385,520
Interest rate swaps
- (inflow) 1.9 (2,899) (4,045) - (6,944)
- outflow 2.5 3,618 5,126 - 8,744
4.4 719 1,081 - 1,800
Trade payables - 57,629 - - 57,629
Other payables - 12,187 - - 12,187
Retention bonds and deposits - 2,098 53 - 2,151
Bank loans 3.7 9,117 257,715 - 266,832
Equipment loans 6.0 43 74 - 117
Contingent consideration - 6,633 332 - 6,965
Finance lease liabilities 7.0 702 3,049 1,460 5,211
Rental guarantee contracts 0.3 3,282 - - 3,282
Financial guarantee contracts - 814 - - 814
Letters of credit 0.3 2,538 - - 2,538
17.3 95,043 261,223 1,460 357,726
Interest rate swaps
- (inflow) 1.7 (2,505) (6,001) - (8,506)
- outflow 2.5 3,680 8,925 - 12,605
4.2 1,175 2,924 - 4,099
(1) Finance lease liability is expected to be settled within a year together with assets classified as held for sale.
The maximum amount the Group could be forced to settle under the rental and financial guarantee contracts, if the fullyguaranteed amount is claimed by the counterparty to the guarantee, is $4.2 million (FY17: $4.1 million).
Retail Food Group Limited - Annual Report - Financial Year Ended 30 June 2018 Page 65
For
per
sona
l use
onl
y
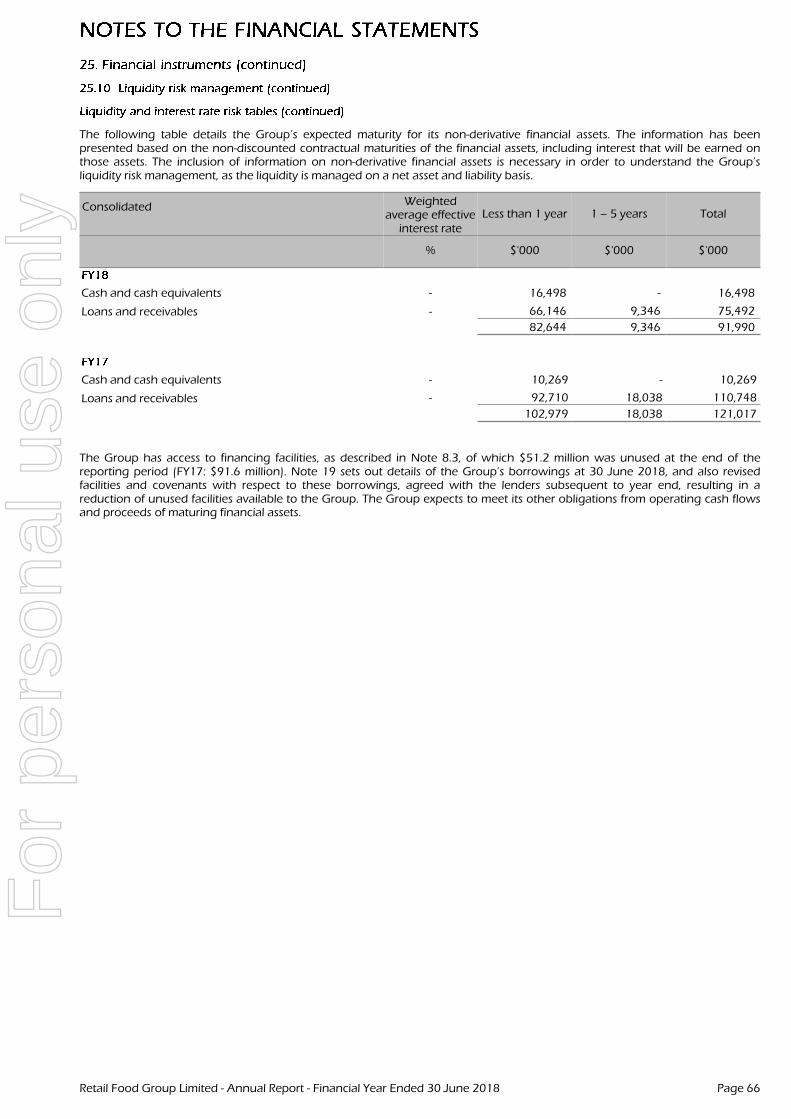
The following table details the Group’s expected maturity for its non-derivative financial assets. The information has beenpresented based on the non-discounted contractual maturities of the financial assets, including interest that will be earned onthose assets. The inclusion of information on non-derivative financial assets is necessary in order to understand the Group’sliquidity risk management, as the liquidity is managed on a net asset and liability basis.
Consolidated Weightedaverage effective
interest rateLess than 1 year 1 – 5 years Total
% $'000 $'000 $'000
Cash and cash equivalents - 16,498 - 16,498
Loans and receivables - 66,146 9,346 75,492
- 82,644 9,346 91,990
Cash and cash equivalents - 10,269 - 10,269
Loans and receivables - 92,710 18,038 110,748
- 102,979 18,038 121,017
The Group has access to financing facilities, as described in Note 8.3, of which $51.2 million was unused at the end of thereporting period (FY17: $91.6 million). Note 19 sets out details of the Group’s borrowings at 30 June 2018, and also revisedfacilities and covenants with respect to these borrowings, agreed with the lenders subsequent to year end, resulting in areduction of unused facilities available to the Group. The Group expects to meet its other obligations from operating cash flowsand proceeds of maturing financial assets.
Retail Food Group Limited - Annual Report - Financial Year Ended 30 June 2018 Page 66
For
per
sona
l use
onl
y
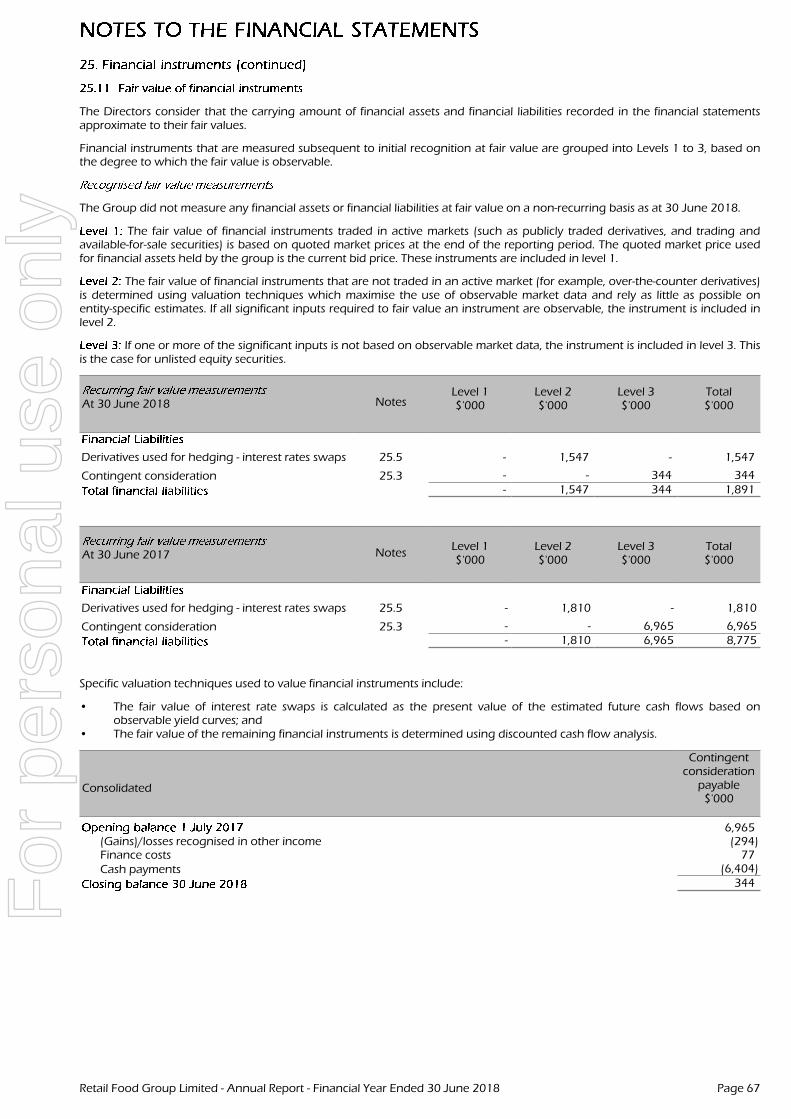
The Directors consider that the carrying amount of financial assets and financial liabilities recorded in the financial statementsapproximate to their fair values.
Financial instruments that are measured subsequent to initial recognition at fair value are grouped into Levels 1 to 3, based onthe degree to which the fair value is observable.
The Group did not measure any financial assets or financial liabilities at fair value on a non-recurring basis as at 30 June 2018.
The fair value of financial instruments traded in active markets (such as publicly traded derivatives, and trading andavailable-for-sale securities) is based on quoted market prices at the end of the reporting period. The quoted market price usedfor financial assets held by the group is the current bid price. These instruments are included in level 1.
The fair value of financial instruments that are not traded in an active market (for example, over-the-counter derivatives)is determined using valuation techniques which maximise the use of observable market data and rely as little as possible onentity-specific estimates. If all significant inputs required to fair value an instrument are observable, the instrument is included inlevel 2.
If one or more of the significant inputs is not based on observable market data, the instrument is included in level 3. Thisis the case for unlisted equity securities.
At 30 June 2018 NotesLevel 1$'000
Level 2$'000
Level 3$'000
Total$'000
Derivatives used for hedging - interest rates swaps 25.5 - 1,547 - 1,547
Contingent consideration 25.3 - - 344 344- 1,547 344 1,891
At 30 June 2017 NotesLevel 1$'000
Level 2$'000
Level 3$'000
Total$'000
Derivatives used for hedging - interest rates swaps 25.5 - 1,810 - 1,810
Contingent consideration 25.3 - - 6,965 6,965- 1,810 6,965 8,775
Specific valuation techniques used to value financial instruments include:
• The fair value of interest rate swaps is calculated as the present value of the estimated future cash flows based onobservable yield curves; and
• The fair value of the remaining financial instruments is determined using discounted cash flow analysis.
Consolidated
Contingentconsideration
payable$'000
6,965(Gains)/losses recognised in other income (294)Finance costs 77Cash payments (6,404)
344
Retail Food Group Limited - Annual Report - Financial Year Ended 30 June 2018 Page 67
For
per
sona
l use
onl
y
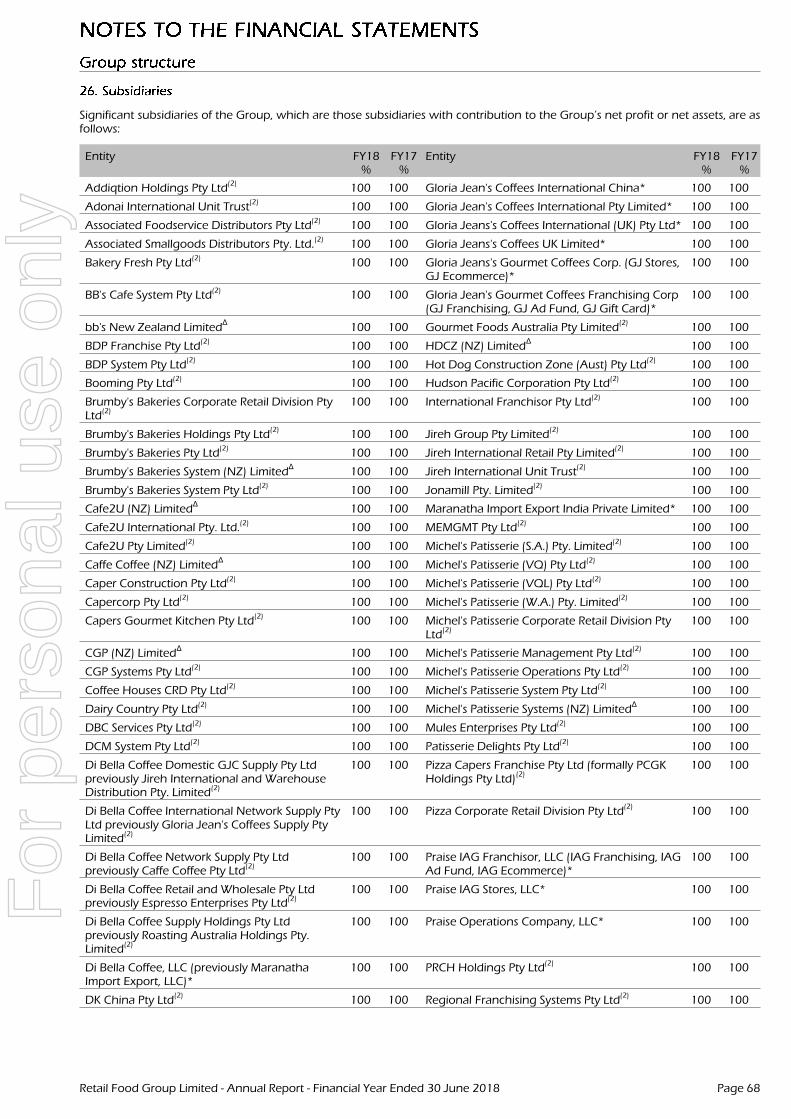
Significant subsidiaries of the Group, which are those subsidiaries with contribution to the Group’s net profit or net assets, are asfollows:
Entity FY18%
FY17%
Entity FY18%
FY17%
Addiqtion Holdings Pty Ltd(2)
100 100 Gloria Jean's Coffees International China* 100 100
Adonai International Unit Trust(2)
100 100 Gloria Jean's Coffees International Pty Limited* 100 100
Associated Foodservice Distributors Pty Ltd(2)
100 100 Gloria Jeans's Coffees International (UK) Pty Ltd* 100 100
Associated Smallgoods Distributors Pty. Ltd.(2)
100 100 Gloria Jeans's Coffees UK Limited* 100 100
Bakery Fresh Pty Ltd(2)
100 100 Gloria Jeans's Gourmet Coffees Corp. (GJ Stores,GJ Ecommerce)*
100 100
BB's Cafe System Pty Ltd(2) 100 100 Gloria Jean's Gourmet Coffees Franchising Corp(GJ Franchising, GJ Ad Fund, GJ Gift Card)*
100 100
bb's New Zealand LimitedΔ
100 100 Gourmet Foods Australia Pty Limited(2)
100 100
BDP Franchise Pty Ltd(2)
100 100 HDCZ (NZ) LimitedΔ
100 100
BDP System Pty Ltd(2)
100 100 Hot Dog Construction Zone (Aust) Pty Ltd(2)
100 100
Booming Pty Ltd(2) 100 100 Hudson Pacific Corporation Pty Ltd(2) 100 100
Brumby's Bakeries Corporate Retail Division PtyLtd
(2)100 100 International Franchisor Pty Ltd(2) 100 100
Brumby's Bakeries Holdings Pty Ltd(2)
100 100 Jireh Group Pty Limited(2)
100 100
Brumby's Bakeries Pty Ltd(2)
100 100 Jireh International Retail Pty Limited(2)
100 100
Brumby's Bakeries System (NZ) LimitedΔ
100 100 Jireh International Unit Trust(2)
100 100
Brumby's Bakeries System Pty Ltd(2)
100 100 Jonamill Pty. Limited(2)
100 100
Cafe2U (NZ) LimitedΔ
100 100 Maranatha Import Export India Private Limited* 100 100
Cafe2U International Pty. Ltd.(2) 100 100 MEMGMT Pty Ltd(2) 100 100
Cafe2U Pty Limited(2) 100 100 Michel's Patisserie (S.A.) Pty. Limited(2) 100 100
Caffe Coffee (NZ) LimitedΔ
100 100 Michel's Patisserie (VQ) Pty Ltd(2) 100 100
Caper Construction Pty Ltd(2) 100 100 Michel's Patisserie (VQL) Pty Ltd(2) 100 100
Capercorp Pty Ltd(2)
100 100 Michel's Patisserie (W.A.) Pty. Limited(2)
100 100
Capers Gourmet Kitchen Pty Ltd(2)
100 100 Michel's Patisserie Corporate Retail Division PtyLtd
(2)100 100
CGP (NZ) LimitedΔ
100 100 Michel's Patisserie Management Pty Ltd(2) 100 100
CGP Systems Pty Ltd(2) 100 100 Michel's Patisserie Operations Pty Ltd(2) 100 100
Coffee Houses CRD Pty Ltd(2) 100 100 Michel's Patisserie System Pty Ltd(2) 100 100
Dairy Country Pty Ltd(2) 100 100 Michel's Patisserie Systems (NZ) LimitedΔ
100 100
DBC Services Pty Ltd(2) 100 100 Mules Enterprises Pty Ltd(2) 100 100
DCM System Pty Ltd(2)
100 100 Patisserie Delights Pty Ltd(2)
100 100
Di Bella Coffee Domestic GJC Supply Pty Ltdpreviously Jireh International and WarehouseDistribution Pty. Limited(2)
100 100 Pizza Capers Franchise Pty Ltd (formally PCGKHoldings Pty Ltd)
(2)100 100
Di Bella Coffee International Network Supply PtyLtd previously Gloria Jean's Coffees Supply PtyLimited(2)
100 100 Pizza Corporate Retail Division Pty Ltd(2)
100 100
Di Bella Coffee Network Supply Pty Ltdpreviously Caffe Coffee Pty Ltd
(2)100 100 Praise IAG Franchisor, LLC (IAG Franchising, IAG
Ad Fund, IAG Ecommerce)*100 100
Di Bella Coffee Retail and Wholesale Pty Ltdpreviously Espresso Enterprises Pty Ltd(2)
100 100 Praise IAG Stores, LLC* 100 100
Di Bella Coffee Supply Holdings Pty Ltdpreviously Roasting Australia Holdings Pty.Limited(2)
100 100 Praise Operations Company, LLC* 100 100
Di Bella Coffee, LLC (previously MaranathaImport Export, LLC)*
100 100 PRCH Holdings Pty Ltd(2) 100 100
DK China Pty Ltd(2)
100 100 Regional Franchising Systems Pty Ltd(2)
100 100
Retail Food Group Limited - Annual Report - Financial Year Ended 30 June 2018 Page 68
For
per
sona
l use
onl
y
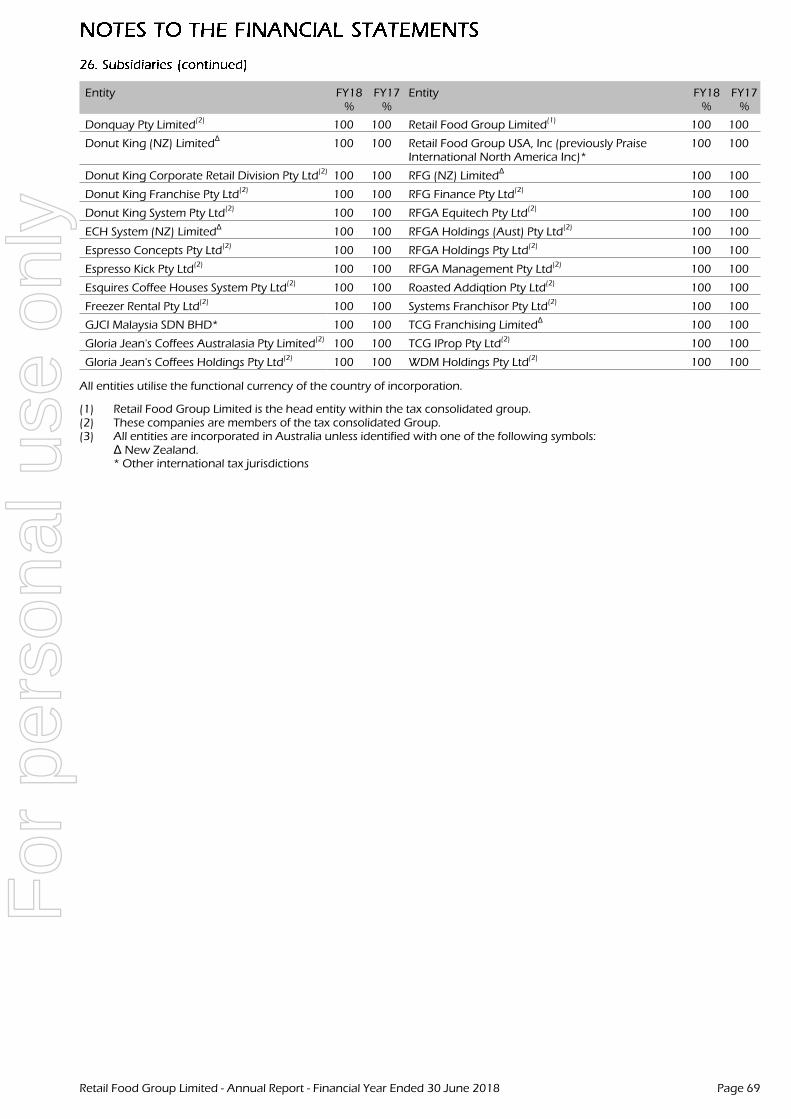
Entity FY18%
FY17%
Entity FY18%
FY17%
Donquay Pty Limited(2)
100 100 Retail Food Group Limited(1)
100 100
Donut King (NZ) LimitedΔ
100 100 Retail Food Group USA, Inc (previously PraiseInternational North America Inc)*
100 100
Donut King Corporate Retail Division Pty Ltd(2) 100 100 RFG (NZ) LimitedΔ
100 100
Donut King Franchise Pty Ltd(2)
100 100 RFG Finance Pty Ltd(2)
100 100
Donut King System Pty Ltd(2)
100 100 RFGA Equitech Pty Ltd(2)
100 100
ECH System (NZ) LimitedΔ
100 100 RFGA Holdings (Aust) Pty Ltd(2)
100 100
Espresso Concepts Pty Ltd(2)
100 100 RFGA Holdings Pty Ltd(2)
100 100
Espresso Kick Pty Ltd(2)
100 100 RFGA Management Pty Ltd(2)
100 100
Esquires Coffee Houses System Pty Ltd(2)
100 100 Roasted Addiqtion Pty Ltd(2)
100 100
Freezer Rental Pty Ltd(2)
100 100 Systems Franchisor Pty Ltd(2)
100 100
GJCI Malaysia SDN BHD* 100 100 TCG Franchising LimitedΔ
100 100
Gloria Jean's Coffees Australasia Pty Limited(2) 100 100 TCG IProp Pty Ltd(2) 100 100
Gloria Jean's Coffees Holdings Pty Ltd(2) 100 100 WDM Holdings Pty Ltd(2) 100 100
All entities utilise the functional currency of the country of incorporation.
(1) Retail Food Group Limited is the head entity within the tax consolidated group.(2) These companies are members of the tax consolidated Group.(3) All entities are incorporated in Australia unless identified with one of the following symbols:
Δ New Zealand.* Other international tax jurisdictions
Retail Food Group Limited - Annual Report - Financial Year Ended 30 June 2018 Page 69
For
per
sona
l use
onl
y
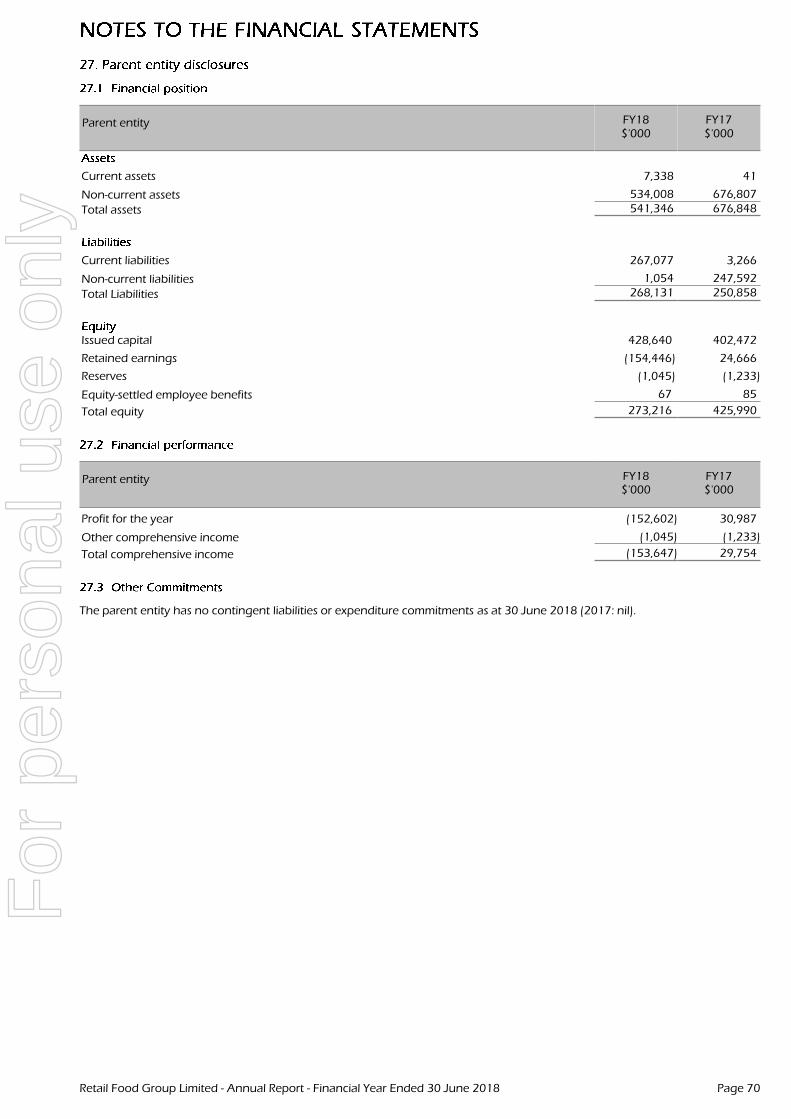
Parent entity FY18$'000
FY17$'000
Current assets 7,338 41
Non-current assets 534,008 676,807
Total assets 541,346 676,848
Current liabilities 267,077 3,266
Non-current liabilities 1,054 247,592
Total Liabilities 268,131 250,858
Issued capital 428,640 402,472
Retained earnings (154,446) 24,666
Reserves (1,045) (1,233)
Equity-settled employee benefits 67 85
Total equity 273,216 425,990
Parent entity FY18$'000
FY17$'000
Profit for the year (152,602) 30,987
Other comprehensive income (1,045) (1,233)
Total comprehensive income (153,647) 29,754
The parent entity has no contingent liabilities or expenditure commitments as at 30 June 2018 (2017: nil).
Retail Food Group Limited - Annual Report - Financial Year Ended 30 June 2018 Page 70
For
per
sona
l use
onl
y
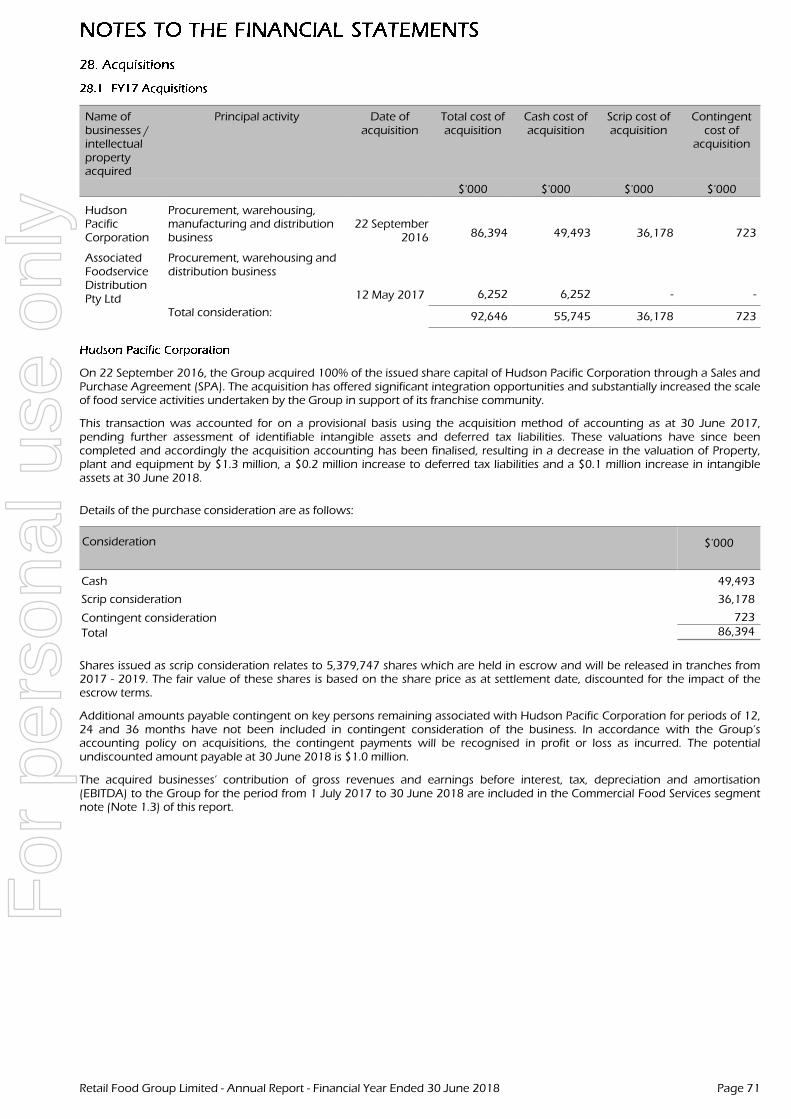
Name ofbusinesses /intellectualpropertyacquired
Principal activity Date ofacquisition
Total cost ofacquisition
Cash cost ofacquisition
Scrip cost ofacquisition
Contingentcost of
acquisition
$'000 $'000 $'000 $'000
HudsonPacificCorporation
Procurement, warehousing,manufacturing and distributionbusiness
22 September2016 86,394 49,493 36,178 723
AssociatedFoodserviceDistributionPty Ltd
Procurement, warehousing anddistribution business
12 May 2017 6,252 6,252 - -
Total consideration: 92,646 55,745 36,178 723
On 22 September 2016, the Group acquired 100% of the issued share capital of Hudson Pacific Corporation through a Sales andPurchase Agreement (SPA). The acquisition has offered significant integration opportunities and substantially increased the scaleof food service activities undertaken by the Group in support of its franchise community.
This transaction was accounted for on a provisional basis using the acquisition method of accounting as at 30 June 2017,pending further assessment of identifiable intangible assets and deferred tax liabilities. These valuations have since beencompleted and accordingly the acquisition accounting has been finalised, resulting in a decrease in the valuation of Property,plant and equipment by $1.3 million, a $0.2 million increase to deferred tax liabilities and a $0.1 million increase in intangibleassets at 30 June 2018.
Details of the purchase consideration are as follows:
Consideration $'000
Cash 49,493
Scrip consideration 36,178
Contingent consideration 723
Total 86,394
Shares issued as scrip consideration relates to 5,379,747 shares which are held in escrow and will be released in tranches from2017 - 2019. The fair value of these shares is based on the share price as at settlement date, discounted for the impact of theescrow terms.
Additional amounts payable contingent on key persons remaining associated with Hudson Pacific Corporation for periods of 12,24 and 36 months have not been included in contingent consideration of the business. In accordance with the Group’saccounting policy on acquisitions, the contingent payments will be recognised in profit or loss as incurred. The potentialundiscounted amount payable at 30 June 2018 is $1.0 million.
The acquired businesses’ contribution of gross revenues and earnings before interest, tax, depreciation and amortisation(EBITDA) to the Group for the period from 1 July 2017 to 30 June 2018 are included in the Commercial Food Services segmentnote (Note 1.3) of this report.
Retail Food Group Limited - Annual Report - Financial Year Ended 30 June 2018 Page 71
For
per
sona
l use
onl
y
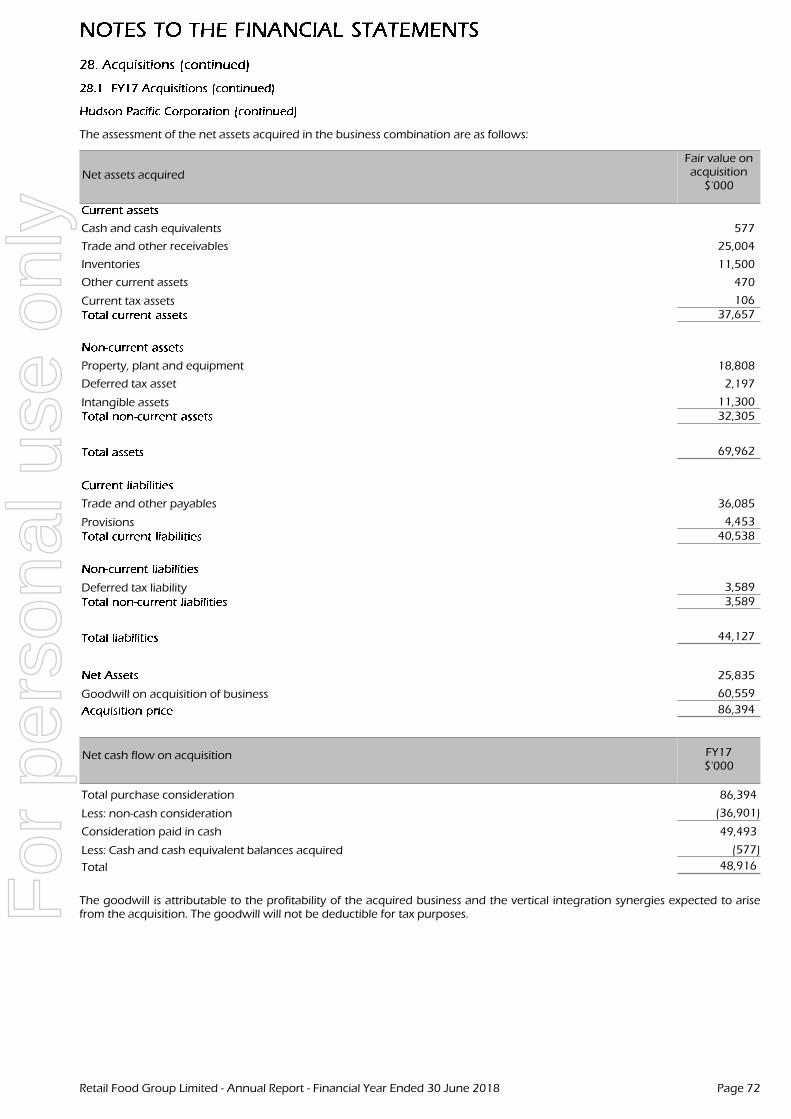
The assessment of the net assets acquired in the business combination are as follows:
Net assets acquired
Fair value onacquisition
$'000
Cash and cash equivalents 577
Trade and other receivables 25,004
Inventories 11,500
Other current assets 470
Current tax assets 10637,657
Property, plant and equipment 18,808
Deferred tax asset 2,197
Intangible assets 11,30032,305
69,962
Trade and other payables 36,085
Provisions 4,45340,538
Deferred tax liability 3,5893,589
44,127
25,835
Goodwill on acquisition of business 60,559
86,394
Net cash flow on acquisition FY17$'000
Total purchase consideration 86,394
Less: non-cash consideration (36,901)
Consideration paid in cash 49,493
Less: Cash and cash equivalent balances acquired (577)
Total 48,916
The goodwill is attributable to the profitability of the acquired business and the vertical integration synergies expected to arisefrom the acquisition. The goodwill will not be deductible for tax purposes.
Retail Food Group Limited - Annual Report - Financial Year Ended 30 June 2018 Page 72
For
per
sona
l use
onl
y
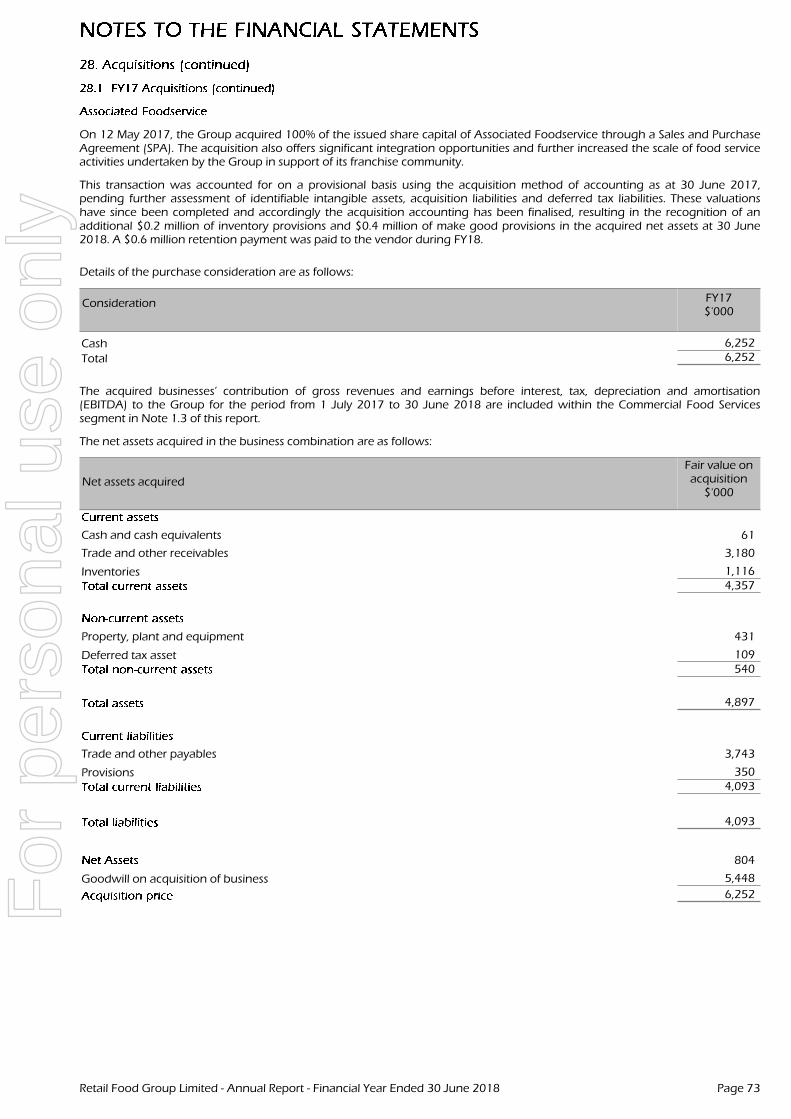
On 12 May 2017, the Group acquired 100% of the issued share capital of Associated Foodservice through a Sales and PurchaseAgreement (SPA). The acquisition also offers significant integration opportunities and further increased the scale of food serviceactivities undertaken by the Group in support of its franchise community.
This transaction was accounted for on a provisional basis using the acquisition method of accounting as at 30 June 2017,pending further assessment of identifiable intangible assets, acquisition liabilities and deferred tax liabilities. These valuationshave since been completed and accordingly the acquisition accounting has been finalised, resulting in the recognition of anadditional $0.2 million of inventory provisions and $0.4 million of make good provisions in the acquired net assets at 30 June2018. A $0.6 million retention payment was paid to the vendor during FY18.
Details of the purchase consideration are as follows:
Consideration FY17$'000
Cash 6,252
Total 6,252
The acquired businesses’ contribution of gross revenues and earnings before interest, tax, depreciation and amortisation(EBITDA) to the Group for the period from 1 July 2017 to 30 June 2018 are included within the Commercial Food Servicessegment in Note 1.3 of this report.
The net assets acquired in the business combination are as follows:
Net assets acquired
Fair value onacquisition
$'000
Cash and cash equivalents 61
Trade and other receivables 3,180
Inventories 1,1164,357
Property, plant and equipment 431
Deferred tax asset 109540
4,897
Trade and other payables 3,743
Provisions 3504,093
4,093
804
Goodwill on acquisition of business 5,448
6,252
Retail Food Group Limited - Annual Report - Financial Year Ended 30 June 2018 Page 73
For
per
sona
l use
onl
y
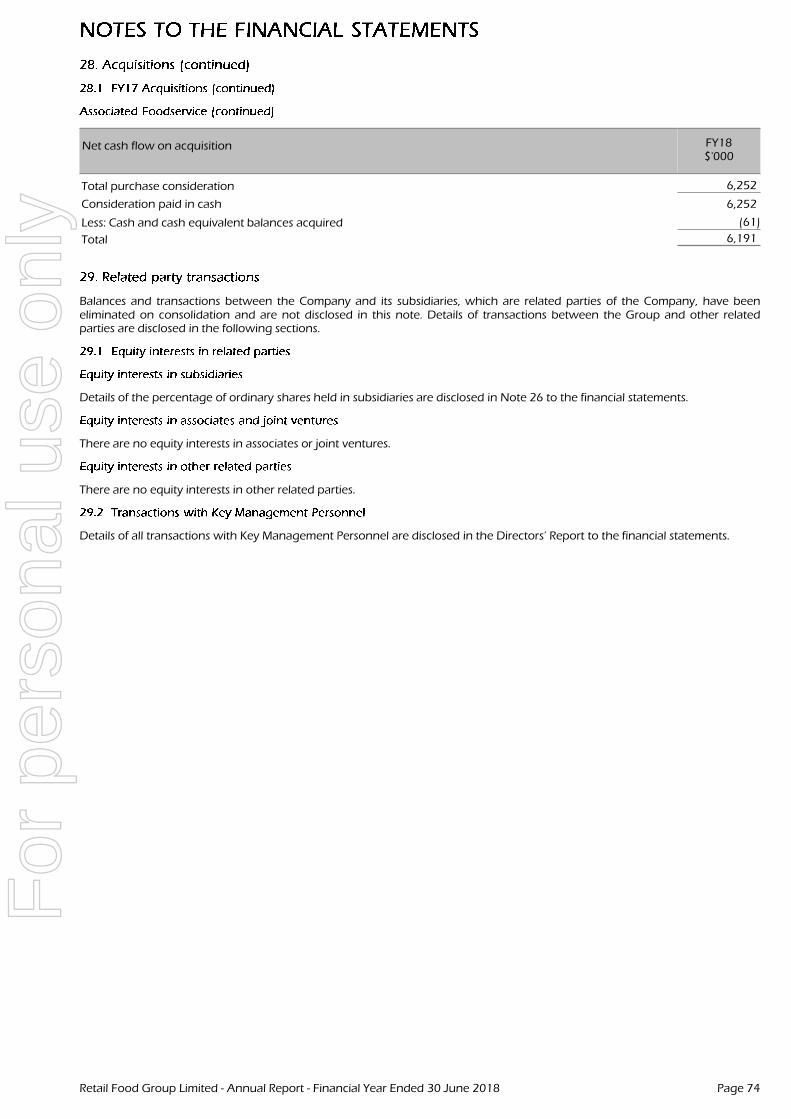
Net cash flow on acquisition FY18$'000
Total purchase consideration 6,252
Consideration paid in cash 6,252
Less: Cash and cash equivalent balances acquired (61)
Total 6,191
Balances and transactions between the Company and its subsidiaries, which are related parties of the Company, have beeneliminated on consolidation and are not disclosed in this note. Details of transactions between the Group and other relatedparties are disclosed in the following sections.
Details of the percentage of ordinary shares held in subsidiaries are disclosed in Note 26 to the financial statements.
There are no equity interests in associates or joint ventures.
There are no equity interests in other related parties.
Details of all transactions with Key Management Personnel are disclosed in the Directors’ Report to the financial statements.
Retail Food Group Limited - Annual Report - Financial Year Ended 30 June 2018 Page 74
For
per
sona
l use
onl
y
Except for the subsequent agreement with its senior debt lenders to reset financial covenants, refer Borrowings, Note 19, therehas not been any other matter or circumstance occurring, in the reasonable opinion of the Directors, that may significantly affectthe operations of the Group, the results of those operations, or the state of affairs of the Group in future financial years.
The Directors have resolved that no final dividend will be paid in respect of FY18.
Consolidated FY18$'000
FY17$'000
Financial guarantee contracts (1) 814 814
Rental guarantee contracts(2)
3,407 3,282
Letters of credit 788 2,5385,009 6,634
(1) During FY08, RFGA Management Pty Ltd, a subsidiary of Retail Food Group Limited, guaranteed the repayment ofborrowings in the amount of $814 thousand made by the Australia and New Zealand Banking group (ANZ Bank) toselective Franchisees. The guarantees had been given as security in respect of loans made by the ANZ Bank to enablecertain franchisees to commission their outlets. Each guarantee is expected to be extinguished without cost to the Groupin future financial periods.
(2) The Group, through various subsidiaries, is guarantor to a number of leases occupied and licensed to franchisees. Noliabilities have been recognised in relation to these rental guarantees.
The Group is currently in dispute with certain franchisees over minor matters. No liability has been recognised in relation to thesematters as the Directors are confident that these matters will be successfully resolved.
Consolidated FY18$'000
FY17$'000
Plant and equipment 698 3,280
Retail Food Group Limited - Annual Report - Financial Year Ended 30 June 2018 Page 75
For
per
sona
l use
onl
y
Operating leases relate to property leases (company stores and office premises) with lease terms of mainly five years, motorvehicle leases with lease terms of three years and office equipment leases with lease terms between two and four years. TheGroup does not have an option to purchase the leased asset at the expiry of the lease period.
The Group has a large number of back-to-back leases with Franchise Partners, which are contracted at substantially offsettingterms. The Group has not recognised these leases as commitments.
Future lease payment relating to back-to-back leases are $161.7 million, of which $147.2 million are expected to be paid byFranchise Partners. The Group has recognised a provision for onerous leases for the amount that is not expected to berecovered.
Consolidated FY18$'000
FY17$'000
Lease expense 9,300 8,0449,300 8,044
Consolidated FY18$'000
FY17$'000
Less than one year 8,806 8,066
Between one and five years 16,407 18,299
More than five years 1,822 1,25227,035 27,617
Consolidated FY18$'000
FY17$'000
Onerous leases and make-good (Note: 17) 20,280 65020,280 650
Consolidated FY18$
FY17$
Audit and review of financial statements 972,050 485,000
Consulting services on acquisition - 363,187IT review - 36,220
Tax advice on acquisition - 20,305
972,050 904,712
Other auditors
Audit and review of financial statements 39,312 20,000
39,312 20,000
The auditor of Retail Food Group Limited in FY18 is PricewaterhouseCooopers.
Retail Food Group Limited - Annual Report - Financial Year Ended 30 June 2018 Page 76
For
per
sona
l use
onl
y
This note provides a list of the significant accounting policies adopted in the preparation of these consolidated financialstatements to the extent they have not already been disclosed in the other notes above.
The financial statements comprise the consolidated financial statements of the Group. For the purpose of preparing theconsolidated financial statements, the Group is a for-profit entity.
These financial statements are general purpose financial statements which have been prepared in accordance with theAustralian Accounting Standards and other authoritative pronouncements of the Australian Accounting
Standards Board.
The nature of the operations and principal activities of the Group are described in the Directors' Report.
The financial statements comply with Australian Accounting Standards. The financial statements also comply with InternationalFinancial Reporting Standards (IFRS) as issued by the International Accounting Standards Board (IASB).
The financial statements were authorised for issue by the Directors on the 31 August 2018.
The financial statements have been prepared on the basis of historical cost, except for the revaluation of certain financialinstruments. Cost is based on the fair values of the consideration given in exchange for assets. All amounts are presented inAustralian Dollars, unless otherwise noted.
The Company is a company of the kind referred to in ASIC Corporations Instrument 2016/191, and, in accordance with thatCorporations Instrument, amounts in the financial report are rounded off to the nearest thousand dollars, unless otherwiseindicated.
The Directors have elected not to early adopt Accounting Standards that are not applicable to the reporting period ended 30June 2018.
These financial statements have been prepared on the basis that RFG is a going concern, able to realise assets in the ordinarycourse of business and settle liabilities as and when they are due.
The Group has experienced challenging operating conditions over the year and as announced with the release of its operatingresults for the half-year ended 31 December 2017, has instituted a restructure of its franchise brand systems networks toright-size the operation base of its respective businesses and set a course for growth in both domestic and international franchiseactivities. During the year ended 30 June 2018, the Group incurred a loss before income tax of $306.7 million, which includedbusiness turnaround, restructuring costs and impairment losses of $427.3 million as a result of the provisioning for the closure ofcirca 250 franchise stores and the impairment impacts arising from the revised profitability forecasts associated with the resetfranchise networks going forward. The Group has a net current liability position of $231.3 million at balance date. Despite thesechallenges, the Group generated a positive cashflow from operating activities of $10.8 million and a positive Underlying EBITDAof $71.4 million. Management and the Board are focussed on implementing the restructuring plan through FY19 and continuingto execute initiatives which are expected to boost operating earnings and reduce costs in future periods.
As referred to in Note 19 of the Financial Statements, the Group’s secured syndicated loans totalling $265 million are classified ascurrent liabilities at the balance date. The Group had breached one of its lending covenants under its syndicated lending facilityagreement at 30 June 2018. However, the Group has received a conditional waiver from the syndicate lenders. In addition,subsequent to the year end, agreement has been reached between the Company and its lenders to reset the covenants effectivefrom 31 August 2018 for covenant testing periods commencing 1 July 2018. The Group’s syndicated loan facility reduced from$309 million to $265 million and the maturity date was brought forward to 31 October 2019.
Despite the program to restructure the franchise businesses and build confidence in the franchise brands by consumers andpotential franchise investors, there remains significant risk that the Group may breach financial covenant thresholds under itsfinancing agreements within the next twelve months. A breach of one or more of these financial covenants may result in all thesyndicated debt becoming due and payable. The continuing viability of the Group and its ability to continue as a going concernis dependent upon the Group maintaining the continuing support of the syndicated lenders, and managing the covenants andthe terms of the renegotiated facility.
Retail Food Group Limited - Annual Report - Financial Year Ended 30 June 2018 Page 77
For
per
sona
l use
onl
y
Achieving this outcome also depends upon:
(1) The Group’s ability to implement successfully an asset sales program over the next twelve months to realise funds to assistin paying down the syndicated debt;
(2) The Group’s ability to obtain additional funding (by way, for example, of a capital raising or accessing alternative sourcesof finance);
(3) The Group’s ability to execute successfully the restructuring initiatives previously referred to.
As a result, there is a material uncertainty that may cast significant doubt on whether the Group will continue as a goingconcern and, therefore, whether it will realise its assets and settle its liabilities and commitments in the normal course of businessand at the amounts stated in the financial report. However, the Directors, after taking into account all relevant factors, haveconcluded that there are reasonable grounds to believe both that the secured syndicate financiers will continue to support theGroup and that the business will remain a going concern for the next twelve months.
Accordingly, the Directors have prepared the financial report on a going concern basis. As a consequence, no furtheradjustments have been made to the financial report relating to the recoverability and classification of the assets carryingamounts or the amounts and classifications of liabilities that might be necessary should the Group not continue as a goingconcern.
RFG’s auditor continues to work with the Board and management through these issues and has included an emphasis of matterparagraph in its audit opinion on the financial statements as at 30 June 2018 on the basis of material uncertainty associated withthe syndicated debt facility and the various recapitalisation initiatives. Your Directors understand and accept the position takenby the auditor at this date, as RFG’s relationship bankers are still considering the impacts of RFG’s turnaround strategies that arecurrently in progress.
The individual financial statements of each group entity are presented in the currency of the primary economic environment inwhich the entity operates (its functional currency). For the purpose of the consolidated financial statements, the results andfinancial position of each group entity are expressed in Australian Dollars (‘$’), which is the functional currency of the Companyand the presentation currency for the consolidated financial statements.
In preparing the financial statements of the individual entities, transactions in currencies other than the entities functionalcurrency (foreign currencies) are recognised at the rates of exchange prevailing at the dates of the transactions. At the end ofeach reporting period, monetary items denominated in foreign currencies are retranslated at the rates prevailing at that date.Non-monetary items carried at fair value that are denominated in foreign currencies are retranslated at the rates prevailing at thedate when the fair value was determined. Non-monetary items that are measured in terms of historical cost in a foreign currencyare not retranslated.
Exchange differences are recognised in profit or loss in the period in which they arise, except for:
• Exchange differences on foreign currency borrowings relating to assets under construction for future productive use.These are included in the cost of the assets only when they are regarded as an adjustment to interest costs on the relatedforeign currency borrowings;
• Exchange differences on transactions entered into, in order to hedge certain foreign currency risks; and
• Exchange differences on monetary items receivable from or payable to a foreign operation for which settlement is neitherplanned nor likely to occur (therefore forming part of the net investment in the foreign operation), and which arerecognised initially in other comprehensive income and reclassified from equity to profit or loss on disposal or partialdisposal of the net investment.
For the purpose of presenting consolidated financial statements, the assets and liabilities of the Group’s foreign operations areexpressed in Australian Dollars using exchange rates prevailing at the end of the reporting period. Income and expense items aretranslated at the average exchange rates for the period, unless exchange rates fluctuated significantly during that period inwhich case the exchange rates at the dates of the transactions are used. Exchange differences arising, if any, are recognised inother comprehensive income and accumulated in equity.
Goodwill and fair value adjustments on identifiable assets and liabilities acquired arising on the acquisition of a foreign operationare treated as assets and liabilities of the foreign operation and translated at the rate of exchange prevailing at the end of eachreporting period. Exchange differences arising are recognised in equity.
Retail Food Group Limited - Annual Report - Financial Year Ended 30 June 2018 Page 78
For
per
sona
l use
onl
y
The preparation of the consolidated financial statements requires Management to make judgements, estimates and assumptionsthat affect the application of accounting policies and the reported amounts of assets, liabilities, income and expenses. Actualresults may differ from these estimates.
Estimates and underlying assumptions are reviewed on an on-going basis. Revisions to accounting estimates are recognised inthe period in which the estimate is amended and in any future periods affected.
In particular, information about significant areas of estimation uncertainty and critical judgements in applying accountingpolicies that have the most significant effect on amounts recognised in the consolidated financial statements are included in thefollowing notes:
Note 9 - Recoverability of debtorsNote 18 - Fair value of assets and liabilities acquired in a business combinationNote 35.2 - Revenue recognitionNote 35.3 - Deferred tax assetsNote 35.6 - Impairment of non-financial assets other than goodwill and indefinite life intangible assetsNote 35.7 - Impairment of goodwill and indefinite life intangible assetsNote 35.7 - Determination as indefinite life intangible assets
Revenues, expenses and assets are recognised net of the amount of goods and services tax (GST), except:
• Where the amount of GST incurred is not recoverable from the taxation authority, it is recognised as part of the cost ofacquisition of an asset or as part of an item of expense; or
• For receivables and payables which are recognised inclusive of GST.
The net amount of GST recoverable from, or payable to, the taxation authority is included within receivables or payables.
Cash flows are included in the consolidated statement of cash flows on a gross basis. The GST component of cash flows arisingfrom investing and financing activities which is recoverable from, or payable to, the taxation authority is classified withinoperating cash flows.
The Group has adopted all of the new and revised Standards and Interpretations issued by the AASB that are relevant to itsoperations and are effective for the current reporting period.
The adoption of new Standards and Interpretations during the current reporting period did not have any material effect on thereported results or financial position of the Group, or the presentation and disclosure of amounts in these financial statements.
At the date of authorisation of the financial statements, the following Standards and Interpretations have been issued but werenot yet effective.
Standard/InterpretationEffective for annualreporting periods
beginning on or after
Expected to be initiallyapplied in the financial
year endingAASB 9 ‘Financial Instruments’, and the relevant amending standards 1 January 2018 30 June 2019AASB 15 ‘Revenue from Contracts with Customers’, and the relevantamending standards
1 January 2018 30 June 2019
AASB 16 'Leases' 1 January 2019 30 June 2020
Retail Food Group Limited - Annual Report - Financial Year Ended 30 June 2018 Page 79
For
per
sona
l use
onl
y
The Group has yet to fully assess the impact the following accounting standards and amendments will have on the financialstatements when applied in future periods:
AASB 16
AASB 16 will result in the leases where the Group is the lessee being recognised on the balance sheet, as the distinctionbetween operating and finance leases is removed. Under the new standard, a depreciating non-financial asset (the right to usethe leased item) and the associated payable, under the lease, are recognised. For leases in which the Group is the lessor,changes are not required for any adjustments on transition however additional requirements have been introduced forsubleases and lease modifications, and lessor disclosure requirements have been expanded.
In addition, the nature of expenses related to those leases will now change as AASB 16 replaces the straight-line operating leaseexpense with a depreciation charge for right-of-use assets and interest expense on lease liabilities. The only exceptions will beshort-term and low-value leases.
The new leasing Standard will have a material impact on the Group’s financial statements, particularly with the inclusion of newassets and liabilities associated with lease recognition. In addition, there may be a significant impact on the way that therevenues and expenses associated with lease accounting will be reported in the consolidated statement of profit or loss andother comprehensive income.
Initial assessment activities have been undertaken on the Group’s current leases to determine the impact AASB 16 Leases. As atthe reporting date, the Group has operating lease commitments of $188.7 million of which $147.2 million have a correspondingfuture lease receivable under back-to-back lease arrangements (refer to Note 33).
A detailed review of contracts, financial reporting impacts and system requirements will continue. The Group does not intend toadopt the standard before its effective date 1 July 2019 (the date of initial application of the standard).
Further information on the Group’s operating lease commitments are disclosed in Note 33.
AASB 9
AASB 9 replaces AASB 139 Financial Instruments: Recognition and Measurement. AASB 9 contains revised guidance for theclassification and measurement of financial instruments, a new impairment model for most debt instruments and new hedgeaccounting requirements.
There is no change to the financial assets falling under the scope of AASB 139 and subsequently under AASB 9. These assets areclassified as amortised cost under both standards, therefore there is an insignificant impact on the classification andmeasurement of the Group’s financial assets.
The new impairment model requires the recognition of impairment losses based on expected credit losses (ECL) rather thanincurred credit losses, as is the case under AASB 139. It applies to financial assets classified at amortised cost, debt instrumentsmeasured at FVOCI, contract assets under AASB 15 Revenue from Contracts with Customers, lease receivables, loancommitments and certain financial guarantee contracts. The Group has not yet undertaken a detailed assessment of how itsimpairment provision would be affected by the new model. It is however expected that the impairment loss provision as at thedate of initial application of the standard will increase.
The new hedge accounting rules will align the accounting for hedging instruments more closely with the Group’s riskmanagement practices. Whilst the Group is yet to undertake a detailed assessment, it would appear that the Group’s currenthedge relationships would qualify as continuing hedges upon the adoption of AASB 9. Accordingly, the Group does not expecta significant impact on the accounting for its hedging relationships.
The Group intends to apply the standard commencing on 1 July 2018 without providing comparative information, adjustingretained earning balances and other equity components as at 1 July 2018 (the date of initial application of the standard) if thereis any such impact.
AASB 15
AASB 15 replaces the current guidance regarding recognition of revenues and presents a new model for recognising revenuefrom contracts with customers. The standard requires revenue to be recognised when control of a good or service is passed tothe customer. This may be at a single point in time or over time. The new standard also provides new guidance on theidentification and separation of obligations to a customer. The implementation of the new guidance will have no impact on theamount or timing of cash flows.
Under the current guidance, the Group recognises initial franchise fees when it has performed all material obligations andservices which generally occurs when a franchise opens for initial fees and when renewal options become effective for renewalfees. Under the new guidance, the initial obligations do not contain separate and distinct performance obligations from thefranchise right and therefore the Group will defer the initial and renewal fees and recognise revenue over the term of the relatedfranchise agreement.
Retail Food Group Limited - Annual Report - Financial Year Ended 30 June 2018 Page 80
For
per
sona
l use
onl
y
The Group has completed an initial quantification of the impact of AASB 15 however estimates may be subject to change as weprogress with the analysis which ongoing, including detailed contract verification as well as the estimated period over which theinitial franchise fees will be deferred.
The Group intends to apply the standard commencing on 1 July 2018 using the modified retrospective method, adjustingretained earning balances as at 1 July 2018 for contracts that are not completed as at the transition date.
The consolidated financial statements incorporate the financial statements of the Company and entities controlled by theCompany (its subsidiaries) (referred to as ‘the Group’ in these financial statements). Control is achieved where the Company haspower over an entity, is exposed or has rights to variable returns from the entity and has the ability to use its power to affect itsreturns.
The results of subsidiaries acquired or disposed of during the year are included in the consolidated statement of profit or loss andother comprehensive income from the effective date of acquisition or up to the effective date of disposal, as appropriate.
Where necessary, adjustments are made to the Subsidiaries' financial statements to make their accounting policies consistentwith those used by other members of the Group.
All intra-group transactions, balances, income and expenses are eliminated in full on consolidation.
Revenue is measured at the fair value of the consideration received or receivable.
Revenue from the sale of goods is recognised when all of the following conditions are satisfied:
• The Group has transferred to the buyer the significant risks and rewards of ownership of the goods;• The Group retains neither continuing managerial involvement to the degree usually associated with ownership nor
effective control over the goods sold;• The amount of revenue can be measured reliably;• It is probable that the economic benefits associated with the transaction will flow to the entity; and• The costs incurred or to be incurred in respect of the transaction can be measured reliably.
Revenue is recognised when the terms of the relevant agreement have been met and the processed goods are delivered to thecustomer.
Revenue from the rendering of services comprises franchisor income and royalty revenue.
Franchisor income is recognised on an accrual basis, in accordance with the terms of the relevant franchise agreement.
Royalty revenue and revenue from suppliers (supplier licence fees) are recognised on an accrual basis in accordance with theterms of the relevant agreement, provided that it is probable that the economic benefits will flow to the Group and the amountof revenue can be measured reliably.
Initial network access fees are received on execution of certain contracts with approved suppliers to the Group’s Brand Systems.This class of revenue is recognised over the corresponding term of the contract period.
Interest revenue is recognised when it is probable that the economic benefits will flow to the Group and the amount of revenuecan be measured reliably. Interest revenue is accrued on a time basis, by reference to the principal outstanding and at theeffective interest rate applicable. This is the rate that exactly discounts estimated future cash receipts through the expected life ofthe financial asset to that asset’s net carrying amount on initial recognition.
Income tax expense represents the sum of current tax expense and deferred tax expense.
The tax currently payable is based on taxable profit for the year. Taxable profit differs from profit as reported in the consolidatedstatement of profit or loss and other comprehensive income because of items of income or expense that are taxable ordeductible in other years and items that are never taxable or deductible. The Group’s liability for current tax is calculated usingtax rates that have been enacted or substantively enacted by the end of the reporting period.
Retail Food Group Limited - Annual Report - Financial Year Ended 30 June 2018 Page 81
For
per
sona
l use
onl
y
Current and deferred taxes are recognised as an expense or income in profit or loss, except when they relate to items that arerecognised outside profit or loss (whether in other comprehensive income or directly in equity). In this case the tax is alsorecognised outside profit or loss, or where it arises from the initial accounting for a business combination. In the case of abusiness combination, the tax effect is included in the accounting for the business combination.
Deferred tax is recognised on temporary differences between the carrying amounts of assets and liabilities in the financialstatements and the corresponding tax base used in the computation of taxable profit. Deferred tax liabilities are generallyrecognised for all taxable temporary differences. Deferred tax assets are generally recognised for all deductible temporarydifferences, to the extent that it is probable that taxable profits will be available against which those deductible temporarydifferences can be utilised. Such deferred tax assets and liabilities are not recognised if the temporary difference arises fromgoodwill or from the initial recognition (other than in a business combination) of other assets and liabilities in a transaction thataffects neither the taxable profit nor the accounting profit.
Deferred tax liabilities are recognised for taxable temporary differences associated with investments in subsidiaries andassociates, and interests in joint ventures, except where the Group is able to control the reversal of the temporary difference andit is probable that the temporary difference will not reverse in the foreseeable future. Deferred tax assets, arising from deductibletemporary differences associated with such investments and interests, are only recognised to the extent that it is probable thatthere will be sufficient taxable profits against which to utilise the benefits of the temporary differences, and they are expected toreverse in the foreseeable future.
The carrying amount of deferred tax assets is reviewed at the end of each reporting period and reduced to the extent that it is nolonger probable that sufficient taxable profits will be available to allow all or part of the asset to be recovered.
Deferred tax assets and liabilities are measured at the tax rates that are expected to apply in the period in which the liability issettled or the asset realised, based on tax rates (and tax laws) that have been enacted or substantively enacted by the end of thereporting period. The measurement of deferred tax liabilities and assets reflects the tax consequences that would flow in themanner the Group expects, at the end of the reporting period, to recover or settle the carrying amount of its assets and liabilities.
Deferred tax assets and liabilities are offset when there is a legally enforceable right to do so set off current tax assets againstcurrent tax liabilities or when they relate to income taxes levied by the same taxation authority and the Group intends to settle itscurrent tax assets and liabilities on a net basis.
The Group's accounting policy for taxation requires Management's judgement as to the types of arrangements considered to bea tax on income in contrast to an operating cost. Judgement is also required in assessing whether deferred tax assets and certaindeferred tax liabilities are recognised on the balance sheet. Deferred tax assets, including those deferred tax assets arising fromnon-recouped tax losses, capital losses and temporary differences, are recognised only where it is considered more likely thannot that they will be recovered, which is dependent on the generation of sufficient future taxable profits. Deferred tax liabilitiesarising from temporary differences in investments, caused principally by retained earnings held in foreign tax jurisdictions, arerecognised unless repatriation of retained earnings can be controlled and are not expected to occur in the foreseeable future.
Assumptions about the generation of future taxable profits, and repatriation of retained earnings, depend on Management'sestimates of future cash flows which, in turn, depend on estimates of future production and sales volumes, operating costs,restoration costs, capital expenditure, dividends and other capital management transactions. Judgements are also required inrelation to the application of income tax legislation.
Deferred tax assets are recognised for deductible temporary differences as Management considers that it is probable that futuretaxable profits will be available to utilise those temporary differences.
These judgements and assumptions are subject to risk and uncertainty, hence there is a possibility that changes in circumstanceswill alter expectations, which may impact the amounts of deferred tax assets and deferred tax liabilities recognised on thebalance sheet and the amount of other tax losses and temporary differences not yet recognised. In such circumstances, some orall of the carrying amounts of recognised deferred tax assets and liabilities may require adjustment, resulting in a correspondingcredit or charge to the consolidated statement of profit or loss and other comprehensive income.
Cash comprises cash on hand and demand deposits. Cash equivalents are short-term, highly liquid investments that are readilyconvertible to known amounts of cash, which are subject to an insignificant risk of changes in value and have a maturity of threemonths or less at the date of acquisition or at reporting date. Bank overdrafts are shown within borrowings in current liabilities inthe balance sheet.
Inventories are stated at the lower of cost and net realisable value. Cost, including an appropriate portion of fixed and variableoverhead expenses, are assigned to inventories by the method most appropriate to each particular class of inventory, withcategories being valued on a weighted average cost basis as determined by the inventory’s nature and use.
Retail Food Group Limited - Annual Report - Financial Year Ended 30 June 2018 Page 82
For
per
sona
l use
onl
y
Land and buildings held for use in the production or supply of goods or services, or for administrative purposes, are stated in theconsolidated statement of financial position at cost, less any subsequent accumulated depreciation and accumulated impairmentlosses.
Properties in the course of construction for production, supply or administrative purposes, or for purposes not yet determined,are carried at cost less any recognised impairment loss. Cost includes professional fees and, for qualifying assets, borrowing costscapitalised in accordance with the Group’s accounting policy. Depreciation of these assets, on the same basis as other propertyassets, commences when the assets are ready for their intended use.
Freehold land is not depreciated.
Fixtures and equipment are stated at cost less accumulated depreciation and accumulated impairment losses.
Depreciation is recognised to write off the cost or valuation of assets (other than freehold land and properties underconstruction) less their residual values over their useful lives, using the straight-line method. The estimated useful lives, residualvalues and depreciation method are reviewed at each year-end, with the effect of any changes in estimate accounted for on aprospective basis.
The gain or loss arising on the disposal or retirement of an item of property, plant or equipment is determined as the differencebetween the sales proceeds and the carrying amount of the asset and is recognised in profit or loss.
Voluntary company stores (VCS), including leasehold improvements and fixtures and equipment, are included as items ofproperty, plant and equipment until such time as the VCS becomes held for sale and is, thereafter, reclassified to inventories.
The following useful lives are used in the calculation of depreciation:
• buildings 40 years;• leasehold improvements 5 - 25 years; and• plant and equipment 2 - 25 years.
The estimation of the useful lives of assets has been based on historical experience as well as manufacturers' warranties (for plantand equipment), lease terms (for leased equipment) and turnover policies (for motor vehicles). In addition, the condition of theassets is assessed at least once per year and considered against the remaining useful life. Adjustments to useful lives are madewhen considered necessary.
The Group assesses impairment of all assets at the end of each reporting period by evaluating conditions specific to the Groupand to the particular asset that may lead to impairment. These assessments include product and manufacturing performance,technology, economic and political environments and future product expectations. If an impairment trigger exists, therecoverable amount of the asset is determined.
Management does not consider that there have been any indicators of impairment and, as such, these assets have not beentested for impairment in this financial period.
Intangible assets with finite lives that are acquired separately are carried at cost less accumulated amortisation and accumulatedimpairment losses. Amortisation is recognised on a straight-line basis over their estimated useful lives (which are estimated to bebetween 2 - 10 years). The estimated useful life and amortisation method are reviewed at the end of each reporting period, withthe effect of any changes in estimate being accounted for on a prospective basis. Intangible assets with indefinite useful lives thatare acquired separately are carried at cost less accumulated impairment losses.
Intangible assets acquired in a business combination, and recognised separately from goodwill, are initially recognised at theirfair value at the acquisition date (which is regarded as their cost).
Subsequent to initial recognition, intangible assets acquired in a business combination are reported at cost less accumulatedamortisation and accumulated impairment losses, on the same basis as intangible assets that are acquired separately.
Intangible assets include franchise networks (consisting of identifiable franchise systems and brand names) and intellectualproperty (consisting of trademarks, recipes, manuals and systems).
Franchise networks are identified and recognised at the time of a business combination and recorded at their fair value, if theirfair value can be measured reliably. Franchise networks acquired separately and intellectual property are recorded at cost.
Franchise networks and intellectual property are not amortised on the basis that they have an indefinite life and are reviewedannually.
Retail Food Group Limited - Annual Report - Financial Year Ended 30 June 2018 Page 83
For
per
sona
l use
onl
y
Expenditure incurred in maintaining intangible assets is expensed in the period in which it is occurred.
Goodwill arising in a business combination is recognised as an asset at the date that control is acquired (the acquisition date).Goodwill is measured as the excess of the sum of the consideration transferred, the amount of any non-controlling interests inthe acquiree and the fair value of the acquirer’s previously held equity interest in the acquiree (if any) over the net of theacquisition date amounts of the identifiable assets acquired and the liabilities assumed.
If, after reassessment, the Group’s interest in the fair value of the acquiree’s identifiable net assets exceeds the sum of theconsideration transferred, the amount of any non-controlling interests in the acquiree and the fair value of the acquirer’spreviously held equity interest in the acquiree (if any), so the excess is recognised immediately in profit or loss as a bargainpurchase gain.
Goodwill is not amortised but is reviewed for impairment at least annually. For the purpose of impairment testing, goodwill isallocated to each of the Group’s operating segments expected to benefit from the synergies of the combination. Operatingsegments, to which goodwill, has been allocated are tested for impairment annually or more frequently when there is anindication that the unit may be impaired. If the recoverable amount of the operating segments is less than its carrying amount,the impairment loss is allocated first to reduce the carrying amount of any goodwill allocated to the unit and then to the otherassets of the unit on a pro-rata basis of the carrying amount of each asset in the unit. An impairment loss recognised for goodwillis not reversed in a subsequent period. On disposal of a subsidiary, the attributable amount of goodwill is included in thedetermination of the profit or loss on disposal.
At the end of each reporting period, the Group reviews the carrying amounts of its tangible and intangible assets to determinewhether there is any indication that those assets have suffered an impairment loss. If any such indication exists, the recoverableamount of the asset is estimated in order to determine the extent of the impairment loss (if any). Where it is not possible toestimate the recoverable amount of an individual asset, the Group estimates the recoverable amount of the cash-generating unitto which the asset belongs. Where a reasonable and consistent basis of allocation can be identified, corporate assets are alsoallocated to individual cash-generating units. Otherwise they are allocated to the smallest group of cash-generating units forwhich a reasonable and consistent allocation basis can be identified.
Recoverable amount is the higher of fair value less costs to sell and value in use. In assessing value in use, the estimated futurecash flows are discounted to their present value using a pre-tax discount rate that reflects current market assessments of the timevalue of money and the risks specific to the asset for which the estimates of future cash flows have not been adjusted.
If the recoverable amount of an asset (or cash-generating unit) is estimated to be less than its carrying amount, the carryingamount of the asset (or cash-generating unit) is reduced to its recoverable amount. An impairment loss is recognisedimmediately in profit or loss.
Where an impairment loss subsequently reverses, the carrying amount of the asset (or cash-generating unit) is increased to therevised estimate of its recoverable amount. Hence the increased carrying amount does not exceed the carrying amount thatwould have been determined had no impairment loss been recognised for the asset (or cash-generating unit) in prior financialyears. A reversal of an impairment loss is recognised immediately in profit or loss.
No amortisation is provided against the carrying value of franchise networks and intellectual property rights on the basis thatthese assets are considered to have an indefinite life.
Key factors taken into account in assessing the useful life of franchise networks and intellectual property rights are:
• These assets are all well established and have experienced strong sales and profit growth over time;• None of the assets have a foreseeable limit to when they will stop generating future net cash inflows to the Group; and• There are currently no legal, technical or commercial obsolescence factors applying to the assets or related products
which indicate that the life should be considered limited.
Specifically, in respect of the intellectual property rights, the Group holds a significant number of registered trademarks for eachfranchise network. Since inception, all of the trademarks have demonstrated significant growth and this growth is forecasted tocontinue. It is noted that the trademark registrations have a finite legal life, however renewal of the registrations is simple withlittle cost involved. Management oversees the registration of the trademarks, as well as the protection of these trademarks. TheGroup intends to renew all trademarks as they expire and has the infrastructure and allocated resources to ensure this renewaloccurs.
Therefore, consistent with AASB 138 , the Group treats each of its franchise networks and intellectual propertyrights as having an indefinite life. All such assets are tested for impairment annually.
Retail Food Group Limited - Annual Report - Financial Year Ended 30 June 2018 Page 84
For
per
sona
l use
onl
y
Expenditure on research activities is recognised as an expense in the period in which it is incurred.
An internally generated intangible asset arising from the development phase of internal projects is recognised if all of thefollowing requirements have been demonstrated:
• The technical feasibility of completing the intangible asset so that it will be available for use or sale;• The intention to complete the intangible asset for use or sale;• The ability to use or sell the intangible asset;• How the intangible asset will generate probable future economic benefits;• The availability of adequate technical, financial and other resources to complete the development and to use of sell the
intangible asset; and• The ability to measure reliably the expenditure attributable to the intangible asset during its development.
The amount initially recognised for internally generated intangible assets is the total of expenditure incurred from the date whenthe intangible asset first meets the recognition criteria. Where no internally generated intangible asset can be recognised,development expenditure is recognised in the consolidated statement of profit or loss and other comprehensive income in theperiod incurred.
Provisions are recognised when the Group has a present obligation (legal or constructive) as a result of a past event, it isprobable that the Group will be required to settle the obligation and a reliable estimate can be made of the amount of theobligation.
The amount recognised as a provision is the best estimate of the consideration required to settle the present obligation at theend of the reporting period, taking into account the risks and uncertainties surrounding the obligation. Where a provision ismeasured using the cash flows estimated to settle the present obligation, its carrying amount is the present value of those cashflows.
When some or all of the economic benefits required to settle a provision are expected to be recovered from a third party, and if itis virtually certain that reimbursement will be received and the amount of the receivable can be measured reliably, a receivable isrecognised as an asset.
A liability is recognised for benefits accruing to employees in respect of wages and salaries, annual leave and long service leavewhen it is probable that settlement will be required and they are capable of being measured reliably.
Liabilities recognised in respect of short-term employee benefits are measured at their nominal values using the remunerationrate expected to apply at the time of settlement.
Liabilities recognised in respect of long-term employee benefits are measured as the present value of the estimated future cashoutflows to be made by the Group in respect of services provided by employees up to the reporting date.
Contributions to defined contribution retirement benefit plans are recognised as an expense when employees have renderedservice entitling them to the contributions.
Retail Food Group Limited - Annual Report - Financial Year Ended 30 June 2018 Page 85
For
per
sona
l use
onl
y
A provision has been made for the present value of future lease payments where the Group is presently obliged to makepayments under non-cancellable onerous lease contracts relating to certain loss-making non-voluntary company stores. Aprovision has been made for the present value of the Directors’ best estimate of the future sacrifice of economic benefits that willbe required to restore the site occupied by the loss-making non-voluntary company stores that existed at the end of thereporting period, to a condition specified in the relevant lease agreement. The estimate has been made on the basis of quotesobtained from restoration specialists or past experience.
The calculation of both provisions requires assumptions such as the likelihood of sale of the non-voluntary company store, theestimated lease termination costs and the expected costs of making-good the premises. These uncertainties may result in futureactual expenditure differing from the amounts currently provided. The provision recognised for each site is periodically reviewedand updated based on the facts and circumstances available at the time. The exit from onerous leases and make-good activitiesare expected to be completed by the Group within twelve months.
The provision for warranties represents repairs on coffee machines. Management has estimated the provision based on historicalwarranty trends which may vary as a result of new materials, altered manufacturing processes or other events affecting productquality.
Equity-settled share-based payments to employees, and others providing similar services, are measured at the fair value of theequity instrument at the grant date.
The fair value determined at the grant date of the equity-settled share-based payments is expensed on a straight-line basis overthe vesting period, based on the Group’s estimate of equity instruments that will eventually vest. At the end of each reportingperiod, the Group revises its estimate of the number of equity instruments expected to vest. The impact of the revision of theoriginal estimates, if any, is recognised in profit or loss such that the cumulative expense reflects the revised estimate, with acorresponding adjustment to the equity-settled employee benefits reserve.
Equity-settled share-based payment transactions, with parties other than employees, are measured at the fair value of the goodsor services received, except where the fair value cannot be estimated reliably. In which case they are measured at the fair valueof the equity instruments granted, measured at the date the entity obtains the goods or the counterparty renders the service.
The Group measures the cost of equity-settled transactions with employees by reference to the fair value of the equityinstruments at the date at which they are granted. Rights subject to marketing conditions have been valued using the MonteCarlo simulation (using the Black-Scholes framework) and rights subject to non-market conditions have been valued using theBlack-Scholes option pricing model. The accounting estimates and assumptions relating to equity-settled share-based paymentswould have no impact on the carrying amounts of assets and liabilities within the next annual reporting period but may impactexpenses and equity.
Trade receivables, loans and other receivables that have fixed or determinable payments, that are not quoted in an activemarket, are classified as loans and receivables. Loans and receivables are measured at amortised cost using the effective interestmethod, less any impairment. Interest income is recognised by applying the effective interest rate, except for short-termreceivables when the recognition of interest would be immaterial.
Debt and equity instruments are classified as either financial liabilities or as equity in accordance with the substance of thecontractual arrangement.
An equity instrument is any contract that evidences a residual interest in the assets of an entity after deducting all of its liabilities.Equity instruments issued by the Group are recognised as the proceeds received, net of direct issue costs.
Other financial liabilities, including borrowings, are initially measured at fair value, net of transaction costs.
Other financial liabilities are subsequently measured at amortised cost using the effective interest method, with interest expenserecognised on an effective yield basis.
Retail Food Group Limited - Annual Report - Financial Year Ended 30 June 2018 Page 86
For
per
sona
l use
onl
y
The effective interest method is a method of calculating the amortised cost of a financial liability and of allocating interestexpense over the relevant period. The effective interest rate is the rate that exactly discounts estimated future cash paymentsthrough the expected life of the financial liability, or (where appropriate) a shorter period, to the net carrying amount on initialrecognition.
The Group derecognises financial liabilities only when the Group’s obligations are discharged, cancelled or they expire.
Financial guarantee contract liabilities are measured initially at their fair values, and, if not designated as at FVTPL, aresubsequently measured at the higher of:
• The amount of the obligation under the contract, as determined in accordance with AASB 137; or
• The amount initially recognised less, where appropriate, cumulative amortisation, recognised in accordance with therevenue recognition policies set out in Note 35.2.
Derivatives are initially recognised at fair value on the date a derivative contract is entered into and are subsequently remeasuredto their fair value at the end of each reporting period. The accounting for subsequent changes in fair value depends on whetherthe derivative is designated as a hedging instrument, and if so, the nature of the item being hedged.
The Group designates certain derivatives as either:
• Hedges of the fair value of recognised assets or liabilities or a firm commitment (fair value hedges);• Hedges of a particular risk associated with the cash flows of recognised assets and liabilities and highly probable forecast
transactions (cash flow hedges); or• Hedges of a net investment in a foreign operation (net investment hedges).
At the inception of the hedging transaction, the Group documents the relationship between hedging instruments and hedgeditems, as well as its risk management objective and strategy for undertaking various hedge transactions. The Group alsodocuments its assessment, both at hedge inception and on an ongoing basis, of whether the derivatives that are used inhedging transactions have been and will continue to be highly effective in offsetting changes in fair values or cash flows ofhedged items.
The fair values of various derivative financial instruments used for hedging purposes are disclosed in Note 25.10. Movements inthe hedging reserve in shareholders’ equity are shown in Note 21. The full fair value of a hedging derivative is classified as anon-current asset or liability when the remaining maturity of the hedged item is more than 12 months and it is classified as acurrent asset or liability when the remaining maturity of the hedged item is less than 12 months. Trading derivatives are classifiedas a current asset or liability.
The effective portion of the changes in the fair value of derivatives that are designated and qualify as cash flow hedges isrecognised in other comprehensive income and accumulated in reserves in equity. The gain or loss relating to the ineffectiveportion is recognised immediately in profit or loss within other income or other expense.
Amounts accumulated in equity are reclassified to profit or loss in the periods when the hedged item affects profit or loss. Thegain or loss relating to the effective portion of interest rate swaps hedging variable rate borrowings is recognised in profit or losswithin finance costs. The gain or loss relating to the effective portion of forward foreign exchange contracts hedging export salesis recognised in profit or loss within ‘sales’. However, when the forecast transaction that is hedged results in the recognition of anon-financial asset (for example inventory or fixed assets) the gains and losses previously deferred in equity are reclassified fromequity and included in the initial measurement of the cost of the asset. The deferred amounts are ultimately recognised in profitor loss as cost of goods sold in the case of inventory or as depreciation or impairment in the case of fixed assets.
When a hedging instrument expires and is sold or terminated, or when a hedge no longer meets the criteria for hedgeaccounting, any cumulative gain or loss existing in equity at that time remains in equity until the forecast transaction is ultimatelyrecognised in profit or loss. When a forecast transaction is no longer expected to occur, the cumulative gain or loss that wasreported in equity is immediately reclassified to profit or loss.
Hedges of net investments in foreign operations are accounted for on a similar basis to cash flow hedges.
Any gain or loss on the hedging instrument relating to the effective portion of the hedge is recognised in other comprehensiveincome and accumulated in reserves in equity. The gain or loss relating to the ineffective portion is recognised immediately inprofit or loss within other income or other expenses. Gains and losses accumulated in equity are reclassified to profit or losswhen the foreign operation is partially disposed of or sold.
Retail Food Group Limited - Annual Report - Financial Year Ended 30 June 2018 Page 87
For
per
sona
l use
onl
y
Certain derivative instruments do not qualify for hedge accounting. Changes in the fair value of any derivative instrument thatdoes not qualify for hedge accounting are recognised immediately in profit or loss and are included in other income or otherexpenses.
Acquisitions of subsidiaries and businesses are accounted for using the acquisition method. The consideration for eachacquisition is measured at the aggregate of the fair values (at the date of exchange) of assets given, liabilities incurred orassumed and equity instruments issued by the Group in exchange for control of the acquiree. Acquisition-related costs arerecognised in profit or loss as incurred.
Where applicable the consideration for the acquisition includes any asset or liability resulting from a contingent considerationarrangement measured at its acquisition-date fair value. Subsequent changes in such fair values are adjusted against the cost ofthe acquisition where they qualify as measurement period adjustments. All other subsequent changes in the fair value ofcontingent consideration classified as an asset or liability are accounted for in accordance with relevant standards. Changes inthe fair value of contingent consideration classified as equity are not recognised.
Where a business combination is achieved in stages, the Group’s previously held interests in the acquired entity are remeasuredto fair value at the acquisition date (i.e. the date the Group attains control) and the resulting gain or loss, if any, is recognised inprofit or loss. Amounts arising from interests in the acquiree prior to the acquisition date that have been recognised in othercomprehensive income are reclassified to profit or loss, where such treatment would be appropriate if that interest was sold.
At the acquisition date, the identifiable assets acquired and the liabilities assumed are recognised at their fair value at theacquisition date, except that:
• Deferred tax assets or liabilities and liabilities or assets related to employee benefit arrangements are recognised andmeasured in accordance with AASB 112 and AASB 119 respectively;
• Liabilities or equity instruments related to the replacement by the Group of an acquiree’s share-based payment awards aremeasured in accordance with AASB 2 ; and
• Assets (or disposal groups) that are classified as held for sale in accordance with AASB 5are measured in accordance with that standard.
If the initial accounting for a business combination is incomplete by the end of the reporting period in which the combinationoccurs, the Group reports provisional amounts for the items for which the accounting is incomplete. Those provisional amountsare adjusted during the measurement period, or additional assets or liabilities are recognised, to reflect new informationobtained about facts and circumstances that existed as of the acquisition date that, if known, would have affected the amountsrecognised as at that date.
The measurement period is the period from the date of acquisition to the date the Group obtains complete information aboutfacts and circumstances that existed as of the acquisition date and is subject to a maximum time of one year.
Business combinations that took place prior to 1 July 2009 were accounted for in accordance with the previous version of AASB3.
Leases are classified as finance leases whenever the terms of the lease transfer substantially all the risks and rewards ofownership to the lessee. All other leases are classified as operating leases.
Rental income from operating leases is recognised on a straight-line basis over the term of the relevant lease.
Operating lease payments are recognised as an expense on a straight-line basis over the lease term, except where anothersystematic basis is more representative of the time pattern in which economic benefits from the leased asset are consumed.Contingent rentals arising under operating leases are recognised as an expense in the period in which they are incurred. In theevent that lease incentives are received to enter into operating leases, such incentives are recognised as a liability. The aggregatebenefit of incentives is recognised as a reduction of rental expense on a straight-line basis, except where another systematic basisis more representative of the time pattern in which economic benefits from the leased asset are consumed.
Retail Food Group Limited - Annual Report - Financial Year Ended 30 June 2018 Page 88
For
per
sona
l use
onl
y
The Directors declare that:
(a) In the Directors’ opinion, the financial statements and notes set out on pages 28 to 88 are in accordance with theCorporations Act 2001, including:
(i) complying with Accounting Standards, the Corporations Regulations 2001 and other mandatory professionalreporting requirements; and
(ii) giving a true and fair view of the consolidated Group’s financial position as at 30 June 2018 and of itsperformance for the financial year ended on that date; and
(b) In the Directors’ opinion, there are reasonable grounds to believe that the Company will be able to pay its debts as andwhen they become due and payable;
(c) In the Directors’ opinion, the financial statements are in compliance with International Financial Reporting Standards, asdisclosed in the notes to the financial statements of the 2018 Annual Report;
(d) The Directors have been given the declarations required by s.295A of the .
Signed in accordance with a resolution of the Directors made pursuant to s.295 (5) of the .
On behalf of the Directors
Mr Colin ArcherChairman and Independent Non-Executive DirectorSouthport31 August 2018
Retail Food Group Limited - Annual Report - Financial Year Ended 30 June 2018 Page 89
For
per
sona
l use
onl
y
PricewaterhouseCoopers, ABN 52 780 433 757 480 Queen Street, BRISBANE QLD 4000, GPO Box 150, BRISBANE QLD 4001 T: +61 7 3257 5000, F: +61 7 3257 5999, www.pwc.com.au
Liability limited by a scheme approved under Professional Standards Legislation.
90
Independent auditor’s report To the members of Retail Food Group Limited
Report on the audit of the financial report
Our opinion In our opinion:
The accompanying financial report of Retail Food Group Limited (the Company) and its controlled entities (together the Group) is in accordance with the Corporations Act 2001, including:
(a) giving a true and fair view of the Group's financial position as at 30 June 2018 and of its financial performance for the year then ended
(b) complying with Australian Accounting Standards and the Corporations Regulations 2001.
What we have audited The Group financial report comprises:
● the consolidated statement of financial position as at 30 June 2018 ● the consolidated statement of profit or loss and other comprehensive income for the year then
ended ● the consolidated statement of changes in equity for the year then ended ● the consolidated statement of cash flows for the year then ended ● the notes to the consolidated financial statements, which include a summary of significant
accounting policies ● the directors’ declaration.
Basis for opinion We conducted our audit in accordance with Australian Auditing Standards. Our responsibilities under those standards are further described in the Auditor’s responsibilities for the audit of the financial report section of our report.
We believe that the audit evidence we have obtained is sufficient and appropriate to provide a basis for our opinion.
Independence We are independent of the Group in accordance with the auditor independence requirements of the Corporations Act 2001 and the ethical requirements of the Accounting Professional and Ethical Standards Board’s APES 110 Code of Ethics for Professional Accountants (the Code) that are relevant to our audit of the financial report in Australia. We have also fulfilled our other ethical responsibilities in accordance with the Code. F
or p
erso
nal u
se o
nly
91
Material uncertainty related to going concern We draw attention to Note 35(d) in the financial report, which indicates that the Group incurred a net loss before tax of $380m for the year ended 30 June 2018 and, as of that date, the Group’s current liabilities exceeded its current assets by $231m, inclusive of syndicated secured borrowings of $265m.
The Group's ability to continue as a going concern is dependent on the Group having a continued appropriate level of funding from it’s existing lenders and/or other sources for at least the next twelve months from the date of this report. These conditions, as well as successfully executing the assets sales program and other Group restructuring initiatives as set forth in Note 35(d), indicate that a material uncertainty exists that may cast significant doubt on the Group’s ability to continue as a going concern. Our opinion is not modified in respect of this matter.
Our audit approach An audit is designed to provide reasonable assurance about whether the financial report is free from material misstatement. Misstatements may arise due to fraud or error. They are considered material if individually or in aggregate, they could reasonably be expected to influence the economic decisions of users taken on the basis of the financial report.
We tailored the scope of our audit to ensure that we performed enough work to be able to give an opinion on the financial report as a whole, taking into account the geographic and management structure of the Group, its accounting processes and controls and the industry in which it operates.
Materiality
● For the purpose of our audit we used overall Group materiality of $2.4 million, which represents approximately 5% of the Group’s loss before tax adjusted for unusual or infrequently occurring items impacting profit and loss, such as asset impairments and onerous lease provisions.
● We applied this threshold, together with qualitative considerations, to determine the scope of our audit and the nature, timing and extent of our audit procedures and to evaluate the effect of misstatements on the financial report as a whole.
● We chose Group loss before tax because, in our view, it is the benchmark against which the performance of the Group is most commonly measured.
● We utilised a 5% threshold based on our professional judgement, noting it is within the range of commonly acceptable thresholds.
For
per
sona
l use
onl
y
92
Audit Scope
● Our audit focused on where the Group made subjective judgements; for example, significant accounting estimates involving assumptions and inherently uncertain future events.
● The Group is structured across 5 operating segments, being Bakery Cafe, QSR Systems, Coffee Retail Systems, Coffee and Allied Beverage and Commercial Food Services. Its head office is based in Brisbane, Queensland.
Key audit matters Key audit matters are those matters that, in our professional judgement, were of most significance in our audit of the financial report for the current year. The key audit matters were addressed in the context of our audit of the financial report as a whole, and in forming our opinion thereon, and we do not provide a separate opinion on these matters. Further, any commentary on the outcomes of a particular audit procedure is made in that context. We communicated the key audit matters to the Audit and Risk Committee.
In addition to the matter described in the Material uncertainty related to going concern section, we have determined the matters described below to be the key audit matters to be communicated in our report.
Key audit matter How our audit addressed the key audit matter
Restructuring of domestic franchising business (Refer to note 6) $403m
The Group's comprehensive review of the outlook for the Australian franchise business operations has resulted in the planned closure of a number of stores throughout FY19 and FY20.
As a result, significant asset impairments and provisions have been recognised in the 30 June 2018 financial report.
This was a key audit matter because in recognising asset impairments and provisions, a number of significant judgements were made by the Group. The most significant judgements included the estimation of:
● the recoverable amount of corporate stores assets classified as either inventory or property, plant and equipment based on the store closure plan.
● the recoverability of trade receivables and
For corporate store asset impairments recorded, we performed the following audit procedures, amongst others:
● considered available information regarding the planned store closures where these included corporate stores.
● assessed the appropriateness of the impairment of corporate store assets related to the store closures plan and checked that corporate stores planned for closure have been fully impaired at 30 June 2018.
For the impairment of amounts due from franchisees (including master franchisees) we performed the following procedures, amongst others:
● developed an understanding of the Group’s policies and procedures in relation to the
For
per
sona
l use
onl
y
93
Key audit matter How our audit addressed the key audit matter
Restructuring of domestic franchising business (Refer to note 6) $403m (cont’d)
vendor finance amounts due from franchisees (including master franchisees), based on the store closure plan and other specific indicators of impairment.
● the recoverable amount and associated impairment of property, plant and equipment based on the store closure plan and the restructuring review of the Group.
● the recognition of provisions for onerous lease contracts at corporate store locations,
● the provision for costs and other expenses directly linked to the restructuring the Group is committed to incur.
● the expected financial impact of potential legal claims and regulatory reviews against the Group
● the recoverable amounts of intangible assets (including goodwill) attributed to franchise brand systems. This has been addressed in a separate key audit matter.
recognition of provisions for doubtful debts in light of the store closure plan.
● made enquiries of management in respect of past due debtors and assessed the risk of impairment.
● considered selected correspondence between the Group and franchisees in respect of balances past due or on payment plans.
● tested the accuracy of the aged receivables listing through tracing a sample to the underlying invoices to assess the dates included in the listing.
● tested a sample of trade receivables and vendor finance amounts due from franchisees to subsequent receipts in the bank including testing if they were in line with the agreed payment plans for those franchisees and tested the allocation of these receipts against outstanding debtor balances.
● considered appropriateness of provisions raised in respect of the sample of amounts due from franchisees who had not paid and had overdue amounts.
For impairments in respect of property, plant and equipment, we performed the following audit procedures, amongst others:
● developed an understanding of the Group’s policy in respect of assessing the net realisable value of property, plant and equipment.
● made enquiries of management in respect of the nature of property, plant and equipment and assessed the risk of the net realisable value being lower than the carrying value.
● considered whether impairments of property, plant and equipment were appropriate in light of the Group’s planned store closure plan and business restructure.
For
per
sona
l use
onl
y
94
Key audit matter How our audit addressed the key audit matter
Restructuring of domestic franchising business (Refer to note 6) $403m (cont’d)
For onerous lease contract provisions, we performed the following audit procedures, amongst others:
assessed the Group’s assumptions relating to onerous contracts by comparing them to supporting documentation, including current trading performance of stores, planned store closure dates and correspondence with landlords.
● evaluated whether the onerous contract provisions met the criteria in Australian Accounting Standards for recognition as liabilities at 30 June 2018.
● for those onerous contract provisions recognised, assessed whether the measurement of the provision was in accordance with criteria outlined in Australian Accounting Standards.
For the provision of costs and other expenses we performed the following procedures, amongst others:
● obtained an understanding and assessed the Group’s assumptions relating to expected costs and other expenses associated with the restructuring of the domestic franchise business.
For the expected impact of the potential legal claims and regulatory reviews we performed the following procedures, amongst others:
● obtained an understanding from the Group’s inhouse legal advisers of the current and potential legal claims and actions against the Group.
● considered board minutes and correspondence between the Group and external legal advisors.
● obtained legal confirmations from the Group’s external legal advisors.
For
per
sona
l use
onl
y
95
Key audit matter How our audit addressed the key audit matter
Assessment of recoverability of goodwill and intangible assets (Refer to note 15) $364m
The Group recognises goodwill and indefinite life intangible assets which relate to brand networks and intellectual property rights.
As required by Australian Accounting Standards, these non-amortising assets are tested each year end for impairment.
The Group performed impairment assessments over each of their cash generating units (CGUs) by calculating the recoverable amount of each CGU. The recoverable amount was determined by either a value in use calculation or fair value less cost of disposal methodology using discounted cash flow models (the models). The Group have recorded impairments charges on goodwill and brand networks totaling $306m for the year ended 30 June 2018.
The key judgements in the models are the budgeted brand system cash flows, the expected average percentage growth rate, discount rates and terminal growth rates.
The assessment of impairment was a key audit matter due to the size of goodwill and indefinite life intangible assets in the balance sheet, the impairments taken during the year and the key judgements and assumptions incorporated in the impairment models prepared to assess the recoverable amount of the goodwill and indefinite life intangible assts.
In assessing the recoverable amount of goodwill and intangible assets, we performed the following procedures, amongst others:
● assessed whether the Group’s identification of CGUs was consistent with our knowledge of the operations, internal reporting lines and the level of largely independent cash-flows.
● tested the mathematical accuracy of the calculations in the models and compared the future cash flow forecasts in the models to the Board approved budgets.
● assessed the 2019 year cash flow forecasts in each of the models by developing an understanding of the underlying drivers for the budget in the context of the Group’s future operational plans.
● compared the discount rates used by the Group and benchmarked implied multiples to external market data and trends that were obtained with the assistance of PwC valuation experts.
● compared the recoverable amount to the market capitalisation of the Group at 30 June 2018.
● checked that the impairments to intangible assets and goodwill identified in the impairment models were consistent with the Group’s financial records at balance date.
● assessed if the presentation and disclosures made in the financial report in respect of impairment were compliant with the relevant Australian Accounting Standard.
For
per
sona
l use
onl
y
96
Key audit matter How our audit addressed the key audit matter
Classification of external borrowings (Refer to note 19) $264m
The Group’s current liabilities includes syndicated secured borrowings of $265m at balance date.
Expecting to breach one of the financial covenants for the 30 June 2018 covenant testing period, the Group sought and received a waiver from its lenders to forego covenant testing for 30 June 2018. The waiver was subject to a number of conditions and additional information being supplied by the Group to the lenders after balance date, as outlined in note 19 to the financial statements.
Given the size and importance of the syndicated secured borrowings to the Group’s funding structure and the Group’s ongoing dialogue with its lenders regarding structuring and debt covenant compliance requirements, the accounting, presentation and disclosure of the Group’s borrowings arrangements was considered a key audit matter.
We obtained confirmations directly from the Group’s lenders to confirm borrowings, including amounts, tenure and conditions.
We read the most up-to date agreements and correspondence between the Group and it’s lenders to obtain an understanding of the terms and conditions associated with the facilities, the amount of facilities available for future redraw and any covenants contained in the facilities.
Where debt was classified as current we tested the Group’s assessment that they did not have the unconditional right to defer payment for at least 12 months from 30 June 2018.
We evaluated whether the disclosures were consistent with the requirements of Australian Accounting Standards.
Revenue recognition (Refer to note 2) $374m
The Group’s revenue is based on a very high volume of transactions across a number of different businesses, which each have several streams of revenue being revenue from the sale of goods, food processing revenue, revenue from the rendering of services (including master franchise fees (both domestic and international), franchisor income, franchise service fees, supplier license fees) and initial network access fees, some of which can be complex.
Complexity arises from the judgements employed by the Group in the recognition and measurement of each source of revenue and the timing of its recognition based on the terms of the relevant agreements.
We performed the following procedures. amongst others:
● developed an understanding of each significant revenue stream, being revenue from the sale of goods, food processing revenue, revenue from the rendering of services (including master franchise fees (both domestic and international), franchisor income, franchise service fees, supplier license fees) and initial network access fees and the policies used to recognise revenue.
● tested a sample of Master Franchise Agreements to evaluate if the Master Franchise Fees were recorded in the correct accounting period. This included testing of amounts recorded to the underlying agreement and payment receipts.
For
per
sona
l use
onl
y
97
Key audit matter How our audit addressed the key audit matter
Revenue recognition (Refer to note 2) $374m (cont’d)
The particular revenue streams that involve complexity include:
● Master Franchise Fees - For Master Franchise Agreements entered into (both International and Domestic) the Group receives Master Franchise Fees at the commencement of the agreement in addition to other franchise service fees over the term of the agreement.
● Supplier License Fees - Supplier arrangements, where the Group grants exclusive supply rights to the Group’s franchisees, resulting in the Group receiving amounts upfront (Supplier License Fees) from the supplier at the commencement of the arrangements.
Each of these revenue streams is underpinned by different systems, processes and controls meaning our focus was whether revenue was being correctly recorded (accuracy) and also recognised in the appropriate period (cut-off).
Due to the opportunity for manual intervention, the high volume of transactions and the interfaces of multiple systems with the general ledger there is potential for these transactions to be recorded incorrectly.
Revenue recognition was a key audit matter because of this complexity, the quantum of the Group’s revenue and the number of different revenue streams, systems and processes involved.
● where individually material Supplier License Fees were identified, we tested amounts recognised by the Group to the terms of the supplier agreement to determine whether the revenue and related costs were recorded accurately and within the correct accounting period.
● for Supplier License Fees that had previously been deferred, we checked whether the amounts recognised in the current year were consistent with the terms of the supplier agreement and the recognition profile for each agreement.
In relation to revenue from the sale of goods, food processing revenue, franchisor income and franchise service fees we performed detailed testing of a sample of revenue transactions, which included the following:
● Assessing the consistent application of the Group’s revenue recognition policies with the underlying terms and conditions of the sale of goods and services performed.
● Developing an understanding of the processes and key controls in place for each revenue stream.
● For all major revenue streams, agreeing a sample of transactions from the general ledger listing to supporting documentation, including bank statements. This included checking whether a sample of transactions either side of the Group year end date were recorded in the appropriate period.
For
per
sona
l use
onl
y
98
Other information
The directors are responsible for the other information. The other information comprises the information included in the annual report for the year ended 30 June 2018, but does not include the financial report and our auditor’s report thereon. Prior to the date of this auditor’s report, the other information we obtained included the Director’s report, Summary Financial Information, Corporate Directory and Additional Stock Exchange Information. We expect the remaining other information to be made available to use after the date of this auditor’s report, including Chairman’s Letter and CEO’s Report.
Our opinion on the financial report does not cover the other information and we do not and will not express an opinion or any form of assurance conclusion thereon.
In connection with our audit of the financial report, our responsibility is to read the other information identified above and, in doing so, consider whether the other information is materially inconsistent with the financial report or our knowledge obtained in the audit, or otherwise appears to be materially misstated.
If, based on the work we have performed on the other information that we obtained prior to the date of this auditor’s report, we conclude that there is a material misstatement of this other information, we are required to report that fact. We have nothing to report in this regard.
When we read the other information not yet received as identified above, if we conclude that there is a material misstatement therein, we are required to communicate the matter to the directors and use our professional judgement to determine the appropriate action to take.
Responsibilities of the directors for the financial report The directors of the Company are responsible for the preparation of the financial report that gives a true and fair view in accordance with Australian Accounting Standards and Corporations Act 2001 and for such internal control as the directors determine is necessary to enable the preparation of the financial report that gives a true and fair view and is free from material misstatement, whether due to fraud or error.
In preparing the financial report, the directors are responsible for assessing the ability of the Group to continue as a going concern, disclosing, as applicable, matters related to going concern and using the going concern basis of accounting unless the directors either intend to liquidate the Group or to cease operations, or have no realistic alternative but to do so.
Auditor’s responsibilities for the audit of the financial report Our objectives are to obtain reasonable assurance about whether the financial report as a whole is free from material misstatement, whether due to fraud or error, and to issue an auditor’s report that includes our opinion. Reasonable assurance is a high level of assurance, but is not a guarantee that an audit conducted in accordance with the Australian Auditing Standards will always detect a material misstatement when it exists. Misstatements can arise from fraud or error and are considered material if, individually or in the aggregate, they could reasonably be expected to influence the economic decisions of users taken on the basis of the financial report.
For
per
sona
l use
onl
y
99
A further description of our responsibilities for the audit of the financial report is located at the Auditing and Assurance Standards Board website at: http://www.auasb.gov.au/auditors_responsibilities/ar1.pdf. This description forms part of our auditor's report.
Report on the remuneration report
Our opinion on the remuneration report We have audited the remuneration report included in pages 14 to 25 of the directors’ report for the year ended 30 June 2018.
In our opinion, the remuneration report of Retail Food Group Limited for the year ended 30 June 2018 complies with section 300A of the Corporations Act 2001.
Responsibilities The directors of the Company are responsible for the preparation and presentation of the remuneration report in accordance with section 300A of the Corporations Act 2001. Our responsibility is to express an opinion on the remuneration report, based on our audit conducted in accordance with Australian Auditing Standards.
PricewaterhouseCoopers
Steven Bosiljevac Brisbane Partner 31 August 2018
For
per
sona
l use
onl
y
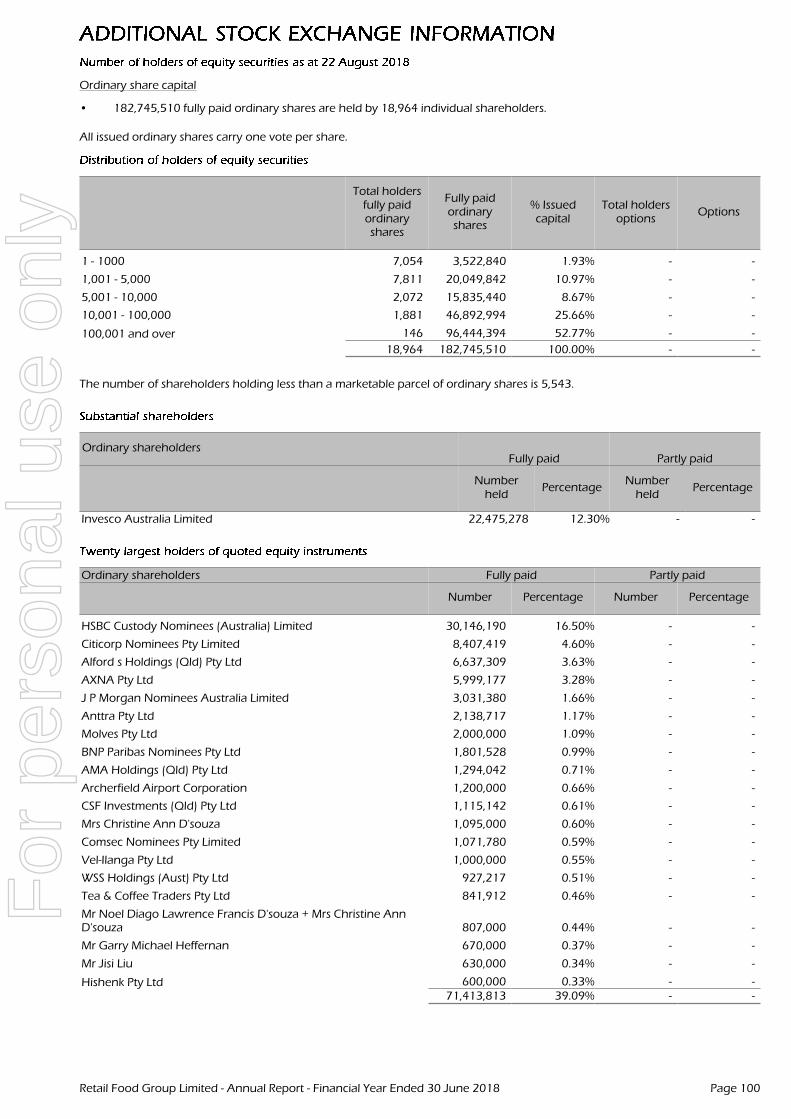
Ordinary share capital
• 182,745,510 fully paid ordinary shares are held by 18,964 individual shareholders.
All issued ordinary shares carry one vote per share.
Total holdersfully paidordinaryshares
Fully paidordinaryshares
% Issuedcapital
Total holdersoptions
Options
1 - 1000 7,054 3,522,840 1.93% - -
1,001 - 5,000 7,811 20,049,842 10.97% - -
5,001 - 10,000 2,072 15,835,440 8.67% - -
10,001 - 100,000 1,881 46,892,994 25.66% - -
100,001 and over 146 96,444,394 52.77% - -
18,964 182,745,510 100.00% - -
The number of shareholders holding less than a marketable parcel of ordinary shares is 5,543.
Ordinary shareholdersFully paid Partly paid
Numberheld
PercentageNumber
heldPercentage
Invesco Australia Limited 22,475,278 12.30% - -
Ordinary shareholders Fully paid Partly paid
Number Percentage Number Percentage
HSBC Custody Nominees (Australia) Limited 30,146,190 16.50% - -
Citicorp Nominees Pty Limited 8,407,419 4.60% - -
Alford s Holdings (Qld) Pty Ltd 6,637,309 3.63% - -
AXNA Pty Ltd 5,999,177 3.28% - -
J P Morgan Nominees Australia Limited 3,031,380 1.66% - -
Anttra Pty Ltd 2,138,717 1.17% - -
Molves Pty Ltd 2,000,000 1.09% - -
BNP Paribas Nominees Pty Ltd 1,801,528 0.99% - -
AMA Holdings (Qld) Pty Ltd 1,294,042 0.71% - -
Archerfield Airport Corporation 1,200,000 0.66% - -
CSF Investments (Qld) Pty Ltd 1,115,142 0.61% - -
Mrs Christine Ann D'souza 1,095,000 0.60% - -
Comsec Nominees Pty Limited 1,071,780 0.59% - -
Vel-Ilanga Pty Ltd 1,000,000 0.55% - -
WSS Holdings (Aust) Pty Ltd 927,217 0.51% - -
Tea & Coffee Traders Pty Ltd 841,912 0.46% - -
Mr Noel Diago Lawrence Francis D'souza + Mrs Christine AnnD'souza 807,000 0.44% - -
Mr Garry Michael Heffernan 670,000 0.37% - -
Mr Jisi Liu 630,000 0.34% - -
Hishenk Pty Ltd 600,000 0.33% - -71,413,813 39.09% - -
Retail Food Group Limited - Annual Report - Financial Year Ended 30 June 2018 Page 100
For
per
sona
l use
onl
y


![[Psilocybin]Magic Mushrooms Of Australia & Newzealand-Allen](https://img.pdfslide.us/doc/110x75/5451e245b1af9f83248b4acc/psilocybinmagic-mushrooms-of-australia-newzealand-allen.jpg)