Embed Size (px)
Citation preview

____________________________________________________________________________________________ Vista Group International Ltd, L3, 60 Khyber Pass Road, Newton, PO Box 8279, Symonds St, Auckland 1150, NZ
Market Announcement
26th August 2016, Vista Group International Limited, Auckland, New Zealand
Vista Group - First half trading produces 49% revenue growth over first half FY2015
Highlights
Consolidated Vista Group Revenue of $40.7m represents growth over first half FY2015 of 49% (42% excluding acquisitions).
EBITDA(1) of $5.3m for the first half of FY2016, represents an increase of $1.7m (+47%).
Completion of 3 strategic acquisitions during the first half of FY2016.
Vista Group continues to invest in projects to sustain and build future growth. Headcount numbers (excluding new acquisitions in FY2016) have increased to 435, representing an increase of 85 employees or 24%.
Announcement and completion of a new venture in China with Tencent affiliate – WePiao - to take advantage of the rapidly expanding Chinese film market.
Vista Group (NZSX: VGL, ASX: VGL) has today announced its half year results for the 6 months to 30
June 2016. Overall, performance is well up on the 2015 half year.
Operating Metrics
Recurring revenue in the first half of FY2016 represents 66% of total revenue, up from 61% in FY2015.
Vista Cinema cumulative site numbers grow to 5,200 (up from 4,710 at the end of FY2015) driving recurring maintenance revenue and additional module upsell opportunities.
Global Vista Cinema market share grows to 38% worldwide for cinema exhibition companies with 20+ screens.
VEEZI revenue increases driven by higher than anticipated site numbers and revenue per site. VEEZI recurring revenues exceed $2.65m on an annualised basis
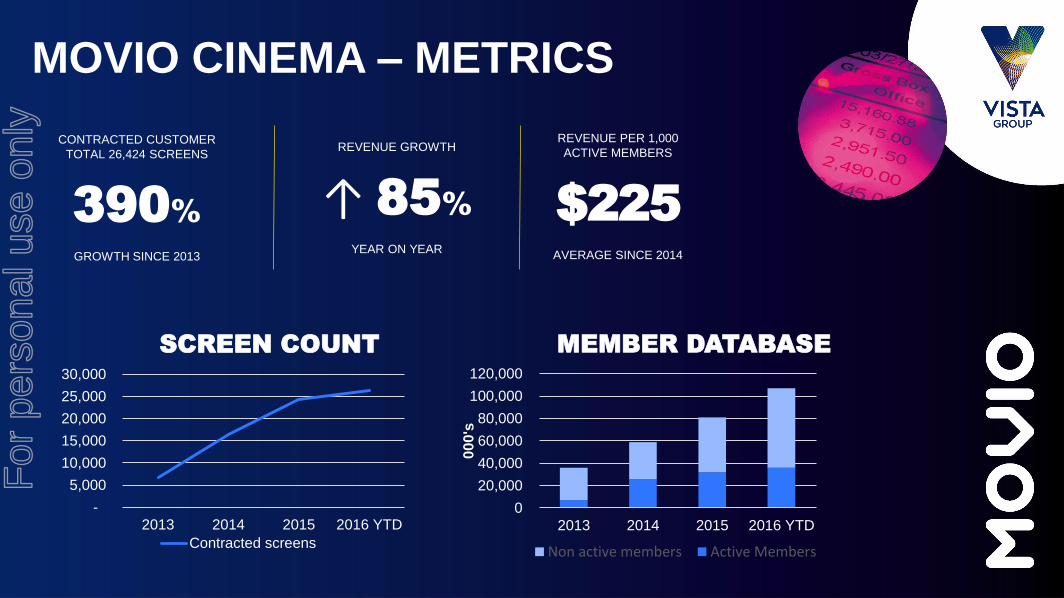
Movio revenue in the first half of FY2016 increases 85% when compared to the same period in FY2015.
Divisional overview Vista Cinema has had a strong first half highlighted by an increase in site numbers of 490 (includes 161 sites from CCG in France). Key deal closure and deployments in China, South Africa and Middle East have driven this result.
For
per
sona
l use
onl
y

____________________________________________________________________________________________ Vista Group International Ltd, L3, 60 Khyber Pass Road, Newton, PO Box 8279, Symonds St, Auckland 1150, NZ
Veezi reached 429 (350 at end of FY2015) contracted sites by 30 June. Progress of entry into other territories, especially France, China and India has been further advanced. Movio Cinema has continued to expand its global footprint with its core analytics and campaign management software, with particular success across the US and Europe, Middle East and Africa. Email volume is at record levels and adoption of the newly launched SMS module is growing rapidly. Key new customers are now live with Movio Cinema, with their revenue to be recognised in the second half of FY2016. Movio Media has continued to gain traction in the US with ongoing agreements in place with Sony, Warner Bros. and NCM. Development is progressing on a second generation product to further refine the offering and address additional market requirements. There are a number of prospects in late stages of negotiation. MACCS performed to expectation. The revenue from the contract with Warner Bros. in the US providing a key uplift, as a result revenue has increased by 33% for the first half when compared to the same period in 2015. MACCS is continuing to increase its penetration and market share in other international markets. New acquisitions. In the first 6 months Vista Group completed the strategic acquisition of three companies: Powster Limited (‘Powster’), Share Dimension B.V. including its subsidiary S.C. Share Dimension S.R.L. (collectively ‘Share Dimension’) and Flicks.co.nz Limited (‘Flicks’). Significant progress has been made to integrate these new businesses into Vista Group with synergies now beginning to be realised. Financial overview Vista Group’s trading performance in the first half of FY2016 represents a solid increase from FY2015 in terms of revenue and EBITDA (1), which represented both the expanded nature of Vista Group and the improved performance of the operating businesses. A high level of volatility in exchange rates was experienced following the Brexit vote in June 2016. All key trading exchange cross rates moved unfavourably due to the strengthening of the NZD. This resulted in a material movement in unrealised losses at period end due to revaluations of items such as trade receivables at balance date. Vista Group has recognised foreign exchange losses of $782k for the half year period to 30 June 2016. When compared to the same period in FY2015 when favourable gains of $1.857m were recognised, this represents a large movement in the operating result. With these movements included, Vista Group still shows an increase in operating profit for the first half of FY2016 of $1.16m, when compared to the same period in FY2015 . Vista Group continues to produce positive cashflow from operating activities. Cash reserves have decreased ($11.1m) primarily due to acquisition activity as Vista Group completes the strategic acquisitions of Powster, Share Dimension and Flicks in the first half of FY2016.
For
per
sona
l use
onl
y

____________________________________________________________________________________________ Vista Group International Ltd, L3, 60 Khyber Pass Road, Newton, PO Box 8279, Symonds St, Auckland 1150, NZ
The new venture in China with WePiao has progressed with the final regulatory approval now having been received to establish the new venture. WePiao have completed the first payment tranche under the agreements. The transaction has now completed, post balance date, and therefore assets and liabilities related to Vista China are classified as held for sale through the financial statements and accompanying notes (see market announcements from 4 March 2016 and 25 August 2016 for further details of the transaction).
(1) EBITDA is defined as earnings before depreciation and amortisation ($1.168m), net finance expenses and income tax.
Contact: Brian J Cadzow Director – Commercial and Legal Email - [email protected] Phone - +64 9 984 4570
For
per
sona
l use
onl
y

Vista Group – FY 2016 Half Year Results
26 August 2016
For
per
sona
l use
onl
y

PAGE 2
Important notice
This presentation has been prepared by Vista Group International Limited (“Vista Group”).
Information in this presentation:
> is provided for general information purposes only, does not purport to be complete or comprehensive and is not an offer or invitation for subscription, purchase or recommendation of securities in Vista Group. This presentation does not constitute investment advice;
> should be read in conjunction with, and is subject to, Vista Group’s financial statements, market releases and information published on Vista Group’s website (www.vistagroup.co.nz);
> may include projections or forward looking statements about Vista Group and the environment in which Vista Group operations. Such forward-looking statements are based upon current expectations and involve risks, uncertainties and contingencies outside of Vista Group’s control. Vista Group’s actual results or performance may differ materially from these statements. Although management may indicate and believe the assumptions underlying the forward looking statements are reasonable, any assumptions could prove inaccurate or incorrect and, therefore, there can be no assurance that the results contemplated in the forward looking statements will be realised;
> may include statements relating to past performance, which should not be regarded as a reliable indicator of future performance.
While all reasonable care has been taken in compiling this presentation, Vista Group accepts no responsibility for any errors oromissions.
All information in this presentation is current at the date of this presentation, unless otherwise stated.
All currency amounts are in NZ dollars, unless stated otherwise.
For
per
sona
l use
onl
y

PAGE 3
> Results highlights and Group update
> Operating performance and trading metrics
> Financial performance
> China transaction
> Outlook
> Questions
For
per
sona
l use
onl
y

VISTA GROUP –
RESULTS HIGHLIGHTS
& GROUP UPDATE
For
per
sona
l use
onl
y
PAGE 5
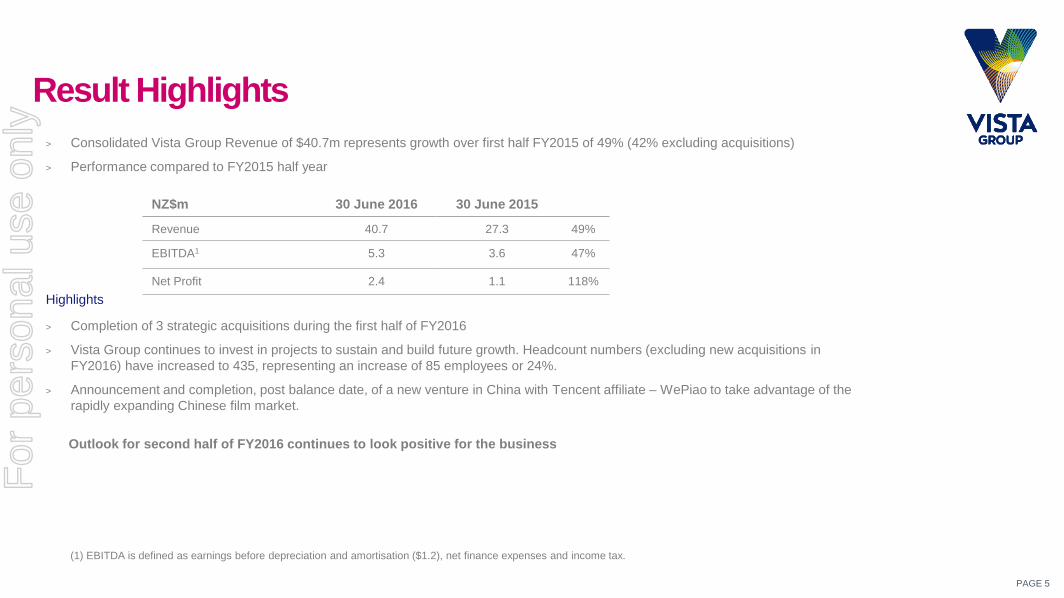
Result Highlights
> Consolidated Vista Group Revenue of $40.7m represents growth over first half FY2015 of 49% (42% excluding acquisitions)
> Performance compared to FY2015 half year
Highlights
> Completion of 3 strategic acquisitions during the first half of FY2016
> Vista Group continues to invest in projects to sustain and build future growth. Headcount numbers (excluding new acquisitions in
FY2016) have increased to 435, representing an increase of 85 employees or 24%.
> Announcement and completion, post balance date, of a new venture in China with Tencent affiliate – WePiao to take advantage of the
rapidly expanding Chinese film market.
Outlook for second half of FY2016 continues to look positive for the business
NZ$m 30 June 2016 30 June 2015
Revenue 40.7 27.3 49%
EBITDA1 5.3 3.6 47%
Net Profit 2.4 1.1 118%
(1) EBITDA is defined as earnings before depreciation and amortisation ($1.2), net finance expenses and income tax.
For
per
sona
l use
onl
y
VISTA GROUP UPDATE
VISTA ENTERTAINMENT SOLUTIONS
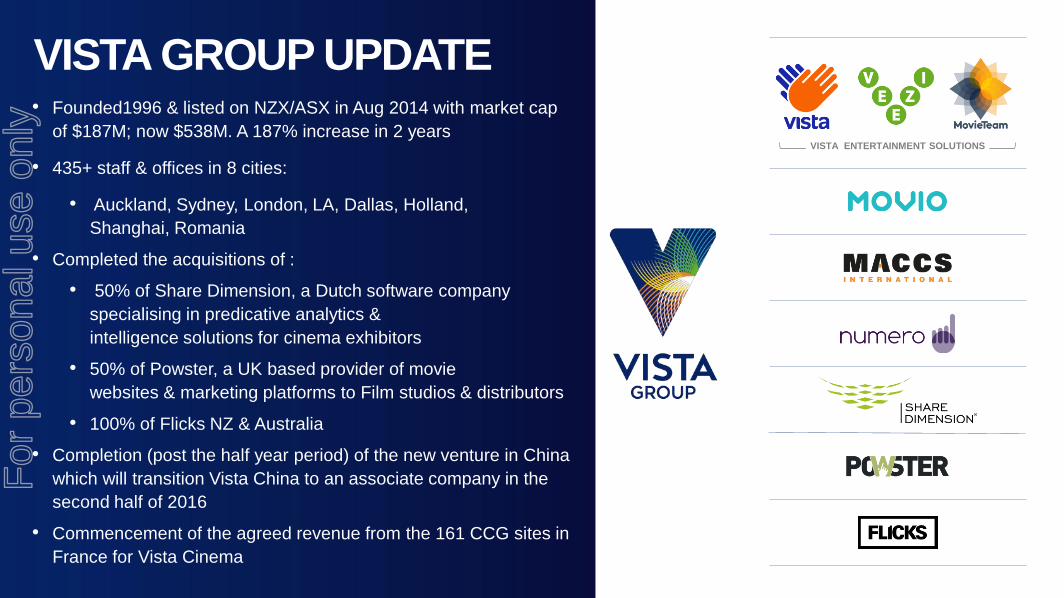
• Founded1996 & listed on NZX/ASX in Aug 2014 with market cap
of $187M; now $538M. A 187% increase in 2 years
• 435+ staff & offices in 8 cities:
• Auckland, Sydney, London, LA, Dallas, Holland,
Shanghai, Romania
• Completed the acquisitions of :
• 50% of Share Dimension, a Dutch software company
specialising in predicative analytics &
intelligence solutions for cinema exhibitors
• 50% of Powster, a UK based provider of movie
websites & marketing platforms to Film studios & distributors
• 100% of Flicks NZ & Australia
• Completion (post the half year period) of the new venture in China
which will transition Vista China to an associate company in the
second half of 2016
• Commencement of the agreed revenue from the 161 CCG sites in
France for Vista Cinema
For
per
sona
l use
onl
y
VISTA GROUP –
OPERATING
PERFORMANCE &
TRADING METRICS
For
per
sona
l use
onl
y
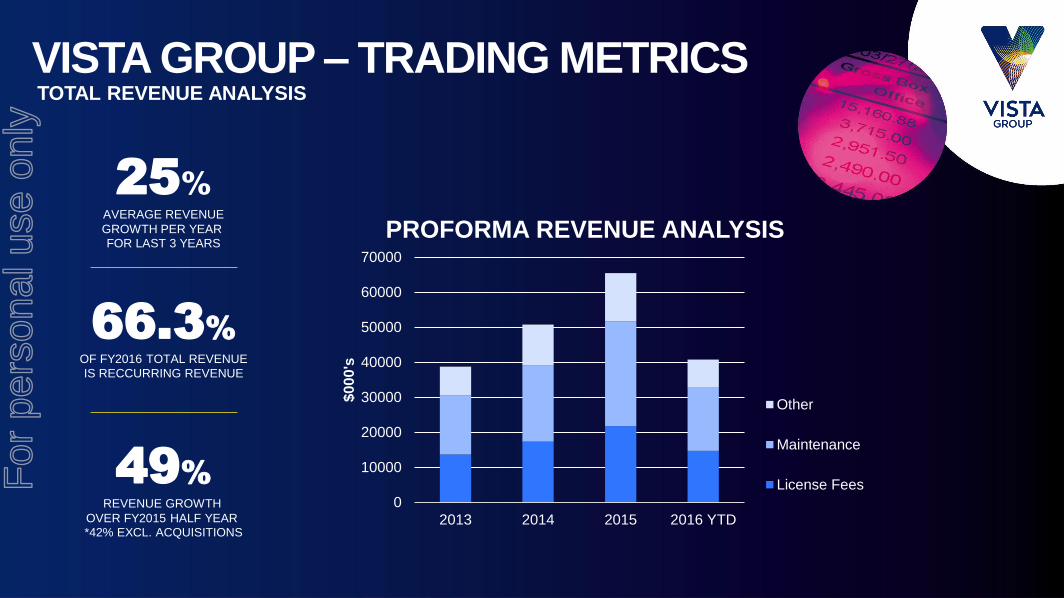
VISTA GROUP – TRADING METRICSTOTAL REVENUE ANALYSIS
0
10000
20000
30000
40000
50000
60000
70000
2013 2014 2015 2016 YTD
$000's
PROFORMA REVENUE ANALYSIS
Other
Maintenance
License Fees
25%
AVERAGE REVENUE
GROWTH PER YEAR FOR LAST 3 YEARS
66.3%
OF FY2016 TOTAL REVENUE
IS RECCURRING REVENUE
49%
REVENUE GROWTH
OVER FY2015 HALF YEAR *42% EXCL. ACQUISITIONS
For
per
sona
l use
onl
y
PAGE 9
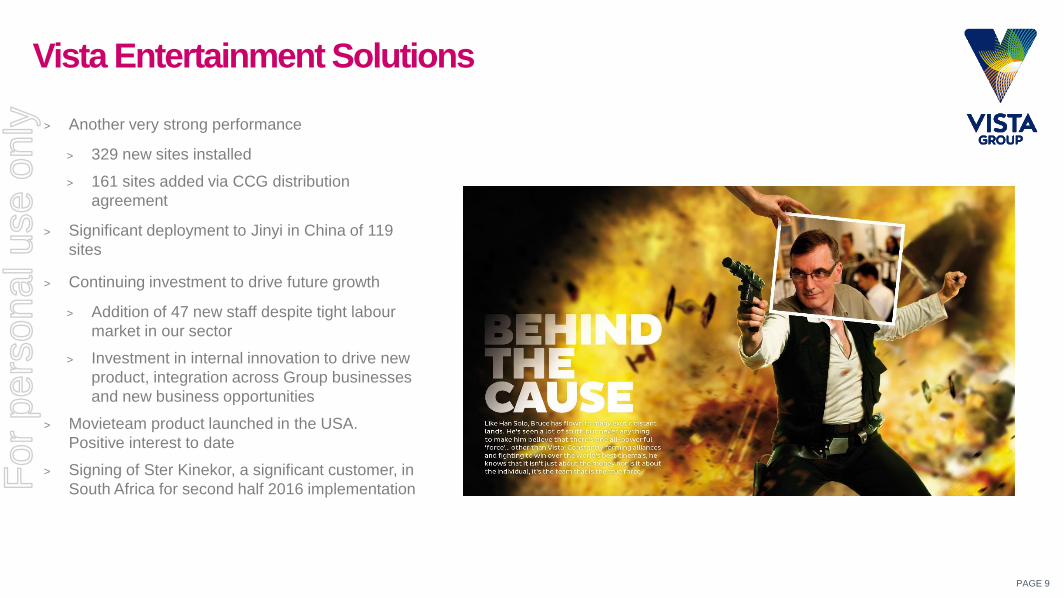
Vista Entertainment Solutions
> Another very strong performance
> 329 new sites installed
> 161 sites added via CCG distribution
agreement
> Significant deployment to Jinyi in China of 119
sites
> Continuing investment to drive future growth
> Addition of 47 new staff despite tight labour
market in our sector
> Investment in internal innovation to drive new
product, integration across Group businesses
and new business opportunities
> Movieteam product launched in the USA.
Positive interest to date
> Signing of Ster Kinekor, a significant customer, in
South Africa for second half 2016 implementation For
per
sona
l use
onl
y
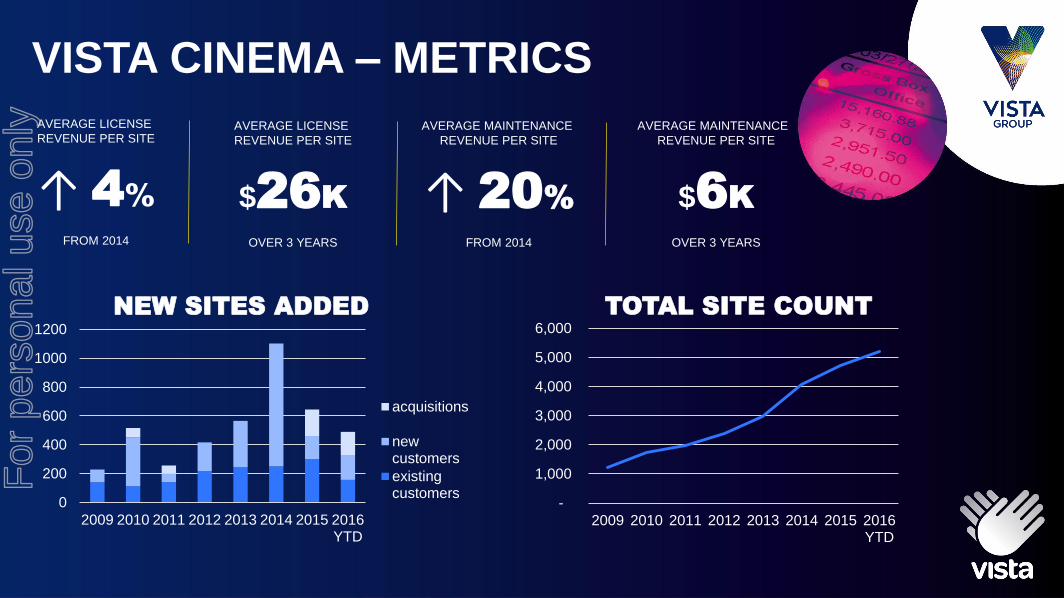
VISTA CINEMA – METRICS
AVERAGE LICENSE
REVENUE PER SITE
↑ 4%
FROM 2014
AVERAGE MAINTENANCE
REVENUE PER SITE
↑ 20%
FROM 2014
-
1,000
2,000
3,000
4,000
5,000
6,000
2009 2010 2011 2012 2013 2014 2015 2016YTD
TOTAL SITE COUNT
AVERAGE LICENSE
REVENUE PER SITE
$26K
OVER 3 YEARS
AVERAGE MAINTENANCE
REVENUE PER SITE
$6K
OVER 3 YEARS
0
200
400
600
800
1000
1200
2009 2010 2011 2012 2013 2014 2015 2016YTD
NEW SITES ADDED
acquisitions
newcustomers
existingcustomers
For
per
sona
l use
onl
y

PAGE 11
Veezi
> 429 contracted sites by 30 June 2016
> Average revenue per site increased to $500 per
month
> Entry to France via the CCG distribution agreement
has been well progressed
> Opportunities to enter China and India are
progressing
For
per
sona
l use
onl
y
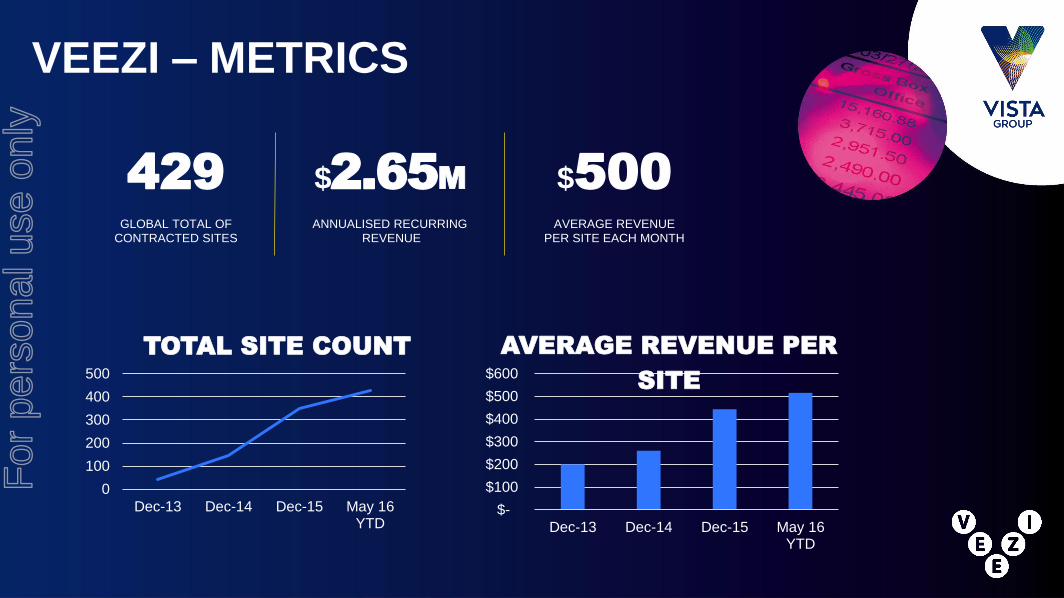
VEEZI – METRICS
429
GLOBAL TOTAL OFCONTRACTED SITES
$500
AVERAGE REVENUEPER SITE EACH MONTH
$2.65M
ANNUALISED RECURRINGREVENUE
0
100
200
300
400
500
Dec-13 Dec-14 Dec-15 May 16YTD
TOTAL SITE COUNT
$-
$100
$200
$300
$400
$500
$600
Dec-13 Dec-14 Dec-15 May 16YTD
AVERAGE REVENUE PER
SITE
For
per
sona
l use
onl
y

PAGE 13
Movio> Movio Cinema
> Continued expansion of customer footprint. Recent
success in US, Europe, Middle East and Africa
> Email volume is at record levels
> New SMS module use is growing rapidly
> Movio functionality continues to act as a draw card
for Vista Entertainment Solutions to potential
customers
> Previously signed customers now live with full Movio
Cinema functionality
> Movio Media
> Continuing to gain traction.
> Key contracts with NCM, Sony and Warner Bros.
> Development is progressing on a second
generation product to further refine the offering
and address additional market requirements
> Negotiations with new prospects continues with
a number well progressed.
MOVIO KNOWS ‘WHO’
For
per
sona
l use
onl
y
-
5,000
10,000
15,000
20,000
25,000
30,000
2013 2014 2015 2016 YTD
SCREEN COUNT
Contracted screens
MOVIO CINEMA – METRICS
REVENUE PER 1,000
ACTIVE MEMBERS
$225
AVERAGE SINCE 2014
CONTRACTED CUSTOMER
TOTAL 26,424 SCREENS
390%
GROWTH SINCE 2013
REVENUE GROWTH
↑ 85%
YEAR ON YEAR
0
20,000
40,000
60,000
80,000
100,000
120,000
2013 2014 2015 2016 YTD
000
's
MEMBER DATABASE
Non active members Active Members
For
per
sona
l use
onl
y
PAGE 15
MACCS
> Revenue up 33% over FY2015 half year
> Core business performed to expectation
> Revenue from the contract with Warner Bros. in USA provided a key
uplift in overall performance
> Continued penetration and market share growth in other international
markets
For
per
sona
l use
onl
y

PAGE 16
Numero
> Collecting box office results for over 99% of the Australasian market
> 6 major studios in Australia have now signed for subscription services.
> Opportunities in other major territories are being progressed.
For
per
sona
l use
onl
y

VISTA GROUP -
FINANCIAL
PERFORMANCE
For
per
sona
l use
onl
y

Trading Performance
> Revenue has increased strongly across the Group and excluding acquisitions is still up 42%
> Operating expenses reflect the increase in scale of the business
> Foreign exchange impacts FY2016 result negatively due to higher NZ dollar subsequent to Brexit vote in June.
> EBITDA measured on comparative basis shows strong increase
For six months ended
NZ$m 30 June 2016 30 June 2015
Revenue 40.7 27.3 49%
Operating Expenses 35.8 26.3 36%
Foreign exchange losses / (gains) 0.8 (1.9)
Operating Profit 4.1 2.9 41%
Net Profit attributable to shareholders 2.4 1.1 118%
Net Profit before Tax 4.2 2.6 62%
NZ$m 2016 Actual 2015 Actual
EBITDA 5.3 3.6 47%
Note: EBITDA is earnings before depreciation and amortisation ($1.2), net finance expense and income tax.
For
per
sona
l use
onl
y

Financial Position
> Higher receivables at 30 June 2016 due to
revenue growth of 40% plus increase in accrued
revenue balance
> Cash balance has reduced due to acquisitions
> Intangibles including Goodwill increased with
acquisitions of Powster, Share Dimension and
Flicks
> No impairment of Intangibles
> Current liabilities up in line with increased trading
levels
> Assets and liabilities classified as held for sale
relate to Vista China due to the post balance date
completion of the transaction with WePiao
For
per
sona
l use
onl
y
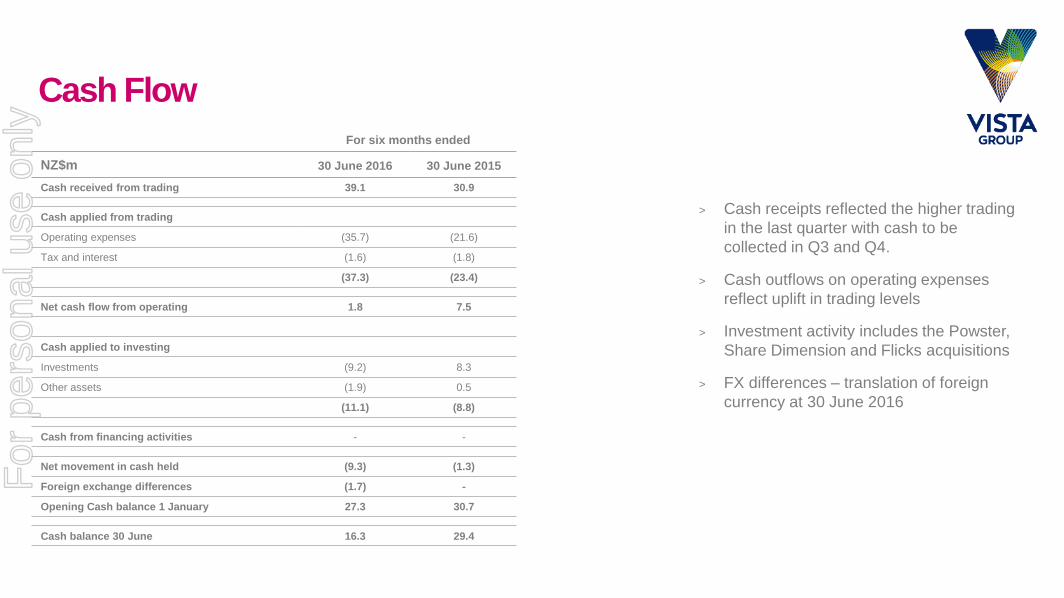
Cash Flow
> Cash receipts reflected the higher trading
in the last quarter with cash to be
collected in Q3 and Q4.
> Cash outflows on operating expenses
reflect uplift in trading levels
> Investment activity includes the Powster,
Share Dimension and Flicks acquisitions
> FX differences – translation of foreign
currency at 30 June 2016
For six months ended
NZ$m 30 June 2016 30 June 2015
Cash received from trading 39.1 30.9
Cash applied from trading
Operating expenses (35.7) (21.6)
Tax and interest (1.6) (1.8)
(37.3) (23.4)
Net cash flow from operating 1.8 7.5
Cash applied to investing
Investments (9.2) 8.3
Other assets (1.9) 0.5
(11.1) (8.8)
Cash from financing activities - -
Net movement in cash held (9.3) (1.3)
Foreign exchange differences (1.7) -
Opening Cash balance 1 January 27.3 30.7
Cash balance 30 June 16.3 29.4
For
per
sona
l use
onl
y

CHINA
TRANSACTION
For
per
sona
l use
onl
y

PAGE 22
Transaction overview
> Vista Group is bringing WePiao, a scale local Chinese operator and an affiliate of Tencent, in to Vista China as a partner
to grow Vista China’s position in the China film market.
> Vista China will have exclusive distribution rights to Vista Cinema, Veezi, Movio, Maccs and Numero in China under a
long term distribution agreement.
> The regulatory approvals required for the transaction have now been fulfilled and completion under the agreements has
occurred.
> The first tranche payments due under the agreements have been completed and the second tranche payments due on
completion are now being processed.
> Vista Group will hold 40% of the new venture going forward.
> WePiao will subscribe for an additional 2.0% of new shares (1,638,805) to be issued in Vista Group. This is at the VWAP
price at the time of the original announcement ($4.871) and will raise $7.982m.
For
per
sona
l use
onl
y

PAGE 23
Transaction overview
> Transaction Values
> Vista Entertainment Solutions has sold shares in Vista China and will receive circa $17m for these
> WePiao has paid circa $33m to subscribe for additional shares in Vista China to provide the necessary working
capital for the business to fund the distribution payments to Vista Group and the future growth of the business. This
is a significant commitment to the new venture.
> Vista Group has entered distribution agreement with Vista China that has the following revenue flows:
> On completion Vista Group will receive up front fees with respect to maintenance and localisation/license of
circa $14m
> In year 2 Vista group will receive additional upfront localisation/license fees of circa $6m
> From year 4 Vista group will receive ongoing maintenance fees of circa $2m
> The revenue accounting treatment for these funds is being discussed with our auditors
> From completion, Vista Group will account for its 40% equity share in Vista China as an associate
For
per
sona
l use
onl
y

OUTLOOK
For
per
sona
l use
onl
y

PAGE 25
Outlook
> The half year result supports the revenue growth projection for FY2016 of 20% to 30%
> The pipeline for future revenue remains strong
> Veezi expected to grow at a faster rate with addition of France, China and Indian markets
> Movio to continue sales of Movio Cinema and to enhance the monetisation of Movio Media
> Numero will add more studios in Australasia and look to branch outside the Australasian region
> MACCS to continue deployment to Warner Bros. in the USA and expand opportunities in global
territories
> Integration of the newly acquired entities will bring benefits to the Group and provide additional revenue
opportunities as new product offerings can be released.
> Vista China will establish itself under the new JV structure and commence the plan to grow its business
in China
For
per
sona
l use
onl
y

QUESTIONS
For
per
sona
l use
onl
y
VISTA GROUP INTERNATIONAL LIMITED
INTERIM REPORT
2016
For
per
sona
l use
onl
y

TABLE OF
CONTENTS
1 Management Commentary
3 Interim Statement of Comprehensive Income
4 Interim Statement of Changes in Equity
5 Interim Statement of Financial Position
6 Interim Statement of Cash Flows
7 Notes to the Interim Financial Statements
For
per
sona
l use
onl
y
01VISTA GROUP INTERNATIONAL LIMITED
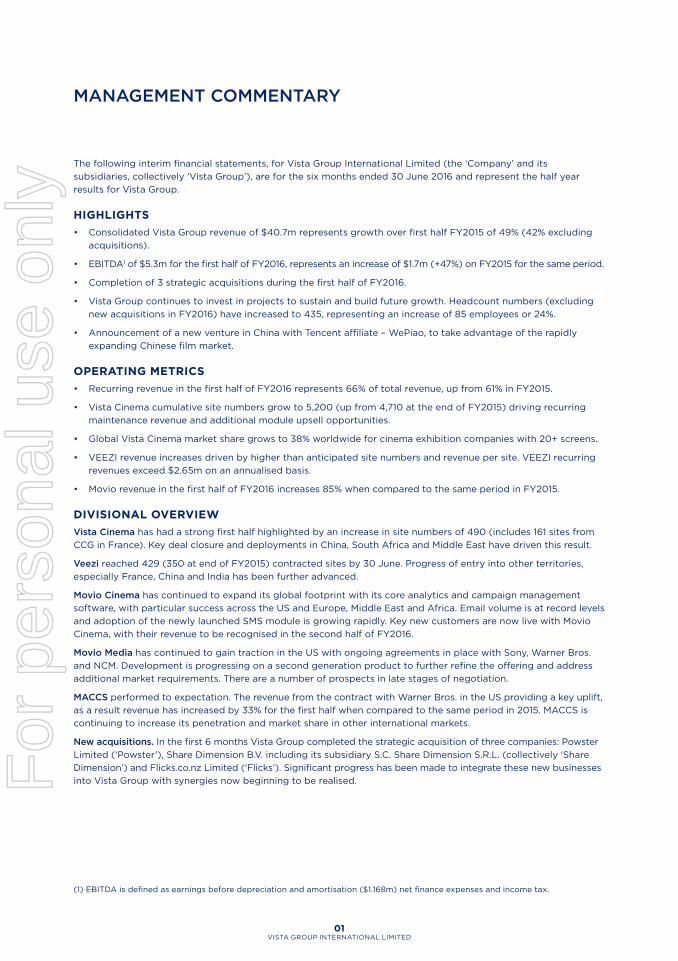
MANAGEMENT COMMENTARY
The following interim financial statements, for Vista Group International Limited (the ‘Company’ and its
subsidiaries, collectively ‘Vista Group’), are for the six months ended 30 June 2016 and represent the half year
results for Vista Group.
HIGHLIGHTS
• Consolidated Vista Group revenue of $40.7m represents growth over first half FY2015 of 49% (42% excluding
acquisitions).
• EBITDA1 of $5.3m for the first half of FY2016, represents an increase of $1.7m (+47%) on FY2015 for the same period.
• Completion of 3 strategic acquisitions during the first half of FY2016.
• Vista Group continues to invest in projects to sustain and build future growth. Headcount numbers (excluding
new acquisitions in FY2016) have increased to 435, representing an increase of 85 employees or 24%.
• Announcement of a new venture in China with Tencent affiliate – WePiao, to take advantage of the rapidly
expanding Chinese film market.
OPERATING METRICS
• Recurring revenue in the first half of FY2016 represents 66% of total revenue, up from 61% in FY2015.
• Vista Cinema cumulative site numbers grow to 5,200 (up from 4,710 at the end of FY2015) driving recurring
maintenance revenue and additional module upsell opportunities.
• Global Vista Cinema market share grows to 38% worldwide for cinema exhibition companies with 20+ screens.
• VEEZI revenue increases driven by higher than anticipated site numbers and revenue per site. VEEZI recurring
revenues exceed $2.65m on an annualised basis.
• Movio revenue in the first half of FY2016 increases 85% when compared to the same period in FY2015.
DIVISIONAL OVERVIEW
Vista Cinema has had a strong first half highlighted by an increase in site numbers of 490 (includes 161 sites from
CCG in France). Key deal closure and deployments in China, South Africa and Middle East have driven this result.
Veezi reached 429 (350 at end of FY2015) contracted sites by 30 June. Progress of entry into other territories,
especially France, China and India has been further advanced.
Movio Cinema has continued to expand its global footprint with its core analytics and campaign management
software, with particular success across the US and Europe, Middle East and Africa. Email volume is at record levels
and adoption of the newly launched SMS module is growing rapidly. Key new customers are now live with Movio
Cinema, with their revenue to be recognised in the second half of FY2016.
Movio Media has continued to gain traction in the US with ongoing agreements in place with Sony, Warner Bros.
and NCM. Development is progressing on a second generation product to further refine the offering and address
additional market requirements. There are a number of prospects in late stages of negotiation.
MACCS performed to expectation. The revenue from the contract with Warner Bros. in the US providing a key uplift,
as a result revenue has increased by 33% for the first half when compared to the same period in 2015. MACCS is
continuing to increase its penetration and market share in other international markets.
New acquisitions. In the first 6 months Vista Group completed the strategic acquisition of three companies: Powster
Limited (‘Powster’), Share Dimension B.V. including its subsidiary S.C. Share Dimension S.R.L. (collectively ‘Share
Dimension’) and Flicks.co.nz Limited (‘Flicks’). Significant progress has been made to integrate these new businesses
into Vista Group with synergies now beginning to be realised.
(1) EBITDA is defined as earnings before depreciation and amortisation ($1.168m) net finance expenses and income tax.
For
per
sona
l use
onl
y

02VISTA GROUP INTERNATIONAL LIMITED
FINANCIAL OVERVIEW
Vista Group’s trading performance in the first half of FY2016 represents a solid increase from FY2015 in terms of
revenue and EBITDA1, which represented both the expanded nature of Vista Group and the improved performance of
the operating businesses. A high level of volatility in exchange rates was experienced following the Brexit vote in June
2016. All key trading exchange cross rates moved unfavourably due to the strengthening of the NZD. This resulted in a
material movement in unrealised losses at period end due to revaluations of items such as trade receivables at balance
date. Vista Group has recognised foreign exchange losses of $0.78m for the half year period to 30 June 2016.
When compared to the same period in FY2015 when favourable gains of $1.857m were recognised, this represents
a large movement in the operating result. With these movements included, Vista Group still shows an increase in
operating profit for the first half of FY2016 of $1.16m, when compared to the same period in FY2015.
Vista Group continues to produce positive cashflow from operating activities. Cash reserves have decreased ($11.1m)
primarily due to acquisition activity as Vista Group completes the strategic acquisitions of Powster, Share Dimension
and Flicks in the first half of FY2016.
The new venture in China with WePiao has progressed with the final regulatory approval now having been received to
establish the new venture. WePiao have completed the first payment tranche under the agreements. The transaction
has now completed, post balance date, and therefore assets and liabilities related to Vista China are classified as held
for sale through the financial statements and accompanying notes (see market announcements from 4 March 2016
and 25 August 2016 for further details of the transaction).
(1) EBITDA is defined as earnings before depreciation and amortisation ($1.168m) net finance expenses and income tax.
For
per
sona
l use
onl
y

03INTERIM REPORT 2016
30 JUNE 2016 30 JUNE 2015
NZ$’000 NZ$’000
NOTES UNAUDITED UNAUDITED
Revenue 40,724 27,268
Total revenue 3 40,724 27,268
Sales and marketing expenses 3,043 2,114
Operating expenses 20,187 15,052
Administration expenses 11,965 7,630
Acquisition expenses 656 1,399
Foreign currency losses / (gains) 782 (1,857)
Total expenses 36,633 24,338
Operating profit 4,091 2,930
Finance costs (231) (345)
Finance income 313 347
Share of profit / (loss) from associate - (348)
Profit before tax 4,173 2,584
Tax expense (1,457) (1,328)
Profit for the period 2,716 1,256
Profit for the period is attributable to:
Owners of the parent 2,393 1,138
Non-controlling interests 323 118
2,716 1,256
Other comprehensive income
Items that may be reclassified to profit or loss:
Exchange differences on translation of foreign operations, net of tax (1,674) 709
Total comprehensive income for the period 1,042 1,965
Total comprehensive income for the period is attributable to:
Owners of the parent 1,061 1,847
Non-controlling interests (19) 118
1,042 1,965
Total comprehensive income for the period is attributable to the owners of the parent arises from:
Continuing operations 923 1,847
Assets classified as held for sale 138 -
1,061 1,847
Earnings per share for profit attributable to the equity holders of the parent
Basic (cents per share) $0.03 $0.02
Diluted (cents per share) $0.03 $0.02
The above statement should be read in conjunction with the accompanying notes.
INTERIM STATEMENT OF COMPREHENSIVE INCOMESIX MONTHS ENDED 30 JUNE 2016
For
per
sona
l use
onl
y
04VISTA GROUP INTERNATIONAL LIMITED
ATTRIBUTABLE TO THE OWNERS OF THE PARENT
NON-CONTROLLING
INTERESTSTOTAL
EQUITYCONTRIBUTED
EQUITYRETAINED EARNINGS
FOREIGN CURRENCY
RESERVE
SHARE-BASED PAYMENT RESERVE TOTAL
NOTES NZ$’000 NZ$’000 NZ$’000 NZ$’000 NZ$’000 NZ$’000 NZ$’000
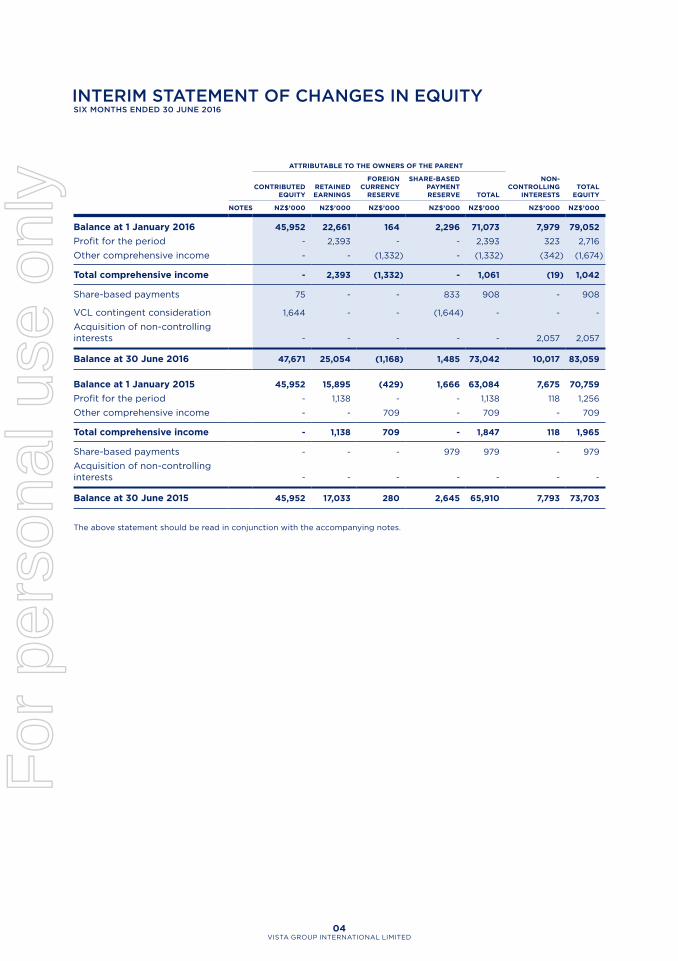
Balance at 1 January 2016 45,952 22,661 164 2,296 71,073 7,979 79,052
Profit for the period - 2,393 - - 2,393 323 2,716
Other comprehensive income - - (1,332) - (1,332) (342) (1,674)
Total comprehensive income - 2,393 (1,332) - 1,061 (19) 1,042
Share-based payments 75 - - 833 908 - 908
VCL contingent consideration 1,644 - - (1,644) - - -
Acquisition of non-controlling interests - - - - - 2,057 2,057
Balance at 30 June 2016 47,671 25,054 (1,168) 1,485 73,042 10,017 83,059
Balance at 1 January 2015 45,952 15,895 (429) 1,666 63,084 7,675 70,759
Profit for the period - 1,138 - - 1,138 118 1,256
Other comprehensive income - - 709 - 709 - 709
Total comprehensive income - 1,138 709 - 1,847 118 1,965
Share-based payments - - - 979 979 - 979
Acquisition of non-controlling interests - - - - - - -
Balance at 30 June 2015 45,952 17,033 280 2,645 65,910 7,793 73,703
The above statement should be read in conjunction with the accompanying notes.
INTERIM STATEMENT OF CHANGES IN EQUITYSIX MONTHS ENDED 30 JUNE 2016
For
per
sona
l use
onl
y
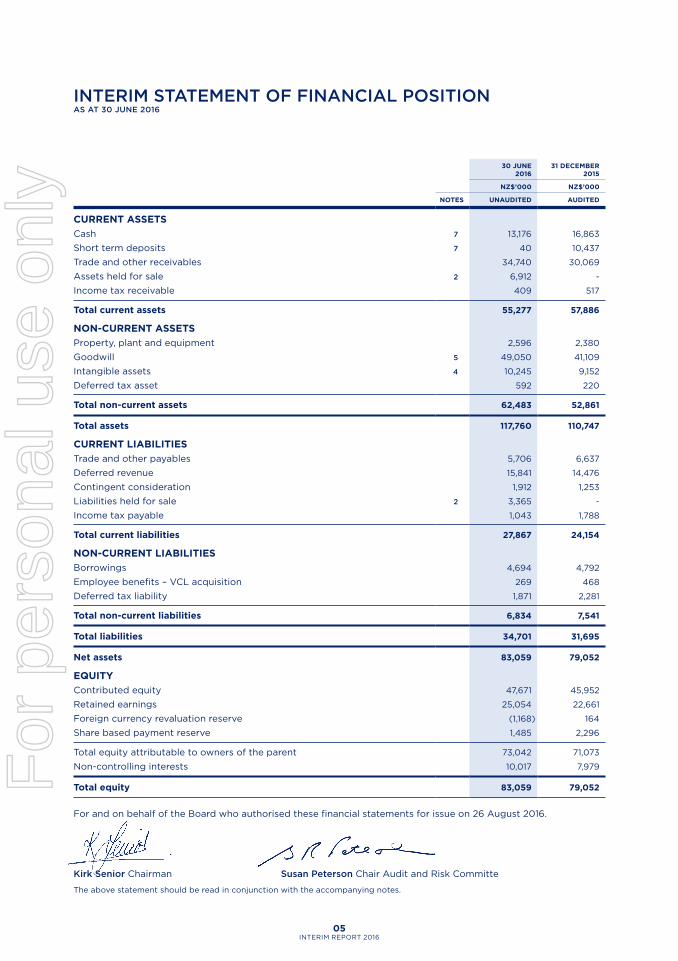
05INTERIM REPORT 2016
30 JUNE 2016
31 DECEMBER 2015
NZ$’000 NZ$’000
NOTES UNAUDITED AUDITED
CURRENT ASSETS
Cash 7 13,176 16,863
Short term deposits 7 40 10,437
Trade and other receivables 34,740 30,069
Assets held for sale 2 6,912 -
Income tax receivable 409 517
Total current assets 55,277 57,886
NON-CURRENT ASSETS
Property, plant and equipment 2,596 2,380
Goodwill 5 49,050 41,109
Intangible assets 4 10,245 9,152
Deferred tax asset 592 220
Total non-current assets 62,483 52,861
Total assets 117,760 110,747
CURRENT LIABILITIES
Trade and other payables 5,706 6,637
Deferred revenue 15,841 14,476
Contingent consideration 1,912 1,253
Liabilities held for sale 2 3,365 -
Income tax payable 1,043 1,788
Total current liabilities 27,867 24,154
NON-CURRENT LIABILITIES
Borrowings 4,694 4,792
Employee benefits – VCL acquisition 269 468
Deferred tax liability 1,871 2,281
Total non-current liabilities 6,834 7,541
Total liabilities 34,701 31,695
Net assets 83,059 79,052
EQUITY
Contributed equity 47,671 45,952
Retained earnings 25,054 22,661
Foreign currency revaluation reserve (1,168) 164
Share based payment reserve 1,485 2,296
Total equity attributable to owners of the parent 73,042 71,073
Non-controlling interests 10,017 7,979
Total equity 83,059 79,052
For and on behalf of the Board who authorised these financial statements for issue on 26 August 2016.
Kirk Senior Chairman Susan Peterson Chair Audit and Risk Committe
The above statement should be read in conjunction with the accompanying notes.
INTERIM STATEMENT OF FINANCIAL POSITIONAS AT 30 JUNE 2016
For
per
sona
l use
onl
y

06VISTA GROUP INTERNATIONAL LIMITED
30 JUNE 2016 30 JUNE 2015
NZ$’000 NZ$’000
NOTES UNAUDITED UNAUDITED
CASHFLOWS FROM OPERATING ACTIVITIES
Receipts from customers 38,495 30,486
Interest received 14 347
Operating expenses (35,744) (21,584)
Taxes paid (1,475) (1,695)
Interest paid (65) (92)
Net operating cashflow – net assets held for sale 561 -
Net cash inflow from operating activities 1,786 7,462
CASHFLOWS FROM INVESTING ACTIVITIES
Purchase of property, plant and equipment (603) (534)
Purchase of intangible assets (1,943) (2,093)
Loan to associate (1,306) -
Acquisition of a business, net of cash acquired (7,290) (6,174)
Net cash (applied to) investing activities (11,142) (8,801)
CASHFLOWS FROM FINANCING ACTIVITIES
Issue of ordinary shares, net of costs - -
Dividends paid to owners of the parent - -
Net cash inflow from financing activities - -
Net decrease in cash and short term deposits (9,356) (1,339)
Cash and short term deposits at 1 January 27,300 30,746
Foreign exchange differences (1,741) -
Cash and short term deposits at 30 June 16,203 29,407
Total cash and short terms deposits at end of period attributable to:
Cash within assets classified as held for sale 2 2,987 -
Cash within continuing operations 13,216 29,407
16,203 29,407
The above statement should be read in conjunction with the accompanying notes.
INTERIM STATEMENT OF CASH FLOWSSIX MONTHS ENDED 30 JUNE 2016
For
per
sona
l use
onl
y

07INTERIM REPORT 2016
1. BUSINESS COMBINATIONS
ACQUISITIONS IN 2016
Powster Limited
On 1 April 2016 Vista Group acquired a 50% shareholding in Powster. Powster is a London based business that
provides bespoke marketing concepts and creative solutions to the film and entertainment industry.
This strategic acquisition continues Vista Group’s strategy of creating a comprehensive suite of technology solutions
for the global film industry. Vista Group will benefit from Powster’s capability to deliver innovative digital marketing
and operational solutions for distributors and exhibitors and as a result it will enhance Vista Group’s product
offering to studios. Powster will benefit from potential cost efficiencies from being part of Vista Group as well
as leveraging Vista Group’s relationships across its geographies and customer base.
The terms of the acquisition achieves effective control of Powster via Vista Group’s ability to exercise majority
voting rights. Accordingly, the investment in Powster is treated as a subsidiary and consolidated as of the
acquisition date.
Details of the purchase consideration, the net assets acquired and goodwill are as follows:
NZ$’000
Cash 7,206
Contingent consideration 904
Total purchase consideration 8,110
The assets and liabilities recognised as a result of the acquisition are as follows:
NZ$’000
Property, plant and equipment 65
Cash on hand 1,999
Trade and other receivables 1,899
Tax payable (728)
Trade and other payables (135)
Net identifiable assets acquired 3,100
Non-controlling interest 1,550
Goodwill 6,560
Total purchase consideration 8,110
The fair value of accounts receivable is $1.54m with no bad debt provision required as all customer accounts are
deemed to be fully performing. The total amount of accounts receivable past due but not impaired was $973,000.
CONTINGENT CONSIDERATION
The purchase agreement includes contingent consideration. Contingent consideration is payable in two tranches
to be paid in April 2017 and April 2018 respectively. The payment tranches are based upon the achievement of
EBITDA2 for the FY2016 and FY2017 periods. For the purposes of quantifying the amounts payable for each
respective tranche, an estimate has been developed based on the expected performance of the Powster business
for these financial years. The assumptions used have been validated by senior management. The estimated
cashflows for each tranche have been discounted back to the balance date at a cost of capital of 8%, to be
unwound over the period of the tranche as a finance charge.
At the acquisition date, the fair value of the contingent consideration was estimated to be $0.9m. There has been no
change to this estimate as at 30 June 2016. The range of potential payment is between $0 and $3m (undiscounted).
NOTES TO THE INTERIM FINANCIAL STATEMENTS
(2) EBITDA is defined as earnings before depreciation, amortisation, net finance expenses and income tax.
For
per
sona
l use
onl
y

NOTES TO THE INTERIM FINANCIAL STATEMENTSCONTINUED
08VISTA GROUP INTERNATIONAL LIMITED
GOODWILL
Goodwill is attributable to Powster’s ability to enable Vista Group to increase the breadth of its product offering
to studios. Goodwill is also attributable to Powster’s cost efficiencies provided by access to Vista Group’s
infrastructure and customer network.
Vista Group elected to measure the non-controlling interest in the acquiree as a proportion of net assets acquired.
Revenue included in the consolidated income statement from 1 April 2016 to 30 June 2016 is $1.56m. Powster
contributed net profit before tax of $0.95m for the same period. Had Powster been consolidated from 1 January
2016 the impact on the statement of comprehensive income for the period ended 30 June 2016 would have been
an increase in revenue of $2.6m and an increase in net profit before tax of $1.2m.
The fair value of assets, liabilities and contingent consideration have been determined on a provisional basis due
to the recent nature of the acquisition.
Share Dimension B.V.
On 4 January 2016 Vista Group acquired a 50% shareholding in Share Dimension B.V. a Netherlands based software
development company. Share Dimension B.V. and its subsidiary S.C. Share Dimension S.R.L. are Dutch and Romanian
software development companies respectively, specialising in predictive analytics applications for cinema exhibitors.
Their flagship product Cinema Intelligence, offers a collection of modules aimed at optimising the scheduling of
films to increase the profitability of cinema exhibitors.
The strategic partnership presents benefits to both parties. Share Dimension gains market access opportunities
to Vista Group’s customer network, whilst Vista Group gains access to new and additional technology for its
customers. Creating a strong integration between the products will increase the velocity of the uptake of the
Share Dimension product.
Vista Group acquired a 50% shareholding in Share Dimension. Effective control of Share Dimension is achieved
as a result of Vista Group controlling the majority voting rights of the Supervisory Board. Accordingly, the
investment in Share Dimension is treated as a subsidiary and consolidated as of the acquisition date.
Details of the purchase consideration, the net assets acquired and goodwill are as follows:
NZ$’000
Cash 2,235
Total purchase consideration 2,235
The assets and liabilities recognised as a result of the acquisition are as follows:
NZ$’000
Property, plant and equipment 53
Intangible assets 419
Cash on hand 701
Trade and other receivables 409
Trade and other payables (568)
Net identifiable assets acquired 1,014
Non-controlling interest 507
Goodwill 1,728
Total purchase consideration 2,235
GOODWILL
Goodwill is attributable to integrating Share Dimension’s technology platform creating new opportunities and markets
for Vista Group.
For
per
sona
l use
onl
y
09INTERIM REPORT 2016
NOTES TO THE INTERIM FINANCIAL STATEMENTSCONTINUED
CONTINGENT CONSIDERATION
The purchase agreement includes contingent consideration. Contingent consideration is payable in two tranches
to be paid in April 2017 and April 2018 respectively. The payment tranches are based upon the achievement of
specified total revenue, recurring revenue and EBITDA2 targets for the FY2016 and FY2017 periods. Based on the
forecasts provided by Share Dimension, an estimate has been developed to calculate the amounts payable for both
these financial years. The calculation assumptions used have been validated by senior management. At acquisition
date and 30 June 2016 the fair value estimate of the contingent consideration payable is nil.
Vista Group elected to measure the non-controlling interest in the acquiree as a proportion of net assets acquired.
Revenue included in the consolidated income statement from 1 January 2016 to 30 June 2016 is $246,000. Share
Dimension contributed a net loss before tax of $732,000 for the same period.
The fair value of assets, liabilities and contingent consideration have been determined on a provisional basis due
to the recent nature of the acquisition.
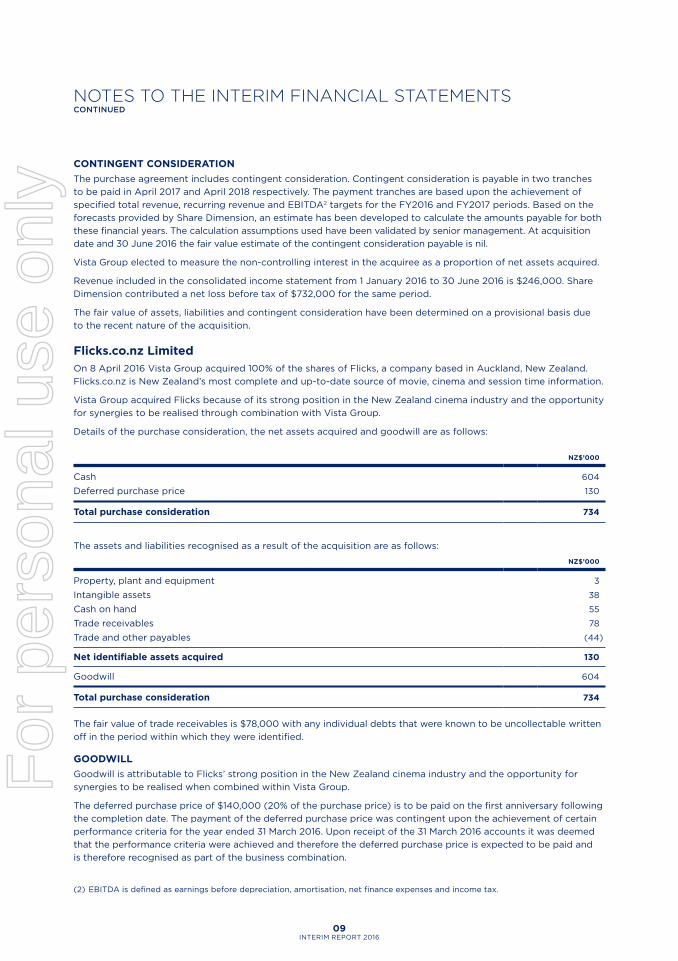
Flicks.co.nz Limited
On 8 April 2016 Vista Group acquired 100% of the shares of Flicks, a company based in Auckland, New Zealand.
Flicks.co.nz is New Zealand’s most complete and up-to-date source of movie, cinema and session time information.
Vista Group acquired Flicks because of its strong position in the New Zealand cinema industry and the opportunity
for synergies to be realised through combination with Vista Group.
Details of the purchase consideration, the net assets acquired and goodwill are as follows:
NZ$’000
Cash 604
Deferred purchase price 130
Total purchase consideration 734
The assets and liabilities recognised as a result of the acquisition are as follows:
NZ$’000
Property, plant and equipment 3
Intangible assets 38
Cash on hand 55
Trade receivables 78
Trade and other payables (44)
Net identifiable assets acquired 130
Goodwill 604
Total purchase consideration 734
The fair value of trade receivables is $78,000 with any individual debts that were known to be uncollectable written
off in the period within which they were identified.
GOODWILL
Goodwill is attributable to Flicks’ strong position in the New Zealand cinema industry and the opportunity for
synergies to be realised when combined within Vista Group.
The deferred purchase price of $140,000 (20% of the purchase price) is to be paid on the first anniversary following
the completion date. The payment of the deferred purchase price was contingent upon the achievement of certain
performance criteria for the year ended 31 March 2016. Upon receipt of the 31 March 2016 accounts it was deemed
that the performance criteria were achieved and therefore the deferred purchase price is expected to be paid and
is therefore recognised as part of the business combination.
(2) EBITDA is defined as earnings before depreciation, amortisation, net finance expenses and income tax.
For
per
sona
l use
onl
y
NOTES TO THE INTERIM FINANCIAL STATEMENTSCONTINUED
10VISTA GROUP INTERNATIONAL LIMITED
The deferred purchase price payment is discounted for one year at 8%. Therefore, the total amount recognised as
part of the business combination is $129,630 with the remaining $10,370 recognised as a finance charge over the
period 1 April 2016 to 31 March 2017.
The acquired business contributed revenues of $153,000 and net profit of $68,000 to Vista Group for the period
8 April 2016 to 30 June 2016. Had Flicks been consolidated from 1 January 2016 the impact on the statement of
comprehensive income for the period ended 30 June 2016 would have been an increase in revenue of $276,000
and an increase in net profit before tax of $102,000.
Virtual Concepts Limited (VCL) – acquisition of remaining 43% of share capital in 2014
The acquisition of the remaining 43% of VCL (trading as Movio) in August 2014 included contingent consideration
that was payable to the former owners in the form of cash and shares. Contingent consideration is payable in three
tranches on 1 April 2016, 1 April 2017 and 1 April 2018. As at 30 June 2016, the first tranche had been paid in line
with the estimate made at 31 December 2015 and amounted to $705,000 in cash and $1,644,000 in shares. At the
reporting date the fair value of the remaining contingent consideration is unchanged from the amounts recognised
at 31 December 2015, the two remaining tranches are currently expected to be paid on the dates specified above.
Further detail related to the acquisition of VCL is included in the 2015 Annual Report.
Ticketsoft
In April 2015, Vista Group acquired the assets of US based cinema software company Ticketsoft. The total
consideration to acquire the assets of Ticketsoft included contingent consideration of $1.8m, payable quarterly
through to September 2016. Payment is based upon the achievement of certain performance obligations, primarily
the number of sites transitioned to Vista software. During 2015 $0.5m was paid out as contingent consideration
based on sites deployed during that period.
At 30 June 2016, the estimated total pay-out under the contingent consideration has been adjusted down from
$1.8m to $1.4m. The updated calculation is based upon a revised estimate of the number of sites expected to transition.
The impact of $0.4m from the revised estimate is recognised through the Statement of Comprehensive Income.
PREVIOUS ACQUISITIONS
Details of acquisitions during the year ended 31 December 2015 are included in the 2015 Annual Report.
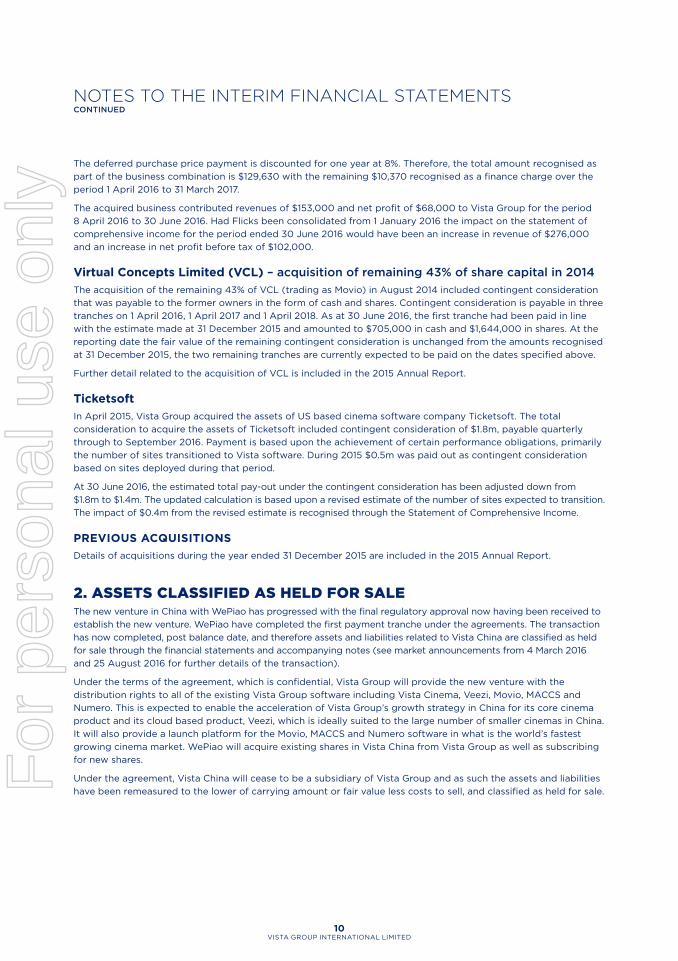
2. ASSETS CLASSIFIED AS HELD FOR SALEThe new venture in China with WePiao has progressed with the final regulatory approval now having been received to
establish the new venture. WePiao have completed the first payment tranche under the agreements. The transaction
has now completed, post balance date, and therefore assets and liabilities related to Vista China are classified as held
for sale through the financial statements and accompanying notes (see market announcements from 4 March 2016
and 25 August 2016 for further details of the transaction).
Under the terms of the agreement, which is confidential, Vista Group will provide the new venture with the
distribution rights to all of the existing Vista Group software including Vista Cinema, Veezi, Movio, MACCS and
Numero. This is expected to enable the acceleration of Vista Group’s growth strategy in China for its core cinema
product and its cloud based product, Veezi, which is ideally suited to the large number of smaller cinemas in China.
It will also provide a launch platform for the Movio, MACCS and Numero software in what is the world’s fastest
growing cinema market. WePiao will acquire existing shares in Vista China from Vista Group as well as subscribing
for new shares.
Under the agreement, Vista China will cease to be a subsidiary of Vista Group and as such the assets and liabilities
have been remeasured to the lower of carrying amount or fair value less costs to sell, and classified as held for sale.For
per
sona
l use
onl
y

11INTERIM REPORT 2016
NOTES TO THE INTERIM FINANCIAL STATEMENTSCONTINUED
The major classes of assets and liabilities for Vista China are as follows:
ASSETS CLASSIFIED AS HELD FOR SALE
30 JUNE 2016
NZ$’000
UNAUDITED
Total non-current assets 437
Cash 2,987
Trade and other receivables 3,488
Total current assets 6,475
Total assets 6,912
Total non-current liabilities (69)
Other current liabilities (2,262)
Trade and other payables (1,034)
Total liabilities (3,365)
Net assets classified as held for sale 3,547
An amount of $100,072 is held within the Foreign Currency Translation Reserve (FCTR) at 30 June 2016, related
to the Vista China entity.
3. SEGMENT REPORTINGVista Group operates in a single vertical film/cinema market and is structured through operating subsidiaries that
report monthly to the Chief Executive. The Board and the Chief Executive are considered to be the chief operating
decision maker in terms of NZ IFRS 8 Operating Segments.
Revenue is reported via three main sources – Product, Maintenance and Services and there is no material indirect
revenue source. No allocation of costs or assets is made against these revenue groups that would enable disclosure
of segmented information in this way.
Revenue is allocated to geographical segments on the basis of where the sale is recorded by each operating entity
within Vista Group. Independent resellers are used to promote the Vista products in multiple jurisdictions. The
revenues recognised via these independent resellers are not allocated geographically rather they are shown within
the Oceania segment.
Geographic InformationREVENUE
30 JUNE 2016 30 JUNE 2015
NZ$’000 NZ$’000
UNAUDITED UNAUDITED
Oceania 11,909 8,443
Asia 3,852 2,135
Americas 12,933 7,938
Europe/Africa 12,030 8,752
Total external revenue 40,724 27,268
No individual customer exceeded 10% of revenue in 2016 or 2015. For
per
sona
l use
onl
y

NOTES TO THE INTERIM FINANCIAL STATEMENTSCONTINUED
12VISTA GROUP INTERNATIONAL LIMITED
Non-current operating assets by location are presented in the following table:
Geographic Information
NON-CURRENT OPERATING ASSETS
30 JUNE 2016
31 DECEMBER 2015
NZ$’000 NZ$’000
UNAUDITED AUDITED
Oceania 41,101 26,981
Asia - 127
Americas 6,179 9,028
Europe/Africa 15,203 16,725
Total non-current operating assets 62,483 52,861
REVENUE BY TYPE
30 JUNE 2016 30 JUNE 2015
NZ$’000 NZ$’000
UNAUDITED UNAUDITED
Product 15,694 4,672
Maintenance 18,045 14,050
Services 6,425 8,546
Other 560 -
Total revenue 40,724 27,268
4. INTANGIBLE ASSETS
30 JUNE 2016
INTERNALLY GENERATED SOFTWARE
SOFTWARE LICENCES
INTELLECTUAL PROPERTY
CUSTOMER RELATIONSHIPS TOTAL
NZ$’000 NZ$’000 NZ$’000 NZ$’000 NZ$’000
UNAUDITED UNAUDITED UNAUDITED UNAUDITED UNAUDITED
Gross carrying amount
Balance 1 January 2016 643 2,260 1,608 6,469 10,980
Additions - 61 - 282 343
Internally generated software 1,139 - - - 1,139
Acquisition through business combinations (Note 1) - 38 419 - 457
Exchange differences 10 (24) (13) (40) (67)
Balance 30 June 2016 1,792 2,335 2,014 6,711 12,852
Accumulated amortisation
Balance 1 January 2016 - (523) (211) (1,094) (1,828)
Amortisation - (119) (120) (540) (779)
Balance 30 June 2016 - (642) (331) (1,634) (2,607)
Carrying amount 30 June 2016 1,792 1,693 1,683 5,077 10,245 F
or p
erso
nal u
se o
nly
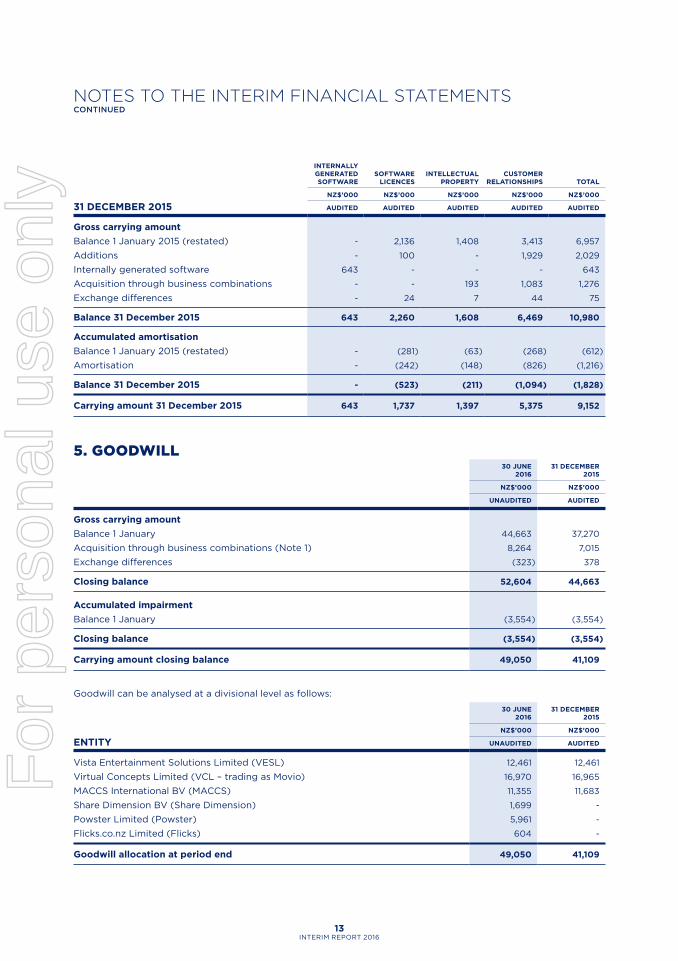
13INTERIM REPORT 2016
NOTES TO THE INTERIM FINANCIAL STATEMENTSCONTINUED
31 DECEMBER 2015
INTERNALLY GENERATED SOFTWARE
SOFTWARE LICENCES
INTELLECTUAL PROPERTY
CUSTOMER RELATIONSHIPS TOTAL
NZ$’000 NZ$’000 NZ$’000 NZ$’000 NZ$’000
AUDITED AUDITED AUDITED AUDITED AUDITED
Gross carrying amount
Balance 1 January 2015 (restated) - 2,136 1,408 3,413 6,957
Additions - 100 - 1,929 2,029
Internally generated software 643 - - - 643
Acquisition through business combinations - - 193 1,083 1,276
Exchange differences - 24 7 44 75
Balance 31 December 2015 643 2,260 1,608 6,469 10,980
Accumulated amortisation
Balance 1 January 2015 (restated) - (281) (63) (268) (612)
Amortisation - (242) (148) (826) (1,216)
Balance 31 December 2015 - (523) (211) (1,094) (1,828)
Carrying amount 31 December 2015 643 1,737 1,397 5,375 9,152
5. GOODWILL30 JUNE
201631 DECEMBER
2015
NZ$’000 NZ$’000
UNAUDITED AUDITED
Gross carrying amount
Balance 1 January 44,663 37,270
Acquisition through business combinations (Note 1) 8,264 7,015
Exchange differences (323) 378
Closing balance 52,604 44,663
Accumulated impairment
Balance 1 January (3,554) (3,554)
Closing balance (3,554) (3,554)
Carrying amount closing balance 49,050 41,109
Goodwill can be analysed at a divisional level as follows:
ENTITY
30 JUNE 2016
31 DECEMBER 2015
NZ$’000 NZ$’000
UNAUDITED AUDITED
Vista Entertainment Solutions Limited (VESL) 12,461 12,461
Virtual Concepts Limited (VCL – trading as Movio) 16,970 16,965
MACCS International BV (MACCS) 11,355 11,683
Share Dimension BV (Share Dimension) 1,699 -
Powster Limited (Powster) 5,961 -
Flicks.co.nz Limited (Flicks) 604 -
Goodwill allocation at period end 49,050 41,109
For
per
sona
l use
onl
y
NOTES TO THE INTERIM FINANCIAL STATEMENTSCONTINUED
14VISTA GROUP INTERNATIONAL LIMITED
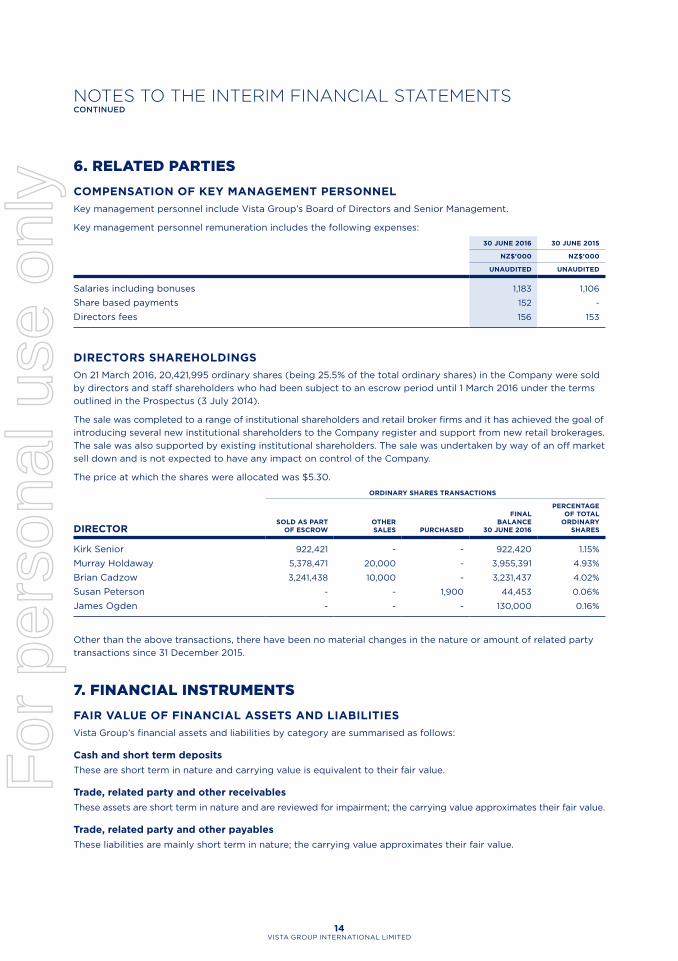
6. RELATED PARTIES
COMPENSATION OF KEY MANAGEMENT PERSONNEL
Key management personnel include Vista Group’s Board of Directors and Senior Management.
Key management personnel remuneration includes the following expenses:
30 JUNE 2016 30 JUNE 2015
NZ$’000 NZ$’000
UNAUDITED UNAUDITED
Salaries including bonuses 1,183 1,106
Share based payments 152 -
Directors fees 156 153
DIRECTORS SHAREHOLDINGS
On 21 March 2016, 20,421,995 ordinary shares (being 25.5% of the total ordinary shares) in the Company were sold
by directors and staff shareholders who had been subject to an escrow period until 1 March 2016 under the terms
outlined in the Prospectus (3 July 2014).
The sale was completed to a range of institutional shareholders and retail broker firms and it has achieved the goal of
introducing several new institutional shareholders to the Company register and support from new retail brokerages.
The sale was also supported by existing institutional shareholders. The sale was undertaken by way of an off market
sell down and is not expected to have any impact on control of the Company.
The price at which the shares were allocated was $5.30.
DIRECTOR
ORDINARY SHARES TRANSACTIONS
SOLD AS PART OF ESCROW
OTHER SALES PURCHASED
FINAL BALANCE
30 JUNE 2016
PERCENTAGE OF TOTAL
ORDINARY SHARES
Kirk Senior 922,421 - - 922,420 1.15%
Murray Holdaway 5,378,471 20,000 - 3,955,391 4.93%
Brian Cadzow 3,241,438 10,000 - 3,231,437 4.02%
Susan Peterson - - 1,900 44,453 0.06%
James Ogden - - - 130,000 0.16%
Other than the above transactions, there have been no material changes in the nature or amount of related party
transactions since 31 December 2015.
7. FINANCIAL INSTRUMENTS
FAIR VALUE OF FINANCIAL ASSETS AND LIABILITIES
Vista Group’s financial assets and liabilities by category are summarised as follows:
Cash and short term deposits
These are short term in nature and carrying value is equivalent to their fair value.
Trade, related party and other receivables
These assets are short term in nature and are reviewed for impairment; the carrying value approximates their fair value.
Trade, related party and other payables
These liabilities are mainly short term in nature; the carrying value approximates their fair value.
For
per
sona
l use
onl
y

15INTERIM REPORT 2016
NOTES TO THE INTERIM FINANCIAL STATEMENTSCONTINUED
Loan and advances
Fair value is estimated based on current market interest rates available for receivables of similar maturity and risk.
The interest rate is used to discount future cash flows.
Borrowings
Borrowings have fixed and floating interest rates. Fair value is estimated using the discounted cash flow model
based on a current market interest rate for similar products; the carrying value approximates their fair value.
Fair values
Vista Group’s financial instruments that are measured subsequent to initial recognition at fair values and are
grouped into levels based on the degree to which the fair value is observable:
Level 1 – fair value measurements derived from quoted prices in active markets for identical assets.
Level 2 – fair value measurements derived from inputs other than quoted prices included within level 1 that are
observable for the asset or liability, either directly or indirectly.
Level 3 – fair value measurements derived from valuation techniques that include inputs for the asset or liability
which are not based on observable market data.
CONTINGENT CONSIDERATION
The fair value of the contingent consideration on Ticketsoft, Powster and Share Dimension has been assessed
as level 3. Amounts related to Ticketsoft were not discounted as the due date for payment lies within the current
financial year. Amounts related to Powster and Share Dimension have been discounted. There have been no
transfers between levels or changes in the valuation methods used to determine the fair value of Vista Group’s
financial instruments during the period. Sensitivities to reasonably possible changes in non-market observable
valuation inputs would not have a material impact on Vista Group’s financial results.
FINANCIAL INSTRUMENTS BY CATEGORY
30 JUNE 2016
31 DECEMBER 2015
NZ$’000 NZ$’000
UNAUDITED AUDITED
Loans and receivables
Cash 13,176 16,863
Short term deposits 40 10,437
Trade receivables 24,853 23,653
Sundry receivables 4,376 2,163
Related party receivables 4,260 3,410
46,705 56,526
Financial liabilities measured at amortised cost
Trade payables 1,435 762
Sundry accruals 2,025 2,918
Borrowings 4,694 4,792
Financial liabilities measured at fair value
Contingent consideration 1,830 1,253
9,984 9,725
For
per
sona
l use
onl
y
NOTES TO THE INTERIM FINANCIAL STATEMENTSCONTINUED
16VISTA GROUP INTERNATIONAL LIMITED
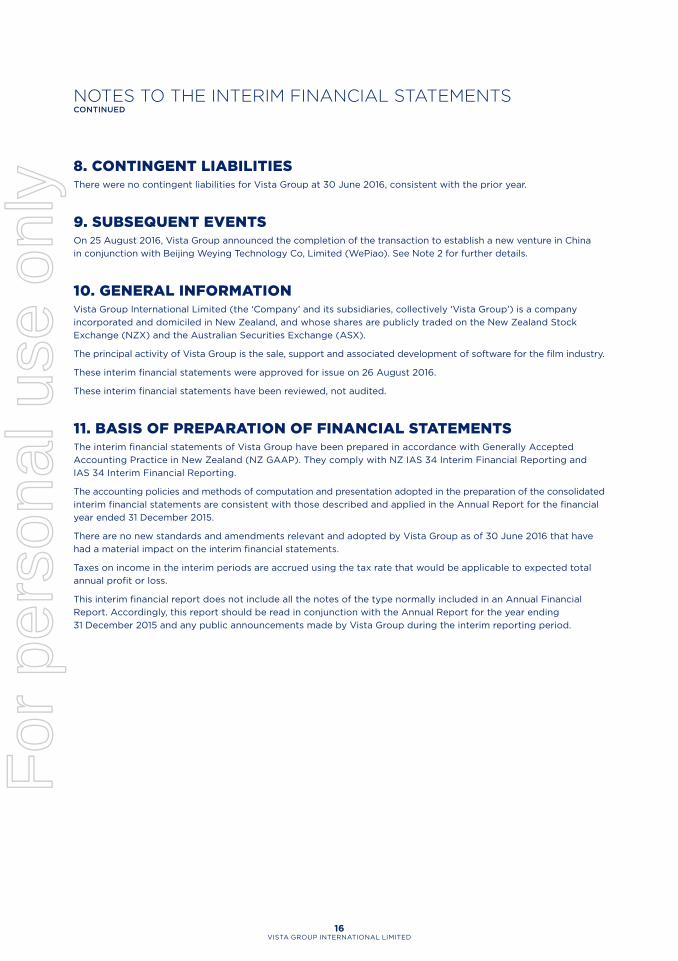
8. CONTINGENT LIABILITIESThere were no contingent liabilities for Vista Group at 30 June 2016, consistent with the prior year.
9. SUBSEQUENT EVENTS On 25 August 2016, Vista Group announced the completion of the transaction to establish a new venture in China
in conjunction with Beijing Weying Technology Co, Limited (WePiao). See Note 2 for further details.
10. GENERAL INFORMATIONVista Group International Limited (the ‘Company’ and its subsidiaries, collectively ‘Vista Group’) is a company
incorporated and domiciled in New Zealand, and whose shares are publicly traded on the New Zealand Stock
Exchange (NZX) and the Australian Securities Exchange (ASX).
The principal activity of Vista Group is the sale, support and associated development of software for the film industry.
These interim financial statements were approved for issue on 26 August 2016.
These interim financial statements have been reviewed, not audited.
11. BASIS OF PREPARATION OF FINANCIAL STATEMENTS The interim financial statements of Vista Group have been prepared in accordance with Generally Accepted
Accounting Practice in New Zealand (NZ GAAP). They comply with NZ IAS 34 Interim Financial Reporting and
IAS 34 Interim Financial Reporting.
The accounting policies and methods of computation and presentation adopted in the preparation of the consolidated
interim financial statements are consistent with those described and applied in the Annual Report for the financial
year ended 31 December 2015.
There are no new standards and amendments relevant and adopted by Vista Group as of 30 June 2016 that have
had a material impact on the interim financial statements.
Taxes on income in the interim periods are accrued using the tax rate that would be applicable to expected total
annual profit or loss.
This interim financial report does not include all the notes of the type normally included in an Annual Financial
Report. Accordingly, this report should be read in conjunction with the Annual Report for the year ending
31 December 2015 and any public announcements made by Vista Group during the interim reporting period.
For
per
sona
l use
onl
y

VISTA GROUP INTERNATIONAL LIMITEDLevel 3, 60 Khyber Pass Road
Newton, Auckland 1023
Phone: +64 9 984 4570 Fax: +64 9 379 0685
Email: [email protected] Website: www.vistagroup.co.nz
For
per
sona
l use
onl
y
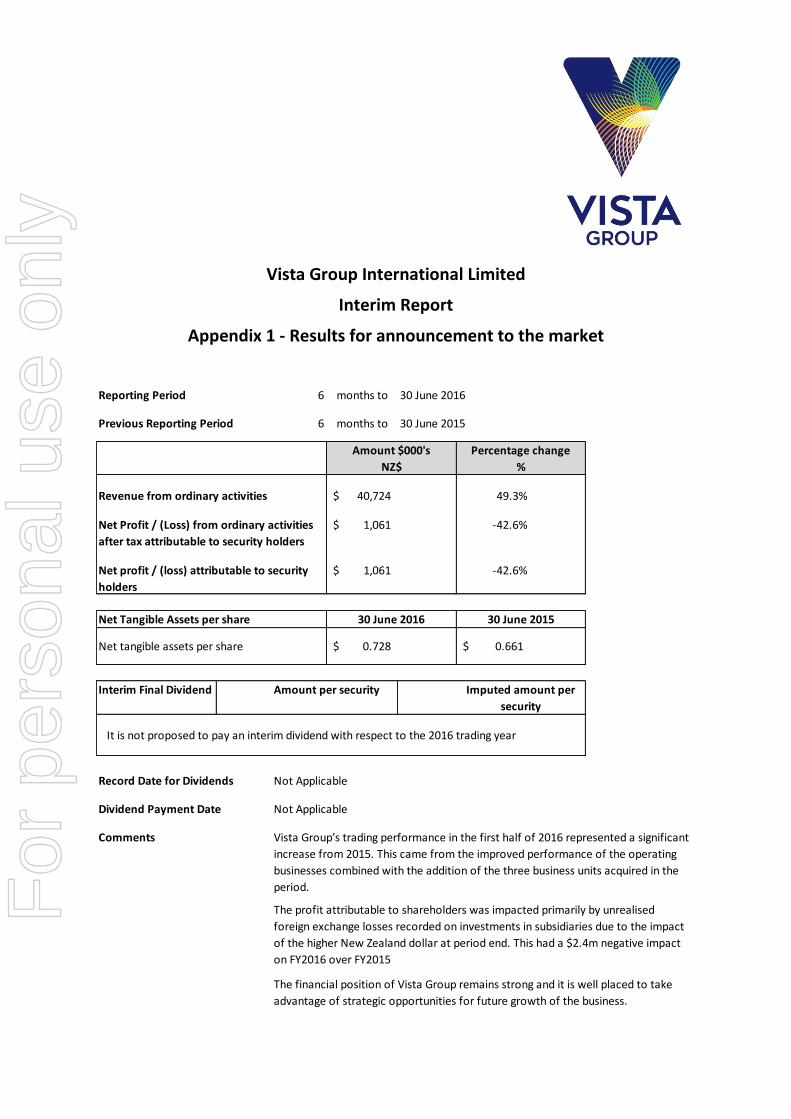
Vista Group International Limited
Interim Report
Appendix 1 - Results for announcement to the market
Reporting Period 6 months to 30 June 2016
Previous Reporting Period 6 months to 30 June 2015
Revenue from ordinary activities 40,724$ 49.3%
1,061$ -42.6%
1,061$ -42.6%
0.728$ 0.661$
Interim Final Dividend Amount per security
Record Date for Dividends Not Applicable
Dividend Payment Date Not Applicable
Comments
The financial position of Vista Group remains strong and it is well placed to take
advantage of strategic opportunities for future growth of the business.
Amount $000's
NZ$
Percentage change
%
Vista Group’s trading performance in the first half of 2016 represented a significant
increase from 2015. This came from the improved performance of the operating
businesses combined with the addition of the three business units acquired in the
period.
Net Profit / (Loss) from ordinary activities
after tax attributable to security holders
Net profit / (loss) attributable to security
holders
Imputed amount per
security
It is not proposed to pay an interim dividend with respect to the 2016 trading year
Net Tangible Assets per share
Net tangible assets per share
30 June 201530 June 2016
The profit attributable to shareholders was impacted primarily by unrealised
foreign exchange losses recorded on investments in subsidiaries due to the impact
of the higher New Zealand dollar at period end. This had a $2.4m negative impact
on FY2016 over FY2015
For
per
sona
l use
onl
y