Embed Size (px)
Citation preview

ANNUAL REPORT
2019
For
per
sona
l use
onl
y

Financial Summary
JB Hi-Fi Limited ABN 80 093 220 136
Sales $7.10b
NPAT $249.8m Stores
EBIT $372.8m
FINANCIAL PERFORMANCE2015
Statutory
2016
Statutory
2017(i)
Statutory
2017(i)
Underlying(ii)
2018
Statutory
2019
Statutory
Growth
Underlying
Sales $3.65b $3.95b $5.63b $5.63b $6.85b $7.10b 3.5%
EBIT $200.9m $221.2m $268.2m $306.3m $350.6m $372.8m 6.4%
NPAT $136.5m $152.2m $172.4m $207.7m $233.2m $249.8m 7.1%
Earnings per share 137.9cps 153.8cps 154.3cps 186.0cps 203.1cps 217.4cps 7.1%
Total dividend - fully franked 90.0cps 100.0cps 118cps 118cps 132cps 142cps 7.6%
(i) JB Hi-Fi acquired The Good Guys on 28 November 2016, all amounts disclosed for the 2017 fi nancial year include The Good Guys for the period under JB Hi-Fi ownership.
(ii) Underlying results exclude transaction fees and implementation costs totaling $22.4m associated with the acquisition of The Good Guys inNovember 2016 and $15.8m of fi xed asset and goodwill impairments in New Zealand.
2015 2016 2017 2018 2019 2015 2016 2017 2018 2019
$200.9m
$5.63b(i)
2015 2016 2017 2018 2019 2015 2016 2017 2018 2019
187
303
$136.5m
$3.65b
$3.95b
$152.2m
194
$221.2m
$306.3m(i)(ii)
$207.7m(i)(ii)
$6.85b
311
$350.6m
$233.2m
$7.10b $372.8m
$249.8m
315
For
per
sona
l use
onl
y
1
Dear fellow shareholder,
FY19 has been a strong year for JB Hi-Fi Limited. It is very
satisfying to report that the year ended 30 June 2019 was
another record year with sales, profits and dividends all up on
the prior year. The 2019 result was driven by a combination of
sales growth and our low cost of doing business, underpinned
by our ongoing emphasis on customer service.
Group Overview
JB Hi-Fi Limited and its subsidiaries (the “Group”), comprises
two leading retail brands: JB Hi-Fi, with a focus on Technology
and Consumer Electronics; and The Good Guys with a focus
on Home Appliances and Consumer Electronics.
The value proposition for each brand centres around ranging
the best brands at low prices supported by exceptional
customer service across our 315 store network, online offering
and through our commercial channels, JB Hi-Fi Solutions and
The Good Guys Commercial.
The dual branded retail approach is underpinned by five key
enablers that provide the Group with a unique competitive
advantage, those being:
• scale;
• a low cost operating model evidenced by the Group’s
low CODB;
• quality store locations;
• strong supplier partnerships; and
• our multichannel capabilities.
The Group achieved sales of $7.1 billion in FY19, up 3.5% on
the prior year. EBIT was up 6.4% to $372.8 million and NPAT
was up 7.1% to $249.8 million. Earnings per share was up
7.1% to 217.4 cents per share and the total dividend for FY19
was up 10 cents per share to 142 cents per share.
Brand Overview
JB Hi-Fi Australia
JB Hi-Fi Australia total sales grew 4.1% to $4.73 billion, with
comparable sales up 2.8%. Online sales grew 23.0% to
$258.0 million or 5.5% of total sales, as the Online offer
continued to evolve. JB Hi-Fi Solutions recorded double digit
sales growth and remains on track to deliver on its longer term
aspirational sales target of approximately $500 million
per annum.
Gross profit increased by 3.9% to $1.05 billion resulting in a
gross margin of 22.1%. CODB was 14.9%, up 7 bps on the
prior year. Total operating costs remained well controlled as
the business managed costs in line with sales and continued
to focus on customer service, invest in strategic initiatives
and manage increased volumes through the store network.
The business’s low CODB remains a competitive advantage
and is maintained through our continued focus on productivity
and minimising unnecessary expenditure.
Sales growth, combined with cost control and lower
depreciation as the business managed its investment in the
store network, drove solid EBIT growth. EBIT was up 3.2%
to $301.7 million with EBIT margin down 6 bps at 6.4%.
JB Hi-Fi New Zealand
Total sales were up 2.0% to NZD236.2 million, with
comparable sales up 8.2%. Online sales grew 38.3% to
NZD13.3 million or 5.6% of total sales as the business
benefited from the improved online platform. Gross margin was
17.3%, down 37 bps on the prior year and CODB was 16.7%,
down 57 bps on the prior year. EBIT was (NZD1.9 million), up
NZD1.0 million or 34.3%.
The Good Guys
Total sales grew 2.2% to $2.15 billion, with comparable sales
up 0.9%. Online sales grew 3.7% to $130.9 million or 6.1%
of total sales, with strong sales on The Good Guys website
partially offset by a decline in third party marketplace sales.
Gross profit was $442.7 million with gross margin up 33 bps to
20.6%. 2HY19 gross margin was up 88 bps as the business
benefited from initiatives put in place over the last twelve
months and cycled strong price competition in the prior year.
Sales growth, combined with gross margin expansion and
lower depreciation as significant pre-acquisition IT investment
is now fully amortised, drove strong EBIT growth. EBIT was up
19.8% to $72.9 million with EBIT margin up 50 bps to 3.4%.
Stores
The Group had 315 stores in Australia and New Zealand at
30 June 2019, with 196 JB Hi-Fi Australia stores, 14 JB Hi-Fi
New Zealand stores and 105 The Good Guys stores.
We continue to both review our existing store portfolio and to
apply stringent store selection criteria to potential new sites to
ensure that they offer a high level of foot traffic and convenient
access for customers. This considered approach to our existing
and new store locations means stores should continue to
deliver comfortably in excess of their cost of capital.
Chairman’s and Group Chief Executive Offi cer’s Report
For
per
sona
l use
onl
y

2
Total Stores: 315*
14JB Hi-Fi Australia: 196
JB Hi-Fi New Zealand: 14
The Good Guys: 105
1
3
3
5
30
63
28 51
23
39
5
10
14
23
1
2
* As at 30 June 2019
Group Balance Sheet, Capital Management and
Dividends
The balance sheet continues to grow in strength with relatively
low financial and operating leverage, evidenced by our solid
fixed charges cover of 3.0 times, gearing of 1.0 and interest
cover of 26.1 times.
JB Hi-Fi Limited regularly reviews all aspects of its capital
structure with a focus on maximising returns to shareholders.
Continued solid earnings growth and prudent management of
our balance sheet, including relatively low gearing, provides the
ability to maintain and optimise our capital structure.
The Board has declared a final dividend of 51 cents per share
fully franked, bringing the total dividend for FY19 to 142 cents
per share, up 10 cents per share on the prior year. The Board
believes that our dividend payout ratio of 65% appropriately
balances the distribution of profit to shareholders, the
repayment of debt and the reinvestment of earnings for
future growth.
90100
118
Dividend up 7.6% to 142 cps
Dividends per Share (cents)
FY15 FY16 FY17 FY18 FY19
132142
Board and Management Approach
The Board recognises the importance of governance,
environmental and social matters to our shareholders,
suppliers and customers and continually reviews and monitors
developments in corporate governance which are relevant
to the Group. The Board is committed to ensuring that the
Group’s business is conducted ethically and in accordance
with high standards of corporate governance. To this end, the
Group has a Code of Conduct that provides guidance on what
the Group deems to be acceptable behaviour.
The relationship between the Board and management is
strong and remains engaging and constructive. It continues
to be an integral part of the Board’s strategy to encourage
innovation and diversification with new products, technology,
merchandising formats, advertising and property locations in
a controlled and responsible manner. This approach provides
opportunities to increase revenue, margin and productivity.
The Board firmly believes that equity participation for
management through the Group’s share ownership-based
remuneration schemes create strong alignment with shareholders
and are a critical tool in attracting new management, retaining
existing management and rewarding performance. In FY19
the Board introduced a new variable reward plan for group
executives and a minimum shareholding requirement for group
executives and non-executive directors, further strengthening the
alignment between the Board, management and shareholders.
The Group recognises the importance of diversity. The Board
believes that the different perspectives arising from diversity
encourage an innovative, responsive, productive and competitive
business and creates value for our customers and shareholders.
The Group has a Diversity Policy and the Board sets objectives
in relation to gender diversity.
The Group has introduced a number of initiatives to encourage
gender diversity and assist in achieving our diversity objectives,
including the introduction of a paid maternity leave scheme,
development of part time and flexible work practices and the
introduction of a domestic violence policy and paid domestic
violence leave program.
Workplace Giving Programs
The Group has workplace giving programs in place that
enable directors, executives and employees to donate to
registered charitable organisations through our payroll system.
The Group matches dollar for dollar these regular employee
contributions, effectively doubling the financial benefit to our
community partners.
Workplace giving programs have proved to be a very effective
way for employers and employees to join together to support
the community. Through the combined giving of the Group and
its employees, we believe we can make a real difference to the
charities in the program.
CHAIRMAN’S AND GROUP CHIEF EXECUTIVE OFFICER’S REPORT (continued)
For
per
sona
l use
onl
y

3
JB Hi-Fi Australia
In FY19, the JB Hi-Fi business celebrated its 10-year
anniversary of the introduction of its workplace giving
program, known as Helping Hands. The Helping Hands
program was awarded Best Overall Program and Most
Innovative Charity/Employer Partnership at the 2016 and
2017 Workplace Giving Awards and was awarded silver in
2018 Best Overall Program category.
Each week around 6,500 or 78% of the JB Hi-Fi Australia
employees give to the program, which makes it one of the
most successful workplace giving programs in Australia.
This year almost $2.6 million has been raised and, since its
inception, the JB Hi-Fi business and its employees are proud
to have raised more than $16.3 million.
JB Hi-Fi New Zealand
The Helping Hands program was launched in New Zealand in
May 2012 and involves over 280 employees (approximately
60% of JB Hi-Fi New Zealand employees) each making weekly
contributions. This year, for the first time, over $100,000 was
raised and, since its inception, over $500,000 has been raised.
The Good Guys
The Good Guys workplace giving program was launched in
July 2017 and is known as The Good Guys Doing Good.
This year the program has donated over $376,000 to
14 national charity partners as a result of contributions from
approximately 52% of The Good Guys employees.
Outlook
In FY20 the Group expects total group sales to be circa
$7.25 billion, comprising:
• JB Hi-Fi Australia $4.84 billion;
• JB Hi-Fi New Zealand (NZD) $0.24 billion; and
• The Good Guys $2.18 billion.
Whilst we continue to see variability in the sales environment,
we enter FY20 confident in our ability to execute and grow
market share.
The key success drivers of the Group continue to be having
the biggest range and the lowest prices, supported by a
talented and enthusiastic team of over 12,500 team members
across Australia and New Zealand. Our team members are
our number one asset and our most important competitive
advantage, their dedication and knowledge continues to delight
our customers everyday.
We look forward to another successful year in FY20.
Greg Richards Richard Murray
Chairman Group Chief Executive Officer
Melbourne,
27 August 2019
For
per
sona
l use
onl
y

JB Hi-Fi Limited ABN 80 093 220 136
Page
Governance, environmental and social statements 5
Directors’ report 18
Operating and fi nancial review 23
Remuneration report 32
Auditor’s independence declaration 57
Independent auditor’s report 58
Directors’ declaration 62
Statement of profi t or loss 63
Statement of profi t or loss and other comprehensive income 64
Balance sheet 65
Statement of changes in equity 66
Statement of cash fl ows 67
Notes to the fi nancial statements 68
Additional securities exchange information 103
Annual Reportfor the fi nancial year ended 30 June 2019
4
For
per
sona
l use
onl
y

5
JB Hi-Fi Limited (“the Company” or “JB Hi-Fi”) recognises the importance of Governance, Environmental and Social matters to our
shareholders, suppliers and customers. The Board continually reviews and monitors developments in corporate governance which
are relevant to the Group (being the consolidated entity consisting of the Company and the entities it controls).
CORPORATE GOVERNANCE STATEMENT
The directors and management of the Group are committed to ensuring that the Group’s business is conducted ethically and in
accordance with high standards of corporate governance.
The Board believes that:
• the Group’s policies and practices comply in all material respects with the 3rd edition of the ASX Corporate Governance
Council Principles and Recommendations (the “ASX Recommendations”); and
• during the 2019 fi nancial year, it has been compliant with the spirit of the principles contained in the ASX Recommendations.
The Company is currently reviewing its policies and practices in view of the recent release of the 4th edition of the ASX Corporate
Governance Council Principles and Recommendations, noting that compliance with the 4th edition is required by FY2021.
This Corporate Governance Statement has been approved by the Board and is effective as at 12 August 2019.
THE BOARD
Role
The primary role of the Board is to protect and enhance long-term shareholder value. The Board is accountable to shareholders for
the performance of the Company and it directs and monitors the business and affairs of the Group on behalf of shareholders.
The Board’s responsibilities include: overseeing the business and affairs of the Group; setting (in consultation with management)
the strategic and financial objectives of the Group and overseeing management’s implementation of these objectives; monitoring
the performance of management; approving the adoption of the Group’s major corporate governance policies; reviewing the
Group’s policies on risk oversight and management; overseeing the reliability and integrity of the Group’s accounting, financial
reporting and financial management and disclosure practices; overseeing the Group’s process for making disclosure to the market;
and the establishment of a formal and transparent procedure for the selection, appointment and review of directors.
The Group Chief Executive Officer, who is accountable to the Board, is responsible for managing, directing and promoting the
profitable operation and development of the Group.
A copy of the Board Charter can be found on the Company’s investor website at https://investors.jbhifi.com.au via the “Investors”
and “Corporate Governance” sections.
Composition of the Board / Selection and appointment of directors
The Board seeks to ensure that the combination of its members provides an appropriate range of experience, skills, diversity,
knowledge and perspective to enable it to carry out its obligations and responsibilities.
The Board believes that having a range of different skills, backgrounds, experience and gender ensures a diversity of viewpoints
which facilitate effective governance and decision making.
The Company believes that skills and experience in the areas listed below are desirable for the Board to perform its role effectively.
The Board considers that its current composition possesses an effective blend of these skills and experience which enables it and
its Committees to effectively govern the business, operate effectively and add value in the context of the Company’s strategy.
• Executive/Management experience
• Retail expertise and experience
• Operational Management expertise and experience
• Financial expertise
• Property expertise
• Mergers & Acquisitions expertise and experience
• Governance expertise and experience
• Other board experience
• Experience in setting executive remuneration
• Risk Management expertise and experience
GOVERNANCE, ENVIRONMENTAL AND SOCIAL STATEMENTS
For
per
sona
l use
onl
y

6
The Company maintains a majority of non-executive directors on its Board. The Board currently comprises seven directors,
being six non-executive directors, including the Chairman, and one executive director, being the Group Chief Executive Officer.
The Company has written agreements with each director setting out the terms of their appointment. Apart from the Group Chief
Executive Officer, directors are subject to shareholder re-election by rotation at least every three years. The Company provides
shareholders with all material information in its possession relevant to the election or re-election of a director.
A copy of the Company’s Board Composition & Succession Policy, which includes the procedure for the selection and
appointment of directors, can be found on the Company’s investor website at https://investors.jbhifi.com.au via the “Investors” and
“Corporate Governance” sections. The Board will undertake appropriate checks before appointing any person or putting forward to
shareholders a candidate for election as a director.
Details of the directors as at the date of this report, including further information about their experience, expertise and term of
office, are set out in the Directors’ Report.
Independence
The Company considers that each of its directors (including the Chairman) is independent with the exception of Richard Murray,
the Group Chief Executive Officer.
The Board regards directors as independent directors if they: do not have a material relationship with the Company other than
solely as a result of being a director; are independent of management; and do not have any business or other relationship that
could compromise the independent exercise of their judgement and their ability to act in the best interests of the Company.
The independence of each director is considered on a case-by-case basis.
Richard Uechtritz was Chief Executive Officer of the Company between July 2000 and May 2010 and a consultant to the Company
from May 2010 to November 2013. Given the passage of time, the Board is of the opinion that Richard is an independent
director, and that neither these previous roles, nor his relationship with current management, compromises his ability to exercise
independent, unfettered judgement or act in the best interests of the Company.
Beth Laughton is a non-executive director and chair of the audit, compliance & risk management committee of GPT Funds
Management Limited (“GPTFM”), the responsible entity for the GPT Wholesale Shopping Centre Fund. Wai Tang is a
non-executive director and member of the audit committee and the risk & compliance committee of Vicinity Limited. Mark Powell
is a non-executive director and member of the audit & risk management committee of Kiwi Property Group Limited. The Board
notes that each of the GPT Wholesale Shopping Centre Fund, Vicinity Limited and Kiwi Property Group Limited have ownership
interests in shopping centres in which the Company currently leases stores. The Board is of the opinion that Beth, Wai and Mark
are independent directors on the basis that individual leasing arrangements at the Company, GPTFM, Vicinity Limited and Kiwi
Property Group Limited are generally determined at a managerial level rather than Board level.
Wai Tang is a non-executive director of ASX listed Ovato Limited which provides catalogue printing services to the Group.
The Board is of the opinion that Wai is an independent director on the basis that these arrangements are determined at a
managerial level rather than Board level.
In addition, the Company’s internal protocols provide that Beth, Wai and Mark would be excluded from any discussion and
decision making where any conflict of interest arises between their roles as a director of the Company and of GPTFM/Vicinity
Limited/Kiwi Property Group Limited/Ovato Limited.
Confl ict of interest
If a conflict of interest arises, the director concerned does not receive the relevant Board papers, is not present at the meeting
whilst the item is considered and takes no part in decision making. Directors must keep the Board advised, on an ongoing basis,
of any interests that could potentially conflict with those of the Company. Directors are required to promptly disclose to the Board
interests in contracts, other directorships or offices held, possible related party transactions and any other material personal
interests in a matter relating to the Company’s affairs.
GOVERNANCE, ENVIRONMENTAL AND SOCIAL STATEMENTS (continued)
For
per
sona
l use
onl
y

7
Board meetings
The Board meets regularly, dependent on business requirements. Prior to any meeting, the directors receive all necessary Board
papers. As well as holding regular Board meetings, the Board also meets to comprehensively review business plans and the
strategy of the Group.
Access to information and independent advice
Each director has the right of access to all relevant Company information and to the Group’s executives. Subject to prior
consultation with the Chairman, each director may seek independent professional advice at the Company’s expense.
Professional development of directors
The Company recognises the need for its directors to develop and maintain the skills and knowledge needed to perform their roles
as directors effectively. The Company provides the directors with briefings and advice on developments in both the law and current
practice in areas relevant to the Company and their role as directors (including, for example, corporate governance, accounting
and remuneration). The Company does this using both the Company’s external advisors (including the Company’s auditors, legal
and remuneration advisors) and management (including the Group Chief Financial Officer and the Company Secretary & General
Counsel). Individual directors also take advantage of professional development opportunities provided by third parties such as the
Australian Institute of Company Directors and major accounting and legal firms.
The Company has an induction program for new directors.
BOARD COMMITTEES
Details of the Committees established by the Board are set out below.
Audit and Risk Management Committee
The Board has established an Audit and Risk Management Committee.
The Audit and Risk Management Committee is charged primarily with assisting the Board in its:
• oversight of the reliability and integrity of the Group’s financial management, financial reporting and disclosure, and related
non-financial reporting and disclosure practices;
• oversight of the independence, performance, appointment and removal of the external auditor; and
• review of the Group’s policies on risk oversight and management, and in discharging its responsibility to satisfy itself that an
adequate and sound system of risk management and internal control has been implemented to manage the material risks
affecting the Group’s business, including compliance with all applicable laws.
A copy of the Audit and Risk Management Committee Charter can be found on the Company’s investor website at
https://investors.jbhifi.com.au via the “Investors” and “Corporate Governance” sections.
During the 2019 financial year, the Audit and Risk Management Committee comprised the following non-executive directors, all of
whom were independent with relevant financial, commercial and risk management experience, including an independent chair who
is not the Chair of the Board:
• Beth Laughton: Ongoing member and Chair of Committee;
• Wai Tang: Ongoing member of Committee;
• Stephen Goddard: Ongoing member of Committee; and
• Mark Powell: Ongoing member of Committee.
Details of the background and experience of each of these non-executive directors are outlined in the Directors’ Report.
The Audit and Risk Management Committee meets regularly. Details of the meetings held and members’ attendance during
the 2019 financial year are listed in the Directors’ Report. Directors who are not members of the Audit and Risk Management
Committee may attend any Audit and Risk Management Committee meeting.
For
per
sona
l use
onl
y

8
Remuneration Committee
The Board has established a Remuneration Committee.
The Remuneration Committee is charged primarily with reviewing and making recommendations to the Board regarding the
framework, structure and quantum of remuneration of executive officers and non-executive directors.
A copy of the Remuneration Committee Charter can be found on the Company’s investor website at https://investors.jbhifi.com.au
via the “Investors” and “Corporate Governance” sections.
During the 2019 financial year, the Remuneration Committee comprised the following directors, each of whom are considered by
the Company to be independent:
• Greg Richards: Ongoing member and Chair of Committee;
• Beth Laughton: Ongoing member of Committee; and
• Wai Tang: Ongoing member of Committee.
The Remuneration Committee meets as required. Details of the meetings held and members’ attendance during the 2019
financial year are listed in the Directors’ Report. Directors who are not members of the Remuneration Committee may attend a
Remuneration Committee meeting at the invitation of the Chairman when considered appropriate.
Nominations Committee
The Board has decided not to establish a Nominations Committee. Rather, the Board itself is responsible for:
• establishing formal and transparent procedures for the selection and appointment of new directors to the Board;
• appointment of directors to fill vacancies or as additional directors and ensuring that the Board has the appropriate balance
of skills, knowledge, experience, independence and diversity to enable it to discharge its duties and responsibilities effectively
(including the process for recruiting new directors);
• induction programs for new directors;
• selecting, appointing and regularly evaluating the performance of, and planning for the succession of, the Group Chief
Executive Officer; and
• ensuring that internal procedures are in place for evaluating Board performance and the performance of individual directors and
Board Committees.
A copy of the Board Charter and the Board Composition & Succession Policy can be found on the Company’s investor website at
https://investors.jbhifi.com.au via the “Investors” and “Corporate Governance” sections.
COMPANY SECRETARY
The Company Secretary is accountable directly to the Board, through the Chair, on all matters to do with the proper functioning of
the Board.
CODE OF CONDUCT
The Group acknowledges the need for directors, executives and employees to observe the highest ethical standards of corporate
behaviour. The Group has adopted a Code of Conduct to provide directors, executives and employees with guidance on what the
Group deems to be acceptable behaviour.
A copy of the Code of Conduct can be found on the Company’s investor website at https://investors.jbhifi.com.au via the
“Investors” and “Corporate Governance” sections.
WHISTLEBLOWER POLICY
The Group has recently adopted a Whisteblower Policy which will be launched in the businesses in August 2019. The Group
will ensure that the Board and/or Audit and Risk Management Committee is informed of any material incidents reported under
this Policy.
GOVERNANCE, ENVIRONMENTAL AND SOCIAL STATEMENTS (continued)
For
per
sona
l use
onl
y

9
DIVERSITY
The Group recognises the importance of diversity and values the competitive advantage that is gained from a diverse range of
skills, backgrounds, experience and gender at all levels of the organisation. The Group has a Diversity Policy which is available on
the Company’s investor website at https://investors.jbhifi.com.au via the “Investors” and “Corporate Governance” sections.
The Diversity Policy states that the Group appreciates that the different perspectives arising from diversity encourage an innovative,
responsive, productive and competitive business and create value for our customers and shareholders. The Group’s objective is
that Board appointments, employment and advancement decisions are based on merit, qualifications and competence, and that
employment opportunities shall not be influenced, affected or limited by discrimination. The Group believes that no barrier should
exist that prevents this from occurring.
Gender diversity
As at 30 June 2019, the proportion of women engaged by the Group was as follows:
• Board: 29% being 2 of 7 directors (2018: 29%).
• Group Executive (the executives classifi ed as key management personnel of the Company as listed on page 34 of this Report,
excluding the executive director/Group CEO): 14% being 1 out of 7 (2018: 0%).
• Senior Management/Executive (excluding the executive director/Group CEO): 13% being 6 of 45 employees (2018: 17%).
For these purposes, Senior Management/Executive means:
• the 7 executives referred to above; and
• the 38 next most senior managers of the Group.
• Group: 40.5% being 5,094 of 12,564 employees (2018: 40.9%).
The Board has set measurable objectives in relation to gender diversity. These objectives, and the progress towards achieving
them are set out in the table below:
Objective June 2019 June 2018
To improve the percentage of female to male commissioned store sales staff 32% 29%
To improve the percentage of female to male store managers 16% 15%
To improve the percentage of female to male territory/area managers 18% 19%
To increase the percentage of female to male senior managers 13% 17%
The Group and the JB Hi-Fi and TGG businesses have implemented various initiatives to assist in achieving the Group’s diversity
objectives as set out below:
• reviewed the gender composition of the workforce across both businesses, in particular the representation of women in
leadership roles;
• introduced a paid maternity leave scheme for all employees of the Group;
• developed systems to enable regular reporting and assessment of progress towards the adopted gender diversity objectives;
• reviewed employee pay to consider whether any gender based disparity exists;
• developed part time and fl exible work practices, with specifi c focus on return to work from maternity leave;
• reorganised the managerial structure within JB Hi-Fi stores, aimed at achieving greater female representation at management
level over the medium term;
• encouraged female participation in leadership development programs;
• conducted a Group-wide employee survey in the JB Hi-Fi business with specifi c focus on equal opportunity and diversity;
• conducted focus groups to determine potential barriers to women’s progression to leadership and/or return from parental leave;
• introduced a domestic violence policy and paid domestic violence leave program for both businesses;
• introduced diversity and unconscious bias training facilitated by an external expert diversity advisor, including compliance
training setting out equal opportunity obligations and expectations of all employees and training to increase leaders’ capability
in managing parental leave and fl exibility requests; and
• introduced a competency framework to support recruitment decisions based on relevant technical and behavioural competencies.
For
per
sona
l use
onl
y

10
SAFETY
The Group is committed to providing a healthy and safe work environment for all its team members, contractors, customers
and visitors.
In FY2019 the Lost Time Injury Frequency Rate (LTIFR) in JB Hi-Fi was 1.66 and in The Good Guys was 7.46, an improvement of
56% and 12% year on year respectively. There were no work-related fatalities recorded during the reporting period.
The decrease in LTIFR was supported by a Group wide focus on safety culture, investment in safety equipment and safe work
practices, continued improvements in team member awareness and education.
SHAREHOLDINGS OF DIRECTORS AND EMPLOYEES
Directors’ current shareholdings are detailed in the Directors’ Report and are updated by notification to the ASX as required.
The Board has approved and adopted a Securities Trading Policy setting out the rules and procedures applying to directors,
officers and employees dealing in securities.
All non-executive directors and the 8 executives listed on page 34 are subject to the Company’s Minimum Shareholding Policies
which were introduced in FY2019 and require:
• Non-Executive Directors to hold the equivalent of 1.0 times base Board fees in shares;
• The Group CEO to hold the equivalent of 1.5 times fixed pay in shares; and
• Other Group executives to hold the equivalent of 1.0 times fixed pay in shares.
This level of shareholding is required to be built over 5 years from the introduction of the policy (or appointment, if later).
Subject to certain specific and limited exceptions, directors and key employees may only trade in the Company’s shares, and
any other securities of the Company, during designated Trading Windows. These four-week Trading Windows follow the
release of the Company’s Final Results (August/September), Interim Results (February/March) and the Annual General Meeting
(October/November). Directors and Group executives are required to obtain the Chairman’s consent in advance of any such
trading and any transaction conducted by directors in shares of the Company is notified to the ASX.
A copy of the Securities Trading Policy can be found on the Company’s investor website at https://investors.jbhifi.com.au via the
“Investors” and “Corporate Governance” sections.
INTEGRITY OF REPORTING
The Company has put in place controls designed to ensure the integrity of its financial reporting and that the Company complies
with all regulatory requirements relevant to this reporting.
In accordance with the Corporations Act and the ASX Recommendations, the Group Chief Executive Officer and Group Chief
Financial Officer have stated in writing to the Board that, in their opinion:
(a) the financial records of the consolidated entity (consisting of the Company and the entities it controlled for the financial
year ended 30 June 2019) for the financial year have been properly maintained in accordance with section 286 of the
Corporations Act;
(b) the financial statements for the financial year and the notes required by the accounting standards give a true and fair view of
the consolidated entity’s financial position and performance, and comply with the accounting standards;
(c) the statements in (a) and (b) above are founded on a sound system of risk management and internal control which is
operating effectively; and
(d) subsequent to 30 June 2019, no changes or other matters have arisen that would have a material effect on the operation of
the risk management and internal control systems of the Group.
The Company’s financial statements are subject to an annual audit by an independent, professional auditor who also reviews the
Company’s half yearly financial statements. The Audit and Risk Management Committee oversees this process on behalf of the
Board. Deloitte has been the Company’s external auditor since 2002. The audit engagement partner is rotated every five years.
Information on procedures for the selection and appointment of the external auditor and for the rotation of external audit
engagement partners can be found in the Charter of the Audit and Risk Management Committee on the Company’s investor
website at https://investors.jbhifi.com.au via the “Investors” and “Corporate Governance” sections.
GOVERNANCE, ENVIRONMENTAL AND SOCIAL STATEMENTS (continued)
For
per
sona
l use
onl
y

11
CONTINUOUS DISCLOSURE
The Company seeks to provide relevant and timely information to its shareholders and is committed to fulfilling its continuous
disclosure obligations.
The Board has approved a Continuous Disclosure Policy to ensure that the procedures for identifying and disclosing material price
sensitive information in accordance with the Corporations Act and ASX Listing Rules are clearly articulated. This policy sets out
the obligations of employees in respect of such information. The Group Chief Executive Officer, in consultation with the Chairman
where appropriate, is responsible for communication with the ASX.
A copy of the Continuous Disclosure Policy can be found on the Company’s investor website at https://investors.jbhifi.com.au via
the “Investors” and “Corporate Governance” sections.
SHAREHOLDER COMMUNICATIONS
The Company’s investor website https://investors.jbhifi.com.au contains an overview of the Group’s businesses and their history
and the following information for shareholders:
• all market announcements and related documents, which are posted immediately after release to the ASX;
• details relating to the Company’s directors and executives;
• Board and Board Committee charters and other corporate governance documents;
• a calendar of forthcoming key dates such as the date of results releases and the Company’s AGM;
• a summary of the Company’s dividend policy and its dividend payment history; and
• details of how investors can contact the Company and its share registry.
Shareholders can elect to receive communications from the Company’s share registry electronically which also gives shareholders
the opportunity to manage their account details and holdings electronically. Shareholders are also able to send communications to
the Company and receive responses to these communications electronically.
A copy of the Company’s Shareholder Communication Policy can be found on the Company’s investor website at
https://investors.jbhifi.com.au via the “Investors” and “Corporate Governance” sections.
The Company has an investor relations program which involves regular meetings with significant current and potential investors,
and with analysts and the financial media.
The Company holds its Annual General Meeting in Melbourne, to which all shareholders are invited. Shareholders who are unable
to attend can appoint a proxy to attend and vote or, alternatively, can vote electronically in advance of the Meeting. The Company
ensures that the external auditor attends its Annual General Meeting and is available to answer shareholder questions about the
conduct of the audit and the preparation and content of the auditor’s report.
RISK IDENTIFICATION AND MANAGEMENT
The Group’s policy is to consider the balance of risk and reward, as far as practicable, in order to optimise the returns gained
from its business activities and to meet the expectations of its shareholders.
The Board has delegated to the Audit and Risk Management Committee responsibility for overseeing the implementation of
policies and procedures aimed at ensuring that the Group conducts its operations in a manner that adequately manages risk
to protect its people, the environment and the Group’s assets and reputation. The Group has an effective risk management
framework in line with ISO31000 which enables management to identify and manage risk appropriately. The Committee regularly
reviews and revises this framework and it is approved by the Board on an annual basis. The risk management framework was
last approved by the Board in November 2018.
Risk identification and management is also a key focus of the executive and management teams.
The JB Hi-Fi business does not have an internal audit function. Instead, risk identification and management for the JB Hi-Fi
business is managed on a day-to-day basis by a dedicated risk management team. Risk identification and management for
The Good Guys business as well as internal audit is managed on a day-to-day basis by a dedicated business assurance team.
A copy of the Group’s Risk Management Policy can be found on the Company’s investor website at https://investors.jbhifi.com.au
via the “Investors” and “Corporate Governance” sections.
For
per
sona
l use
onl
y

12
ECONOMIC, ENVIRONMENTAL & SOCIAL SUSTAINABILITY RISKS
Economic sustainability risks
Economic sustainability risks are risks to the Group’s ability to continue operating at its current level of economic production over
the long term.
The Group is exposed to a number of economic sustainability risks, which have a real possibility of substantively impacting on the
Group’s ability to create or preserve value for its shareholders over the short, medium or long term. These economic sustainability
risks (together with the Group’s strategies for managing these risks) are discussed in the “Business Strategies and Prospects”
section of the Operating and Financial Review commencing on page 28.
Environmental sustainability risks
Environmental sustainability risks are risks to the Group’s ability to continue operating in a manner that does not compromise the
health of the ecosystems in which it operates over the long term.
The Group does not believe that it is exposed to any environmental sustainability risks which have a real possibility of substantively
impacting on the Group’s ability to create or preserve value for its shareholders over the short, medium or long term.
Notwithstanding this, environmental sustainability is important to the Group and, accordingly, the Group has implemented several
initiatives to minimise the impact of its operations on the environment. These initiatives are discussed in the Environmental
Statement on page 14 and include participation by the JB Hi-Fi business in the Carbon Disclosure Project and the Australian
Packaging Covenant.
Social sustainability risks
Social sustainability risks are risks to the Group’s ability to continue operating in a manner that meets accepted social norms and
needs over the long term.
The Group does not believe that it is exposed to any social sustainability risks which have a real possibility of substantively
impacting on the Group’s ability to create or preserve value for its shareholders over the short, medium or long term.
Notwithstanding this, the Group prides itself on conducting its business in a socially responsible manner and believes that it is
important to give back to the community. The Group’s initiatives in this regard are discussed in the Social Statement on page 16,
the most significant of which are the Group’s workplace giving programs.
The Group is currently engaging with its suppliers in relation to ethical sourcing and “modern slavery” standards, and intends to
publish a modern slavery statement by December 2020 as required by legislation.
BOARD AND EXECUTIVE PERFORMANCE
JB Hi-Fi monitors and evaluates the performance of its Board, Board Committees, individual directors, and executives in order to
fairly review, and actively encourage enhanced, Board and management effectiveness.
In June/July of each year, each director completes a written board review and assessment document, and subsequent one-on-one
interviews then take place between the Chair and each director which cover:
• review of Board performance as a whole;
• review of the individual director’s performance; and
• review of the Chair’s performance.
The Chair reports back to the Board on the discussions and the Board considers any issues as necessary.
Directors may also discuss the Chair’s performance with the Chair of the Company’s Audit & Risk Management Committee, who
will report back to the Board if necessary.
The Chair provides informal feedback to directors throughout the year as necessary.
Each Board Committee reviews its performance and reports the results of the review to the Board. Where necessary,
recommendations will be made to the Board for improving the effectiveness of the relevant Committee.
GOVERNANCE, ENVIRONMENTAL AND SOCIAL STATEMENTS (continued)
For
per
sona
l use
onl
y

13
Review of the Group CEO’s performance is evaluated by the Chair, with ultimate oversight by the Board. This involves an
assessment against both financial and non-financial performance measures. All other Group executives are evaluated by the
Group CEO including: (i) assessment against both financial and non-financial performance measures; and (ii) a one-on-one meeting
between the Group CEO and executive to discuss the executive’s performance. The Group CEO provides a summary of the
evaluation of each executive to the Board and the Remuneration Committee.
Evaluation of the Board, Board Committees, individual directors and Group executives has been conducted in respect of the 2019
financial year.
DIRECTORS’ FEES AND EXECUTIVE REMUNERATION
Directors’ fees
The details of remuneration paid to each non-executive director during the financial year and the principles behind the setting of
such remuneration are included in the Remuneration Report.
Executive remuneration
The amount of remuneration, both monetary and non-monetary, for the executives who had authority and responsibility for
planning, directing and controlling the activities of the Group during the financial year, and the principles behind the setting of such
remuneration, are included in the Remuneration Report.
For
per
sona
l use
onl
y
14
ENVIRONMENTAL STATEMENT
The Group is committed to understanding and attempting to mitigate any adverse environmental impacts its business has on the
Australian and New Zealand environments, and has implemented several initiatives to help achieve this.
Carbon disclosure project
The Carbon Disclosure Project (“CDP”) is a not-for-profit organisation that collates and reports company environmental actions to
external users such as investors and other corporations. The Group has systems in place to ensure it is reporting and monitoring
energy consumption and greenhouse gas emissions. In addition, the Group seeks to identify opportunities and implement solutions
to reduce energy consumption and greenhouse gas emissions whilst maintaining its low cost of doing business.
The Group’s response to the CDP in 2018 was assessed as a D. The Group is currently developing a Sustainability Framework
which will be released in FY2020 and is designed to ensure a strategic and structured approach to the management of
sustainability and which is likely to improve the Group’s CDP rating.
Promotion of energy effi cient products
The Group supports the Smarter Choice program in conjunction with the Victorian and New South Wales State Governments.
This program educates employees of the Group on how to best advise customers about the energy efficiency of products.
The Good Guys business also works with state-based organisations that provide home energy assistance. These include:
• Energex in Queensland (which promotes PeakSmart air-conditioners, which help reduce peak electricity demand);
• New South Wales Office of Environment & Heritage (which assists eligible residents through the Appliance Replacement Offer
to reduce energy bills by subsidising the purchase of energy efficient product upgrades); and
• Brotherhood of St Laurence in Victoria (which assists low income and vulnerable households in replacing appliances with more
energy efficient ones).
Australian packaging covenant
The Group is a signatory to the Australian Packaging Covenant. This is a voluntary program involving both Government and
industry with the intention of ensuring that the environmental impact from packaging is reduced, measured and understood.
Each signatory to the Australian Packaging Covenant is required to have an action plan which sets out what the signatory
proposes to do to contribute to the Australian Packaging Covenant’s objectives and goals.
During FY2019, JB Hi-Fi was assessed at a Performance Level 2 (Good Progress) which was the same as FY2018. The Good
Guys were assessed at Performance Level 1 (Getting Started). Additional initiatives that will be implemented by the Group will
be addressed in conjunction with the new Group Sustainability Framework and these are likely to lead to an improvement in
the ratings.
Cartridges 4 Planet Ark
The Group is a Cartridges 4 Planet Ark collection partner. This program enables consumers to drop used printer cartridges in
stores, where they are collected and returned for recycling and remanufacturing, ensuring landfill is avoided. In FY2019, almost
41,000 cartridges were recycled through the Group’s participation in this program. Since the commencement of the Group’s
participation in this program approximately 264,000 cartridges have been recycled (in addition to cartridges recycled by
The Good Guys prior to its acquisition by the Group).
TAKE2
The Group has committed to participate in Sustainability Victoria’s TAKE2 program, which is a collective climate change program
supporting individuals, government, businesses and other organisations to help Victoria achieve net zero emissions by 2050.
REDCycle
The Group has committed to support the REDCycle Program, which enables soft plastics such as plastic bags to be returned to
over 1800 sites around Australia and New Zealand and converted into furniture for schools and communities.
GOVERNANCE, ENVIRONMENTAL AND SOCIAL STATEMENTS (continued)
For
per
sona
l use
onl
y

15
E-Waste
All e-waste from Store and Support operations is recycled.
Store initiatives
The Group continues to review its store operations and has introduced various initiatives with the aim of ensuring its impact on the
environment is reduced.
In order to reduce energy consumption stores have been fitted with LED lighting and a trial is underway to control, monitor,
measure and optimise energy consumption in stores.
Waste from operations is recycled where possible with stores having paper and cardboard recycling bins. A trial is underway to
identify opportunities to reduce plastic waste going to landfill.
JB Hi-Fi New Zealand stores no longer provide customers with plastic bags; customers now have the option of a paper bag or are
able to purchase reusable bags.
For
per
sona
l use
onl
y

16
SOCIAL STATEMENT
As one of Australia’s and New Zealand’s leading retailers, the Group understands the impact it can have on people and the
community. The Group is committed to working with its employees, customers and suppliers to ensure a strong and sustainable
future for our people and the community in which we live and operate.
Modern slavery reporting and group ethical sourcing policy
The Group is in the process of developing and implementing a Group Ethical Sourcing Policy, which outlines the Group’s minimum
standards for labour, environmental management, ethics and health and safety in relation to the sourcing of products by the
Group. In conjunction with this, in FY2019 the Group became a member of the Responsible Business Alliance, which is the world’s
largest industry coalition dedicated to corporate social responsibility in global supply chains. The Group will submit an Annual
Slavery Statement to the Department of Home Affairs by Dec 2020.
JB Hi-Fi’s workplace giving program – “Helping Hands”
During FY2019, JB Hi-Fi celebrated the 10-year anniversary of the introduction of Helping Hands, which is the business’ workplace
giving program. Through this program, JB Hi-Fi directors, executives and employees are able to donate to registered charitable
organisations. The JB Hi-Fi business matches dollar for dollar employee contributions through its payroll system, effectively
doubling the financial benefit to its charity partners.
Our Helping Hands program was awarded Best Overall Program and Most Innovative Charity/Employer Partnership at the 2016
and 2017 Workplace Giving Awards and was awarded silver in 2018 Best Overall Program category.
The JB Hi-Fi business works with Workplace Giving Australia to develop and maintain the program and, in doing so, contributes
to the Group’s vision of delivering significant social impact through employers and community organisations working together.
Through the combined giving of the JB Hi-Fi business and its employees, the Group believes it makes a real difference to the
charities in the program.
Helping Hands – Australia
The Helping Hands program in Australia involves around 6,500 JB Hi-Fi Australia employees (approximately 78% of total JB Hi-Fi
Australia employees) each making weekly contributions to registered charitable organisations. In FY2019 almost $2.6 million has
been raised and, since its inception, the JB Hi-Fi business and its employees are proud to have raised more than $16.3 million.
During 2018 The Group proactively sought feedback from its employees as to the cause areas they wanted to support. Based on
that feedback a charity rotation plan has been introduced, which has resulted in two new charity partners, Kids Under Cover and
JB Hi-Fi Helping Out, being introduced. JB Hi-Fi Helping Out has been set up to enable employees to donate, for a limited time,
to a charity that is delivering an innovative initiative within a cause area the employees are passionate about. The first charity to be
supported through JB Hi-Fi Helping Out is McAuley Community Service for Women which provides services for women and their
children who are escaping family violence, and for women who are homeless.
The current charity partners who receive contributions are Bush Heritage Australia, ReachOut.com, Medicins Sans Frontieres
(Doctors Without Borders), The Song Room, RedKite, Fred Hollows Foundation, Oxfam, Animal Welfare League Australia (“AWLA”),
Kids Under Cover and JB Hi-Fi Helping Out.
Helping Hands – New Zealand
The Helping Hands program was launched in New Zealand in 2012 and involves over 280 employees (approximately 60% of
JB Hi-Fi New Zealand employees) each making weekly contributions. This year, for the first time, over $100 thousand was raised
and since its inception over $503 thousand has been raised. The current charity partners in New Zealand are ShelterBox, Kenzies
Gift, Forest and Bird, Youthline and Plunket.
GOVERNANCE, ENVIRONMENTAL AND SOCIAL STATEMENTS (continued)
For
per
sona
l use
onl
y
17
The Good Guys’ “Doing Good” workplace giving program
The Good Guys business launched its workplace giving program, Doing Good, in July 2017. Under this program The Good Guys
matches dollar for dollar contributions made by employees, effectively doubling the benefit to its national charity partners. This year
the program has donated over $376 thousand to 14 national charity partners as a result of contributions from approximately 52%
of The Good Guys employees.
Donations were made to the following charities: Berry Street, Circus Oz, Orange Sky Laundry, The Good Foundation, Whitelion,
KickStart for Kids, McGrath Foundation, Soldier On, Prostate Cancer Foundation of Australia, EdConnect, Perth Children’s Hospital
Foundation, Daniel Morcombe Foundation, HeartKids and RSPCA.
“Change for Change” – donation boxes in JB Hi-Fi stores
The Helping Hands program has driven the placement of “Change for Change” boxes in all JB Hi-Fi stores across Australia and
New Zealand. These boxes have been placed at point of sale locations to encourage donations from customers. All donations
collected are shared evenly amongst the Helping Hands program’s charity partners. This year almost $48 thousand has been
collected in Australia and, since inception, the program has raised over $642 thousand. In New Zealand approximately
$31 thousand has been collected since boxes were first introduced into stores.
One-off fundraising campaigns
During the year the Group partnered with both current Helping Hands charity partners and other charities to deliver one-off
fundraising campaigns. Current partners Songroom and ReachOut received over $200 thousand each as a result of instore
campaigns. Drought Angels and The Christchurch Foundation received contributions from employees, which were matched dollar
for dollar by the Group, to assist with events during the year.
“Employer Leadership Group” – founding partner
The JB Hi-Fi business is a founding partner of Workplace Giving Australia’s “Employer Leadership Group” (“ELG”) that was formed
in 2010 to generate awareness of the benefits of workplace giving programs across the leadership of Australian businesses.
The Group’s CEO, Richard Murray, is Chairperson of the ELG. Members of the ELG have demonstrated best practice in engaging
with their employees around community issues and are committed to leading the growth of the sector alongside Workplace Giving
Australia. As a founding partner, the JB Hi-Fi business seeks to play its part in encouraging workplace giving as a low cost and
highly efficient way of generating funds for the charitable sector. In addition to the Group’s workplace giving programs and Change
for Change contributions detailed above, from 2012 to 2019 the Group has made contributions to Workplace Giving Australia
totalling $300 thousand in order to support its initiatives.
The recent addition of the Business Council of Australia as a member of Workplace Giving Australia is an exciting step forward
in the continued growth of workplace giving in Australia and towards the realisation of Workplace Giving Australia’s vision of one
million Australians giving to charity through their place of work by 2020.
For
per
sona
l use
onl
y

18
The directors of JB Hi-Fi Limited (the “Company”) submit herewith the annual financial report of the consolidated entity consisting
of the Company and the entities it controlled (the “Group”) for the financial year ended 30 June 2019. In order to comply with the
provisions of the Corporations Act 2001, the Directors report as follows:
The names and particulars of the directors of the Company during or since the end of the financial year are:
Name Particulars
Mr Greg Richards
Chairman
Non-Executive Director
B.Ec (Hons)
Greg was appointed to the Board in December 2007 and was appointed Chairman of the
Board in June 2012. Greg is a member and Chairman of the Remuneration Committee and
was Chairman of the Audit and Risk Management Committee from February 2010 until
May 2012. Prior to 2006, Greg had over 25 years’ experience in the investment banking
industry. Most recently he was with Goldman Sachs JBWere for over 19 years where he was
an equity partner for 17 years, working primarily in equity capital markets. Greg was previously
the non-executive chairman of Vitaco Holdings Limited.
Mr Stephen Goddard
Non-Executive Director
MSc. BSc (Hons)
Stephen was appointed to the Board in August 2016 and is a member of the Audit and Risk
Management Committee. Stephen has more than 30 years’ retail experience having held
senior executive positions with some of Australia’s best known retailers. These include Finance
Director and Operations Director for David Jones, founding Managing Director of Offi ceworks,
and various senior management roles with Myer. Stephen is currently a non-executive director
and Chair of the Audit and Risk Management Committees of both GWA Group Limited and
Accent Group Limited and a non-executive director of Nick Scali Limited. He was previously
a non-executive director and Chair of the Audit and Risk Management Committees of Pacifi c
Brands and Surfstitch Group Ltd.
Ms Beth Laughton
Non-Executive Director
B.Ec, FAICD, FCA
Beth was appointed to the JB Hi-Fi Board in May 2011, became Chair of the Audit & Risk
Management Committee in June 2012 and is also a member of the Company’s Remuneration
Committee. After qualifying as a Chartered Accountant, Beth spent over 25 years in corporate
fi nance, providing mergers and acquisition advice and arranging equity funding for companies
in a range of industries including specialty retail. For 12 years her primary focus was on
information technology, telecommunications and entertainment. She is also a member of
the Board of GPT Funds Management Limited and Chair of its Audit, Compliance & Risk
Management Committee and a non-executive director of Shopping Centres Australasia
Property Group RE Limited and Shopping Centres Australasia Property Holding Pty Ltd. Beth
was previously a member of the Defence SA Advisory Board and its Audit & Risk Management
Committee, a non-executive director of Port Adelaide Maritime Corporation, a non-executive
director and Chair of the Audit Committee of both Sydney Ferries and CRC Care Pty Ltd, and
a non-executive director and member of the Audit Committee of the ASX listed Australand
Property Group companies.
Mr Mark Powell
Non-Executive Director
BSc (Hons), MSc, MBA (Distinction),
BApp. Theol, MA (Hons)
Mark was appointed to the Board in March 2017 and is a member of the Audit & Risk
Management Committee. Mark has over 25 years’ executive experience in retail, logistics and
wholesale distribution in the UK, Spain, North America, Australia and New Zealand. This includes
being UK Logistics Operations Director for Tesco Plc, running Wal-Mart Canada’s logistics
operations and CEO of Warehouse Stationery in NZ. Mark also spent fi ve years as Group CEO
for The Warehouse Group, an NSX listed retail group which includes Noel Leeming, NZ’s largest
technology and appliances retailer. He was an advisor to the board of The Good Guys for
18 months prior to its acquisition by JB Hi-Fi. Mark is currently a non-executive director and
member of the Audit and Risk Committee of NZX listed Kiwi Property Group Limited. He is also
involved on a voluntary basis on the boards of several not-for-profi t organisations.
Ms Wai Tang
Non-Executive Director
BAppSC, MBA, GAICD
Wai was appointed to the Board in September 2015 and is a member of the Company’s
Audit & Risk Management Committee and Remuneration Committee. Wai has extensive retail
industry experience and knowledge gained through senior executive and board roles. Her
former senior executive roles included Operations Director for Just Group and Chief Executive
Offi cer of the Just Group sleepwear business, Peter Alexander. Prior to joining the Just Group,
Wai was General Manager of Business Development for Pacifi c Brands. Wai was co-founder of
the Happy Lab retail confectionery concept. Wai is also a non-executive director and member
of the Audit Committee and the Risk & Compliance Committee of Vicinity Limited, and a
non-executive director of Ovato Limited, Metcash Limited, the Melbourne Festival and Visit
Victoria. Wai’s former directorships include Speciality Fashion Group and the Melbourne
Fashion Festival.
DIRECTORS’ REPORT
For
per
sona
l use
onl
y

19
Mr Richard Uechtritz
Non-Executive Director
Richard has over 30 years’ experience in retailing. He was co-founder of Australia’s two
leading photo chains, Rabbit Photo and Smiths Kodak Express. He was also a director of
Kodak (Australasia) Pty Ltd. Richard led the management buy-in of JB Hi-Fi in July 2000
and was CEO and Managing Director until his resignation from these positions in May 2010.
Richard re-joined the Board in April 2011 as a non-executive director. He is also a
non-executive director of Seven Group Holdings Limited.
Mr Richard Murray
Group Chief Executive Officer and
Executive Director
B.Comm, Grad.Dip.
Applied Finance & Investment,
FCA
Richard became Chief Executive Offi cer on 1 July 2014 having been appointed to the Board
in June 2012. Richard has 25 years’ experience in retail and fi nance. He joined JB Hi-Fi as
CFO in 2003 and took the business through the IPO process. Prior to this Richard worked
with Deloitte for 10 years. He is currently Chairman of Workplace Giving Australia’s Leadership
Group, which aims to encourage Australian businesses to set up workplace giving programs.
Each of the aforementioned directors held offi ce for the whole fi nancial year and since the end of the fi nancial year.
Company Secretary Particulars
Mr Doug Smith
BA (Hons). Admitted to legal
practice in Victoria & in England
& Wales.
Doug was appointed Company Secretary in June 2012. Doug joined JB Hi-Fi as General
Counsel in September 2010 and has over 25 years’ legal and company secretarial experience
in-house and in private practice.
Directorships of other listed companies
Directorships of other listed companies held by directors in the 3 years immediately before the end of the financial year and since
the end of the financial year are as follows:
Name Company Period of Directorship
Greg Richards Vitaco Holdings Limited August 2015 (listed September 2015) –
December 2016
Stephen Goddard GWA Group Limited
Accent Group Limited
Nick Scali Limited
Pacific Brands Limited
Surfstitch Group Limited
Since October 2016
Since November 2017
Since March 2018
May 2013 – July 2016
November 2014 (listed December 2014) –
December 2016
Beth Laughton Shopping Centres Australasia Property Group Since 13 December 2018
Mark Powell Kiwi Property Group Limited (NZX) Since October 2017
Wai Tang Vicinity Limited
Ovato Limited
Metcash Limited
Since May 2014
Since October 2017
Since 1 August 2019
Richard Uechtritz Seven Group Holdings Limited Since June 2010
For
per
sona
l use
onl
y

20
Principal activity
The Group’s principal activity in the course of the financial year was the retailing of home consumer products. The Group offers
a wide range of leading brands with particular focus on consumer electronics, software (including music, games and movies),
whitegoods and appliances.
There have been no significant changes in the nature of the principal activity of the Group during the financial year other than as
detailed herein.
Operating and Financial Review
The Operating and Financial Review, which forms part of this Directors’ Report, is presented separately on pages 23 to 31.
Changes in state of affairs
During the financial year there was no significant change in the state of affairs of the Group.
Subsequent events
There have been no matters or circumstances occurring subsequent to the end of the financial year, that have significantly affected,
or may significantly affect, the operations of the Group, the results of those operations, or the state of affairs of the Group in future
financial years.
Future developments
Information regarding likely developments in the operations of the Group in future financial years is set out in the Operating and
Financial Review and elsewhere in the Annual Report.
Environmental regulations
The Group is not involved in any activities that have a marked influence on the environment within its area of operation. As such,
the directors are not aware of any material issues affecting the Group or its compliance with the relevant environmental agencies or
regulatory authorities.
Dividends
In respect of the financial year ended 30 June 2018, as detailed in the Directors’ Report for that financial year, an interim dividend
of 86.0 cents per share and a final dividend of 46.0 cents per share, both franked to 100% at the 30% corporate income tax rate,
were paid to the holders of fully paid ordinary shares on 9 March 2018 and 7 September 2018 respectively.
In respect of the financial year ended 30 June 2019, an interim dividend of 91.0 cents per share was paid to the holders of fully
paid ordinary shares on 8 March 2019 and the directors have declared the payment of a final dividend of 51 cents per share, to be
paid to the holders of fully paid ordinary shares on 6 September 2019. Both dividends are franked to 100% at the 30% corporate
income tax rate. The total dividend for the financial year of 142 cents per share represents a payout ratio of approximately 65% of
net profit after tax.
Indemnifi cation of offi cers and auditors
The Company indemnifies current and former directors and officers for any loss arising from any claim by reason of any wrongful
act committed by them in their capacity as a director or officer (subject to certain exclusions as required by law). During the
financial year, the Company has paid premiums in respect of contracts insuring the directors and officers against any liability of
this nature. In accordance with normal commercial practices, under the terms of the insurance contracts the nature of the liabilities
insured against and the amount of the premiums paid are confidential. The Company has not otherwise, during or since the end of
the financial year, except to the extent permitted by law, indemnified or agreed to indemnify an officer or auditor of the Company
or of any related body corporate against a liability incurred as such by an officer or auditor.
DIRECTORS’ REPORT (continued)
For
per
sona
l use
onl
y

21
Directors’ meetings
The following table sets out the number of directors’ meetings (including meetings of Committees of directors) held during the
2019 financial year and the number of meetings attended by the members of the Board or the relevant Committee. During the
financial year, 14 Board meetings, 6 Remuneration Committee meetings and 6 Audit and Risk Management Committee meetings
were held.
Board of Directors Remuneration Committee
Audit and Risk Management
Committee
Directors Held Attended Held Attended Held Attended
G. Richards 14 14 6 6 – –
S. Goddard 14 14 – – 6 6
B. Laughton 14 14 6 6 6 6
M. Powell 14 14 – – 6 6
W. Tang 14 13 6 5 6 6
R. Uechtritz 14 14 – – – –
R. Murray 14 14 – – – –
Directors’ shareholdings
The following table sets out each director’s relevant interest in shares, debentures, and rights or options in shares or debentures of
the Company, or a related body corporate, as at the date of this Report.
Fully paid ordinary shares Executive share options
Directors Direct number Indirect number Total Direct number Indirect number Total
G. Richards 3,455 23,031 26,486 – – –
S. Goddard 4,500 – 4,500 – – –
B. Laughton 5,804 – 5,804 – – –
M. Powell 2,000 – 2,000 – – –
W. Tang – 5,000 5,000 – – –
R. Uechtritz 11,516 – 11,516 – – –
R. Murray(i) 107,818 2,304 110,257 270,823 – 270,823
(i) Excludes any restricted shares that may be granted by the Board in August 2019 pursuant to achievement of incentives under the Company’s
Variable Reward Plan.
Remuneration Report
The Remuneration Report, which forms part of this Directors’ Report, is presented separately on pages 32 to 56.
Proceedings on behalf of the Company
The directors are not aware of any persons applying for leave under s.237 of the Corporations Act 2001 to bring, or intervene in,
proceedings on behalf of the Company.
Non-audit services
Given the size and complexity of the Group, it can be in the interests of the Group to engage the services of its auditor to assist
in a range of related projects. The directors are aware of the issues relating to auditor independence and have in place policies
and procedures to address actual, potential and perceived conflicts in relation to the provision of non-audit related services by the
Company’s auditor.
The directors have not engaged the auditor to provide any non-audit services in the 2019 financial year.
Auditor’s independence declaration
The auditor’s independence declaration is included on page 57 of the Annual Report.
For
per
sona
l use
onl
y

22
Rounding off of amounts
The Company is a company of a kind referred to in ASIC Corporations (Rounding in Financial/Directors’ Reports) Instrument
2016/191 dated 24 March 2016, and in accordance with that Corporations Instrument, amounts in the Directors’ Report and
financial report are rounded off to the nearest hundred thousand dollars, unless otherwise indicated.
Signed in accordance with a resolution of the directors made pursuant to s.298(2) of the Corporations Act 2001.
On behalf of the directors
Greg Richards Richard Murray
Chairman Group Chief Executive Offi cer
Melbourne
12 August 2019
DIRECTORS’ REPORT (continued)
For
per
sona
l use
onl
y

23
OVERVIEW OF OPERATIONS
The Group, which includes both the JB Hi-Fi and The Good Guys businesses, sells the following products:
• consumer electronics including televisions, audio equipment, computers and cameras;
• telecommunications products and services;
• whitegoods, cooking products, heating & cooling products, small appliances and kitchen accessories; and
• software (CDs, DVDs, Blu-ray discs and games) and musical instruments.
The Group also provides information technology and consulting services.
The Group holds significant market-share in many of its product categories.
The Group’s sales are primarily from its branded retail store networks (196 JB Hi-Fi/JB Hi-Fi Home stores in Australia, 14 JB Hi-Fi
stores in New Zealand and 105 The Good Guys stores in Australia as at 30 June 2019) and online operations (JB Hi-Fi and
The Good Guys websites). Sales are also generated from the Group’s commercial and education businesses, JB Hi-Fi Solutions
and The Good Guys Commercial.
GROUP FINANCIAL PERFORMANCE – HIGHLIGHTS
FY2019 FY2018 Mvt
Total Sales ($m) 7,095.3 6,854.3 +3.5%
Earnings before interest and tax ($m) 372.8 350.6 +6.4%
Net profit after tax ($m) 249.8 233.2 +7.1%
Earnings per share (basic ¢) 217.4 203.1 +7.1%
Dividend per share (¢) 142.0 132.0 +7.6%
Total sales grew by 3.5% to $7,095.3 million, earnings before interest and tax grew by 6.4% to $372.8 million and net profit after
tax grew by 7.1% to $249.8 million. Earnings per share were up 7.1% to 217.4 cps.
OPERATING AND FINANCIAL REVIEW
For
per
sona
l use
onl
y

24
DIVISIONAL PERFORMANCE
JB Hi-Fi Australia
FY2019 FY2018 Mvt
Total Sales ($m) 4,726.0 4,539.7 +4.1%
Gross Profit ($m) 1,046.2 1,006.5 +3.9%
Gross Margin (%) 22.14% 22.17% (4 bps)
Cost of Doing Business (%) 14.89% 14.82% +7 bps
EBITDA ($m) 342.3 333.6 +2.6%
EBITDA Margin (%) 7.24% 7.35% (11 bps)
EBIT ($m) 301.7 292.3 +3.2%
EBIT Margin (%) 6.38% 6.44% (6 bps)
Stores (#) 196 193 +3 stores
Total sales were up 4.1% to $4,726.0 million (FY2018: $4,539.7 million) and comparable sales growth was 2.8%. It was a pleasing
finish to FY2019 with strong sales in the key tax time promotional period driving quarter four comparable sales growth of 3.3%.
Hardware and services sales (all sales excluding Music, Movies and Games Software categories) were up 5.4% for the financial
year, with comparable sales up 4.1%, driven by the Communications, Audio, Fitness, Games Hardware and Connected
Technology categories. Software sales were down 7.3% and on a comparable basis were down 8.3% as a result of double digit
declines in the Movies and Music categories which was partially offset by strong growth in the Games Software category. By value,
software sales represent 9.3% of total sales (FY2018: 10.0%).
Online sales in Australia grew 23.0% (FY2018: 32.1%) to $258.0 million or 5.5% of total sales (FY2018: 4.6%), as the JB Hi-Fi
Australia business continues to invest in and evolve its online offer.
A continued focus on growing sales and gross profit dollars saw gross profit increase by 3.9% to $1,046.2 million. Gross margin
decreased by 4 bps to 22.14%, driven primarily by sales mix as the business manages the decline in higher margin software
categories and the growth of low margin brands and categories, and price investment to reinforce the business’ market leadership.
The JB Hi-Fi Australia business’ low Cost of Doing Business (“CODB”) remains a competitive advantage and is maintained through
continued focus on productivity, minimising unnecessary expenditure and leveraging scale. CODB increased by 7 bps to 14.89%
and in absolute terms grew 4.6%. Total operating costs remained well controlled as the JB Hi-Fi Australia business managed costs
in line with sales and continued to focus on customer service, investing in strategic initiatives and managing increased volumes
through the store network.
Sales growth, combined with cost control drove EBITDA growth of 2.6%. Depreciation declined by 1.4% as the business managed
its investment in the store network. EBIT was up 3.2% to $301.7 million, while EBIT Margin was down 6 bps to 6.38%.
OPERATING AND FINANCIAL REVIEW (continued)
For
per
sona
l use
onl
y

25
JB Hi-Fi New Zealand(i)
FY2019 FY2018 Mvt
Total Sales (NZ$m) 236.2 231.5 +2.0%
Gross Profit (NZ$m) 40.8 40.9 (0.1%)
Gross Margin (%) 17.29% 17.66% (37 bps)
Cost of Doing Business (%) 16.71% 17.28% (57 bps)
EBITDA (NZ$m) 1.4 0.9 +56.1%
EBITDA Margin (%) 0.58% 0.38% +20 bps
EBIT (NZ$m) (1.9) (2.9) +34.3%
EBIT Margin (%) (0.80%) (1.24%) +44 bps
Stores (#) 14 15 (1 store)
(i) Amounts disclosed for JB Hi-Fi New Zealand are in local currency to remove the impacts of foreign currency translation on trading performance,
the Australian dollar performance is presented in Note 2 of the financial statements.
Total sales in FY2019 were up 2.0% to NZ$236.2 million, with comparable sales up 8.2%.
The key growth categories were Communications, Fitness, Audio and Small Appliances. Online sales in New Zealand for FY2019
grew 38.3% to NZ$13.3 million or 5.6% of total sales (FY2018: 4.1%) as the business benefited from the improved online platform.
Gross margin was down 37 bps on FY2018 to 17.29% due to sales mix. CODB was down 57 bps on FY2018 to 16.71%, driven
by cost control and strong comparable sales growth. In absolute terms CODB declined 1.3% on FY2018.
Sales growth, combined with cost control, drove EBITDA growth of 56.1%. Depreciation declined by 13.2%, as we managed our
investment in the store network. EBIT was -NZ$1.9 million up NZ$1.0 million from FY2018.
The Good Guys
FY2019 FY2018 Mvt
Total Sales ($m) 2,147.9 2,101.3 +2.2%
Gross Profit ($m) 442.7 426.1 +3.9%
Gross Margin (%) 20.61% 20.28% +33 bps
Cost of Doing Business (%) 16.63% 16.60% +3 bps
EBITDA ($m) 85.5 77.3 +10.6%
EBITDA Margin (%) 3.98% 3.68% +30 bps
EBIT ($m) 72.9 60.9 +19.8%
EBIT Margin (%) 3.40% 2.90% +50 bps
Stores (#) 105 103 +2 stores
Total sales were up 2.2% to $2,147.9 million (FY2018: $2,101.3 million) and comparable sales growth was 0.9%.
The key growth categories for FY2019 were Refrigeration, Laundry, Dishwashers, Televisions, Communications and Computers.
Online sales for FY2019 were up 3.7% to $130.9 million or 6.1% of total sales (FY2018: 6.0%) with strong sales on The Good
Guys website partially offset by a decline in third party marketplace sales.
Gross profit for FY2019 was up 3.9% to $442.7 million from $426.1 million in FY2018, with gross margin up 33 bps to 20.61%
(FY2018: 20.28%). Gross margin in the second half was up 88 bps as the business benefited from the initiatives put in place over
the last twelve months and the cycling of strong price competition in the second half of FY2018.
CODB for FY2019 was up 3 bps to 16.63% and in absolute terms grew 2.4% on FY2018 with total operating costs in line with
expectations and store wages remained well controlled.
Sales growth, combined with gross margin expansion drove strong EBITDA growth of 10.6%. Depreciation declined by 23.5%
as significant pre-acquisition IT investment is now fully amortised. EBIT was up 19.8% to $72.9 million from $60.9 million in the
previous financial year, while EBIT Margin was up 50 bps to 3.40%.
For
per
sona
l use
onl
y

26
GROUP BALANCE SHEET, CAPITAL MANAGEMENT AND DIVIDENDS
The Group’s total net assets at the end of the financial year were $1,044.1 million, which was $96.5 million higher than at the end
of FY2018.
In June 2019, the Group restructured its multi-tranche term debt facilities, resulting in a reduction in these facilities by $110.0 million
to $440.0 million. In conjunction with this restructure, the Group also increased its trade finance facility by $110 million to
$140.0 million, which is renewable annually, and reduced its overdraft facilities by $30 million, resulting in overdraft facilities of
$50.0 million and NZ$10.0 million which are renewable annually.
The Group now has term debt facilities as follows:
• $60.0 million with an expiry date of September 2020;
• $242.0 million with an expiry date of July 2021; and
• $138.0 million with an expiry date of July 2022.
The financial covenants included in the Group’s financing facilities are leverage and fixed charges cover ratios. The Group has
complied with each of its financial covenants throughout the period.
At the end of the financial year the Group had total interest bearing liabilities of $439.1 million and cash on hand of $119.2 million
resulting in net debt of $319.9 million, a reduction of $77.5 million from the prior year.
The total dividend for the 2019 financial year of 142.0 cents per share represents a payout ratio of approximately 65% of the
full year earnings. The Board currently believes a 65% dividend payout ratio appropriately balances the distribution of profit to
shareholders, the repayment of debt and reinvestment of earnings for future growth. The final dividend for the 2019 financial year
of 51.0 cents per share fully franked will be paid on 6 September 2019 with a record date of 23 August 2019.
INVESTMENTS FOR FUTURE PERFORMANCE
Investments of $59.3 million were made during the financial year in capital expenditure projects, an increase of $4.9 million from
$54.4 million during the previous financial year. Capital expenditure remains well controlled as the Group continues to invest in the
store portfolio, our digital propositions and strategic initiatives.
These investing activities are anticipated to contribute towards earnings growth in FY2020 and beyond.
WORKING CAPITAL
Total inventory on hand decreased from the previous financial year by $4.4 million as a result of better than expected sales in the
key tax time promotional period, and trade and other payables decreased by $8.4 million. Inventory turnover was 6.3 times up
from 6.2 times in FY2018.
Financial and operating leverage remains low as is evidenced by solid fixed charges cover of 3.0 times (FY2018: 2.9 times) and
interest cover of 26.1 times (FY2018: 21.1 times). The Company’s gearing ratio decreased to 1.0 (FY2018: 1.1).
OPERATING AND FINANCIAL REVIEW (continued)
For
per
sona
l use
onl
y

27
STORES
The Group’s sales are primarily from its branded retail store networks, located both in stand-alone destination sites and shopping
centre locations.
The store locations as at 30 June 2019 are set out below.
Total JB Hi-Fi Stores – 210
Total The Good Guys Stores – 105
14JB Hi-Fi Australia
JB Hi-Fi New Zealand
The Good Guys
1
3
3
5
30
63
28 51
23
39
5
10
14
23
1
2
In Australia, 5 new JB Hi-Fi stores were opened and two were closed in FY2019. One JB Hi-Fi store was closed in New Zealand
during FY2019.
Two new The Good Guys stores were opened during FY2019.
JB HI-FI SOLUTIONS (COMMERCIAL, EDUCATION & INSURANCE)
The Group’s commercial, insurance and education businesses, JB Hi-Fi Solutions and The Good Guys Commercial, comprises:
• Corporate, Government & Education sales of products and services; and
• Insurance replacements.
The business recorded double digit sales growth in FY2019 and remains on track to deliver on its longer term aspirational sales
target of approximately $500m per annum, through both organic growth and strategic acquisitions.
For
per
sona
l use
onl
y

28
BUSINESS STRATEGIES AND PROSPECTS
The following factors are considered important in understanding the strategy of the Group and the main opportunities and threats
that may have a significant effect on its results and its prospects for future years. These factors are listed regardless of whether
they were significant in FY2019.
Business risks
There are a number of factors, both specific to the Group and of a general nature, which may threaten both the future operating
and financial performance of the Group and the outcome of an investment in the Group. There can be no guarantee that the
Group will achieve its stated objectives or that forward looking statements will be realised. The operating and financial performance
of the Group is influenced by a variety of general economic and business conditions, including levels of consumer spending,
inflation, interest and exchange rates, access to debt and capital markets, and government fiscal, monetary and regulatory policies.
A prolonged deterioration in general economic conditions, including an increase in interest rates or a decrease in consumer and
business demand, may have an adverse impact on the Group’s business or financial condition. The specific material business risks
faced by the Group, and how the Group manages these risks, are set out below.
• Competition – the markets in which the Group operates remain highly competitive and any increased competition from new
and existing competitors may lead to price defl ation and a decline in sales and profi tability. As the #1 player in a fragmented
Australian market, the Group’s scale allows it to maintain focus on market share and absorb margin pressure during periods of
heightened market price activity and consolidation. The Group also believes that its competitive advantages and the plans for
growth set out below will allow it to maintain its market leading position.
• A loss or erosion of reputation – both the JB Hi-Fi business and The Good Guys business enjoy a high level of loyalty and
trust with customers. The JB Hi-Fi business has been consistently ranked among Australia’s most reputable companies in
the Corporate Reputation Index released by the Reputation Institute and AMR (1st in 2014 and 2016 and 3rd in 2012,
2013, 2015, 2017 and 2019). The JB Hi-Fi business was also awarded the Roy Morgan Customer Satisfaction Award for
Furniture/Electrical store of the year for 2017 and 2019, whilst The Good Guys business won the same award for 2011,
2012, 2013, 2014 and 2016 and fi nished second in 2019. Additionally, The Good Guys Business won the Canstar Blue Most
Satisfi ed Customers Electronic Retailers Award from 2011 to 2018 with JB Hi-Fi fi nishing second in 2018. A decline in this high
level of loyalty and trust could compromise the market leading positions of the JB Hi-Fi business and The Good Guys business
and adversely affect the Group’s operating and fi nancial performance. This could occur as a result of a wide range of factors or
events, including:
• a loss or erosion of the reputation of the JB Hi-Fi and The Good Guys businesses for price leadership and high levels
of customer service. The Group seeks to mitigate this risk through careful monitoring of its competitors’ pricing and
market share data, senior management monitoring of customer complaints, and use of customer service and
engagement analytics;
• a major information security breach of the Group’s IT systems. The Group seeks to mitigate this risk through investment
in IT security measures, including incident response planning and testing;
• a major workplace health and safety incident or customer injury. The Group seeks to mitigate this risk through having
appropriate occupational health and safety procedures and staff training in place for all of its sites; or
• a signifi cant breach of regulatory or legislative requirements. The Group seeks to mitigate this risk through appropriate
staff training on key regulatory and legislative requirements relevant to its business, as well as making legal and regulatory
compliance a key focus of the management team.
• Consumer discretionary spending and changes in consumer demands – the Group is exposed to consumer spending cycles
and changes in consumer demands. A reduction in consumer spending and demand may lead to a decline in the Group’s
sales and profi tability. The Group maintains its relevance using its strong market position supported by its everyday low price
proposition. The Group’s stores, which are both in convenient and high traffi c locations, seek to maximise both destination and
impulse sales, refl ected in the Group’s high sales per square metre of fl oor space. The Group also closely monitors changes in
the economic environment, consumer demand and new products, and is able to respond quickly to such changes.
OPERATING AND FINANCIAL REVIEW (continued)
For
per
sona
l use
onl
y

29
• Online competition taking sales from the Group’s stores – the Group seeks to provide customers with a quality online offer,
while leveraging the benefi ts of its physical stores. The Group continues to innovate both in-store and online in order to give
customers the choice as to how to transact with the JB Hi-Fi and The Good Guys businesses. The Group’s market leadership
and scale gives it global relevance with suppliers and drives signifi cant buying power which enables the Group to compete
successfully with online players, as does its low cost of doing business. The Group also believes that the existence of its store
networks will continue to provide confi dence in after-sales service and support to its online customers, whilst also enabling fast
online fulfi lment via delivery from stores and click & collect.
• Digitisation of physical software leading to a fall in traditional software sales beyond expectations – the JB Hi-Fi business will
maintain a software presence in store while the category is still providing solid returns, whilst adjusting inventory, range and
in-store space allocated to the category as appropriate.
• Ineffective inventory management - a failure to maintain suffi cient inventory (or holding excessive inventory) may adversely affect
the Group’s operating and fi nancial performance. The Group mitigates this risk through regular monitoring of inventory quality
and stock levels.
• Failure to maintain key supplier relationships – the Group has strong partnerships with all major suppliers, with its dual brand
retail approach providing ranging and merchandising optionality and facilitating the execution of strategic initiatives at scale.
The Group’s store locations and high traffi c websites provide suppliers with high visibility for their products. However, a failure
to maintain key supplier relationships could adversely impact on the Group’s operating and fi nancial performance. The Group
has signifi cant supplier management processes to mitigate this risk and, whilst at any one time certain products and suppliers
are more important than others, the large and diverse range of products stocked by the businesses means that reliance on any
one supplier or product is less than for some smaller competitors. In addition, the JB Hi-Fi and The Good Guys businesses
have proven records of expansion into new product categories and introducing new brands, rather than remaining reliant on
those products and brands which were successful in previous years.
• Acquisition of The Good Guys business – the acquisition of The Good Guys business does not deliver the expected outcomes
for the Group. For example, The Good Guys business does not, itself, perform as expected or the acquisition has an adverse
effect on the performance of the JB Hi-Fi business due to, for example, management being preoccupied with The Good Guys
business.
• Growth of JB Hi-Fi Solutions and The Good Guys Commercial - the JB Hi-Fi Solutions and The Good Guys Commercial
businesses do not deliver the expected growth outcomes for the Group. The Group continues to invest in these businesses to
support their continued growth.
• JB Hi-Fi New Zealand business - if the performance of the JB Hi-Fi New Zealand business does not improve as expected, this
may have an adverse impact on the Group’s operating and fi nancial performance. The Group is in the process of implementing
a turnaround strategy to improve performance in the JB Hi-Fi New Zealand business.
• Increasing cost of doing business – certain costs of doing business are outside of the Group’s control. For example, the
Group’s cost of doing business is impacted by the annual Fair Work Award wage reviews (which have resulted in increases
totalling 15% over the past 5 years to 30 June 2019), and rising energy costs. However, the increasing scale of the Group’s
operations continues to deliver cost reductions which mean that higher wage costs can be offset to some extent by cost
reductions in other areas.
• Leasing arrangements – the ability to identify suitable sites and negotiate suitable leasing terms for new and existing stores is
key to the Group’s ongoing growth and profi tability. The Group believes that it will continue to be able to do this as it has done
successfully to date.
• Loss of, or inability to attract and retain, key staff – the Group’s ability to attract and retain talented staff is critical to its
operating and fi nancial performance. In recognition of this, succession planning and executive/senior management team
composition is a key focus for the Board and Group executive team.
• IT systems – the Group’s increasing reliance on IT systems means that outages, disruptions and security breaches could have
a detrimental impact on its operating and fi nancial performance, and any failure to maintain and upgrade its IT systems over
time has the potential to inhibit the achievement of the Group’s business initiatives. To mitigate these risks, the Group has
documented disaster recovery processes (including off-site IT back-up infrastructure) and invests in IT security measures.
The Group also continues to invest and develop its IT resources and capabilities to support the Group’s strategic objectives.
For
per
sona
l use
onl
y

30
• Changes in regulatory environment – changes in the regulatory environment in which the Group operates may increase
compliance costs, and even (in extreme cases) affect the ability of the Group to sell certain types of products and services or
conduct certain activities. Whilst such changes are outside the control of the Group, the Group monitors proposed changes
in the regulatory environment so that it can assess the impact of such changes and develop appropriate response strategies
where possible.
• Finance – a breach of the Group’s debt covenants or inability to access fi nancing facilities would adversely affect the Group’s
operating and fi nancial performance. The Group has signifi cant headroom in both its debt facilities and covenants. Additionally,
cash fl ow forecasts and debt capacity are closely monitored by management. Details of the Group’s fi nancing facilities are set
out on page 26.
• Fraud and corruption – the Group has no history of material fraud or corruption, and seeks to minimise the risk of loss arising
from fraud and corruption through appropriate policies, procedures and controls.
• Changes to Australian Accounting Standards – the Australian Accounting Standards are set by the Australian Accounting
Standards Board (“AASB”). Changes to the Australian Accounting Standards issued by AASB could adversely affect the
fi nancial performance and position reported in the Group’s fi nancial statements.
• Litigation/breach of legal or regulatory requirements – legal proceedings and claims may arise from time to time in the
ordinary course of the Group’s businesses and may result in high legal costs, adverse monetary judgements and/or damage
to the Group’s businesses which could have an adverse impact on the Group’s fi nancial position and fi nancial performance.
Additionally, a signifi cant breach of regulatory requirements or laws could adversely impact the Group’s ability to carry on its
business. The Group seeks to mitigate this risk through appropriate staff training on key regulatory and legislative requirements
relevant to its business, as well as making legal and regulatory compliance a key focus of the management team.
Business Strategies
The Group believes that the following strategies/factors will continue to drive growth in sales and earnings:
• proactive management of store portfolio with continuation of the Group’s disciplined approach to selecting new stores based
on high foot traffi c and closure of underperforming or sub-scale existing stores;
• continued focus on customer service and in-store experience;
• continued growth opportunities in many categories and in market share, both in physical stores and online;
• continued technological innovation and the launch of new products and updated models which will continue to drive new and
replacement sales;
• realisation of effi ciencies from the acquisition of The Good Guys and leveraging the scale of the Group;
• continued development of the Group’s websites and online offering, aimed at enhancing the user experience across multiple
platforms (e.g. computer, tablet & phone) to drive continued growth in online sales;
• expansion of the online product range and depth beyond that which is practical in store;
• signifi cant opportunities to grow JB Hi-Fi Solutions and The Good Guys Commercial and expand into new markets;
• ongoing focus on the Group merchandise function to provide strategic guidance and oversight of the Group’s buying, identify
Group buying opportunities and strengthen supplier relationships;
• design and implementation of an expanded services offering for the JB Hi-Fi Australia business;
• continued execution of the Group’s strategy to improve the performance of the JB Hi-Fi New Zealand business;
• personalisation of marketing and customer experiences;
• improved supply chain and logistics systems to support the Group’s expansion; and
• continued mitigation of the business risks faced by the Group detailed on pages 28 to 30.
OPERATING AND FINANCIAL REVIEW (continued)
For
per
sona
l use
onl
y

31
TRADING OUTLOOK – as at 12 August 2019
July 2019 sales update
• total sales growth for the JB Hi-Fi Australia business in July 2019 was 4.1% (July 2018: 2.9%) with comparable sales growth of
3.2% (July 2018: 0.3%);
• total sales growth for the JB Hi-Fi New Zealand business in July 2019 was -0.4% (July 2018: -2.1%) with comparable sales
growth of -0.3% (July 2018: 3.4%); and
• total sales growth for The Good Guys business in July 2019 was -2.1% (July 2018: 2.7%) with comparable sales growth of
-3.4% (July 2018: 1.4%).
FY2020 Guidance
Whilst there continues to be variability in the sales environment, the Group remains confident in its ability to execute and grow
market share. In FY2020 the Company expects total Group sales to be circa $7.25 billion, comprising:
• JB Hi-Fi Australia $4.84 billion;
• JB Hi-Fi New Zealand (NZD) $0.24 billion; and
• The Good Guys $2.18 billion.
For
per
sona
l use
onl
y

32
CONTENTS
• Summary (page 32)
• Group Executive Remuneration for FY2019 (page 34)
• Non-Executive Director Remuneration (page 41)
• Other Information (page 42)
• Key Management Personnel Compensation (page 43)
• Key Management Personnel Equity/Options (page 48)
• Share Options (page 53)
SUMMARY
Remuneration overview
The Board recognises that the performance of the Group depends on the quality and motivation of its people, including both the
Group executives (being those persons listed as executives on page 34) and the approximately 12,500 employees of the Group
across Australia and New Zealand. The Company’s remuneration strategy seeks to appropriately reward, incentivise and retain key
employees. The Board aims to achieve this by setting competitive remuneration packages that include a mix of fixed remuneration
and incentives (“packages”).
Snapshot - FY2019 remuneration
Group executive FY2019 remuneration packages
To remain competitive in attracting and retaining key talent in FY2019 the Board considered the remuneration levels and
remuneration structures for Group executives with reference to external market benchmarks as well as the skills, experience,
complexity and responsibilities of the executive roles. As a result of this review, for FY2019 the Board:
• increased fixed remuneration by 3.9% for the Group CEO and between 3.0% and 8.4% for other Group Executives (excluding
the Group CFO). The Group CFO’s fixed remuneration was increased by 16.6% given it had been set low compared to market
upon his appointment;
• introduced a minimum shareholding requirement for Group executives to create stronger alignment between executive reward
values and shareholder outcomes;
• replaced the previous short and long term incentive structure with a single simpler Variable Reward Plan (VRP). During FY2018
the Board reviewed the previous short term and long term incentive structures in place noting: (i) the diffi culty in setting long
term EPS growth targets that were seen as motivating by executives and considered challenging enough by shareholders in a
volatile retail environment where it is diffi cult to confi dently form a long term view on performance; and (ii) that the success of
meeting LTI targets (or not) in past years was often linked to macro-economic factors or share price volatility, as much as the
quality of company or executive performance. This led to volatility in LTI vesting (generally near or close to 100% or not at all).
The new VRP allows for fl exibility in setting performance targets to take into account changing trading conditions, providing
a more motivating remuneration framework for Group executives and greater alignment with shareholders, with only 25% of
incentives earned being paid in cash and the remainder in restricted shares. Further detail on the new VRP is set out on
pages 35 to 37; and
• reduced the overall amount of remuneration offered to Group executives (from what would have been offered had the
previous structure been retained for FY2019), reducing the proportion of the reward paid in cash, and increasing the
proportion of reward delivered in fully paid ordinary shares that are to be held over the long term under the new minimum
shareholding requirement.
Group executive FY2019 incentive achievement
The 2019 financial year has been a successful year for the Group, with management having delivered record revenue (up 3.5%),
EBIT (up 6.4%) and EPS (up 7.1%) in a challenging retail environment. This strong performance has been reflected in vesting
outcomes of incentives for Group executives, with between 71% and 82% of rewards available under the VRP for the year
(or, in the case of Terry Smart, the Company’s STI plan) being earned.
REMUNERATION REPORT (audited)
For
per
sona
l use
onl
y

33
In regards to FY2019 VRP targets, 75% of available rewards were linked to financial measures, primarily FY2019 Group EPS
growth, with between 65% and 82% of available rewards for the financial performance component earned by each Group
executive. The remaining 25% of available rewards were dependent upon the achievement of various strategic measures deemed
relevant for the individual executive. Between 71% and 87% of available rewards for this strategic component were earned by
each executive. Further detail is set out on pages 36 to 37.
Group executive incentive achievement outcomes under the FY2019 VRP were broadly in line with achievement outcomes under
the Group’s previous incentive structure when comparing similar financial performance, as shown in the table on page 39.
All long-term incentives (“LTI”) issued to Group executives prior to the adoption of the variable reward plan for FY2019 were in the
form of share options subject to both service and performance based conditions. Given strong EPS growth in recent years, some
of the options issued to Group executives in previous years vested in FY2019.
Non-Executive Directors FY2019 remuneration
Fees for non-executive directors remained at the levels set for FY2018, with no increases. In FY2019 the Company adopted a
minimum shareholding requirement for non-executive directors.
FY2020 remuneration
The Company will retain the same structure for FY2020 Group executive remuneration as was used in FY2019.
With the exception of Lynda Blakely and Simon Page who have recently been promoted to their Group executive roles:
• there will be no increases in fixed annual remuneration for Group executives for FY2020; and
• only Tim Carter will receive an increase to his incentive package for FY2020.
The Group financial component of the VRP (EPS growth) will again be set in line with the Company’s historical incentive ranges
i.e. commencing rewards when performance exceeds the previous year’s earnings performance and paying maximum reward
at 10% earnings growth. Within this range the % of the incentive payable will be set taking account of Board approved annual
budgets and longer term corporate plans.
Fees for non-executive directors will remain at the levels set for FY2018 and FY2019.
For
per
sona
l use
onl
y

34
GROUP EXECUTIVE REMUNERATION FOR FY2019
Details of executive key management personnel
The following persons acted as executive directors and/or Group executives during and since the end of the financial year and are
considered members of key management personnel for reporting purposes:
Executive Director
Richard Murray Group Chief Executive Officer
Executives
Cameron Trainor Managing Director – JB Hi-Fi (Managing Director – Group Merchandise from 13 August 2018 –
18 June 2019)
Terry Smart Managing Director – The Good Guys
Nick Wells Group Chief Financial Officer
Tim Carter Group Supply Chain & Commercial Director
James Saretta Strategy & Digital Director
Lynda Blakely Group HR Director (from 4 June 2019)
Simon Page Group Technology Director (from 4 June 2019)
Group executive remuneration policy – 2019 fi nancial year
The Board believes that executive remuneration should be fair and reasonable, structured effectively to attract, motivate, retain and
reward valued executives, and designed to produce value for shareholders.
The Remuneration Committee annually reviews the remuneration packages of all Group executives and makes recommendations
to the Board. Remuneration packages are reviewed with due regard to performance and data on remuneration paid by
comparable companies. Where appropriate, the Remuneration Committee may receive expert independent advice regarding
remuneration levels required to attract, retain and compensate Group executives given the nature of their work and responsibilities.
In setting the FY2019 remuneration packages, the Board and the Remuneration Committee considered a number of factors,
including current market practice.
The Remuneration Committee also considered current market conventions with regard to the splits between fixed remunerations
and incentive elements. The package splits for FY2019 were as follows:
Executive Fixed Incentive(i) Total
R. Murray 33% 67% 100%
C. Trainor 38% 62% 100%
T. Smart 38% 62% 100%
N. Wells 38% 62% 100%
T. Carter 43% 57% 100%
J. Saretta 43% 57% 100%
S. Page 45% 55% 100%
L. Blakely 70% 30% 100%
(i) For all Group executives other than T. Smart, L. Blakely and S. Page, incentive is in the form of VRP. For T. Smart and L. Blakely the incentive
is the combined STI/LTI opportunity, and for S. Page the incentive is the combined STI/LTI and VRP opportunity as set out on page 38.
Further details on each of the key elements of Group executive remuneration for the 2019 financial year are set out below.
Fixed remuneration
Fixed remuneration is paid by way of base salary, motor vehicle allowances and superannuation. No elements of fixed
remuneration are dependent on performance conditions.
REMUNERATION REPORT (continued)
For
per
sona
l use
onl
y

35
Variable Reward Plan Incentive
In FY2018, the Remuneration Committee and the Board reviewed the reward framework to consider what was fit for purpose for
the Group going forward in a changing retail environment which is subject to macroeconomic factors often beyond the control of
the Group.
When considering the appropriateness of the previous STI and LTI structure, the Board noted that:
• it is increasingly difficult to set long term EPS growth targets that are seen as motivating by executives and considered
challenging enough by shareholders in a volatile retail environment where it is difficult to confidently form a long term view on
performance; and
• in the past, the success of meeting LTI targets (or not) has often been linked to macro-economic factors or share price volatility
as often as the quality of company or executive performance. This has led to volatility in LTI vesting (generally near or close to
100% or not at all).
To address these challenges, for FY2019 the Board elected to simplify its Group executive reward framework to one that is fit for
a retail business that is subject to many short term influences by combining the previous Group STI and LTI structures into a
single VRP. Under the VRP, performance is assessed at the end of each financial year against a scorecard of robust measures
and awards under the VRP are delivered:
• 25% in cash at the end of the one-year performance period; and
• 75% in restricted shares, to be released progressively in equal tranches over years 2, 3 and 4.
This is a significant reduction from the proportion of cash available annually to executives under the previous STI and LTI plans.
By granting the majority of the reward as shares that are restricted over the medium to longer term, and are subject to long
term share price risk and clawback, the VRP provides for stronger shareholder alignment than the Group’s previous STI and LTI
program. This, combined with the introduction of minimum shareholding guidelines as set out on page 40, encourages Group
executives to think and act like shareholders and to make decisions in the long term interests of the Group.
In addition, in view of the move to an annual performance period rather the previous 3 and 4 year periods applicable to the LTI,
Group executive opportunity levels under the VRP were made at a 20% discount to the LTI opportunity levels that would have
been offered had the previous structure been retained. The amount of discount reflects relative STI and LTI outcomes over
recent years.
During the restricted period dividends are paid on the restricted shares and the executive may exercise votes attaching to these
shares. The market value of a share used to calculate the number of restricted shares granted will be the volume weighted average
price of shares traded on the ASX in the 5 trading days immediately following the release of the Company’s financial results for the
year to which the award relates, or the actual average cost incurred by the Company in acquiring the shares.
All rewards under the VRP are subject to clawback at the Board’s discretion in the event of fraud, dishonesty, material
misstatement, material breach or negligence by the Group executive and in certain other circumstances.
Subject to the Board exercising its discretion to the contrary, a Group executive will not be eligible to receive a VRP award in
respect of a particular performance period if, during that period, the executive ceases to be employed, or has given notice of his or
her resignation from employment or has been given notice of termination from employment. A Group executive who ceases to be
employed during the restriction period will, subject to the Board’s discretion:
• forfeit the restricted shares if they are a “bad leaver” (termination for cause or resignation to work for a competitor);
• retain the restricted shares, subject to the restrictions, if they are a “good leaver” (retirement, redundancy, disablement,
mental/terminal illness or death).
Treatment of restricted shares where a Group executive leaves in other circumstances is at the Board’s discretion.
Further detail on the performance measures under the FY2019 VRP is set out on the following pages.For
per
sona
l use
onl
y

36
FY2019 VRP incentive scorecard - performance conditions and outcomes
Under the VRP, performance is assessed at the end of each financial year against a scorecard of robust measures. 75% of the
rewards under the plan for each executive are dependent on financial targets and the remaining 25% of the scorecard are based
on strategic measures approved by the Board and aligned with the Group’s long term corporate plans. The financial targets in the
scorecard are predominantly based on Group EPS, with some executives also having targets relating to aspects of the business
for which that executive is responsible or where particular focus is required.
For FY2019, for the Group financial component of the VRP, the performance range was in line with the Company’s historical
incentive ranges i.e. commencing rewards when performance exceeds the previous year’s earnings performance and paying
maximum reward at 10% earnings growth. Within this range the % of the incentive payable was set taking account of Board
approved budgets and longer term corporate plans.
Composition of, and achievement under, the FY2019 VRP for Group executives (STI for Terry Smart) was as follows:
MEASURE ACHIEVEMENT
(as a % of maximum
available)
PERFORMANCE COMMENTARY
GROUP CEO – RICHARD MURRAY
Financial
Measures
(75%)
Group EPS 77% Richard achieved above target results in respect of Group EPS
(7.1% growth from 203.1 to 217.4 cents per share).
Strategic
Measures
(25%)
OHS, diversity,
succession/talent,
strategic initiatives,
Investor relations
76% Richard achieved his overall strategic objectives with continued
improvements in OHS metrics (LTIFR down significantly),
significant diversity initiatives introduced, implementation of key
strategic initiatives, finalisation of Group leadership team and
progress in succession planning and talent development, and
effective investor relations engagement.
MANAGING DIRECTOR, JB HI-FI – CAMERON TRAINOR (GROUP MERCHANDISE DIRECTOR FROM AUGUST 2018 – JUNE 2019)
Financial
Measures
(75%)
Group EPS, Group
comparative sales,
Group stock turns,
Group synergies/
cost-out
77% Cameron achieved above target results in respect of Group
EPS (7.1% growth from 203.1 to 217.4 cents per share), and
achieved the maximum available in respect of Group stock
turn and Group synergy targets. Achievement for Group
comparative sales was below target.
Strategic
Measures
(25%)
Establish Group
Merchandise
Function, OHS,
succession/talent/
diversity, Group
services & Private
Label Strategy
78% Cameron achieved his overall strategic objectives with the
successful establishment of Group Merchandise Function,
continued improvements in OHS metrics (LTIFR down
significantly), progress in succession planning and talent
development in merchandise teams across the Group, and
implementation of Private Label Strategy with introduction of
the “FFalcon” brand.
MANAGING DIRECTOR, THE GOOD GUYS – TERRY SMART(1)
Financial
Measures
(75%)
Group EPS,
TGG EBIT, TGG
comparative sales,
TGG stock turns
65% Terry achieved above target results in respect of Group
EPS (7.1% growth from 203.1 to 217.4 cents per share)
and The Good Guys EBIT. Achievement for The Good Guys
comparative sales growth and stock turns was below target.
Strategic
Measures
(25%)
OHS, succession/
talent/diversity,
Group Merchandise
Function, category
architecture, process
improvements and
simplification
87% Terry exceeded his overall strategic objectives with continued
improvements in OHS metrics (LTIFR down significantly),
progress in succession planning and talent development
including key leadership appointments in The Good Guys
senior management and executive teams, supporting
the successful establishment of Group Merchandise
Function, implementation of category architecture resulting
in improvements in store layout and merchandising, and
significant improvements in and simplification of business
processes resulting in cost savings.
REMUNERATION REPORT (continued)
For
per
sona
l use
onl
y

37
MEASURE ACHIEVEMENT
(as a % of maximum
available)
PERFORMANCE COMMENTARY
GROUP CFO – NICK WELLS
Financial
Measures
(75%)
Group EPS,
Group synergies/
costs-out, Group
stock turns, Group
interest expense
80% Nick achieved above target results in respect of Group EPS
(7.1% growth from 203.1 to 217.4 cents per share) and Group
interest expense, and achieved the maximum available in
respect of Group stock turn and Group synergy targets.
Strategic
Measures
(25%)
OHS, succession/
talent/diversity,
risk management,
investor relations,
Support Office
consolidation
77% Nick achieved his overall strategic objectives with continued
improvements in OHS metrics (LTIFR down significantly),
progress in succession planning and talent development and
diversity within the finance team, effective investor relations
engagement and successful consolidation of JB Hi-Fi and
TGG Support Offices into one support office.
GROUP SUPPLY CHAIN & COMMERCIAL DIRECTOR – TIM CARTER
Financial
Measures
(75%)
Group EPS, JB
Hi-Fi Solutions EBIT,
JB Hi-Fi Solutions
comparable sales
growth, supply chain
savings
82% Tim achieved above target results in respect of Group EPS
(7.1% growth from 203.1 to 217.4 cents per share) and supply
chain savings, and achieved the maximum available in respect
of JB Hi-Fi Solutions EBIT and comparable sales growth.
Strategic
Measures
(25%)
OHS, succession/
talent/diversity, Group
supply chain strategy,
Group Private Label
Strategy, Group
Commercial strategy
83% Tim exceeded his overall strategic objectives with continued
improvements in OHS metrics (LTIFR down significantly),
progress in succession planning and talent development
including key leadership appointments, development of Group
supply chain strategy, implementation of Private Label Strategy
with introduction of the “FFalcon” brand, and continued roll-out
of Group commercial strategy including JB Hi-Fi Solutions and
The Good Guys Commercial.
STRATEGY & DIGITAL DIRECTOR – JAMES SARETTA
Financial
Measures
(75%)
Group EPS, JB Hi-Fi
Online EBIT, JB Hi-Fi
Online comparative
sales, Group
synergies/costs-out
81% James achieved above target results in respect of Group
EPS (7.1% growth from 203.1 to 217.4 cents per share), and
achieved the maximum available in respect of JB Hi-Fi Online
EBIT, JB Hi-Fi Online comparative sales growth, and Group
synergy targets.
Strategic
Measures
(25%)
Group strategy
framework, Group
supply chain strategy,
role of brands
strategy, succession/
talent/diversity, OHS
71% James achieved his overall strategic objectives with ongoing
development of the Group’s strategy framework, the Group’s
role of brands strategy and the Group’s succession planning
& talent development framework, and improvement in OHS
metrics (LTIFR down significantly).
Notes
1. Given T. Smart received a one-off 3 year grant of LTI on re-joining the Group in April 2017, he did not participate in the VRP for FY2019.
Instead, he was able to earn an STI in FY19. Further detail is set out below.
2. Information for L. Blakely and S. Page is not included as they only became key management personnel on 4 June 2019.For
per
sona
l use
onl
y

38
Short-term incentive
Given Terry Smart received a one-off 3 year grant of LTI on re-joining the Group in April 2017, he did not participate in the VRP
for FY2019. Instead, he was able to earn an STI in FY19 based on the same scorecard structure as other Group executives under
the VRP. 80% of Terry’s STI will be paid in cash, with the remaining 20% deferred into shares which are subject to a restriction
on sale/disposal for 1 year after issue. The number of shares granted is calculated on the basis of the volume weighted average
share price for the Company’s shares in the five days following the release of the Company’s FY2019 results to the ASX. From
FY2021Terry will participate in the VRP.
Simon Page and Lynda Blakely were also eligible to receive STIs in FY2019, having only been appointed as Group executives
(and become key management personnel) on 4 June 2019. Simon and Lynda will participate in the VRP (and will not be eligible to
receive STIs) in FY2020.
Long-Term Incentive (“LTI”) Plan
Some of the options granted to Group executives prior to FY2019 under the Company’s previous LTI structure vested in FY2019.
Details of options that vested and were exercised are set out on page 51.
Further details of the terms of these options are included under the heading “Group share option plans” on page 53.
Relationship between fi nancial performance and remuneration
The Group’s executive remuneration is directly related to the performance of the Group through the linking of the incentives to
certain financial measures as detailed previously and shown below.
The financial performance of the Group is summarised in the table below, whilst the alignment of executive remuneration to the
performance of the Group is detailed in the graph and the table on page 39.
Growth
FY2015 FY2016 FY2017 FY2018 FY2019 FY2019
CAGR
Last
5 years(iii)
1. Financial performance:
Sales ($m) 3,625.1 3,954.5 5,628.0 6,854.3 7,095.3 4% 15%
EBIT ($m) 200.9 221.2 290.5(v) 350.6 372.9 6% 14%
Net profit attributable to owners of
the Company ($m) 136.5 152.2 192.2(v) 233.2 249.8 7% 14%
Basic EPS (cents) 137.9 153.8 172.1(v) 203.1 217.4 7% 11%
2. Shareholder value created:
Company share price at the end of
the reporting period ($) 19.48 24.10 23.37 22.52 25.85 15% 7%
Market capitalisation ($m) 1,928.3 2,384.6 2,674.0 2,587.2 2,969.7 15% 10%
Enterprise value(i) ($m) 2,018.7 2,442.5 3,160.0 2,984.5 3,289.6 10% 11%
Movement in enterprise value during
the financial year ($m) 71.7 423.8 717.5 (175.5) 305.1
Dividends paid to shareholders
during the financial year ($m) 87.2 93.2 119.1 151.6 157.4 4% 15%
On market share buy-back ($m) 5.0 13.2 – – –
Shareholder value created(ii)
- per annum ($m) 163.9 530.2 836.6 (23.9) 462.5
- cumulative ($m) since IPO 2,561.2 3,091.4 3,928.1 3,904.2 4,366.7 12% 22%(iv)
(i) Enterprise value is measured as the sum of market capitalisation and net debt.
(ii) Shareholder value created is measured as the increase in the enterprise value, plus cash dividends and share buy-backs paid during the financial
year. Cumulative shareholder value is measured from the date of listing in October 2003 when opening shareholder value was $201.7m.
(iii) Percentage movement shown is the compound annual growth rate over the last 5 years.
(iv) Percentage movement shown is the compound annual growth rate since IPO.
(v) FY2017 EBIT, net profit and EPS exclude transaction fees and implementation costs totalling $22.4m associated with the acquisition of
The Good Guys in November 2016 but include New Zealand Goodwill and New Zealand Fixed Asset impairments of $15.8 million.
REMUNERATION REPORT (continued)
For
per
sona
l use
onl
y

39
The graph below shows the relationship between total Group executive remuneration and EPS over the past 5 years and the high
correlation of Group executive remuneration with Company performance.
Group executive remuneration and EPS over the last 5 financial years:
-
50
100
150
200
250
-
2,000,000
4,000,000
6,000,000
8,000,000
10,000,000
12,000,000
14,000,000
2015
Rem
une
ration $
LTI/VRP Shares
STI/VRP Cash
Fixed
EPS
EP
S (cen
ts p
er
sh
are
)
2019201820172016
Notes
1. The graph shows the aggregate total of remuneration for the Group executive team for each year from 2015 to 2019, excluding payments made
in relation to departures from the Group. The number of executives engaged during each of these years varied.
2. LTI/VRP expense is the current period LTI/VRP expense only, excluding any prior period write-backs.
3. EPS in FY2017 excludes transaction fees and implementation costs totalling $22.4m associated with the acquisition of The Good Guys in
November 2016 but includes New Zealand Goodwill and New Zealand Fixed Asset impairments of $15.8 million.
Group CEO STI and VRP incentive achievement over the last 5 financial years:
Group executive incentive achievement outcomes continue to align with the financial performance and strategic objectives of the
Group. The table below sets out the Group CEO’s incentive achievement over the last 5 years, with FY2019 under the VRP and
FY2015 to FY2018 under the Group’s previous STI incentive structure.
Group Financial Target
Financial Year(i)
Incentive
Target
(Growth)
Actual
Growth Achievement
Non-Financial
Target
Achievement
Total
Achievement
2015 0 - 10% 5.1% 51% 100% 63%
2016 0 - 10% 10.1% 100% 100% 100%
2017 0 - 10% 21.2% 100% 100% 100%
2018 23% - 34%(ii) 30.8% 71% 96% 77%
2019 0 - 10% 7.1% 77% 74% 76%
Notes
(i) FY2015 – FY2018 STI target based on EBIT, FY2019 VRP target based on EPS.
(ii) FY2018 target increased due to the acquisition of The Good Guys and JB Hi-Fi New Zealand goodwill impairment in the base in the prior year,
on an underlying basis this represented 0-10% growth target.
For
per
sona
l use
onl
y

40
The effectiveness of the executives’ performance related remuneration in driving performance is reflected in the long term growth
of the share price of the Company. The following graph plots the JB Hi-Fi closing share price and the ASX 200 on a daily basis
between listing on the ASX and 1 August 2019. The JB Hi-Fi closing share price compound annual growth rate between listing
and 1 August 2019 is 20.0%, whilst the ASX 200 compound annual growth rate over the same period is 4.7%.
$0.00
$5.00
$10.00
$15.00
$20.00
$25.00
$30.00
$35.00
Share
Price
Oct-
03
Oct-
04
Oct-
05
Oct-
06
Oct-
07
Oct-
08
Oct-
09
Oct-
10
Oct-
11
Oct-
12
Oct-
13
Oct-
14
Oct-
15
Oct-
16
Oct-
18
Oct-
17
Oct-
19
JB Hi-Fi Share Price ASX 200 (rebased against JBH share price)
Key terms of executive employment agreements
The remuneration and other terms of employment for each of the Group executives are set out in individual Company employment
agreements. None of the executives are subject to a fixed term of employment.
Name Notice Periods/Termination Payment/Non-compete
R. Murray 12 months’ notice (or payment in lieu)
12 months’ post termination non-compete and non-solicitation restriction
C. Trainor 9 months’ notice (or payment in lieu) if terminated by the Company
6 months’ notice if notice is given by the executive
6 months’ post termination non-compete and non-solicitation restriction
T. Smart, N. Wells, T. Carter, J. Saretta,
L. Blakely, S. Page
6 months’ notice (or payment in lieu)
6 months’ post termination non-compete and non-solicitation restriction
Each Group executive may be terminated immediately for serious misconduct. In no instance would a payment in lieu of notice
exceed the termination payments limits set out in the Corporations Act 2001.
Each of the Group executive service contracts contains contractual entitlements for the Company to clawback incentive
remuneration in the event of fraud, dishonesty, or material misstatements in, or omissions from, the Company’s financial
statements or misstatements concerning the satisfaction of a performance condition.
Minimum shareholding guidelines
Building Group executive shareholdings is a priority of the Board in the context of executive retention, and to ensure Group
executives are invested in the long term success of the Group and aligned with shareholder interests.
In conjunction with introducing the VRP, a minimum shareholding requirement for senior executives was introduced in FY2019, being:
• 1.5 times fixed pay for the CEO; and
• 1.0 times fixed pay for the other Group executives.
This level of shareholding is required to be built over 5 years from the introduction of the VRP (or appointment, if later).
REMUNERATION REPORT (continued)
For
per
sona
l use
onl
y

41
NON-EXECUTIVE DIRECTOR REMUNERATION
FY2019 Non-Executive Director Remuneration
The following persons acted as non-executive directors of the Company during and since the end of the financial year and are
considered members of key management personnel:
Greg Richards Non-executive Director, Chair of the Board and Remuneration Committee
Stephen Goddard Non-executive Director and Member of the Audit and Risk Management Committee
Beth Laughton Non-executive Director, Chair of the Audit and Risk Management Committee and Member of the
Remuneration Committee
Mark Powell Non-executive Director and Member of the Audit and Risk Management Committee
Wai Tang Non-executive Director, Member of the Audit and Risk Management Committee and the
Remuneration Committee
Richard Uechtritz Non-executive Director
The overriding objective of the JB Hi-Fi remuneration policies with regard to non-executive directors is to ensure the Company
is able to attract and retain non-executive directors with the skills and experience to enable the Board to discharge its oversight
and governance responsibilities in an effective and diligent manner. The Board also believes that remuneration for non-executive
directors should reflect the time commitment and responsibilities of the role.
The remuneration packages for non-executive directors for FY2019 are set out below and are at the same level as those for
FY2018. Aggregate non-executive director remuneration for FY2019 was within the amount determined by the Company in its
Annual General Meeting on 26 October 2017 being $1,500,000.
Role
Fees
2019
$
Fees
2018
$
Chair of the Board $300,000 $300,000
Non-executive director $134,000 $134,000
Additional Committee Fees
Remuneration Committee Chair $25,000 $25,000
Audit and Risk Management Committee Chair $32,000 $32,000
Audit and Risk Management Committee member $16,000 $16,000
Remuneration Committee member $14,000 $14,000
Superannuation contributions are made by the Company on behalf of non-executive directors in line with statutory requirements
and are included in the remuneration package amount. It is the policy of the Company not to pay lump sum retirement benefits to
non-executive directors.
It is the policy of the Company not to have any elements of non-executive director remuneration at risk. Specifically, non-executive
directors do not receive any bonus payments and are not entitled to participate in any Company share option plans or the VRP.
In order to further align non-executive directors with shareholders of the Company, a minimum shareholding requirement for
non-executive directors was introduced in October 2018, being 1 times the base board fees for the non-executive director.
This level of shareholding is required to be built over 5 years from the introduction of the policy (or appointment, if later).
FY2020 Non-Executive Director Remuneration
Non-executive directors’ fees will remain at the current level for FY2020. The Remuneration Committee will continue to review
remuneration for non-executive directors on an annual basis in order to ensure that the objectives set out above in respect of
non-executive directors’ remuneration are met.
For
per
sona
l use
onl
y

42
OTHER INFORMATION
Remuneration recommendations
In FY2018, KPMG-3dc was engaged to provide remuneration recommendations for FY2019 in accordance with the provisions
of the Corporations Act 2001 and was paid $16,000 (excluding GST) for remuneration recommendations regarding the
FY2019 remuneration levels for the Group CEO and Group CFO. KPMG-3dc provided a formal declaration confirming that its
recommendations were made free from undue influence by the member or members of the key management personnel to
whom the recommendations related and, in view of this declaration and the process adopted in the engagement of KPMG-3dc
and receipt of its recommendations, the Board is satisfied that each of the recommendations were free of undue influence by
such persons.
During FY2019, KPMG-3dc acted as remuneration advisor to the Remuneration Committee. No remuneration recommendations
(as defined in the Corporations Act) were provided by KPMG-3dc during FY2019.
Board policy with regard to executives limiting their exposure to risk in relation to equity options
The Company’s Securities Trading Policy prohibits directors, executives, senior management and other specified employees from
altering the economic benefit or risk derived by them in relation to any unvested equity options that they hold. The Policy also
requires directors and Group executives to obtain prior written approval from the Chair of the Board before altering the economic
benefit or risk derived by them in relation to any shares or vested options in JB Hi-Fi held by them. Each year directors and
executives are required to sign a declaration that they are in compliance with all elements of the JB Hi-Fi Securities Trading Policy.
These declarations have been received in relation to the 2019 financial year from all directors and Group executives.
REMUNERATION REPORT (continued)
For
per
sona
l use
onl
y

43
KEY MANAGEMENT PERSONNEL COMPENSATION
Key management personnel for FY2019 include the non-executive directors and the eight identified executives set out on page 34.
The aggregate compensation of the key management personnel of the Group for FY2019 is set out below:
Consolidated
2019
$
2018
$
Short-term employee benefits
Salary, fees & allowances 6,175,428 5,796,481
Bonus 746,652 3,177,120
VRP Cash 1,388,686 –
8,310,766 8,973,601
Post-employment benefits
Superannuation 238,607 230,482
238,607 230,482
Share based payments
Options expense 2,723,538 2,942,717
VRP expense 1,506,541 –
4,230,079 2,942,717
12,779,452 12,146,800
For
per
sona
l use
onl
y

44
The compensation for each member of the key management personnel of the Group is set out below:
Short-term employee benefits
Post-
employ-
ment
benefits Share based payments
Salary,
fees &
allowances Bonus(ii) VRP Cash(ii)
Total
short-term
employee
benefits
Super-
annuation Options(i)(ii) VRP(ii)(iii)
Total share
based
payments Total
2019 $ $ $ $ $ $ $ $ $
Non-executive
directors
G. Richards 304,951 – – 304,951 20,049 – – – 325,000
B. Laughton 164,384 – – 164,384 15,616 – – – 180,000
W. Tang 149,772 – – 149,772 14,228 – – – 164,000
R. Uechtritz 122,374 – – 122,374 11,626 – – – 134,000
S. Goddard 136,986 – – 136,986 13,014 – – – 150,000
M. Powell 136,986 – – 136,986 13,014 – – – 150,000
1,015,453 – – 1,015,453 87,547 – – – 1,103,000
Executives
R. Murray 1,324,519 – 534,759 1,859,278 24,519 930,246 579,323 1,509,569 3,393,366
C. Trainor 1,003,943 – 319,277 1,323,220 24,519 430,514 345,883 776,397 2,124,136
T. Smart(iv) 1,004,036 727,421 – 1,731,457 25,000 657,865 – 657,865 2,414,322
N. Wells 673,557 – 222,458 896,015 24,519 264,900 240,996 505,896 1,426,430
T. Carter 549,999 – 159,467 709,466 24,519 235,319 172,756 408,075 1,142,060
J. Saretta 550,000 – 152,725 702,725 24,519 185,263 165,452 350,715 1,077,959
S. Page(v) 33,092 15,385 – 48,477 1,886 15,447 2,131 17,578 67,941
L. Blakely(v) 20,829 3,846 – 24,675 1,579 3,984 – 3,984 30,238
5,159,975 746,652 1,388,686 7,295,313 151,060 2,723,538 1,506,541 4,230,079 11,676,452
6,175,428 746,652 1,388,686 8,310,766 238,607 2,723,538 1,506,541 4,230,079 12,779,452
(i) In accordance with Accounting Standards, remuneration includes the amortisation of the fair value of options issued under the Group share
option plans that are expected to vest, less any write-back on options lapsed or expected to lapse as a result of actual or expected performance
against non-market hurdles (“Option Accounting Value”). The fair value of options is measured at grant date in accordance with the relevant
accounting standard and progressively allocated to profit and loss over the vesting period of the option. The amount included in remuneration
above may not be indicative of the benefit (if any) that key management personnel may ultimately realise should the equity instruments vest.
(ii) Performance based.
(iii) In accordance with Accounting Standards, remuneration includes the amortisation of the value of VRP that is paid in restricted shares. The value
of shares is progressively allocated to profit and loss over the restriction period of the share.
(iv) Given T. Smart received a one-off 3 year grant of LTI on re-joining the Group in April 2017, he did not participate in the VRP for FY2019. Instead,
he was able to earn an STI in FY19. 80% of this STI will be paid in cash with 20% paid in deferred shares. Further detail is set out on page 38.
(v) All amounts disclosed for S. Page and L. Blakely are for the period that they were classified as key management personnel (4 June 2019 to
30 June 2019).
REMUNERATION REPORT (continued)
For
per
sona
l use
onl
y

45
Performance based Short-term employee benefits
Bonus VRP Cash
Maximum Potential Actual Maximum Potential Actual
2019 $
% of total
potential
remuneration $
% of total
actual
remuneration $
% of total
potential
remuneration $
% of total
actual
remuneration
Executives
R. Murray – – – – 698,625 19% 534,759 16%
C. Trainor – – – – 412,000 18% 319,277 15%
T. Smart(i) 1,030,000 38% 727,421 30% – – – –
N. Wells – – – – 280,000 18% 222,458 16%
T. Carter – – – – 194,063 16% 159,467 14%
J. Saretta – – – – 194,063 17% 152,725 14%
S. Page(ii) 19,615 27% 15,385 23% – – – –
L. Blakely(ii) 3,846 13% 3,846 13% – – – –
1,053,461 8% 746,652 6% 1,778,751 14% 1,388,686 12%
Performance based Share based payments
Options VRP Shares
Maximum Potential Actual Maximum Potential Actual
2019 $
% of total
potential
remuneration $
% of total
actual
remuneration $
% of total
potential
remuneration $
% of total
actual
remuneration
Executives
R. Murray 930,246 25% 930,246 27% 756,844 20% 579,323 17%
C. Trainor 430,514 19% 430,514 20% 446,333 19% 345,883 16%
T. Smart(i) 657,865 24% 657,865 27% – – – –
N. Wells 264,900 17% 264,900 19% 303,333 20% 240,996 17%
T. Carter 235,319 19% 235,319 21% 210,234 17% 172,756 15%
J. Saretta 185,263 16% 185,263 17% 210,234 18% 165,452 15%
S. Page(ii) 15,447 21% 15,447 23% 2,778 4% 2,131 3%
L. Blakely(ii) 3,984 13% 3,984 13% – – – –
2,723,538 21% 2,723,538 23% 1,929,756 15% 1,506,541 13%
(i) Given T. Smart received a one-off 3 year grant of LTI on re-joining the Group in April 2017, he did not participate in the VRP for FY2019. Instead,
he was able to earn an STI in FY19. Further detail is set out on page 38.
(ii) All amounts disclosed for S. Page and L. Blakely are for the period that they were classified as key management personnel (4 June 2019 to
30 June 2019).
For
per
sona
l use
onl
y

46
The VRP Shares amounts included in the table above represent the FY2019 Maximum Potential accounting expense and Actual
accounting expense recognised in accordance with Accounting Standards. The Maximum Potential VRP Shares available for
each Group Executive, based on their remuneration package, and the Actual VRP Shares earned in FY2019 (to be issued in
August 2019), is set out in the table below.
VRP Incentive Package VRP Incentive Achieved
Maximum
Potential
Cash
Maximum
Potential
Shares
Total
VRP
Incentive
Package Achieved
Actual
Cash
Actual
Shares
Total
VRP
achieved
2019 $ $ $ % $ $ $
Executives
R. Murray 698,625 2,095,875 2,794,500 77% 534,759 1,604,278 2,139,037
C. Trainor 412,000 1,236,000 1,648,000 78% 319,277 957,831 1,277,108
T. Smart – – – – – – –
N. Wells 280,000 840,000 1,120,000 79% 222,458 667,373 889,831
T. Carter 194,063 582,188 776,251 82% 159,467 478,402 637,869
J. Saretta 194,063 582,188 776,251 79% 152,725 458,174 610,899
S. Page(i) – 7,692 7,692 77% – 5,902 5,902
L. Blakely(i) – – – – – – –
1,778,751 5,343,943 7,122,694 78% 1,388,686 4,171,960 5,560,646
(i) All amounts disclosed for S. Page and L. Blakely are for the period that they were classified as key management personnel (4 June 2019 to
30 June 2019).
Short-term employee benefits
Post-
employ-
ment
benefits
Share based
payments
Salary,
fees &
allowances Bonus(ii)
Total
short-term
employee
benefits
Super-
annuation Options(i)(ii) Total
2018 $ $ $ $ $ $
Non-executive directors
G. Richards 304,951 – 304,951 20,049 – 325,000
B. Laughton 164,384 – 164,384 15,616 – 180,000
W. Tang 149,772 – 149,772 14,228 – 164,000
R. Uechtritz 122,374 – 122,374 11,626 – 134,000
S. Goddard 136,986 – 136,986 13,014 – 150,000
M. Powell 136,986 – 136,986 13,014 – 150,000
1,015,453 – 1,015,453 87,547 – 1,103,000
Executives
R. Murray 1,274,058 999,622 2,273,680 24,712 1,063,151 3,361,543
C. Trainor 925,770 580,114 1,505,884 23,750 497,240 2,026,874
T. Smart 960,527 602,904 1,563,431 20,049 657,865 2,241,345
N. Wells 572,981 349,992 922,973 24,712 287,171 1,234,856
T. Carter 523,942 320,826 844,768 24,712 266,947 1,136,427
J. Saretta 523,750 323,662 847,412 25,000 170,343 1,042,755
4,781,028 3,177,120 7,958,148 142,935 2,942,717 11,043,800
5,796,481 3,177,120 8,973,601 230,482 2,942,717 12,146,800
(i) In accordance with Accounting Standards, remuneration includes the amortisation of the fair value of options issued under the Group share
option plans that are expected to vest, less any write-back on options lapsed or expected to lapse as a result of actual or expected performance
against non-market hurdles (“Option Accounting Value”). The fair value of options is measured at grant date in accordance with the relevant
accounting standard and progressively allocated to profit and loss over the vesting period of the option. The amount included in remuneration
above may not be indicative of the benefit (if any) that key management personnel may ultimately realise should the equity instruments vest.
(ii) Performance based.
REMUNERATION REPORT (continued)
For
per
sona
l use
onl
y

47
Performance based
Short-term employee benefits Share based payments
Maximum Potential STI Actual STI Maximum Potential LTI Actual LTI
Bonus Bonus Options Options
2018 $
% of total
potential
remuneration $
% of total
actual
remuneration $
% of total
potential
remuneration $
% of total
actual
remuneration
Executives
R. Murray 1,300,000 35% 999,622 30% 1,063,151 29% 1,063,151 32%
C. Trainor 712,500 33% 580,114 29% 497,240 23% 497,240 25%
T. Smart 1,000,000 38% 602,904 27% 657,865 25% 657,865 29%
N. Wells 450,000 34% 349,992 28% 287,171 21% 287,171 23%
T. Carter 412,500 34% 320,826 28% 266,947 22% 266,947 23%
J. Saretta 412,500 36% 323,662 31% 170,343 15% 170,343 16%
4,287,500 35% 3,177,120 29% 2,942,717 24% 2,942,717 27%
All bonuses are paid in the financial year following the year in which they were earned, for example the 2019 financial year bonuses
are paid in August 2019 (the 2020 financial year).
For
per
sona
l use
onl
y

48
KEY MANAGEMENT PERSONNEL EQUITY/OPTIONS
Fully paid ordinary shares of JB Hi-Fi Limited
2019
Balance at
1 July 2018
No.
Granted as
compensation(i)
No.
Received on
exercise of options
No.
Net other change
No.
Balance at
30 June 2019
No.
Balance held
nominally
No.
G. Richards 26,486 – – – 26,486 3,455
B. Laughton 4,304 – – 1,500 5,804 –
W. Tang 5,000 – – – 5,000 –
R. Uechtritz 11,516 – – – 11,516 –
S. Goddard 1,500 – – 3,000 4,500 –
M. Powell 1,000 – – 1,000 2,000 –
R. Murray 110,257 7,818 79,568 (87,521) 110,122 –
C. Trainor 15,298 4,537 43,349 (26,365) 36,819 –
T. Smart 51,701 4,715 – – 56,416 –
N. Wells 20,093 2,737 15,744 (5,816) 32,758 –
T. Carter 3,204 2,509 18,785 (7,636) 16,862 –
J. Saretta 2,479 2,531 – – 5,010 –
S. Page(ii) – – – 5,802 5,802 –
L. Blakely – – – – – –
252,838 24,847 157,446 (116,036) 319,095 3,455
(i) Shares issued under the Company’s executive deferred STI Plan.
(ii) The net other change for S. Page represents the shares held by him when he became a KMP on 4 June 2019.
2018
Balance at
1 July 2017
No.
Granted as
compensation(i)
No.
Received on
exercise of options
No.
Net other change
No.
Balance at
30 June 2018
No.
Balance held
nominally
No.
G. Richards 26,486 – – – 26,486 3,455
B. Laughton 2,304 – – 2,000 4,304 –
W. Tang 3,700 – – 1,300 5,000 –
R. Uechtritz 11,516 – – – 11,516 –
S. Goddard 1,500 – – – 1,500 –
M. Powell – – – 1,000 1,000 –
R. Murray 105,572 7,953 112,629 (115,897) 110,257 –
C. Trainor 10,070 5,228 86,614 (86,614) 15,298 –
T. Smart 50,000 1,701 – – 51,701 –
N. Wells 11,314 2,316 12,403 (5,940) 20,093 –
T. Carter 888 2,316 13,787 (13,787) 3,204 –
J. Saretta 163 2,316 – – 2,479 –
223,513 21,830 225,433 (217,938) 252,838 3,455
(i) Shares issued under the Company’s executive deferred STI Plan.
REMUNERATION REPORT (continued)
For
per
sona
l use
onl
y
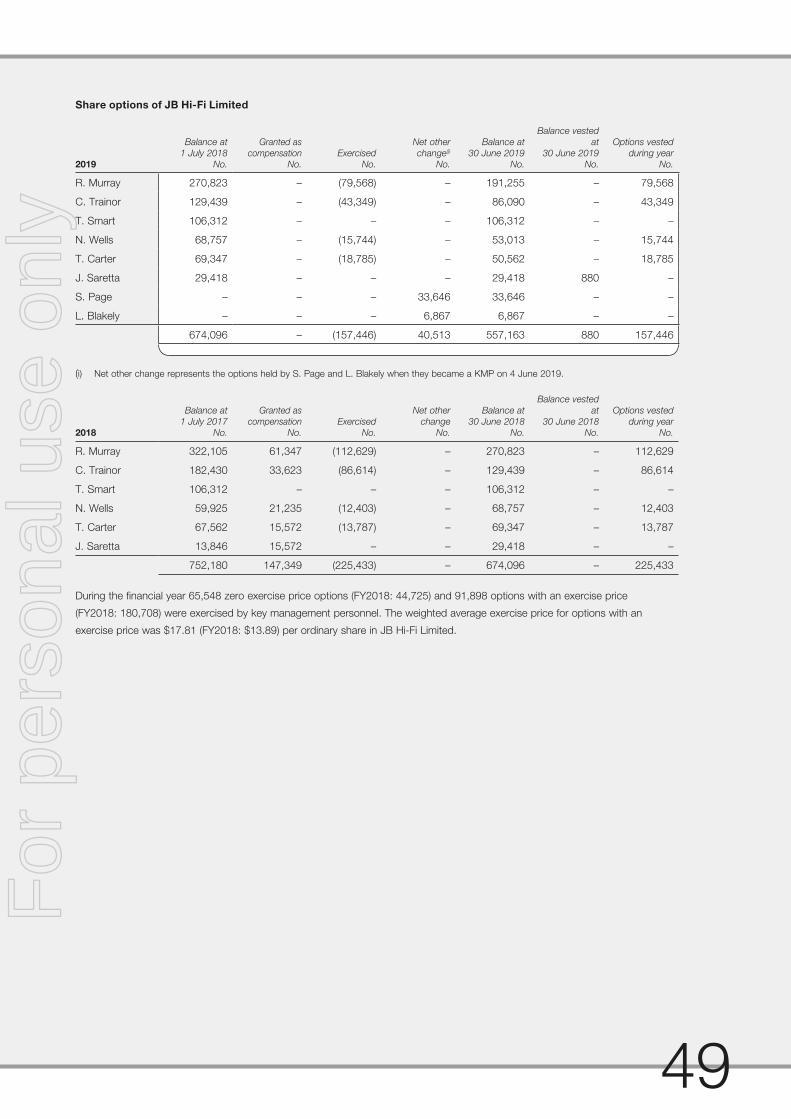
49
Share options of JB Hi-Fi Limited
2019
Balance at
1 July 2018
No.
Granted as
compensation
No.
Exercised
No.
Net other
change(i)
No.
Balance at
30 June 2019
No.
Balance vested
at
30 June 2019
No.
Options vested
during year
No.
R. Murray 270,823 – (79,568) – 191,255 – 79,568
C. Trainor 129,439 – (43,349) – 86,090 – 43,349
T. Smart 106,312 – – – 106,312 – –
N. Wells 68,757 – (15,744) – 53,013 – 15,744
T. Carter 69,347 – (18,785) – 50,562 – 18,785
J. Saretta 29,418 – – – 29,418 880 –
S. Page – – – 33,646 33,646 – –
L. Blakely – – – 6,867 6,867 – –
674,096 – (157,446) 40,513 557,163 880 157,446
(i) Net other change represents the options held by S. Page and L. Blakely when they became a KMP on 4 June 2019.
2018
Balance at
1 July 2017
No.
Granted as
compensation
No.
Exercised
No.
Net other
change
No.
Balance at
30 June 2018
No.
Balance vested
at
30 June 2018
No.
Options vested
during year
No.
R. Murray 322,105 61,347 (112,629) – 270,823 – 112,629
C. Trainor 182,430 33,623 (86,614) – 129,439 – 86,614
T. Smart 106,312 – – – 106,312 – –
N. Wells 59,925 21,235 (12,403) – 68,757 – 12,403
T. Carter 67,562 15,572 (13,787) – 69,347 – 13,787
J. Saretta 13,846 15,572 – – 29,418 – –
752,180 147,349 (225,433) – 674,096 – 225,433
During the financial year 65,548 zero exercise price options (FY2018: 44,725) and 91,898 options with an exercise price
(FY2018: 180,708) were exercised by key management personnel. The weighted average exercise price for options with an
exercise price was $17.81 (FY2018: $13.89) per ordinary share in JB Hi-Fi Limited.
For
per
sona
l use
onl
y

50
Key management personnel options granted and exercised during the fi nancial year
The following table summarises the value of options granted and exercised during the financial year to and by the key management
personnel:
2019
Value of options granted –
at the grant date(i)
Value of options exercised –
at the exercise date
$ $
R. Murray – 1,192,954
C. Trainor – 630,182
T. Smart – –
N. Wells – 257,514
T. Carter – 269,578
J. Saretta – –
S. Page(ii) – –
L. Blakely(ii) – –
– 2,350,228
(i) The value of options granted during the period is recognised in remuneration over the vesting period of the option, in accordance with
Accounting Standards.
(ii) There were no options granted to or exercised by S. Page and L. Blakely since they became KMP’s on 4 June 2019.
The value of options granted and exercised during the year is calculated based on the following:
• fair value of the option at grant date multiplied by the number of options granted; and
• fair value of the option at the time it is exercised multiplied by the number of options exercised.
Options granted during the financial year
There were no share options granted during the financial year to key management personal following the change in remuneration
structure to the VRP as set out on pages 35 to 37.
REMUNERATION REPORT (continued)
For
per
sona
l use
onl
y

51
Options exercised during the financial year
The following table details the options exercised during the financial year by key management personnel.
Series
Number
of options
exercised Exercise date
Number of
shares issued
Exercise price
$
Share price at
exercise date
$
Performance
condition –
cumulative
EPS growth
per annum
Performance
condition –
achieved
R. Murray 94.3 8,964 23/08/2018 8,964 $18.93 $25.59 5% Yes
95.1 27 23/08/2018 27 $18.93 $25.59 5%-10% Yes
95.2 27 23/08/2018 27 $18.93 $25.59 5%-10% Yes
95.3 3,842 23/08/2018 3,842 $18.93 $25.59 5%-10% Yes
97 7 23/08/2018 7 – $25.59 5%-10% Yes
99 7 23/08/2018 7 – $25.59 5%-10% Yes
100 2,286 23/08/2018 2,286 – $25.59 5% Yes
101 980 23/08/2018 980 – $25.59 5%-10% Yes
103.2 23,692 23/08/2018 23,692 $17.72 $25.59 5% Yes
104.2 10,154 23/08/2018 10,154 $17.72 $25.59 5%-10% Yes
107 5,227 23/08/2018 5,227 – $25.59 5% Yes
108 2,240 23/08/2018 2,240 – $25.59 5%-10% Yes
112 3,734 23/08/2018 3,734 – $25.59 n/a n/a(i)
128 18,381 23/08/2018 18,381 – $25.59 4%-8% Yes
79,568 79,568
C. Trainor 94.3 8,963 23/08/2018 8,963 $18.93 $25.59 5% Yes
95.1 27 23/08/2018 27 $18.93 $25.59 5%-10% Yes
95.2 27 23/08/2018 27 $18.93 $25.59 5%-10% Yes
95.3 3,842 23/08/2018 3,842 $18.93 $25.59 5%-10% Yes
97 10 14/08/2018 10 – $24.73 5%-10% Yes
99 10 14/08/2018 10 – $24.73 5%-10% Yes
100 3,002 16/08/2018 3,002 – $26.19 5% Yes
101 1,286 16/08/2018 1,286 – $26.19 5%-10% Yes
103.2 9,454 22/08/2018 9,454 $17.72 $26.00 5% Yes
104.2 4,052 22/08/2018 4,052 $17.72 $26.00 5%-10% Yes
107 2,086 15/08/2018 2,086 – $26.17 5% Yes
108 894 15/08/2018 894 – $26.17 5%-10% Yes
112 1,490 15/08/2018 1,490 – $26.17 n/a n/a(i)
128 8,206 14/08/2018 8,206 – $24.73 4%-8% Yes
43,349 43,349
N. Wells 103.2 5,743 23/08/2018 5,743 $17.72 $25.59 5% Yes
104.2 2,461 23/08/2018 2,461 $17.72 $25.59 5%-10% Yes
107 1,267 23/08/2018 1,267 – $25.59 5% Yes
108 543 23/08/2018 543 – $25.59 5%-10% Yes
112 905 23/08/2018 905 – $25.59 n/a n/a(i)
128 4,825 23/08/2018 4,825 – $25.59 4%-8% Yes
15,744 15,744
T. Carter 117.2 7,436 1/03/2019 7,436 $15.58 $22.24 5% Yes
118.2 3,187 1/03/2019 3,187 $15.58 $22.24 5%-10% Yes
121 1,477 26/02/2019 1,477 – $21.44 5% Yes
122 633 26/02/2019 633 – $21.44 5%-10% Yes
126 1,055 26/02/2019 1,055 – $21.44 n/a n/a(i)
128 4,997 20/08/2018 4,997 – $26.21 4%-8% Yes
18,785 18,785
157,446 157,446
(i) Options did not contain a performance condition as they are a one-off issue of retention options made in August 2014 to each of the executives
at that time, as detailed in the Company’s 2015 Annual Report.
For
per
sona
l use
onl
y

52
No options issued to T. Smart, J. Saretta, S. Page or L. Blakely were exercised during the financial year while they were key
management personnel.
Options lapsed during the financial year
There were no options issued to the identified key management personnel that lapsed during the financial year.
Key management personnel options granted, exercised and lapsed since the end of the fi nancial year
No options have been issued to key management personnel, and no options issued to key management personnel have been
exercised or lapsed, since the end of the financial year.
REMUNERATION REPORT (continued)
For
per
sona
l use
onl
y

53
SHARE OPTIONS
Group share option plans
The Group has share ownership-based remuneration schemes for executives and non-executive management (excluding
non-executive directors). In accordance with the provisions of these schemes, executives and non-executive managers within the
Group are granted options to purchase parcels of ordinary shares at various exercise prices or to acquire shares at a zero exercise
price. Options issued from FY2013 to FY2019 (inclusive) have the features set out below. Group executives no longer receive
options under these schemes and, instead, have the opportunity to earn share ownership-based remuneration under the Group’s
Variable Reward Plan detailed on pages 35 to 37:
• no issue price is payable on the issue of an option;
• for some of the options issued to executives during the 2013, 2014 and 2015 fi nancial years, an exercise price is payable
on the exercise of an option. This exercise price was usually calculated as being the closing volume weighted average share
price (“VWAP”) of JB Hi-Fi Limited shares over the 5 trading days post and including the date of release of the Group’s full year
results, immediately prior to the grant of the option. This price may be calculated by reference to another date or time period,
for example where a grant of options occurs other than following the release of results as a result of an executive or
non-executive manager joining the Group or being promoted within the Group. For options that have an exercise price payable
on exercise of the option, a share price condition provides that options will only vest if, during a trading window (as defi ned in
the Group’s Securities Trading Policy), the VWAP of the shares over 5 consecutive trading days exceeds the option exercise
price (at a time when all other conditions have been satisfi ed);
• for some options issued before 30 June 2015 and all options issued after 30 June 2015, a zero exercise price;
• for options issued to Group executives in previous years, the majority of options are subject to performance conditions based
on EPS growth. Some of the options issued to certain senior managers are also subject to performance hurdles. Options
issued have been subject to performance hurdles which require compound annual earnings per share growth of between
4% and 15% per annum;
• service based conditions – the options issued to executives in FY2013 to FY2017 (inclusive) vest a third each on the third,
fourth and fi fth anniversary of the grant date provided that the executive remains employed at that time. The only exception to
this is for options issued to Terry Smart in April 2017, which vest one half each on each of the third and fourth anniversary of
the grant date provided that he remains employed at that time. Options issued to executives in FY2018 also vest one half each
on each of the third and fourth anniversary of the grant date, provided the relevant executive remains employed at that time.
For all options issued to non-executive management, options vest a third each on the second, third and fourth anniversary of
grant date provided that the non-executive manager remains employed at that time;
• all conditions must be satisfi ed for an option to vest;
• options issued to non-executive management since 1 July 2012 generally expire fi ve years after they are issued. Options
issued to executives between 1 July 2012 and 30 June 2017 generally expire six years after they are issued. Options issued to
executives between 1 July 2017 and 30 June 2018 expire fi ve years after they are issued. All unvested options generally expire
immediately upon termination of employment although, depending upon the terms of issue, the Company may have discretion
to allow the options to continue or waive vesting conditions in certain circumstances. Upon termination of employment, vested
options either expire upon termination, 30 days after termination or continue in force depending upon the circumstances of the
employee’s exit and the terms of issue;
• to the extent that a performance condition is not achieved in one year, the hurdle is compounded and reassessed in each
subsequent year, until the earlier of the condition being satisfi ed or the option expiring. However, no retesting takes place in the
year of expiry;
• options are valued using the Black-Scholes option pricing model, which takes into account the exercise price, term of the
option, the expected exercise date based on prior years’ experience, the share price at grant date, the expected price volatility
of the underlying share, the expected dividend yield and the risk-free interest rate;
• each option entitles the holder to one ordinary share in JB Hi-Fi Limited;
• holders of options do not have the right, under the options, to dividends or to participate in any share issue or interest issue of
JB Hi-Fi Limited or of any other body corporate or registered scheme;
• upon a change of control of the Company all vested and unvested options will automatically lapse unless the Company
determines otherwise; and
• other conditions including, amongst other things, treatment of the options in the event of a capital reorganisation.
For
per
sona
l use
onl
y

54
As detailed in the Company’s 2015 Annual Report, in August 2014 the Company made a one-off issue of share options with a
zero exercise price and specific service-based vesting conditions to each of the executives at that time.
Shares under option
Details of interests under option at the date of this report are set out below, 78,778 of the outstanding options are vested and
exercisable. All options entitle the holder to ordinary shares in JB Hi-Fi Limited.
Option
series
Number
of shares
under
option
Grant date
(GD)
Share Price
at GD
$ Expiry date
Exercise
price
$
Weighted
average
expected
volatility(i)
Dividend
yield at
GD
Risk-free
interest
rate at GD
Weighted
average
fair value
at GD(i)
$
103-104 63,777 15/08/2014 $17.66 14/08/2020 $17.72 30.7% 4.6% 2.9% $3.25
109-113 21,111 15/08/2014 $17.66 14/08/2020 $0.00 30.7% 4.6% 2.9% $14.06
117-118 10,624 27/11/2014 $15.56 26/11/2020 $15.58 30.9% 5.3% 2.6% $2.51
123-127 3,165 27/11/2014 $15.56 26/11/2020 $0.00 30.3% 5.3% 2.6% $11.98
129-130 85,745 14/08/2015 $20.79 13/08/2021 $0.00 31.2% 4.3% 2.2% $17.06
133 48,550 14/08/2015 $20.79 13/08/2020 $0.00 31.7% 4.3% 2.2% $17.42
135-136 10,959 5/11/2015 $17.63 4/11/2021 $0.00 31.1% 4.9% 2.2% $14.26
139 747 18/12/2015 $18.36 17/12/2020 $0.00 30.4% 5.0% 2.2% $14.88
140-142 2,640 2/05/2016 $22.18 1/05/2022 $0.00 30.1% 4.2% 2.1% $18.19
144-145 74,829 22/08/2016 $29.50 21/08/2021 $0.00 29.5% 3.3% 1.5% $26.13
146-148 123,256 22/08/2016 $29.50 21/08/2022 $0.00 30.1% 3.4% 1.5% $25.70
153-154 983 19/10/2016 $28.79 18/10/2021 $0.00 29.4% 3.7% 2.2% $23.31
156-157 983 2/11/2016 $27.41 1/11/2021 $0.00 29.4% 3.7% 2.2% $23.31
158-159 106,312 18/04/2017 $24.46 17/04/2023 $0.00 28.1% 4.6% 2.0% $21.16
160-162 6,951 1/05/2017 $24.94 30/04/2022 $0.00 28.3% 4.0% 2.1% $21.58
163-167 417,790 29/08/2017 $23.56 28/08/2022 $0.00 27.9% 4.6% 2.2% $21.47
168-170 251,820 20/08/2018 $26.21 19/08/2023 $0.00 27.3% 5.0% 2.2% $22.03
171-173 7,595 3/12/2018 $23.40 2/12/2023 $0.00 26.6% 5.5% 2.2% $19.76
1,237,837
(i) The values shown are the weighted average for the relevant series listed.
REMUNERATION REPORT (continued)
For
per
sona
l use
onl
y

55
The following tables include all share options granted under the Group share option plans that were exercised during and since the
end of the current financial year and during the previous financial year. All shares were ordinary shares issued by JB Hi-Fi Limited
and no amounts remain unpaid.
2019
Option
Series Grant date
Number
exercised
Number
of shares
issued
Amount paid
per share
$
Share price at
exercise date(i)
$
94-95 16/08/2013 33,399 33,399 $18.93 $25.59
97-99 16/08/2013 44 44 $0.00 $24.73 to $25.59
100-101 16/08/2013 9,504 9,504 $0.00 $25.59 to $26.19
103-104 15/08/2014 63,776 63,776 $17.72 $25.59 to $26.00
107-116 15/08/2014 71,205 71,205 $0.00 $25.47 to $26.21
117-118 27/11/2014 10,623 10,623 $15.58 $22.24
121-126 27/11/2014 3,165 3,165 $0.00 $21.44
128-132 14/08/2015 92,657 92,657 $0.00 $24.73 to $26.21
134 5/11/2015 5,479 5,479 $0.00 $23.58
138 18/12/2015 747 747 $0.00 $22.98
143 22/08/2016 38,189 38,189 $0.00 $25.00 to $26.40
152 19/10/2016 491 491 $0.00 $22.48
155 2/11/2016 491 491 $0.00 $23.58
329,770 329,770
(i) Where a range of prices are shown, options within the series were exercised on various dates throughout the period. The share prices shown
are the maximum and minimum share prices on the exercise dates for the relevant series.
2018
Option
Series Grant date
Number
exercised
Number
of shares
issued
Amount paid
per share
$
Share price at
exercise date(i)
$
80-81 17/08/2012 112,987 112,987 $9.75 $23.56 to $24.83
83-87 17/08/2012 17,799 17,799 $0.00 $24.83 to $25.62
93 16/08/2013 50,798 50,798 $0.00 $21.89 to $27.66
94-95 16/08/2013 34,473 34,473 $18.93 $24.83 to $25.40
97-99 16/08/2013 9,852 9,852 $0.00 $24.83 to $25.02
103-104 15/08/2014 63,772 63,772 $17.72 $24.30 to $25.02
105-115 15/08/2014 75,255 75,255 $0.00 $21.89 to $27.66
117-118 27/11/2014 10,623 10,623 $15.58 $26.72
119-125 27/11/2014 3,164 3,164 $0.00 $26.72
131 14/08/2015 55,820 55,820 $0.00 $21.89 to $27.66
137 18/12/2015 746 746 $0.00 $27.66
435,289 435,289
(i) Where a range of prices are shown, options within the series were exercised on various dates throughout the period. The share prices shown
are the maximum and minimum share prices on the exercise dates for the relevant series.
For
per
sona
l use
onl
y
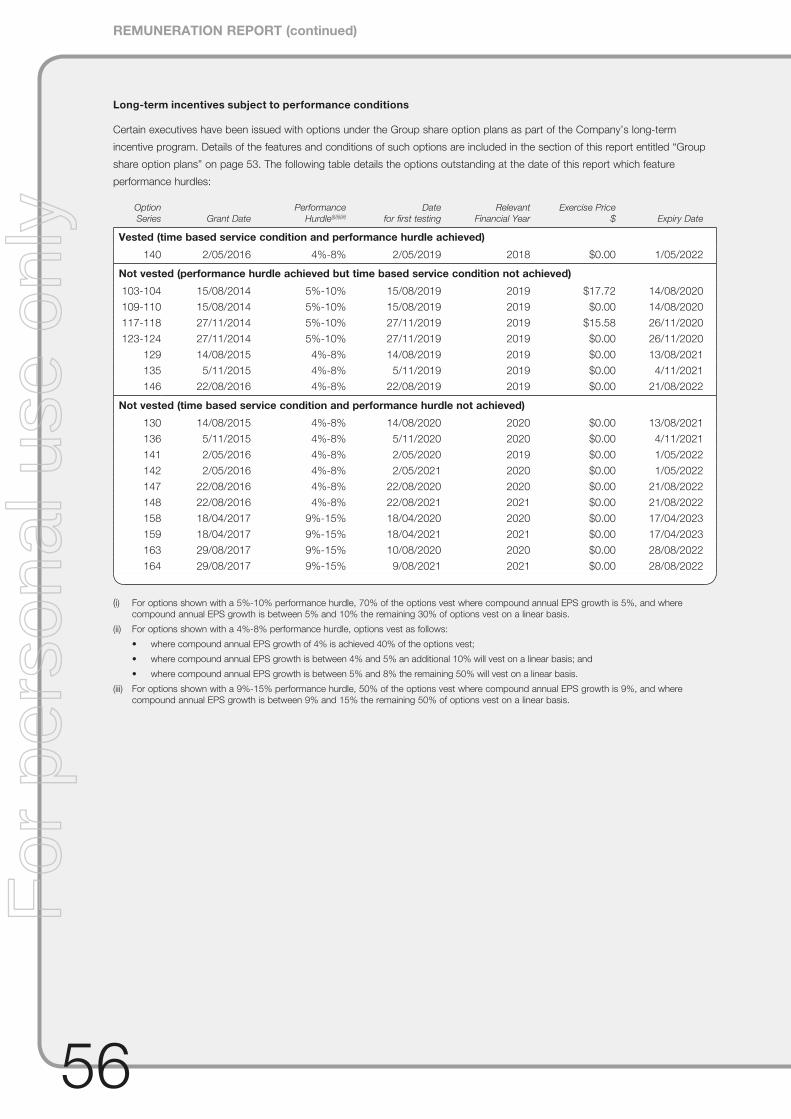
56
Long-term incentives subject to performance conditions
Certain executives have been issued with options under the Group share option plans as part of the Company’s long-term
incentive program. Details of the features and conditions of such options are included in the section of this report entitled “Group
share option plans” on page 53. The following table details the options outstanding at the date of this report which feature
performance hurdles:
Option
Series Grant Date
Performance
Hurdle(i)(ii)(iii)
Date
for first testing
Relevant
Financial Year
Exercise Price
$ Expiry Date
Vested (time based service condition and performance hurdle achieved)
140 2/05/2016 4%-8% 2/05/2019 2018 $0.00 1/05/2022
Not vested (performance hurdle achieved but time based service condition not achieved)
103-104 15/08/2014 5%-10% 15/08/2019 2019 $17.72 14/08/2020
109-110 15/08/2014 5%-10% 15/08/2019 2019 $0.00 14/08/2020
117-118 27/11/2014 5%-10% 27/11/2019 2019 $15.58 26/11/2020
123-124 27/11/2014 5%-10% 27/11/2019 2019 $0.00 26/11/2020
129 14/08/2015 4%-8% 14/08/2019 2019 $0.00 13/08/2021
135 5/11/2015 4%-8% 5/11/2019 2019 $0.00 4/11/2021
146 22/08/2016 4%-8% 22/08/2019 2019 $0.00 21/08/2022
Not vested (time based service condition and performance hurdle not achieved)
130 14/08/2015 4%-8% 14/08/2020 2020 $0.00 13/08/2021
136 5/11/2015 4%-8% 5/11/2020 2020 $0.00 4/11/2021
141 2/05/2016 4%-8% 2/05/2020 2019 $0.00 1/05/2022
142 2/05/2016 4%-8% 2/05/2021 2020 $0.00 1/05/2022
147 22/08/2016 4%-8% 22/08/2020 2020 $0.00 21/08/2022
148 22/08/2016 4%-8% 22/08/2021 2021 $0.00 21/08/2022
158 18/04/2017 9%-15% 18/04/2020 2020 $0.00 17/04/2023
159 18/04/2017 9%-15% 18/04/2021 2021 $0.00 17/04/2023
163 29/08/2017 9%-15% 10/08/2020 2020 $0.00 28/08/2022
164 29/08/2017 9%-15% 9/08/2021 2021 $0.00 28/08/2022
(i) For options shown with a 5%-10% performance hurdle, 70% of the options vest where compound annual EPS growth is 5%, and where
compound annual EPS growth is between 5% and 10% the remaining 30% of options vest on a linear basis.
(ii) For options shown with a 4%-8% performance hurdle, options vest as follows:
• where compound annual EPS growth of 4% is achieved 40% of the options vest;
• where compound annual EPS growth is between 4% and 5% an additional 10% will vest on a linear basis; and
• where compound annual EPS growth is between 5% and 8% the remaining 50% will vest on a linear basis.
(iii) For options shown with a 9%-15% performance hurdle, 50% of the options vest where compound annual EPS growth is 9%, and where
compound annual EPS growth is between 9% and 15% the remaining 50% of options vest on a linear basis.
REMUNERATION REPORT (continued)
For
per
sona
l use
onl
y

57
Deloitte Touche Tohmatsu
ABN 74 490 121 060
550 Bourke Street
Melbourne, VIC, 3000
Australia
Phone: +61 3 9671 7000
www.deloitte.com.au
Board of Directors
JB Hi-Fi Limited
Podium Level, 60 City Road
Southbank VIC 3006
12 August 2019
Dear Board Members
JB Hi-Fi Limited
In accordance with section 307C of the Corporations Act 2001, I am pleased to provide the following declaration of independence
to the directors of JB Hi-Fi Limited.
As lead audit partner for the audit of the fi nancial statements of JB Hi-Fi Limited for the year ended 30 June 2019, I declare that to
the best of my knowledge and belief, there have been no contraventions of:
(i) the auditor independence requirements of the Corporations Act 2001 in relation to the audit; and
(ii) any applicable code of professional conduct in relation to the audit.
Yours sincerely
DELOITTE TOUCHE TOHMATSU
Travis Simkin
Partner
Chartered Accountants
AUDITOR’S INDEPENDENCE DECLARATION
Liability limited by a scheme approved under Professional Standards Legislation.
Member of Deloitte Asia Pacifi c Limited and the Deloitte Network.
For
per
sona
l use
onl
y

58
Deloitte Touche Tohmatsu
ABN 74 490 121 060
550 Bourke Street
Melbourne, VIC, 3000
Australia
Phone: +61 3 9671 7000
www.deloitte.com.au
INDEPENDENT AUDITOR’S REPORT
TO THE MEMBERS OF JB HI-FI LIMITED
Report on the Audit of the Financial Report
Opinion
We have audited the financial report of JB Hi-Fi Limited (the “Company”) and its subsidiaries (the “Group”) which comprises the
consolidated balance sheet as at 30 June 2019, the consolidated statement of profit or loss, the consolidated statement of profit
or loss and other comprehensive income, the consolidated statement of cash flows and the consolidated statement of changes in
equity for the year then ended, and notes to the financial statements, including a summary of significant accounting policies, and the
directors’ declaration.
In our opinion, the accompanying financial report of the Group is in accordance with the Corporations Act 2001, including:
(i) giving a true and fair view of the Group’s financial position as at 30 June 2019 and of its financial performance for the
year then ended; and
(ii) complying with Australian Accounting Standards and the Corporations Regulations 2001.
Basis for Opinion
We conducted our audit in accordance with Australian Auditing Standards. Our responsibilities under those standards are further
described in the Auditor’s Responsibilities for the Audit of the Financial Report section of our report. We are independent of the
Group in accordance with the auditor independence requirements of the Corporations Act 2001 and the ethical requirements of the
Accounting Professional and Ethical Standards Board’s APES 110 Code of Ethics for Professional Accountants (the Code) that are
relevant to our audit of the financial report in Australia. We have also fulfilled our other ethical responsibilities in accordance with
the Code.
We confirm that the independence declaration required by the Corporations Act 2001, which has been given to the directors of the
Company, would be in the same terms if given to the directors as at the time of this auditor’s report.
We believe that the audit evidence we have obtained is sufficient and appropriate to provide a basis for our opinion.
Key Audit Matters
Key audit matters are those matters that, in our professional judgement, were of most signifi cance in our audit of the fi nancial report
for the current period. These matters were addressed in the context of our audit of the fi nancial report as a whole, and in forming
our opinion thereon, and we do not provide a separate opinion on these matters.
INDEPENDENT AUDITOR’S REPORT
Liability limited by a scheme approved under Professional Standards Legislation.
Member of Deloitte Asia Pacifi c Limited and the Deloitte Network.
For
per
sona
l use
onl
y

59
Key Audit Matter How the scope of our audit responded to the
Key Audit Matter
Carrying value of The Good Guys cash generating unit
Refer to Note 11 Intangibles.
The carrying value of The Good Guys cash generating unit
contains $575.6 million of goodwill and $241.3 million of
indefi nite useful life brand names, both of which are required
to be assessed for impairment annually or where there is an
indicator of impairment.
As disclosed within Note 11 to the fi nancial statements,
management have assessed The Good Guys cash generating
unit for impairment using a ‘value in use’ discounted cash fl ow
model. The impairment assessment incorporated signifi cant
judgments and estimates, specifi cally concerning factors
such as forecast cash fl ows, discounts rates and terminal
growth rates.
Our audit procedures included, but were not limited to:
• assessing the design and implementation of key controls
relating to the preparation of the value-in-use model;
• agreeing forecast cash fl ows to the latest Board
approved budget and assessing the historical accuracy of
management’s forecasting;
• with the assistance of our valuation specialists, we:
• assessed the management’s value-in-use
methodology;
• challenging key assumptions, including forecast
growth rates by comparing them to historical results
and economic forecasts;
• evaluated the discount rate used by assessing
the cost of capital for the cash generating unit by
comparison to market data;
• assessing the mathematical accuracy of the value-in-
use model; and
• assessed management’s sensitivity analyses around
key assumptions used in the valuation model.
We also assessed the appropriateness of the disclosures
included in Note 11 to the fi nancial statements.
AASB 16 Leases: Presentation and disclosure
Refer to Note 29(e) Signifi cant accounting policies New
accounting standards.
The Group is required to apply the requirements of AASB 16
Leases from 1 July 2019, being the start of the financial year
ending 30 June 2020.
As set out in Note 29(e), management has identified that the
adoption of AASB 16 Leases will have a significant impact on
the presentation of the Group’s financial statements.
The expected impact of adopting AASB 16 is reliant upon
a number of key estimates and judgements as set out in
Note 29(e). Additionally, there is risk that the lease data is
incomplete or inaccurate.
Our audit procedures included, but were not limited to:
• testing the completeness of the lease data captured by
management by agreeing a sample of rent expense in the
ledger to the lease data;
• testing the accuracy of the lease data captured by
management, on a sample basis, by agreeing it to the
underlying lease documentation;
• with the assistance of our treasury specialists, assessing
the incremental borrowing rates used by management to
calculate the lease liability;
• evaluating the estimates and judgement applied by
management in determining the lease period for each
lease, including the probability of exercising options and
the lease term assigned to leases in ‘hold over’; and
• recalculating the lease liability and right of use asset, on
a sample basis, to test the mathematical accuracy of
management’s calculations.
We also assessed the appropriateness of the disclosures
included in Note 29(e) to the fi nancial statements.
For
per
sona
l use
onl
y

60
Other Information
The directors are responsible for the other information. The other information comprises the Governance, Environmental and
Social Statements, Directors’ Report, Operating and Financial Review and additional securities exchange information which we
obtained prior to the date of this auditor’s report. The other information also includes the Chairman and Chief Executive Officer
Report, which is expected to be made available to us after that date (but does not include the financial report and our auditor’s
report thereon).
Our opinion on the financial report does not cover the other information and we do not express any form of assurance conclusion
thereon.
In connection with our audit of the financial report, our responsibility is to read the other information identified above and, in doing
so, consider whether the other information is materially inconsistent with the financial report or our knowledge obtained in the
audit, or otherwise appears to be materially misstated. If, based on the work we have performed on the other information that we
obtained prior to the date of this auditor’s report, we conclude that there is a material misstatement of this other information, we
are required to report that fact. We have nothing to report in this regard.
When we read the Chairman and Chief Executive Officer Report, if we conclude that there is a material misstatement therein, we
are required to communicate the matter to the directors and use our professional judgement to determine the appropriate action.
Responsibilities of the Directors for the Financial Report
The directors of the Company are responsible for the preparation of the financial report that gives a true and fair view in
accordance with Australian Accounting Standards and the Corporations Act 2001 and for such internal control as the directors
determine is necessary to enable the preparation of the financial report that gives a true and fair view and is free from material
misstatement, whether due to fraud or error.
In preparing the financial report, the directors are responsible for assessing the ability of the Group to continue as a going concern,
disclosing, as applicable, matters related to going concern and using the going concern basis of accounting unless the directors
either intend to liquidate the Group or to cease operations, or has no realistic alternative but to do so.
Auditor’s Responsibilities for the Audit of the Financial Report
Our objectives are to obtain reasonable assurance about whether the financial report as a whole is free from material
misstatement, whether due to fraud or error, and to issue an auditor’s report that includes our opinion. Reasonable assurance is a
high level of assurance, but is not a guarantee that an audit conducted in accordance with the Australian Auditing Standards will
always detect a material misstatement when it exists. Misstatements can arise from fraud or error and are considered material if,
individually or in the aggregate, they could reasonably be expected to influence the economic decisions of users taken on the basis
of this financial report.
As part of an audit in accordance with the Australian Auditing Standards, we exercise professional judgement and maintain
professional scepticism throughout the audit. We also:
• Identify and assess the risks of material misstatement of the financial report, whether due to fraud or error, design and perform
audit procedures responsive to those risks, and obtain audit evidence that is sufficient and appropriate to provide a basis for
our opinion. The risk of not detecting a material misstatement resulting from fraud is higher than for one resulting from error, as
fraud may involve collusion, forgery, intentional omissions, misrepresentations, or the override of internal control.
• Obtain an understanding of internal control relevant to the audit in order to design audit procedures that are appropriate in the
circumstances, but not for the purpose of expressing an opinion on the effectiveness of the Group’s internal control.
• Evaluate the appropriateness of accounting policies used and the reasonableness of accounting estimates and related
disclosures made by the directors.
• Conclude on the appropriateness of the director’s use of the going concern basis of accounting and, based on the audit
evidence obtained, whether a material uncertainty exists related to events or conditions that may cast significant doubt on
the Group’s ability to continue as a going concern. If we conclude that a material uncertainty exists, we are required to draw
attention in our auditor’s report to the related disclosures in the financial report or, if such disclosures are inadequate, to modify
our opinion. Our conclusions are based on the audit evidence obtained up to the date of our auditor’s report. However, future
events or conditions may cause the Group to cease to continue as a going concern.
INDEPENDENT AUDITOR’S REPORT (continued)
For
per
sona
l use
onl
y

61
• Evaluate the overall presentation, structure and content of the financial report, including the disclosures, and whether the
financial report represents the underlying transactions and events in a manner that achieves fair presentation.
• Obtain sufficient appropriate audit evidence regarding the financial information of the entities or business activities within the
Group to express an opinion on the financial report. We are responsible for the direction, supervision and performance of the
Group’s audit. We remain solely responsible for our audit opinion.
We communicate with the directors regarding, among other matters, the planned scope and timing of the audit and significant
audit findings, including any significant deficiencies in internal control that we identify during our audit.
We also provide the directors with a statement that we have complied with relevant ethical requirements regarding independence,
and to communicate with them all relationships and other matters that may reasonably be thought to bear on our independence,
and where applicable, related safeguards.
From the matters communicated with the directors, we determine those matters that were of most significance in the audit of the
financial report of the current period and are therefore the key audit matters. We describe these matters in our auditor’s report
unless law or regulation precludes public disclosure about the matter or when, in extremely rare circumstances, we determine
that a matter should not be communicated in our report because the adverse consequences of doing so would reasonably be
expected to outweigh the public interest benefits of such communication.
Report on the Remuneration Report
Opinion on the Remuneration Report
We have audited the Remuneration Report included in pages 32 to 56 of the Directors’ report for the year ended 30 June 2019.
In our opinion, the Remuneration Report of JB Hi-Fi Limited, for the year ended 30 June 2019, complies with section 300A of the
Corporations Act 2001.
Responsibilities
The directors of the Company are responsible for the preparation and presentation of the Remuneration Report in accordance with
section 300A of the Corporations Act 2001. Our responsibility is to express an opinion on the Remuneration Report, based on our
audit conducted in accordance with Australian Auditing Standards.
DELOITTE TOUCHE TOHMATSU
Travis Simkin
Partner
Chartered Accountants
Melbourne
12 August 2019
For
per
sona
l use
onl
y

62
The directors declare that:
(a) in the directors’ opinion, there are reasonable grounds to believe that the Company will be able to pay its debts as and when
they become due and payable;
(b) the attached financial statements are in compliance with International Financial Reporting Standards, as stated in note 1 to the
financial statements;
(c) in the directors’ opinion, the attached financial statements and notes thereto are in accordance with the Corporations Act 2001,
including compliance with accounting standards and giving a true and fair view of the financial position and performance of the
consolidated entity; and
(d) the directors have been given the declarations required by s.295A of the Corporations Act 2001.
At the date of this declaration, the Company is within the class of companies affected by ASIC Corporations (Wholly-owned
Companies) Instrument 2016/785. The nature of the deed of cross guarantee is such that each company which is party to the
deed guarantees to each creditor payment in full of any debt in accordance with the deed of cross guarantee.
In the directors’ opinion, there are reasonable grounds to believe that the Company and the companies to which the ASIC Class
Order applies, as detailed in note 22 to the financial statements will, as a group, be able to meet any obligations or liabilities to
which they are, or may become, subject by virtue of the deed of cross guarantee.
Signed in accordance with a resolution of the directors made pursuant to s.295(5) of the Corporations Act 2001.
On behalf of the Directors
Greg Richards Richard Murray
Chairman Group Chief Executive Officer
Melbourne
12 August 2019
DIRECTORS’ DECLARATION
For
per
sona
l use
onl
y

63
Consolidated
Notes
2019
$m
2018
$m
Revenue 7,095.3 6,854.3
Cost of sales (5,568.2) (5,384.1)
Gross profi t 1,527.1 1,470.2
Other income 2.4 1.1
Sales and marketing expenses (731.0) (695.1)
Occupancy expenses (306.4) (299.7)
Administration expenses (44.5) (48.2)
Other expenses (74.0) (77.2)
Finance costs 5 (14.3) (16.6)
Profi t before tax 359.3 334.5
Income tax expense 6 (109.5) (101.3)
Profi t for the year attributable to Owners of the Company 249.8 233.2
Cents Cents
Earnings per share
Basic (cents per share) 3 217.44 203.09
Diluted (cents per share) 3 215.27 201.11
STATEMENT OF PROFIT OR LOSS
for the fi nancial year ended 30 June 2019
The above statement of profi t or loss should be read in conjunction with the accompanying notes.
For
per
sona
l use
onl
y

64
Consolidated
2019
$m
2018
$m
Profi t for the year 249.8 233.2
Other comprehensive income
Items that may be reclassifi ed subsequently to profi t or loss
Changes in the fair value of cash fl ow hedges (net of tax) (1.1) 1.9
Exchange differences on translation of foreign operations 1.4 (1.3)
Other comprehensive income for the year (net of tax) 0.3 0.6
Total comprehensive income for the year attributable to Owners of the Company 250.1 233.8
The above statement of profi t or loss and other comprehensive income should be read in conjunction with the accompanying notes.
STATEMENT OF PROFIT OR LOSS AND OTHER COMPREHENSIVE INCOME
for the fi nancial year ended 30 June 2019F
or p
erso
nal u
se o
nly

65
Consolidated
Notes
2019
$m
2018
$m
ASSETS
Current assets
Cash and cash equivalents 119.2 72.0
Trade and other receivables 8 236.0 204.7
Inventories 7 886.7 891.1
Other current assets 9 34.6 42.7
Total current assets 1,276.5 1,210.5
Non-current assets
Plant and equipment 10 191.5 198.0
Deferred tax assets 6 2.7 –
Intangible assets 11 1,037.3 1,037.3
Other non-current assets 9 40.8 45.9
Total non-current assets 1,272.3 1,281.2
Total assets 2,548.8 2,491.7
LIABILITIES
Current liabilities
Trade and other payables 12 656.9 665.3
Deferred revenue 13 163.2 150.5
Provisions 14 93.9 83.5
Other current liabilities 15 8.0 8.3
Current tax liabilities 5.1 9.6
Total current liabilities 927.1 917.2
Non-current liabilities
Borrowings 17 439.1 469.4
Deferred revenue 13 90.1 103.7
Deferred tax liabilities 6 – 5.7
Provisions 14 15.2 12.5
Other non-current liabilities 15 33.2 35.6
Total non-current liabilities 577.6 626.9
Total liabilities 1,504.7 1,544.1
Net assets 1,044.1 947.6
EQUITY
Contributed equity 18 434.8 441.7
Reserves 19 53.7 42.7
Retained earnings 555.6 463.2
Total equity 1,044.1 947.6
The above balance sheet should be read in conjunction with the accompanying notes.
BALANCE SHEET
as at 30 June 2019F
or p
erso
nal u
se o
nly

66
Consolidated Notes
Contributed
equity
$m
Equity
settled
benefi ts
reserve
$m
Foreign
currency
translation
reserve
$m
Hedging
reserves
$m
Common
control
reserve
$m
Retained
earnings
$m
Total
equity
$m
Balance at 1 July 2017 438.7 34.6 4.9 (0.2) (6.1) 381.6 853.5
Profi t for the year – – – – – 233.2 233.2
Cash fl ow hedges
(net of tax) – – – 1.9 – – 1.9
Exchange difference
on translation of foreign
operations – – (1.3) – – – (1.3)
Total comprehensive
income for the year – – (1.3) 1.9 – 233.2 233.8
Issue of shares under
share option plans 18 3.0 – – – – – 3.0
Dividends provided for
or paid 4 – – – – – (151.6) (151.6)
Share-based payments -
expense – 7.8 – – – – 7.8
Share-based payments -
income tax – 1.1 – – – – 1.1
Balance at 30 June 2018 441.7 43.5 3.6 1.7 (6.1) 463.2 947.6
Balance at 1 July 2018 441.7 43.5 3.6 1.7 (6.1) 463.2 947.6
Profi t for the year – – – – – 249.8 249.8
Cash fl ow hedges
(net of tax) – – – (1.1) – – (1.1)
Exchange difference
on translation of foreign
operations – – 1.4 – – – 1.4
Total comprehensive
income for the year – – 1.4 (1.1) – 249.8 250.1
Issue of shares under
share option plans 18 1.9 – – – – – 1.9
Dividends provided for
or paid 4 – – – – – (157.4) (157.4)
Acquisition of shares by
employee share trust 18 (8.8) – – – – – (8.8)
Share-based payments -
expense – 10.2 – – – – 10.2
Share-based payments -
income tax – 0.5 – – – – 0.5
Balance at 30 June 2019 434.8 54.2 5.0 0.6 (6.1) 555.6 1,044.1
The above statement of changes in equity should be read in conjunction with the accompanying notes.
STATEMENT OF CHANGES IN EQUITY
for the fi nancial year ended 30 June 2019F
or p
erso
nal u
se o
nly

67
Consolidated
Notes
2019
$m
2018
$m
Cash fl ows from operating activities
Receipts from customers 7,804.9 7,551.9
Payments to suppliers and employees (7,373.8) (7,130.5)
Interest received 0.7 0.5
Interest and other fi nance costs paid (13.8) (15.0)
Income taxes paid (116.4) (114.8)
Net cash infl ow from operating activities 16 301.6 292.1
Cash fl ows from investing activities
Payments for plant and equipment 10 (59.3) (54.4)
Proceeds from sale of plant and equipment 0.2 0.4
Net cash (outfl ow) from investing activities (59.1) (54.0)
Cash fl ows from fi nancing activities
Proceeds from issues of shares 18 1.9 3.0
Payments for shares acquired by the employee share trust 18 (8.8) –
Repayment of borrowings (30.5) (89.7)
Payments for debt issue costs (0.6) (0.8)
Dividends paid to owners of the Company 4 (157.4) (151.6)
Net cash (outfl ow) from fi nancing activities (195.4) (239.1)
Net increase (decrease) in cash and cash equivalents 47.1 (1.0)
Cash and cash equivalents at the beginning of the fi nancial year 72.0 72.8
Effects of exchange rate changes on cash and cash equivalents 0.1 0.2
Cash and cash equivalents at end of year 119.2 72.0
The above statement of cash fl ows should be read in conjunction with the accompanying notes.
STATEMENT OF CASH FLOWS
for the fi nancial year ended 30 June 2019F
or p
erso
nal u
se o
nly

68
Contents of the notes to the consolidated fi nancial statements
Page
1 About this report ................................................................................................................................................................69
Group Performance .....................................................................................................................................................................70
2 Segment information ..........................................................................................................................................................70
3 Earnings per share .............................................................................................................................................................71
4 Dividends ...........................................................................................................................................................................72
5 Expenses ...........................................................................................................................................................................73
6 Taxation .............................................................................................................................................................................73
Operating Assets and Liabilities ................................................................................................................................................76
7 Inventories .........................................................................................................................................................................76
8 Trade and other receivables ...............................................................................................................................................76
9 Other assets ......................................................................................................................................................................77
10 Plant and equipment ..........................................................................................................................................................78
11 Intangible assets ................................................................................................................................................................79
12 Trade and other payables ...................................................................................................................................................80
13 Deferred revenue ...............................................................................................................................................................80
14 Provisions ..........................................................................................................................................................................81
15 Other liabilities ....................................................................................................................................................................82
Capital Structure and Risk Management ..................................................................................................................................83
16 Notes to the cash fl ow statement .......................................................................................................................................83
17 Borrowings ........................................................................................................................................................................83
18 Contributed equity .............................................................................................................................................................84
19 Reserves............................................................................................................................................................................85
20 Financial risk management .................................................................................................................................................86
21 Commitments ....................................................................................................................................................................90
Group Structure ...........................................................................................................................................................................91
22 Subsidiaries .......................................................................................................................................................................91
23 Deed of cross guarantee ....................................................................................................................................................92
24 Parent entity ......................................................................................................................................................................94
25 Related party transactions .................................................................................................................................................94
Other Disclosures ........................................................................................................................................................................95
26 Key management personnel disclosures ............................................................................................................................95
27 Share-based payments ......................................................................................................................................................95
28 Remuneration of auditors ...................................................................................................................................................96
29 Summary of other signifi cant accounting policies ...............................................................................................................97
30 Events occurring after the reporting period .......................................................................................................................102
NOTES TO THE FINANCIAL STATEMENTS
for the fi nancial year ended 30 June 2019F
or p
erso
nal u
se o
nly

69
1 ABOUT THIS REPORT
These are the consolidated fi nancial statements of JB Hi-Fi Limited (Company or parent entity) and its controlled entities.
JB Hi-Fi Limited and its controlled entities together are referred to in this fi nancial report as the Group. For the purposes of preparing
the consolidated fi nancial statements the Company is a for-profi t entity.
(a) Basis of preparation
These general purpose fi nancial statements have been prepared in accordance with Australian Accounting Standards and
interpretations issued by the Australian Accounting Standards Board and the Corporations Act 2001.
(i) Compliance with IFRS
The consolidated fi nancial statements of JB Hi-Fi Limited also comply with International Financial Reporting Standards (IFRS) as
issued by the International Accounting Standards Board (IASB).
(ii) Historical cost convention
These fi nancial statements have been prepared under the historical cost convention, except for fi nancial assets and liabilities
(including derivative instruments), and certain classes of plant and equipment which are measured at fair value.
(iii) Corporation information
JB Hi-Fi Limited is a company limited by shares, incorporated and domiciled in Australia. Its registered offi ce and principal place of
business is Podium Level, 60 City Road, Southbank, Victoria.
The fi nancial statements were authorised for issue by the directors on 12 August 2019.
(b) Rounding off of amounts
The Company is of a kind referred to in ASIC Corporations (Rounding in Financial/Directors’ Reports) Instrument 2016/191, dated
24 March 2016, and in accordance with that Corporations Instrument, amounts in the fi nancial report are rounded off to the nearest
hundred thousand dollars, unless otherwise stated.
(c) Sections
The notes in these fi nancial statements have been organised into the following sections to help users fi nd and understand the
information they need to know:
(i) Group Performance: focuses on the results and performance of the Group;
(ii) Operating Assets and Liabilities: provides information on the assets and liabilities used to generate the Group’s
performance;
(iii) Capital Structure and Risk Management: outlines how the Group manages its capital and various fi nancial risks;
(iv) Group Structure: explains aspects of the group structure and how any changes have affected the fi nancial position and
performance of the Group; and
(v) Other Disclosures: provides information on items which require disclosure to comply with Australian Accounting Standards
and other regulatory pronouncements.
(d) Critical accounting estimates and assumptions
Estimates and judgements used in the preparation of these fi nancial statements are continually evaluated and are based on
historical experience and other factors, including expectations of future events that may have a fi nancial impact on the Group and
that are believed to be reasonable under the circumstances.
The estimates and assumptions that have a signifi cant risk of causing a material adjustment to the carrying amounts of assets and
liabilities within the next fi nancial year are included in the following notes:
Judgement Area Note
Impairment of goodwill and other intangible assets 11
For
per
sona
l use
onl
y

70
NOTES TO THE FINANCIAL STATEMENTS (continued)
for the fi nancial year ended 30 June 2019
GROUP PERFORMANCE
2 SEGMENT INFORMATION
(a) Description of segments
Management has determined the operating segments based on the reports reviewed by the Group Chief Executive Offi cer that are
used to make strategic and operating decisions.
The Group Chief Executive Offi cer considers the business primarily from a brand and geographic perspective. On this basis,
management has identifi ed three reportable segments, JB Hi-Fi Australia (JB Aust), JB Hi-Fi New Zealand (JB NZ) and The Good
Guys (TGG). The Group Chief Executive Offi cer monitors the performance of these three segments separately. The Group does not
operate any other brand or in any other geographic segment.
(b) Segment information provided to the Group Chief Executive Offi cer
The segment information provided to the Group Chief Executive Offi cer for the reportable segments for the year ended
30 June 2019 is as follows:
2019JB Aust
$m
JB NZ
$m
TGG
$m
Total
$m
Revenue from external customers 4,726.0 221.4 2,147.9 7,095.3
EBITDA 342.3 1.3 85.5 429.1
Total segment assets 1,224.9 50.2 1,326.0 2,601.1
Additions to plant and equipment 30.7 0.3 28.3 59.3
Depreciation and impairment 40.6 3.0 12.6 56.2
Total segment liabilities 1,058.5 15.7 482.8 1,557.0
2018JB Aust
$m
JB NZ
$m
TGG
$m
Total
$m
Revenue from external customers 4,539.7 213.3 2,101.3 6,854.3
EBITDA 333.6 0.8 77.3 411.7
Total segment assets 1,152.5 51.6 1,346.4 2,550.5
Additions to plant and equipment 30.9 1.2 22.3 54.4
Depreciation and impairment 41.3 3.4 16.4 61.1
Total segment liabilities 1,033.2 17.1 552.6 1,602.9
(i) EBITDA
The Group Chief Executive Offi cer assesses the performance of the operating segments based on a measure of EBITDA.
This measurement basis excludes the effects of interest revenue, fi nance costs, income tax, depreciation, amortisation, impairment,
and non-operating intercompany charges.
A reconciliation of EBITDA to profi t before income tax is provided as follows:
Consolidated
2019
$m
2018
$m
EBITDA 429.1 411.7
Interest revenue 0.7 0.5
Finance costs (14.3) (16.6)
Depreciation and impairment (56.2) (61.1)
Profi t before income tax from continuing operations 359.3 334.5
For
per
sona
l use
onl
y

71
2 SEGMENT INFORMATION (continued)
(b) Segment information provided to the Group Chief Executive Offi cer (continued)
(ii) Segment assets and liabilities
The amounts provided to the Group Chief Executive Offi cer with respect to total assets and liabilities are measured in a manner
consistent with that of the fi nancial statements. These assets and liabilities are allocated based on the operations of the segment or
the physical location of the asset.
Reportable segments’ assets and liabilities are reconciled to total assets and liabilities as follows:
Consolidated
2019
$m
2018
$m
Segment assets 2,601.1 2,550.5
Intersegment eliminations (52.3) (58.8)
Total assets as per the balance sheet 2,548.8 2,491.7
Segment liabilities 1,557.0 1,602.9
Intersegment eliminations (52.3) (58.8)
Total liabilities as per the balance sheet 1,504.7 1,544.1
(c) Product information
The Group operates in one product and services segment, being the sale of consumer electronics products and services, including
televisions, audio equipment, computers, cameras, telecommunications products and services, software, musical instruments,
whitegoods, cooking products, heating and cooling products, small appliances, kitchen accessories and information technology
and consulting services. The Group’s revenue is primarily generated on a point in time basis. The amount of revenue recognised by
the Group on an ‘over time’ basis is not material in the context of the Group’s total revenue.
Consolidated
2019
Cents
2018
Cents
3 EARNINGS PER SHARE
Basic (cents per share) 217.44 203.09
Diluted (cents per share) 215.27 201.11
Consolidated
2019
$m
2018
$m
(a) Reconciliation of earnings used in calculating earnings per share
Basic earnings per share
Profi t for the year attributable to owners of the Company 249.8 233.2
Diluted earnings per share
Profi t for the year attributable to owners of the Company 249.8 233.2
For
per
sona
l use
onl
y

72
NOTES TO THE FINANCIAL STATEMENTS (continued)
for the fi nancial year ended 30 June 2019
Consolidated
2019
Number
m
2018
Number
m
3 EARNINGS PER SHARE (continued)
(b) Weighted average number of shares used as the denominator
Weighted average number of ordinary shares used as the denominator in calculating
basic earnings per share 114.9 114.8
Adjustments for calculation of diluted earnings per share:
Options 1.2 1.1
Weighted average number of ordinary and potential ordinary shares used as the
denominator in calculating diluted earnings per share 116.1 115.9
(c) Information concerning the classifi cation of securities
Options
Options granted under the Company’s share option plans are considered to be potential ordinary shares and have been included
in the determination of diluted earnings per share to the extent to which they are dilutive (1,159,578 options are considered dilutive
(2018: 1,131,023), 53,746 are considered anti-dilutive (2018: 130,453)). The options have not been included in the determination of
basic earnings per share. Details relating to the options are set out in note 27.
2019 2018
Cents
per share $m
Cents
per share $m
4 DIVIDENDS
Recognised amounts
Final Dividend - previous fi nancial year 46.00 52.8 46.00 52.8
Interim Dividend - current fi nancial year 91.00 104.6 86.00 98.8
137.00 157.4 132.00 151.6
Unrecognised amounts
Final Dividend - current fi nancial year 51.00 58.6 46.00 52.8
In respect of the fi nancial year ended 30 June 2019, the directors have recommended the payment of a fi nal dividend of 51.0 cents
per share. The record date is 23 August 2019.
All dividends declared and subsequently paid by the Company are franked to 100% at the 30% corporate income tax rate.
Consolidated
2019
$m
2018
$m
(a) Franking account balance
Franking credits available for subsequent reporting periods based on a tax rate of 30.0%
(2018: 30.0%) 312.7 270.6
The above amounts represent the balance of the franking account as at the end of the fi nancial year, adjusted for franking credits
that will arise from the payment of the amount of the provision for income tax.
The impact on the franking account of the dividend recommended by the directors since year end, but not recognised as a liability
at year end, will be a reduction in the franking account of $25.1 million (2018: $22.6 million).
For
per
sona
l use
onl
y

73
Consolidated
2019
$m
2018
$m
5 EXPENSES
Profi t before income tax includes the following specifi c expenses:
Finance costs
Interest on loans 13.3 15.0
Fair value loss on interest swaps designated as cash fl ow hedges - transfer from equity 0.3 0.5
Other interest expense 0.7 1.1
14.3 16.6
Rental expense relating to operating leases
Minimum lease payments 203.6 193.1
Employee benefi ts expenses
Share-based payments - expense 10.2 7.8
Defi ned contribution superannuation expense 57.4 53.9
Other employee benefi ts 661.6 634.0
729.2 695.7
Consolidated
2019
$m
2018
$m
6 TAXATION
(a) Income tax expense
Current tax 117.9 111.7
Deferred tax (8.4) (10.4)
109.5 101.3
(b) Numerical reconciliation of income tax expense to prima facie tax payable
Profi t from continuing operations before income tax expense 359.3 334.5
Tax at the Australian tax rate of 30.0% (2018: 30.0%) 107.8 100.4
Effect of expenses that are not deductible in determining taxable profi t 3.2 2.3
Effect of different tax rates of subsidiaries operating in other jurisdictions 0.1 0.1
Effect of other deductibles in determining taxable profi t (1.6) (1.4)
Other – (0.1)
Tax expense 109.5 101.3
(c) Amounts recognised directly in equity
The following current and deferred amounts were charged directly to equity during the
period:
Current tax
Tax effect of employee share options in reserves (0.5) (1.1)
Deferred tax
Tax effect of hedge gains/(loss) in reserves – 0.8
(0.5) (0.3)
For
per
sona
l use
onl
y

74
NOTES TO THE FINANCIAL STATEMENTS (continued)
for the fi nancial year ended 30 June 2019
Consolidated
2019
$m
2018
$m
6 TAXATION (continued)
(d) Deferred tax
The balance comprises temporary differences attributable to:
Deferred tax assets
Provisions 42.6 35.6
Inventories 9.6 8.1
Deferred revenue 40.7 45.0
Other 13.6 10.7
106.5 99.4
Deferred tax liabilities
Brand names (85.2) (85.2)
Prepayments (18.6) (19.9)
(103.8) (105.1)
Net deferred tax assets/(liabilities) 2.7 (5.7)
All movements in the above temporary differences have been charged to income.
(e) Recognition and measurement
Current tax
Current tax represents the amount expected to be paid to taxation authorities on taxable income for the period, using tax rates
enacted or substantively enacted at the reporting date and any adjustment to tax payable in respect of previous years. Current tax
for current and prior periods is recognised as a liability (or asset) to the extent that it is unpaid (or refundable).
Deferred tax
Deferred tax is accounted for using the balance sheet liability method, providing for temporary differences between the carrying
amounts of assets and liabilities under fi nancial reporting and taxation purposes. Deferred tax is measured at the rates that are
expected to apply in the period in which the liability is settled or asset realised, based on tax rates enacted or substantively enacted
at the reporting date.
Deferred tax assets and liabilities are not recognised if the temporary difference arises from the initial recognition (other than in a
business combination) of assets and liabilities in a transaction that affects neither the taxable profi t nor the accounting profi t or in
relation to the initial recognition of goodwill.
A deferred tax asset is recognised only to the extent that it is probable that future taxable profi ts will be available against which the
deductible temporary differences or unused tax losses and tax offsets can be utilised. Deferred tax assets are reduced to the extent
that it is no longer probable that the related tax benefi t will be realised.
Deferred tax assets and liabilities are offset when they relate to income taxes levied by the same taxation authority and the Group
intends to settle its current tax assets and liabilities on a net basis.
Income tax is recognised in the statement of profi t or loss except to the extent that it relates to items recognised directly in equity, in
which case, the tax is also recognised directly in equity.For
per
sona
l use
onl
y

75
6 TAXATION (continued)
(f) Tax consolidation legislation
The Company and its wholly owned Australian resident entities are part of a tax consolidated group and are therefore taxed as a
single entity. The head entity within the tax consolidated group is JB Hi-Fi Limited. The members of the tax consolidated group are
identifi ed at note 22.
Tax expense/income, deferred tax liabilities and deferred tax assets arising from temporary differences of the members of the tax
consolidated group are recognised in the separate fi nancial statements of the members of the tax consolidated group using the
‘separate taxpayer within group’ approach by reference to the carrying amounts in the separate fi nancial statements of each entity
and the tax values applying under tax consolidation. Current tax liabilities and assets and deferred tax assets arising from unused
tax losses and relevant tax credits of the members of the tax consolidated group are recognised by the Company (as head entity in
the tax consolidated group).
Where the tax contribution amount recognised by each member of the tax consolidated group for a particular period is different to
the aggregate of the current tax liability or asset and any deferred tax asset arising from unused tax losses and tax credits in respect
of that period, the difference is recognised as a contribution from (or distribution to) equity participants.
(g) Nature of tax funding and tax sharing agreements
Entities within the tax consolidated group have entered into a tax funding arrangement and a tax sharing agreement with the head
entity. Under the terms of the tax funding arrangement, JB Hi-Fi Limited and each of the entities in the tax consolidated group have
agreed to pay a tax equivalent payment to or from the head entity, based on the current tax liability or current tax asset of the entity.
Such amounts are refl ected in amounts receivable from or payable to other entities in the tax consolidated group.
The tax sharing agreement entered into between members of the tax consolidated group provides for the determination of the
allocation of income tax liabilities between the entities should the head entity default on its tax payment obligations or if an entity
should leave the tax consolidated group. The effect of the tax sharing agreement is that each member’s liability for tax payable by
the tax consolidated group is limited to the amount payable to the head entity under the tax funding agreement.
JB Hi-Fi calculates deferred taxes in relation to investments within the tax consolidated group using the ‘change in tax status’ view.
This view results in no deferred tax being recognised until such time as an entity leaves the tax consolidated group.
For
per
sona
l use
onl
y
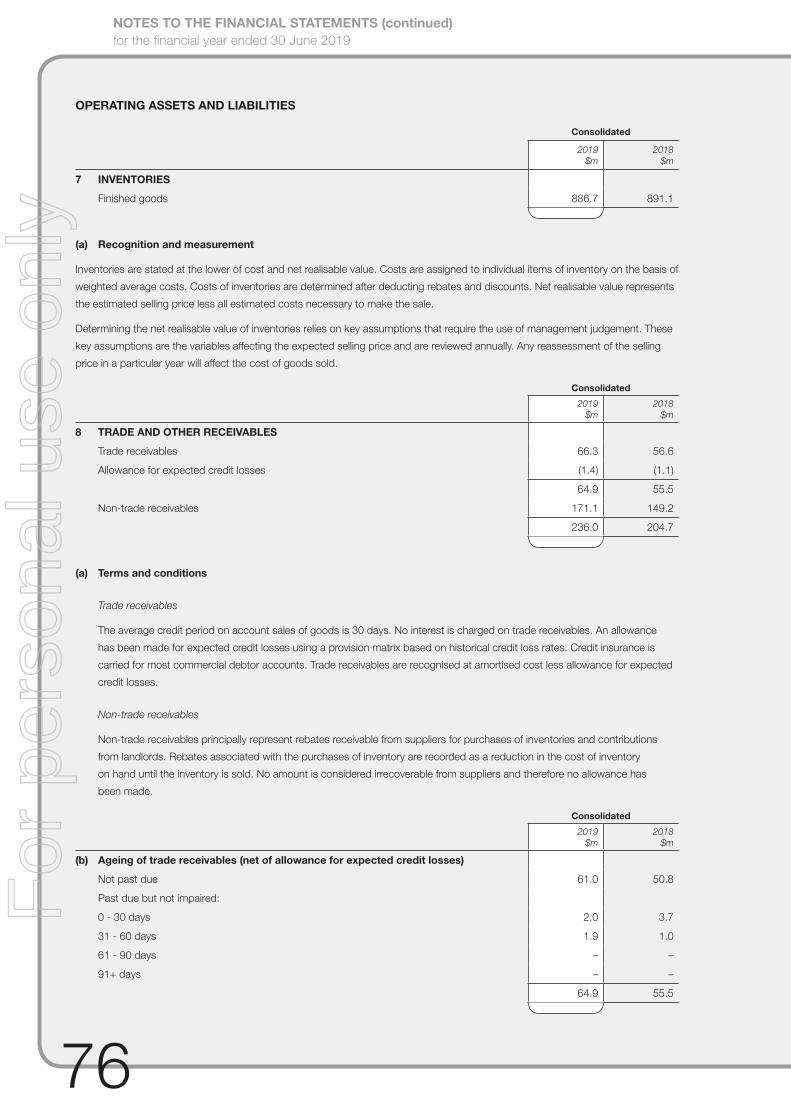
76
NOTES TO THE FINANCIAL STATEMENTS (continued)
for the fi nancial year ended 30 June 2019
OPERATING ASSETS AND LIABILITIES
Consolidated
2019
$m
2018
$m
7 INVENTORIES
Finished goods 886.7 891.1
(a) Recognition and measurement
Inventories are stated at the lower of cost and net realisable value. Costs are assigned to individual items of inventory on the basis of
weighted average costs. Costs of inventories are determined after deducting rebates and discounts. Net realisable value represents
the estimated selling price less all estimated costs necessary to make the sale.
Determining the net realisable value of inventories relies on key assumptions that require the use of management judgement. These
key assumptions are the variables affecting the expected selling price and are reviewed annually. Any reassessment of the selling
price in a particular year will affect the cost of goods sold.
Consolidated
2019
$m
2018
$m
8 TRADE AND OTHER RECEIVABLES
Trade receivables 66.3 56.6
Allowance for expected credit losses (1.4) (1.1)
64.9 55.5
Non-trade receivables 171.1 149.2
236.0 204.7
(a) Terms and conditions
Trade receivables
The average credit period on account sales of goods is 30 days. No interest is charged on trade receivables. An allowance
has been made for expected credit losses using a provision matrix based on historical credit loss rates. Credit insurance is
carried for most commercial debtor accounts. Trade receivables are recognised at amortised cost less allowance for expected
credit losses.
Non-trade receivables
Non-trade receivables principally represent rebates receivable from suppliers for purchases of inventories and contributions
from landlords. Rebates associated with the purchases of inventory are recorded as a reduction in the cost of inventory
on hand until the inventory is sold. No amount is considered irrecoverable from suppliers and therefore no allowance has
been made.
Consolidated
2019
$m
2018
$m
(b) Ageing of trade receivables (net of allowance for expected credit losses)
Not past due 61.0 50.8
Past due but not impaired:
0 - 30 days 2.0 3.7
31 - 60 days 1.9 1.0
61 - 90 days – –
91+ days – –
64.9 55.5
For
per
sona
l use
onl
y

77
Consolidated
2019
$m
2018
$m
8 TRADE AND OTHER RECEIVABLES (continued)
(c) Movements in allowance for expected credit losses
Balance at the beginning of the year 1.1 0.7
Remeasurement of loss allowance 0.4 0.5
Receivables written off during the year as uncollectable (0.1) (0.1)
1.4 1.1
(d) Collectability of trade receivables
An allowance has been made for expected credit losses (ECL) calculated by using a simplifi ed provision matrix that is based on
historical credit loss rates. The historical loss rates are adjusted to refl ect current and forward-looking information specifi c to the
economic environment and affecting customers’ ability to settle their receivables. Trade receivables are written off against the
allowance account where there is no reasonable expectation of recovery.
The amount of the ECL is recognised in profi t or loss within other expenses. Subsequent recoveries of amounts previously written
off are credited against the same line item.
Consolidated
2019
$m
2018
$m
9 OTHER ASSETS
Current
Prepayments 30.0 31.8
Other 4.6 10.9
34.6 42.7
Non-current
Prepayments 40.8 45.9
40.8 45.9
Prepayments includes payments made in relation to The Goods Guys Gold Service Extras program and general prepaid expenses.
For
per
sona
l use
onl
y

78
NOTES TO THE FINANCIAL STATEMENTS (continued)
for the fi nancial year ended 30 June 2019
Plant and
equipment
$m
Leasehold
improvements
$m
Total
$m
10 PLANT AND EQUIPMENT
At 1 July 2017
Cost 310.6 173.9 484.5
Accumulated depreciation and impairment (162.4) (113.9) (276.3)
Net book amount 148.2 60.0 208.2
Year ended 30 June 2018
Opening net book amount 148.2 60.0 208.2
Exchange differences (0.4) (0.2) (0.6)
Additions 35.9 18.5 54.4
Disposals (2.2) (0.7) (2.9)
Depreciation charge (40.8) (19.6) (60.4)
Impairment charge (0.6) (0.1) (0.7)
Closing net book amount 140.1 57.9 198.0
At 30 June 2018
Cost 336.4 188.1 524.5
Accumulated depreciation and impairment (196.3) (130.2) (326.5)
Net book amount 140.1 57.9 198.0
Year ended 30 June 2019
Opening net book amount 140.1 57.9 198.0
Exchange differences 0.4 0.1 0.5
Additions 39.2 20.1 59.3
Disposals (9.8) (0.3) (10.1)
Depreciation charge (36.1) (18.6) (54.7)
Impairment charge (1.5) – (1.5)
Closing net book amount 132.3 59.2 191.5
At 30 June 2019
Cost 354.1 201.0 555.1
Accumulated depreciation and impairment (221.8) (141.8) (363.6)
Net book amount 132.3 59.2 191.5
(a) Recognition and measurement
Plant and equipment and leasehold improvements are stated at cost less accumulated depreciation and impairment (if any).
Cost includes expenditure that is directly attributable to the acquisition of the item.
Depreciation is provided on plant and equipment and leasehold improvements. Depreciation is calculated on a straight line basis
so as to write off the net cost of each asset over its expected useful life to its estimated residual value. The estimated useful lives,
residual values and depreciation method are reviewed at the end of each annual reporting period, with the effect of any changes
recognised on a prospective basis.
The following estimated useful lives are used in the calculation of depreciation:
• Leasehold improvements 1 to 15 years
• Plant and equipment 1.5 to 15 years
Plant and equipment and leasehold improvements are tested for impairment whenever events or changes in circumstances indicate
that the carrying amount may not be recoverable.
An impairment loss is recognised for the amount by which the asset’s carrying amount exceeds its recoverable amount.
The recoverable amount is the higher of an asset’s fair value less costs to sell and value in use. For the purposes of assessing
impairment, assets are grouped at the lowest levels for which there are separately identifi able cash infl ows which are largely
independent of the cash infl ows from other assets or groups of assets (cash-generating units).
An item of plant and equipment is derecognised upon disposal or when no future economic benefi ts are expected to arise from the
continued use of the asset. Any gain or loss arising on the disposal or retirement of an item of plant and equipment is determined as
the difference between the sales proceeds and the carrying amount of the asset, and is recognised in other expenses in the profi t
or loss.
For
per
sona
l use
onl
y

79
Goodwill
$m
Brand
names
$m
Location
premiums
$m
Rights to
profi t share
$m
Total
$m
11 INTANGIBLE ASSETS
Year ended 30 June 2018
Opening net book amount 747.0 284.4 2.4 3.5 1,037.3
Impairment charge – – – – –
Closing net book amount 747.0 284.4 2.4 3.5 1,037.3
Year ended 30 June 2019
Opening net book amount 747.0 284.4 2.4 3.5 1,037.3
Impairment charge – – – – –
Closing net book amount 747.0 284.4 2.4 3.5 1,037.3
(a) Recognition and measurement
Goodwill represents the excess of the cost of an acquisition over the fair value of the Company’s share of the net identifi able assets
acquired at the date of acquisition.
Brand names, location premiums and rights to profi t share are assessed as having indefi nite useful lives. This assessment refl ects
management’s intention to continue to utilise these intangible assets into the foreseeable future. Each period, the useful life of these assets
are reviewed to determine whether events and circumstances continue to support an indefi nite useful life assessment for the assets.
Intangible assets that have an indefi nite useful life are carried at cost less accumulated impairment losses.
(b) Impairment testing
Intangible assets that have an indefi nite useful life are not subject to amortisation and are tested annually for impairment, or more
frequently if events or changes in circumstances indicate that they might be impaired.
An impairment loss is recognised for the amount by which the asset’s carrying amount exceeds its recoverable amount.
The recoverable amount is the higher of an asset’s fair value less costs to sell and value in use. For the purposes of assessing
impairment, assets are grouped at the lowest levels for which there are separately identifi able cash infl ows which are largely
independent of the cash infl ows from other assets or groups of assets (cash-generating units). Non-fi nancial assets other than
goodwill that suffered an impairment are reviewed for possible reversal of the impairment at the end of each reporting period.
For the purposes of impairment testing, goodwill is allocated to each of the Group’s cash-generating units (‘CGUs’), or groups of
CGUs, expected to benefi t from the synergies of the business combination.
If the recoverable amount of the CGU (or groups of CGUs) is less than the carrying amount of the CGU (or groups of CGUs),
the impairment loss is allocated fi rst to reduce the carrying amount of any goodwill allocated to the CGU (or groups of CGUs) and
then to the other assets in the CGU (or groups of CGUs) pro rata on the basis of the carrying amount of each asset in the CGU
(or groups of CGUs). An impairment loss recognised for goodwill is recognised immediately in profi t or loss.
On disposal of an operation within a CGU, the attributable amount of goodwill is included in the determination of the profi t or loss on
disposal of the operation.
The carrying amount of goodwill and brand names is allocated to the following cash-generating units (CGUs) or groups of CGUs for
impairment testing purposes:
Consolidated
2019
$m
2018
$m
Goodwill
The Good Guys 575.6 575.6
JB Hi-Fi Australia 163.3 163.3
Impact Records (store acquisition) 1.7 1.7
JB Solutions division (Commercial) 6.4 6.4
JB Hi-Fi New Zealand – –
747.0 747.0
For
per
sona
l use
onl
y

80
NOTES TO THE FINANCIAL STATEMENTS (continued)
for the fi nancial year ended 30 June 2019
Consolidated
2019
$m
2018
$m
11 INTANGIBLE ASSETS (continued)
(b) Impairment testing (continued)
Brand names
The Good Guys 241.3 241.3
JB Hi-Fi Australia 43.1 43.1
284.4 284.4
The recoverable amount of each CGU (or group of CGUs) has been determined based on value in use calculations which use cash
fl ow projections from fi nancial budgets approved by the Board. The cash fl ows beyond the budget period have been extrapolated
using a steady 2.5% long term growth rate (2018: 2.5%) which is consistent with the projected long term average growth rate for
the consumer products market. The discount rate used in the calculations is 10.0% for JB Hi-Fi Australia, Impact Records and
JB Solutions division (2018: 10.0%) and 10.0% for The Good Guys (2018: 10.5%).
The key assumptions used in the value in use calculations include sales growth, gross margin, cost of doing business (CODB)
and the discount rate. The assumptions are based on past experience and the Company’s forecast operating and fi nancial
performance for each CGU (or group of CGUs) taking into account current market and economic conditions, risks, uncertainties and
opportunities for improvement for each CGU (or groups of CGUs). The discount rate is derived from the Group’s weighted average
cost of capital, adjusted for varying risk profi les.
The Group has concluded that no impairment is required based on expected performance and current market and economic
conditions. A material change in market and economic conditions may increase the risk of impairment for The Good Guys in future
periods, however there is no reasonably possible change in key assumptions that could result in an impairment for JB Hi-Fi Australia.
Consolidated
2019
$m
2018
$m
12 TRADE AND OTHER PAYABLES
Trade payables 570.0 582.0
Goods and services tax (GST) payable 47.8 37.3
Other creditors and accruals 39.1 46.0
656.9 665.3
Trade payables and other creditors and accruals represent liabilities for goods and services provided to the Group prior to the end of
fi nancial year which are unpaid. Trade and other payables are stated at amortised cost. The amounts are unsecured and are usually
settled within 45 days of recognition.
Consolidated
2019
$m
2018
$m
13 DEFERRED REVENUE
Current
Deferred revenue 163.2 150.5
163.2 150.5
Non-current
Deferred revenue 90.1 103.7
90.1 103.7
Deferred revenue relates to unfulfi lled services to be performed under The Good Guys Gold Service Extras program, unredeemed
gift cards and customer deposits. Refer to note 29(a) for revenue recognition accounting policy.
Management expects that 83% of Non-Current Deferred Revenue will be recognised in the 2021 & 2022 fi nancial years and the
remaining 17% recognised in the following 3 years.
For
per
sona
l use
onl
y

81
Consolidated
2019
$m
2018
$m
14 PROVISIONS
Current
Employee benefi ts 86.5 78.2
Lease provision 7.4 5.3
93.9 83.5
Non-current
Employee benefi ts 7.5 7.3
Lease provision 7.7 5.2
15.2 12.5
(a) Recognition and measurement
Provisions are recognised when the Group has a present obligation (legal or constructive) as a result of a past event, it is probable
that the Group will be required to settle the obligation, and a reliable estimate can be made of the amount of the obligation.
The amount recognised as a provision is the best estimate of the consideration required to settle the present obligation at reporting
date, taking into account the risks and uncertainties surrounding the obligation. Where a provision is measured using the cash fl ows
estimated to settle the present obligation, its carrying amount is the present value of those cash fl ows.
(i) Employee benefi ts
Liabilities for wages and salaries, including non-monetary benefi ts, are recognised in respect of employees’ services up to the end
of the reporting period and are measured at the amounts expected to be paid when the liabilities are settled. The liability for annual
leave and unpaid bonuses are recognised in the provision for employee benefi ts. All other short-term employee benefi t obligations
are presented as payables.
Contributions to defi ned contribution superannuation plans are expensed when employees have rendered services entitling them to
the contributions.
The liability for long service leave is recognised in the provision for employee benefi ts and measured as the present value of
expected future payments to be made in respect of services provided by employees, up to the end of the reporting period.
Expected future payments are discounted using the Australian corporate bond discount rate curve as published by Milliman with
terms to maturity and currency that match, as closely as possible, the estimated future cash outfl ows.
Management judgement is applied in determining the following key assumptions used in the calculation of long service leave at
balance date:
• future increases in wages and salaries;
• future on cost rates; and
• experience of employee departures and period of service.
(ii) Lease provision
The lease provision includes the Group’s best estimate of the amount required to return the Group’s leased premises to their original
condition, taking into account due consideration of the Group’s past history of vacating stores and the Group’s best estimate of
onerous lease obligations.For
per
sona
l use
onl
y

82
NOTES TO THE FINANCIAL STATEMENTS (continued)
for the fi nancial year ended 30 June 2019
Consolidated
2019
$m
2018
$m
15 OTHER LIABILITIES
Current
Lease accrual 2.6 2.8
Lease incentive 5.2 5.2
Other fi nancial liabilities 0.2 0.3
8.0 8.3
Non-current
Lease accrual 15.2 15.0
Lease incentive 18.0 20.6
33.2 35.6
(a) Lease accrual
Leases in which a signifi cant portion of the risks and rewards of ownership are not transferred to the Group as lessee are classifi ed
as operating leases. Payments made under operating leases (net of any incentives received from the lessor) are charged to the
statement of profi t or loss on a straight line basis over the period of the lease. The lease accrual represents the difference between
the expense incurred and the payments made.
(b) Lease incentives
In the event that lease incentives (for example rent free periods and upfront capital contributions) are received to enter into operating
leases, such incentives are recognised as a liability. The aggregate benefi ts of incentives are recognised as a reduction of rental
expense on a straight line basis over the period of the lease.
For
per
sona
l use
onl
y

83
CAPITAL STRUCTURE AND RISK MANAGEMENT
16 NOTES TO THE CASH FLOW STATEMENT
For the purposes of the cash fl ow statement, cash and cash equivalents includes cash on hand and in banks, net of outstanding
bank overdrafts and trade fi nance facilities.
(a) Reconciliation of cash and cash equivalents
Cash and cash equivalents at the end of the fi nancial year as shown in the cash fl ow statement is reconciled as follows:
Consolidated
2019
$m
2018
$m
Cash 136.4 72.0
Trade fi nance facility (17.2) –
Cash and cash equivalents 119.2 72.0
(b) Reconciliation of net cash infl ow from operating activities to profi t
Profi t for the year 249.8 233.2
Depreciation and amortisation 54.7 60.4
Impairment of plant and equipment 1.5 0.7
Non-cash employee benefi ts expense - share-based payments 10.2 7.8
Net loss on disposal of non-current assets 9.9 2.5
Fair value adjustment to derivatives (1.1) 1.9
Change in operating assets and liabilities net of effects from acquisition of businesses:
(Increase) decrease in inventories 5.9 (33.0)
(Increase) decrease in current receivables (28.9) (10.7)
(Increase) decrease in other current assets 13.1 (0.4)
(Increase) decrease in deferred tax liabilities (8.4) (10.4)
(Decrease) increase in current payables (11.1) 22.4
(Decrease) increase in current provisions 12.3 7.3
(Decrease) increase in other current liabilities (0.2) (0.7)
(Decrease) increase in deferred revenue (0.9) 12.8
(Decrease) increase in non-current provisions 2.7 0.7
(Decrease) increase in other non-current liabilities (4.2) 0.7
(Decrease) increase in current tax liabilities (3.7) (3.1)
Net cash infl ow from operating activities 301.6 292.1
Consolidated
2019
$m
2018
$m
17 BORROWINGS
Unsecured non-current
Bank loans 439.1 469.4
Reconciliation of liabilities arising from fi nancing activities
Opening borrowings 469.4 558.8
Repayment of borrowings (30.5) (89.7)
Debt issue costs paid (0.6) (0.8)
Amortisation of debt issue costs 0.8 1.1
439.1 469.4
For
per
sona
l use
onl
y

84
NOTES TO THE FINANCIAL STATEMENTS (continued)
for the fi nancial year ended 30 June 2019
17 BORROWINGS (continued)
In June 2019, the Group restructured its multi-tranche term debt facilities, resulting in a reduction in its multi-tranche term debt
facilities by $110.0 million to $440.0 million. In conjunction with the restructure of the term debt facilities, the Group also increased
its trade fi nance facility by $110.0 million to $140.0 million and reduced its overdraft facility by $30 million to $59.6 million. Refer to
note 20(b) for further details on the Group’s fi nancing facilities.
In line with the Group’s fi nancial risk management policy, the Group has utilised an interest rate swap and interest rate cap over
approximately 50% of the Group’s borrowings to mitigate the risk of changing interest rates on the variable rate debt held.
(a) Recognition and measurement
Borrowings are initially recognised at fair value, net of transaction costs incurred. Borrowings are subsequently measured at
amortised cost.
Borrowings are classifi ed as current liabilities unless the Group has an unconditional right to defer settlement of the liability for at
least 12 months after the reporting date, and intends to do so.
The Group monitors compliance with its fi nancial covenants on a monthly basis and reports compliance on a semi-annual basis to
the banks. The Group has complied with all such requirements during the current and previous year.
Parent entity Parent entity
2019
Shares
2018
Shares
2019
$m
2018
$m
18 CONTRIBUTED EQUITY
(a) Share capital
Ordinary shares - fully paid 114,883,372 114,883,372 434.8 441.7
Ordinary shares issued are classifi ed as equity and are fully paid, have no par value and carry one vote per share and the right to
dividends. Incremental costs directly attributable to the issue of new shares are shown in equity as a deduction, net of tax, from the
proceeds.
If the entity reacquires its own equity instruments, for example, as the result of a share buy-back, those instruments are deducted
from equity and the associated shares are cancelled. No gain or loss is recognised in the profi t or loss and the consideration paid,
including any directly attributable incremental costs (net of income taxes), is recognised directly in equity.
(b) Movements in ordinary share capital
Date Details
Number of
shares $m
1 July 2017 Opening balance 114,421,403 438.7
Issue of shares under share option and deferred STI plans 461,969 3.0
30 June 2018 Closing balance 114,883,372 441.7
1 July 2018 Opening balance 114,883,372 441.7
Shares acquired by employee share trust (354,617) (8.8)
Allocation of shares under share option and deferred STI plans 354,617 1.9
30 June 2019 Closing balance 114,883,372 434.8
(c) Share options
In accordance with the provisions of the Company’s share option plans, as at 30 June 2019, executives and non-executive
management have options over 1,252,931 ordinary shares (of which 3,197 were vested), in aggregate, with various expiry dates.
As at 30 June 2018, executives and non-executive management had options over 1,333,919 ordinary shares (which were all
unvested), in aggregate, with various expiry dates.
Share options granted under the Company’s share option plans carry no rights to dividends and no voting rights.
For
per
sona
l use
onl
y

85
18 CONTRIBUTED EQUITY (continued)
(d) Capital management
The Board reviews the capital structure on an ongoing basis. The Group’s objective is to maintain an optimal capital structure which
seeks to reduce the cost of capital and to ensure the Group has access to adequate capital to sustain the future development of
the business.
In order to maintain or adjust the capital structure, the Group may adjust the level of dividends paid to shareholders, return capital to
shareholders, buy back shares, issue new shares or sell assets to reduce debt.
As part of its capital management program, the Group monitors the return on invested capital and the gearing ratio. The Group
defi nes return on invested capital as earnings before interest and tax (EBIT) divided by the sum of total equity plus net debt and the
gearing ratio as term debt excluding capitalised borrowing costs, plus bank overdrafts, divided by earnings before interest, taxation,
depreciation, amortisation and impairment (EBITDA).
The Board has adopted a policy of monitoring the dividend payout ratio and targeting a payout ratio of 65% of net profi t after tax as
it seeks to strike a balance between shareholder returns and ensuring adequate capital is retained for the growth of the business so
as to maximise long term shareholder returns.
There were no changes in the Group’s approach to capital management during the year.
The Group’s return on invested capital and gearing ratios as at 30 June 2019 and 30 June 2018 were as follows:
Consolidated
2019
$m
2018
$m
Return on invested capital
Profi t before tax 359.3 334.5
Net fi nance costs 13.6 16.1
EBIT 372.9 350.6
Borrowings 439.1 469.4
Cash and cash equivalents (119.2) (72.0)
Net debt 319.9 397.4
Total equity 1,044.1 947.6
Invested capital 1,364.0 1,345.0
Return on invested capital 27.3% 26.1%
Gearing
Term debt 440.0 470.3
EBIT 372.9 350.6
Depreciation and impairment 56.2 61.1
EBITDA 429.1 411.7
Gearing 1.03 1.14
Consolidated
2019
$m
2018
$m
19 RESERVES
Equity-settled benefi ts 54.2 43.5
Common control reserve (6.1) (6.1)
Hedging reserves 0.6 1.7
Foreign currency translation reserve 5.0 3.6
53.7 42.7
For
per
sona
l use
onl
y
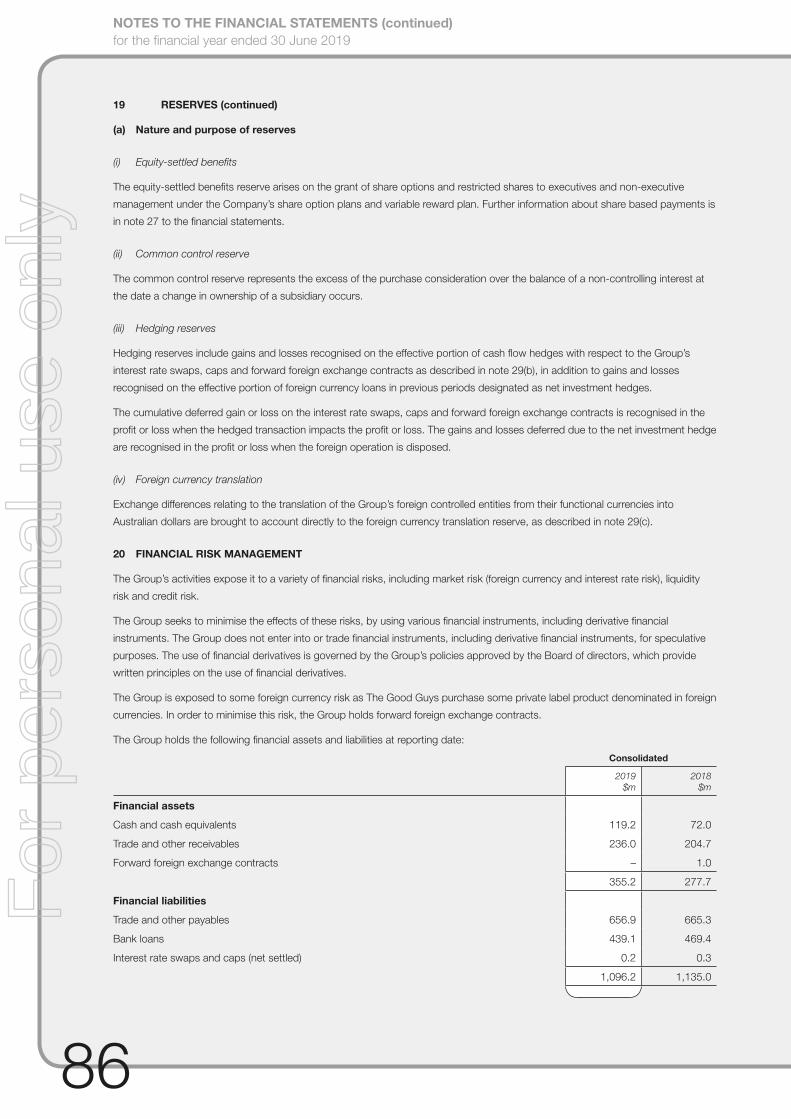
86
NOTES TO THE FINANCIAL STATEMENTS (continued)
for the fi nancial year ended 30 June 2019
19 RESERVES (continued)
(a) Nature and purpose of reserves
(i) Equity-settled benefi ts
The equity-settled benefi ts reserve arises on the grant of share options and restricted shares to executives and non-executive
management under the Company’s share option plans and variable reward plan. Further information about share based payments is
in note 27 to the fi nancial statements.
(ii) Common control reserve
The common control reserve represents the excess of the purchase consideration over the balance of a non-controlling interest at
the date a change in ownership of a subsidiary occurs.
(iii) Hedging reserves
Hedging reserves include gains and losses recognised on the effective portion of cash fl ow hedges with respect to the Group’s
interest rate swaps, caps and forward foreign exchange contracts as described in note 29(b), in addition to gains and losses
recognised on the effective portion of foreign currency loans in previous periods designated as net investment hedges.
The cumulative deferred gain or loss on the interest rate swaps, caps and forward foreign exchange contracts is recognised in the
profi t or loss when the hedged transaction impacts the profi t or loss. The gains and losses deferred due to the net investment hedge
are recognised in the profi t or loss when the foreign operation is disposed.
(iv) Foreign currency translation
Exchange differences relating to the translation of the Group’s foreign controlled entities from their functional currencies into
Australian dollars are brought to account directly to the foreign currency translation reserve, as described in note 29(c).
20 FINANCIAL RISK MANAGEMENT
The Group’s activities expose it to a variety of fi nancial risks, including market risk (foreign currency and interest rate risk), liquidity
risk and credit risk.
The Group seeks to minimise the effects of these risks, by using various fi nancial instruments, including derivative fi nancial
instruments. The Group does not enter into or trade fi nancial instruments, including derivative fi nancial instruments, for speculative
purposes. The use of fi nancial derivatives is governed by the Group’s policies approved by the Board of directors, which provide
written principles on the use of fi nancial derivatives.
The Group is exposed to some foreign currency risk as The Good Guys purchase some private label product denominated in foreign
currencies. In order to minimise this risk, the Group holds forward foreign exchange contracts.
The Group holds the following fi nancial assets and liabilities at reporting date:
Consolidated
2019
$m
2018
$m
Financial assets
Cash and cash equivalents 119.2 72.0
Trade and other receivables 236.0 204.7
Forward foreign exchange contracts – 1.0
355.2 277.7
Financial liabilities
Trade and other payables 656.9 665.3
Bank loans 439.1 469.4
Interest rate swaps and caps (net settled) 0.2 0.3
1,096.2 1,135.0
For
per
sona
l use
onl
y
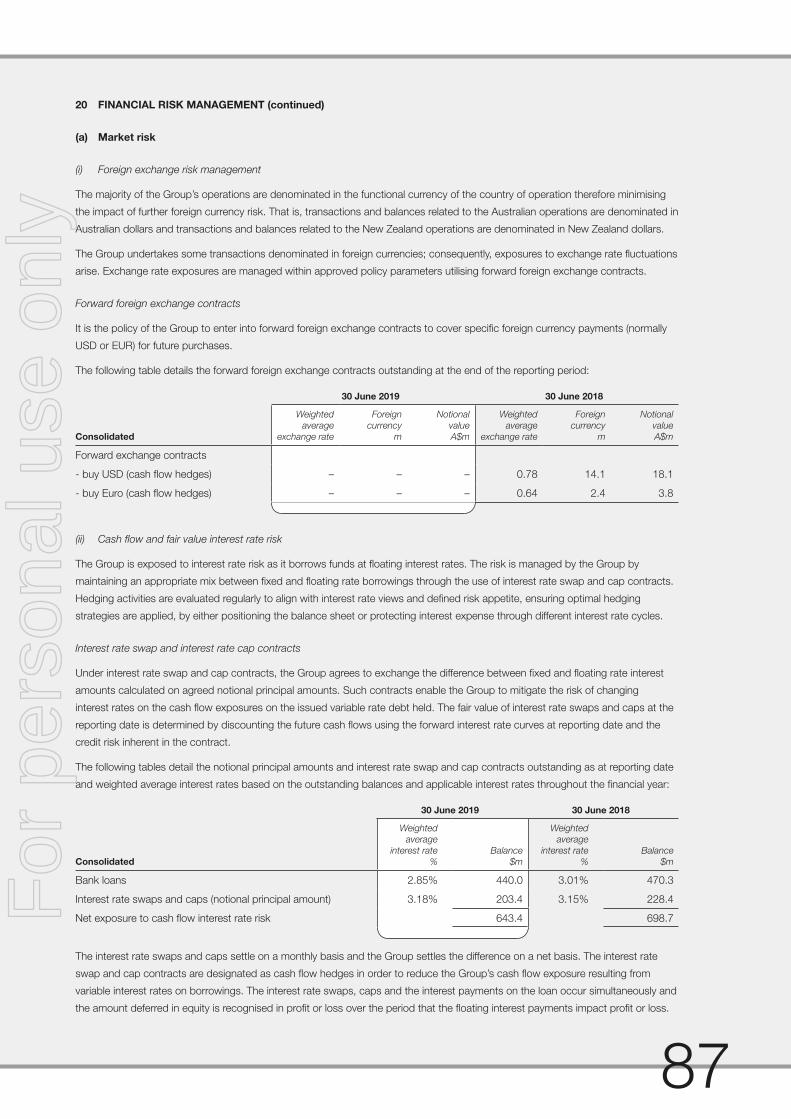
87
20 FINANCIAL RISK MANAGEMENT (continued)
(a) Market risk
(i) Foreign exchange risk management
The majority of the Group’s operations are denominated in the functional currency of the country of operation therefore minimising
the impact of further foreign currency risk. That is, transactions and balances related to the Australian operations are denominated in
Australian dollars and transactions and balances related to the New Zealand operations are denominated in New Zealand dollars.
The Group undertakes some transactions denominated in foreign currencies; consequently, exposures to exchange rate fl uctuations
arise. Exchange rate exposures are managed within approved policy parameters utilising forward foreign exchange contracts.
Forward foreign exchange contracts
It is the policy of the Group to enter into forward foreign exchange contracts to cover specifi c foreign currency payments (normally
USD or EUR) for future purchases.
The following table details the forward foreign exchange contracts outstanding at the end of the reporting period:
30 June 2019 30 June 2018
Consolidated
Weighted
average
exchange rate
Foreign
currency
m
Notional
value
A$m
Weighted
average
exchange rate
Foreign
currency
m
Notional
value
A$m
Forward exchange contracts
- buy USD (cash fl ow hedges) – – – 0.78 14.1 18.1
- buy Euro (cash fl ow hedges) – – – 0.64 2.4 3.8
(ii) Cash fl ow and fair value interest rate risk
The Group is exposed to interest rate risk as it borrows funds at fl oating interest rates. The risk is managed by the Group by
maintaining an appropriate mix between fi xed and fl oating rate borrowings through the use of interest rate swap and cap contracts.
Hedging activities are evaluated regularly to align with interest rate views and defi ned risk appetite, ensuring optimal hedging
strategies are applied, by either positioning the balance sheet or protecting interest expense through different interest rate cycles.
Interest rate swap and interest rate cap contracts
Under interest rate swap and cap contracts, the Group agrees to exchange the difference between fi xed and fl oating rate interest
amounts calculated on agreed notional principal amounts. Such contracts enable the Group to mitigate the risk of changing
interest rates on the cash fl ow exposures on the issued variable rate debt held. The fair value of interest rate swaps and caps at the
reporting date is determined by discounting the future cash fl ows using the forward interest rate curves at reporting date and the
credit risk inherent in the contract.
The following tables detail the notional principal amounts and interest rate swap and cap contracts outstanding as at reporting date
and weighted average interest rates based on the outstanding balances and applicable interest rates throughout the fi nancial year:
30 June 2019 30 June 2018
Consolidated
Weighted
average
interest rate
%
Balance
$m
Weighted
average
interest rate
%
Balance
$m
Bank loans 2.85% 440.0 3.01% 470.3
Interest rate swaps and caps (notional principal amount) 3.18% 203.4 3.15% 228.4
Net exposure to cash fl ow interest rate risk 643.4 698.7
The interest rate swaps and caps settle on a monthly basis and the Group settles the difference on a net basis. The interest rate
swap and cap contracts are designated as cash fl ow hedges in order to reduce the Group’s cash fl ow exposure resulting from
variable interest rates on borrowings. The interest rate swaps, caps and the interest payments on the loan occur simultaneously and
the amount deferred in equity is recognised in profi t or loss over the period that the fl oating interest payments impact profi t or loss.
For
per
sona
l use
onl
y

88
NOTES TO THE FINANCIAL STATEMENTS (continued)
for the fi nancial year ended 30 June 2019
20 FINANCIAL RISK MANAGEMENT (continued)
(a) Market risk (continued)
Summarised sensitivity analysis
The carrying value of interest rate swap and caps was $0.2m (2018: $0.3m) and borrowings was $439.1m (2018: $469.4m).
Using a sensitivity of 50 basis points results in an immaterial impact on the carrying values.
(b) Liquidity risk
Ultimate responsibility for liquidity risk management rests with the Board of directors, who assess the Group’s short, medium and
long term funding and liquidity management requirements. The Group manages liquidity risk by maintaining adequate reserves,
banking facilities and reserve borrowing facilities and by continuously monitoring forecast and actual cash fl ows.
Financing arrangements
The Group had access to the following undrawn borrowing facilities at the end of the reporting period:
Consolidated
2019
$m
2018
$m
Unsecured bank overdraft facility:
amount used – 16.7
amount unused 59.6 72.5
59.6 89.2
Unsecured trade fi nance facility:
amount used 17.2 –
amount unused 122.8 30.0
140.0 30.0
Unsecured indemnity guarantees:
amount used 3.7 4.9
amount unused 2.6 4.0
6.3 8.9
Unsecured bank loan facilities (term debt):
amount used(i) 440.0 470.3
amount unused – 79.7
440.0 550.0
Headroom in total borrowing facilities (excluding security indemnity guarantees) 182.4 182.2
(i) Face value of term debt (excluding capitalised borrowing costs).
For
per
sona
l use
onl
y

89
20 FINANCIAL RISK MANAGEMENT (continued)
(b) Liquidity risk (continued)
Maturities of fi nancial liabilities
The following tables detail the Group’s remaining contractual maturity for its fi nancial liabilities. The tables have been drawn up
based on the undiscounted cash fl ows of fi nancial liabilities based on the earliest date on which the Group can be required to pay.
The table includes both principal and estimated interest cash fl ows.
Cash fl ows for fi nancial liabilities without fi xed amount or timing are based on the conditions existing at the reporting date.
Less than
6 months 6 - 12 months
Between
1 and 2 years
Between
2 and 5 years Over 5 years Total
Weighted
average
effective
interest rate
2019 $m $m $m $m $m $m %
Financial liabilities
Trade and other payables 656.9 – – – – 656.9 –
Bank loans 6.3 6.3 12.5 442.7 – 467.8 2.85%
Interest rate swaps and caps
(net settled) 0.2 – – – – 0.2 3.18%
663.4 6.3 12.5 442.7 – 1,124.9
Less than
6 months 6 - 12 months
Between
1 and 2 years
Between
2 and 5 years Over 5 years Total
Weighted
average
effective
interest rate
2018 $m $m $m $m $m $m %
Financial liabilities
Trade and other payables 665.3 – – – – 665.3 –
Bank loans 7.1 7.1 205.4 281.6 – 501.2 3.01%
Interest rate swaps and caps
(net settled) 0.1 0.2 – – – 0.3 3.15%
672.5 7.3 205.4 281.6 – 1,166.8
(c) Credit risk management
Credit risk refers to the risk that a counterparty will default on its contractual obligations resulting in fi nancial loss to the Group.
The Group has endeavoured to minimise its credit risk by dealing with creditworthy counterparties. The Group’s exposure and the
credit ratings of its counterparties are continuously monitored and the aggregate value of transactions concluded is spread amongst
approved counterparties.
The Group does not have any signifi cant credit risk exposure to any single counterparty or any group of counterparties having
similar characteristics.
The carrying amount of fi nancial assets recorded in the fi nancial statements, net of any allowance for impairment, represents the
Group’s maximum exposure to credit risk.
For
per
sona
l use
onl
y

90
NOTES TO THE FINANCIAL STATEMENTS (continued)
for the fi nancial year ended 30 June 2019
20 FINANCIAL RISK MANAGEMENT (continued)
(d) Fair value of fi nancial instruments
The only fi nancial assets or fi nancial liabilities carried at fair value in the current fi nancial year are interest rate swaps and interest
rate caps.
All these instruments are considered to be Level 2 fi nancial instruments because, unlike Level 1 fi nancial instruments, their
measurement is derived from inputs other than quoted prices that are observable for the assets or liabilities, either directly (as prices)
or indirectly (derived from prices).
The interest rate swaps and caps fair value was obtained from third party valuations derived from discounted cash fl ow forecasts of
interest rates from observable yield curves at the end of the reporting period and contract interest rates.
The foreign currency forward contracts fair value presented in the prior year was obtained from third party valuations derived from
discounted cash fl ow forecasts of forward exchange rates at the end of the reporting period and contract exchange rates.
There were no transfers between levels 1, 2 and 3 for recurring fair value measurements during the fi nancial year.
The carrying amount of other fi nancial assets and fi nancial liabilities recorded in the fi nancial statements approximate their fair values.
21 COMMITMENTS
(a) Non-cancellable operating leases
The Group has entered into operating lease agreements in relation to its stores and some minor operating leases in relation to plant
and equipment. Store leases have terms of between fi ve to fi fteen years, with, in some cases, an option to extend. Operating lease
contracts generally contain market review clauses in the event that the Group exercises its option to renew. The Group does not
have an option to purchase the leased asset at the expiry of the lease period.
Consolidated
2019
$m
2018
$m
Commitments for minimum lease payments in relation to non-cancellable operating leases are
payable as follows:
Within one year 153.4 157.5
Later than one year but not later than fi ve years 407.6 405.3
Later than fi ve years 118.8 121.6
679.8 684.4
For
per
sona
l use
onl
y
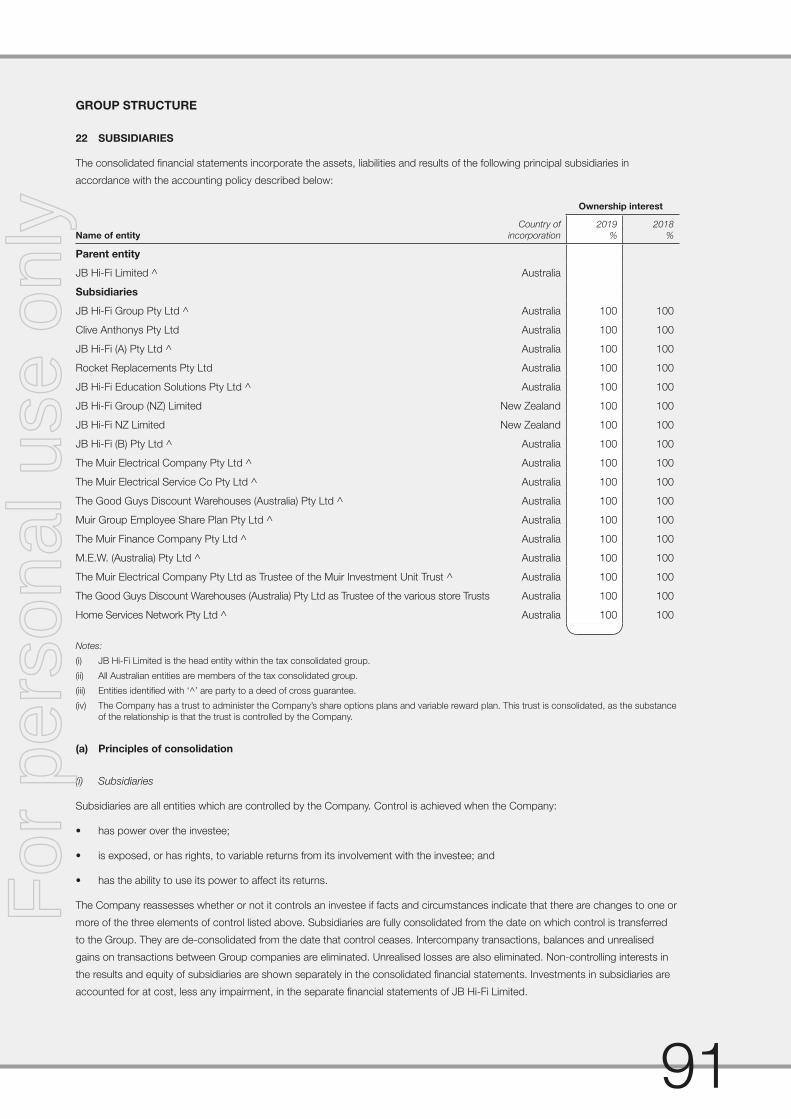
91
GROUP STRUCTURE
22 SUBSIDIARIES
The consolidated fi nancial statements incorporate the assets, liabilities and results of the following principal subsidiaries in
accordance with the accounting policy described below:
Name of entity
Country of
incorporation
Ownership interest
2019
%
2018
%
Parent entity
JB Hi-Fi Limited ^ Australia - -
Subsidiaries
JB Hi-Fi Group Pty Ltd ^ Australia 100 100
Clive Anthonys Pty Ltd Australia 100 100
JB Hi-Fi (A) Pty Ltd ^ Australia 100 100
Rocket Replacements Pty Ltd Australia 100 100
JB Hi-Fi Education Solutions Pty Ltd ^ Australia 100 100
JB Hi-Fi Group (NZ) Limited New Zealand 100 100
JB Hi-Fi NZ Limited New Zealand 100 100
JB Hi-Fi (B) Pty Ltd ^ Australia 100 100
The Muir Electrical Company Pty Ltd ^ Australia 100 100
The Muir Electrical Service Co Pty Ltd ^ Australia 100 100
The Good Guys Discount Warehouses (Australia) Pty Ltd ^ Australia 100 100
Muir Group Employee Share Plan Pty Ltd ^ Australia 100 100
The Muir Finance Company Pty Ltd ^ Australia 100 100
M.E.W. (Australia) Pty Ltd ^ Australia 100 100
The Muir Electrical Company Pty Ltd as Trustee of the Muir Investment Unit Trust ^ Australia 100 100
The Good Guys Discount Warehouses (Australia) Pty Ltd as Trustee of the various store Trusts Australia 100 100
Home Services Network Pty Ltd ^ Australia 100 100
Notes:
(i) JB Hi-Fi Limited is the head entity within the tax consolidated group.
(ii) All Australian entities are members of the tax consolidated group.
(iii) Entities identifi ed with ‘^’ are party to a deed of cross guarantee.
(iv) The Company has a trust to administer the Company’s share options plans and variable reward plan. This trust is consolidated, as the substance
of the relationship is that the trust is controlled by the Company.
(a) Principles of consolidation
(i) Subsidiaries
Subsidiaries are all entities which are controlled by the Company. Control is achieved when the Company:
• has power over the investee;
• is exposed, or has rights, to variable returns from its involvement with the investee; and
• has the ability to use its power to affect its returns.
The Company reassesses whether or not it controls an investee if facts and circumstances indicate that there are changes to one or
more of the three elements of control listed above. Subsidiaries are fully consolidated from the date on which control is transferred
to the Group. They are de-consolidated from the date that control ceases. Intercompany transactions, balances and unrealised
gains on transactions between Group companies are eliminated. Unrealised losses are also eliminated. Non-controlling interests in
the results and equity of subsidiaries are shown separately in the consolidated fi nancial statements. Investments in subsidiaries are
accounted for at cost, less any impairment, in the separate fi nancial statements of JB Hi-Fi Limited.
For
per
sona
l use
onl
y

92
NOTES TO THE FINANCIAL STATEMENTS (continued)
for the fi nancial year ended 30 June 2019
22 SUBSIDIARIES (continued)
(a) Principles of consolidation (continued)
(ii) Changes in ownership interests
The Company treats transactions with non-controlling interests that do not result in a loss of control as transactions with equity
owners of the Company. A change in ownership interest results in an adjustment between the carrying amounts of the controlling
and non-controlling interests to refl ect their relative interests in the subsidiary. Any difference between the amount of the adjustment
to non-controlling interests and any consideration paid or received is recognised in a separate reserve within equity attributable to
owners of JB Hi-Fi Limited (the common control reserve).
23 DEED OF CROSS GUARANTEE
The subsidiaries identifi ed with a ‘^’ in note 22 are parties to a deed of cross guarantee under which each Company guarantees to
each creditor payment in full of any debt in accordance with the deed of cross guarantee. By entering into the deed, the subsidiaries
who are party to the deed have been relieved from the requirement to prepare and lodge an audited fi nancial report under ASIC
Corporations (Wholly-owned Companies) Instrument 2016/785.
The consolidated statement of profi t or loss, statement of profi t or loss and other comprehensive income and balance sheet of the
entities party to the deed of cross guarantee are provided as follows:
2019
$m
2018
$m
(a) Consolidated statement of profi t or loss, statement of profi t or loss and other
comprehensive income
Statement of profi t or loss
Revenue 5,083.9 4,895.6
Cost of sales (3,978.1) (3,845.0)
Gross profi t 1,105.8 1,050.6
Other income 118.7 114.2
Sales and marketing expenses (543.6) (503.2)
Occupancy expenses (207.1) (205.0)
Administration expenses (35.4) (34.0)
Finance costs (14.2) (16.4)
Other expenses (63.4) (68.9)
Profi t before income tax 360.8 337.3
Income tax expense (110.0) (102.1)
Profi t for the year 250.8 235.2
Statement of profi t or loss and other comprehensive income
Profi t for the year 250.8 235.2
Other comprehensive income
Items that may be reclassifi ed to profi t or loss
Changes in the fair value of cash fl ow hedges (net of tax) (1.1) 1.9
Other comprehensive income for the year (net of tax) (1.1) 1.9
Total comprehensive income for the year 249.7 237.1For
per
sona
l use
onl
y

93
2019
$m
2018
$m
23 DEED OF CROSS GUARANTEE (continued)
(b) Balance sheet
Current assets
Cash and cash equivalents 119.5 69.3
Trade and other receivables 396.7 295.9
Inventories 595.5 606.6
Other current assets 36.5 13.2
Total current assets 1,148.2 985.0
Non-current assets
Plant and equipment 148.6 161.1
Deferred tax assets 71.3 63.5
Intangible assets 83.8 83.8
Investments in subsidiaries 911.7 911.7
Other non-current assets 213.5 173.0
Total non-current assets 1,428.9 1,393.1
Total assets 2,577.1 2,378.1
Current liabilities
Trade and other payables 628.4 644.9
Deferred revenue 119.1 60.3
Current tax liabilities 5.1 9.6
Provisions 98.4 89.8
Other current liabilities 7.3 7.2
Other fi nancial liabilities 0.3 –
Total current liabilities 858.6 811.8
Non-current liabilities
Borrowings 439.1 462.1
Deferred revenue 90.2 6.2
Provisions 14.2 12.4
Other non-current liabilities 30.0 32.5
Total non-current liabilities 573.5 513.2
Total liabilities 1,432.1 1,325.0
Net assets 1,145.0 1,053.1
Equity
Contributed equity 454.9 453.0
Reserves 41.2 44.6
Retained earnings 648.9 555.5
Total equity 1,145.0 1,053.1
For
per
sona
l use
onl
y

94
NOTES TO THE FINANCIAL STATEMENTS (continued)
for the fi nancial year ended 30 June 2019
Parent Entity
2019
$m
2018
$m
24 PARENT ENTITY
Assets
Non-current assets 526.4 517.7
Total assets 526.4 517.7
Liabilities
Current liabilities 8.9 14.1
Non-current liabilities 0.1 –
Total liabilities 9.0 14.1
- -
Shareholders’ equity
Contributed equity 434.8 441.7
Reserves 54.2 43.5
Retained earnings 28.4 18.4
517.4 503.6
Profi t for the year 167.4 161.8
Total comprehensive income 167.4 161.8
25 RELATED PARTY TRANSACTIONS
(a) Parent entity and equity interests in related parties
The parent entity of the Group is JB Hi-Fi Limited, a listed public company, incorporated in Australia.
(b) Equity interests in related parties
Details of the percentage of ordinary shares held in subsidiaries are disclosed in note 22.
(c) Key management personnel
Disclosures relating to key management personnel are set out in the Directors’ report.
(d) Terms and conditions of transactions with related parties other than key management personnel or entities related
to them
Sales to, and purchases from, related parties for goods and services are made in arm’s length transactions at normal prices and on
normal commercial terms.
For
per
sona
l use
onl
y

95
OTHER DISCLOSURES
Consolidated
2019
$’000
2018
$’000
26 KEY MANAGEMENT PERSONNEL DISCLOSURES
The aggregate compensation of the key management personnel of the Group is set out below: -
Short-term employee benefi ts 8,310 8,974
Post-employment benefi ts 239 230
Share-based payments expense 4,230 2,943
12,779 12,147
Detailed remuneration disclosures are provided in the remuneration report on pages 32 to 56.
27 SHARE-BASED PAYMENTS
(a) Group share option plans
The Group has ownership-based remuneration schemes for executives and non-executive management (excluding non-executive
directors). In accordance with the provisions of these schemes, executives and non-executive managers within the Group are
granted options to purchase parcels of ordinary shares at various issue prices or to acquire shares at a zero exercise price.
Details of the features of outstanding share options are provided in the remuneration report on pages 53 to 56.
The following reconciles the outstanding share options granted under the Group’s share option plans at the beginning and end of
the fi nancial year:
Balance at
start of
the year
Number
Granted
during
the year
Number
Exercised/
lapsed
during
the year
Number
Balance
at end of
the year
Number
Vested and
exercisable
at end of
the year
Number
2019
Outstanding Share Options with an exercise price 182,199 – (107,798) 74,401 –
Outstanding Zero Exercise Price Options 1,151,720 275,588 (248,778) 1,178,530 3,197
1,333,919 275,588 (356,576) 1,252,931 3,197
Weighted average exercise price of those with
an exercise price $17.69 – $17.88 $17.41 –
Balance at
start of
the year
Number
Granted
during
the year
Number
Exercised/
lapsed
during
the year
Number
Balance
at end of
the year
Number
Vested and
exercisable
at end of
the year
Number
2018
Outstanding Share Options with an exercise price 404,054 – (221,855) 182,199 –
Outstanding Zero Exercise Price Options 955,145 464,840 (268,265) 1,151,720 –
1,359,199 464,840 (490,120) 1,333,919 –
Weighted average exercise price of those with
an exercise price $15.53 – $13.75 $17.69 –
The weighted average remaining contractual life of share options outstanding at the end of the period was 1,112 days
(2018: 1,222 days).
For
per
sona
l use
onl
y

96
NOTES TO THE FINANCIAL STATEMENTS (continued)
for the fi nancial year ended 30 June 2019
27 SHARE-BASED PAYMENTS (continued)
(a) Group share option plans (continued)
Fair value of options granted
Equity settled share based payments with employees are measured at the fair value of the equity instrument at grant date.
The weighted average fair value of options granted during the year ended 30 June 2019 was $21.97 (2018: $21.48). The fair value
at grant date is determined using a Black-Scholes option pricing model that takes into account the exercise price, the term of the
option, the expected exercise date based on prior years’ experience, the share price at grant date, the expected price volatility of
the underlying share, the expected dividend yield and the risk-free interest rate.
The expected life used in the model has been adjusted, based on management’s best estimate, for the effects of non-transferability,
exercise restrictions and behavioural considerations.
The expected price volatility for options granted during the year ended 30 June 2019 is based on the daily closing share price for
the number of years preceding the issue of the series, that matches the years to vesting as all of these options are expected to be
exercised as soon as they vest.
Detailed share option disclosures for all options series granted and exercised during the year are provided in the remuneration report
on pages 32 to 56.
Share based payments expense
The fair value determined at the grant date of the equity-settled share based payments is expensed on a straight line basis over the
vesting period, based on the Group’s estimate of shares that will eventually vest, with a corresponding increase in equity.
At each reporting date the Group estimates the number of equity instruments expected to vest. The number of equity instruments
that are expected to vest is based on management’s assessment of the likelihood of the vesting conditions attached to the equity
instruments being satisfi ed. The key vesting conditions that are assessed are earnings per share targets and required service
periods. The impact of any revision in the number of equity instruments that are expected to vest is recognised as an adjustment to
the share based payments expense with the corresponding adjustment to the equity-settled benefi ts reserve in the reporting period
that the revision is made.
b) Variable reward plan
In the 2019 fi nancial year, the Group introduced a Variable Reward Plan (VRP) for Group Executives which replaces their previous
short term and long term incentives. Under the VRP, performance is assessed at the end of each fi nancial year against a scorecard
of robust measures and awards under the VRP are delivered:
• 25% in cash at the end of the one-year performance period; and
• 75% in restricted shares, to be released progressively in equal tranches over years 2, 3 and 4.
There are also certain non-Group executives who receive a VRP in addition to their existing short term and long term incentives,
however the whole amount is delivered in restricted shares that are released progressively in equal tranches over years 2, 3 and 4.
Further details on the VRP are set out in the remuneration report on page 35.
The component of the VRP that is paid in cash is treated as a bonus and is expensed to the profi t and loss in the period the bonus
is earned. The component of the VRP that is delivered in shares is expensed on a straight line basis over the restriction period of
each tranche, with the expense recorded as part of the share based payments expense and a corresponding increase in equity.
Consolidated
2019
$’000
2018
$’000
28 REMUNERATION OF AUDITORS
Audit and other services
Audit and review of group fi nancial statements 625 607
Audit and review of subsidiary fi nancial statements 33 44
Audit of accounting for the acquisition of The Good Guys – 10
Total remuneration for audit and other services 658 661
The auditor of the Group is Deloitte Touche Tohmatsu.
For
per
sona
l use
onl
y

97
29 SUMMARY OF OTHER SIGNIFICANT ACCOUNTING POLICIES
The remaining principal accounting policies adopted in the preparation of these fi nancial statements that have not already been
disclosed are set out below. These policies have been consistently applied to all the years presented, unless otherwise stated.
(a) Revenue recognition
Revenue is measured at the fair value of the consideration received or receivable. Amounts disclosed as revenue are net of returns,
trade allowances, rebates and amounts collected on behalf of third parties.
The Group recognises revenue when the amount of revenue can be reliably measured, it is probable that future economic benefi ts will
fl ow to the entity and specifi c criteria have been met for each of the Group’s activities as described below. The Group bases its estimates
on historical results, taking into consideration the type of customer, the type of transaction and the specifi cs of each arrangement.
Revenue is recognised for the major business activities as follows:
(i) Sale of goods
Revenue associated with the sale of goods is recognised when the performance obligation of the sale has been fulfi lled and control
of the goods has transferred to the customer, which occurs at the point of sale when the goods are collected/delivered.
Gift cards and store credits are considered a prepayment for goods and services to be delivered in the future. The Group has an
obligation to transfer the goods or services in the future - creating a performance obligation. The Group recognises deferred revenue for
the amount of the prepayment and recognises revenue when the customer redeems the gift card or store credit and the Group fulfi ls
the performance obligation related to the transaction or likelihood of the gift card being redeemed by the customer is deemed remote.
In recognising revenue from the sale of goods, the Group considers its historical experience with sales returns to determine if its
‘highly probable’ that a signifi cant reversal of revenue will arise in the future.
(ii) Commissions
The Group acts as an agent in the sale of various products and services to customers such as telecommunication contracts.
Commissions associated with agency sales are recognised on a point in time basis when all performance obligations have been
completed to entitle the Group to the commission.
(iii) Rendering of services
The Group generates revenue from the provision of various services including installation, customer delivery, IT services and
extended care and customer support services.
Revenue relating to installation, customer delivery and IT services is principally recognised on a point in time basis, which occurs
upon completion of the service given the short time period over which the services are provided.
Revenue relating to extended care and customer support services is recognised over the period of cover where the Group retains
the responsibility for the performance obligations associated with the services and at point of sale when a third party assumes
responsibility for the performance obligations associated with the services. Amounts collected for services not yet provided are
recorded as deferred revenue in the balance sheet.
(b) Derivatives and hedging activities
Derivatives are initially recognised at fair value on the date a derivative contract is entered into and are subsequently remeasured
to their fair value at the end of each reporting period. The accounting for subsequent changes in fair value depends on whether
the derivative is designated as a hedging instrument, and if so, the nature of the item being hedged. The Group designates certain
derivatives as either:
• hedges of a particular risk associated with the cash fl ows of recognised assets and liabilities and highly probable forecast
transactions (cash fl ow hedges); or
• hedges of a net investment in a foreign operation (net investment hedges).
The Group documents at the inception of the hedging transaction the relationship between hedging instruments and hedged items,
as well as its risk management objective and strategy for undertaking various hedge transactions. The Group also documents its
assessment, both at hedge inception and on an ongoing basis, of whether the derivatives that are used in hedging transactions
have been and will continue to be highly effective in offsetting changes in fair values or cash fl ows of hedged items.
For
per
sona
l use
onl
y

98
NOTES TO THE FINANCIAL STATEMENTS (continued)
for the fi nancial year ended 30 June 2019
29 SUMMARY OF OTHER SIGNIFICANT ACCOUNTING POLICIES (continued)
(b) Derivatives and hedging activities (continued)
The fair values of various derivative fi nancial instruments used for hedging purposes are disclosed in note 20. Movements in the
hedging reserve in shareholder’s equity are shown in the statement of changes in equity.
(i) Cash fl ow hedge
The effective portion of changes in the fair value of derivatives that are designated and qualify as cash fl ow hedges is recognised in
the cash fl ow hedge reserve within equity. The gain or loss relating to the ineffective portion is recognised immediately in profi t or
loss within other income or other expenses.
Amounts accumulated in equity are reclassifi ed to profi t or loss in the periods when the hedged item affects profi t or loss. The gain
or loss relating to the effective portion of interest rate swaps hedging variable rate borrowings is recognised in profi t or loss within
‘fi nance costs’.
When a hedging instrument expires, or is sold or terminated, or when a hedge no longer meets the criteria for hedge accounting,
any cumulative deferred gain or loss and deferred costs of hedging in equity at that time remains in equity until the forecast
transaction occurs, resulting in the recognition of a non-fi nancial asset such as inventory. When the forecast transaction is no
longer expected to occur, the cumulative gain or loss and deferred costs of hedging that were reported in equity are immediately
reclassifi ed to profi t or loss.
(ii) Net investment hedges
Hedges of net investments in foreign operations are accounted for similarly to cash fl ow hedges.
Any gain or loss on the hedging instrument relating to the effective portion of the hedge is recognised in other comprehensive
income and accumulated in reserves in equity. The gain or loss relating to the ineffective portion is recognised immediately in profi t
or loss within other income or other expenses.
Gains and losses accumulated in equity are reclassifi ed to profi t or loss when the foreign operation is partially disposed of or sold.
(c) Foreign currency translation
(i) Functional and presentation currency
Items included in the fi nancial statements of each of the Company’s entities are measured using the currency of the primary
economic environment in which the entity operates (‘the functional currency’). The fi nancial statements are presented in Australian
dollars, which is JB Hi-Fi Limited’s functional and presentation currency.
(ii) Transactions and balances
Foreign currency transactions are translated into the functional currency using the exchange rates prevailing at the dates of the
transactions. Foreign exchange gains and losses resulting from the settlement of such transactions and from the translation at year
end exchange rates of monetary assets and liabilities denominated in foreign currencies are recognised in profi t or loss, except
when they are deferred in equity as qualifying cash fl ow hedges and qualifying net investment hedges, or are attributable to part of
the net investment in a foreign operation.
(iii) Group companies
The results and fi nancial position of foreign operations (none of which has the currency of a hyperinfl ationary economy) that have a
functional currency different from the presentation currency are translated into the presentation currency as follows:
• assets and liabilities presented are translated at the closing rate at the date of that balance sheet;
• income and expenses are translated at average exchange rates (unless this is not a reasonable approximation of the
cumulative effect of the rates prevailing on the transaction dates, in which case income and expenses are translated at the
dates of the transactions); and
• all resulting exchange differences are recognised in other comprehensive income.
For
per
sona
l use
onl
y

99
29 SUMMARY OF OTHER SIGNIFICANT ACCOUNTING POLICIES (continued)
(c) Foreign currency translation (continued)
(iii) Group companies (continued)
On consolidation, exchange differences arising from the translation of any net investment in foreign entities, and of borrowings and
other fi nancial instruments designated as hedges of such investments, are recognised in other comprehensive income. When a
foreign operation is sold or any borrowings forming part of the net investment are repaid, the associated exchange differences are
reclassifi ed to profi t or loss, as part of the gain or loss on sale.
Goodwill and fair value adjustments arising on the acquisition of a foreign operation are treated as assets and liabilities of the foreign
operation and translated at the closing rate.
(d) Goods and Services Tax (GST)
Revenues, expenses and assets are recognised net of the amount of associated GST, unless the GST incurred is not recoverable
from the taxation authority. In this case it is recognised as part of the cost of acquisition of the asset or as part of the expense.
Receivables and payables are stated inclusive of the amount of GST receivable or payable. The net amount of GST recoverable
from, or payable to, the taxation authority is included with other receivables or payables in the balance sheet.
Cash fl ows are presented on a gross basis. The GST components of cash fl ows arising from investing or fi nancing activities which
are recoverable from, or payable, to the taxation authority, are presented as operating cash fl ows.
(e) New accounting standards and interpretations
In the current year, the Group has adopted all of the following new and revised Standards and Interpretations issued by the
Australian Accounting Standards Board (the AASB) that are relevant to its operations and effective for the current annual
reporting period:
(i) AASB 9 Financial Instruments and related amending Standards
The Group has adopted AASB 9 Financial Instruments from 1 July 2018 which replaces AASB 139 Financial Instruments:
Recognition and Measurement. AASB 9 introduces new requirements for the classifi cation and measurement of fi nancial assets
and fi nancial liabilities, a new model for calculating the provision for doubtful debts (now termed the credit loss allowance), and new
hedge accounting requirements.
Credit losses on trade receivables
The Group has elected to apply the simplifi ed approach to measuring expected credit losses, using the lifetime expected loss
allowance for all trade receivables. To measure the expected credit losses, trade receivables have been grouped based on shared
credit risk characteristics and the days past due. A provision matrix is then determined based on the historic credit loss rate for each
group, adjusted for any material expected changes to the future credit risk for that group. The difference between the credit loss
allowances calculated under AASB 9 compared to the incurred loss calculated under AASB 139 is not material to the Group.
Hedge accounting
In accordance with the transition provisions of AASB 9 for hedge accounting, the Group has applied the AASB 9 hedge accounting
requirements prospectively from the date of initial application on 1 July 2018. There has been no change in the Groups transactions
that are subject to hedge accounting from the adoption of AASB 9, being the interest rate swaps, caps and forward foreign currency
exchange contracts. Accordingly, there has been no impact on the hedging reserve from the adoption of AASB 9.
(ii) AASB 15 Revenue from Contracts with Customers and related amending Standards
The Group has adopted AASB 15 Revenue from Contracts with Customers from 1 July 2018, which replaces AASB 118 Revenue,
using the modifi ed retrospective approach.
AASB 15 establishes a principles-based approach for revenue recognition whereby revenue is recognised when performance
obligations are satisfi ed and the control of goods or services is transferred. The standard applies a fi ve-step approach to the timing
of revenue recognition and is applicable to all contracts with customers, except those in the scope of other standards, replacing the
separate models for goods, services and construction contracts under the previous accounting standards.
For
per
sona
l use
onl
y

100
NOTES TO THE FINANCIAL STATEMENTS (continued)
for the fi nancial year ended 30 June 2019
29 SUMMARY OF OTHER SIGNIFICANT ACCOUNTING POLICIES (continued)
(e) New accounting standards and interpretations (continued)
The major sources of the Group’s revenue are from the sale of goods, commissions and rendering of services, which are each
considered below.
Sale of goods
The adoption of AASB 15 has not impacted the timing of revenue recognition on the sale of goods, which continues to be
recognised on a point in time basis.
In previous reporting periods, revenue from the sale of goods was recognised when the customer accepted the risks and rewards
of ownership, which occurred at the point in sale or when the goods were collected/delivered. In applying AASB 15, revenue
associated with the sale of goods is recognised when the performance obligation of the sale has been fulfi lled and control of the
goods has transferred to the customer, which continues to occur at the point of sale when the goods are collected/delivered.
Gift cards and store credits are considered a prepayment for goods and services to be delivered in the future. The Group has an
obligation to transfer the goods or services in the future - creating a performance obligation. The Group recognises deferred revenue for
the amount of the prepayment and recognises revenue when the customer redeems the gift card or store credit and the Group fulfi ls
the performance obligation related to the transaction or likelihood of the gift card being redeemed by the customer is deemed remote.
In recognising revenue from the sale of goods, the Group considers its historical experience with sales returns to determine if its
‘highly probable’ that a signifi cant reversal of revenue will arise in the future.
Commissions
The Group acts as an agent in the sale of various products and services to customers such as telecommunication contracts.
Under AASB 15, commissions associated with agency sales are recognised on a point in time basis when all performance
obligations have been completed to entitle the Group to the commission.
There has been no change in the point of revenue recognition for commissions arising from the adoption of AASB 15.
Rendering of services
The Group generates revenue from the provision of various services including installation, customer delivery, IT services and
extended care and customer support services.
Under AASB 15, revenue relating to installation, customer delivery and IT services is principally recognised on a point in time basis,
which occurs upon completion of the service given the short time period over which the services are provided.
Revenue relating to extended care and customer support services is recognised over the period of cover where the Group retains
the responsibility for the performance obligations associated with the services and at point of sale when a third party assumes
responsibility for the performance obligations associated with the services. Amounts collected for services not yet provided are
recorded as deferred revenue in the balance sheet.
The adoption of AASB 15 has not impacted the timing revenue recognition for services revenue.
Timing of revenue recognition
As described above, the Group’s revenue is principally generated on a ‘point in time’ basis, the amount of revenue recognised by
the Group on an ‘over-time’ basis is not material in the context of the Group’s total revenue.
(iii) AASB 2016-5 Amendments to Australian Accounting Standards - Classifi cation and Measurement of Share-based Payment
Transactions
The adoption of this amending Standard did not have any impact on the disclosures or the amounts recognised in the Group’s
condensed consolidated fi nancial statements.
At the date of authorisation of the fi nancial report, the following relevant Standards and Interpretations were issued but not yet effective.
For
per
sona
l use
onl
y

101
29 SUMMARY OF OTHER SIGNIFICANT ACCOUNTING POLICIES (continued)
(e) New accounting standards and interpretations (continued)
The effects of the following Standards that are issued but not yet effective are still being determined:
(i) AASB 16 Leases (effective 1 January 2019)
AASB 16 Leases is effective for the Group from 1 July 2019 and will have a signifi cant impact on the Group’s consolidated fi nancial
statements for the year ended 30 June 2020. The Group has identifi ed all arrangements that will be subject to the new standard,
which are predominately the leases for the Group’s retail stores along with warehouses and support offi ces.
The Group has elected to transition to the new standard using the modifi ed retrospective approach, therefore the cumulative
effect of adopting AASB 16 will be recognised as an adjustment to the opening balance of retained earnings at 1 July 2019,
with no restatement of comparative information. The Group expects to be able to provide supplementary information in investor
presentations during the transition period to bridge the fi nancial statements between the new and old standard.
When applying the modifi ed retrospective approach, the Group has elected to apply a number of practical expedients including:
• the use of hindsight in determining the lease term where the contract contains options to extend the lease; and
• non-lease components will not be separated out from lease components of a lease.
The treatment of lease options available to the Group will be assessed on a lease by lease basis and will be added to the lease term
as appropriate, taking into consideration the current and future performance of the specifi c location and any planned relocations.
The Group has substantially completed its implementation assessment of the new standard, however certain technical and
judgemental aspects of the revised accounting policy remain open, including the determination of lease terms for leases with
options and leases in holdover, which could have a material impact on the outcomes under the new standard. An indicative range
of the fi nancial impacts from adoption of the new standard is set out below allowing for these uncertainties. The actual fi nancial
impact on the results for the 30 June 2020 fi nancial year will also be contingent on any new leases that are entered into during the
fi nancial year.
Estimated impact
$m
Estimated impact on the Balance sheet at 1 July 2019
Recognition of right of use asset $675.0 - $775.0
Recognition of lease liability ($775.0) - ($875.0)
De-recognition of lease accrual/incentive $41.0
Increase in deferred tax asset $17.7 - $20.7
Reduction in net assets ($38.3) - ($41.3)
Estimated impact on Profi t & Loss for year ending 30 June 2020
Increase in EBITDA $150.0 - $175.0
Increase in EBIT $16.0 - $18.0
Reduction in net profi t before tax ($7.0) - ($9.0)
Reduction in net profi t after tax ($4.9) - ($6.3)
Estimated impact on Cash Flows for the year ending 30 June 2020
Increase in operating cash fl ows $135.0 - $185.0
Decrease in fi nancing cash fl ows ($135.0) - ($185.0)
Net cash fl ows $0.0
The effects of the followings Standards and Interpretations are not expected to be material:
(i) AASB 2018-1 Amendments to Australian Accounting Standards - Annual Improvements 2015 - 2017 Cycle
(effective 1 January 2019)
(ii) AASB 2018-2 Amendments to Australian Accounting Standards - Plan Amendment, Curtailment or Settlement
(effective 1 January 2019)
(iii) Interpretation 23 Uncertainty over Income Tax Treatments (effective 1 January 2019)
For
per
sona
l use
onl
y

102
NOTES TO THE FINANCIAL STATEMENTS (continued)
for the fi nancial year ended 30 June 2019
30 EVENTS OCCURRING AFTER THE REPORTING PERIOD
There have been no matters or circumstances occurring subsequent to the end of the fi nancial year end, that have signifi cantly
affected, or may signifi cantly affect, the operations of the Group, the results of those operations or the state of affairs of the Group or
economic entity in future fi nancial years.
For
per
sona
l use
onl
y

103
The shareholder information set out below was applicable as at 5 August 2019.
A. Distribution of equity securities
Analysis of numbers of equity security holders by size of holding:
Ordinary shares
Holding Total Holders Units % Issued Capital
1 - 1,000 16,085 5,449,413 4.74
1,001 - 5,000 4,016 8,128,442 7.08
5,001 - 10,000 306 2,103,149 1.83
10,001 - 100,000 156 3,870,937 3.37
100,001 and over 21 95,331,431 82.98
20,584 114,883,372 100.00
There were 272 holders of less than a marketable parcel of ordinary shares.
B. Equity security holders
Twenty largest quoted equity security holders
The names of the twenty largest holders of quoted equity securities are listed below:
Ordinary shares
Name Number held
% of issued
shares
1. J P MORGAN NOMINEES AUSTRALIA PTY LIMITED 28,792,775 25.06
2. HSBC CUSTODY NOMINEES (AUSTRALIA) LIMITED 28,100,358 24.46
3. CITICORP NOMINEES PTY LIMITED 15,522,642 13.51
4. BNP PARIBAS NOMINEES PTY LTD <AGENCY LENDING DRP A/C> 7,653,711 6.66
5. NATIONAL NOMINEES LIMITED 6,621,147 5.76
6. HSBC CUSTODY NOMINEES (AUSTRALIA) LIMITED <NT-COMNWLTH SUPER CORP A/C> 2,261,306 1.97
7. BNP PARIBAS NOMS PTY LTD <DRP> 2,099,128 1.83
8. CITICORP NOMINEES PTY LIMITED <COLONIAL FIRST STATE INV A/C> 963,822 0.84
9. NATIONAL NOMINEES LIMITED <N A/C> 775,000 0.67
10. HSBC CUSTODY NOMINEES (AUSTRALIA) LIMITED - A/C 2 456,482 0.40
11. AMP LIFE LIMITED 376,217 0.33
12. HSBC CUSTODY NOMINEES (AUSTRALIA) LIMITED-GSCO ECA 371,072 0.32
13. 3RD WAVE INVESTORS LTD 300,000 0.26
14. SCCASP HOLDINGS PTY LTD <H & R SUPER FUND A/C> 175,400 0.15
15. CS THIRD NOMINEES PTY LIMITED <HSBC CUST NOM AU LTD 13 A/C> 173,654 0.15
16. POWERWRAP LIMITED <SCHEME - IML TRADES A/C> 163,740 0.14
17. NETWEALTH INVESTMENTS LIMITED <WRAP SERVICES A/C> 153,247 0.13
18. FULLFIELD PTY LTD <D L RODD FAMILY A/C> 150,000 0.13
19. ASTRASET PTY LTD <ALBENISA SUPER FUND A/C> 113,211 0.10
20. BNP PARIBAS NOMINEES PTY LTD HUB24 CUSTODIAL SERV LTD DRP 108,519 0.09
95,331,431 82.96
ADDITIONAL SECURITIES EXCHANGE INFORMATION
For
per
sona
l use
onl
y

104
C. Substantial holders
Substantial holders in the Company are set out below:
Ordinary sharesNumber
held
Voting Power
%
AustralianSuper Pty Ltd 11,515,044 10.02
Legg Mason Asset Management Australia Limited 10,682,309 9.30
Ausbil Investment Management Limited 5,881,121 5.12
The Vanguard Group 5,804,822 5.05
Mitsubishi UFJ Financial Group Inc. 5,751,639 5.01
Number
on issue
Number
of holders
D. Unquoted equity securities
Employee share options issued under the Company’s share option plans 1,237,837 149
ADDITIONAL SECURITIES EXCHANGE INFORMATION (continued)
For
per
sona
l use
onl
y

COMPANY SECRETARY
Doug Smith
PRINCIPAL REGISTERED OFFICE IN AUSTRALIA
Podium Level
60 City Road, Southbank VIC 3006
Phone: +61 3 8530 7333
SHARE REGISTRY
Computershare Investor Services Pty Limited
Yarra Falls, 452 Johnston Street, Abbotsford, Victoria, 3067, Australia
Phone: 1300 302 417 (Australia)
Phone: +61 3 9415 4136
CORPORATE INFORMATIONABN 80 093 220 136
For
per
sona
l use
onl
y

jbhifi .com.au
For
per
sona
l use
onl
y