Embed Size (px)
Citation preview
Consulting Technology
Oakton Limited ABN 50 007 028 711
Melbourne Head office Level 8 271 Collins Street Melbourne VIC 3000 Australia t +61 3 9617 0200 f +61 3 9621 1951
Sydney Level 3 65 Berry Street North Sydney NSW 2060 Australia t +61 2 9923 9800 f +61 2 9929 6731
Canberra Unit 2 45 Wentworth Avenue Kingston ACT 2604 Australia t +61 2 6230 1997 f +61 2 6230 1919
Brisbane Level 5 200 Mary Street Brisbane QLD 4000 Australia t +61 7 3136 2900 f +61 7 3136 2999
Hyderabad Krishe-e 8-2-293 Plot 499 Road 36 Jubilee Hills 500033 Hyderabad India t +91 40 23552694 VoIP: +61 3 9617 0294
www.oakton.com.au
23 August 2013
The Manager
Company Announcements Office
Australian Stock Exchange Limited
(online lodgement)
Dear Sir
RE: Annual Report & Statutory Accounts for the year ended 30 June 2013
Please find attached the 2013 Annual Report which will be distributed to shareholders on 30 August 2013.
The report is currently available electronically from the Oakton Limited website,
http://www.oakton.com.au/investors/financial-reports
Yours faithfully
Michael Miers
Company Secretary
For
per
sona
l use
onl
y
Consulting Technology
Annual Report 2013
how weThis is
think
For
per
sona
l use
onl
y
Oakton Consulting Technology
Oakton Annual Report 2013
We’re an Australian consulting and technology firm founded in 1988. Our business is collaborating with customers to create tangible value, bringing together business insight and technology solutions to give them a distinct advantage in today’s rapidly changing world. How you think about a problem is more important than the problem itself.OAKTON LIMITED ABN 50 007 028 711
2013 Highlights 1
About Us 2
The Journey 4
Showcase Solution: Toll Group 6
Showcase Solution: ING DIRECT 7
Chairman and Managing Directors Report 8
Location Update 10
Directors 12
Our Leadership Group 14
Corporate Governance Statement 2013 16
Directors’ Report 21
Auditor’s Independence Declaration 39
Financial Statements 40
Directors’ Declaration 64
Independent Auditor’s Report 65
Shareholding Information 66
For
per
sona
l use
onl
y
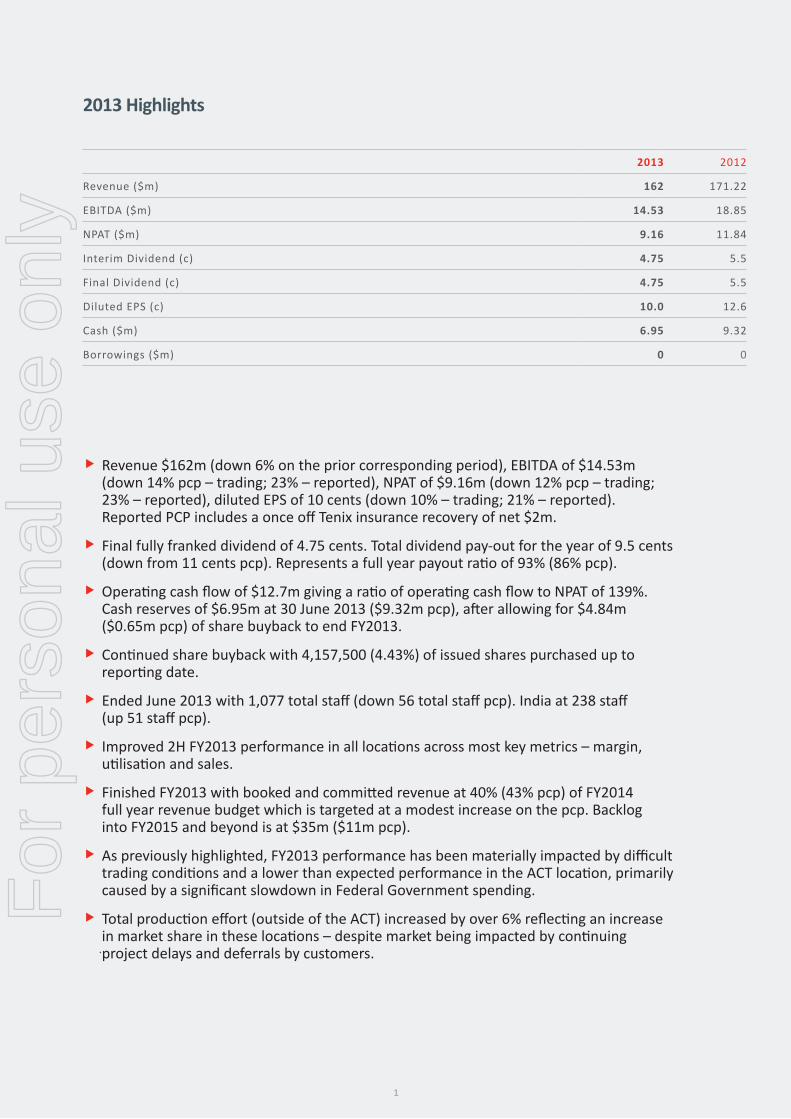
� Revenue $162m (down 6% on the prior corresponding period), EBITDA of $14.53m (down 14% pcp – trading; 23% – reported), NPAT of $9.16m (down 12% pcp – trading; 23% – reported), diluted EPS of 10 cents (down 10% – trading; 21% – reported). Reported PCP includes a once off Tenix insurance recovery of net $2m.
� Final fully franked dividend of 4.75 cents. Total dividend pay-out for the year of 9.5 cents (down from 11 cents pcp). Represents a full year payout ratio of 93% (86% pcp).
� Operating cash flow of $12.7m giving a ratio of operating cash flow to NPAT of 139%. Cash reserves of $6.95m at 30 June 2013 ($9.32m pcp), after allowing for $4.84m ($0.65m pcp) of share buyback to end FY2013.
� Continued share buyback with 4,157,500 (4.43%) of issued shares purchased up to reporting date.
� Ended June 2013 with 1,077 total staff (down 56 total staff pcp). India at 238 staff (up 51 staff pcp).
� Improved 2H FY2013 performance in all locations across most key metrics – margin, utilisation and sales.
� Finished FY2013 with booked and committed revenue at 40% (43% pcp) of FY2014 full year revenue budget which is targeted at a modest increase on the pcp. Backlog into FY2015 and beyond is at $35m ($11m pcp).
� As previously highlighted, FY2013 performance has been materially impacted by difficult trading conditions and a lower than expected performance in the ACT location, primarily caused by a significant slowdown in Federal Government spending.
� Total production effort (outside of the ACT) increased by over 6% reflecting an increase in market share in these locations – despite market being impacted by continuing project delays and deferrals by customers.
2013 Highlights
2013 2012
Revenue ($m) 162 171.22
EBITDA ($m) 14.53 18.85
NPAT ($m) 9.16 11.84
Interim Dividend (c) 4.75 5.5
Final Dividend (c) 4.75 5.5
Diluted EPS (c) 10.0 12.6
Cash ($m) 6.95 9.32
Borrowings ($m) 0 0
1
For
per
sona
l use
onl
y
Oakton Consulting Technology
Oakton has been listed on the Australian Stock Exchange since June 2000 and celebrates 25 years of business in 2013. In the last 13 years there have been seven acquisitions and significant organic growth which now sees the company operating in Victoria, NSW, ACT, QLD, WA and Hyderabad (India). Oakton provides consulting and technology services to Federal and State government departments and agencies and leading Australian and international organisations operating within the Australian market, many of which are part of the ASX300 group.
About Us
We takecomplexity
‘We continue our transformation to become the leading Australian Services Integration company, and we are leading this thinking and execution to market. The investments we have made in our offshore business, our solution development and our service integration partnerships are now aligning very well with our customers’ requirements which continue to change to drive faster, cheaper and more capable IT service delivery. Adapting to a new world is about ensuring our transformation is evolutionary and in step with our customers’ changing business requirements.Neil Wilson, Managing Director and Chief Executive Officer.
We have a specialised focus combining Industry, Domain and Technology expertise which quickly enables us to develop Solutions that meet the specific requirements of our customers. Increasingly these solutions are being delivered to our customers as a combination of our intellectual property and partnerships with cloud based infrastructure and software providers. In many situations this allows the reuse of knowledge and assets that reduce the risk, time-frame and investment required to deliver a successful outcome for our customers.
We see this new world of service integration and solution delivery as fundamental to Oakton’s future direction and one we have been positioning for over the last few years.
Inside Oakton there are over 1,000 consultants and technologists employed, professionals with deep expertise, intimate knowledge and specialist skills. How we draw on these experienced-based capabilities amassed over many years in a specialised Industry, Domain and Technology combination is the very foundation of how we create differentiating value for our customers. We are now beginning to see the flow of new revenue streams that are not reliant on people but the fees associated with the provision of infrastructure and software as a service as part of our solutions. This model enables us to grow our revenue without necessarily increasing head count, a model which will enable greater scale and more year on year annuity business.
What is IDT (Industry, Domain and Technology)? IDT is a framework for managing our service catalogue, our skills and experience and our intellectual property that enables repeatability of solutions for our customers. An example of an IDT combination solution is Government (Industry) Enterprise Content Management collaboration solution (Domain – the business activity) and Microsoft SharePoint technology (Technology). This combination is repeatable across multiple Industries. As a result each time it is repeated it becomes enriched, enabling acceleration of the time to deliver and reduction of the risk to deliver.
Oakton is focused on finding the IDT combinations most sought after in the market and establishing a clear brand differentiation for the provision of services in these specialised areas.
2
Oakton Consulting Technology
For
per
sona
l use
onl
y
TECHNOLOgyEnablement
INDUSTry Coverage
and give you clarity
DOMAIN Services
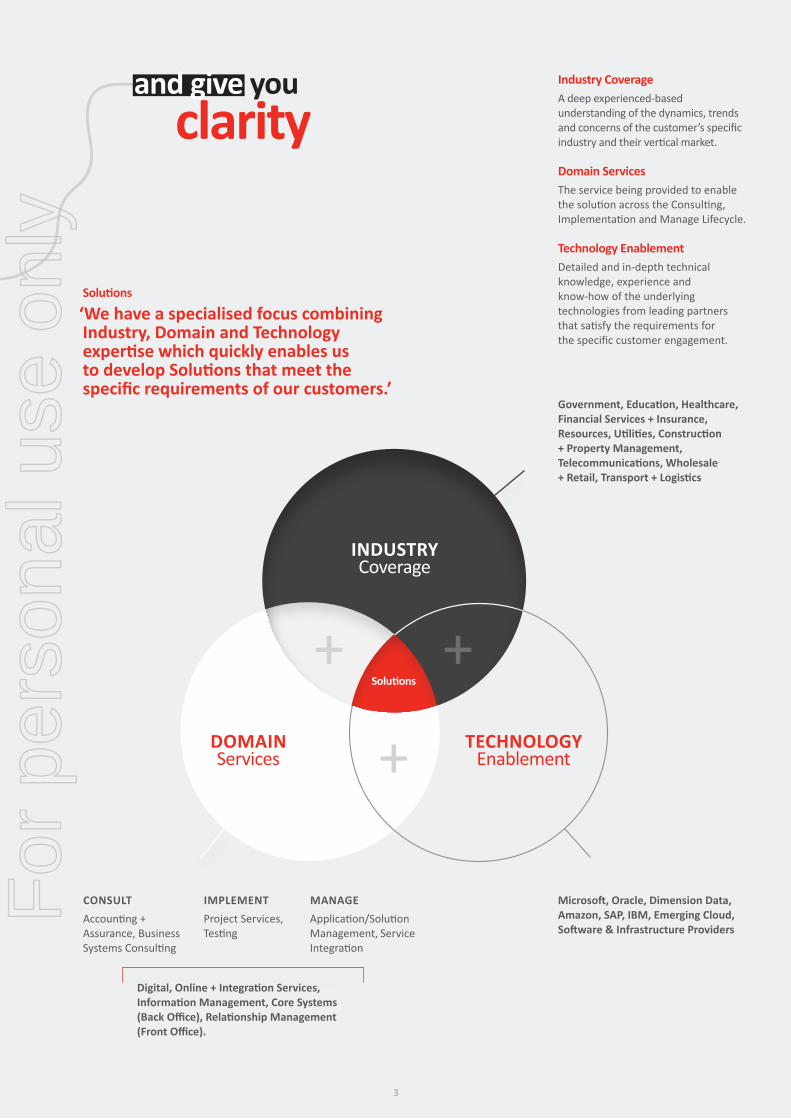
Industry CoverageA deep experienced-based understanding of the dynamics, trends and concerns of the customer’s specific industry and their vertical market.
Domain ServicesThe service being provided to enable the solution across the Consulting, Implementation and Manage Lifecycle.
Technology EnablementDetailed and in-depth technical knowledge, experience and know-how of the underlying technologies from leading partners that satisfy the requirements for the specific customer engagement.
government, Education, Healthcare, Financial Services + Insurance, resources, Utilities, Construction + Property Management, Telecommunications, Wholesale + retail, Transport + Logistics
Digital, Online + Integration Services, Information Management, Core Systems (Back Office), relationship Management (Front Office).
CONSULTAccounting + Assurance, Business Systems Consulting
IMPLEMENTProject Services, Testing
MANAgEApplication/Solution Management, Service Integration
Microsoft, Oracle, Dimension Data, Amazon, SAP, IBM, Emerging Cloud, Software & Infrastructure Providers
Solutions
‘We have a specialised focus combining Industry, Domain and Technology expertise which quickly enables us to develop Solutions that meet the specific requirements of our customers.’
+ +
+Solutions
3
For
per
sona
l use
onl
y
Oakton Consulting Technology
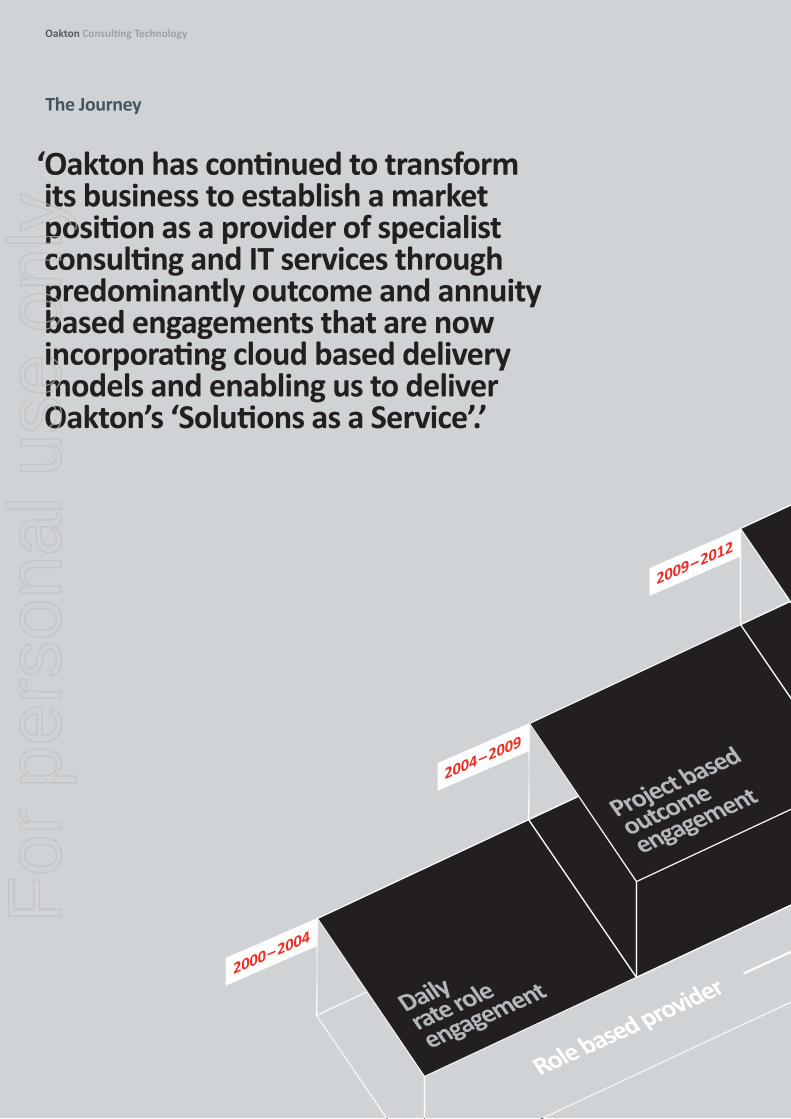
‘Oakton has continued to transform its business to establish a market position as a provider of specialist consulting and IT services through predominantly outcome and annuity based engagements that are now incorporating cloud based delivery models and enabling us to deliver Oakton’s ‘Solutions as a Service’.’
Oakton Consulting Technology
The Journey
Oakton Consulting Technology
‘Oakton has continued to transform its business to establish a market position as a provider of specialist consulting and IT services through predominantly outcome and annuity based engagements that are now incorporating cloud based delivery models and enabling us to deliver Oakton’s ‘Solutions as a Service’.’
2000–2004
2004–2009
2009–2012
2013–2014
2014 "
Daily rate role
engagement
Project based
outcome
engagement
Role based provider
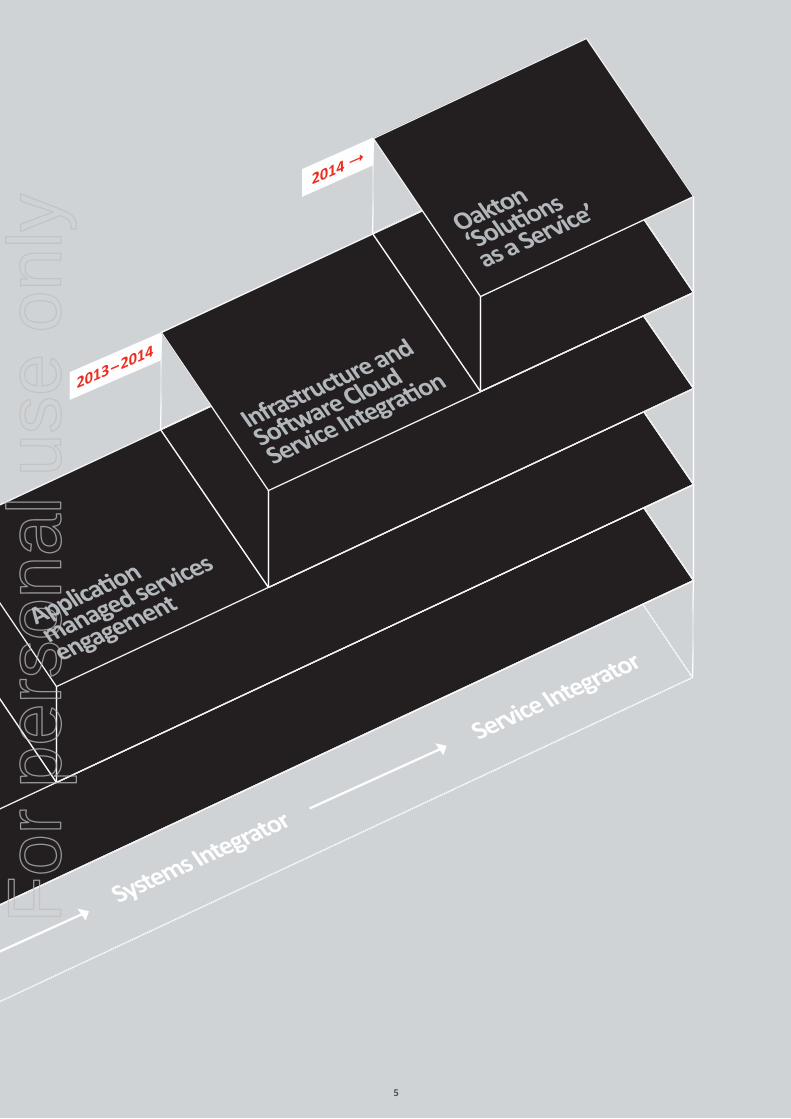
Systems Integrator
Service Integrator
Application
managed services
engagement
Infrastructure and
Software Cloud
Service Integration
Oakton
‘Solutions
as a Service’
}
}
Oakton Consulting Technology
The Journey
Oakton Consulting Technology
‘Oakton has continued to transform its business to establish a market position as a provider of specialist consulting and IT services through predominantly outcome and annuity based engagements that are now incorporating cloud based delivery models and enabling us to deliver Oakton’s ‘Solutions as a Service’.’
2000–2004
2004–2009
2009–2012
2013–2014
2014 "
Daily rate role
engagement
Project based
outcome
engagement
Role based provider
Systems Integrator
Service Integrator
Application
managed services
engagement
Infrastructure and
Software Cloud
Service Integration
Oakton
‘Solutions
as a Service’
}
}
Oakton Consulting Technology
The Journey
For
per
sona
l use
onl
y
Oakton Consulting Technology
‘Oakton has continued to transform its business to establish a market position as a provider of specialist consulting and IT services through predominantly outcome and annuity based engagements that are now incorporating cloud based delivery models and enabling us to deliver Oakton’s ‘Solutions as a Service’.’
2000–2004
2004–2009
2009–2012
2013–2014
2014 "
Daily rate role
engagement
Project based
outcome
engagement
Role based provider
Systems Integrator
Service Integrator
Application
managed services
engagement
Infrastructure and
Software Cloud
Service Integration
Oakton
‘Solutions
as a Service’
}
}
Oakton Consulting Technology
The Journey
Oakton Consulting Technology
‘Oakton has continued to transform its business to establish a market position as a provider of specialist consulting and IT services through predominantly outcome and annuity based engagements that are now incorporating cloud based delivery models and enabling us to deliver Oakton’s ‘Solutions as a Service’.’
2000–2004
2004–2009
2009–2012
2013–2014
2014 "
Daily rate role
engagement
Project based
outcome
engagement
Role based provider
Systems Integrator
Service Integrator
Application
managed services
engagement
Infrastructure and
Software Cloud
Service Integration
Oakton
‘Solutions
as a Service’
}
}
Oakton Consulting Technology
The Journey
5
For
per
sona
l use
onl
y
Oakton Consulting Technology
Showcase Solution: Toll group
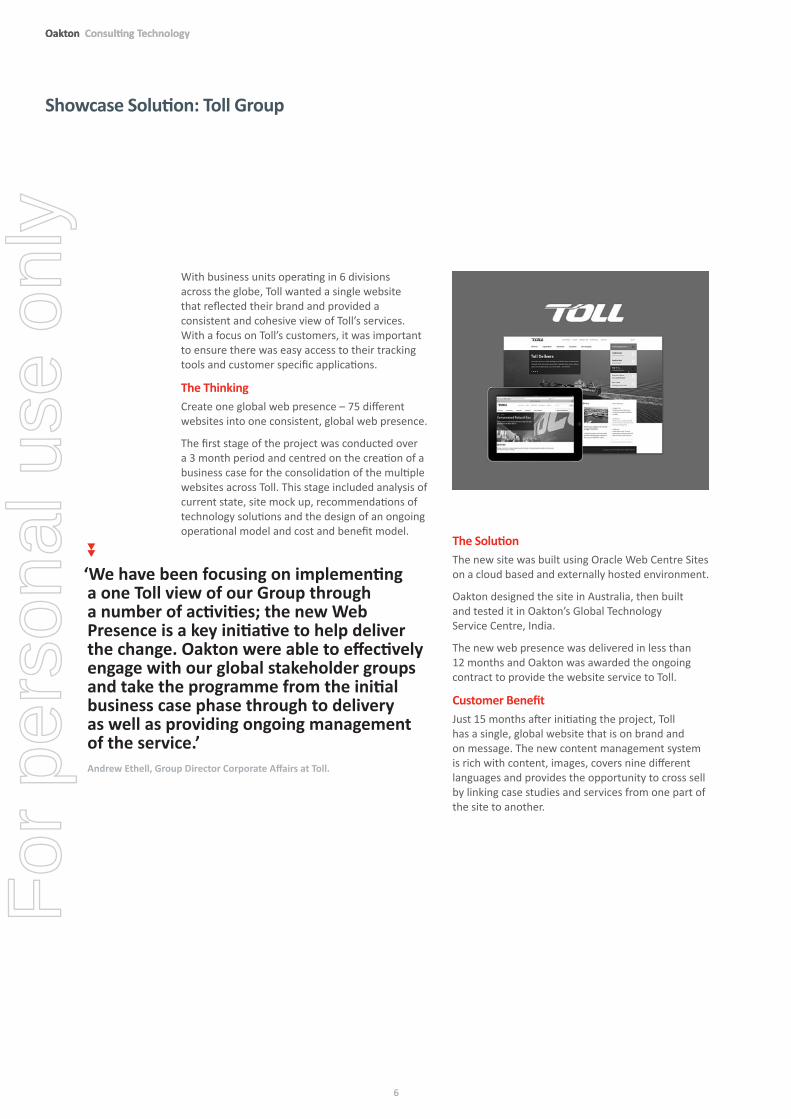
With business units operating in 6 divisions across the globe, Toll wanted a single website that reflected their brand and provided a consistent and cohesive view of Toll’s services. With a focus on Toll’s customers, it was important to ensure there was easy access to their tracking tools and customer specific applications.
The ThinkingCreate one global web presence – 75 different websites into one consistent, global web presence.
The first stage of the project was conducted over a 3 month period and centred on the creation of a business case for the consolidation of the multiple websites across Toll. This stage included analysis of current state, site mock up, recommendations of technology solutions and the design of an ongoing operational model and cost and benefit model.
‘We have been focusing on implementing a one Toll view of our group through a number of activities; the new Web Presence is a key initiative to help deliver the change. Oakton were able to effectively engage with our global stakeholder groups and take the programme from the initial business case phase through to delivery as well as providing ongoing management of the service.’Andrew Ethell, group Director Corporate Affairs at Toll.
The SolutionThe new site was built using Oracle Web Centre Sites on a cloud based and externally hosted environment.
Oakton designed the site in Australia, then built and tested it in Oakton’s Global Technology Service Centre, India.
The new web presence was delivered in less than 12 months and Oakton was awarded the ongoing contract to provide the website service to Toll.
Customer BenefitJust 15 months after initiating the project, Toll has a single, global website that is on brand and on message. The new content management system is rich with content, images, covers nine different languages and provides the opportunity to cross sell by linking case studies and services from one part of the site to another.
6
Oakton Consulting Technology
For
per
sona
l use
onl
y
Showcase Solution: INg DIrECT
ING DIRECT was faced with the challenge of delivering a market leading mobile banking experience in a secure and responsive way, whilst ensuring its customers have visibility and control over their personal finances.
The ThinkingPartnering with ING DIRECT’s Digital team, Oakton worked with ING DIRECT on architecting a services layered solution to deliver a more robust and responsive mobile banking solution to align to ING DIRECT’s performance requirements.
The SolutionThe ING DIRECT app allows customers to view their account balance across all their products before logging in and to transfer money to anyone in Australia with email or SMS notification.
The uniqueness of the solution implemented by Oakton is in the security and authentication model that was developed. Oakton chose a cutting edge approach using Microsoft Windows Identity Framework for authentication with claims based architecture allowing for the establishment of trust for other services.
The new architecture not only increases performance but also delivers cost effectiveness for ongoing maintenance through the use of a centralised authentication model.
All ING Direct objectives were achieved by Oakton’s ‘Solutions as a Service’ model, a model which allows Oakton to deliver an improved customer experience at a reduced cost aligned to business and consumer needs.
With Oakton’s extensive expertise in security, the new ING DIRECT solution represents a new way of thinking about architectures.
Customer BenefitING DIRECT customers now have an easy and intuitive mobile banking app that provides them with visibility and control over their personal finances.
‘The consistent trend in web visits has been around 15% up year on year, but the increase in mobile interactions is significant and proof of the ever-growing consumer demand and comfort to be able to ‘do’ while on the go.’Executive Director Distribution at INg DIrECT, Lisa Claes.
‘We were particular about choosing the features that mattered most to customers and designing them in a very easy, intuitive way.’ Lisa Claes, Executive Director Distribution at INg DIrECT.
7
For
per
sona
l use
onl
y
Oakton Consulting Technology
To our fellow ownersIt has been another year of increasing change in our industry. This year we have seen our customers continue to drive a digital agenda as they seek out the returns from online channels and insights from increasing volumes of internal and external data, much of which is now being created by social media platforms such as Facebook and Twitter. Customers no longer wait months for feedback on products and services; they know in days and sometimes in hours how consumers are reacting. The demand for agile, relevant and cost efficient solutions to enable these directions continues to increase and interestingly, the buyers are no longer just the IT departments of government and commercial organisations. As the consumerisation of IT continues its steady ramp, business people running marketing departments, finance departments and business operations expect the same ease of use and access to information within the workplace that they enjoy on their personal smartphone and tablets.
Our response to these directions has not been short term; we have been setting the foundation and transforming our company towards being a more specialised Service Integration provider that has an increasing relevance to our customers’ changing business models and demands for contemporary consulting and technology services. We refocused our business model; we repositioned our brand to focus on specialised integration and project-based service and solution outcomes, leveraging our global resourcing model; and we invested in people development programs, new business processes, systems and new partnerships, including cloud based infrastructure and software service providers, required to enable broader service capability. Throughout FY2013 we continued to invest in these operational changes that underpin our plans to deliver improved returns to our customers, employees and shareholders over the medium to long term.
We faced a number of market driven challenges in FY2013, particularly in our ACT operation where demand for services was significantly impacted by the Federal Government’s drive for a surplus and uncertainty created by the setting of the date for a Federal Election early in 2013. While the impact from the ACT location performance was material,
Chairman and Managing Directors report
we were still able to maintain the level of effort provided to customers at the same level as last year and without the ACT we showed 6% growth in effort provided which is a clear measure of market share improvement in very difficult trading conditions across all sectors. The amount of effort is an important performance measure as our transition to more work offshore to meet customer price expectations impacts revenue per head and for a period will impact total revenue and earnings. This year our offshore contribution doubled from 10% to 20% of total production effort and is forecast to be 30% in FY2014. We also saw new revenue streams coming from our cloud based infrastructure and software partnerships. We expect this revenue stream to increasingly offset the reduction in revenue per head resulting from the increased use of offshore resources. These investments we have made in our offshore business and our specialised solutions focus is clearly enabling us to be increasingly relevant with our customers and we are seeing more opportunities in areas that we have not previously engaged and where our proposition is more compelling than our local and global competitors.
We have once again seen a decrease in our financial results, however, we can reconcile much of this with the impact of the downturn in the Federal Government, market trading conditions generally and our continued transition to a blended on and offshore model. We have held the line on continued investment in the transformation of the business and we know that this is required to build the business required now and in the future.
A key highlight for FY2013 was the performance of our new WA office which opened in July 2012. We saw a number of new customer relationships established and we have progressively built awareness of our brand in the WA market. Pleasingly, the backlog of opportunities leading into FY2014 is also strong. The operations of our WA office is in line with our strategy where locally based employees assist the customers with their solution definition, project management and some local delivery with most of the engineering and support work completed offshore. We also won business where our cloud partners provided a non-person
We would like to extend our thanks to all the Oakton employees for their hard work, commitment, passion and contribution to our business. Paul Holyoake, Chairman.
8
Oakton Consulting Technology
For
per
sona
l use
onl
y
based revenue stream that enabled the location to look much bigger at the revenue line than the local employee count would suggest. This is now the model for our entire customer facing locations; no longer will the growth and market share of the specific location be based on the change in local employee numbers.
The business remains debt free holding a cash balance of nearly $7m at year end after spending over $4m on share buyback during FY2013. Accordingly, the company has been able to maintain a strong dividend payout ratio and has declared a fully franked final dividend of 4.75 cents per share, taking the full year dividend to 9.5 cents per share.
Our Industry, Domain and Technology model allows us to use our expertise, knowledge and processes as an integrated and specialised set of services and solutions that enable customer successes through lower risk engagement and increased return on their investment. Together with some of the leading software vendors such as Microsoft, Oracle, SAP, Salesforce and IBM we are delivering enterprise-based solutions utilising the full spectrum of Oakton’s consulting and technology expertise. We position ourselves as a partner with deep and intimate knowledge of a customers’ industry sector, coupled with the complementary ability to turn that knowledge into company-specific operational and management processes and systems supporting online capability, information management and core system enablement, and
based on an extensive understanding of leading edge technologies. We assist customers with the planning, the implementation and the ongoing management of their solutions in a similar way to the architect, the builder and the maintenance services within the building industry.
Our specialisation allows us to be clear about the outcomes expected and to apply proven techniques to deliver new capability for our customers within the timeframes and investment parameters that have been established.
We are very comfortable we have our strategy right in this area and are pleased we have made much of the investment required to reposition the business for the future.
Our customer base is diverse and spread across a range of government and commercial industry sectors and geographies – of note is our increased focus on the resources sector on the back of our successful entry into the WA market during FY2013. We are seeing good levels of demand in a number of sectors, in particular:
� Financial services; � Property and Construction; � Transport and Logistics; and � Resources.
We continue to support many of our customers to enable their digital presence via online channels and increased connection with social media platforms. We have illustrated two specific examples of a showcase solution – the Toll ‘Web Presence’ project and the ING Mobile Banking platform solution which are representative of the future style of contemporary solutions.
It is the mix of Oakton’s Industry, Domain and Technology skill sets and solutions that we have focussed on in order to increase opportunities to maximise value. We believe this is a key competitive advantage. Get it right and we grow customer satisfaction and customer references, lower risk, drive repeat business, obtain higher margins and improved profitability.
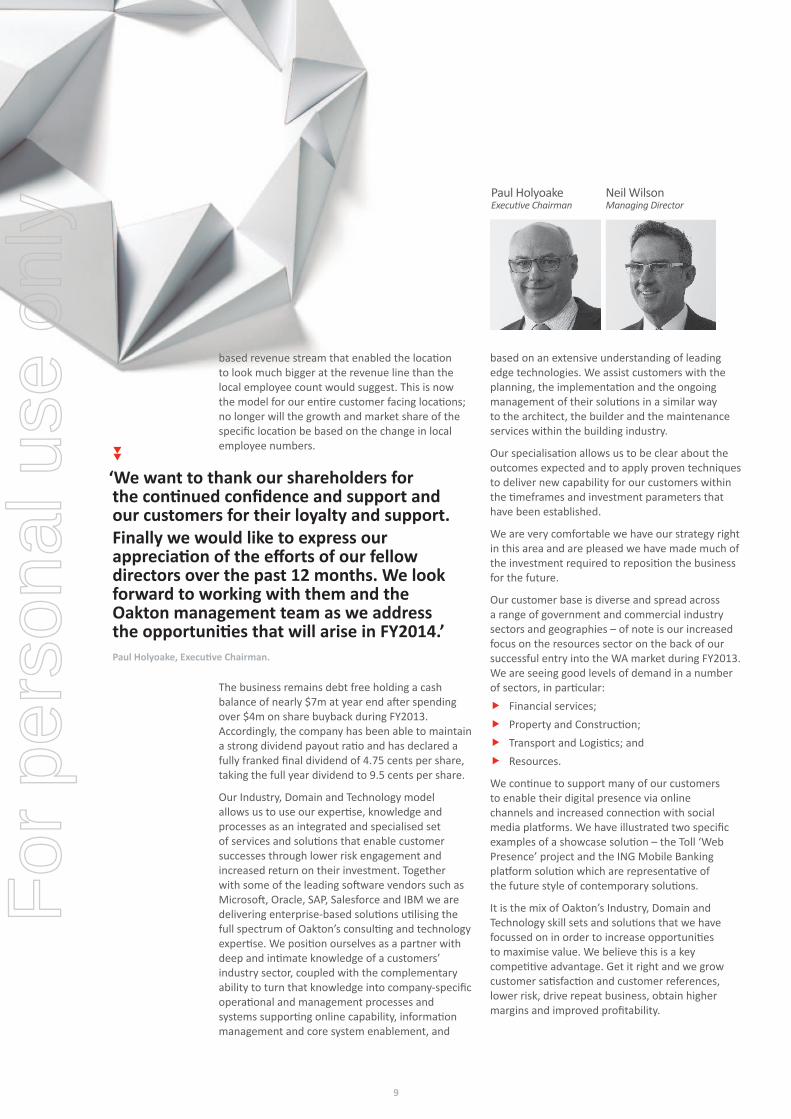
Paul HolyoakeExecutive Chairman
Neil WilsonManaging Director
‘We want to thank our shareholders for the continued confidence and support and our customers for their loyalty and support.Finally we would like to express our appreciation of the efforts of our fellow directors over the past 12 months. We look forward to working with them and the Oakton management team as we address the opportunities that will arise in Fy2014.’Paul Holyoake, Executive Chairman.
9
For
per
sona
l use
onl
y
Oakton Consulting Technology
VictoriaThe Victorian market was quite flat during FY2013 with our customers and prospects shifting their investment focus from traditional areas of spend to customer centric and cost focussed initiatives. The Victorian Government also had unusually low investment levels during FY2013.
A significant trend that has strongly emerged is our increased engagement with business side customers in addition to Technology customers, more than has historically been the case.
We have found that the Domains of digital, information and service integration were areas of increasing demand, offsetting some erosion in traditional service offers. Further, the nature of the engagements evolved to more of an outcome or service orientation.
We finished FY2013 with a very solid second half sales performance which has provided an improved backlog position for the start of FY2014. Through FY2013 we secured a number of key strategic long term assignments and also a large number of new customers – typically through leveraging existing I-D-T solutions to differentiate ourselves from our competitors.
Employee retention continued to improve during FY2013 and our business in Victoria has also taken the opportunity to up-skill within a somewhat softer labour market in some key domains and technologies that are areas of high current and emerging customer demand.
In summary, we expect the trends in investment focus identified above to continue in FY2014 and therefore plan to grow our market share in Victoria based on further tailoring and adapting our I-D-T solutions and services to the requirements of enterprise customers in the Victorian marketplace.
New South WalesMarket conditions have remained challenging with a number of delayed customer projects, cost management initiatives at customers and general market uncertainty. We have seen an ongoing trend of offshoring and customers transitioning their IT environments to cloud computing.
The approach we’ve taken is to drive for market share by continuing to build relationships with our existing customers and engage more with new customers. The NSW office is also moving location from North Sydney to the CBD which will bring better proximity to many of our key customers.
We started a transition this year in terms of a forward looking portfolio that has capability in digital solutions, customer relationship management, cloud services integration, core business systems and information management. We increased our level of production hours this year with a strong increase in offshoring and managed to win our way competitively into a number of new customers (over 30) as part of our expansion plans.
The transition of our business lines is seeing a shift in pipeline towards service integration and managed services which builds for a stronger future. The short term focus is to maintain the profitability of the existing business while positioning for the future.
ACTThe ACT office experienced very tight market conditions in FY2013, with demand for services across the Board down approximately 35% from the previous year due to restricted Government spending across all Departments and Authorities. This has impacted our ACT Operations and overall result significantly.
Nevertheless, we have continued the transformation of our business in the ACT to a Consulting and Services Integration business that is now well positioned to take advantage of increased activity in the ACT market by increasing our investment in new personnel, and leveraging solutions that have been delivered in other Australian locations that can be applied in the Federal Government market.
Whilst we expect the ACT market to be flat at best for at least the first half of FY2014, we believe the market will offer increased opportunity in the areas of digital solutions, cloud solutions as a service and information management, as well as our traditional consulting services in internal audit, financial management and business consulting.
Our last quarter of FY2013 showed an improvement over the previous 3 quarters in sales and utilisation and we have entered the new financial year with a slightly improved backlog position.
The ACT market still presents significant short term challenges for the company, but our strategy for increased acquisition of market share, and leveraging existing Solutions as a Service is in line with Federal Government emerging policies in these areas.
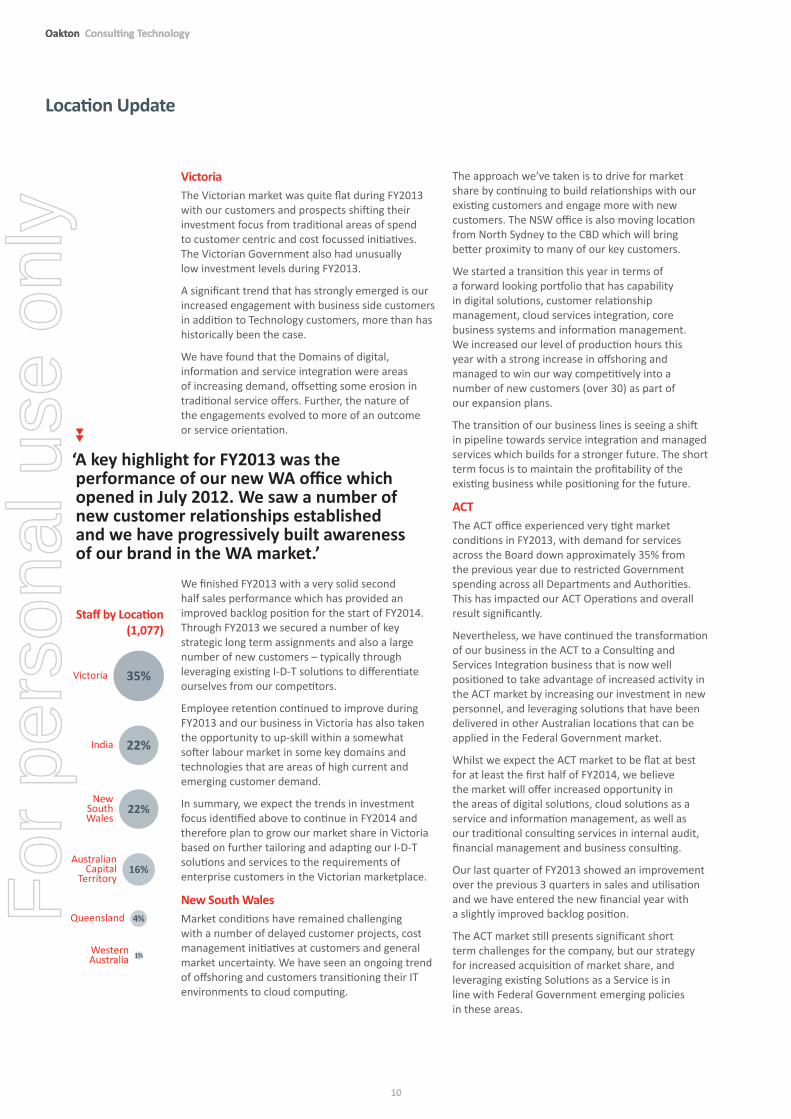
Location Update
AustralianCapital
Territory
Queensland
WesternAustralia
Victoria
NewSouthWales
India
16%
4%
35%
22%
22%
‘A key highlight for Fy2013 was the performance of our new WA office which opened in July 2012. We saw a number of new customer relationships established and we have progressively built awareness of our brand in the WA market.’
Staff by Location (1,077)
10
Oakton Consulting Technology
For
per
sona
l use
onl
y
All of these conditions present a great opportunity for Oakton to offer innovative thinking utilising our I-D-T model and leveraging our offshore assets as a differentiator in the market. We have now proven our capability to secure and implement a world class ‘support and operate’ model for a complex International mining organisation that forms the foundation of our location growth plans.
We have made significant investments in building our local capabilities and are well positioned to capitalise on changing market conditions.
India OperationsOur office in Hyderabad India experienced substantial growth in FY2013; both in terms of overall head count, improved utilisation and the percentage of overall business that was delivered from the location, which was more than double from the previous financial year. Much of this growth was driven by the growth in our on shore, annuity based, managed services business. Both the team and effort contributing to this service doubled in FY2013. In addition to this, larger components of projects are being completed by our offshore team than ever before. The India location also achieved a high employee engagement score which contributed to the employee turnover remaining well below the company and industry average.
This is a powerful and differentiating service model which continues to be a key component of our supply chain in delivering value to our customers and supporting our business. We draw on the optimum mix of our local and overseas expertise, skills, knowledge and capabilities to deliver and deploy projects more quickly and more cost effectively than otherwise achievable domestically.
We are seeing customers with a heightened awareness and willingness to consider a range of multi- sourced models that deliver competitive results because we can offer our customers’ access to increasingly scarce resources with deeper specialist capability at a better price point than our domestic competitors.
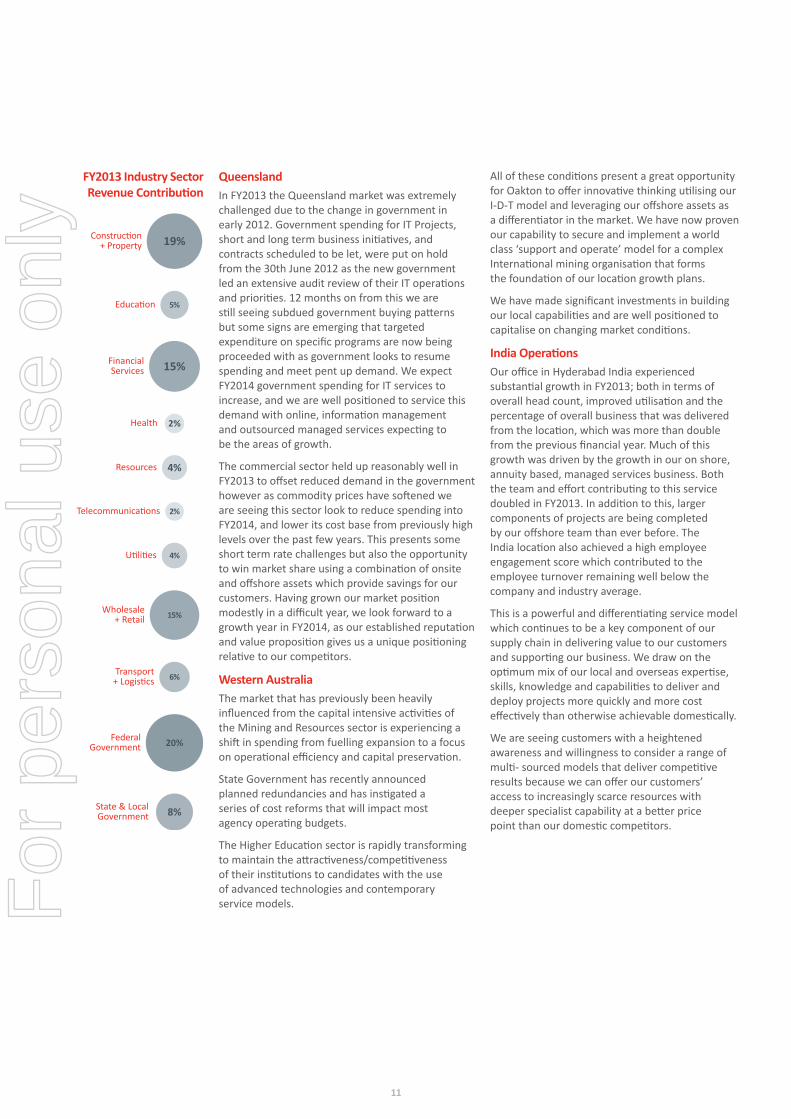
FederalGovernment
State & Local Government
Utilities
Education
Health
FinancialServices
Resources
Telecommunications
Transport+ Logistics
Wholesale+ Retail
Construction+ Property
15%
5%
2%
4%
2%
4%
15%
6%
20%
8%
19%
QueenslandIn FY2013 the Queensland market was extremely challenged due to the change in government in early 2012. Government spending for IT Projects, short and long term business initiatives, and contracts scheduled to be let, were put on hold from the 30th June 2012 as the new government led an extensive audit review of their IT operations and priorities. 12 months on from this we are still seeing subdued government buying patterns but some signs are emerging that targeted expenditure on specific programs are now being proceeded with as government looks to resume spending and meet pent up demand. We expect FY2014 government spending for IT services to increase, and we are well positioned to service this demand with online, information management and outsourced managed services expecting to be the areas of growth.
The commercial sector held up reasonably well in FY2013 to offset reduced demand in the government however as commodity prices have softened we are seeing this sector look to reduce spending into FY2014, and lower its cost base from previously high levels over the past few years. This presents some short term rate challenges but also the opportunity to win market share using a combination of onsite and offshore assets which provide savings for our customers. Having grown our market position modestly in a difficult year, we look forward to a growth year in FY2014, as our established reputation and value proposition gives us a unique positioning relative to our competitors.
Western AustraliaThe market that has previously been heavily influenced from the capital intensive activities of the Mining and Resources sector is experiencing a shift in spending from fuelling expansion to a focus on operational efficiency and capital preservation.
State Government has recently announced planned redundancies and has instigated a series of cost reforms that will impact most agency operating budgets.
The Higher Education sector is rapidly transforming to maintain the attractiveness/competitiveness of their institutions to candidates with the use of advanced technologies and contemporary service models.
Fy2013 Industry Sector revenue Contribution
11
For
per
sona
l use
onl
y
Oakton Consulting Technology
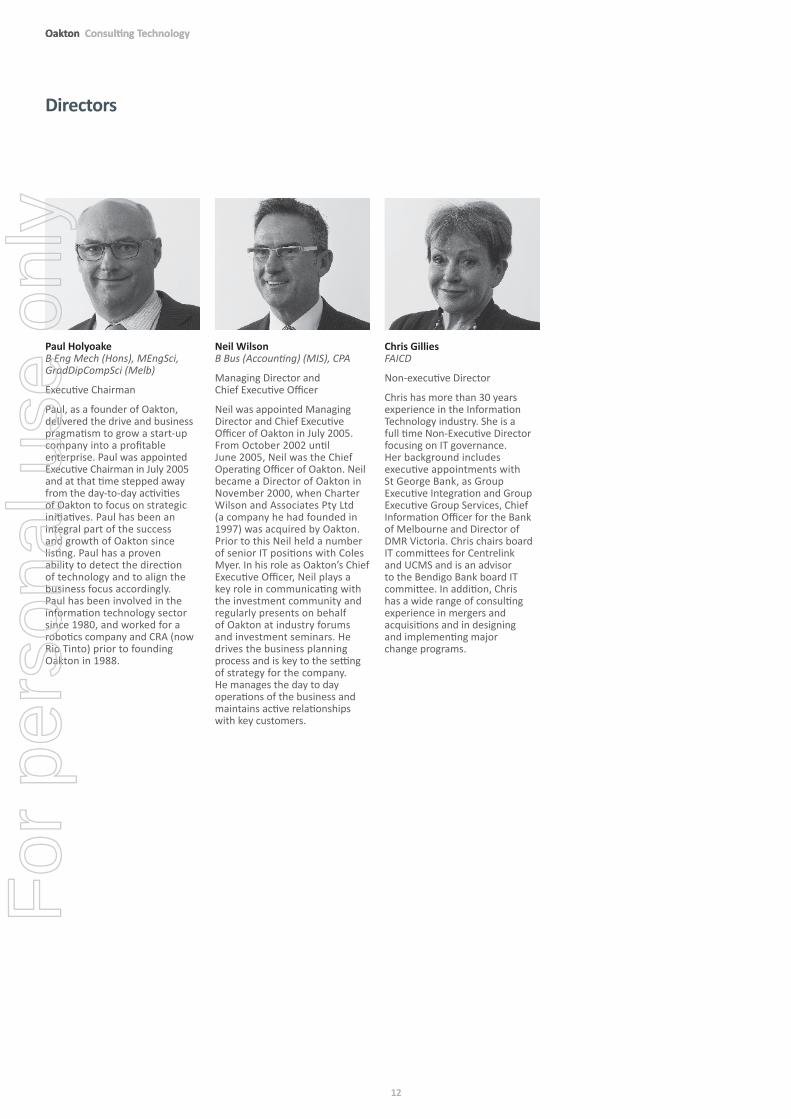
Paul Holyoake B Eng Mech (Hons), MEngSci, GradDipCompSci (Melb)
Executive Chairman
Paul, as a founder of Oakton, delivered the drive and business pragmatism to grow a start-up company into a profitable enterprise. Paul was appointed Executive Chairman in July 2005 and at that time stepped away from the day-to-day activities of Oakton to focus on strategic initiatives. Paul has been an integral part of the success and growth of Oakton since listing. Paul has a proven ability to detect the direction of technology and to align the business focus accordingly. Paul has been involved in the information technology sector since 1980, and worked for a robotics company and CRA (now Rio Tinto) prior to founding Oakton in 1988.
Neil Wilson B Bus (Accounting) (MIS), CPA
Managing Director and Chief Executive Officer
Neil was appointed Managing Director and Chief Executive Officer of Oakton in July 2005. From October 2002 until June 2005, Neil was the Chief Operating Officer of Oakton. Neil became a Director of Oakton in November 2000, when Charter Wilson and Associates Pty Ltd (a company he had founded in 1997) was acquired by Oakton. Prior to this Neil held a number of senior IT positions with Coles Myer. In his role as Oakton’s Chief Executive Officer, Neil plays a key role in communicating with the investment community and regularly presents on behalf of Oakton at industry forums and investment seminars. He drives the business planning process and is key to the setting of strategy for the company. He manages the day to day operations of the business and maintains active relationships with key customers.
Chris gillies FAICD
Non-executive Director
Chris has more than 30 years experience in the Information Technology industry. She is a full time Non-Executive Director focusing on IT governance. Her background includes executive appointments with St George Bank, as Group Executive Integration and Group Executive Group Services, Chief Information Officer for the Bank of Melbourne and Director of DMR Victoria. Chris chairs board IT committees for Centrelink and UCMS and is an advisor to the Bendigo Bank board IT committee. In addition, Chris has a wide range of consulting experience in mergers and acquisitions and in designing and implementing major change programs.
Directors
12
Oakton Consulting Technology
For
per
sona
l use
onl
y
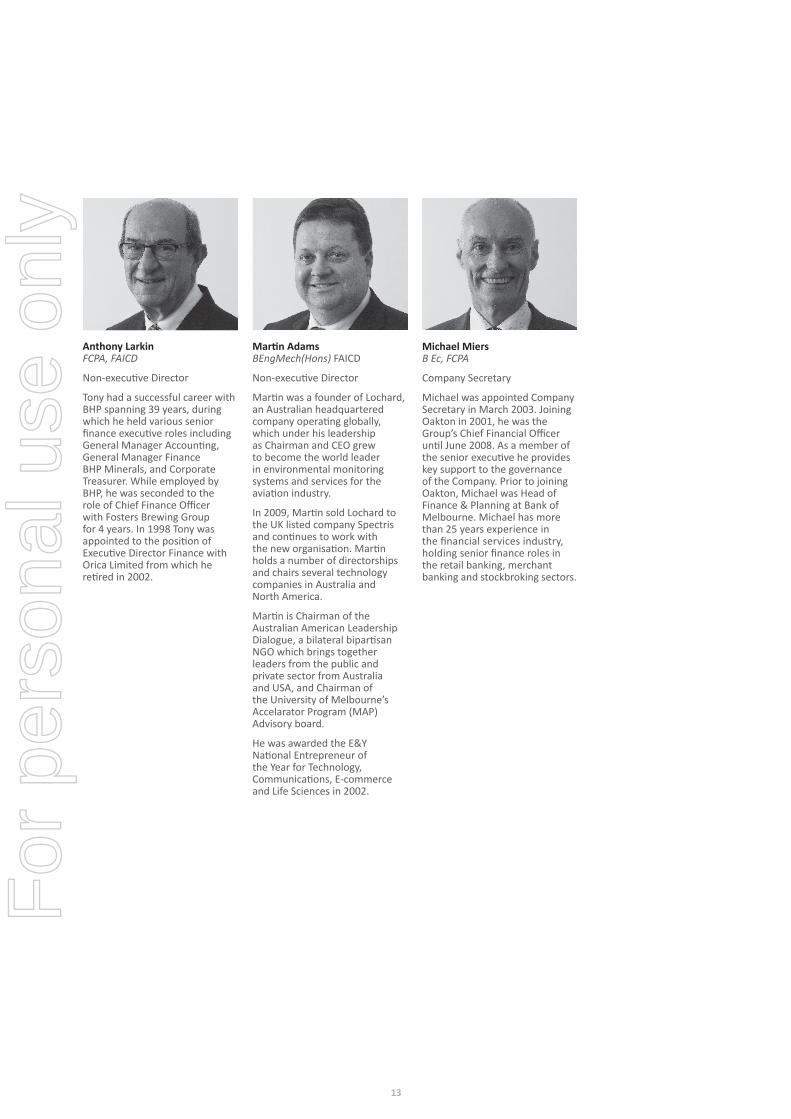
Anthony Larkin FCPA, FAICD
Non-executive Director
Tony had a successful career with BHP spanning 39 years, during which he held various senior finance executive roles including General Manager Accounting, General Manager Finance BHP Minerals, and Corporate Treasurer. While employed by BHP, he was seconded to the role of Chief Finance Officer with Fosters Brewing Group for 4 years. In 1998 Tony was appointed to the position of Executive Director Finance with Orica Limited from which he retired in 2002.
Martin Adams BEngMech(Hons) FAICD
Non-executive Director
Martin was a founder of Lochard, an Australian headquartered company operating globally, which under his leadership as Chairman and CEO grew to become the world leader in environmental monitoring systems and services for the aviation industry.
In 2009, Martin sold Lochard to the UK listed company Spectris and continues to work with the new organisation. Martin holds a number of directorships and chairs several technology companies in Australia and North America.
Martin is Chairman of the Australian American Leadership Dialogue, a bilateral bipartisan NGO which brings together leaders from the public and private sector from Australia and USA, and Chairman of the University of Melbourne’s Accelarator Program (MAP) Advisory board.
He was awarded the E&Y National Entrepreneur of the Year for Technology, Communications, E-commerce and Life Sciences in 2002.
Michael Miers B Ec, FCPA
Company Secretary
Michael was appointed Company Secretary in March 2003. Joining Oakton in 2001, he was the Group’s Chief Financial Officer until June 2008. As a member of the senior executive he provides key support to the governance of the Company. Prior to joining Oakton, Michael was Head of Finance & Planning at Bank of Melbourne. Michael has more than 25 years experience in the financial services industry, holding senior finance roles in the retail banking, merchant banking and stockbroking sectors.
13
For
per
sona
l use
onl
y
Oakton Consulting Technology
Belinda Bacon
Belinda recently joined the Oakton team after a variety of roles in sectors including the Non-for Profit, On Line Advertising and Retail.
Belinda leads Oakton’s human resources and cultural initiatives focussed on strengthening employee engagement and operational efficiency.
Belinda has spent over 10 years within the Coles Myer group in a variety of Retail Management, Buying Operations and Human Resource roles. She then joined what was then the small online advertising company of realestate.com.au, (REA Group) leading the HR function during 7.5 years of high growth. She built HR from a greenfield site to a function supporting multi countries.
Her most recent role was with the Not-For-Profit Save the Children Australia Pacific heading up the HR Function, with a focus on imbedding Risk Management and building commercial acumen and transforming the business.
Bob Peebles
Bob was appointed to the role of Executive General Manager ACT, in February 2013. He is responsible for all of Oakton’s operations in the ACT.
Bob has 30 years’ experience in the IT Sector, and has a strong focus on Sales and Marketing, Customer engagement, and delivering Business outcomes.
Bob joined Oakton in 2002 as a result of the acquisition of Tier Technologies. Prior to joining Oakton, Bob held senior positions at Tier Technologies, Infact, and the Commonwealth Public service.
Since joining Oakton, Bob has held various positions including Victorian Sales Director, National Sales and Marketing General Manager, and Partner Enablement and Solutions General Manager.
Steve McNally
Steve McNally joined Oakton in 2012 as the Executive General Manager for Western Australia having previously been the State Director for Microsoft and State Manager for global systems integrator Dimension Data.
Steve has over 20 years’ experience in the IT industry building and managing high performance teams that consistently achieve their objectives from start-ups to global IT vendors.
His role is to continue the expansions of Oakton’s presence in a relatively new market with the delivery of exceptional customer service through the industry’s best consultants.
Paul Voges BSc (Computer Science)
Paul came to Oakton in October 2012 as the Executive General Manager of NSW. Paul is responsible for all Oakton’s growth, profitability and the operation of the NSW business with 300 of the best consultants in the Australian market. His role is to ensure that customers and Oakton achieve success through an environment that continues to attract the very best talent, elite alliance partners and the finest opportunities.
Paul has worked in the IT industry for over 17 years and has held previous roles at Salesforce and Microsoft Australia, with key responsibilities including leading large sales teams with direct and indirect channels, managing consulting businesses and leading divisions covering enterprise through to SMB market segments across Australia and New Zealand.
Our Leadership group
14
Oakton Consulting Technology
For
per
sona
l use
onl
y
Dennis Papakyriakopoulos B Sc (Computing)
Dennis was appointed Vice President of Oakton GTSCI (India) in April 2009 and is responsible for all aspects of the performance of Oakton’s operations in our offshore facility in Hyderabad. He was recently appointed Executive General Manager of Group Services, a newly formed function, with the responsibility of driving efficiency and effectiveness in our supply chain through the consolidation of Oakton’s offshore and national delivery capability and the increasing support for provision of service integration services provided from cloud based infrastructure and software providers. The Group Service function will also provide support for the ongoing development of Oakton solutions and the increasing support for internal administrative functions.
Dennis has more than 25 years’ experience in the IT industry, and has a strong focus on delivery and leading high performance teams in delivering value to customers through the application of information technology services.
John Phillips BAcc, CA, MAICD
John, a Chartered Accountant, was appointed to the position of Chief Financial Officer in July 2008 after being General Manager of Oakton’s Victorian operations and National Consulting. Prior to this John held the position of Chief Executive Officer at Acumen Alliance from August 2006, and at the same time was Managing Director of Acumen’s Victorian Office. He has more than 30 years’ experience in financial administration and management, governance and accountability and has consulted extensively in these areas to a range of corporate and government agencies. John specialises in advice to Senior Executives on governance, financial and risk management, investments strategies, project management, information optimisation and overall business strategy. John is a member of the Loreto Mandeville Hall Council and was previously Joint Vice Chairman of the Melbourne Football Club and a Council member for William Angliss TAFE.
Bruce Minahan BSurv (Melb)
Bruce was appointed to the role of Executive General Manager for Victoria in November 2010. Bruce is responsible for all business development and delivery in the Victorian location. Prior to this Bruce had a national operational role having previously held the Victorian General Manager role for a number of years. Bruce has been with Oakton since 1997.
Bruce has more than 25 years’ experience in IT services. Prior to joining Oakton, Bruce held IT positions with Anderson Consulting, Hitachi Data Systems, Fujitsu, ICL and the Victorian State Government and has a strong focus on delivering business value through the well-managed application of information technology.
Simon Williams BSc (Computer Science/Accounting)
In late 2005, after establishing Oakton’s mid-market Package Solutions offering across Victoria and New South Wales, Simon was appointed Executive General Manager Queensland and moved to Brisbane to establish Oakton’s Queensland office. Simon joined Oakton through the acquisition of Aston IT Group in 2003, where he was the Practice manager focused on ERP and CRM business solutions.
15
For
per
sona
l use
onl
y
Corporate Governance Statement 2013Oakton Limited and its controlled entities
Listing rule 4.10.3 requires that Oakton discloses the extent to which it has followed the recommendations of the ASX Corporate Governance Council (‘Council’) during the 2013 financial year. There are 8 principles reported on below. Each principle includes one or more recommendations as well as a guide to reporting.
Principle 1 – Lay solid foundations for management and oversight Recommendation 1.1 Companies should establish the functions reserved to the Board and those delegated to senior executives and disclose those functions.The Oakton Board retains responsibility for the following items:
� setting and monitoring of objectives, goals and strategic direction for management with a view to maximising shareholder wealth;
� approving an annual budget and the monitoring of financial performance;
� approving debt facilities and corporate guarantees; � ensuring adequate internal controls exist and are appropriately
monitored for compliance; � ensuring significant business risks are identified and appropriately
managed; � approving acquisitions; � ensuring compliance with statutory requirements; � selecting and appointing new Directors and the Chief Executive
Officer; and � maintaining the highest business standards and ethical behaviour.
During the year Neil Wilson was Chief Executive Officer. The Board has delegated authority within the following areas to him:
� managing performance of the business and its constituent units and managers;
� implementing the strategies, business plans and budgets adopted by the Board;
� ensuring that the business processes in relation to risk management and assurance are met; and
� ensuring compliance with applicable laws and regulations. � approving capital expenditure (except aquisitions)
Recommendation 1.2 Companies should disclose the process for evaluating the performance of senior executives.In the 2013 financial year, executives including executive directors who have operational responsibilities within their area of control were evaluated against the approved budgets and key performance indicators which were approved by the Board in the annual budget and planning process. Reviews with each senior executive are performed annually.
Principle 2 – Structure of the board to add valueRecommendation 2.1 A majority of the Board should be independent directors.For three months of the 2013 financial year the Board comprised four non-executive directors and two executive directors. For the remainder of the year and currently, it comprises three non-executive directors and two executive directors. All the non-executive directors are considered independent by the Board under the definitions provided in the Council’s recommendations. This recommendation has been complied with for the entire 2013 financial year.
Recommendation 2.2 The chair should be an independent director.During the 2013 financial year, the chairman of the Board of Directors was Paul Holyoake. He is not considered to be independent under the Council’s definition as he held an executive position within the three prior financial years and continues to do so. He is also a substantial shareholder. This recommendation has not been complied with during the 2013 financial year.
Recommendation 2.3 The roles of the chairperson and chief executive officer should not be exercised by the same individual.Paul Holyoake (Chairman) and Neil Wilson (Chief Executive Officer) have distinct roles.
Recommendation 2.4 The Board should establish a nomination committee.The Remuneration and Nomination Committee holds the delegated authority to nominate and assess candidates for the Board.
Recommendation 2.5 Companies should disclose the process for evaluating the performance of the Board, its committees and individual directors.During the 2012 financial year, the Board commissioned an independent review covering composition, subcommittee structure, meeting frequency, Board paper composition and other related matters. Recommendations from this independent review have been implemented. In addition, the Board undertakes an annual self assessment process, the results of which are reviewed by the Chairman and presented to the Board for consideration.
16
Oakton Consulting Technology
For
per
sona
l use
onl
y
Principle 3 – Promote ethical and responsible decision making Recommendation 3.1 Companies should establish a code of conduct and disclose the code or a summary of the code as to:
� the practices necessary to maintain confidence in the company’s integrity;
� the practices necessary to take into account their legal obligations and the reasonable expectations of their stakeholders; and
� the responsibility and accountability of individuals for reporting and investigating reports of unethical practice.
The Oakton Human Resources manual and procedures ensure that: � company assets are used appropriately for business purposes; � confidential information is maintained confidential; and � all parties act so as not to conflict with Oakton’s interests.
Additionally, terms and conditions of employment provide detailed instructions as to the acceptable standards of behaviour.
The Company has established a Code of Conduct.
A copy of the Oakton Securities Trading Policy and the Code of Conduct is available on the Oakton website at www.oakton.com.au/investors/governance.
Recommendation 3.2 Companies should establish a policy concerning diversity and disclose the policy or a summary of that policy. The policy should include requirements for the Board to establish measurable objectives for achieving gender diversity and for the Board to assess annually both the objectives and progress in achieving them.The Oakton Board adopted a policy on diversity in July 2011. Oakton is committed to:
� attracting, developing and retaining our employees to ensure business growth and performance;
� ensuring that every employee is treated fairly and with respect; � valuing differences and the contribution of all employees to
business success; � creating an environment where people can excel without
encountering bias or being hampered by race, age, gender, lifestyle choices, religion, culture or disability; and
� ensuring all employees and applicants are treated and evaluated according to their job-related skills, qualifications, abilities and aptitudes only.
The Oakton Diversity Statement can be found on our website at www.oakton.com.au/investors/governance.
Recommendation 3.3 Companies should disclose in each annual report the measurable objectives for achieving gender diversity set by the Board in accordance with the diversity policy and progress towards achieving them.The Executive Team, under the direction of the Chief Executive Officer, drives diversity and inclusivity within our business. We are proud of our culturally and ethnically diverse workforce. We will continue to focus on all aspects of diversity with our initial focus to improve our gender diversity. To demonstrate our commitment in this area the Board had adopted the following diversity measures for the 2013 financial year:
� Maintain current proportion of women on the Oakton Board – Achieved;
� Increase the number of female managers from 17% to a minimum 20%. Women account for 21% of management positions; and
� Formalise FAB (Females Achieving Business) as a proactive network to assist women to develop skills to deal with a “mostly male” environment and championed by one of the female board members – The FAB Network is well established across our operating locations.
Recommendation 3.4 Companies should disclose in each annual report the proportion of women employees in the whole organisation, women in senior executive positions and women on the Board.As at 30 June 2013 the proportion of women employees is 25% of the total workforce, 13% of senior executive positions and 20% of the Board.
Principle 4 – Safeguard integrity of financial reporting Recommendation 4.1 The Board should establish an audit committee.The Audit Committee was established in June 2000 when the company became a listed company. Within Oakton, the committee is called the Audit and Risk Committee.
The main objectives of the Audit and Risk Committee are:a. to assist the Board achieve its objectives in relation to:
� the integrity and reliability of the consolidated entity’s financial reporting;
� the application of accounting principles, policies, controls and procedures;
� the adequacy of practices and procedures in respect of achieving legal and regulatory compliance; and
� the effectiveness of internal control and risk management systems.
b. maintain and improve the quality, credibility and objectivity of the financial reporting process;
c. promote a culture of compliance;d. maintain effective communication between the Board
and the Committee;e. oversee the relationship with the external auditor and assess
the auditor’s independence; andf. monitor compliance strategies and the effectiveness of the
compliance function.
17
For
per
sona
l use
onl
y
Corporate Governance Statement 2013 continuedOakton Limited and its controlled entities
The responsibilities of the Audit and Risk Committee are in the areas of external financial reporting, external audit, risk management and internal control and other items as noted in its charter.
Additionally, the Audit and Risk Committee is responsible for: � assessing and recommending to the Board the scope, cover and
cost of insurance, including insurance relating to directors and officers liability, company reimbursement, professional indemnity, crime and special accident;
� if it considers appropriate, investigating any complaint or allegation made to it;
� reviewing and monitoring any transaction between the Oakton group and the key management personnel and their personally-related entities, and making recommendations to the Board on their approval or otherwise; and
� monitoring that the audit, risk management and compliance policies and procedures are adequately documented and that those documents are reviewed and updated for any legal and regulatory developments.
The Committee has adopted a program of work which enables it to discharge its responsibilities under the Charter. The full charter is available on the Oakton website at www.oakton.com.au/investors/governance.
Recommendation 4.2 The audit committee should be structured so that it:
� consists only of non-executive directors; � consists of a majority of independent directors; � is chaired by an independent chair, who is not chair of the
Board; and � has at least three members.
During the 2013 financial year, the members of the Audit and Risk Committee were:
� Anthony Larkin (an independent, non-executive director), Chairman of the Committee;
� Chris Gillies (an independent, non-executive director); � Martin Adams (an independent, non-executive director)
appointed 21st November 2012; and � Gordon Hughes (an independent, non-executive director)
resigned 21st November 2012.
The Company Secretary acts as the Committee Secretary assisting members. The Company’s external auditors are invited to attend the Committee’s meetings. In addition, the Committee is able to seek and obtain input from external consultants as required.
Recommendation 4.3 The audit committee should have a formal operating charter.The Audit and Risk Committee has a formal operating charter. A copy of the charter is available on the Oakton website at www.oakton.com.au/investors/governance. In addition to the Charter, the Committee has adopted a program of work for each year.
Principle 5 – Make timely and balanced disclosureRecommendation 5.1 Companies should establish written policies and procedures designed to ensure compliance with ASX listing rule disclosure requirements and to ensure accountability at senior management level for that compliance and disclose those policies or a summary of those policies.The Company Secretary is the Disclosing Officer responsible for all communications with the ASX. The procedures ensure that all matters which may effect the price of securities are monitored by the Board and at each board meeting the Board confirms whether or not there are any further matters to be disclosed. All communications are reviewed by the directors, together with the Disclosing Officer to ensure that they are factually correct and complete. Should matters arise between scheduled Directors’ Meetings, the executive directors and the Disclosing Officer will consider them, prepare recommendations and then circulate them to all directors for review and resolution. Should the matter(s) require disclosure, then an announcement will be made via the Disclosing Officer.
Principle 6 – Respect the rights of shareholdersRecommendation 6.1 Companies should design and disclose a communications strategy to promote effective communication with shareholders and encourage effective participation at general meetings and disclose their policy or a summary of that policy.Communications to shareholders:The Board has developed an annual investor relations communications plan:
� The annual report is published electronically on the Oakton website. A printed copy of the annual report is distributed to shareholders or other stakeholders upon request. The Board ensures that the annual report includes relevant information about the operation of the Company during the year, changes in the state of affairs of the Company and details of future developments, in addition to the other disclosures required by the Corporations Act. The annual report is the primary source of publically available information on Oakton;
� The half-year report contains summarised financial information and a review of the operations of the Company during the period. The half-year financial report is prepared in accordance with the Corporations Act, and is lodged with the Australian Securities and Investments Commission and the Australian Stock Exchange (ASX); and
� The Company’s website at www.oakton.com.au is regularly updated and provides details of recent material announcements by the Company to the ASX, annual reports, and general information on the Company and its business.
The Board encourages participation of shareholders at the Annual General Meeting to ensure a high level of accountability and identification with the Company’s strategy and goals. Important issues are presented to the shareholders as distinct resolutions.
The Board reviews the investor relations communication plan in April of each year.
18
Oakton Consulting Technology
For
per
sona
l use
onl
y
Principle 7 – Recognise and manage risk Recommendation 7.1 Companies should establish policies for the oversight and management of material business risks and disclose a summary of those policies.In relation to identifying areas of significant business risk and putting in place arrangements to manage such risk the Board relies on the advice and expertise of senior management acting in consultation with the Company’s external advisers. Where appropriate the Board obtains advice directly from external advisers.
The Board has not considered it appropriate to appoint a separate Corporate Governance Committee. Responsibility for developing and monitoring corporate governance policies and practices in areas outside the scope of the functions of the Audit and Risk Committee is retained and exercised directly at Board level.
Risk management is part of the business as usual process at Oakton comprising a system of risk oversight, management and internal controls operating at all levels of the organisation.
Oakton’s policy in relation to risk management outlines: � definition of risk; � identification of material business risk; and � reporting on the status of mitigating actions.
Oakton’s risk management policy defines risk as any adverse exposure to events that could affect Oakton’s ability to discharge its responsibilities to its stakeholders and/or meet its objectives.
Risks are rated on two scales reflecting the probability of occurrence and the impact which are then rated on a scale of impact to Oakton’s reputation and/or financial performance to provide a matrix of the material business risks that Oakton manages.
In response to changing conditions, the ranking of certain risks may change and additional risk mitigation activities may be undertaken.
Recommendation 7.2 The Board should require management to design and implement the risk management and internal control system to manage the company’s material business risks and report to it on whether those risks are being managed effectively. The Board should disclose that management has reported to it as to the effectiveness of the company’s management of its material business risks.A process exists to report risk at different operational levels from business unit through to the Board. Material operational and strategic risks are reported monthly to the Board. Risks are aligned to Oakton business plan domains enabling direct linking of risk mitigation action plans with the business plan initiatives and/or existing operational functions. This focuses risk ownership at the executive level, who periodically report to the Audit and Risk Committee on the status of their risk portfolio.
The effectiveness of the risk management process is assessed periodically and continually improved.
In addition, as part of Oakton’s delivery of risk mitigation, the Company is ISO 9001 certified and externally audited bi-annually to maintain this certification.
The Board of Directors has overall responsibility for establishing and maintaining an effective system of internal control. The day-to-day work of maintaining an effective internal control environment and continuous risk assessment in respect of financial reporting has been delegated to the Managing Director and Chief Executive Officer, who in turn has delegated function-specific responsibility to managers at appropriate levels within the company.
The company’s processes and systems for ensuring effective internal controls have been designed with the intention of managing and limiting the risks of material errors in the reporting of financial information, and, consequently, lead to both operational and strategic decisions being based on accurate financial information. The Internal Control system is governed by a clearly defined set of roles and responsibilities, supported by approved Delegations of Authority, appropriate segregation of duties and management review and supervision.
Recommendation 7.3 The Board should disclose whether it has received assurance from the chief executive officer (or equivalent) and the chief financial officer (or equivalent) that the declaration provided in accordance with section 295A of the Corporations Act is founded on a sound system of risk management and internal control and that the system is operating effectively in all material respects in relation to financial reporting risks.This recommendation was complied with during the 2013 financial year.
19
For
per
sona
l use
onl
y
Corporate Governance Statement 2013 continuedOakton Limited and its controlled entities
Principle 8 – Remunerate fairly and responsiblyRecommendation 8.1 The Board should establish a remuneration committee.The Remuneration Committee was established in June 2000 when the company became a listed company. Within Oakton, the committee is called the Remuneration and Nomination Committee.
Recommendation 8.2 The remuneration committee should be structured so that it:
� consists of a majority of independent directors � is chaired by an independent chair � has at least three members.
During the 2013 financial year, the members of the Remuneration and Nomination Committee were:
� Chris Gillies (an independent, non-executive director), Chairperson of the Committee;
� Anthony Larkin (an independent non-executive director); � Martin Adams (an independent non-executive director),
appointed 21st November 2012; and � Gordon Hughes (an independent non-executive director),
retired 21st November 2012;
The Remuneration and Nomination Committee is responsible for making recommendations to the Board on remuneration policies and packages applicable to the Board members. The broad remuneration policy is to ensure the remuneration package properly reflects the person’s duties and responsibilities; and that remuneration is competitive in attracting, retaining and motivating people of the highest quality.
The Remuneration and Nomination Committee has authority for nomination of candidates to the Board and management of the Oakton Limited Equity Incentive Plan.
The Remuneration and Nomination Committee Charter was formally adopted in May 2006 and is reviewed periodically.
Recommendation 8.3 Companies should clearly distinguish the structure of non-executive directors’ remuneration from that of executive directors and senior executives.The terms and conditions of the appointment of the non-executive directors are set out in a letter of appointment which prescribes:
� remuneration; � the term of appointment, subject to shareholder approval; � the expectation of the Board in relation to attending and
preparing for all Board Meetings; � procedures for dealing with conflicts of interest; and � the availability of independent professional advice.
Non-executive directors are remunerated for their services from the maximum aggregated amount approved by shareholders for that purpose. Their compensation is reviewed by the Board. There are no termination benefits for non-executive directors.
Non-executive directors do not receive at risk remuneration.
The executive directors and senior executives are employed under individual contracts detailing their remuneration, service period and non-competition clauses. The contracts may be terminated for cause and the executive directors and senior executives may be entitled to termination benefits in accordance with relevant state and federal laws governing long service leave and superannuation. All executives have an element of their remuneration at risk. The key performance indicators which will entitle them to access the at risk portion of their remuneration are set through the annual business planning and budget process.
Specific details of remuneration paid and incentive arrangements are detailed in the Remuneration Report set out on pages 25 to 38.
20
Oakton Consulting Technology
For
per
sona
l use
onl
y
Directors’ Report
The directors present their report together with the financial report of the consolidated entity consisting of Oakton Limited ABN 50 007 028 711 and the entities it controlled, for the financial year ended 30 June 2013 and auditor’s report thereon. This financial report has been prepared in accordance with Australian Accounting Standards.
DirectorsThe names of directors in office at any time during or since the end of the financial year are:
� Paul Holyoake (Executive Chairman); � Neil Wilson (Managing Director & Chief Executive Officer); � Chris Gillies; � Gordon Hughes (retired 21 November 2012); � Anthony Larkin; and � Martin Adams (appointed 4 September 2012).
Directors have been in office since the start of the financial year to the date of this report unless otherwise stated.
Company SecretaryThe following person held the position of company secretary at the end of the financial year:
� Michael Miers
Principal activitiesThe principal activities of the consolidated entity during the financial year consisted of:
� business consulting and IT strategy; � risk management, assurance and accounting services; � delivery services and solution design; � custom application development and technical
architecture services; � packaged software implementation; � information management, data warehousing and business
intelligence services; � systems integration solutions; and � application management services.
There has been no significant change in the nature of these activities during the financial year.
ResultsThe consolidated profit after income tax attributable to the members of Oakton Limited was $9,156,130 (2012: $11,836,623).
Review of operationsDetails of the operations of Oakton Limited during the year, the financial position and the strategies and prospects for future years can be found in the Chairman and Managing Director’s Review found on pages 8 to 11 which forms part of this Directors’ Report.
Significant changes in the state of affairsThere were no significant changes in the state of affairs of the consolidated entity during the financial year.
After balance date eventsNo matters or circumstances have arisen since the end of the financial year that have significantly affected or may significantly affect the operations of the consolidated entity, the results of those operations, or the state of affairs of the consolidated entity in future financial years.
Likely developmentsLikely developments, future prospects and business strategies of the operations of the consolidated entity are detailed in the Chairman and Managing Director’s Review on pages 8 to 11.
Environmental regulationThe consolidated entity’s operations are not subject to any significant Commonwealth or State environmental regulations or laws.
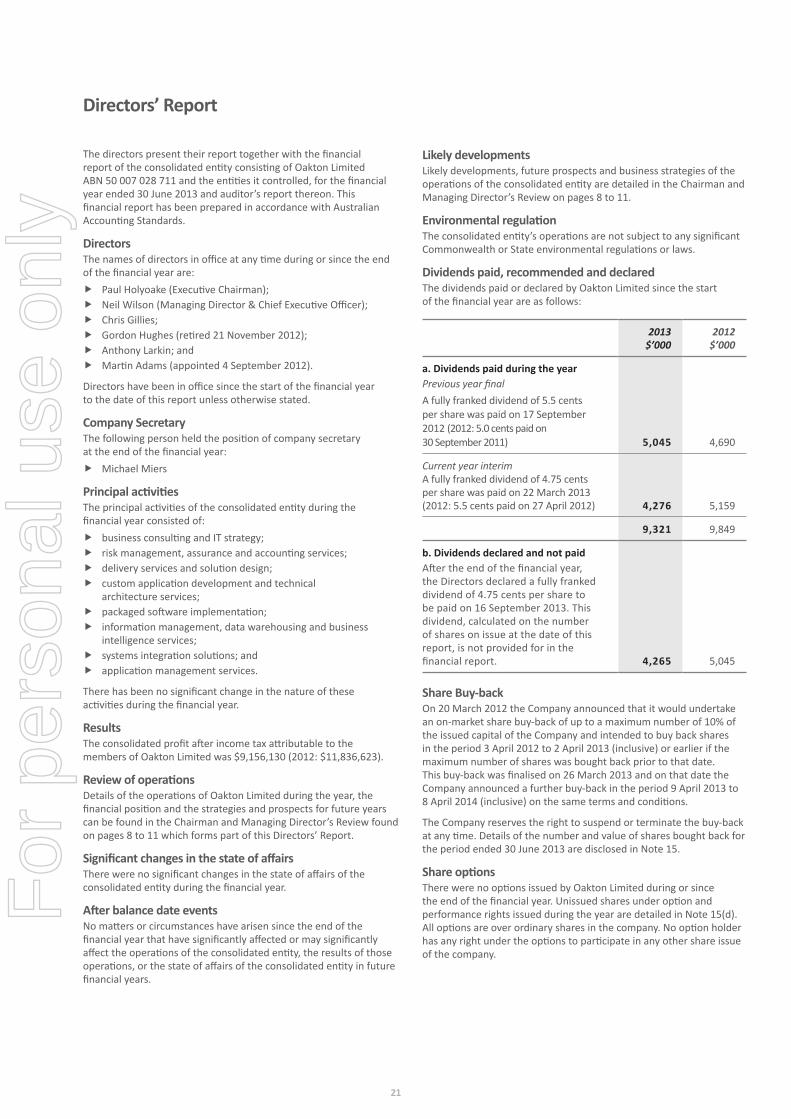
Dividends paid, recommended and declaredThe dividends paid or declared by Oakton Limited since the start of the financial year are as follows:
2013 $’000
2012 $’000
a. Dividends paid during the yearPrevious year finalA fully franked dividend of 5.5 cents per share was paid on 17 September 2012 (2012: 5.0 cents paid on 30 September 2011) 5,045 4,690
Current year interimA fully franked dividend of 4.75 cents per share was paid on 22 March 2013 (2012: 5.5 cents paid on 27 April 2012) 4,276 5,159
9,321 9,849
b. Dividends declared and not paidAfter the end of the financial year, the Directors declared a fully franked dividend of 4.75 cents per share to be paid on 16 September 2013. This dividend, calculated on the number of shares on issue at the date of this report, is not provided for in the financial report. 4,265 5,045
Share Buy-backOn 20 March 2012 the Company announced that it would undertake an on-market share buy-back of up to a maximum number of 10% of the issued capital of the Company and intended to buy back shares in the period 3 April 2012 to 2 April 2013 (inclusive) or earlier if the maximum number of shares was bought back prior to that date. This buy-back was finalised on 26 March 2013 and on that date the Company announced a further buy-back in the period 9 April 2013 to 8 April 2014 (inclusive) on the same terms and conditions.
The Company reserves the right to suspend or terminate the buy-back at any time. Details of the number and value of shares bought back for the period ended 30 June 2013 are disclosed in Note 15.
Share optionsThere were no options issued by Oakton Limited during or since the end of the financial year. Unissued shares under option and performance rights issued during the year are detailed in Note 15(d). All options are over ordinary shares in the company. No option holder has any right under the options to participate in any other share issue of the company.
21
For
per
sona
l use
onl
y
Directors’ Report continued
Performance RightsPerformance rights issued by Oakton Limited during or since the end of the financial year are detailed in Notes 15(d) and 22 in the attached financial report. The details of rights granted to Directors and executives are detailed in the Remuneration Report on pages 25 to 38. All rights are over ordinary shares in the company. No rights holder has any right under the rights to participate in any other share issue of the company.
Indemnification and insurance of Directors and OfficersThe company has during and since the end of the financial year, in respect of any person who has, is or has been an officer of the company or a related body corporate, paid a premium in respect of Directors and Officers Liability insurance which indemnifies Directors,
Officers and the Company of any claims made against the Directors, Officers of the Company and the Company, subject to conditions contained in the insurance policy. Further disclosure required under section 300(9) of the Corporations Act 2001 is prohibited under the terms of the contract.
Proceedings on behalf of the Consolidated EntityNo person has applied for leave of a Court to bring proceedings on behalf of the consolidated entity.
Information on Directors and Company SecretaryThe qualifications, experience and special responsibilities of each person who has been a Director of Oakton Limited at any time during or since the end of the financial year is provided below, together with details of the Company Secretary as at the year end.
Paul Holyoake BEngMech(Hons), MEngSci, Grad Dip CompSci (Melb)
Executive ChairmanAppointed as a director on 12 July 1988. Last re-elected at the 2011 AGM. No other directorships of listed companies were held at any time during the three years prior to 30 June 2013.
Neil WilsonBBus (Accounting) (MIS), CPA
Managing Director and Chief Executive OfficerAppointed as a director on 17 November 2000. Last re-elected at 2003 AGM. As Managing Director, he is not subject to rotation and re-election. No other directorships of listed companies were held at any time during the three years prior to 30 June 2013.
Chris GilliesFAICD
Independent DirectorAppointed as a director on 11 June 2003. Chairperson of the Remuneration and Nomination Committee. Member of the Audit and Risk Committee. Last re-elected at 2010 AGM. Previous directorships in listed companies in the prior 3 years: Corporate Express Australia Ltd (July 2005 to July 2010) and Rabinov Property Trust (from December 2010 to November 2011).
Gordon HughesLLB (Hons), LLM, PhD
Independent DirectorAppointed as a director on 7 April 2000. Member of the Audit and Risk Committee. Member of the Remuneration and Nomination Committee from August 2011. Last re-elected at 2009 AGM. No other directorships of listed companies were held at any time during the three years prior to 30 June 2013. Retired as a director and as a member of the Audit and Risk Committee and the Remuneration and Nomination Committee on 21 November 2012.
Anthony LarkinFCPA, FAICD
Independent DirectorAppointed as a director on 2 September 2009. Chairman of the Audit and Risk Committee since his appointment. Member of the Remuneration and Nomination Committee. Last re-elected at the 2012 AGM. Other listed company directorships: Incitec Pivot Ltd (since May 2003) and MMG Limited (formerly Minmetal Resources Ltd, listed on Hong Kong Stock Exchange). Previous directorships in listed companies in the prior 3 years: Corporate Express Australia Ltd (July 2004 to July 2010), Eyecare Partners Limited (August 2007 to January 2010).
Martin Adams BEngMech(Hons), FAICD
Independent DirectorAppointed as a director on 4 September 2012. Member of the Audit and Risk Committee and Remuneration and Nomination Committee since his appointment. Last elected at the 2012 AGM.No other directorships of listed companies were held at any time during the three years prior to 30 June 2013.
Michael MiersBEc, FCPA
Company SecretaryAppointed Company Secretary in March 2003.
For details of the experience of continuing directors, refer to profiles on pages 12 to 13.
Apart from the Managing Director, one-third of directors are subject to rotation each year and may offer themselves for re-election at the Annual General Meeting.
The Board has a policy of enabling Directors to seek independent professional advice at the company’s expense, subject to estimated costs being approved by the Chairman in advance as being reasonable. It is the practice of the Directors that when a potential conflict of interest may arise, the Director concerned does not receive a copy of the relevant Board paper and withdraws from the Board Meeting whilst such a matter is being considered.
22
Oakton Consulting Technology
For
per
sona
l use
onl
y
Directors’ meetingsThe number of meetings of the Board of Directors and of each Board Committee held during the financial year and the numbers of meetings attended by each director were:
Board of Directors Audit and Risk CommitteeRemuneration
and Nomination Committee
Eligible to attend Attended Eligible to attend Attended Eligible to attend Attended
Paul Holyoake 12 12 0 0 0 0Neil Wilson 12 12 0 0 0 0Chris Gillies 12 12 4 4 2 2Gordon Hughes 6 6 1 1 1 1Anthony Larkin 12 12 4 4 2 2Martin Adams 9 9 3 3 2 2
Directors’ Interests in Shares, Options or RightsDirectors’ relevant interests in shares of Oakton Limited or options and rights over shares in the company as at the date of this report are detailed below.
Ordinary shares of Oakton Limited held directly
Ordinary shares of Oakton Limited held indirectly
Rights over shares in Oakton Limited held directly
Paul Holyoake – 8,000,000 –Neil Wilson 2,195,000 5,000 557,995Chris Gillies – 26,000 –Gordon Hughes – – –Anthony Larkin – – –Martin Adams – 74,757 –
Directors’ interests in contractsTransactions with Directors are at arms-length and in the ordinary course of business on normal trading terms. The consolidated entity leases premises owned by Davkat Holdings Pty Ltd (entity related to Paul Holyoake). During FY2013 the company paid $207,941 (FY2012 $218,145) in respect of lease rental for the premises. There were no other transactions with Directors or their personally related entities during FY2013.
Directors’ interests in contracts are disclosed in Note 24(b) to the financial statements.
Auditor’s Independence DeclarationA copy of the Auditor’s Independence Declaration as required under s307C of the Corporations Act 2001 in relation to the audit for the financial year is provided with this report.
Non-audit servicesNon-audit services are approved by resolution of the Audit and Risk Committee. Non-audit services provided by the auditors of the consolidated entity during the year, Pitcher Partners, are detailed below. The directors are satisfied that the provision of the non-audit services during the year by the auditor is compatible with the general standard of independence for auditors imposed by the Corporations Act 2001.
Amounts paid or payable to an auditor for non-audit services provided during the year by the auditor by any entity that is part of the consolidated entity for:
2013 $’000
2012 $’000
Corporate secretarial services 8 6
Rounding of amountsThe amounts contained in the report and in the financial report have been rounded to the nearest $1,000 (where rounding is applicable) under the option available to the consolidated entity under ASIC Class Order 98/0100. The consolidated entity is an entity to which the Class Order applies.
23
For
per
sona
l use
onl
y
Directors’ Report continued
Message from the Board
Dear Shareholder,
We are pleased to present the Oakton Remuneration Report for the financial year ended 30 June 2013 (FY2013).
The key characteristics of the senior executive remuneration framework are summarised below, including a summary of key remuneration outcomes for the FY2013 year.
Executive remuneration framework
� The executive remuneration framework seeks to align with market and shareholders’ expectations, and to reflect well governed remuneration practices.
� A significant portion of executive remuneration is to be performance-based and clearly aligned with annual and longer-term objectives.
Fixed/total remuneration � Oakton’s policy is to position the Managing Director’s/Chief Executive Officer’s (MD/CEO’s) fixed remuneration at the market median of a comparator group of companies of a similar size based on market capitalization. For other Executives, reference is made to industry specific salary surveys. Fixed Remuneration may range between 85-115% of market rates for comparable roles, depending on the employee’s competence and sustained performance in their role. It is the Company’s intention to position total remuneration (fixed, short term incentive (STI) and long term incentive (LTI)) at the 75th percentile of the same peer group of companies to encourage a culture of out-performance.
� A decision has been made to maintain the freeze on executives’ fixed remuneration while the transition to remuneration mixes that more closely align with market practices continues.
Short-term incentives(STI)
� An annual cash incentive is available to employees who participate in the STI plan and who achieve relevant metrics.
� During FY2013 the MD/CEO had a target STI opportunity of 26% of fixed remuneration, and other members of the executive team had an STI opportunity of between 15% – 30% of fixed remuneration. The Board has the discretion to adjust STI payments downwards in light of unexpected or unintended circumstances.
� Before any STIs are paid, a base level of financial performance must be achieved. For FY2013, no STI was payable unless the Company’s financial performance had reached 95% of the annual financial objectives, regardless of the performance achieved for other metrics. STI metrics are weighted 50% towards financial metrics and 50% towards non-financial metrics. The metrics for FY2013 related to key initiatives in the areas of delivering financial performance, increasing employee engagement, increased customer satisfaction and delivery of increased returns to shareholders (through quality of earnings and revenue growth). Executives are also assessed on the achievement of individual performance objectives, which are weighted on specific key areas depending on the employee’s role and Oakton’s business plan for the year.
� The STI pool metrics are assessed and calibrated annually to ensure that potential incentive outcomes align with the interests of shareholders.
� During FY2013, the Company’s financial performance fell below threshold requirements, and consequently no STI was paid to any Executive, notwithstanding that other metrics may have been achieved.
Long-term incentives(LTI)
� The LTI plan, approved by shareholders at the FY2011 annual general meeting, provides flexibility to the Board to make annual LTI grants of Options, Performance Rights and/or Share Appreciation Rights, with vesting subject to market aligned performance hurdles.
� Oakton also engaged Ernst & Young in the prior year to benchmark the remuneration package of the MD/CEO. This exercise identified that the LTI component of the MD/CEO’s existing remuneration was low compared to the market. As such, a grant of Performance Rights, equivalent to 28% of total remuneration, was made to the MD/CEO during FY2013 to place a larger portion of the remuneration package at risk.
� The grant of Performance Rights made to the MD/CEO has a performance period of 3 years such that no vesting occurs until the third anniversary of grant date. The Performance Rights vest subject to achievement of a relative Total Shareholder Return (‘TSR’) (50% weighting) and absolute Earnings per Share (‘EPS’) (50% weighting) performance hurdles. Relative TSR performance will be assessed against a peer group comprised of the ASX 300 (excluding financial services, infrastructure funds and mining/property/manufacturing companies). Absolute EPS requires that a minimum 10% compound annual growth rate is achieved.
� Performance Rights were issued to executives with identical vesting conditions to those of the MD/CEO.
Non-executive Director (NED) fees
� For FY2013, the Company increased NED fees by $5,000 (including superannuation). � Additionally for FY2013, the Company has paid additional committee fees to Chairs of committees
in recognition of the additional time and commitment required in undertaking such a role. Chairs of committees will receive $10,000 (including superannuation) in addition to their NED fees.
We welcome on-going feedback from our shareholders to further enhance both the structure and transparency of our remuneration arrangements.
Paul Holyoake Chris Gillies Executive Chairman Chair of Remuneration and Nomination Committee
24
Oakton Consulting Technology
For
per
sona
l use
onl
y
Audited Remuneration Report (forming part of the Directors’ Report)This remuneration report sets out remuneration information for Oakton’s non-executive directors, executive directors and other key management personnel (“KMP”).
The report is comprised of the following key sections:a. Who this report coversb. Remuneration governancec. Executive remuneration policy and frameworkd. Use of remuneration consultantse. Link between performance and remuneration outcomesf. Non-executive director remuneration frameworkg. Details of remunerationh. Service agreementsi. Details of share-based compensation and bonusesj. Voting and comments made at the Oakton’s 2012 Annual General Meetingk. Other KMP Disclosures
a. Who this report coversThe names and positions of each person who held the position of director at any time during the financial year are:
Directors Position
Paul Holyoake Executive ChairmanNeil Wilson Managing Director and Chief Executive OfficerChris Gillies Independent, Non-executive DirectorGordon Hughes Independent, Non-executive Director (retired on 21 November 2012)Anthony Larkin Independent, Non-executive DirectorMartin Adams Independent, Non-executive Director (appointed on 4 September 2012)
The key management personnel of the consolidated entity for the financial year are:
Key management personnel Position
John Phillips Chief Financial OfficerKaren Lowe Executive General Manager, Organisational Capability
Changes since the end of the reporting periodThere were no changes to directors disclosed in this report since 30 June 2013. Karen Lowe has resigned effective from 1 August 2013.
b. Remuneration governanceThe Remuneration and Nomination Committee is a committee of the Board. It is responsible for making recommendations to the Board on remuneration policies and remuneration packages of the executive directors.
Subject to review by the Remuneration and Nomination Committee, the MD/CEO determines the remuneration of the KMP.
c. Executive remuneration policy and frameworkOakton aims to provide market competitive and equitable remuneration to attract, motivate and retain highly skilled people who will drive the successful execution of our business strategy and deliver positive outcomes to our stakeholders.
The executive remuneration structure aims to deliver a significant portion of remuneration that is dependent on annual business performance and long-term shareholder value, ensuring alignment between the business’ success and an individual’s reward. It provides incentives to encourage employee commitment, innovation and creativity in their contribution to the business.
Oakton uses an industry-based remuneration benchmarking process which aims to position executive fixed remuneration at a level that reflects the market for a comparable role. In addition to fixed remuneration, incentive remuneration is offered and provides the opportunity to increase total remuneration payable if targets are met. Comparable roles for benchmarking purposes are identified within the Australian Information Industry Association survey and/or other relevant salary surveys.
25
For
per
sona
l use
onl
y
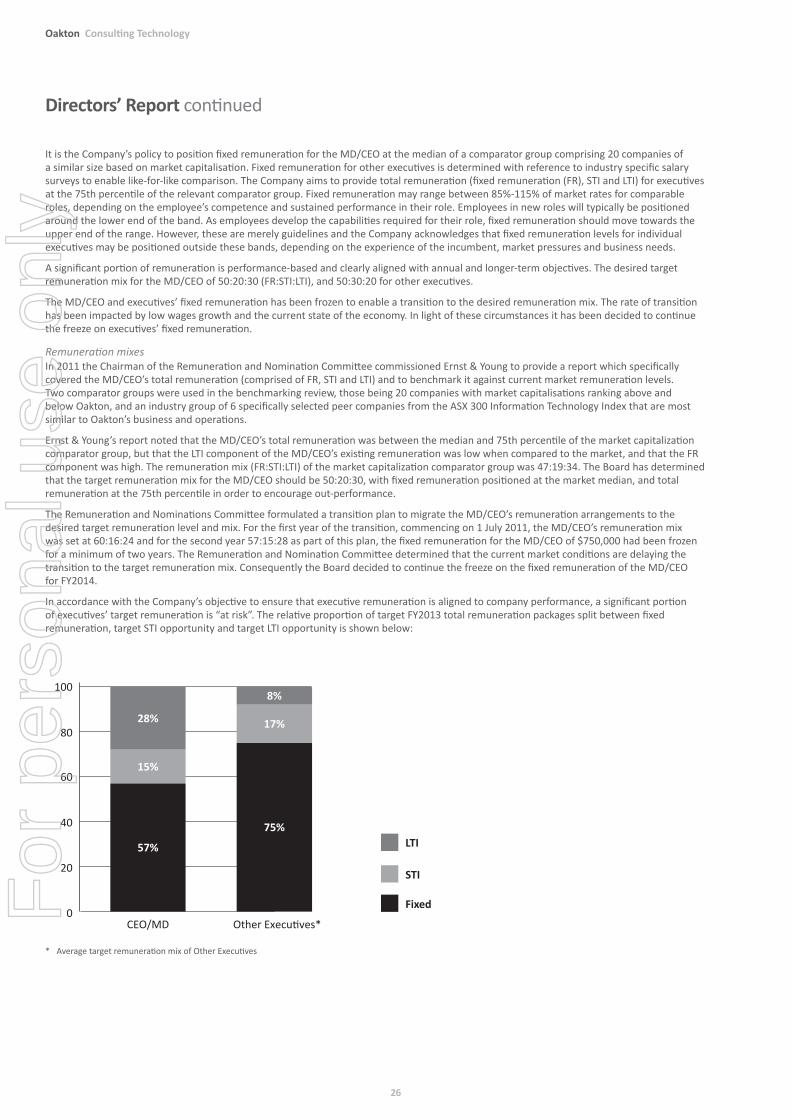
Directors’ Report continued
It is the Company’s policy to position fixed remuneration for the MD/CEO at the median of a comparator group comprising 20 companies of a similar size based on market capitalisation. Fixed remuneration for other executives is determined with reference to industry specific salary surveys to enable like-for-like comparison. The Company aims to provide total remuneration (fixed remuneration (FR), STI and LTI) for executives at the 75th percentile of the relevant comparator group. Fixed remuneration may range between 85%-115% of market rates for comparable roles, depending on the employee’s competence and sustained performance in their role. Employees in new roles will typically be positioned around the lower end of the band. As employees develop the capabilities required for their role, fixed remuneration should move towards the upper end of the range. However, these are merely guidelines and the Company acknowledges that fixed remuneration levels for individual executives may be positioned outside these bands, depending on the experience of the incumbent, market pressures and business needs.
A significant portion of remuneration is performance-based and clearly aligned with annual and longer-term objectives. The desired target remuneration mix for the MD/CEO of 50:20:30 (FR:STI:LTI), and 50:30:20 for other executives.
The MD/CEO and executives’ fixed remuneration has been frozen to enable a transition to the desired remuneration mix. The rate of transition has been impacted by low wages growth and the current state of the economy. In light of these circumstances it has been decided to continue the freeze on executives’ fixed remuneration.
Remuneration mixesIn 2011 the Chairman of the Remuneration and Nomination Committee commissioned Ernst & Young to provide a report which specifically covered the MD/CEO’s total remuneration (comprised of FR, STI and LTI) and to benchmark it against current market remuneration levels. Two comparator groups were used in the benchmarking review, those being 20 companies with market capitalisations ranking above and below Oakton, and an industry group of 6 specifically selected peer companies from the ASX 300 Information Technology Index that are most similar to Oakton’s business and operations.
Ernst & Young’s report noted that the MD/CEO’s total remuneration was between the median and 75th percentile of the market capitalization comparator group, but that the LTI component of the MD/CEO’s existing remuneration was low when compared to the market, and that the FR component was high. The remuneration mix (FR:STI:LTI) of the market capitalization comparator group was 47:19:34. The Board has determined that the target remuneration mix for the MD/CEO should be 50:20:30, with fixed remuneration positioned at the market median, and total remuneration at the 75th percentile in order to encourage out-performance.
The Remuneration and Nominations Committee formulated a transition plan to migrate the MD/CEO’s remuneration arrangements to the desired target remuneration level and mix. For the first year of the transition, commencing on 1 July 2011, the MD/CEO’s remuneration mix was set at 60:16:24 and for the second year 57:15:28 as part of this plan, the fixed remuneration for the MD/CEO of $750,000 had been frozen for a minimum of two years. The Remuneration and Nomination Committee determined that the current market conditions are delaying the transition to the target remuneration mix. Consequently the Board decided to continue the freeze on the fixed remuneration of the MD/CEO for FY2014.
In accordance with the Company’s objective to ensure that executive remuneration is aligned to company performance, a significant portion of executives’ target remuneration is “at risk”. The relative proportion of target FY2013 total remuneration packages split between fixed remuneration, target STI opportunity and target LTI opportunity is shown below:
* Average target remuneration mix of Other Executives
Other Executives*
Fixed
STI
LTI
CEO/MD
100
57%
15%
28%
75%
17%
8%
80
60
40
20
0
26
Oakton Consulting Technology
For
per
sona
l use
onl
y
Fixed remunerationThe remuneration packages for executives contain a fixed component that is not dependent on business performance. Fixed remuneration pays staff for their agreed base performance, job competencies and expectations within a role, and generally consists of base salary, benefits, and superannuation. The company pays superannuation at the required superannuation guarantee rate. Salary sacrificed contributions are paid into an accumulated benefit type fund and therefore there are no future liabilities in respect of these payments.
Apart from retirement benefits which accrue under statute (such as unpaid annual leave, long service leave and superannuation benefits), there are no retirement benefits for executive directors and key management personnel. If required by law, or to protect commercial or competitive rights, amounts may be paid on termination.
There are no guaranteed fixed remuneration increases included in any executives’ contracts.
Short-term incentives (“STI”)STIs are offered to motivate staff to achieve a common set of short-term organisational goals, and provide additional incentives where pre-determined objectives (“metrics”) are achieved. The metrics are derived from the business plan and budget (which are approved by the Board) and are cascaded throughout the Company. The metrics for the financial year related to key initiatives in the areas of delivering financial performance, increasing employee engagement, increased customer satisfaction and delivery of increased returns to shareholders (through quality of earnings and revenue growth).
The target STI opportunity for each employee is expressed as a fixed percentage of fixed remuneration. The MD/CEO has a target STI opportunity of 26% of fixed remuneration, and other members of the executive team had an STI opportunity between 15% – 30% of fixed remuneration. STI targets are reviewed annually as part of the annual remuneration benchmarking process. The total quantum of the STI Pool is determined by the aggregation of the individual participants’ STI opportunity.
The Board is responsible for assessing whether the key performance objectives are met. Assessment of financial performance is based on figures contained within the audited financial statements. Achievement of non-financial metrics is determined by the Board. Additionally, the Board has the discretion to adjust STIs downwards in light of unexpected or unintended circumstances.
Before any STIs are paid out, a base level of financial performance must be achieved. That is, the Company assesses its ability to pay out incentives before considering employees’ performance against personal key performance indicators (KPIs). For FY2013, no STI was payable unless the company met at least 95% of the annual financial objective (for FY2013, this was earnings before interest, taxation, depreciation and amortisation (EBITDA)). 50% of the STI Pool was available between 95% and 99.9% of EBITDA achievement. At 100% EBITDA 100% of the STI Pool is available and where over-achievement occurred, STI would have increased on a linear basis until 125% of the EBITDA target (see table below).
KPIs are weighted 50% towards financial metrics and 50% towards non-financial metrics to ensure that the STI plan is mainly self-funded.
STI Pool Value
% of Financial Target achieved 90.0% 95.0% 99.9% 100.0% 110.0% 120.0% 125.0% 130.0%FY2013: % of STI Pool made available for distribution 0.0% 50.0% 50.0% 100.0% 110.0% 120.0% 125.0% 125.0%
Executives are also assessed on the achievement of individual performance objectives, which are weighted on specific key areas depending on the employee’s role and the Company’s business plan for the year. An individual’s performance objectives are aligned with the strategic plan of the business and cascade down from the objectives of the MD/CEO. They include:
� Financial targets – EBITDA, utilisation, overhead costs; � Customer satisfaction; � Employee engagement – Staff satisfaction, attrition rates; and � Quality of Earnings – Gross margin, project delivery, offshore delivery.
The metrics and STI outcomes in relation to FY2013 were as follows:
MetricPerformance achieved1
Target short term incentive
STI Paid or payable for FY2013
Neil Wilson (MD/CEO)
Business Plan Objectives Non-financial objectives achieved
$200,000(26% of fixed remuneration)
Nil
Karen Lowe (Executive GM, Organisational Capability)
Business Plan Objectives Non-financial objectives achieved
$67,598(19% of fixed remuneration)
Nil
John Phillips (CFO)
Business Plan Objectives Non-financial objectives achieved
$63,735(19% of fixed remuneration)
Nil
1. For FY2013, the Company’s financial performance was less than the level required to generate a short term incentive pool. Individuals may have achieved their individual objectives however no STI will be paid.
27
For
per
sona
l use
onl
y
Directors’ Report continued
Long-term incentives (“LTI”)Carefully designed, performance-linked, equity plans are widely considered to be very effective in providing long-term incentives to staff while aligning incentive outcomes with the interests of shareholders. They are also recognised as being an effective means of attracting and retaining staff by providing them with the opportunity to participate in the creation of a valuable personal asset – a financial stake in the company on a performance tensioned ‘at risk’ basis.
The LTI plan gives the Company the flexibility to grant Options, Performance Rights and/or Share Appreciation Rights (Awards), and the Shareholders’ approved the implementation of this new LTI plan at the annual general meeting held on 5 October 2011.
The Board believes that the grant of Awards under the Plan to eligible participants will underpin the Company’s employment strategy, and will: � maximise the retention of members of the management team and other key operational staff; � enable the Company to attract quality staff in the future; � link the reward of key staff with the achievements of strategic goals and the long term performance objectives of the Company; and � provide incentives to participants of the Plan to focus on superior performance that creates Shareholder value.
During the financial year, LTI grants were made to the MD/CEO and other KMP. Performance Rights were determined to be the most appropriate vehicle as it is one of the most prevalent equity instruments currently used by companies in the market. Performance Rights are also simple in nature and are easily understood by employees as well as by Shareholders. By issuing Performance Rights, employees are better able to perceive the value obtained from Performance Rights (ie. conversion of one right equates to one share in the Company), resulting in better alignment with shareholders’ interests.
Relative Total Shareholder Return (‘TSR’) and absolute Diluted Earnings per Share (‘EPS’) have been chosen as appropriate performance measures and are both commonly used by companies in the ASX100. Further, the use of both a relative and absolute measure ensures that the Company focuses on external and internal performance.
The grant of Performance Rights will vest 50% based on relative TSR performance, and 50% based on absolute EPS performance.
Relative TSR measures the return received by Shareholders from holding shares in the company over the three-year performance period and rewards rights holders where the Company outperforms its peers. For the FY2013 grant, performance is assessed against the performance of companies in the ASX300 (excluding financial services, infrastructure funds and mining/property/manufacturing companies).
Absolute EPS measures the portion of a company’s profit allocated to each outstanding ordinary share and serves as an indicator of a company’s profitability. It is a well-accepted measure of financial performance, is highly visible in the financial statements and its measurement is prescribed by the Accounting Standards. An absolute EPS measure (as opposed to a relative EPS measure) takes into account factors that are unique to a company that other comparator companies may not share.
The details of the performance rights issued during the year are:
Percentage of grant subject to each vesting criteria
Performance period1 Vesting criteria Performance outcome Vesting outcome
50% 3 years Relative Total Shareholder Return Performance2
� <50th percentile � 50th percentile � 50th to 75th percentiles � >75th percentile
� Nil � 50% � 50% to 100% (linear) � 100%
50% 3 years Compound Annual Diluted Earnings per Share growth3
� <10% � 10% � 10% to 15% � >15%
� Nil � 50% � 50% to 100% (linear) � 100%
1. Performance will be tested over a period of 3 years to ensure that sustainable shareholder growth has been created and is in line with current market practice.2. Relative TSR measures the return received by Shareholders from holding shares in the company over the three-year performance period and rewards the MD/CEO where
the Company outperforms its peers. For the FY2013 grant, performance will be assessed against the performance of companies in the ASX300 (excluding financial services, infrastructure funds and mining/property/manufacturing companies).
3. Absolute EPS measures the portion of a company’s profit allocated to each outstanding ordinary share and serves as an indicator of a company’s profitability. An absolute EPS measure (as opposed to a relative EPS measure) takes into account factors that are unique to a company that other comparator companies may not share.
Note that irrespective of relative TSR and absolute EPS performance achieved for the performance period, no Performance Rights will vest if the employee does not remain employed with the group at the third anniversary of the grant date.
28
Oakton Consulting Technology
For
per
sona
l use
onl
y
d. Use of remuneration consultantsNo remuneration consultants were engaged during FY2013 however in prior years remuneration consultants were engaged as noted in the FY2012 remuneration report.
e. Link between performance and remuneration outcomesThe remuneration framework detailed above has been tailored with the objective of attracting and retaining the highest calibre staff who contribute to the success of Oakton, while maintaining alignment between Company performance and individual rewards. The remuneration policies seek a balance between the interests of stakeholders (customers, shareholders and staff) and competitive market remuneration levels.
Performance measure 2013 2012 2011 2010 2009
Net profit (change from prior year) (%) (22.6) (9.7) (35.2) 41.9 (48.4)Dividends paid per share (fully franked) (cents) 10.25 10.5 7.5 4.0 12.8Diluted earnings per share (cents) 10.0 12.6 14.0 21.8 15.9Total Shareholder return1 13.2% (44.7%) (9.8%) 14.0% (29.8%)STI paid to KMP2 $– $– $– $315,000 $20,000
1. Total shareholder return is measured as a combination of share price movements and dividend yield over the applicable financial year2. No STI will be paid to executives in FY2013
The redesigned LTI plan incorporating the vesting conditions of TSR performance and EPS growth further enhances the link between performance and reward.
f. Non-executive director remuneration frameworkThe aggregate remuneration paid to non-executive directors (NED) is capped at $300,000 and was approved by shareholders in 2000. The Remuneration and Nomination Committee is responsible for making recommendations to the Board on the remuneration applicable to non-executive directors. Non-executive directors’ remuneration may reflect the additional tasks that they may undertake from time to time. There are no termination benefits for non-executive directors.
Non-executive directors do not receive any performance-based remuneration.
Effective from 1 July 2012 committee fees will be paid to NEDs who chair a committee in recognition of the additional time and commitment required in undertaking such a role. Committee fees of $10,000 per annum were paid to the chairs of the Audit & Risk Committee and the Remuneration & Nomination Committee during the current financial year. The Chairman is not eligible for committee fees.
Superannuation contributions made by the Company meet the minimum level of superannuation contributions required under any applicable legislation to avoid any penalty, charge, tax or impost.
The following fees have applied in FY2013:
Base feesChair $nilOther non-executive directors $65,000
Additional fees (from 1 July 2012)Audit & Risk Committee Chair $10,000Remuneration & Nomination Committee Chair $10,000
29
For
per
sona
l use
onl
y
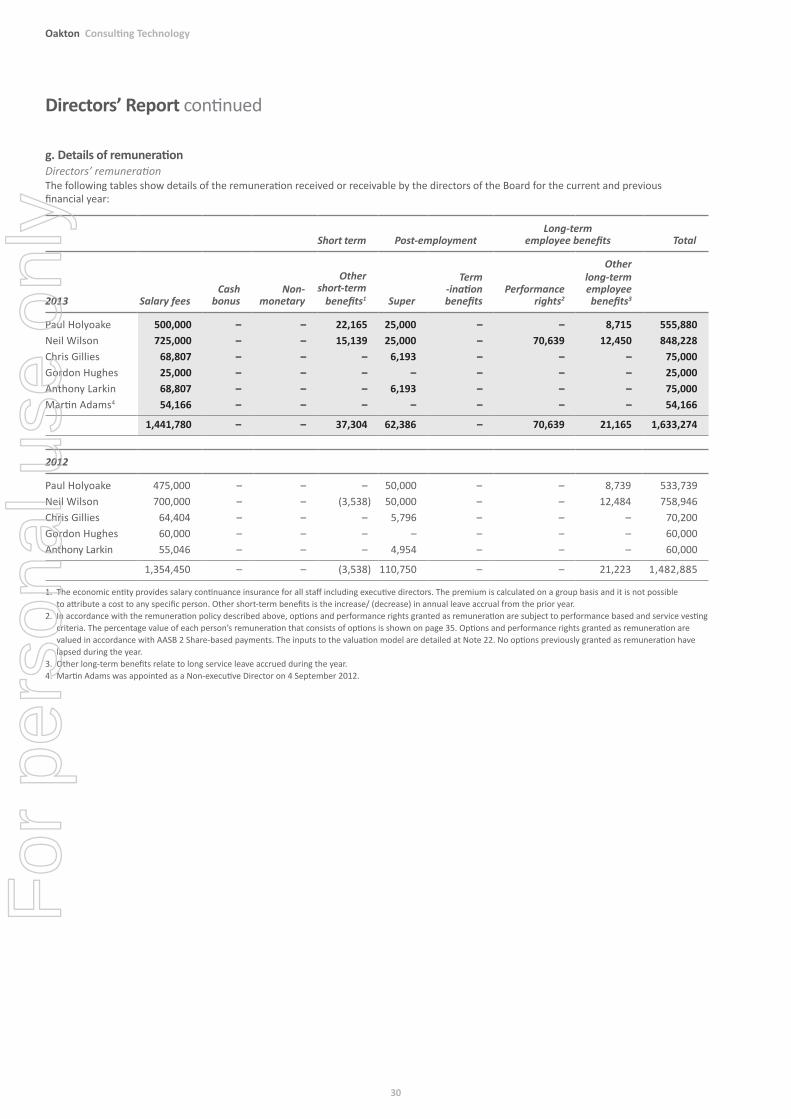
Directors’ Report continued
g. Details of remunerationDirectors’ remunerationThe following tables show details of the remuneration received or receivable by the directors of the Board for the current and previous financial year:
Short term Post-employmentLong-term
employee benefits Total
2013 Salary feesCash
bonusNon-
monetary
Other short-term
benefits1 Super
Term -ination benefits
Performance rights2
Other long-term employee benefits3
Paul Holyoake 500,000 – – 22,165 25,000 – – 8,715 555,880Neil Wilson 725,000 – – 15,139 25,000 – 70,639 12,450 848,228Chris Gillies 68,807 – – – 6,193 – – – 75,000Gordon Hughes 25,000 – – – – – – – 25,000Anthony Larkin 68,807 – – – 6,193 – – – 75,000Martin Adams4 54,166 – – – – – – – 54,166
1,441,780 – – 37,304 62,386 – 70,639 21,165 1,633,274
2012
Paul Holyoake 475,000 – – – 50,000 – – 8,739 533,739Neil Wilson 700,000 – – (3,538) 50,000 – – 12,484 758,946Chris Gillies 64,404 – – – 5,796 – – – 70,200Gordon Hughes 60,000 – – – – – – – 60,000Anthony Larkin 55,046 – – – 4,954 – – – 60,000
1,354,450 – – (3,538) 110,750 – – 21,223 1,482,885
1. The economic entity provides salary continuance insurance for all staff including executive directors. The premium is calculated on a group basis and it is not possible to attribute a cost to any specific person. Other short-term benefits is the increase/ (decrease) in annual leave accrual from the prior year.
2. In accordance with the remuneration policy described above, options and performance rights granted as remuneration are subject to performance based and service vesting criteria. The percentage value of each person’s remuneration that consists of options is shown on page 35. Options and performance rights granted as remuneration are valued in accordance with AASB 2 Share-based payments. The inputs to the valuation model are detailed at Note 22. No options previously granted as remuneration have lapsed during the year.
3. Other long-term benefits relate to long service leave accrued during the year.4. Martin Adams was appointed as a Non-executive Director on 4 September 2012.
30
Oakton Consulting Technology
For
per
sona
l use
onl
y
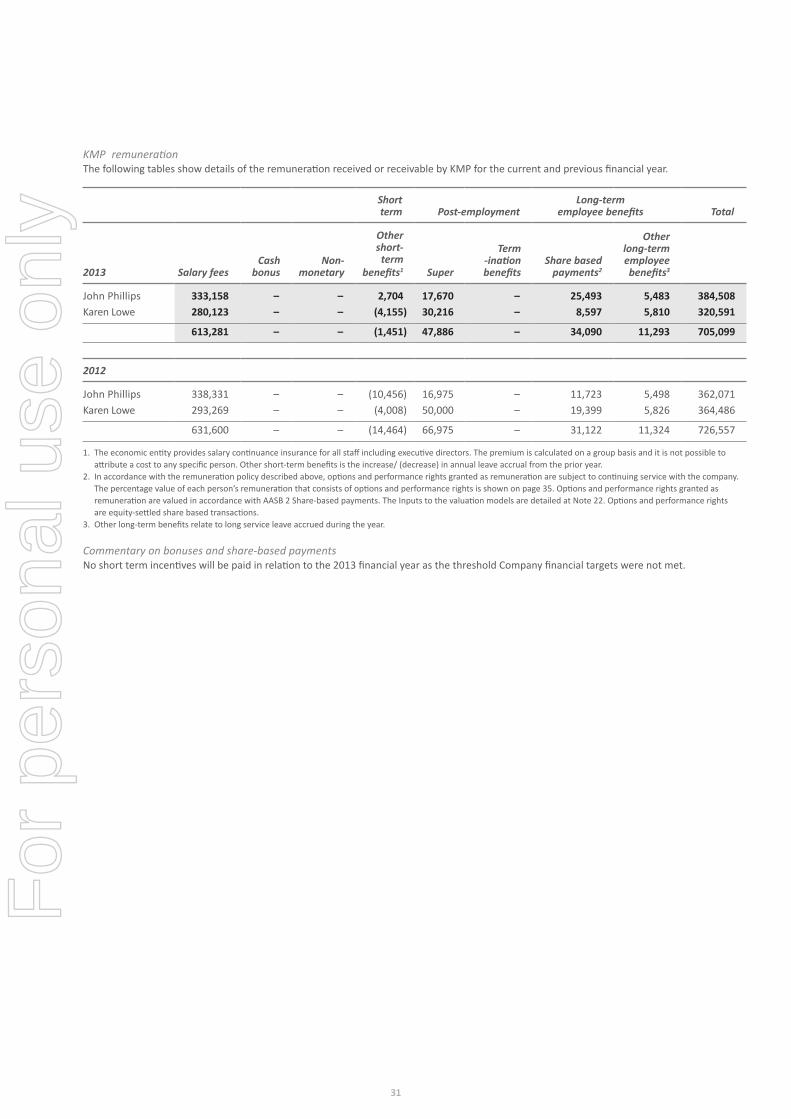
KMP remunerationThe following tables show details of the remuneration received or receivable by KMP for the current and previous financial year.
Short term Post-employment
Long-term employee benefits Total
2013 Salary feesCash
bonusNon-
monetary
Other short-term
benefits1 Super
Term -ination benefits
Share based payments2
Other long-term employee benefits3
John Phillips 333,158 – – 2,704 17,670 – 25,493 5,483 384,508Karen Lowe 280,123 – – (4,155) 30,216 – 8,597 5,810 320,591
613,281 – – (1,451) 47,886 – 34,090 11,293 705,099
2012
John Phillips 338,331 – – (10,456) 16,975 – 11,723 5,498 362,071Karen Lowe 293,269 – – (4,008) 50,000 – 19,399 5,826 364,486
631,600 – – (14,464) 66,975 – 31,122 11,324 726,557
1. The economic entity provides salary continuance insurance for all staff including executive directors. The premium is calculated on a group basis and it is not possible to attribute a cost to any specific person. Other short-term benefits is the increase/ (decrease) in annual leave accrual from the prior year.
2. In accordance with the remuneration policy described above, options and performance rights granted as remuneration are subject to continuing service with the company. The percentage value of each person’s remuneration that consists of options and performance rights is shown on page 35. Options and performance rights granted as remuneration are valued in accordance with AASB 2 Share-based payments. The Inputs to the valuation models are detailed at Note 22. Options and performance rights are equity-settled share based transactions.
3. Other long-term benefits relate to long service leave accrued during the year.
Commentary on bonuses and share-based paymentsNo short term incentives will be paid in relation to the 2013 financial year as the threshold Company financial targets were not met.
31
For
per
sona
l use
onl
y
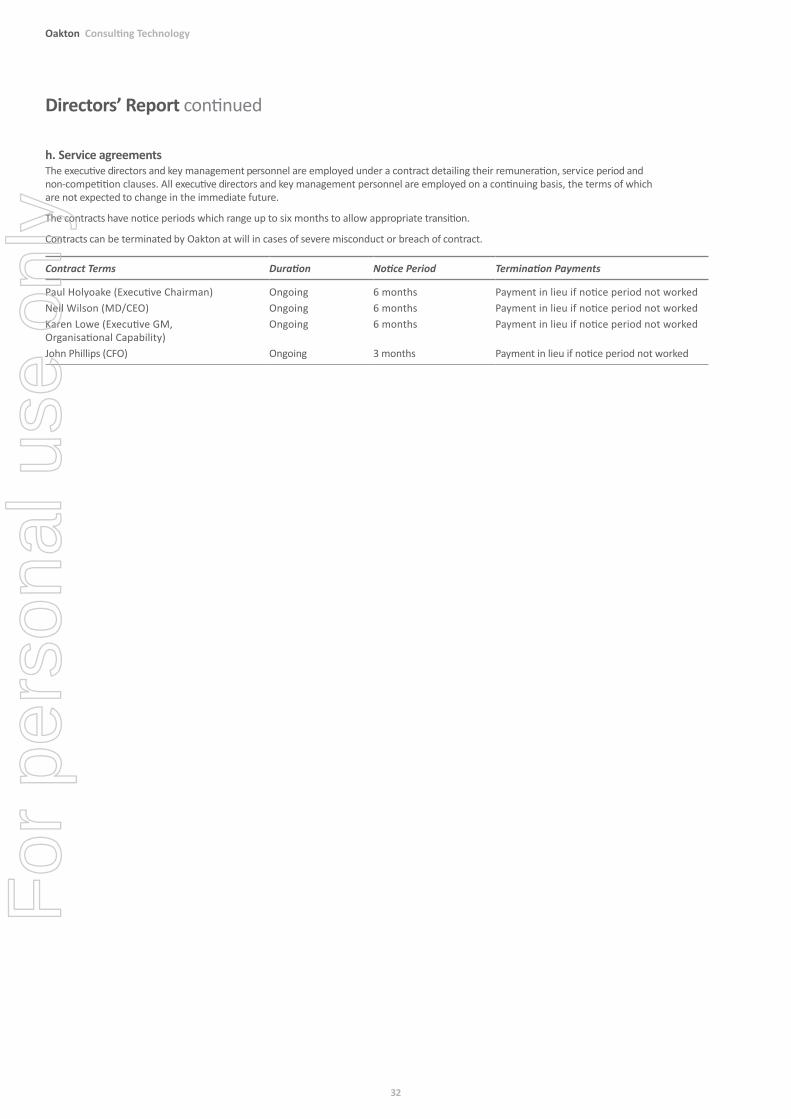
Directors’ Report continued
h. Service agreementsThe executive directors and key management personnel are employed under a contract detailing their remuneration, service period and non-competition clauses. All executive directors and key management personnel are employed on a continuing basis, the terms of which are not expected to change in the immediate future.
The contracts have notice periods which range up to six months to allow appropriate transition.
Contracts can be terminated by Oakton at will in cases of severe misconduct or breach of contract.
Contract Terms Duration Notice Period Termination Payments
Paul Holyoake (Executive Chairman) Ongoing 6 months Payment in lieu if notice period not workedNeil Wilson (MD/CEO) Ongoing 6 months Payment in lieu if notice period not workedKaren Lowe (Executive GM, Organisational Capability)
Ongoing 6 months Payment in lieu if notice period not worked
John Phillips (CFO) Ongoing 3 months Payment in lieu if notice period not worked
32
Oakton Consulting Technology
For
per
sona
l use
onl
y
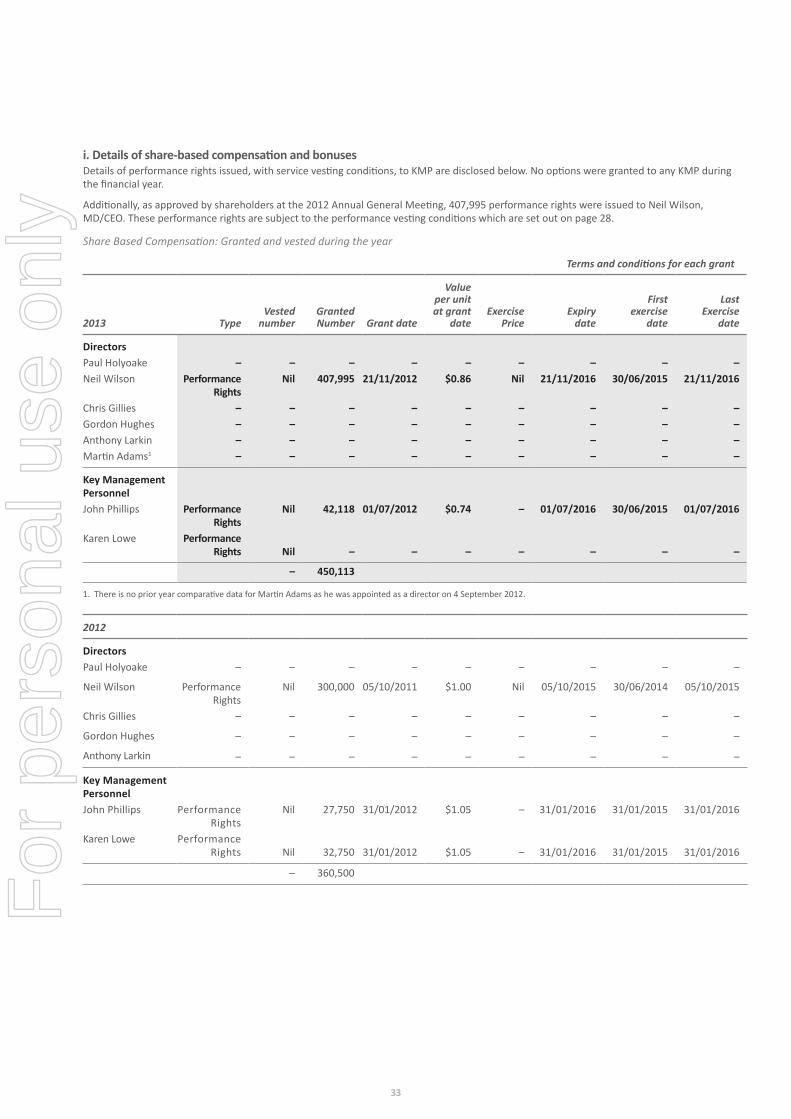
i. Details of share-based compensation and bonusesDetails of performance rights issued, with service vesting conditions, to KMP are disclosed below. No options were granted to any KMP during the financial year.
Additionally, as approved by shareholders at the 2012 Annual General Meeting, 407,995 performance rights were issued to Neil Wilson, MD/CEO. These performance rights are subject to the performance vesting conditions which are set out on page 28.
Share Based Compensation: Granted and vested during the year
Terms and conditions for each grant
2013 TypeVested
numberGranted Number Grant date
Value per unit at grant
dateExercise
PriceExpiry date
First exercise
date
Last Exercise
date
DirectorsPaul Holyoake – – – – – – – – –Neil Wilson Performance
RightsNil 407,995 21/11/2012 $0.86 Nil 21/11/2016 30/06/2015 21/11/2016
Chris Gillies – – – – – – – – –Gordon Hughes – – – – – – – – –Anthony Larkin – – – – – – – – –Martin Adams1 – – – – – – – – –
Key Management PersonnelJohn Phillips Performance
RightsNil 42,118 01/07/2012 $0.74 – 01/07/2016 30/06/2015 01/07/2016
Karen Lowe Performance Rights Nil – – – – – – –
– 450,113
1. There is no prior year comparative data for Martin Adams as he was appointed as a director on 4 September 2012.
2012
DirectorsPaul Holyoake – – – – – – – – –
Neil Wilson Performance Rights
Nil 300,000 05/10/2011 $1.00 Nil 05/10/2015 30/06/2014 05/10/2015
Chris Gillies – – – – – – – – –
Gordon Hughes – – – – – – – – –
Anthony Larkin – – – – – – – – –
Key Management PersonnelJohn Phillips Performance
RightsNil 27,750 31/01/2012 $1.05 – 31/01/2016 31/01/2015 31/01/2016
Karen Lowe Performance Rights Nil 32,750 31/01/2012 $1.05 – 31/01/2016 31/01/2015 31/01/2016
– 360,500
33
For
per
sona
l use
onl
y
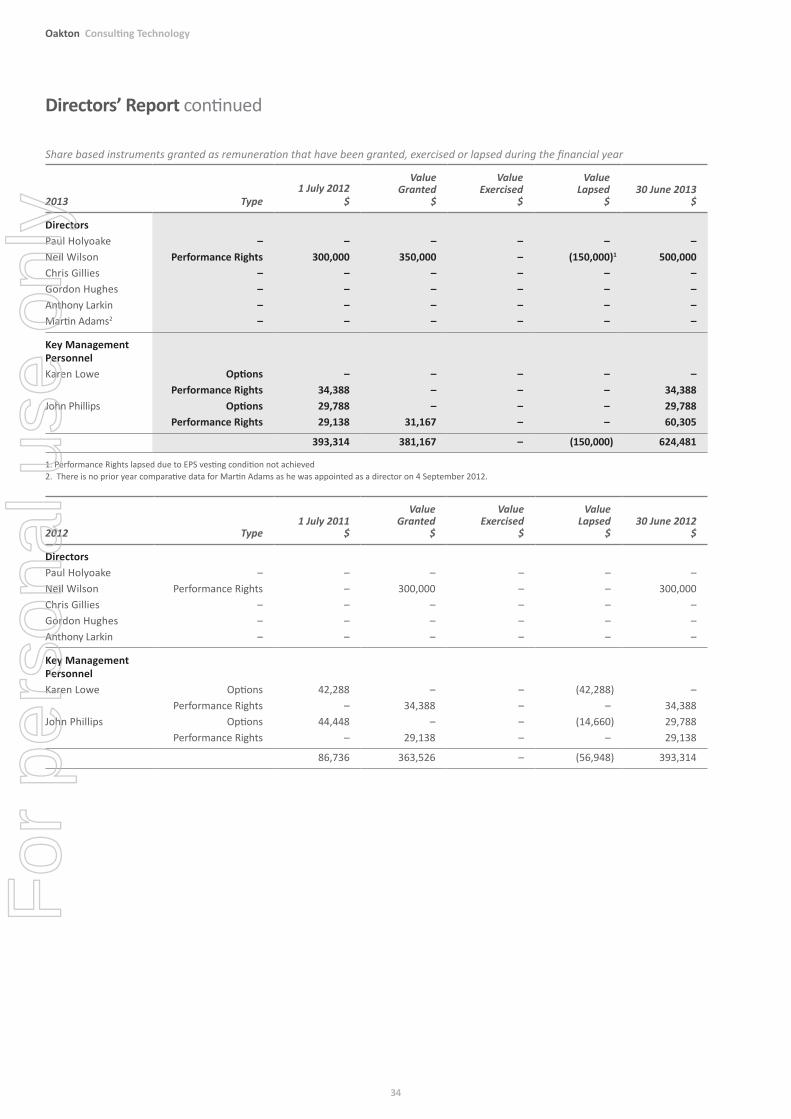
Directors’ Report continued
Share based instruments granted as remuneration that have been granted, exercised or lapsed during the financial year
2013 Type1 July 2012
$
Value Granted
$
Value Exercised
$
Value Lapsed
$30 June 2013
$
DirectorsPaul Holyoake – – – – – –Neil Wilson Performance Rights 300,000 350,000 – (150,000)1 500,000Chris Gillies – – – – – –Gordon Hughes – – – – – –Anthony Larkin – – – – – –Martin Adams2 – – – – – –
Key Management PersonnelKaren Lowe Options – – – – –
Performance Rights 34,388 – – – 34,388John Phillips Options 29,788 – – – 29,788
Performance Rights 29,138 31,167 – – 60,305
393,314 381,167 – (150,000) 624,481
1. Performance Rights lapsed due to EPS vesting condition not achieved2. There is no prior year comparative data for Martin Adams as he was appointed as a director on 4 September 2012.
2012 Type1 July 2011
$
Value Granted
$
Value Exercised
$
Value Lapsed
$30 June 2012
$
DirectorsPaul Holyoake – – – – – –Neil Wilson Performance Rights – 300,000 – – 300,000Chris Gillies – – – – – –Gordon Hughes – – – – – –Anthony Larkin – – – – – –
Key Management PersonnelKaren Lowe Options 42,288 – – (42,288) –
Performance Rights – 34,388 – – 34,388John Phillips Options 44,448 – – (14,660) 29,788
Performance Rights – 29,138 – – 29,138
86,736 363,526 – (56,948) 393,314
34
Oakton Consulting Technology
For
per
sona
l use
onl
y
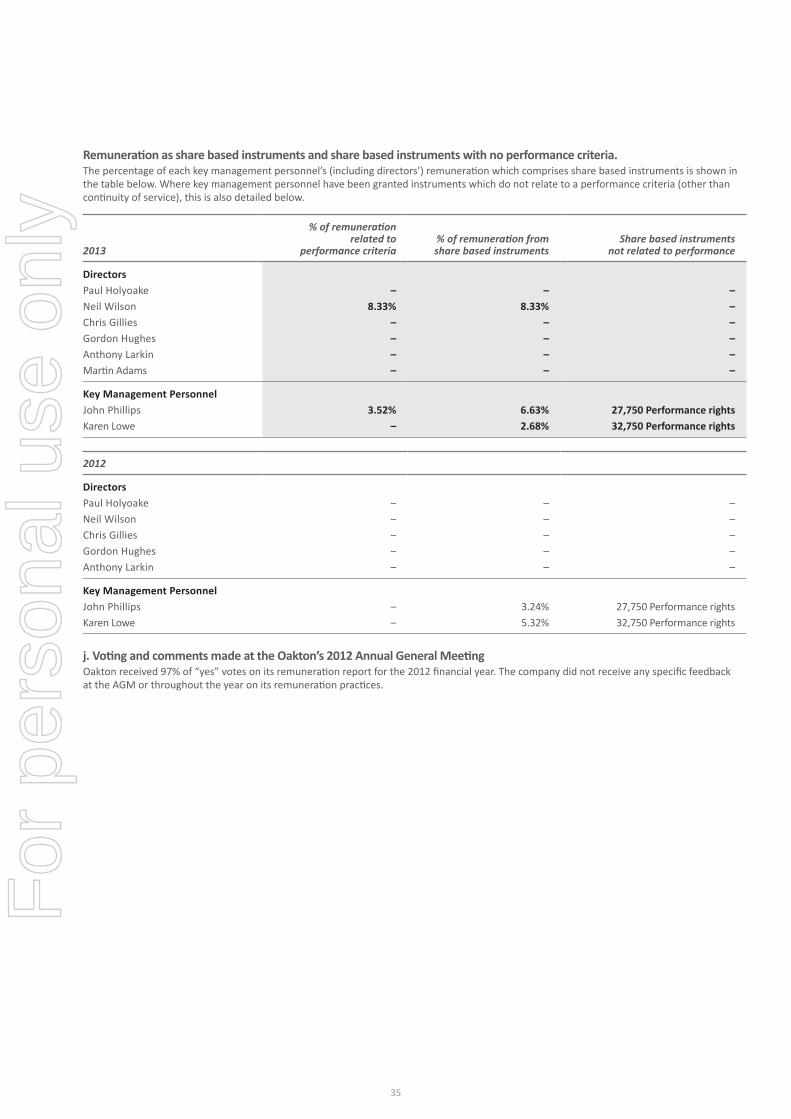
Remuneration as share based instruments and share based instruments with no performance criteria.The percentage of each key management personnel’s (including directors’) remuneration which comprises share based instruments is shown in the table below. Where key management personnel have been granted instruments which do not relate to a performance criteria (other than continuity of service), this is also detailed below.
2013
% of remuneration related to
performance criteria% of remuneration from share based instruments
Share based instruments not related to performance
DirectorsPaul Holyoake – – –Neil Wilson 8.33% 8.33% –Chris Gillies – – –Gordon Hughes – – –Anthony Larkin – – –Martin Adams – – –
Key Management PersonnelJohn Phillips 3.52% 6.63% 27,750 Performance rightsKaren Lowe – 2.68% 32,750 Performance rights
2012
DirectorsPaul Holyoake – – –Neil Wilson – – –Chris Gillies – – –Gordon Hughes – – –Anthony Larkin – – –
Key Management PersonnelJohn Phillips – 3.24% 27,750 Performance rightsKaren Lowe – 5.32% 32,750 Performance rights
j. Voting and comments made at the Oakton’s 2012 Annual General MeetingOakton received 97% of “yes” votes on its remuneration report for the 2012 financial year. The company did not receive any specific feedback at the AGM or throughout the year on its remuneration practices.
35
For
per
sona
l use
onl
y
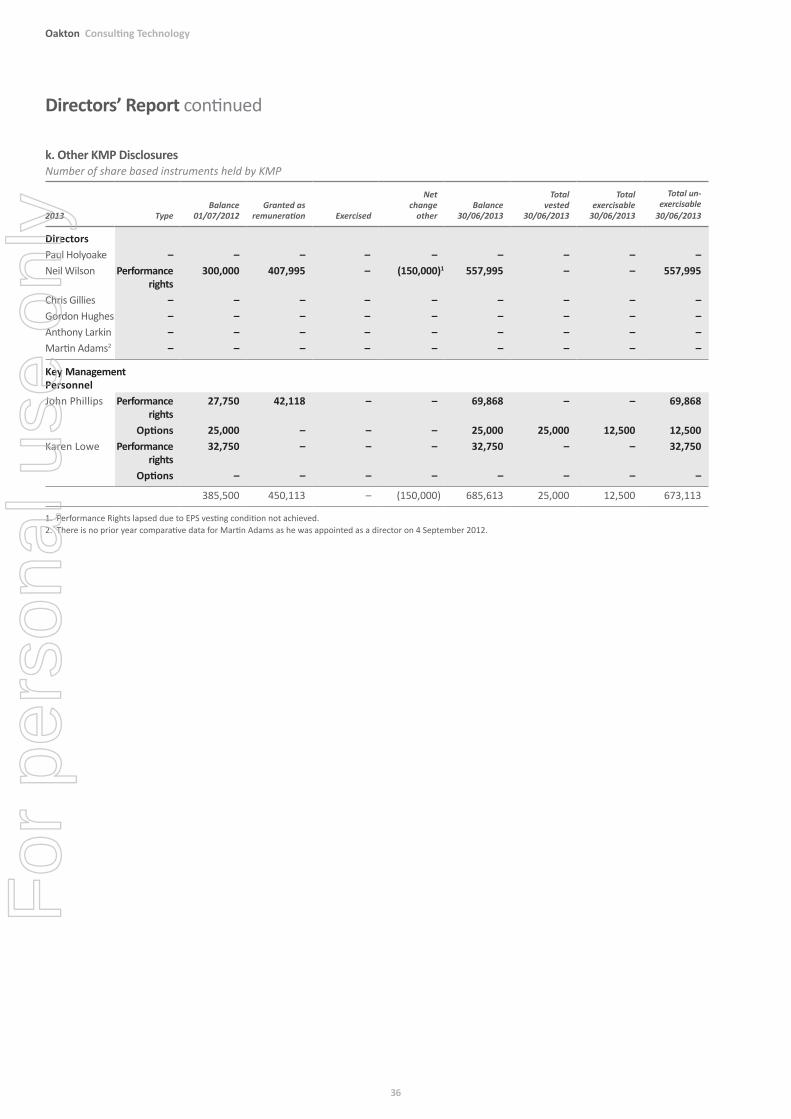
Directors’ Report continued
k. Other KMP DisclosuresNumber of share based instruments held by KMP
2013 TypeBalance
01/07/2012Granted as
remuneration Exercised
Net change
otherBalance
30/06/2013
Total vested
30/06/2013
Total exercisable
30/06/2013
Total un- exercisable
30/06/2013
DirectorsPaul Holyoake – – – – – – – – –Neil Wilson Performance
rights300,000 407,995 – (150,000)1 557,995 – – 557,995
Chris Gillies – – – – – – – – –Gordon Hughes – – – – – – – – –Anthony Larkin – – – – – – – – –Martin Adams2 – – – – – – – – –
Key Management PersonnelJohn Phillips Performance
rights27,750 42,118 – – 69,868 – – 69,868
Options 25,000 – – – 25,000 25,000 12,500 12,500Karen Lowe Performance
rights32,750 – – – 32,750 – – 32,750
Options – – – – – – – –
385,500 450,113 – (150,000) 685,613 25,000 12,500 673,113
1. Performance Rights lapsed due to EPS vesting condition not achieved.2. There is no prior year comparative data for Martin Adams as he was appointed as a director on 4 September 2012.
36
Oakton Consulting Technology
For
per
sona
l use
onl
y
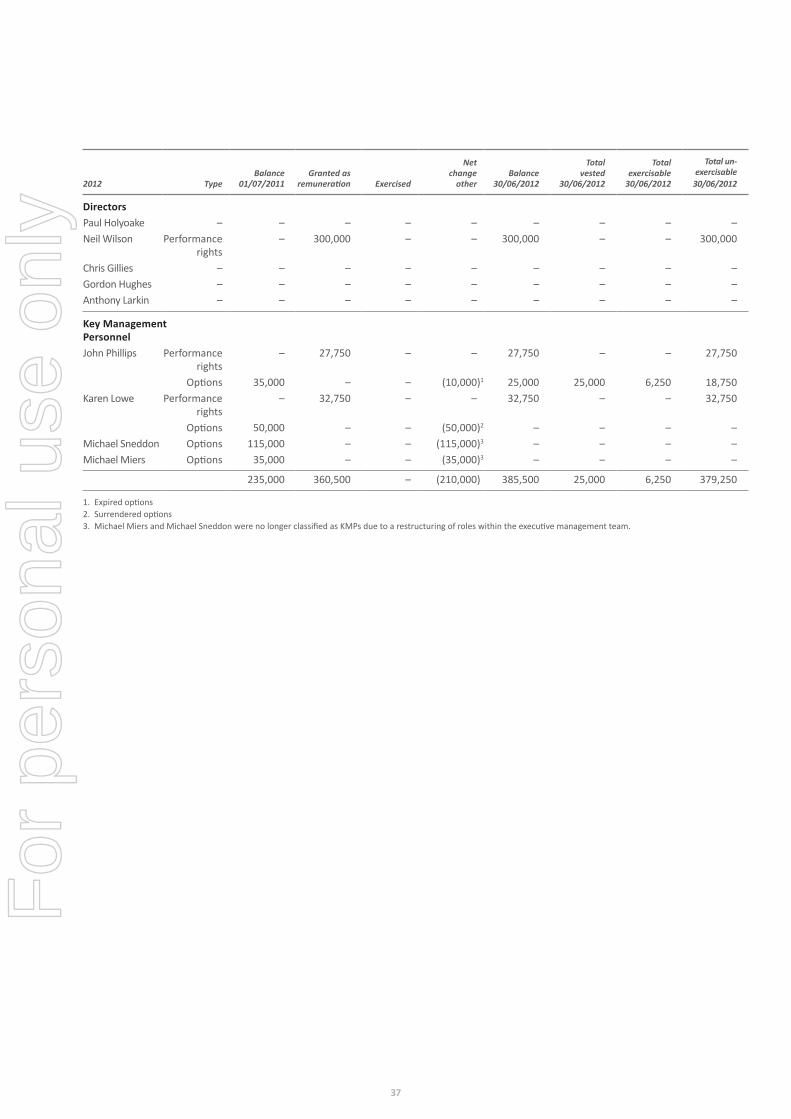
2012 TypeBalance
01/07/2011Granted as
remuneration Exercised
Net change
otherBalance
30/06/2012
Total vested
30/06/2012
Total exercisable
30/06/2012
Total un- exercisable
30/06/2012
DirectorsPaul Holyoake – – – – – – – – –Neil Wilson Performance
rights– 300,000 – – 300,000 – – 300,000
Chris Gillies – – – – – – – – –Gordon Hughes – – – – – – – – –Anthony Larkin – – – – – – – – –
Key Management PersonnelJohn Phillips Performance
rights– 27,750 – – 27,750 – – 27,750
Options 35,000 – – (10,000)1 25,000 25,000 6,250 18,750Karen Lowe Performance
rights– 32,750 – – 32,750 – – 32,750
Options 50,000 – – (50,000)2 – – – –Michael Sneddon Options 115,000 – – (115,000)3 – – – –Michael Miers Options 35,000 – – (35,000)3 – – – –
235,000 360,500 – (210,000) 385,500 25,000 6,250 379,250
1. Expired options2. Surrendered options3. Michael Miers and Michael Sneddon were no longer classified as KMPs due to a restructuring of roles within the executive management team.
37
For
per
sona
l use
onl
y
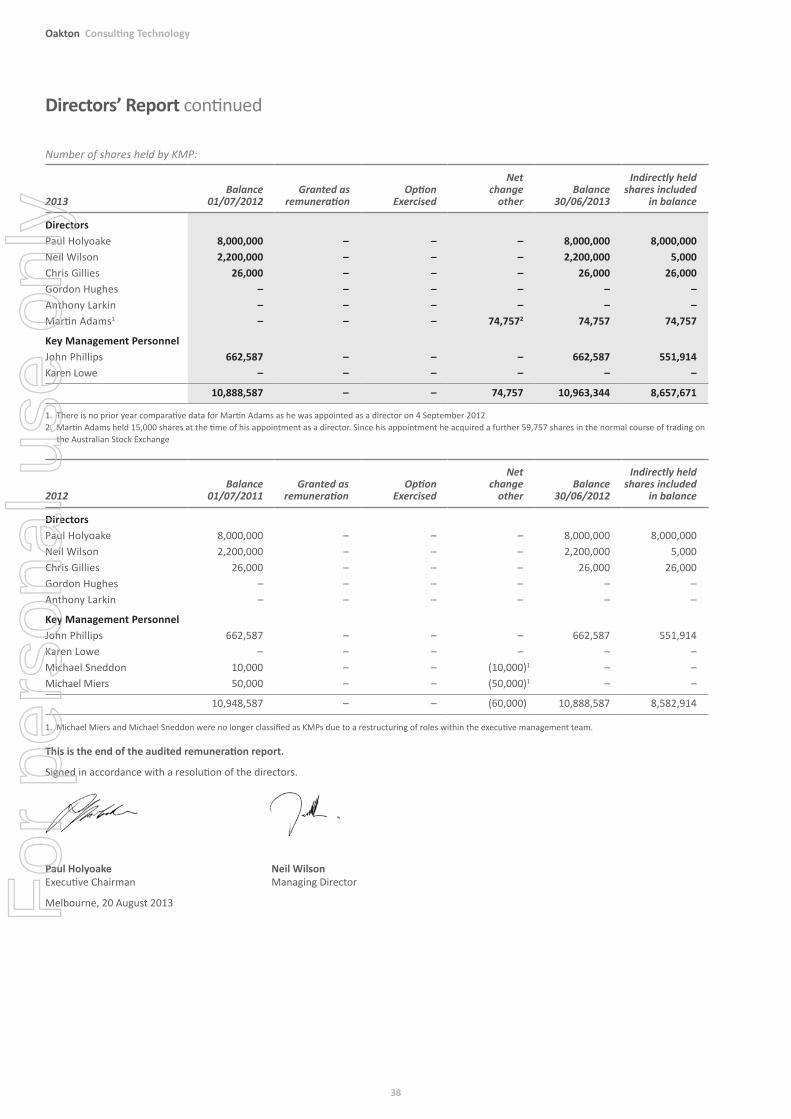
Directors’ Report continued
Number of shares held by KMP:
2013Balance
01/07/2012Granted as
remunerationOption
Exercised
Net change
otherBalance
30/06/2013
Indirectly held shares included
in balance
DirectorsPaul Holyoake 8,000,000 – – – 8,000,000 8,000,000Neil Wilson 2,200,000 – – – 2,200,000 5,000Chris Gillies 26,000 – – – 26,000 26,000Gordon Hughes – – – – – –Anthony Larkin – – – – – –Martin Adams1 – – – 74,7572 74,757 74,757
Key Management PersonnelJohn Phillips 662,587 – – – 662,587 551,914Karen Lowe – – – – – –
10,888,587 – – 74,757 10,963,344 8,657,671
1. There is no prior year comparative data for Martin Adams as he was appointed as a director on 4 September 20122. Martin Adams held 15,000 shares at the time of his appointment as a director. Since his appointment he acquired a further 59,757 shares in the normal course of trading on
the Australian Stock Exchange
2012Balance
01/07/2011Granted as
remunerationOption
Exercised
Net change
otherBalance
30/06/2012
Indirectly held shares included
in balance
DirectorsPaul Holyoake 8,000,000 – – – 8,000,000 8,000,000Neil Wilson 2,200,000 – – – 2,200,000 5,000Chris Gillies 26,000 – – – 26,000 26,000Gordon Hughes – – – – – –Anthony Larkin – – – – – –
Key Management PersonnelJohn Phillips 662,587 – – – 662,587 551,914Karen Lowe – – – – – –Michael Sneddon 10,000 – – (10,000)1 – –Michael Miers 50,000 – – (50,000)1 – –
10,948,587 – – (60,000) 10,888,587 8,582,914
1. Michael Miers and Michael Sneddon were no longer classified as KMPs due to a restructuring of roles within the executive management team.
This is the end of the audited remuneration report.
Signed in accordance with a resolution of the directors.
Paul Holyoake Neil Wilson Executive Chairman Managing Director
Melbourne, 20 August 2013
38
Oakton Consulting Technology
For
per
sona
l use
onl
y
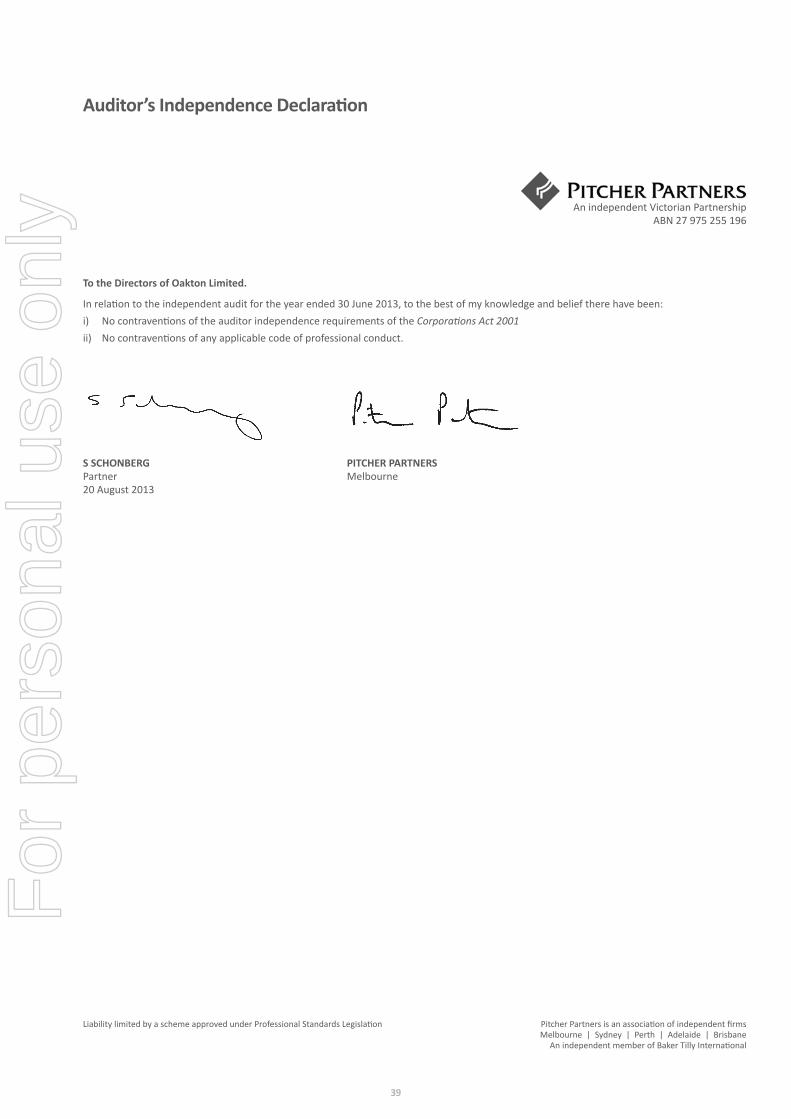
Auditor’s Independence Declaration
An independent Victorian Partnership ABN 27 975 255 196
To the Directors of Oakton Limited.
In relation to the independent audit for the year ended 30 June 2013, to the best of my knowledge and belief there have been:i) No contraventions of the auditor independence requirements of the Corporations Act 2001ii) No contraventions of any applicable code of professional conduct.
S SCHONBERG PITCHER PARTNERS Partner Melbourne 20 August 2013
Liability limited by a scheme approved under Professional Standards Legislation Pitcher Partners is an association of independent firms Melbourne | Sydney | Perth | Adelaide | Brisbane An independent member of Baker Tilly International
39
For
per
sona
l use
onl
y
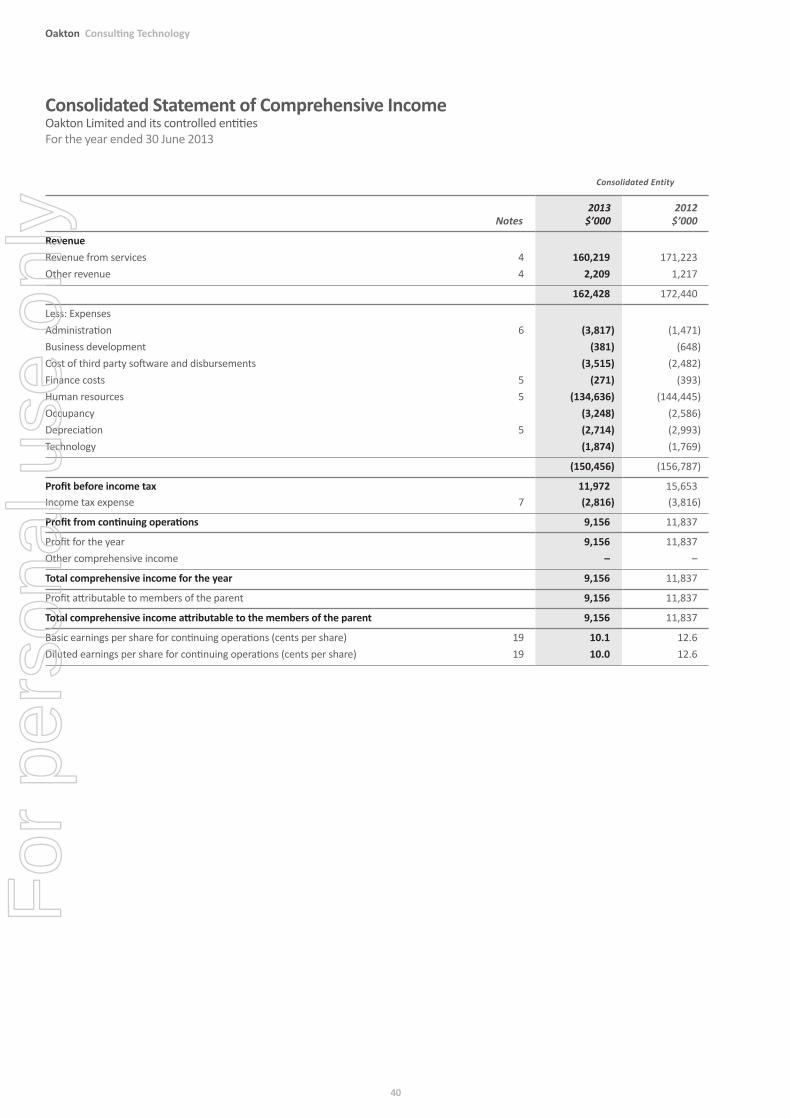
Consolidated Statement of Comprehensive IncomeOakton Limited and its controlled entities For the year ended 30 June 2013
Consolidated Entity
Notes 2013
$’000 2012
$’000
RevenueRevenue from services 4Other revenue 4
160,2192,209
171,223 1,217
162,428 172,440
Less: ExpensesAdministration 6Business developmentCost of third party software and disbursementsFinance costs 5Human resources 5OccupancyDepreciation 5Technology
(3,817)(381)
(3,515)(271)
(134,636)(3,248)(2,714)(1,874)
(1,471) (648)
(2,482) (393)
(144,445)(2,586)(2,993)(1,769)
(150,456) (156,787)
Profit before income tax 11,972 15,653Income tax expense 7 (2,816) (3,816)
Profit from continuing operations 9,156 11,837
Profit for the yearOther comprehensive income
9,156 –
11,837 –
Total comprehensive income for the year 9,156 11,837
Profit attributable to members of the parent 9,156 11,837
Total comprehensive income attributable to the members of the parent 9,156 11,837
Basic earnings per share for continuing operations (cents per share) 19Diluted earnings per share for continuing operations (cents per share) 19
10.1 10.0
12.6 12.6
40
Oakton Consulting Technology
For
per
sona
l use
onl
y
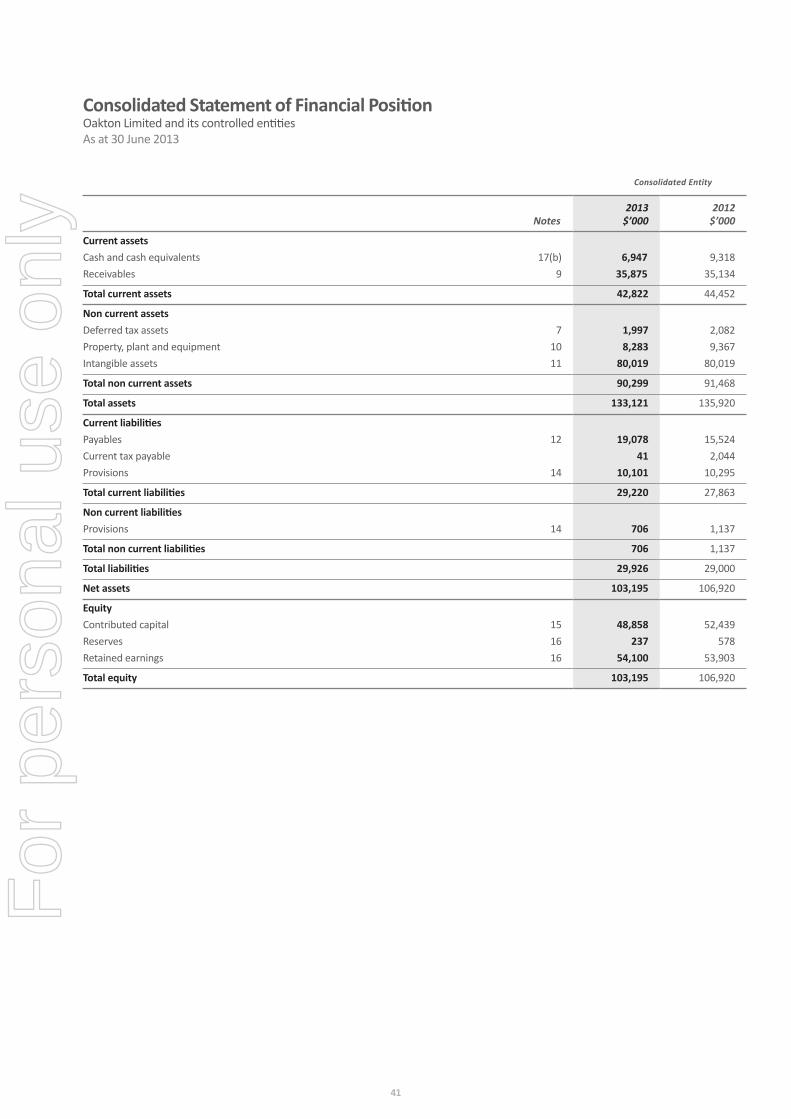
Consolidated Statement of Financial PositionOakton Limited and its controlled entitiesAs at 30 June 2013
Consolidated Entity
Notes 2013
$’000 2012
$’000
Current assetsCash and cash equivalents 17(b) Receivables 9
6,947 35,875
9,318 35,134
Total current assets 42,822 44,452
Non current assetsDeferred tax assets 7Property, plant and equipment 10Intangible assets 11
1,997 8,283
80,019
2,082 9,367
80,019
Total non current assets 90,299 91,468
Total assets 133,121 135,920
Current liabilitiesPayables 12Current tax payableProvisions 14
19,078 41
10,101
15,524 2,044
10,295
Total current liabilities 29,220 27,863
Non current liabilitiesProvisions 14 706 1,137
Total non current liabilities 706 1,137
Total liabilities 29,926 29,000
Net assets 103,195 106,920
EquityContributed capital 15Reserves 16Retained earnings 16
48,858 237
54,100
52,439 578
53,903
Total equity 103,195 106,920
41
For
per
sona
l use
onl
y
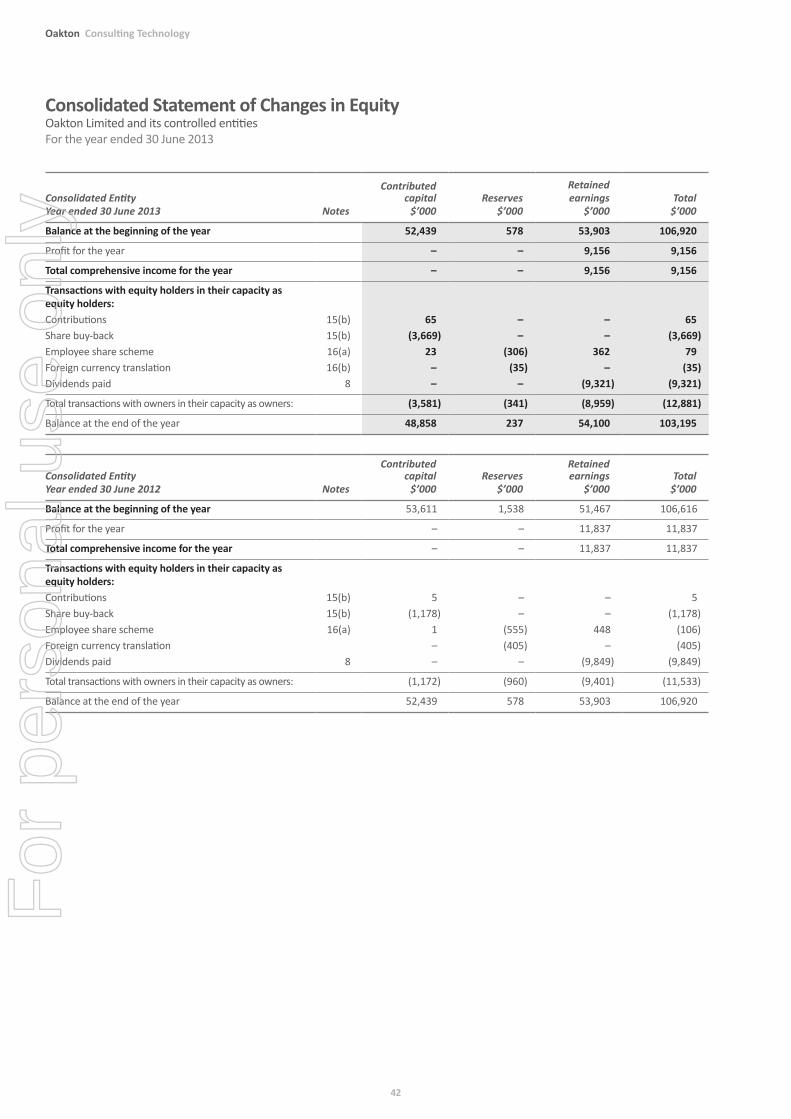
Consolidated Statement of Changes in EquityOakton Limited and its controlled entitiesFor the year ended 30 June 2013
Consolidated Entity Year ended 30 June 2013 Notes
Contributed capital
$’000 Reserves
$’000
Retained earnings
$’000 Total
$’000
Balance at the beginning of the year 52,439 578 53,903 106,920
Profit for the year – – 9,156 9,156
Total comprehensive income for the year – – 9,156 9,156
Transactions with equity holders in their capacity as equity holders:Contributions 15(b) 65 – – 65Share buy-back 15(b) (3,669) – – (3,669) Employee share scheme 16(a) 23 (306) 362 79Foreign currency translation 16(b) – (35) – (35) Dividends paid 8 – – (9,321) (9,321)
Total transactions with owners in their capacity as owners: (3,581) (341) (8,959) (12,881)
Balance at the end of the year 48,858 237 54,100 103,195
Consolidated Entity Year ended 30 June 2012 Notes
Contributed capital
$’000 Reserves
$’000
Retained earnings
$’000 Total
$’000
Balance at the beginning of the year 53,611 1,538 51,467 106,616
Profit for the year – – 11,837 11,837
Total comprehensive income for the year – – 11,837 11,837
Transactions with equity holders in their capacity as equity holders:Contributions 15(b) 5 – – 5Share buy-back 15(b) (1,178) – – (1,178) Employee share scheme 16(a) 1 (555) 448 (106) Foreign currency translation – (405) – (405) Dividends paid 8 – – (9,849) (9,849)
Total transactions with owners in their capacity as owners: (1,172) (960) (9,401) (11,533)
Balance at the end of the year 52,439 578 53,903 106,920
42
Oakton Consulting Technology
For
per
sona
l use
onl
y
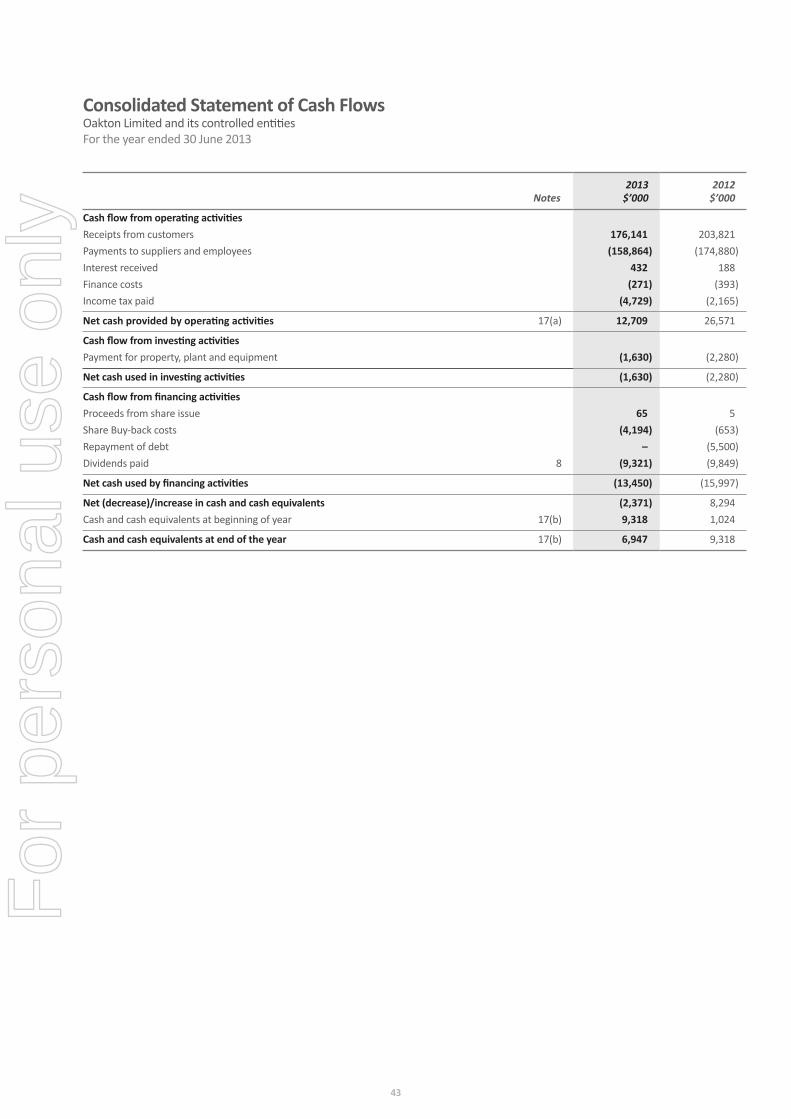
Notes 2013
$’000 2012
$’000
Cash flow from operating activitiesReceipts from customersPayments to suppliers and employeesInterest receivedFinance costsIncome tax paid
176,141(158,864)
432(271)
(4,729)
203,821(174,880)
188 (393)
(2,165)
Net cash provided by operating activities 17(a) 12,709 26,571
Cash flow from investing activitiesPayment for property, plant and equipment (1,630) (2,280)
Net cash used in investing activities (1,630) (2,280)
Cash flow from financing activitiesProceeds from share issue Share Buy-back costs Repayment of debtDividends paid 8
65(4,194)
– (9,321)
5(653)
(5,500)(9,849)
Net cash used by financing activities (13,450) (15,997)
Net (decrease)/increase in cash and cash equivalentsCash and cash equivalents at beginning of year 17(b)
(2,371) 9,318
8,294 1,024
Cash and cash equivalents at end of the year 17(b) 6,947 9,318
Consolidated Statement of Cash FlowsOakton Limited and its controlled entitiesFor the year ended 30 June 2013
43
For
per
sona
l use
onl
y
Notes to the Financial StatementsOakton Limited and its controlled entities For the year ended 30 June 2013
1. Statement of significant accounting policiesThe following is a summary of material accounting policies adopted by the consolidated entity in the preparation and presentation of the financial report. The accounting policies have been consistently applied, unless otherwise stated.
a. Basis of preparation of the financial reportThis financial report is a general purpose financial report that has been prepared in accordance with Australian Accounting Standards, Interpretations and other authoritative pronouncements of the Australian Accounting Standards Board and the Corporations Act 2001.
The financial report covers Oakton Limited and controlled entities as a consolidated entity. Oakton Limited is a company limited by shares, incorporated and domiciled in Australia.
The financial report was authorised for issue by the directors on 20 August 2013.
Compliance with IFRSThe consolidated financial statements of Oakton Limited also comply with International Financial Reporting Standards (IFRS) as issued by the International Accounting Standards Board (IASB).
Historical cost conventionThe financial report has been prepared under the historical cost convention, as modified by revaluations to fair value for certain classes of assets, as described in the accounting policies.
Critical Accounting EstimatesThe preparation of the financial report requires the use of certain estimates and judgements in applying the consolidated entity’s accounting policies. These estimates and judgements significant to the financial report are disclosed at Note 2.
b. Principles of consolidationThe consolidated financial statements are those of the consolidated entity, comprising the financial statements of the parent entity and of all entities, which Oakton Limited has the power to control the financial and operating policies so as to obtain benefits from its activities. Details of the controlled entities are contained in Note 24(a).
The financial statements of subsidiaries are prepared for the same reporting period as the parent entity, using consistent accounting policies. Adjustments are made to bring into line any dissimilar accounting policies, which may exist.
All inter-company balances and transactions, including any unrealised profits or losses have been eliminated on consolidation. Subsidiaries are fully consolidated from the date on which control is established. They are de-consolidated from the date that control ceases.
c. Revenue recognitionRevenue from the provision of services to a customer is recognised upon performance of the service. Accrued revenue arising from recognised revenue is transferred to trade receivables when tax invoices are raised. Certain customers may be invoiced in advance of provision of services and this amount is recognised as a liability until the service is performed. Revenue from the sale of products is recognised when the product is delivered. Revenue from fixed price contracts is recognised by reference to the stage of completion.
The stage of completion is determined using inputs from Oakton’s professional project management methodology, including effort expended and cost to complete.
Interest revenue is recognised when it becomes receivable on a pro-rata basis taking into account the interest rates applicable to the financial assets.
Dividend revenue is recognised when the right to receive a dividend has been established. Dividends received from associates and joint ventures are accounted for in accordance with the equity method.
Other revenue includes Research and Development (“R&D”) concessions received or receivable in respect of eligible R&D as registered with AusIndustry. The R&D concession is brought to account when the eligible R&D has been quantified.
All revenue is stated net of the amount of goods and services tax (GST).
d. Cash and cash equivalentsCash and cash equivalents include cash on hand and at banks. Bank overdrafts are shown within short-term borrowings in current liabilities on the balance sheet.
e. Plant and equipmentCost and valuationPlant and equipment are stated at cost less depreciation and any accumulated impairment losses.
Software developed is capitalised and depreciated when it can be demonstrated that the asset is available for use. The cost of this asset comprises all directly attributable costs.
The carrying amount of plant and equipment is reviewed for impairment when events or changes in circumstances indicate the carrying value may not be recoverable. If any such indication exists and where the carrying value exceeds the estimated recoverable amount, the assets are written down to their recoverable amount. Impairment losses are recognised in the income statement.
DepreciationThe depreciable amounts of plant and equipment are depreciated on a straight-line basis or reducing balance method over their estimated useful lives commencing from the time the asset is held ready for use. Leasehold improvements are depreciated over the shorter of either the unexpired period of the lease or the estimated useful lives of the improvements.
The useful lives for each class of assets are:
2013 2012
Leasehold improvementsSoftware developedPlant and equipment
Up to 6 yearsUp to 5 years
2 to 6 years
Up to 6 yearsUp to 5 years
2 to 6 years
f. LeasesLeases are classified at their inception as either operating or finance leases based on the economic substance of the agreement so as to reflect the risks and benefits incidental to ownership.
Operating leasesLease payments for operating leases, are recognised as expenses on a straight line basis over the term of the lease.
44
Oakton Consulting Technology
For
per
sona
l use
onl
y
g. IntangiblesGoodwillGoodwill on consolidation represents the excess of the cost of an acquisition over the fair value of the consolidated entity’s share of net identifiable assets of the acquired entities at the date of acquisition.
Goodwill is not amortised but is tested annually for impairment, or more frequently if events or changes in circumstances indicate that it might be impaired. Goodwill is carried at cost less accumulated impairment losses.
h. Impairment of assetsAssets subject to annual depreciation or amortisation are reviewed for impairment whenever events or circumstances arise that indicate that the carrying amount of the asset may be impaired.
An impairment loss is recognised where the carrying amount of the asset exceeds its recoverable amount. The recoverable amount of an asset is defined as the higher of its fair value less costs to sell and value in use.
i. Income taxCurrent income tax expense or revenue is the tax payable or receivable on the current period’s taxable income based on the applicable income tax rate adjusted by changes in deferred tax assets and liabilities.
A balance sheet approach is adopted under which deferred tax assets and liabilities are recognised for temporary differences between the tax bases of assets and liabilities and their carrying amounts in the financial statements. No deferred tax asset or liability is recognised in relation to temporary differences arising from the initial recognition of an asset or a liability if they arose in a transaction, other than a business combination, that at the time of the transaction did not affect either accounting profit or taxable profit or loss.
Deferred tax assets are recognised for deductible temporary differences and unused tax losses only when it is probable that future taxable amounts will be available to utilise those temporary differences and losses.
Current and deferred tax balances attributable to amounts recognised directly in equity are also recognised directly in equity.
Tax consolidationThe parent entity and its Australian controlled entities have formed an income tax consolidated group under the tax consolidation legislation. The parent entity is responsible for recognising the current tax liabilities and deferred tax assets arising in respect of tax losses for the consolidated group. The tax consolidated group has also entered a tax funding agreement whereby each company in the group contributes to the income tax payable in proportion to their contribution to the net profit before tax of the tax consolidated group.
j. ProvisionsProvisions are recognised when the consolidated entity has a legal or constructive obligation, as a result of past events, for which it is probable that an outflow of economic benefits will result and that outflow can be reliably measured.
k. Employee benefitsLiabilities arising in respect of wages and salaries, annual leave and any other employee benefits expected to be settled within 12 months of the reporting date are measured at their nominal amounts based on remuneration rates which are expected to be paid when the liability is settled. All other employee benefit liabilities are measured at the present value of the estimated future cash outflow to be made in respect of services provided by employees up to the reporting date. Provision for long service leave is classified as current where the employee is entitled to be compensated for the leave within 12 months of them rendering the service and there is no unconditional right of deferral.
Defined contribution superannuation fundThe consolidated entity makes contributions to defined contribution superannuation plans in respect of employee services rendered during the year. These superannuation contributions are recognised as an expense in the same period as the employee services are received.
Share-based paymentsThe consolidated entity operates an employee equity incentive plan. The value of equity rights (Options, Performance Rights and Share Appreciation Rights) is recognised as an expense in the Income Statement in the period(s) when the benefit is earned.
The total amount to be expensed over the vesting period is determined by reference to the fair value of the equity rights at grant date. The fair value of options at grant date is determined using a Black-Scholes option pricing model, and is recognised as an employee expense over the period during which the employees become entitled to the equity rights.
l. Research and developmentResearch expenditure is recognised as an expense. Costs incurred on development projects are recognised as intangible assets when it is probable that the project will, after considering its commercial and technical feasibility, be completed and generate future economic benefits and its costs can be measured reliably. Refer also Note 1(c).
m. Borrowing costsBorrowing cost can include interest, amortisation of discounts relating to borrowings, ancillary costs incurred in connection with arrangement of borrowings. Borrowing costs are expensed as incurred.
n. Financial instrumentsClassificationThe consolidated entity classifies its financial instruments in the following categories: financial assets at fair value through profit or loss, loans and receivables, held-to-maturity investments, and available-for-sale financial assets. The classification depends on the purpose for which the investments were acquired. Management determines the classification of its investments at initial recognition.
Non-derivative financial instrumentsNon-derivative financial instruments consist of trade and other receivables, cash, loans and borrowings, and trade and other payables.
Non-derivative financial instruments are initially recognised at fair value, plus directly attributable transaction costs (if any). After initial recognition, non-derivative financial instruments are measured as described below.
45
For
per
sona
l use
onl
y
Notes to the Financial Statements continuedOakton Limited and its controlled entities For the year ended 30 June 2013
Loans and receivablesLoans and receivables are measured at fair value at inception. Outstanding balances are tested for impairment when overdue.
Financial liabilitiesFinancial liabilities include trade payables, other creditors and loans from third parties including inter-company balances. Non-derivative financial liabilities are recognised at amortised cost, comprising original debt less principal payments and amortisation.
o. Foreign currenciesFunctional and presentation currencyThe financial statements of each entity in the consolidated entity are measured using its functional currency, which is the currency of the primary economic environment in which that entity operates. The consolidated financial statements are presented in Australian dollars, as this is the parent entity’s functional and presentation currency.
Transactions and balancesTransactions in foreign currencies of entities within the consolidated entity are translated into functional currency at the rate of exchange ruling at the date of the transaction.
Foreign currency monetary items that are outstanding at the reporting date (other than monetary items arising under foreign currency contracts where the exchange rate for that monetary item is fixed in the contract) are translated using the spot rate at the end of the financial year.
Resulting exchange differences arising on settlement or restatement are recognised as revenues and expenses for the financial year.
p. Goods and Services Tax (‘GST’)Revenues, expenses and assets are recognised net of the amount of GST, except where the amount of GST incurred is not recoverable from the Tax Office. In these circumstances, GST is recognised as part of the cost of acquisition of the asset or as part of an item of expense. Receivables and payables in the statement of financial position are shown inclusive of GST.
Cash flows are presented in the statement of cash flows on a gross basis, except for the GST component of investing and financing activities, which are disclosed as operating cash flows.
q. ComparativesWhere necessary, comparative information has been reclassified and repositioned for consistency with current year disclosures.
r. Rounding amountsThe consolidated entity is of a kind referred to in ASIC Class Order CO 98/0100 and in accordance with that Class Order, amounts in the consolidated financial statements and directors’ report have been rounded off to the nearest thousand dollars, or in certain cases, to the nearest dollar.
s. New accounting standards and interpretationsA number of accounting standards and interpretations have been issued at the reporting date but are not yet effective. The directors have assessed the impact of those standards or interpretations and are satisfied that there will be no material impact on the financial statements.
2. Critical accounting estimates and judgementsCertain accounting estimates include assumptions concerning the future, which, by definition, will seldom represent actual results. Estimates and assumptions based on future events have a significant inherent risk, and where future events are not as anticipated there could be a material impact on the carrying value of the assets and liabilities discussed below:
a. Impairment of goodwillGoodwill is allocated to cash generating units (CGUs) according to applicable business operations. In the 2013 and 2012 financial years, Oakton had one CGU. The recoverable amount of a CGU is based on value-in-use calculations. These calculations are based on projected cash flows approved by management covering a period not exceeding five years. Management’s determination of cash flow projections and gross margins are based on past performance and its expectation for the future. The present value of future cash flows has been calculated using a discount rate of 12.75% (2012: 12.75%) and a growth rate of 2.5% (2012: 4.0%) per annum to determine value-in-use.
b. Income taxesIncome tax benefits are based on the assumption that no adverse change will occur in the income tax legislation and the anticipation that the consolidated entity will derive sufficient future assessable income to enable the benefit to be realised and comply with the conditions of deductibility imposed by the law.
c. Employee benefitsCalculation of long-term employment benefits requires estimation of the retention of staff, future remuneration levels and timing of the settlement of the benefits. The estimates are based on historical trends.
d. Share based paymentsCalculation of share based payments requires estimation of the timing of the exercise of the underlying equity instrument. The estimates are based on historical trends.
46
Oakton Consulting Technology
For
per
sona
l use
onl
y
3. Financial risk managementThe consolidated entity’s financial instruments consist mainly of deposits and borrowings with banks and accounts receivable and payable. The main purpose of non-derivative financial instruments is to raise finance for group operations.
The key financial risks that the consolidated entity is exposed to are interest rate risk, liquidity risk and credit risk. The consolidated entity has no material exposure to currency risk or market price risk.
The consolidated entity manages its financial risk exposure in addition to the business risks managed and described in the Corporate Governance Statement detailed on pages 16 to 20. Financial risk is managed by the Chief Executive Officer and the Chief Financial Officer and routinely reported to the Board of Directors. The objective of the financial risk management policy is to support the delivery of the consolidated entity’s financial and business targets.
Interest rate riskInterest rate risk is the risk that the fair value or future cash flows of a financial instrument will fluctuate as a result of changes in market interest rates.
The consolidated entity’s exposure to market interest rates relates primarily to it’s cash balances and debt obligations. The balance of cash is disclosed in note 17 and the level of debt is disclosed in note 13.
The group maintains a $20 million (2012: $20 million) facility comprising bank bill debt which is at a variable interest rate. The rate at year end was 3.80% (2012: 4.49%).
Cash on deposit attracts a variable interest rate which was 2.75% (2012: 3.6%) at year end.
The Group constantly monitors its interest rate exposure with consideration given to hedging positions if considered necessary.
Based on debt drawn during the year, if interest rates had changed by +/- one percentage point from the year end rates of 3.80% (2012: 4.49%) (with all other variables held constant) after-tax profits would have been $4,944 lower/higher (2012: $5,556).
Credit riskCredit risk is the risk that one party to a financial instrument will cause a financial loss for the other party by failing to discharge an obligation.
The maximum exposure to credit risk at balance date to recognised financial assets, is the carrying amount, net of any provisions for impairment of those assets, as disclosed in the consolidated statement of financial position and notes to the consolidated financial statements.
The consolidated entity does not have any material credit risk exposure to any single receivable or group of receivables under financial instruments entered into by the consolidated entity. The concentration of revenue with Australian Governments noted in Note 25(b) does not create material credit risk exposure. The percentage of receivables relating to Australian Governments is 34.7% (2012: 33.1%) at balance date and the counterparty has a low risk of default.
The consolidated entity trades only with recognised, creditworthy third parties across a range of industries. All potential customers who trade on credit terms are subject to credit verification procedures. Receivable balances are monitored on an on-going basis and close relationships are maintained with customers. The result is that the exposure to bad debts is immaterial.
Currency riskCurrency risk is the risk that the fair value or future cash flows of a financial instrument will fluctuate because of changes in foreign exchange rates.
The consolidated entity is not currently exposed to any material fluctuations in foreign currencies.
Liquidity riskLiquidity risk is the risk that an entity will encounter difficulty in meeting obligations associated with financial liabilities.
The consolidated entity manages liquidity risk by forecasting and monitoring cash flows on a continuing basis. Its interest bearing facilities (refer note 17 (c)) of $20 million will be subject to review in June 2014. The facility is not subject to amortisation.
Refer note 17(c) for details of unused finance facilities at balance date.
Fair valueThe fair value of financial assets and financial liabilities approximates their carrying amounts as disclosed in the consolidated statement of financial position and notes to the consolidated financial statements.
47
For
per
sona
l use
onl
y
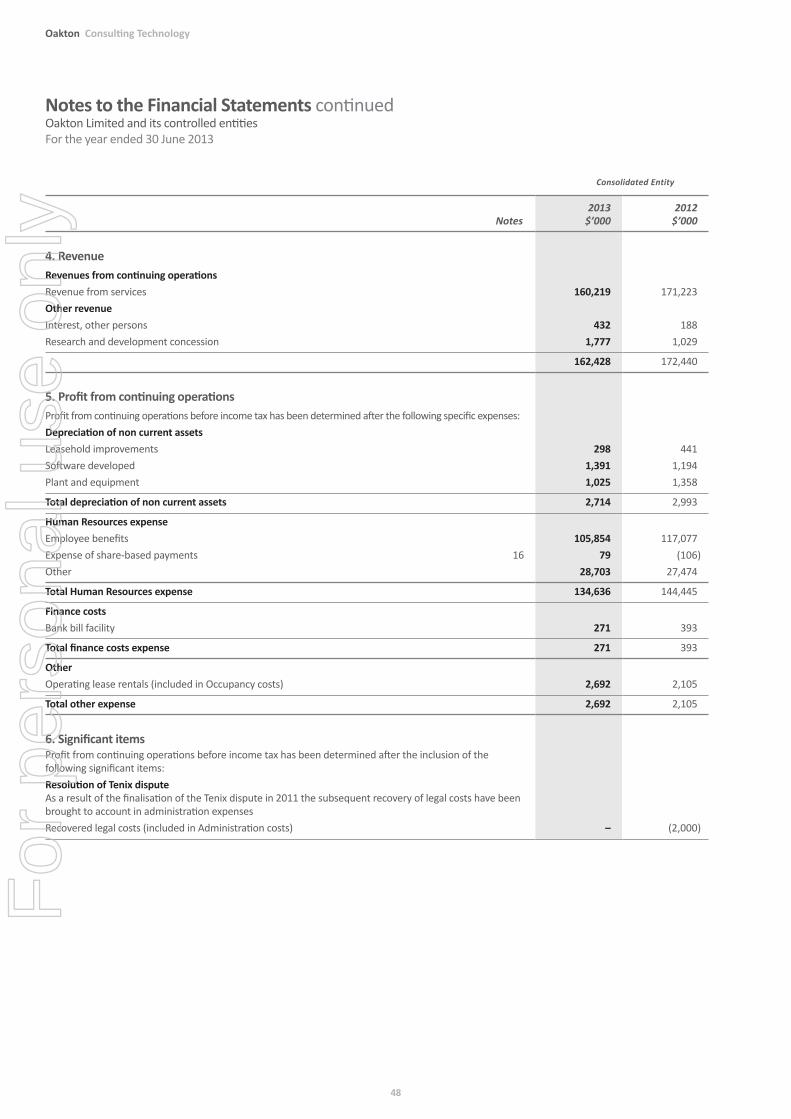
Notes to the Financial Statements continuedOakton Limited and its controlled entities For the year ended 30 June 2013
Consolidated Entity
Notes 2013
$’000 2012
$’000
4. RevenueRevenues from continuing operationsRevenue from services Other revenueInterest, other personsResearch and development concession
160,219
432 1,777
171,223
188 1,029
162,428 172,440
5. Profit from continuing operationsProfit from continuing operations before income tax has been determined after the following specific expenses:Depreciation of non current assetsLeasehold improvementsSoftware developedPlant and equipment
298 1,391 1,025
441 1,194 1,358
Total depreciation of non current assets 2,714 2,993
Human Resources expenseEmployee benefitsExpense of share-based payments 16Other
105,854 79
28,703
117,077 (106)
27,474
Total Human Resources expense 134,636 144,445
Finance costsBank bill facility 271 393
Total finance costs expense 271 393
OtherOperating lease rentals (included in Occupancy costs) 2,692 2,105
Total other expense 2,692 2,105
6. Significant itemsProfit from continuing operations before income tax has been determined after the inclusion of the following significant items:Resolution of Tenix dispute As a result of the finalisation of the Tenix dispute in 2011 the subsequent recovery of legal costs have been brought to account in administration expenses Recovered legal costs (included in Administration costs)
–
(2,000)
48
Oakton Consulting Technology
For
per
sona
l use
onl
y
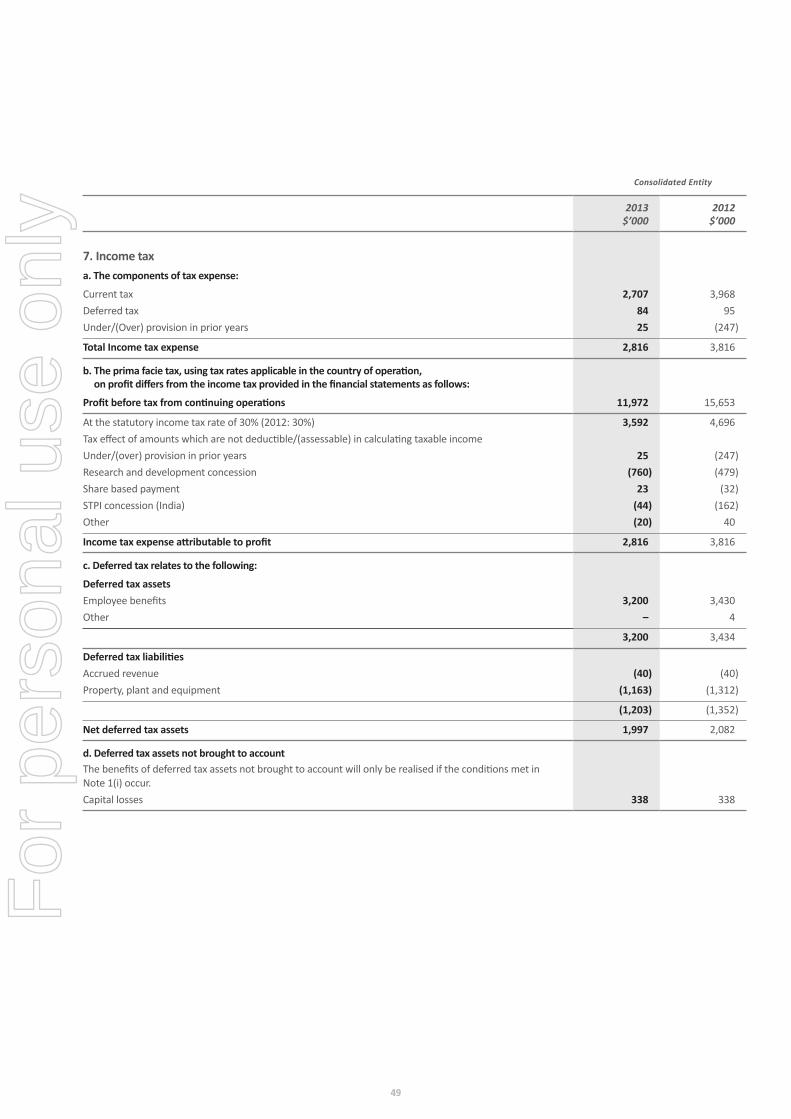
Consolidated Entity
2013 $’000
2012 $’000
7. Income taxa. The components of tax expense:
Current taxDeferred taxUnder/(Over) provision in prior years
2,707 84 25
3,968 95
(247)
Total Income tax expense 2,816 3,816
b. The prima facie tax, using tax rates applicable in the country of operation, on profit differs from the income tax provided in the financial statements as follows:
Profit before tax from continuing operations 11,972 15,653
At the statutory income tax rate of 30% (2012: 30%)Tax effect of amounts which are not deductible/(assessable) in calculating taxable incomeUnder/(over) provision in prior yearsResearch and development concessionShare based paymentSTPI concession (India)Other
3,592
25 (760)
23 (44) (20)
4,696
(247) (479)
(32) (162)
40
Income tax expense attributable to profit 2,816 3,816
c. Deferred tax relates to the following:
Deferred tax assets Employee benefits Other
3,200–
3,430 4
3,200 3,434
Deferred tax liabilitiesAccrued revenueProperty, plant and equipment
(40) (1,163)
(40) (1,312)
(1,203) (1,352)
Net deferred tax assets 1,997 2,082
d. Deferred tax assets not brought to accountThe benefits of deferred tax assets not brought to account will only be realised if the conditions met in Note 1(i) occur.Capital losses 338 338
49
For
per
sona
l use
onl
y
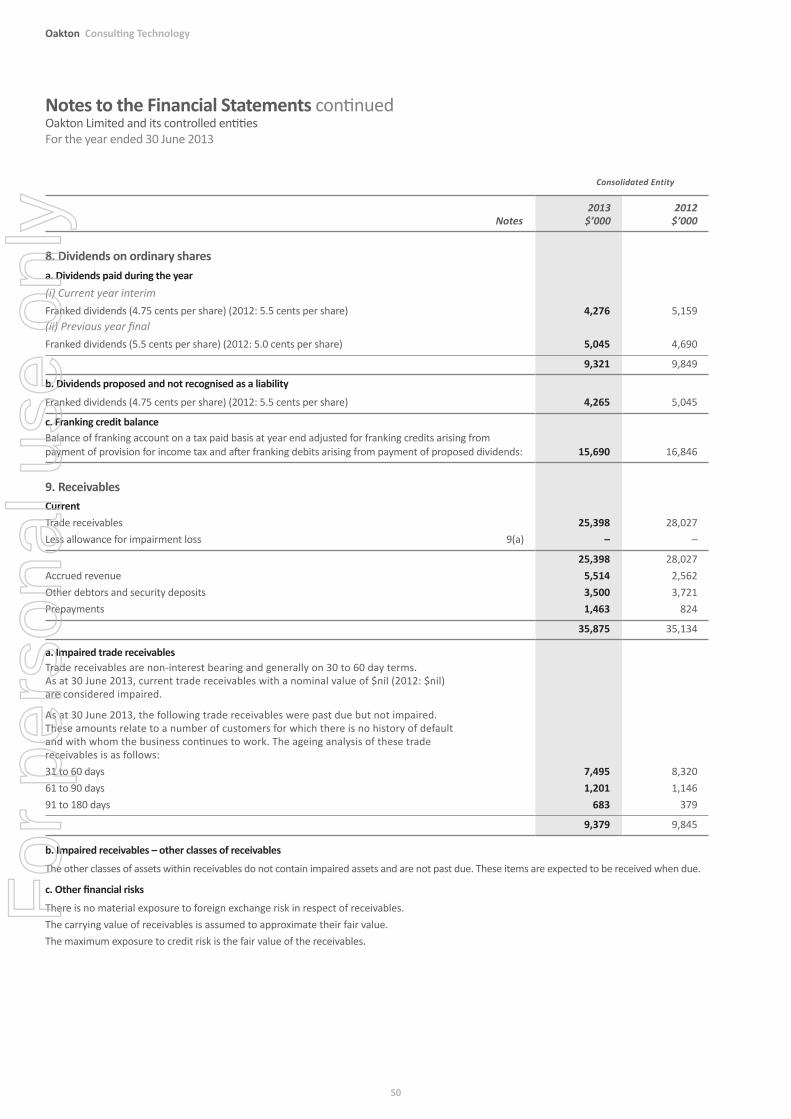
Notes to the Financial Statements continuedOakton Limited and its controlled entities For the year ended 30 June 2013
Consolidated Entity
Notes 2013
$’000 2012
$’000
8. Dividends on ordinary sharesa. Dividends paid during the year(i) Current year interimFranked dividends (4.75 cents per share) (2012: 5.5 cents per share)(ii) Previous year finalFranked dividends (5.5 cents per share) (2012: 5.0 cents per share)
4,276
5,045
5,159
4,690
9,321 9,849
b. Dividends proposed and not recognised as a liability
Franked dividends (4.75 cents per share) (2012: 5.5 cents per share) 4,265 5,045
c. Franking credit balanceBalance of franking account on a tax paid basis at year end adjusted for franking credits arising from payment of provision for income tax and after franking debits arising from payment of proposed dividends: 15,690 16,846
9. ReceivablesCurrentTrade receivablesLess allowance for impairment loss 9(a)
25,398 –
28,027 –
Accrued revenueOther debtors and security depositsPrepayments
25,398 5,514 3,500 1,463
28,027 2,562 3,721
824
35,875 35,134
a. Impaired trade receivablesTrade receivables are non-interest bearing and generally on 30 to 60 day terms. As at 30 June 2013, current trade receivables with a nominal value of $nil (2012: $nil) are considered impaired.
As at 30 June 2013, the following trade receivables were past due but not impaired. These amounts relate to a number of customers for which there is no history of default and with whom the business continues to work. The ageing analysis of these trade receivables is as follows:31 to 60 days61 to 90 days91 to 180 days
7,495 1,201
683
8,320 1,146
379
9,379 9,845
b. Impaired receivables – other classes of receivables
The other classes of assets within receivables do not contain impaired assets and are not past due. These items are expected to be received when due.
c. Other financial risks
There is no material exposure to foreign exchange risk in respect of receivables. The carrying value of receivables is assumed to approximate their fair value. The maximum exposure to credit risk is the fair value of the receivables.
50
Oakton Consulting Technology
For
per
sona
l use
onl
y
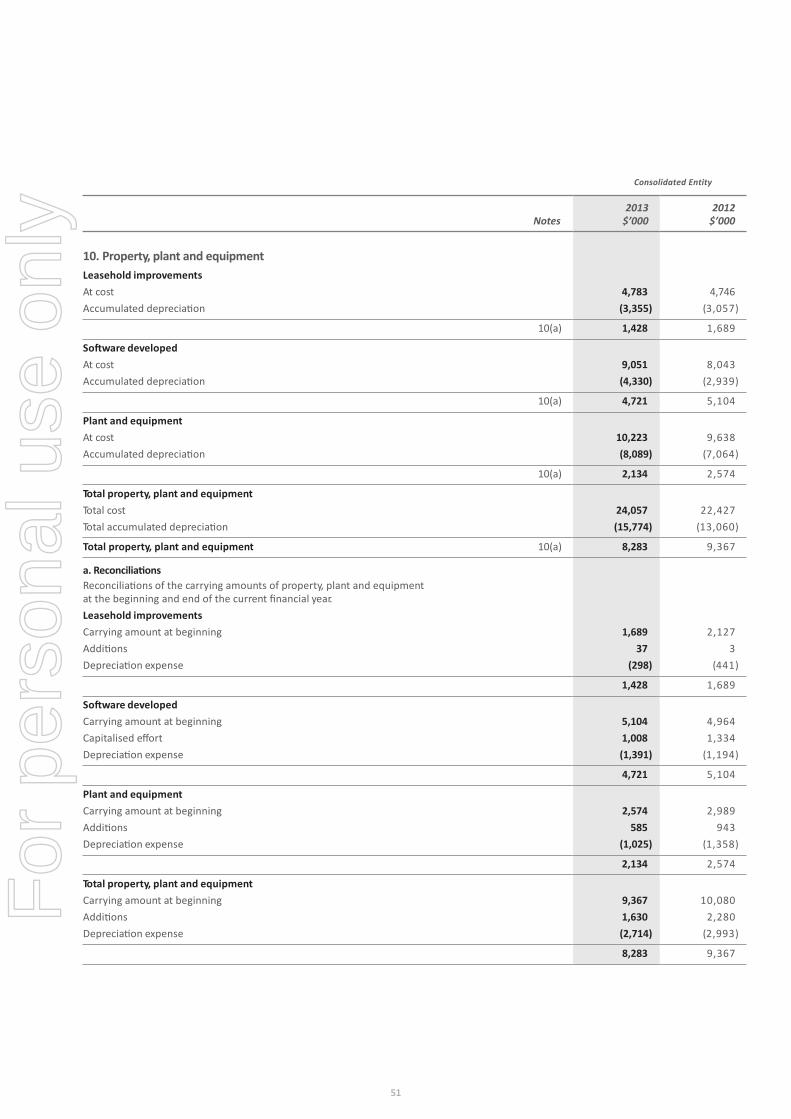
Consolidated Entity
Notes 2013
$’000 2012
$’000
10. Property, plant and equipmentLeasehold improvementsAt costAccumulated depreciation
4,783 (3,355)
4,746 (3,057)
10(a) 1,428 1,689
Software developedAt costAccumulated depreciation
9,051(4,330)
8,043 (2,939)
10(a) 4,721 5,104
Plant and equipmentAt costAccumulated depreciation
10,223(8,089)
9,638 (7,064)
10(a) 2,134 2,574
Total property, plant and equipmentTotal costTotal accumulated depreciation
24,057(15,774)
22,427 (13,060)
Total property, plant and equipment 10(a) 8,283 9,367
a. ReconciliationsReconciliations of the carrying amounts of property, plant and equipment at the beginning and end of the current financial year.Leasehold improvements Carrying amount at beginning AdditionsDepreciation expense
1,689 37
(298)
2,127 3
(441)
1,428 1,689
Software developedCarrying amount at beginningCapitalised effortDepreciation expense
5,104 1,008(1,391)
4,964 1,334
(1,194)
4,721 5,104
Plant and equipmentCarrying amount at beginningAdditionsDepreciation expense
2,574 585
(1,025)
2,989 943
(1,358)
2,134 2,574
Total property, plant and equipment Carrying amount at beginning AdditionsDepreciation expense
9,367 1,630(2,714)
10,080 2,280
(2,993)
8,283 9,367
51
For
per
sona
l use
onl
y
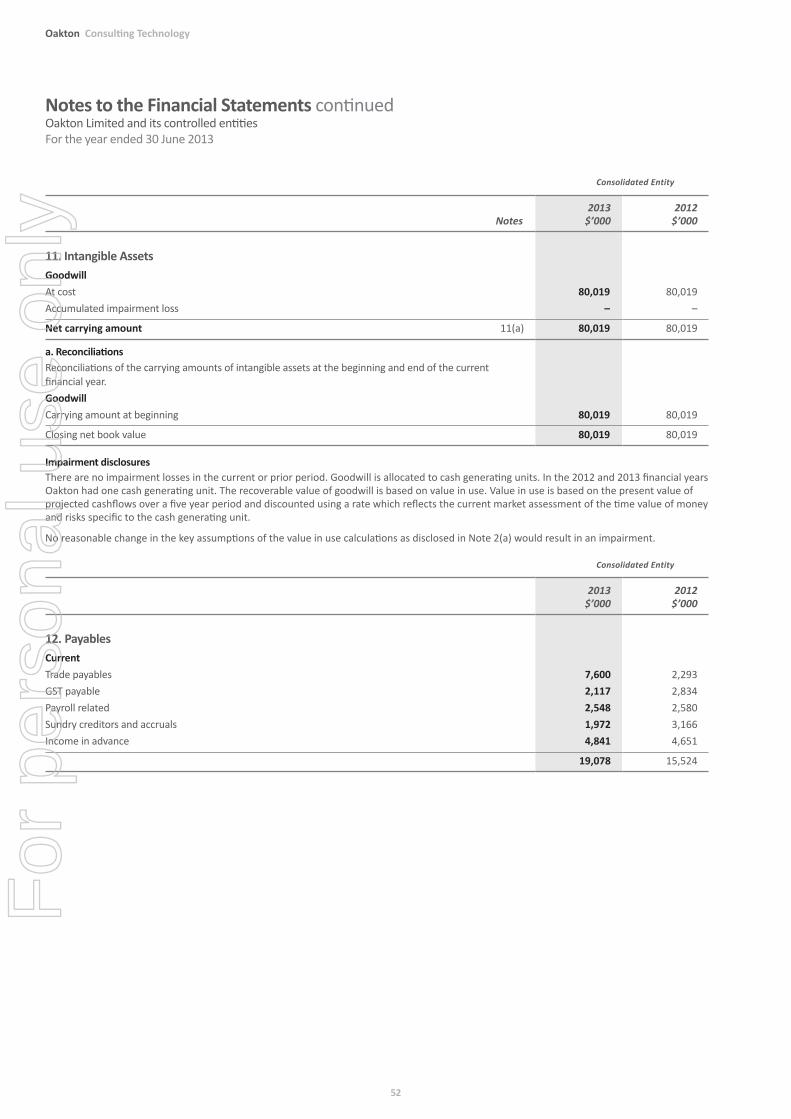
Notes to the Financial Statements continuedOakton Limited and its controlled entities For the year ended 30 June 2013
Consolidated Entity
Notes 2013
$’000 2012
$’000
11. Intangible AssetsGoodwillAt costAccumulated impairment loss
80,019 –
80,019–
Net carrying amount 11(a) 80,019 80,019
a. ReconciliationsReconciliations of the carrying amounts of intangible assets at the beginning and end of the current financial year.GoodwillCarrying amount at beginning 80,019 80,019
Closing net book value 80,019 80,019
Impairment disclosuresThere are no impairment losses in the current or prior period. Goodwill is allocated to cash generating units. In the 2012 and 2013 financial years Oakton had one cash generating unit. The recoverable value of goodwill is based on value in use. Value in use is based on the present value of projected cashflows over a five year period and discounted using a rate which reflects the current market assessment of the time value of money and risks specific to the cash generating unit.
No reasonable change in the key assumptions of the value in use calculations as disclosed in Note 2(a) would result in an impairment.
Consolidated Entity
2013$’000
2012 $’000
12. PayablesCurrentTrade payablesGST payablePayroll related Sundry creditors and accrualsIncome in advance
7,600 2,117 2,5481,972 4,841
2,293 2,834 2,580 3,166 4,651
19,078 15,524
52
Oakton Consulting Technology
For
per
sona
l use
onl
y
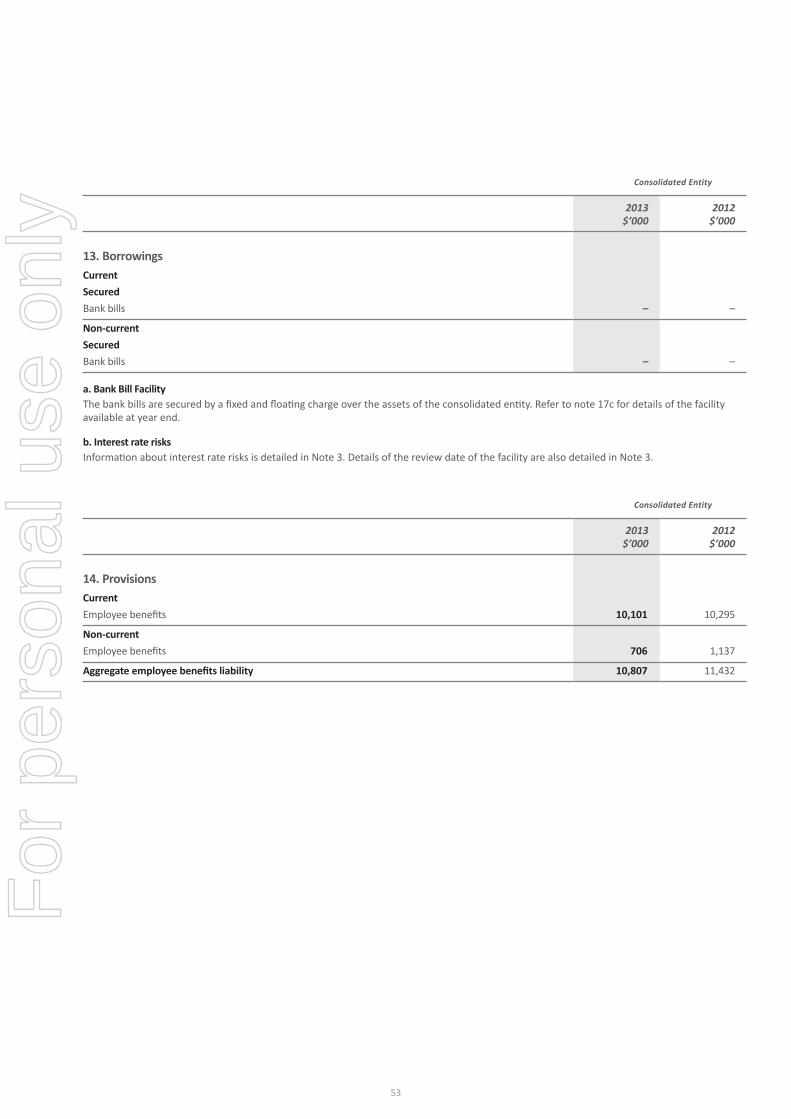
Consolidated Entity
2013$’000
2012 $’000
13. BorrowingsCurrent Secured Bank bills – –
Non-currentSecuredBank bills – –
a. Bank Bill FacilityThe bank bills are secured by a fixed and floating charge over the assets of the consolidated entity. Refer to note 17c for details of the facility available at year end.
b. Interest rate risksInformation about interest rate risks is detailed in Note 3. Details of the review date of the facility are also detailed in Note 3.
Consolidated Entity
2013 $’000
2012 $’000
14. ProvisionsCurrentEmployee benefits 10,101 10,295
Non-currentEmployee benefits 706 1,137
Aggregate employee benefits liability 10,807 11,432
53
For
per
sona
l use
onl
y
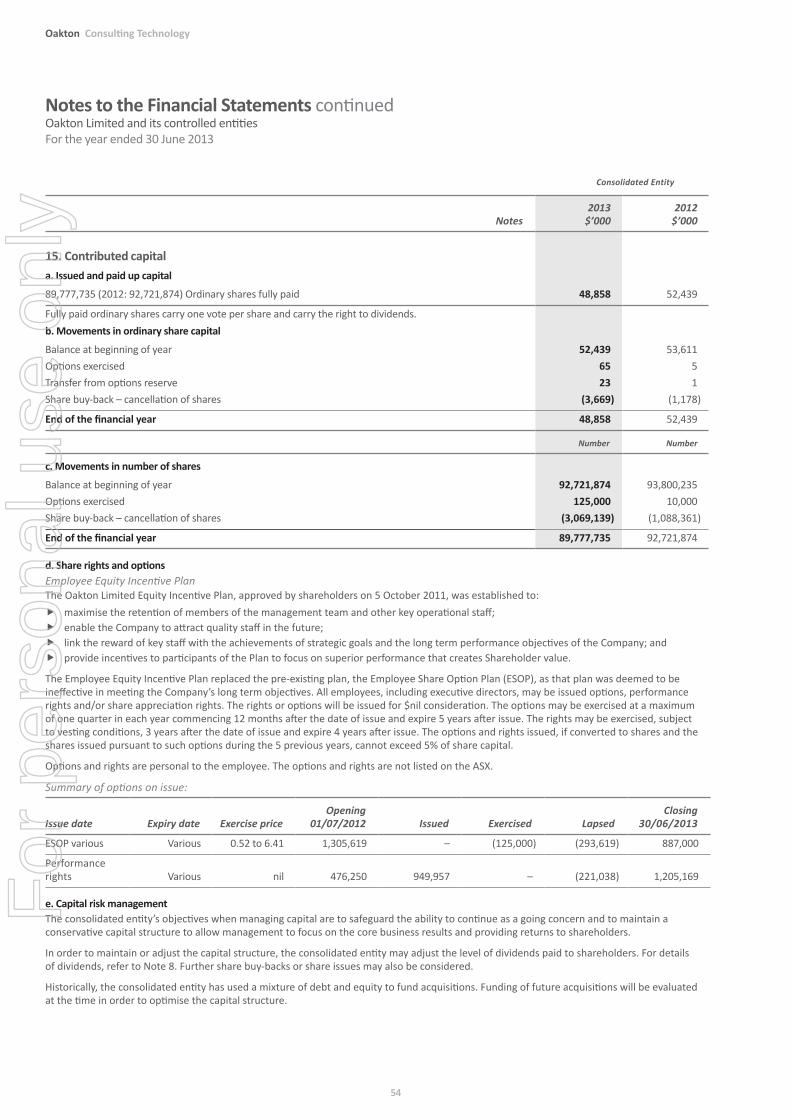
Notes to the Financial Statements continuedOakton Limited and its controlled entities For the year ended 30 June 2013
Consolidated Entity
Notes 2013
$’000 2012
$’000
15. Contributed capitala. Issued and paid up capital
89,777,735 (2012: 92,721,874) Ordinary shares fully paid 48,858 52,439
Fully paid ordinary shares carry one vote per share and carry the right to dividends.b. Movements in ordinary share capital
Balance at beginning of yearOptions exercisedTransfer from options reserveShare buy-back – cancellation of shares
52,4396523
(3,669)
53,611 51
(1,178)
End of the financial year 48,858 52,439
Number Number
c. Movements in number of shares
Balance at beginning of yearOptions exercisedShare buy-back – cancellation of shares
92,721,874 125,000
(3,069,139)
93,800,235 10,000
(1,088,361)
End of the financial year 89,777,735 92,721,874
d. Share rights and optionsEmployee Equity Incentive PlanThe Oakton Limited Equity Incentive Plan, approved by shareholders on 5 October 2011, was established to:
� maximise the retention of members of the management team and other key operational staff; � enable the Company to attract quality staff in the future; � link the reward of key staff with the achievements of strategic goals and the long term performance objectives of the Company; and � provide incentives to participants of the Plan to focus on superior performance that creates Shareholder value.
The Employee Equity Incentive Plan replaced the pre-existing plan, the Employee Share Option Plan (ESOP), as that plan was deemed to be ineffective in meeting the Company’s long term objectives. All employees, including executive directors, may be issued options, performance rights and/or share appreciation rights. The rights or options will be issued for $nil consideration. The options may be exercised at a maximum of one quarter in each year commencing 12 months after the date of issue and expire 5 years after issue. The rights may be exercised, subject to vesting conditions, 3 years after the date of issue and expire 4 years after issue. The options and rights issued, if converted to shares and the shares issued pursuant to such options during the 5 previous years, cannot exceed 5% of share capital.
Options and rights are personal to the employee. The options and rights are not listed on the ASX.
Summary of options on issue:
Issue date Expiry date Exercise priceOpening
01/07/2012 Issued Exercised Lapsed Closing
30/06/2013
ESOP various Various 0.52 to 6.41 1,305,619 – (125,000) (293,619) 887,000
Performance rights Various nil 476,250 949,957 – (221,038) 1,205,169
e. Capital risk managementThe consolidated entity’s objectives when managing capital are to safeguard the ability to continue as a going concern and to maintain a conservative capital structure to allow management to focus on the core business results and providing returns to shareholders.
In order to maintain or adjust the capital structure, the consolidated entity may adjust the level of dividends paid to shareholders. For details of dividends, refer to Note 8. Further share buy-backs or share issues may also be considered.
Historically, the consolidated entity has used a mixture of debt and equity to fund acquisitions. Funding of future acquisitions will be evaluated at the time in order to optimise the capital structure.
54
Oakton Consulting Technology
For
per
sona
l use
onl
y
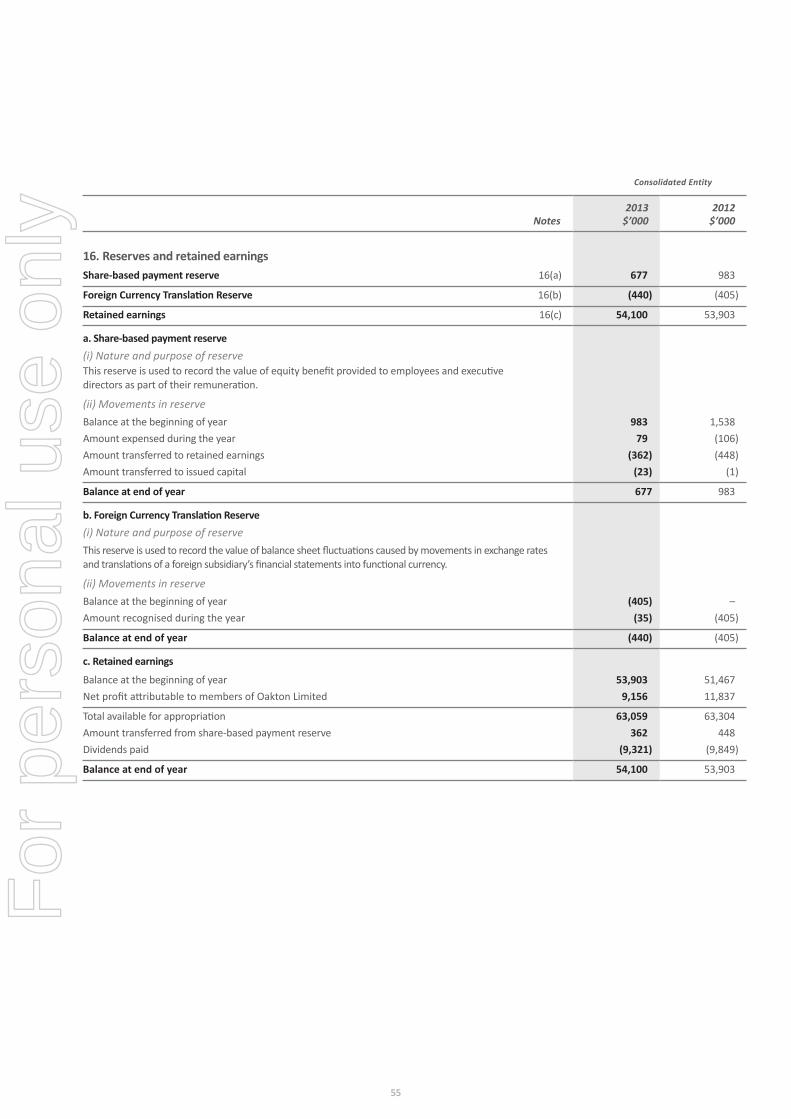
Consolidated Entity
Notes 2013
$’000 2012
$’000
16. Reserves and retained earningsShare-based payment reserve 16(a) 677 983
Foreign Currency Translation Reserve 16(b) (440) (405)
Retained earnings 16(c) 54,100 53,903
a. Share-based payment reserve(i) Nature and purpose of reserveThis reserve is used to record the value of equity benefit provided to employees and executive directors as part of their remuneration.
(ii) Movements in reserveBalance at the beginning of yearAmount expensed during the yearAmount transferred to retained earningsAmount transferred to issued capital
98379
(362) (23)
1,538(106)(448)
(1)
Balance at end of year 677 983
b. Foreign Currency Translation Reserve(i) Nature and purpose of reserveThis reserve is used to record the value of balance sheet fluctuations caused by movements in exchange rates and translations of a foreign subsidiary’s financial statements into functional currency.
(ii) Movements in reserveBalance at the beginning of yearAmount recognised during the year
(405) (35)
–(405)
Balance at end of year (440) (405)
c. Retained earnings
Balance at the beginning of yearNet profit attributable to members of Oakton Limited
53,903 9,156
51,467 11,837
Total available for appropriationAmount transferred from share-based payment reserveDividends paid
63,059 362
(9,321)
63,304 448
(9,849)
Balance at end of year 54,100 53,903
55
For
per
sona
l use
onl
y
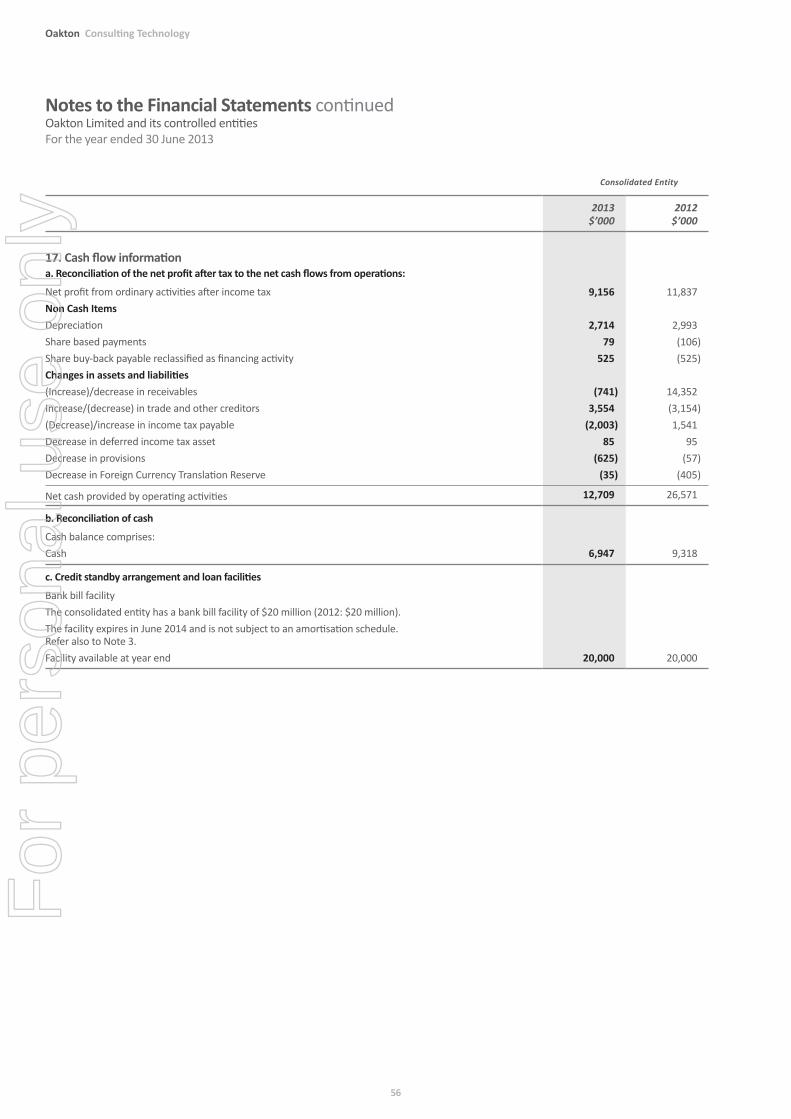
Notes to the Financial Statements continuedOakton Limited and its controlled entities For the year ended 30 June 2013
Consolidated Entity
2013 $’000
2012 $’000
17. Cash flow informationa. Reconciliation of the net profit after tax to the net cash flows from operations:
Net profit from ordinary activities after income taxNon Cash ItemsDepreciationShare based paymentsShare buy-back payable reclassified as financing activityChanges in assets and liabilities (Increase)/decrease in receivables Increase/(decrease) in trade and other creditors (Decrease)/increase in income tax payable Decrease in deferred income tax asset Decrease in provisionsDecrease in Foreign Currency Translation Reserve
9,156
2,714 79
525
(741) 3,554
(2,003) 85
(625) (35)
11,837
2,993 (106) (525)
14,352 (3,154)1,541
95 (57)
(405)
Net cash provided by operating activities 12,709 26,571
b. Reconciliation of cash
Cash balance comprises: Cash 6,947 9,318
c. Credit standby arrangement and loan facilities
Bank bill facilityThe consolidated entity has a bank bill facility of $20 million (2012: $20 million).The facility expires in June 2014 and is not subject to an amortisation schedule. Refer also to Note 3.Facility available at year end 20,000 20,000
56
Oakton Consulting Technology
For
per
sona
l use
onl
y
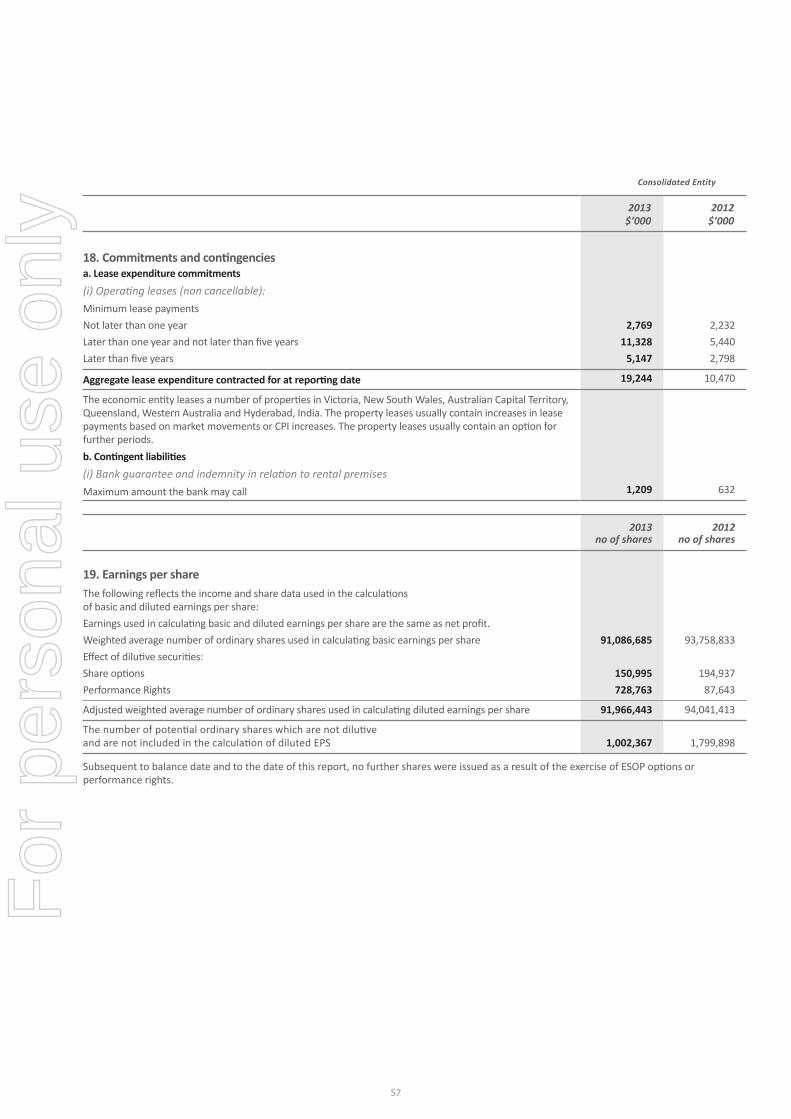
Consolidated Entity
2013 $’000
2012 $’000
18. Commitments and contingenciesa. Lease expenditure commitments (i) Operating leases (non cancellable): Minimum lease paymentsNot later than one yearLater than one year and not later than five yearsLater than five years
2,769 11,328
5,147
2,232 5,440 2,798
Aggregate lease expenditure contracted for at reporting date 19,244 10,470
The economic entity leases a number of properties in Victoria, New South Wales, Australian Capital Territory, Queensland, Western Australia and Hyderabad, India. The property leases usually contain increases in lease payments based on market movements or CPI increases. The property leases usually contain an option for further periods.b. Contingent liabilities(i) Bank guarantee and indemnity in relation to rental premisesMaximum amount the bank may call 1,209 632
2013 no of shares
2012 no of shares
19. Earnings per shareThe following reflects the income and share data used in the calculations of basic and diluted earnings per share:Earnings used in calculating basic and diluted earnings per share are the same as net profit.Weighted average number of ordinary shares used in calculating basic earnings per shareEffect of dilutive securities:Share optionsPerformance Rights
91,086,685
150,995 728,763
93,758,833
194,937 87,643
Adjusted weighted average number of ordinary shares used in calculating diluted earnings per share 91,966,443 94,041,413
The number of potential ordinary shares which are not dilutive and are not included in the calculation of diluted EPS 1,002,367 1,799,898
Subsequent to balance date and to the date of this report, no further shares were issued as a result of the exercise of ESOP options or performance rights.
57
For
per
sona
l use
onl
y
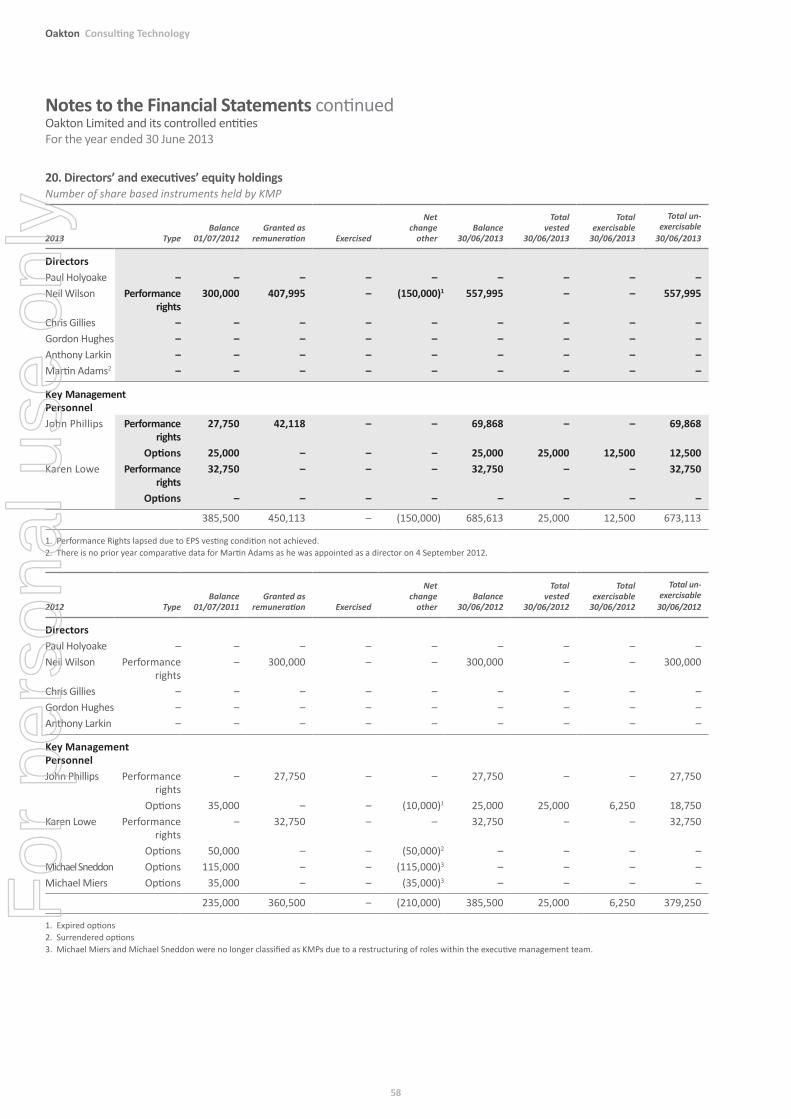
Notes to the Financial Statements continuedOakton Limited and its controlled entities For the year ended 30 June 2013
20. Directors’ and executives’ equity holdingsNumber of share based instruments held by KMP
2013 TypeBalance
01/07/2012Granted as
remuneration Exercised
Net change
otherBalance
30/06/2013
Total vested
30/06/2013
Total exercisable
30/06/2013
Total un- exercisable
30/06/2013
DirectorsPaul Holyoake – – – – – – – – –Neil Wilson Performance
rights300,000 407,995 – (150,000)1 557,995 – – 557,995
Chris Gillies – – – – – – – – –Gordon Hughes – – – – – – – – –Anthony Larkin – – – – – – – – –Martin Adams2 – – – – – – – – –
Key Management PersonnelJohn Phillips Performance
rights27,750 42,118 – – 69,868 – – 69,868
Options 25,000 – – – 25,000 25,000 12,500 12,500Karen Lowe Performance
rights32,750 – – – 32,750 – – 32,750
Options – – – – – – – –
385,500 450,113 – (150,000) 685,613 25,000 12,500 673,113
1. Performance Rights lapsed due to EPS vesting condition not achieved.2. There is no prior year comparative data for Martin Adams as he was appointed as a director on 4 September 2012.
2012 TypeBalance
01/07/2011Granted as
remuneration Exercised
Net change
otherBalance
30/06/2012
Total vested
30/06/2012
Total exercisable
30/06/2012
Total un- exercisable
30/06/2012
DirectorsPaul Holyoake – – – – – – – – –Neil Wilson Performance
rights– 300,000 – – 300,000 – – 300,000
Chris Gillies – – – – – – – – –Gordon Hughes – – – – – – – – –Anthony Larkin – – – – – – – – –
Key Management PersonnelJohn Phillips Performance
rights– 27,750 – – 27,750 – – 27,750
Options 35,000 – – (10,000)1 25,000 25,000 6,250 18,750Karen Lowe Performance
rights– 32,750 – – 32,750 – – 32,750
Options 50,000 – – (50,000)2 – – – –Michael Sneddon Options 115,000 – – (115,000)3 – – – –Michael Miers Options 35,000 – – (35,000)3 – – – –
235,000 360,500 – (210,000) 385,500 25,000 6,250 379,250
1. Expired options2. Surrendered options3. Michael Miers and Michael Sneddon were no longer classified as KMPs due to a restructuring of roles within the executive management team.
58
Oakton Consulting Technology
For
per
sona
l use
onl
y
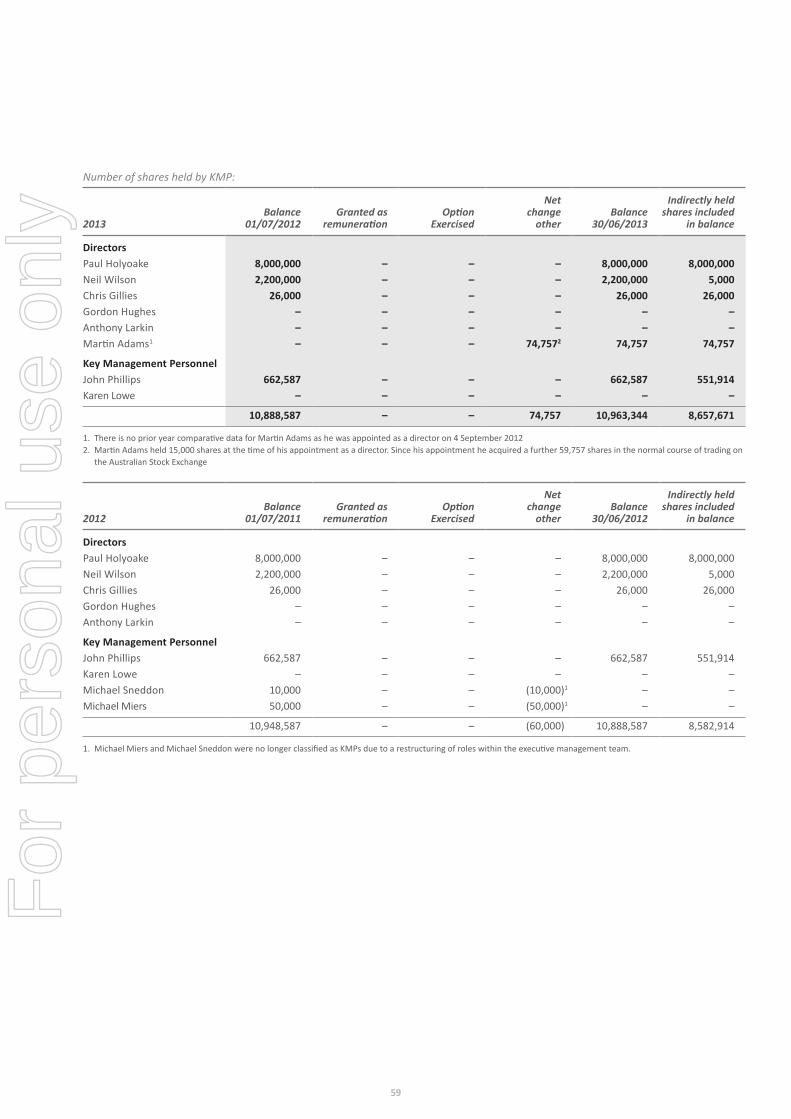
Number of shares held by KMP:
2013Balance
01/07/2012Granted as
remunerationOption
Exercised
Net change
otherBalance
30/06/2013
Indirectly held shares included
in balance
DirectorsPaul Holyoake 8,000,000 – – – 8,000,000 8,000,000Neil Wilson 2,200,000 – – – 2,200,000 5,000Chris Gillies 26,000 – – – 26,000 26,000Gordon Hughes – – – – – –Anthony Larkin – – – – – –Martin Adams1 – – – 74,7572 74,757 74,757
Key Management PersonnelJohn Phillips 662,587 – – – 662,587 551,914Karen Lowe – – – – – –
10,888,587 – – 74,757 10,963,344 8,657,671
1. There is no prior year comparative data for Martin Adams as he was appointed as a director on 4 September 20122. Martin Adams held 15,000 shares at the time of his appointment as a director. Since his appointment he acquired a further 59,757 shares in the normal course of trading on
the Australian Stock Exchange
2012Balance
01/07/2011Granted as
remunerationOption
Exercised
Net change
otherBalance
30/06/2012
Indirectly held shares included
in balance
DirectorsPaul Holyoake 8,000,000 – – – 8,000,000 8,000,000Neil Wilson 2,200,000 – – – 2,200,000 5,000Chris Gillies 26,000 – – – 26,000 26,000Gordon Hughes – – – – – –Anthony Larkin – – – – – –
Key Management PersonnelJohn Phillips 662,587 – – – 662,587 551,914Karen Lowe – – – – – –Michael Sneddon 10,000 – – (10,000)1 – –Michael Miers 50,000 – – (50,000)1 – –
10,948,587 – – (60,000) 10,888,587 8,582,914
1. Michael Miers and Michael Sneddon were no longer classified as KMPs due to a restructuring of roles within the executive management team.
59
For
per
sona
l use
onl
y
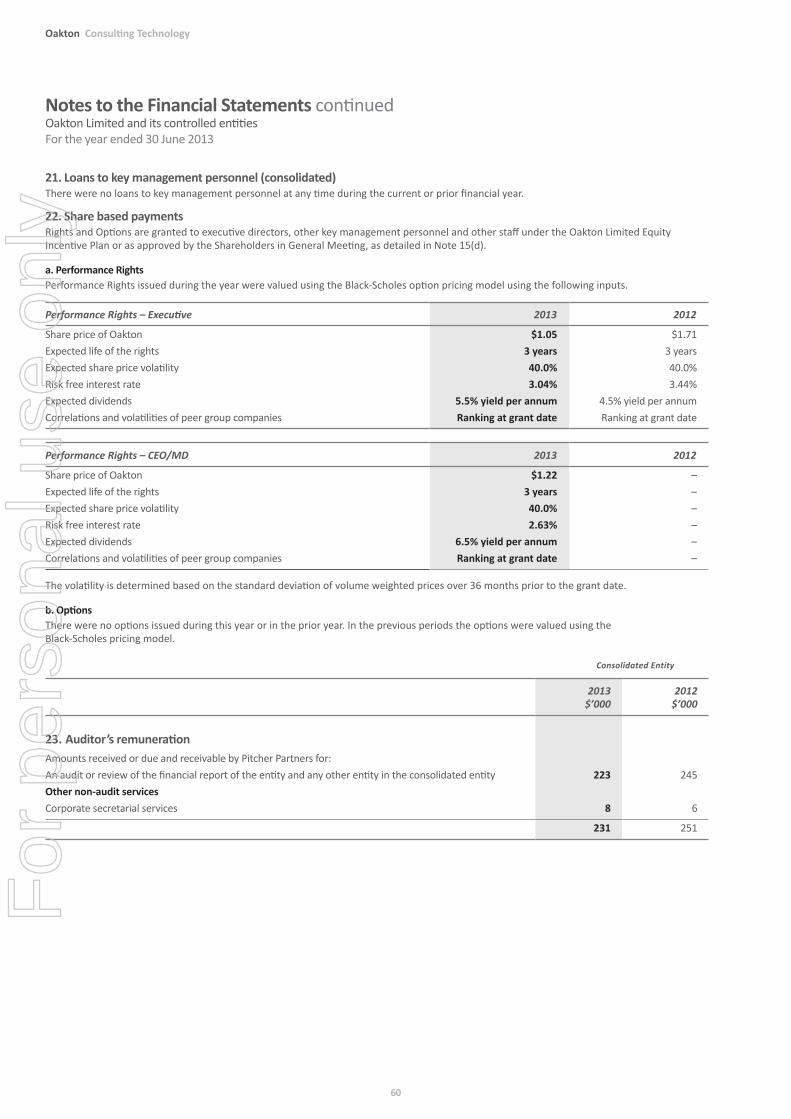
Notes to the Financial Statements continuedOakton Limited and its controlled entities For the year ended 30 June 2013
21. Loans to key management personnel (consolidated)There were no loans to key management personnel at any time during the current or prior financial year.
22. Share based paymentsRights and Options are granted to executive directors, other key management personnel and other staff under the Oakton Limited Equity Incentive Plan or as approved by the Shareholders in General Meeting, as detailed in Note 15(d).
a. Performance RightsPerformance Rights issued during the year were valued using the Black-Scholes option pricing model using the following inputs.
Performance Rights – Executive 2013 2012
Share price of OaktonExpected life of the rightsExpected share price volatilityRisk free interest rateExpected dividendsCorrelations and volatilities of peer group companies
$1.053 years40.0%3.04%
5.5% yield per annumRanking at grant date
$1.713 years40.0%3.44%
4.5% yield per annumRanking at grant date
Performance Rights – CEO/MD 2013 2012
Share price of OaktonExpected life of the rightsExpected share price volatilityRisk free interest rateExpected dividendsCorrelations and volatilities of peer group companies
$1.223 years40.0%2.63%
6.5% yield per annumRanking at grant date
––––––
The volatility is determined based on the standard deviation of volume weighted prices over 36 months prior to the grant date.
b. OptionsThere were no options issued during this year or in the prior year. In the previous periods the options were valued using the Black-Scholes pricing model.
Consolidated Entity
2013 $’000
2012 $’000
23. Auditor’s remunerationAmounts received or due and receivable by Pitcher Partners for:An audit or review of the financial report of the entity and any other entity in the consolidated entityOther non-audit servicesCorporate secretarial services
223
8
245
6
231 251
60
Oakton Consulting Technology
For
per
sona
l use
onl
y
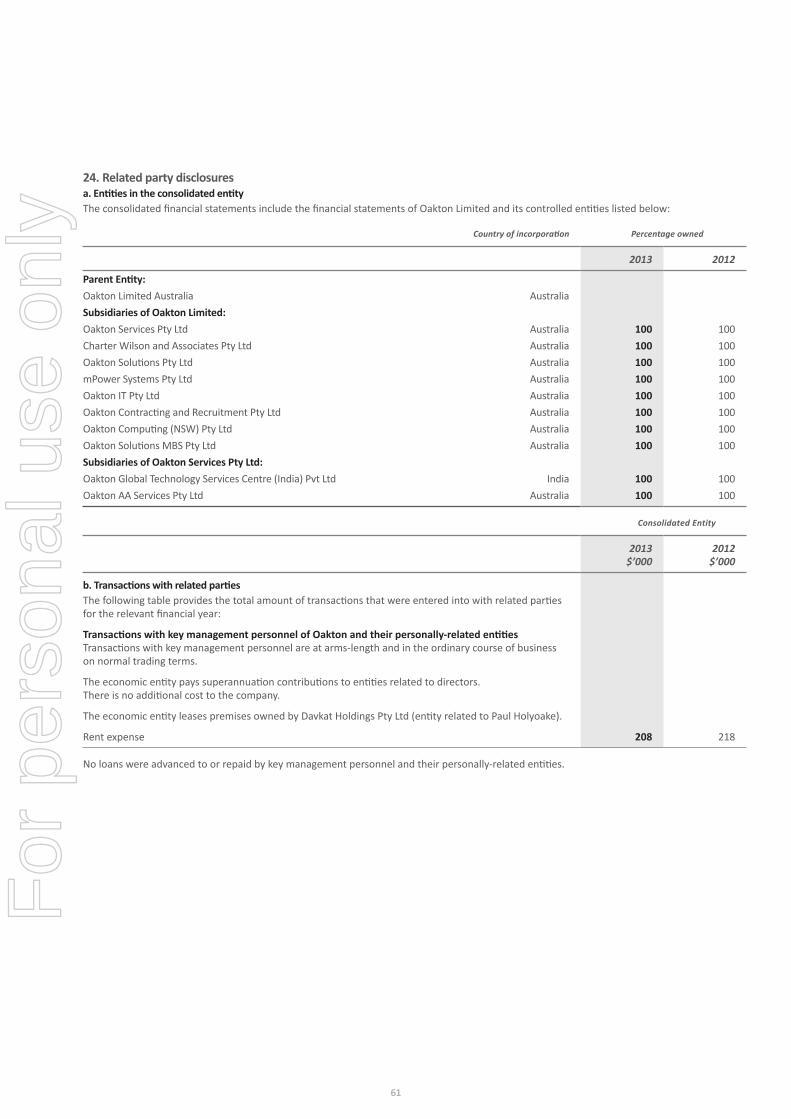
24. Related party disclosuresa. Entities in the consolidated entityThe consolidated financial statements include the financial statements of Oakton Limited and its controlled entities listed below:
Country of incorporation Percentage owned
2013 2012
Parent Entity:Oakton Limited Australia AustraliaSubsidiaries of Oakton Limited:Oakton Services Pty Ltd Australia Charter Wilson and Associates Pty Ltd AustraliaOakton Solutions Pty Ltd Australia mPower Systems Pty Ltd Australia Oakton IT Pty Ltd Australia Oakton Contracting and Recruitment Pty Ltd Australia Oakton Computing (NSW) Pty Ltd Australia Oakton Solutions MBS Pty Ltd AustraliaSubsidiaries of Oakton Services Pty Ltd:Oakton Global Technology Services Centre (India) Pvt Ltd IndiaOakton AA Services Pty Ltd Australia
100 100 100 100 100 100 100 100
100 100
100100100100100100100100
100100
Consolidated Entity
2013 $’000
2012 $’000
b. Transactions with related partiesThe following table provides the total amount of transactions that were entered into with related parties for the relevant financial year:
Transactions with key management personnel of Oakton and their personally-related entitiesTransactions with key management personnel are at arms-length and in the ordinary course of business on normal trading terms.
The economic entity pays superannuation contributions to entities related to directors. There is no additional cost to the company.
The economic entity leases premises owned by Davkat Holdings Pty Ltd (entity related to Paul Holyoake).
Rent expense 208 218
No loans were advanced to or repaid by key management personnel and their personally-related entities.
61
For
per
sona
l use
onl
y
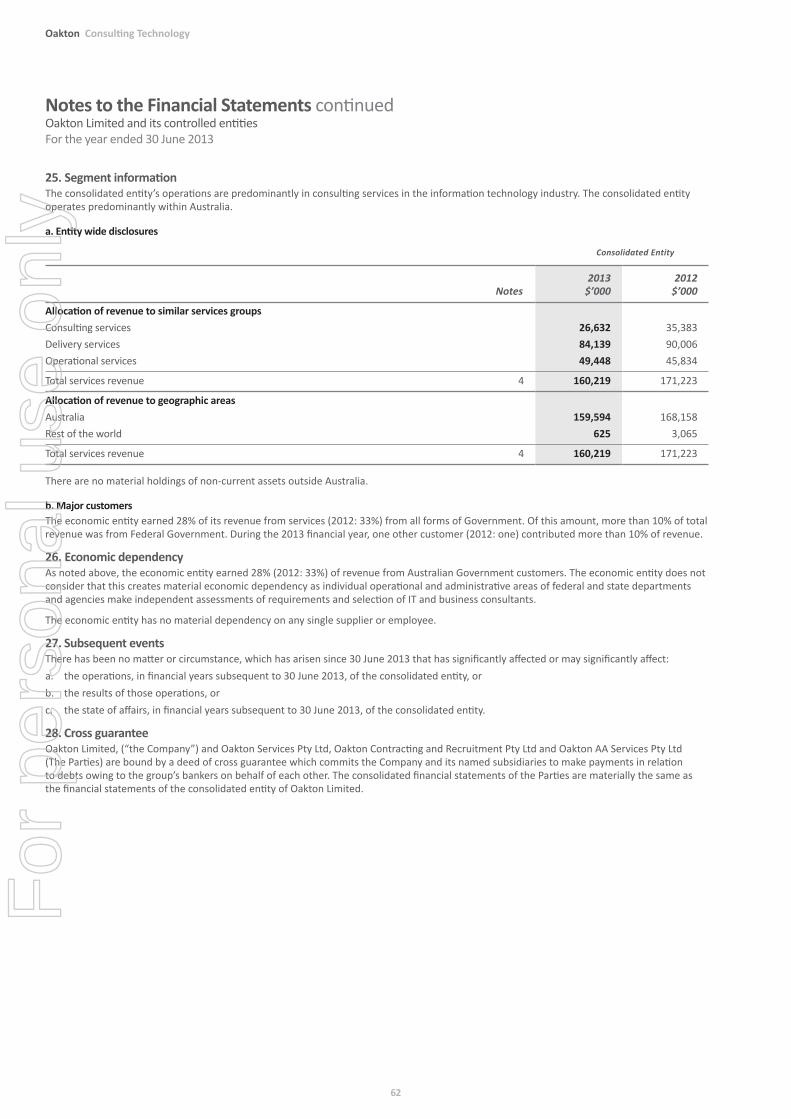
Notes to the Financial Statements continuedOakton Limited and its controlled entities For the year ended 30 June 2013
25. Segment informationThe consolidated entity’s operations are predominantly in consulting services in the information technology industry. The consolidated entity operates predominantly within Australia.
a. Entity wide disclosures
Consolidated Entity
Notes 2013
$’000 2012
$’000
Allocation of revenue to similar services groupsConsulting services Delivery services Operational services
26,632 84,139 49,448
35,383 90,006 45,834
Total services revenue 4 160,219 171,223
Allocation of revenue to geographic areasAustraliaRest of the world
159,594 625
168,158 3,065
Total services revenue 4 160,219 171,223
There are no material holdings of non-current assets outside Australia.
b. Major customersThe economic entity earned 28% of its revenue from services (2012: 33%) from all forms of Government. Of this amount, more than 10% of total revenue was from Federal Government. During the 2013 financial year, one other customer (2012: one) contributed more than 10% of revenue.
26. Economic dependencyAs noted above, the economic entity earned 28% (2012: 33%) of revenue from Australian Government customers. The economic entity does not consider that this creates material economic dependency as individual operational and administrative areas of federal and state departments and agencies make independent assessments of requirements and selection of IT and business consultants.
The economic entity has no material dependency on any single supplier or employee.
27. Subsequent eventsThere has been no matter or circumstance, which has arisen since 30 June 2013 that has significantly affected or may significantly affect:a. the operations, in financial years subsequent to 30 June 2013, of the consolidated entity, orb. the results of those operations, orc. the state of affairs, in financial years subsequent to 30 June 2013, of the consolidated entity.
28. Cross guaranteeOakton Limited, (“the Company”) and Oakton Services Pty Ltd, Oakton Contracting and Recruitment Pty Ltd and Oakton AA Services Pty Ltd (The Parties) are bound by a deed of cross guarantee which commits the Company and its named subsidiaries to make payments in relation to debts owing to the group’s bankers on behalf of each other. The consolidated financial statements of the Parties are materially the same as the financial statements of the consolidated entity of Oakton Limited.
62
Oakton Consulting Technology
For
per
sona
l use
onl
y
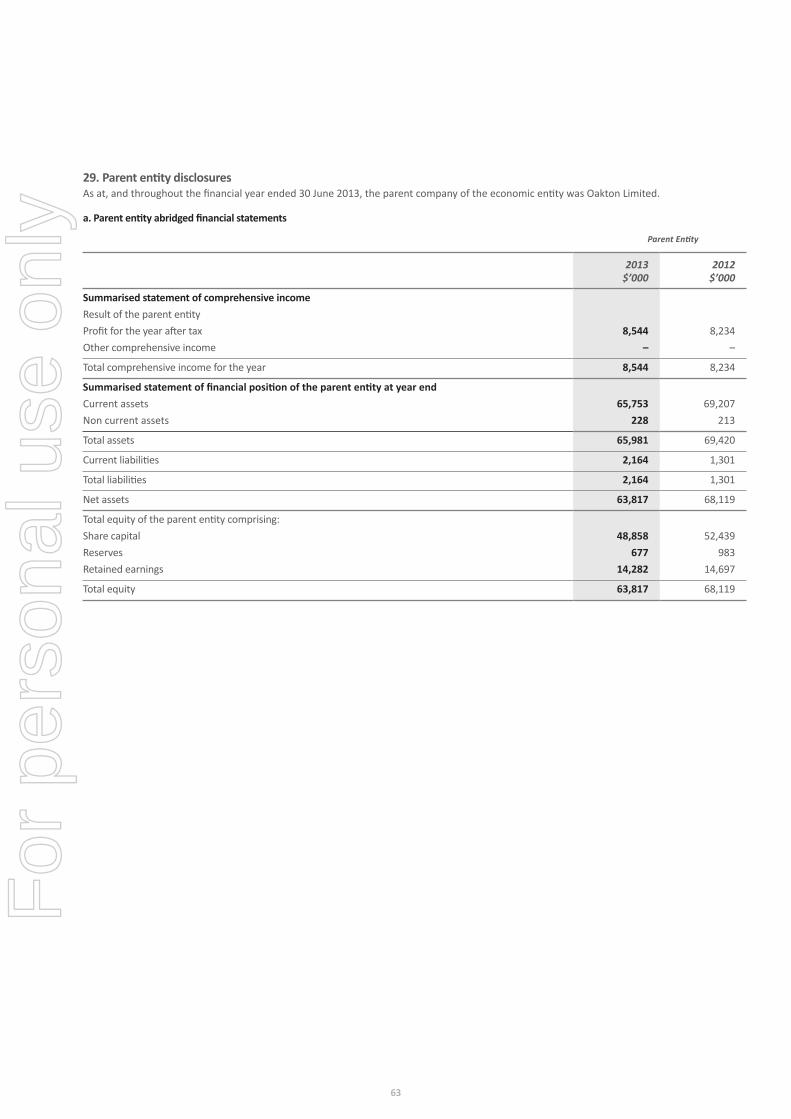
29. Parent entity disclosuresAs at, and throughout the financial year ended 30 June 2013, the parent company of the economic entity was Oakton Limited.
a. Parent entity abridged financial statements
Parent Entity
2013 $’000
2012 $’000
Summarised statement of comprehensive incomeResult of the parent entity Profit for the year after tax Other comprehensive income
8,544–
8,234 –
Total comprehensive income for the year 8,544 8,234
Summarised statement of financial position of the parent entity at year endCurrent assetsNon current assets
65,753 228
69,207 213
Total assets 65,981 69,420
Current liabilities 2,164 1,301
Total liabilities 2,164 1,301
Net assets 63,817 68,119
Total equity of the parent entity comprising:Share capitalReservesRetained earnings
48,858677
14,282
52,439 983
14,697
Total equity 63,817 68,119
63
For
per
sona
l use
onl
y
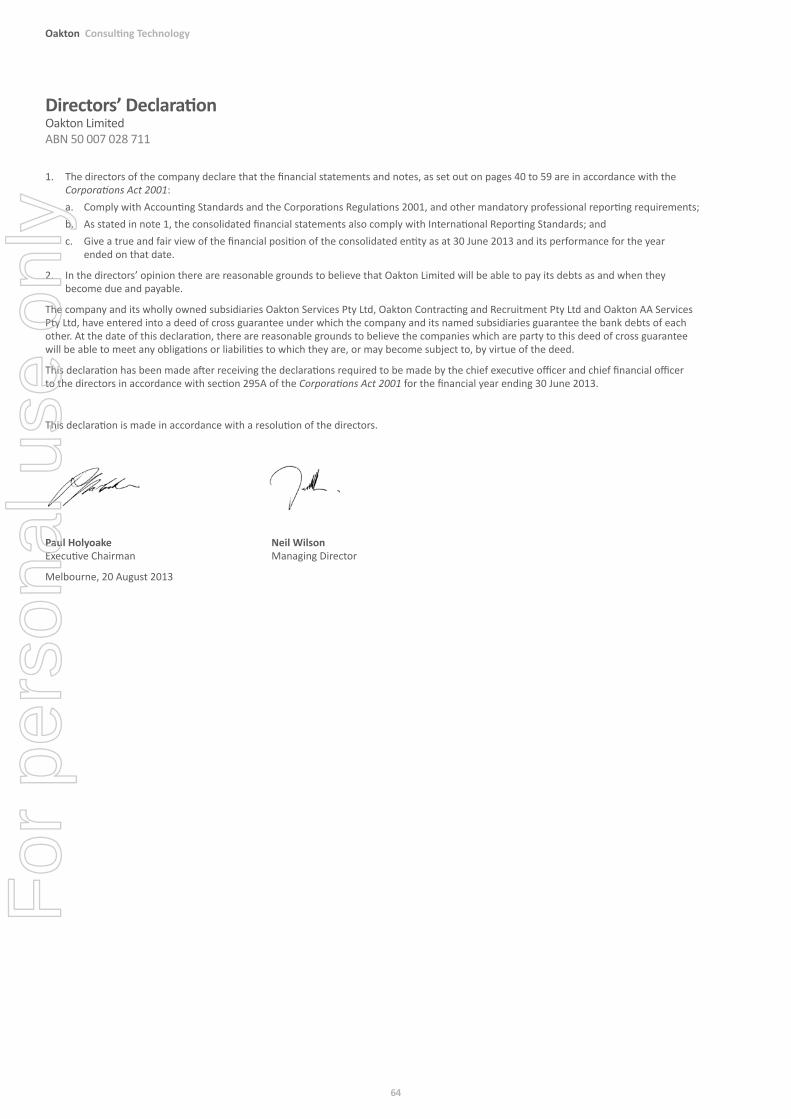
1. The directors of the company declare that the financial statements and notes, as set out on pages 40 to 59 are in accordance with the Corporations Act 2001:
a. Comply with Accounting Standards and the Corporations Regulations 2001, and other mandatory professional reporting requirements; b. As stated in note 1, the consolidated financial statements also comply with International Reporting Standards; and c. Give a true and fair view of the financial position of the consolidated entity as at 30 June 2013 and its performance for the year
ended on that date.
2. In the directors’ opinion there are reasonable grounds to believe that Oakton Limited will be able to pay its debts as and when they become due and payable.
The company and its wholly owned subsidiaries Oakton Services Pty Ltd, Oakton Contracting and Recruitment Pty Ltd and Oakton AA Services Pty Ltd, have entered into a deed of cross guarantee under which the company and its named subsidiaries guarantee the bank debts of each other. At the date of this declaration, there are reasonable grounds to believe the companies which are party to this deed of cross guarantee will be able to meet any obligations or liabilities to which they are, or may become subject to, by virtue of the deed.
This declaration has been made after receiving the declarations required to be made by the chief executive officer and chief financial officer to the directors in accordance with section 295A of the Corporations Act 2001 for the financial year ending 30 June 2013.
This declaration is made in accordance with a resolution of the directors.
Paul Holyoake Neil Wilson Executive Chairman Managing Director
Melbourne, 20 August 2013
Directors’ DeclarationOakton Limited ABN 50 007 028 711
64
Oakton Consulting Technology
For
per
sona
l use
onl
y
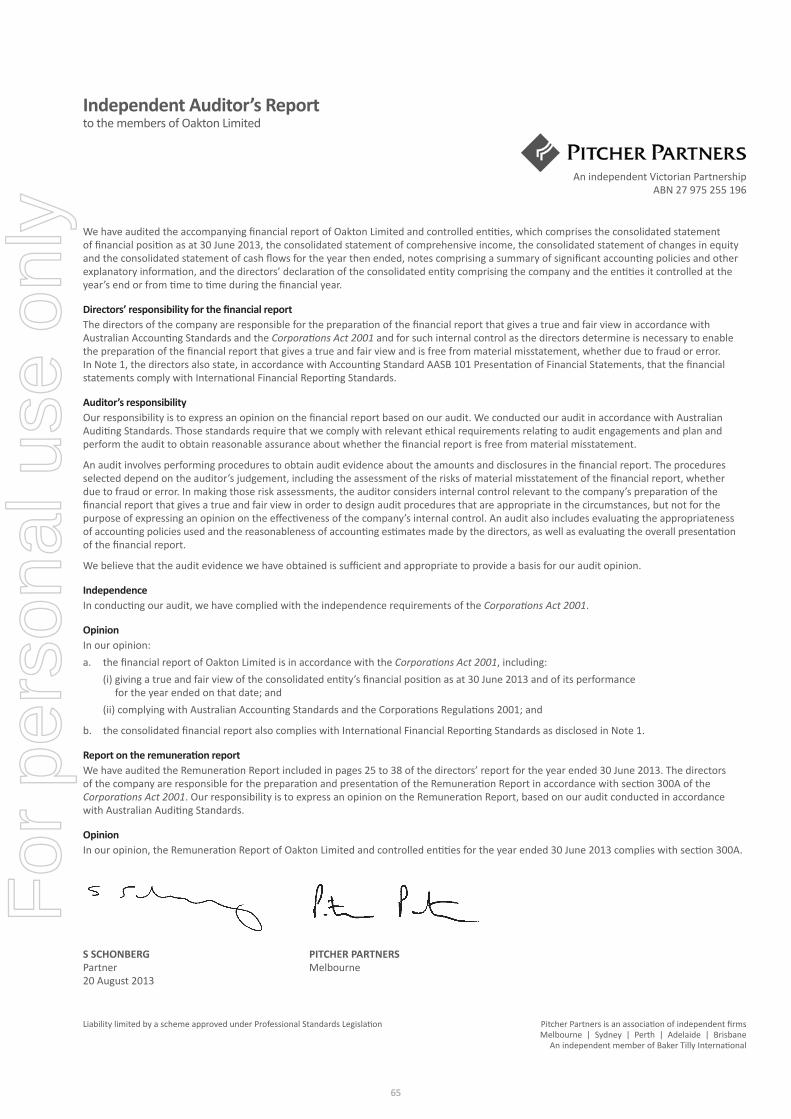
An independent Victorian Partnership ABN 27 975 255 196
We have audited the accompanying financial report of Oakton Limited and controlled entities, which comprises the consolidated statement of financial position as at 30 June 2013, the consolidated statement of comprehensive income, the consolidated statement of changes in equity and the consolidated statement of cash flows for the year then ended, notes comprising a summary of significant accounting policies and other explanatory information, and the directors’ declaration of the consolidated entity comprising the company and the entities it controlled at the year’s end or from time to time during the financial year.
Directors’ responsibility for the financial reportThe directors of the company are responsible for the preparation of the financial report that gives a true and fair view in accordance with Australian Accounting Standards and the Corporations Act 2001 and for such internal control as the directors determine is necessary to enable the preparation of the financial report that gives a true and fair view and is free from material misstatement, whether due to fraud or error. In Note 1, the directors also state, in accordance with Accounting Standard AASB 101 Presentation of Financial Statements, that the financial statements comply with International Financial Reporting Standards.
Auditor’s responsibilityOur responsibility is to express an opinion on the financial report based on our audit. We conducted our audit in accordance with Australian Auditing Standards. Those standards require that we comply with relevant ethical requirements relating to audit engagements and plan and perform the audit to obtain reasonable assurance about whether the financial report is free from material misstatement.
An audit involves performing procedures to obtain audit evidence about the amounts and disclosures in the financial report. The procedures selected depend on the auditor’s judgement, including the assessment of the risks of material misstatement of the financial report, whether due to fraud or error. In making those risk assessments, the auditor considers internal control relevant to the company’s preparation of the financial report that gives a true and fair view in order to design audit procedures that are appropriate in the circumstances, but not for the purpose of expressing an opinion on the effectiveness of the company’s internal control. An audit also includes evaluating the appropriateness of accounting policies used and the reasonableness of accounting estimates made by the directors, as well as evaluating the overall presentation of the financial report.
We believe that the audit evidence we have obtained is sufficient and appropriate to provide a basis for our audit opinion.
IndependenceIn conducting our audit, we have complied with the independence requirements of the Corporations Act 2001.
OpinionIn our opinion:a. the financial report of Oakton Limited is in accordance with the Corporations Act 2001, including: (i) giving a true and fair view of the consolidated entity’s financial position as at 30 June 2013 and of its performance
for the year ended on that date; and (ii) complying with Australian Accounting Standards and the Corporations Regulations 2001; and
b. the consolidated financial report also complies with International Financial Reporting Standards as disclosed in Note 1.
Report on the remuneration reportWe have audited the Remuneration Report included in pages 25 to 38 of the directors’ report for the year ended 30 June 2013. The directors of the company are responsible for the preparation and presentation of the Remuneration Report in accordance with section 300A of the Corporations Act 2001. Our responsibility is to express an opinion on the Remuneration Report, based on our audit conducted in accordance with Australian Auditing Standards.
OpinionIn our opinion, the Remuneration Report of Oakton Limited and controlled entities for the year ended 30 June 2013 complies with section 300A.
S SCHONBERG PITCHER PARTNERS Partner Melbourne 20 August 2013
Independent Auditor’s Report to the members of Oakton Limited
Liability limited by a scheme approved under Professional Standards Legislation Pitcher Partners is an association of independent firms Melbourne | Sydney | Perth | Adelaide | Brisbane An independent member of Baker Tilly International
65
For
per
sona
l use
onl
y
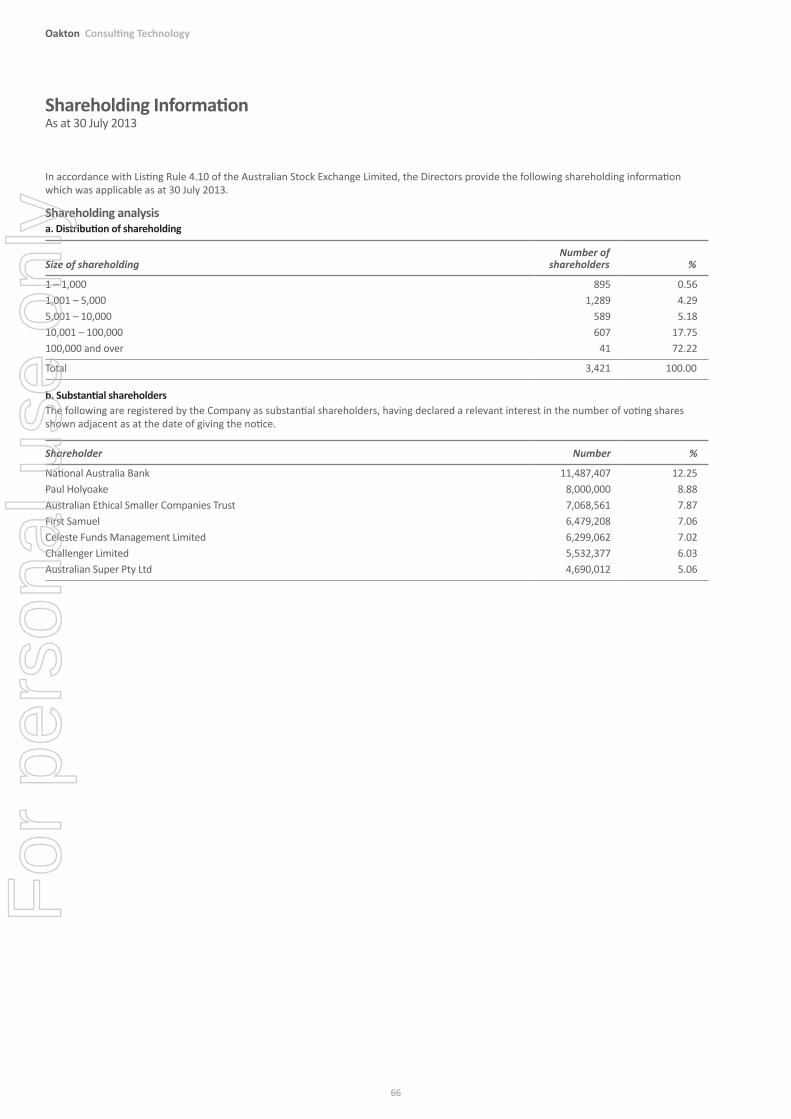
In accordance with Listing Rule 4.10 of the Australian Stock Exchange Limited, the Directors provide the following shareholding information which was applicable as at 30 July 2013.
Shareholding analysisa. Distribution of shareholding
Size of shareholdingNumber of
shareholders %
1 – 1,000 895 0.561,001 – 5,000 1,289 4.295,001 – 10,000 589 5.1810,001 – 100,000 607 17.75100,000 and over 41 72.22
Total 3,421 100.00
b. Substantial shareholdersThe following are registered by the Company as substantial shareholders, having declared a relevant interest in the number of voting shares shown adjacent as at the date of giving the notice.
Shareholder Number %
National Australia Bank 11,487,407 12.25Paul Holyoake 8,000,000 8.88Australian Ethical Smaller Companies Trust 7,068,561 7.87First Samuel 6,479,208 7.06Celeste Funds Management Limited 6,299,062 7.02Challenger Limited 5,532,377 6.03Australian Super Pty Ltd 4,690,012 5.06
Shareholding InformationAs at 30 July 2013
66
Oakton Consulting Technology
For
per
sona
l use
onl
y
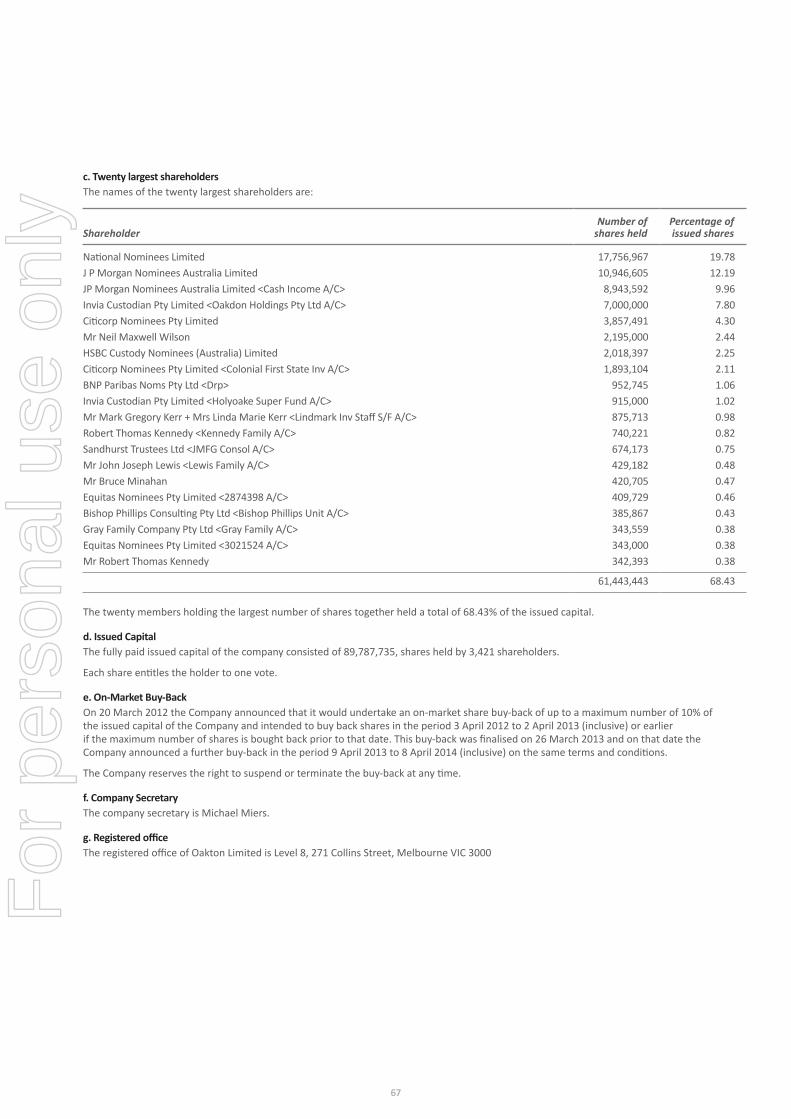
c. Twenty largest shareholdersThe names of the twenty largest shareholders are:
ShareholderNumber of
shares heldPercentage of issued shares
National Nominees Limited 17,756,967 19.78J P Morgan Nominees Australia Limited 10,946,605 12.19JP Morgan Nominees Australia Limited <Cash Income A/C> 8,943,592 9.96Invia Custodian Pty Limited <Oakdon Holdings Pty Ltd A/C> 7,000,000 7.80Citicorp Nominees Pty Limited 3,857,491 4.30Mr Neil Maxwell Wilson 2,195,000 2.44HSBC Custody Nominees (Australia) Limited 2,018,397 2.25Citicorp Nominees Pty Limited <Colonial First State Inv A/C> 1,893,104 2.11BNP Paribas Noms Pty Ltd <Drp> 952,745 1.06Invia Custodian Pty Limited <Holyoake Super Fund A/C> 915,000 1.02Mr Mark Gregory Kerr + Mrs Linda Marie Kerr <Lindmark Inv Staff S/F A/C> 875,713 0.98Robert Thomas Kennedy <Kennedy Family A/C> 740,221 0.82Sandhurst Trustees Ltd <JMFG Consol A/C> 674,173 0.75Mr John Joseph Lewis <Lewis Family A/C> 429,182 0.48Mr Bruce Minahan 420,705 0.47Equitas Nominees Pty Limited <2874398 A/C> 409,729 0.46Bishop Phillips Consulting Pty Ltd <Bishop Phillips Unit A/C> 385,867 0.43Gray Family Company Pty Ltd <Gray Family A/C> 343,559 0.38Equitas Nominees Pty Limited <3021524 A/C> 343,000 0.38Mr Robert Thomas Kennedy 342,393 0.38
61,443,443 68.43
The twenty members holding the largest number of shares together held a total of 68.43% of the issued capital.
d. Issued CapitalThe fully paid issued capital of the company consisted of 89,787,735, shares held by 3,421 shareholders.
Each share entitles the holder to one vote.
e. On-Market Buy-BackOn 20 March 2012 the Company announced that it would undertake an on-market share buy-back of up to a maximum number of 10% of the issued capital of the Company and intended to buy back shares in the period 3 April 2012 to 2 April 2013 (inclusive) or earlier if the maximum number of shares is bought back prior to that date. This buy-back was finalised on 26 March 2013 and on that date the Company announced a further buy-back in the period 9 April 2013 to 8 April 2014 (inclusive) on the same terms and conditions.
The Company reserves the right to suspend or terminate the buy-back at any time.
f. Company SecretaryThe company secretary is Michael Miers.
g. Registered officeThe registered office of Oakton Limited is Level 8, 271 Collins Street, Melbourne VIC 3000
67
For
per
sona
l use
onl
y
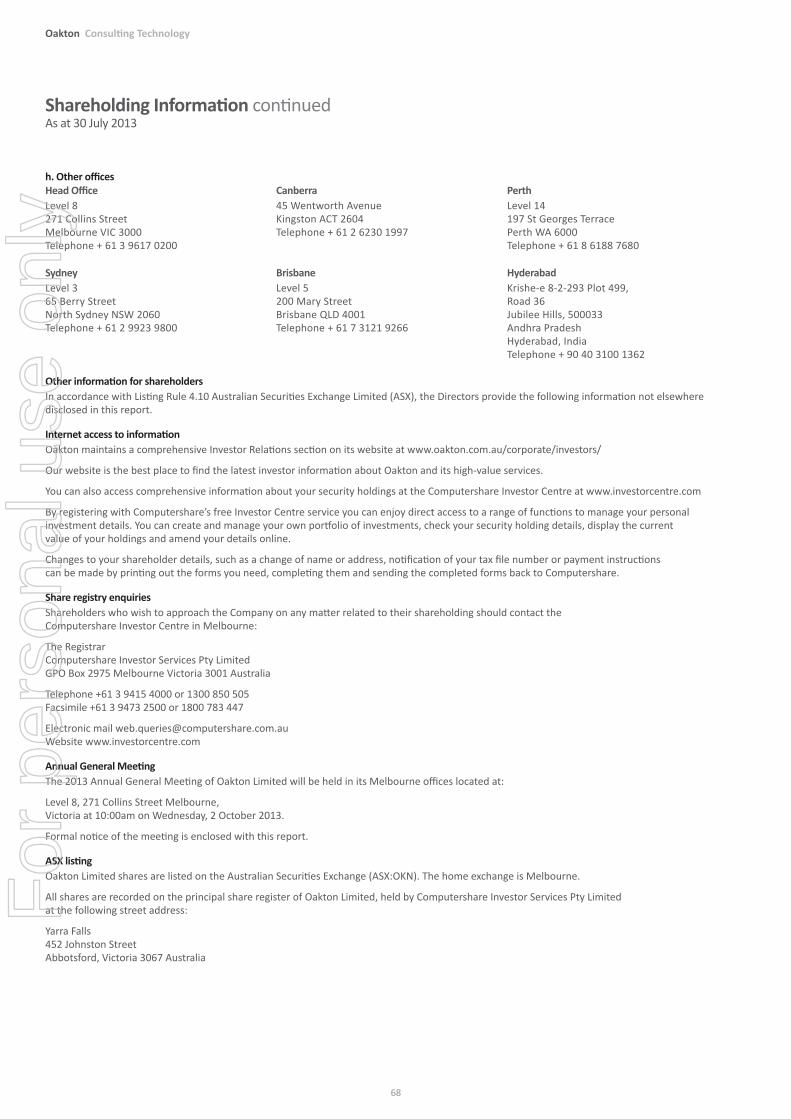
h. Other officesHead OfficeLevel 8271 Collins StreetMelbourne VIC 3000Telephone + 61 3 9617 0200
Canberra45 Wentworth AvenueKingston ACT 2604Telephone + 61 2 6230 1997
PerthLevel 14197 St Georges TerracePerth WA 6000Telephone + 61 8 6188 7680
SydneyLevel 365 Berry StreetNorth Sydney NSW 2060Telephone + 61 2 9923 9800
BrisbaneLevel 5200 Mary StreetBrisbane QLD 4001Telephone + 61 7 3121 9266
HyderabadKrishe-e 8-2-293 Plot 499,Road 36Jubilee Hills, 500033Andhra PradeshHyderabad, IndiaTelephone + 90 40 3100 1362
Other information for shareholdersIn accordance with Listing Rule 4.10 Australian Securities Exchange Limited (ASX), the Directors provide the following information not elsewhere disclosed in this report.
Internet access to informationOakton maintains a comprehensive Investor Relations section on its website at www.oakton.com.au/corporate/investors/
Our website is the best place to find the latest investor information about Oakton and its high-value services.
You can also access comprehensive information about your security holdings at the Computershare Investor Centre at www.investorcentre.com
By registering with Computershare’s free Investor Centre service you can enjoy direct access to a range of functions to manage your personal investment details. You can create and manage your own portfolio of investments, check your security holding details, display the current value of your holdings and amend your details online.
Changes to your shareholder details, such as a change of name or address, notification of your tax file number or payment instructions can be made by printing out the forms you need, completing them and sending the completed forms back to Computershare.
Share registry enquiriesShareholders who wish to approach the Company on any matter related to their shareholding should contact the Computershare Investor Centre in Melbourne:
The Registrar Computershare Investor Services Pty Limited GPO Box 2975 Melbourne Victoria 3001 Australia
Telephone +61 3 9415 4000 or 1300 850 505 Facsimile +61 3 9473 2500 or 1800 783 447
Electronic mail [email protected] Website www.investorcentre.com
Annual General MeetingThe 2013 Annual General Meeting of Oakton Limited will be held in its Melbourne offices located at:
Level 8, 271 Collins Street Melbourne, Victoria at 10:00am on Wednesday, 2 October 2013.
Formal notice of the meeting is enclosed with this report.
ASX listingOakton Limited shares are listed on the Australian Securities Exchange (ASX:OKN). The home exchange is Melbourne.
All shares are recorded on the principal share register of Oakton Limited, held by Computershare Investor Services Pty Limited at the following street address:
Yarra Falls 452 Johnston Street Abbotsford, Victoria 3067 Australia
Shareholding Information continuedAs at 30 July 2013
68
Oakton Consulting Technology
For
per
sona
l use
onl
y
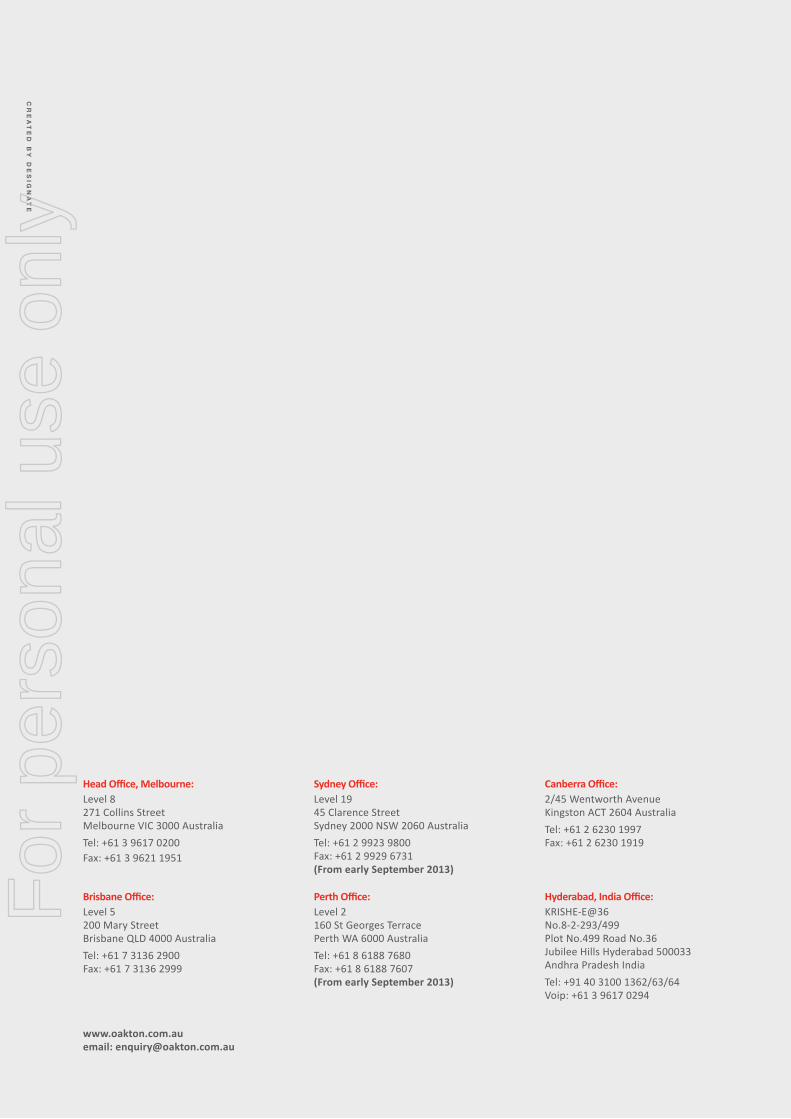
Head Office, Melbourne:Level 8 271 Collins Street Melbourne VIC 3000 AustraliaTel: +61 3 9617 0200Fax: +61 3 9621 1951
Sydney Office:Level 19 45 Clarence Street Sydney 2000 NSW 2060 AustraliaTel: +61 2 9923 9800Fax: +61 2 9929 6731(From early September 2013)
Canberra Office:2/45 Wentworth Avenue Kingston ACT 2604 AustraliaTel: +61 2 6230 1997Fax: +61 2 6230 1919
Brisbane Office:Level 5 200 Mary Street Brisbane QLD 4000 AustraliaTel: +61 7 3136 2900Fax: +61 7 3136 2999
Perth Office:Level 2 160 St Georges Terrace Perth WA 6000 AustraliaTel: +61 8 6188 7680Fax: +61 8 6188 7607(From early September 2013)
Hyderabad, India Office:KRISHE-E@36 No.8-2-293/499 Plot No.499 Road No.36Jubilee Hills Hyderabad 500033 Andhra Pradesh IndiaTel: +91 40 3100 1362/63/64Voip: +61 3 9617 0294
www.oakton.com.au email: [email protected]
For
per
sona
l use
onl
y

www.oakton.com.au
For
per
sona
l use
onl
y


![[ Sample Image: Place a 9.5” x 4.75” image here ]](https://img.pdfslide.us/doc/110x75/568151c6550346895dbffbe6/-sample-image-place-a-95-x-475-image-here-.jpg)
