Embed Size (px)
Citation preview
GALE PacificInvestor PresentationResults to 30 June 2015
September 2015
For
per
sona
l use
onl
y
Who we are
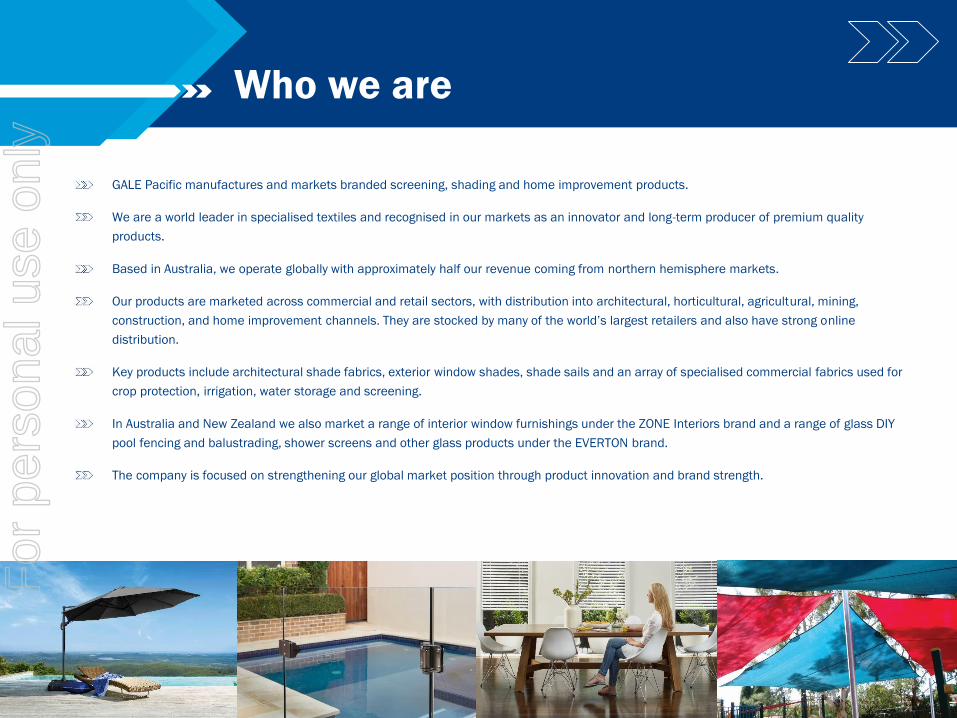
GALE Pacific manufactures and markets branded screening, shading and home improvement products.
We are a world leader in specialised textiles and recognised in our markets as an innovator and long-term producer of premium quality
products.
Based in Australia, we operate globally with approximately half our revenue coming from northern hemisphere markets.
Our products are marketed across commercial and retail sectors, with distribution into architectural, horticultural, agricultural, mining,
construction, and home improvement channels. They are stocked by many of the world’s largest retailers and also have strong online
distribution.
Key products include architectural shade fabrics, exterior window shades, shade sails and an array of specialised commercial fabrics used for
crop protection, irrigation, water storage and screening.
In Australia and New Zealand we also market a range of interior window furnishings under the ZONE Interiors brand and a range of glass DIY
pool fencing and balustrading, shower screens and other glass products under the EVERTON brand.
The company is focused on strengthening our global market position through product innovation and brand strength.
2
For
per
sona
l use
onl
y
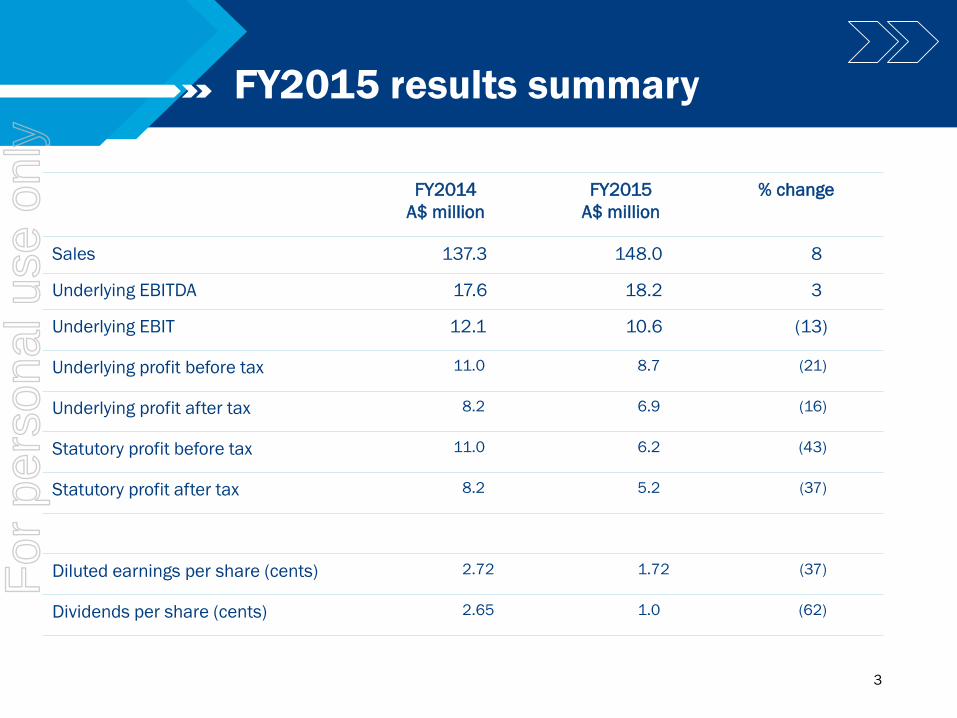
FY2015 results summary
FY2014
A$ million
FY2015
A$ million
% change
Sales 137.3 148.0 8
Underlying EBITDA 17.6 18.2 3
Underlying EBIT 12.1 10.6 (13)
Underlying profit before tax 11.0 8.7 (21)
Underlying profit after tax 8.2 6.9 (16)
Statutory profit before tax 11.0 6.2 (43)
Statutory profit after tax 8.2 5.2 (37)
Diluted earnings per share (cents) 2.72 1.72 (37)
Dividends per share (cents) 2.65 1.0 (62)
3
For
per
sona
l use
onl
y

Half-on-half results
H2: 76.4
H1: 60.9
H2: 80.2
H1: 67.8
H2: 13.7
H1: 4.5
H2: 5.8
H1: 1.1
H2: 10.3
H1: 7.3
H2: 4.7
H1: 3.5 4
For
per
sona
l use
onl
y
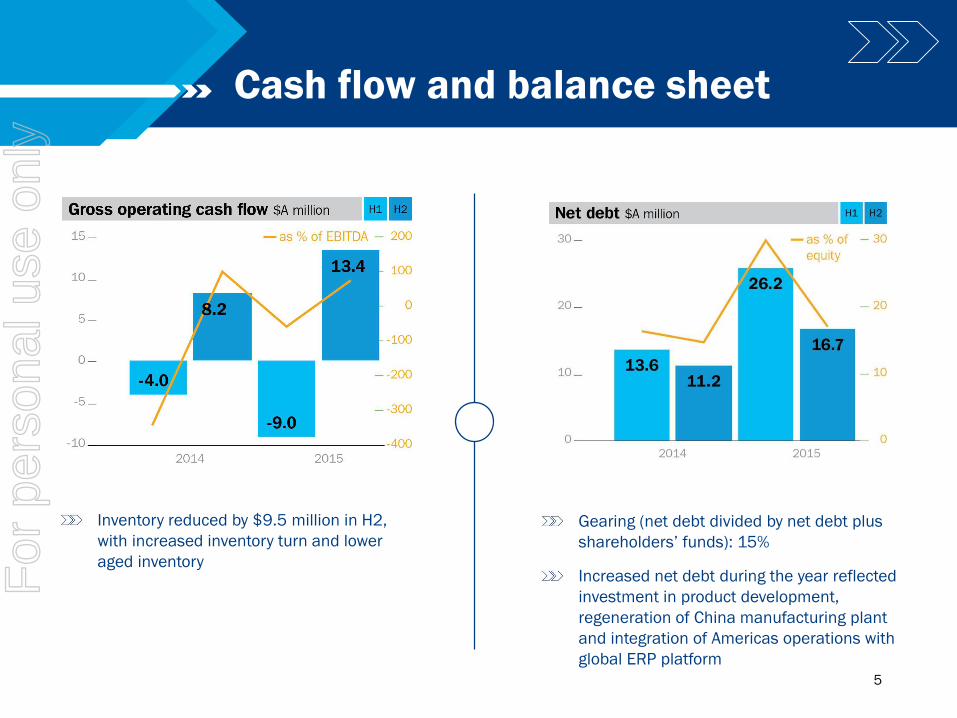
Cash flow and balance sheet
Inventory reduced by $9.5 million in H2,
with increased inventory turn and lower
aged inventory
Gearing (net debt divided by net debt plus
shareholders’ funds): 15%
Increased net debt during the year reflected
investment in product development,
regeneration of China manufacturing plant
and integration of Americas operations with
global ERP platform
5
For
per
sona
l use
onl
y
Heading
Sub Heading
STRATEGY UPDATE
6
For
per
sona
l use
onl
y
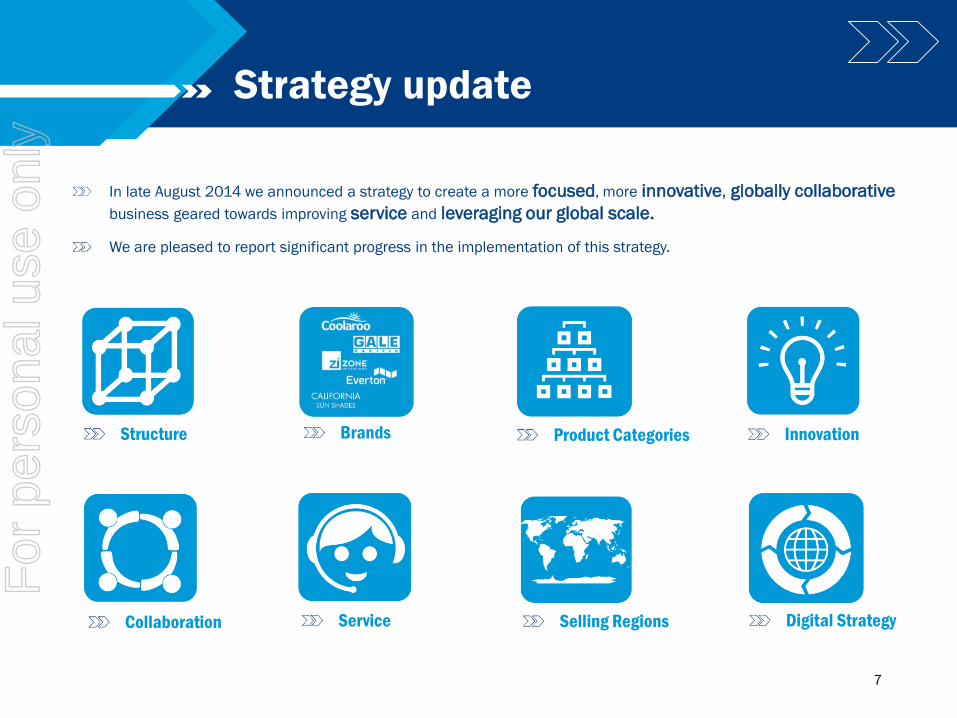
Strategy update
InnovationStructure Product CategoriesBrands
Digital StrategyService Selling RegionsCollaboration
In late August 2014 we announced a strategy to create a more focused, more innovative, globally collaborative
business geared towards improving service and leveraging our global scale.
We are pleased to report significant progress in the implementation of this strategy.
7
For
per
sona
l use
onl
y

Strategy update: achievements - 1
Structure
Brands
Product Categories
Global organisational structure
Global supply chain model to improve working capital management and
leverage company’s scale in procurement
14 brands reduced to 5
Investment in less brands enables us to make them more meaningful to
consumers and customers
Product category strategy defined
Plans to exit non-strategic categories and focus on core business
8
For
per
sona
l use
onl
y

Brand execution
Decision to exit brands with low consumer equity, enabling focus on smaller number of brands
Stringent brand guidelines established with reinvigorated packaging, websites, etc.
EVERTON pool fencing and balustrade range relaunched, increasing point-of-sale performance
New range of ZONE Interiors blinds introduced
9
For
per
sona
l use
onl
y
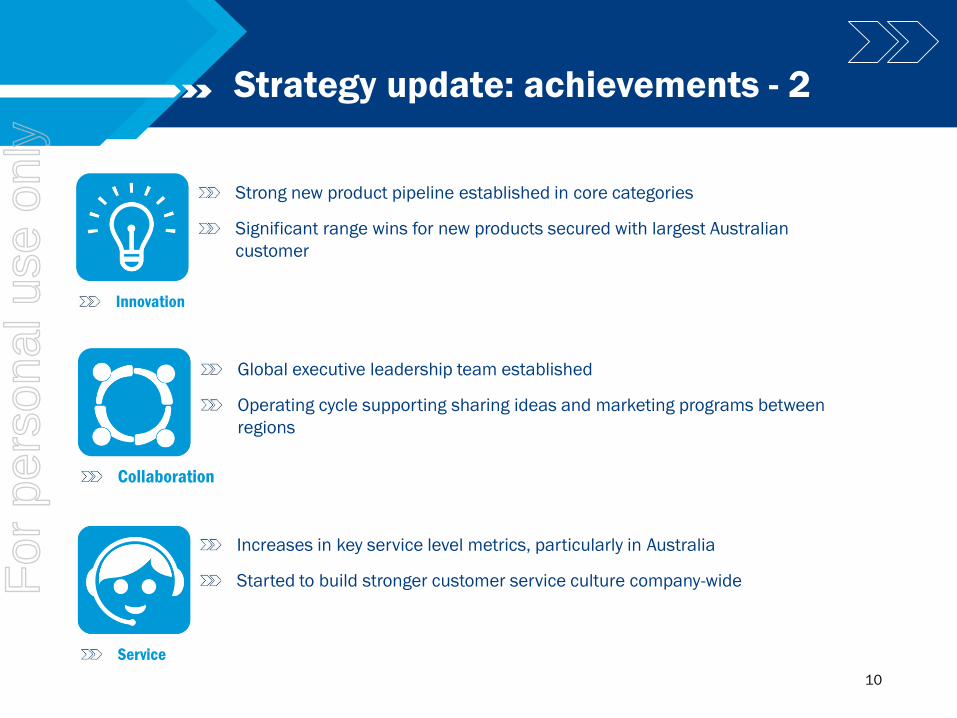
Strategy update: achievements - 2
Innovation
Collaboration
Service
Strong new product pipeline established in core categories
Significant range wins for new products secured with largest Australian
customer
Global executive leadership team established
Operating cycle supporting sharing ideas and marketing programs between
regions
Increases in key service level metrics, particularly in Australia
Started to build stronger customer service culture company-wide
10
For
per
sona
l use
onl
y
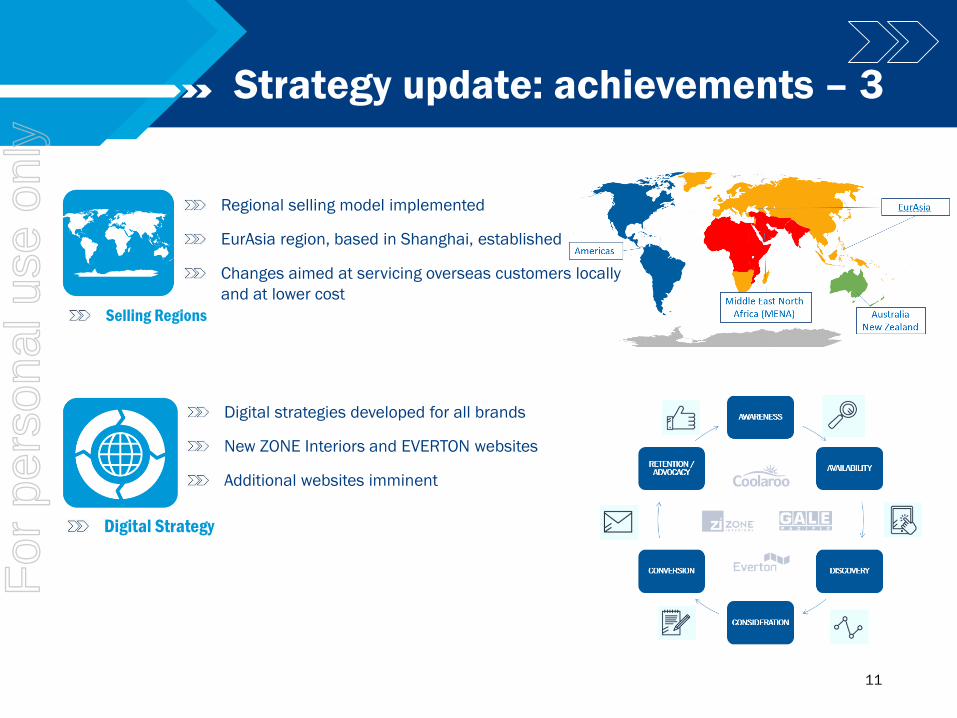
Digital Strategy
Selling Regions
Strategy update: achievements – 3
Regional selling model implemented
EurAsia region, based in Shanghai, established
Changes aimed at servicing overseas customers locally
and at lower cost
Digital strategies developed for all brands
New ZONE Interiors and EVERTON websites
Additional websites imminent
11
For
per
sona
l use
onl
y
Heading
Sub Heading
EFFICIENCY & EFFECTIVENESS
12
For
per
sona
l use
onl
y
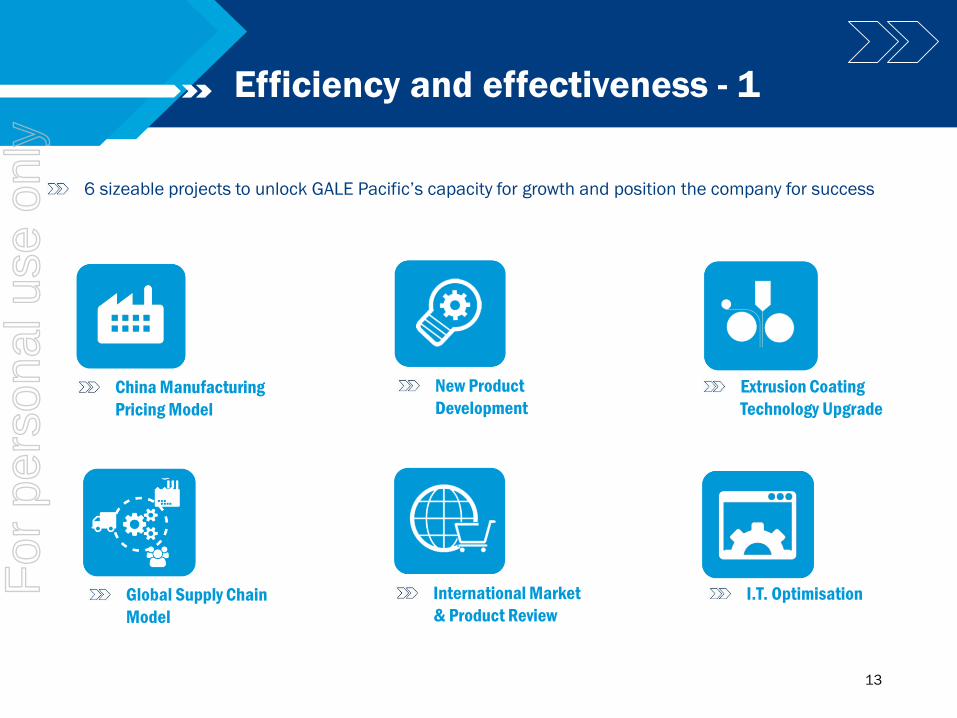
Efficiency and effectiveness - 1
China Manufacturing
Pricing Model
Extrusion Coating
Technology Upgrade
New Product
Development
International Market
& Product Review
I.T. Optimisation Global Supply Chain
Model
6 sizeable projects to unlock GALE Pacific’s capacity for growth and position the company for success
13
For
per
sona
l use
onl
y

Extrusion Coating Technology Upgrade
Efficiency and effectiveness - 2
China Manufacturing Pricing Model
New Product Development
China manufacturing operation established as a cost centre rather than a profit
centre, effective 1 July 2015
Improves visibility of regional profitability and transitions focus in China to quality,
manufacturing efficiency and service
Research and development processes improved
Focus on fewer, but larger, more global projects
Strong new product pipeline and impressive ranging wins
New operating system and scanning technology for Australian-based extrusion
coating plant
Quality improvements and production efficiencies already being achieved
14
For
per
sona
l use
onl
y
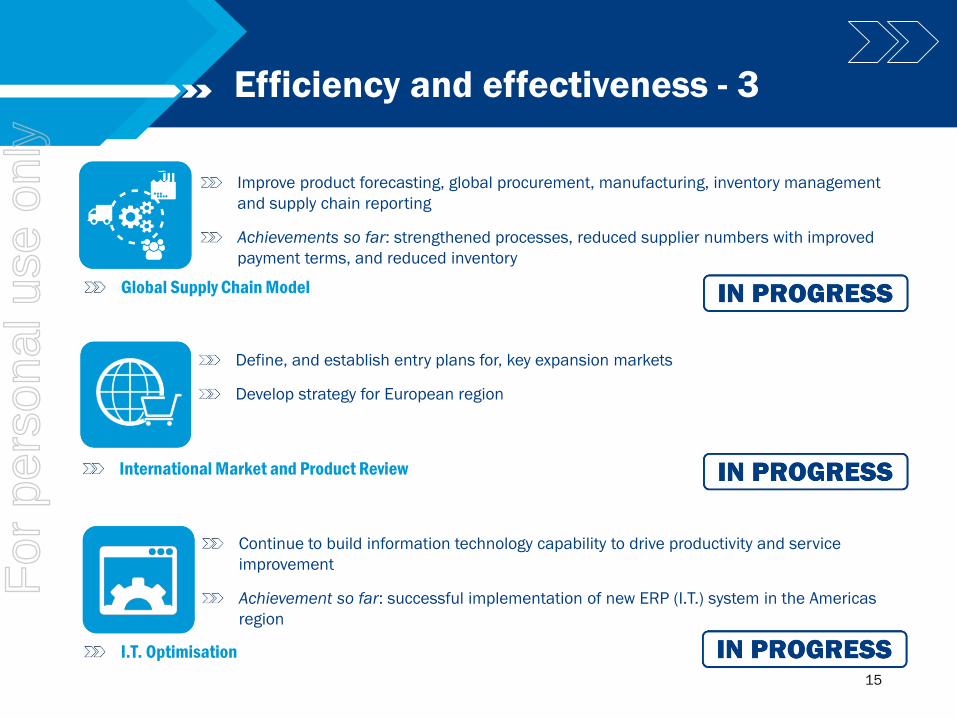
International Market and Product Review
I.T. Optimisation
Efficiency and effectiveness - 3
Global Supply Chain Model
Improve product forecasting, global procurement, manufacturing, inventory management
and supply chain reporting
Achievements so far: strengthened processes, reduced supplier numbers with improved
payment terms, and reduced inventory
Define, and establish entry plans for, key expansion markets
Develop strategy for European region
Continue to build information technology capability to drive productivity and service
improvement
Achievement so far: successful implementation of new ERP (I.T.) system in the Americas
region
15
For
per
sona
l use
onl
y

Heading
Sub Heading
REGIONS
16
For
per
sona
l use
onl
y
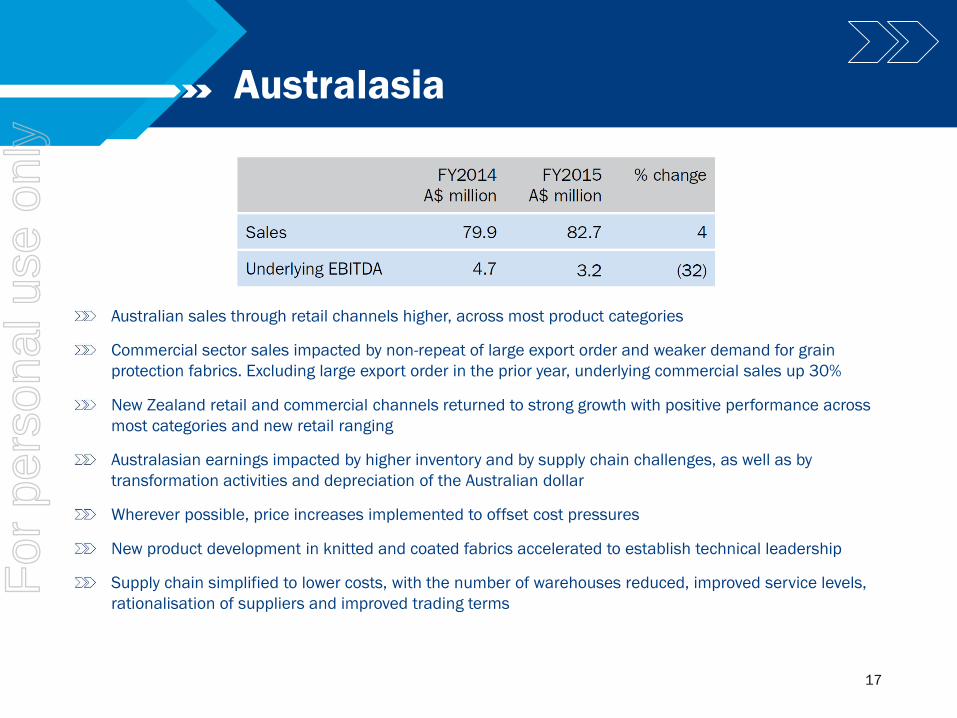
Australasia
Australian sales through retail channels higher, across most product categories
Commercial sector sales impacted by non-repeat of large export order and weaker demand for grain
protection fabrics. Excluding large export order in the prior year, underlying commercial sales up 30%
New Zealand retail and commercial channels returned to strong growth with positive performance across
most categories and new retail ranging
Australasian earnings impacted by higher inventory and by supply chain challenges, as well as by
transformation activities and depreciation of the Australian dollar
Wherever possible, price increases implemented to offset cost pressures
New product development in knitted and coated fabrics accelerated to establish technical leadership
Supply chain simplified to lower costs, with the number of warehouses reduced, improved service levels,
rationalisation of suppliers and improved trading terms
17
For
per
sona
l use
onl
y
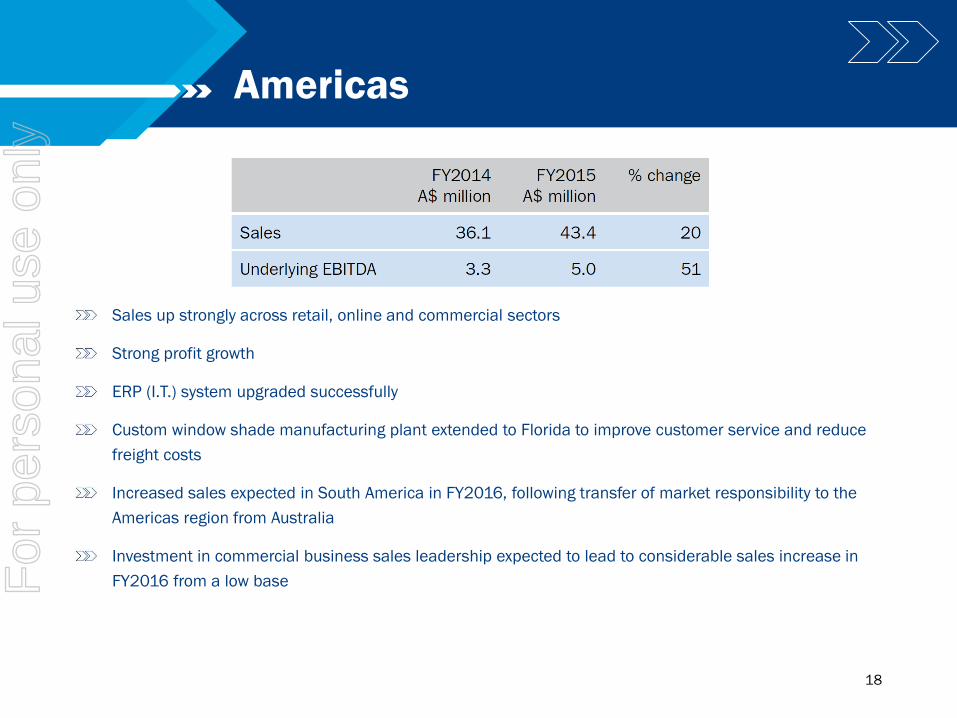
Americas
Sales up strongly across retail, online and commercial sectors
Strong profit growth
ERP (I.T.) system upgraded successfully
Custom window shade manufacturing plant extended to Florida to improve customer service and reduce
freight costs
Increased sales expected in South America in FY2016, following transfer of market responsibility to the
Americas region from Australia
Investment in commercial business sales leadership expected to lead to considerable sales increase in
FY2016 from a low base
18
For
per
sona
l use
onl
y
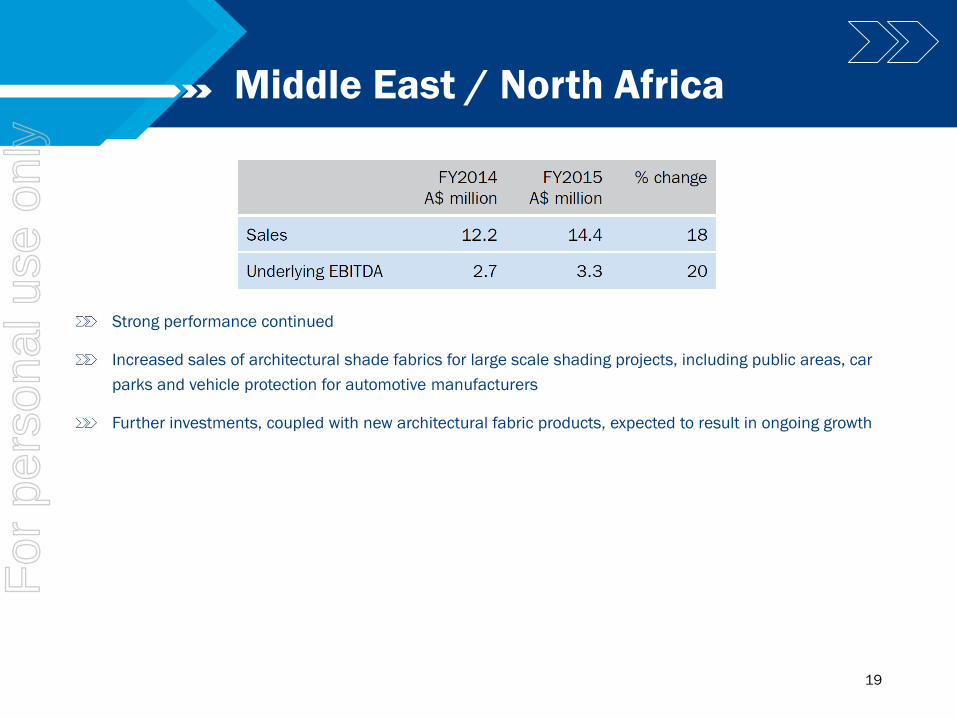
Middle East / North Africa
Strong performance continued
Increased sales of architectural shade fabrics for large scale shading projects, including public areas, car
parks and vehicle protection for automotive manufacturers
Further investments, coupled with new architectural fabric products, expected to result in ongoing growth
19
For
per
sona
l use
onl
y
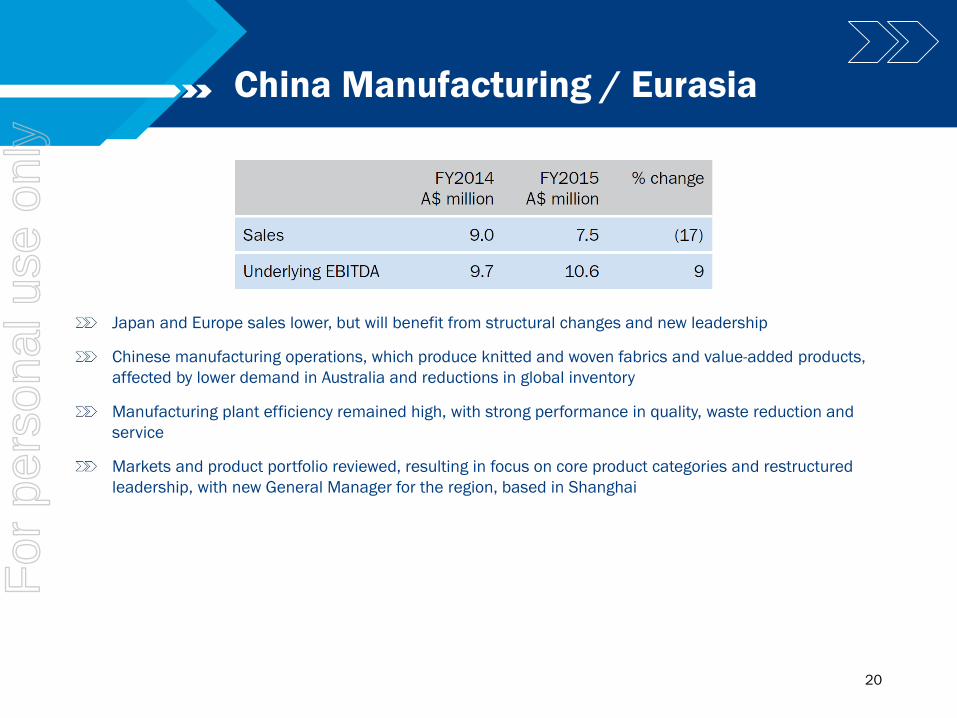
China Manufacturing / Eurasia
Japan and Europe sales lower, but will benefit from structural changes and new leadership
Chinese manufacturing operations, which produce knitted and woven fabrics and value-added products,
affected by lower demand in Australia and reductions in global inventory
Manufacturing plant efficiency remained high, with strong performance in quality, waste reduction and
service
Markets and product portfolio reviewed, resulting in focus on core product categories and restructured
leadership, with new General Manager for the region, based in Shanghai
20
For
per
sona
l use
onl
y
Heading
Sub Heading
LOOKING FORWARD
21
For
per
sona
l use
onl
y
Looking Forward
The next phase of the company’s transformation will focus on:
Successful execution of the significant new business won across product
categories in Australia;
Building a more robust global supply chain with improvements in product
forecasting, procurement, manufacturing and inventory management;
Advancing new product development, particularly in the area of commercial
fabrics;
Building strategies for accelerated commercial sector growth in all regions;
Developing a strong EurAsia selling region; and
Continuing to optimise the company’s information technology platform to
reduce costs and improve service.
We are confident that GALE Pacific is well positioned to deliver strong sales and
earnings growth.
22
For
per
sona
l use
onl
y

Disclaimer
Statements contained in this presentation, particularly those regarding possible or assumed future performance, estimated company earnings, potential growth of the company, industry growth or other trend projections are or may be forward looking statements. Such statements relate to future events and expectations and therefore involve unknown risks and uncertainties. Actual results may differ materially from those expressed or implied by these forward looking statements.
23
For
per
sona
l use
onl
y