Embed Size (px)
Citation preview
1H19 Results Presentation
1H19 Results presentation
Collection House LimitedFebruary 2019F
or p
erso
nal u
se o
nly
1H19 Results Presentation
The material in this presentation has been prepared by Collection House Limited ABN 74 010 230 716 (CLH Group) and is general background informationabout CLH Group activities current as at the date of this presentation. This information is given in summary form and does not purport to be complete. Itshould be read in conjunction with continuous disclosure announcements and all other information which CLH Group has lodged with the AustralianSecurities Exchange (ASX).
Financial information provided may include certain non-IFRS measures which have not been specifically audited in accordance with Australian AuditingStandards. These measures are used internally by CLH Group to assess the performance of the business and make decisions. Non-IFRS measures should notbe considered as an indication of or alterative to an IFRS measure of profitability, financial performance or liquidity.
Information in this presentation, including forecast financial information, should not be considered as advice or a recommendation to investors or potentialinvestors in relation to holding, purchasing or selling securities or other financial products or instruments and does not take into account your particularinvestment objectives, financial situation or needs. Before acting on any information you should consider the appropriateness of the information having regardto these matters, any relevant offer document and in particular, you should seek independent financial advice. All securities and financial product orinstrument transactions involve risks, which include (among others) the risk of adverse or unanticipated market, financial or political developments and, ininternational transactions, currency risk.
To the maximum extent permitted by law, CLH Group, including their related corporate bodies, directors, officers and employees, exclude all liability arisingfrom fault or negligence for any loss or damage (including without limitation, indirect, special or consequential damages) arising from the use or reliance onany of this information, including any error or omission, or otherwise arising in connection with it.
This presentation may contain forward looking statements including statements regarding our intent, belief or current expectations with respect to CLHGroup’s businesses and operations, market conditions, results of operation and financial condition, capital adequacy, specific provisions and risk managementpractices. Forward-looking statements can generally be identified by the use of words such as “guidance”, “objective”, “outlook”, “anticipate”, “project”,“expect”, “believe”, “forecast”, “estimate”, “intend”, “should”, “could”, “may”, “target”, “plan” and other similar expressions. Readers are cautioned not to placeundue reliance on these forward looking statements. CLH Group does not undertake any obligation to publicly release the result of any revisions to theseforward looking statements to reflect events or circumstances after the date hereof to reflect the occurrence of unanticipated events. While due care hasbeen used in the preparation of forecast information, actual results may vary in a materially positive or negative manner. Forward looking statements,forecasts and hypothetical examples are not guarantees of future performance and involve risks, uncertainties and other factors which may be outside CLHGroup’s control. Past performance is not a reliable indication of future performance.
2
DISCLAIMER
For
per
sona
l use
onl
y
1H19 Results Presentation
1H19 REVIEW
Company summary
3
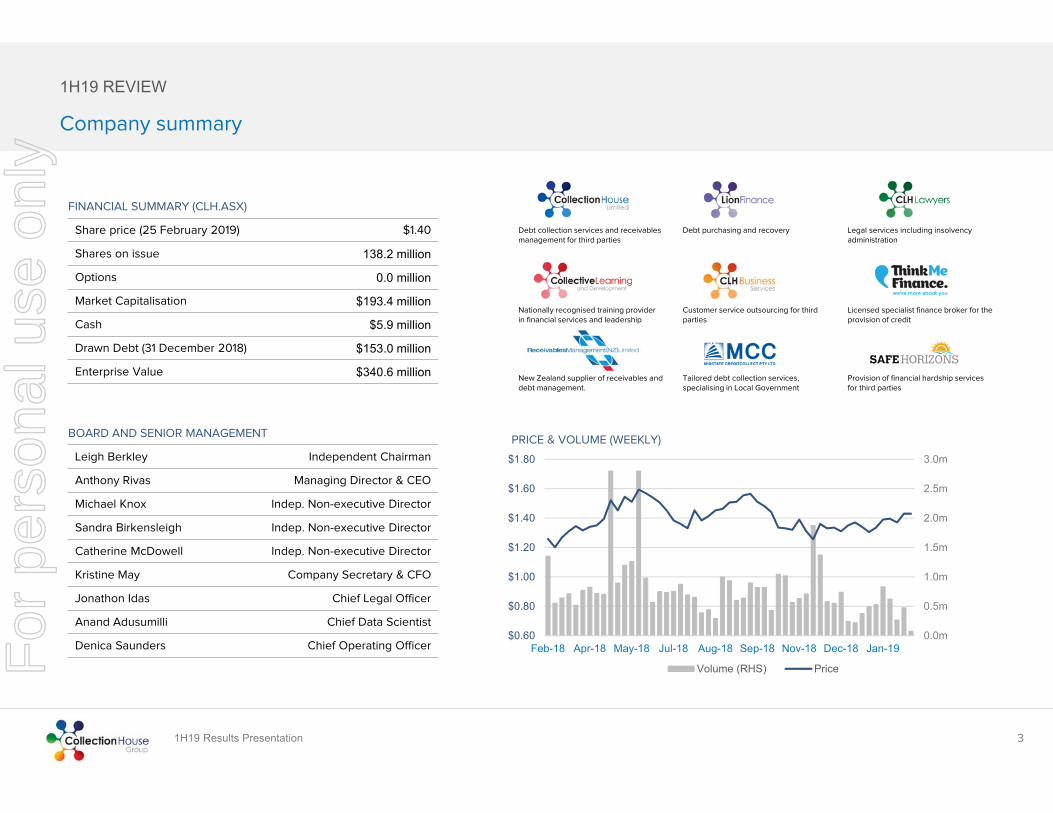
Debt collection services and receivables management for third parties
Debt purchasing and recovery Legal services including insolvency administration
Nationally recognised training provider in financial services and leadership
Customer service outsourcing for third parties
Licensed specialist finance broker for the provision of credit
New Zealand supplier of receivables and debt management.
Tailored debt collection services,specialising in Local Government
Provision of financial hardship services for third parties
FINANCIAL SUMMARY (CLH.ASX)
Share price (25 February 2019) $1.40
Shares on issue 138.2 million
Options 0.0 million
Market Capitalisation $193.4 million
Cash $5.9 million
Drawn Debt (31 December 2018) $153.0 million
Enterprise Value $340.6 million
BOARD AND SENIOR MANAGEMENT
Leigh Berkley Independent Chairman
Anthony Rivas Managing Director & CEO
Michael Knox Indep. Non-executive Director
Sandra Birkensleigh Indep. Non-executive Director
Catherine McDowell Indep. Non-executive Director
Kristine May Company Secretary & CFO
Jonathon Idas Chief Legal Officer
Anand Adusumilli Chief Data Scientist
Denica Saunders Chief Operating Officer0.0m
0.5m
1.0m
1.5m
2.0m
2.5m
3.0m
$0.60
$0.80
$1.00
$1.20
$1.40
$1.60
$1.80
Feb-18 Apr-18 May-18 Jul-18 Aug-18 Sep-18 Nov-18 Dec-18 Jan-19
PRICE & VOLUME (WEEKLY)
Volume (RHS) PriceFor
per
sona
l use
onl
y
1H19 Results Presentation 4
1H19 ACHIEVEMENTS
Continued progress thanks to our investment in productivity and analytics
Group revenue of $66.0 million, (1H18: $63.4m) up 4% on pcp. Normalised Group EBIT of $15.9m was up 6% on pcp.
The Purchase Debt Ledger segment reported revenue of $34.0 million, up 12% on 1H18. An improved margin lifted the Segment EBIT contribution by 18% to $14.7m (1H18: $12.4m).
Active repayment Arrangements continued their uptrend to $431 million from $320 million at the end of 1H18. We expect this improvement to continue.
Collection Services reported revenue of $32.2m which was down 3% on 1H18. Once again some client revenue was deferred in the first half which led to a weak seasonal period.
Segment EBIT fell 8% to $5.0m (1H18: $5.5m) with the Royal Commission impacting demand during the period. We expect a much improved 2H19 and to report divisional profits for the full year in line with FY18.
Equity Investment of $8.5 million in Volt Corporation Ltd (Volt), the holding company of Australia’s first digital bank, VoltBank Ltd (Volt Bank)
Acquisition of New Zealand-based Receivables Management (NZ) Limited ("RML") for a total cash consideration of NZ$14.1m (approx. A$13.4m)
We have increased our PDL purchase guidance by approximately 12% (midpoint) to $87-92m a record for the group.
Our FY19 guidance is maintained: EPS of 15.2¢ps-15.5¢ps or 19.2¢ps-19.5¢ps including the PEP.
The first half dividend of 4.1¢ps represents a small improvement on pcp ( 1H18: 3.9¢ps) and the DRP is once again available to shareholders at a 2.5% discount.F
or p
erso
nal u
se o
nly
1H19 Results Presentation 5
1H19 RESULTS SUMMARY
PDL growth good, partially offset by Collection Services
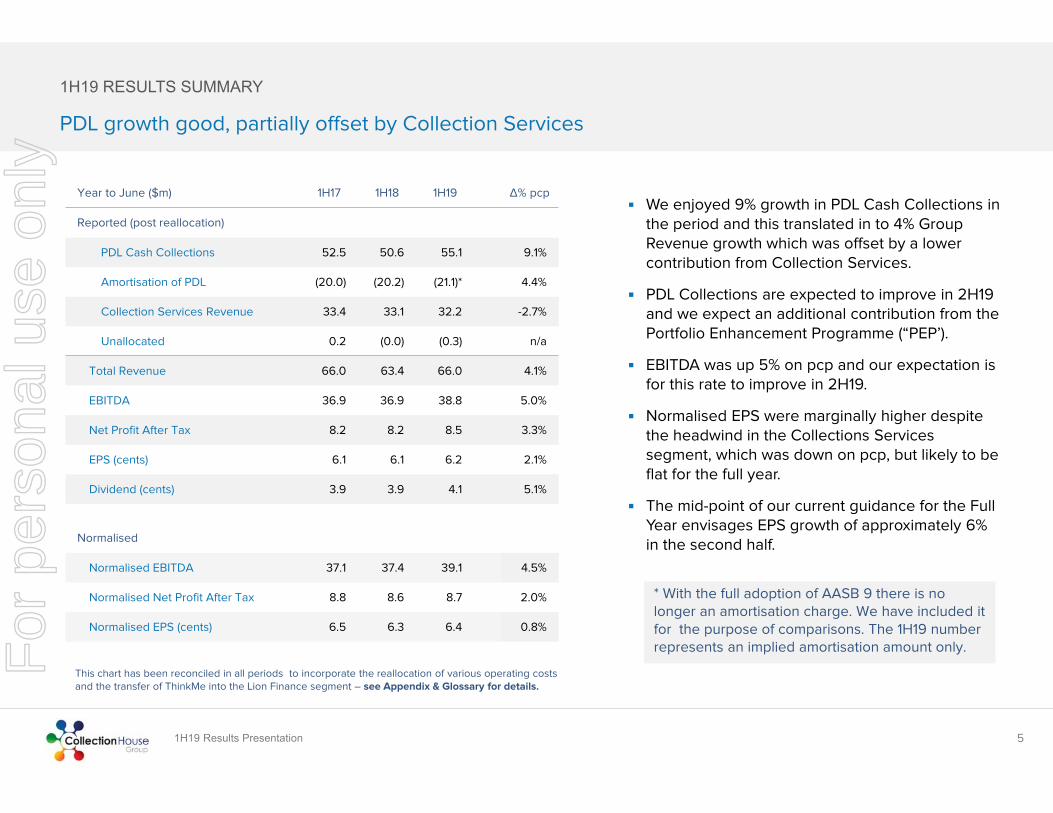
We enjoyed 9% growth in PDL Cash Collections in the period and this translated in to 4% Group Revenue growth which was offset by a lower contribution from Collection Services.
PDL Collections are expected to improve in 2H19 and we expect an additional contribution from the Portfolio Enhancement Programme (“PEP’).
EBITDA was up 5% on pcp and our expectation is for this rate to improve in 2H19.
Normalised EPS were marginally higher despite the headwind in the Collections Services segment, which was down on pcp, but likely to be flat for the full year.
The mid-point of our current guidance for the Full Year envisages EPS growth of approximately 6% in the second half.
This chart has been reconciled in all periods to incorporate the reallocation of various operating costs and the transfer of ThinkMe into the Lion Finance segment – see Appendix & Glossary for details.
Year to June ($m) 1H17 1H18 1H19 Δ% pcp
Reported (post reallocation)
PDL Cash Collections 52.5 50.6 55.1 9.1%
Amortisation of PDL (20.0) (20.2) (21.1)* 4.4%
Collection Services Revenue 33.4 33.1 32.2 -2.7%
Unallocated 0.2 (0.0) (0.3) n/a
Total Revenue 66.0 63.4 66.0 4.1%
EBITDA 36.9 36.9 38.8 5.0%
Net Profit After Tax 8.2 8.2 8.5 3.3%
EPS (cents) 6.1 6.1 6.2 2.1%
Dividend (cents) 3.9 3.9 4.1 5.1%
Normalised
Normalised EBITDA 37.1 37.4 39.1 4.5%
Normalised Net Profit After Tax 8.8 8.6 8.7 2.0%
Normalised EPS (cents) 6.5 6.3 6.4 0.8%
* With the full adoption of AASB 9 there is no longer an amortisation charge. We have included it for the purpose of comparisons. The 1H19 number represents an implied amortisation amount only.F
or p
erso
nal u
se o
nly
1H19 Results Presentation
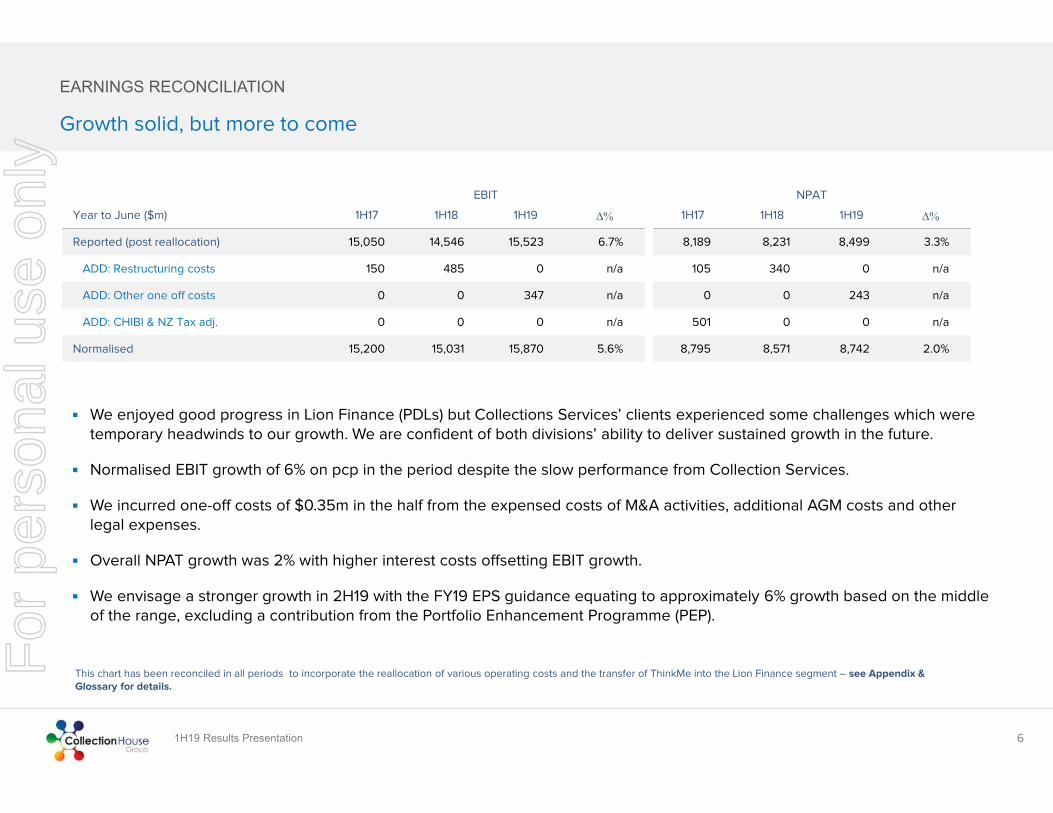
We enjoyed good progress in Lion Finance (PDLs) but Collections Services’ clients experienced some challenges which were temporary headwinds to our growth. We are confident of both divisions’ ability to deliver sustained growth in the future.
Normalised EBIT growth of 6% on pcp in the period despite the slow performance from Collection Services.
We incurred one-off costs of $0.35m in the half from the expensed costs of M&A activities, additional AGM costs and other legal expenses.
Overall NPAT growth was 2% with higher interest costs offsetting EBIT growth.
We envisage a stronger growth in 2H19 with the FY19 EPS guidance equating to approximately 6% growth based on the middle of the range, excluding a contribution from the Portfolio Enhancement Programme (PEP).
6
EARNINGS RECONCILIATION
Growth solid, but more to come
EBIT NPAT
Year to June ($m) 1H17 1H18 1H19 1H17 1H18 1H19
Reported (post reallocation) 15,050 14,546 15,523 6.7% 8,189 8,231 8,499 3.3%
ADD: Restructuring costs 150 485 0 n/a 105 340 0 n/a
ADD: Other one off costs 0 0 347 n/a 0 0 243 n/a
ADD: CHIBI & NZ Tax adj. 0 0 0 n/a 501 0 0 n/a
Normalised 15,200 15,031 15,870 5.6% 8,795 8,571 8,742 2.0%
This chart has been reconciled in all periods to incorporate the reallocation of various operating costs and the transfer of ThinkMe into the Lion Finance segment – see Appendix & Glossary for details.
For
per
sona
l use
onl
y
1H19 Results Presentation
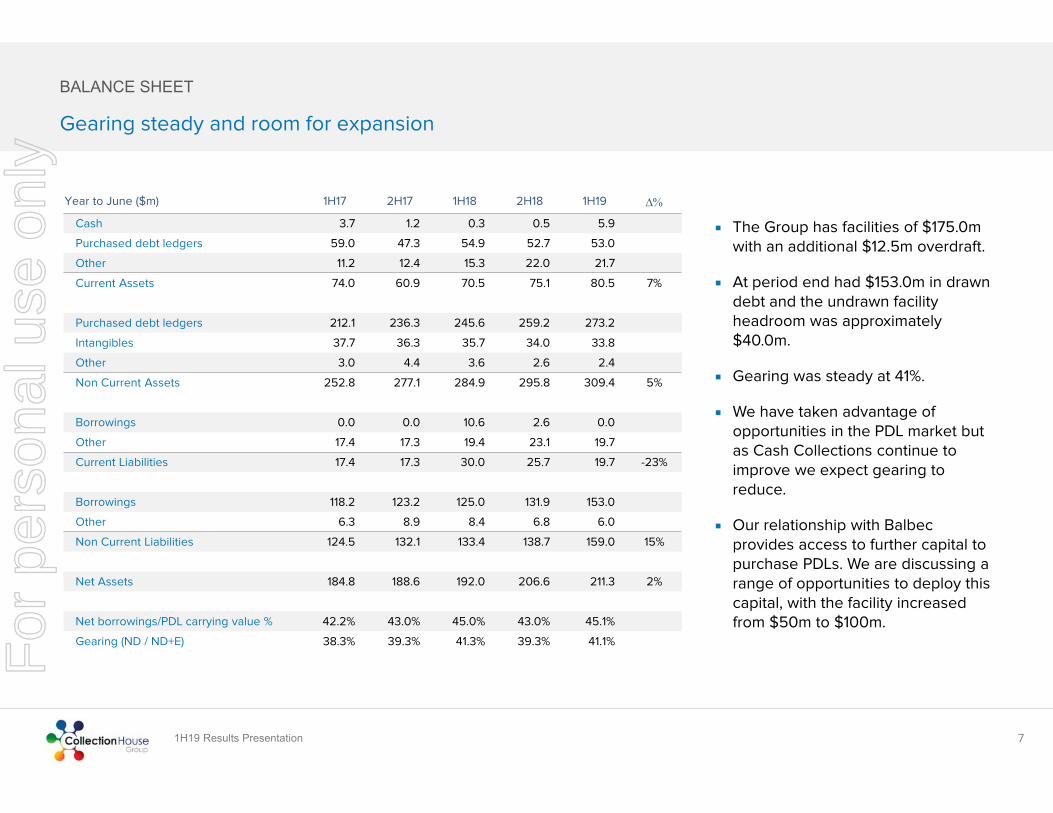
The Group has facilities of $175.0m with an additional $12.5m overdraft.
At period end had $153.0m in drawn debt and the undrawn facility headroom was approximately $40.0m.
Gearing was steady at 41%.
We have taken advantage of opportunities in the PDL market but as Cash Collections continue to improve we expect gearing to reduce.
Our relationship with Balbec provides access to further capital to purchase PDLs. We are discussing a range of opportunities to deploy this capital, with the facility increased from $50m to $100m.
7
BALANCE SHEET
Gearing steady and room for expansion
Year to June ($m) 1H17 2H17 1H18 2H18 1H19
Cash 3.7 1.2 0.3 0.5 5.9
Purchased debt ledgers 59.0 47.3 54.9 52.7 53.0
Other 11.2 12.4 15.3 22.0 21.7
Current Assets 74.0 60.9 70.5 75.1 80.5 7%
Purchased debt ledgers 212.1 236.3 245.6 259.2 273.2
Intangibles 37.7 36.3 35.7 34.0 33.8
Other 3.0 4.4 3.6 2.6 2.4
Non Current Assets 252.8 277.1 284.9 295.8 309.4 5%
Borrowings 0.0 0.0 10.6 2.6 0.0
Other 17.4 17.3 19.4 23.1 19.7
Current Liabilities 17.4 17.3 30.0 25.7 19.7 -23%
Borrowings 118.2 123.2 125.0 131.9 153.0
Other 6.3 8.9 8.4 6.8 6.0
Non Current Liabilities 124.5 132.1 133.4 138.7 159.0 15%
Net Assets 184.8 188.6 192.0 206.6 211.3 2%
Net borrowings/PDL carrying value % 42.2% 43.0% 45.0% 43.0% 45.1%
Gearing (ND / ND+E) 38.3% 39.3% 41.3% 39.3% 41.1%For
per
sona
l use
onl
y
1H19 Results Presentation
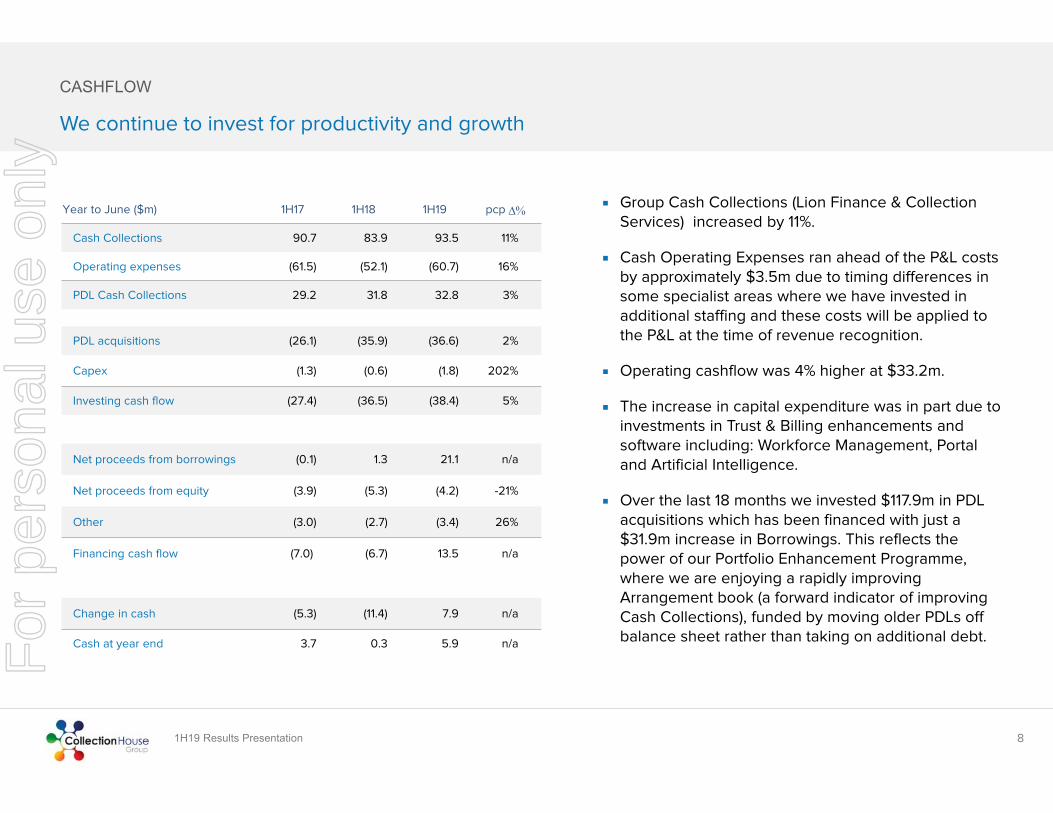
Group Cash Collections (Lion Finance & Collection Services) increased by 11%.
Cash Operating Expenses ran ahead of the P&L costs by approximately $3.5m due to timing differences in some specialist areas where we have invested in additional staffing and these costs will be applied to the P&L at the time of revenue recognition.
Operating cashflow was 4% higher at $33.2m.
The increase in capital expenditure was in part due to investments in Trust & Billing enhancements and software including: Workforce Management, Portal and Artificial Intelligence.
Over the last 18 months we invested $117.9m in PDL acquisitions which has been financed with just a $31.9m increase in Borrowings. This reflects the power of our Portfolio Enhancement Programme, where we are enjoying a rapidly improving Arrangement book (a forward indicator of improving Cash Collections), funded by moving older PDLs off balance sheet rather than taking on additional debt.
8
CASHFLOW
We continue to invest for productivity and growth
Year to June ($m) 1H17 1H18 1H19 pcp
Cash Collections 90.7 83.9 93.5 11%
Operating expenses (61.5) (52.1) (60.7) 16%
PDL Cash Collections 29.2 31.8 32.8 3%
PDL acquisitions (26.1) (35.9) (36.6) 2%
Capex (1.3) (0.6) (1.8) 202%
Investing cash flow (27.4) (36.5) (38.4) 5%
Net proceeds from borrowings (0.1) 1.3 21.1 n/a
Net proceeds from equity (3.9) (5.3) (4.2) -21%
Other (3.0) (2.7) (3.4) 26%
Financing cash flow (7.0) (6.7) 13.5 n/a
Change in cash (5.3) (11.4) 7.9 n/a
Cash at year end 3.7 0.3 5.9 n/aFor
per
sona
l use
onl
y
1H19 Results Presentation
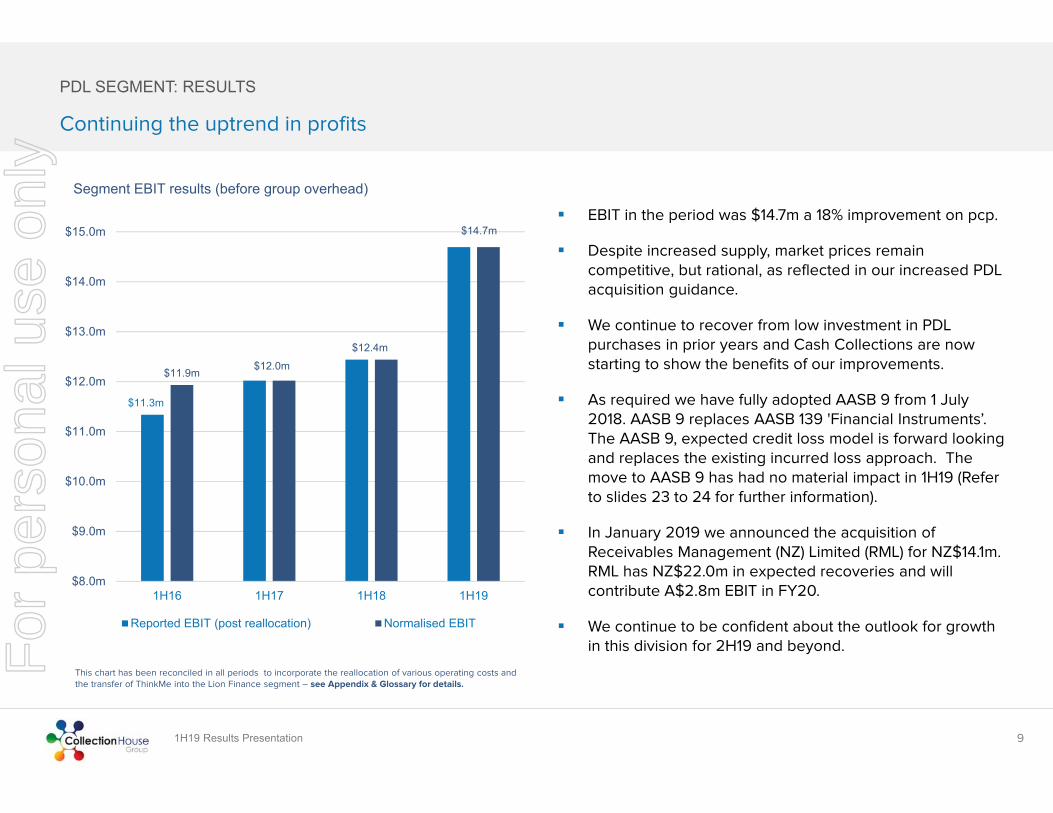
EBIT in the period was $14.7m a 18% improvement on pcp.
Despite increased supply, market prices remain competitive, but rational, as reflected in our increased PDL acquisition guidance.
We continue to recover from low investment in PDL purchases in prior years and Cash Collections are now starting to show the benefits of our improvements.
As required we have fully adopted AASB 9 from 1 July 2018. AASB 9 replaces AASB 139 'Financial Instruments’. The AASB 9, expected credit loss model is forward looking and replaces the existing incurred loss approach. The move to AASB 9 has had no material impact in 1H19 (Refer to slides 23 to 24 for further information).
In January 2019 we announced the acquisition of Receivables Management (NZ) Limited (RML) for NZ$14.1m. RML has NZ$22.0m in expected recoveries and will contribute A$2.8m EBIT in FY20.
We continue to be confident about the outlook for growth in this division for 2H19 and beyond.
9
PDL SEGMENT: RESULTS
Continuing the uptrend in profits
This chart has been reconciled in all periods to incorporate the reallocation of various operating costs and the transfer of ThinkMe into the Lion Finance segment – see Appendix & Glossary for details.
$11.3m
$11.9m $12.0m$12.4m
$14.7m
$8.0m
$9.0m
$10.0m
$11.0m
$12.0m
$13.0m
$14.0m
$15.0m
1H16 1H17 1H18 1H19
Segment EBIT results (before group overhead)
Reported EBIT (post reallocation) Normalised EBIT
For
per
sona
l use
onl
y
1H19 Results Presentation 10
LION FINANCE – PDL SEGMENT: OPERATIONAL
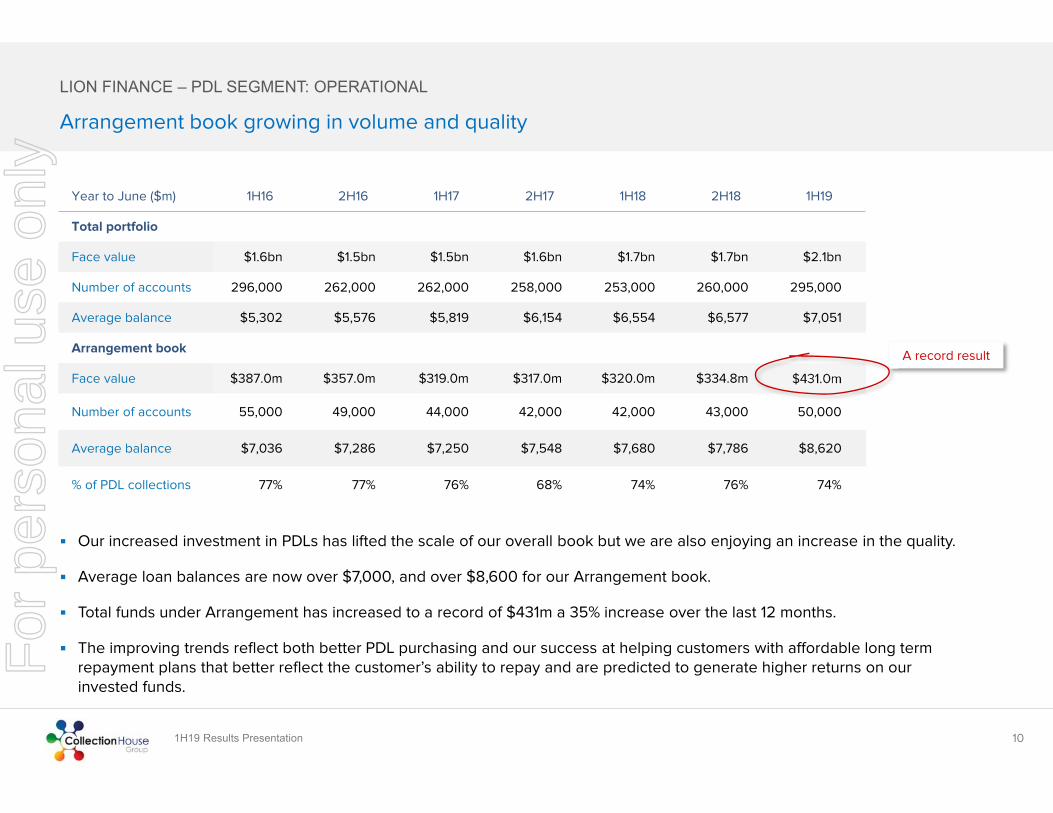
Our increased investment in PDLs has lifted the scale of our overall book but we are also enjoying an increase in the quality.
Average loan balances are now over $7,000, and over $8,600 for our Arrangement book.
Total funds under Arrangement has increased to a record of $431m a 35% increase over the last 12 months.
The improving trends reflect both better PDL purchasing and our success at helping customers with affordable long term repayment plans that better reflect the customer’s ability to repay and are predicted to generate higher returns on our invested funds.
Arrangement book growing in volume and quality
Year to June ($m) 1H16 2H16 1H17 2H17 1H18 2H18 1H19
Total portfolio
Face value $1.6bn $1.5bn $1.5bn $1.6bn $1.7bn $1.7bn $2.1bn
Number of accounts 296,000 262,000 262,000 258,000 253,000 260,000 295,000
Average balance $5,302 $5,576 $5,819 $6,154 $6,554 $6,577 $7,051
Arrangement book
Face value $387.0m $357.0m $319.0m $317.0m $320.0m $334.8m $431.0m
Number of accounts 55,000 49,000 44,000 42,000 42,000 43,000 50,000
Average balance $7,036 $7,286 $7,250 $7,548 $7,680 $7,786 $8,620
% of PDL collections 77% 77% 76% 68% 74% 76% 74%
A record result
For
per
sona
l use
onl
y
1H19 Results Presentation 11
LION FINANCE - PDL SEGMENT: POSITIVE TRENDS
Better collections methodologies and PDL purchasing now coming through
$0k
$100k
$200k
$300k
$400k
$500k
$600k
$700k
$800k
Online Self-serve Portal Monthly Collections
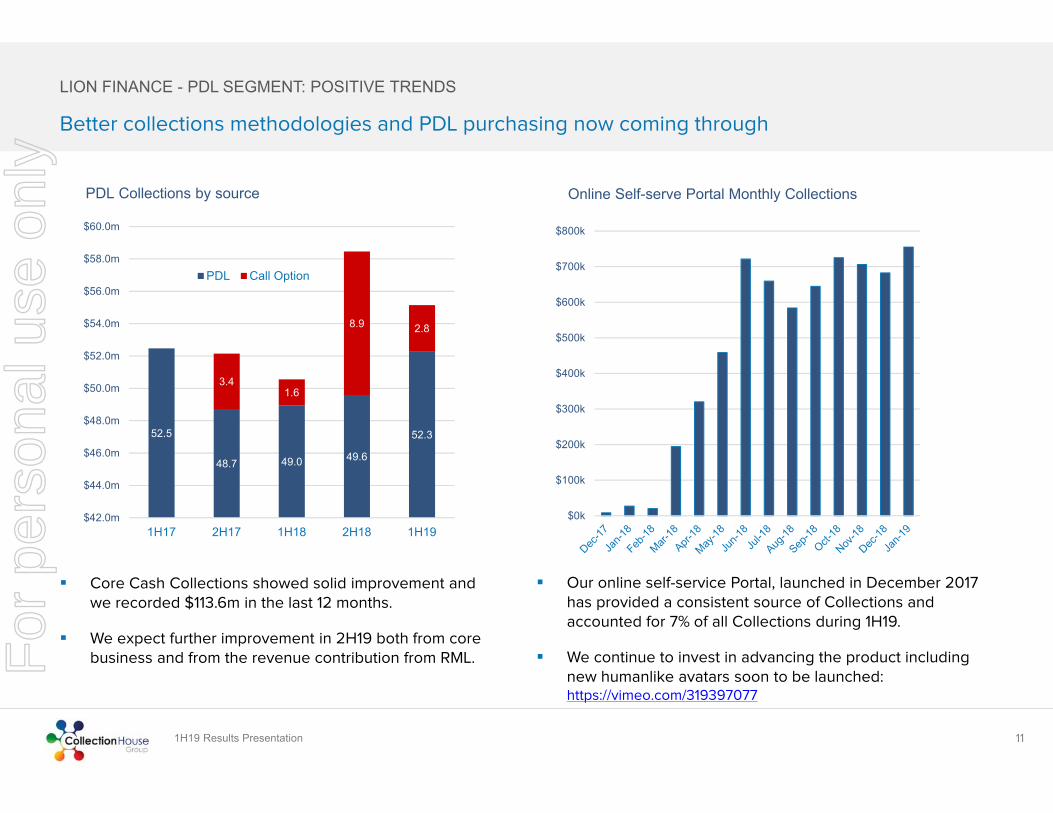
Core Cash Collections showed solid improvement and we recorded $113.6m in the last 12 months.
We expect further improvement in 2H19 both from core business and from the revenue contribution from RML.
Our online self-service Portal, launched in December 2017 has provided a consistent source of Collections and accounted for 7% of all Collections during 1H19.
We continue to invest in advancing the product including new humanlike avatars soon to be launched: https://vimeo.com/319397077
52.5
48.7 49.0 49.6
52.3
3.41.6
8.9 2.8
$42.0m
$44.0m
$46.0m
$48.0m
$50.0m
$52.0m
$54.0m
$56.0m
$58.0m
$60.0m
1H17 2H17 1H18 2H18 1H19
PDL Collections by source
PDL Call Option
For
per
sona
l use
onl
y
1H19 Results Presentation
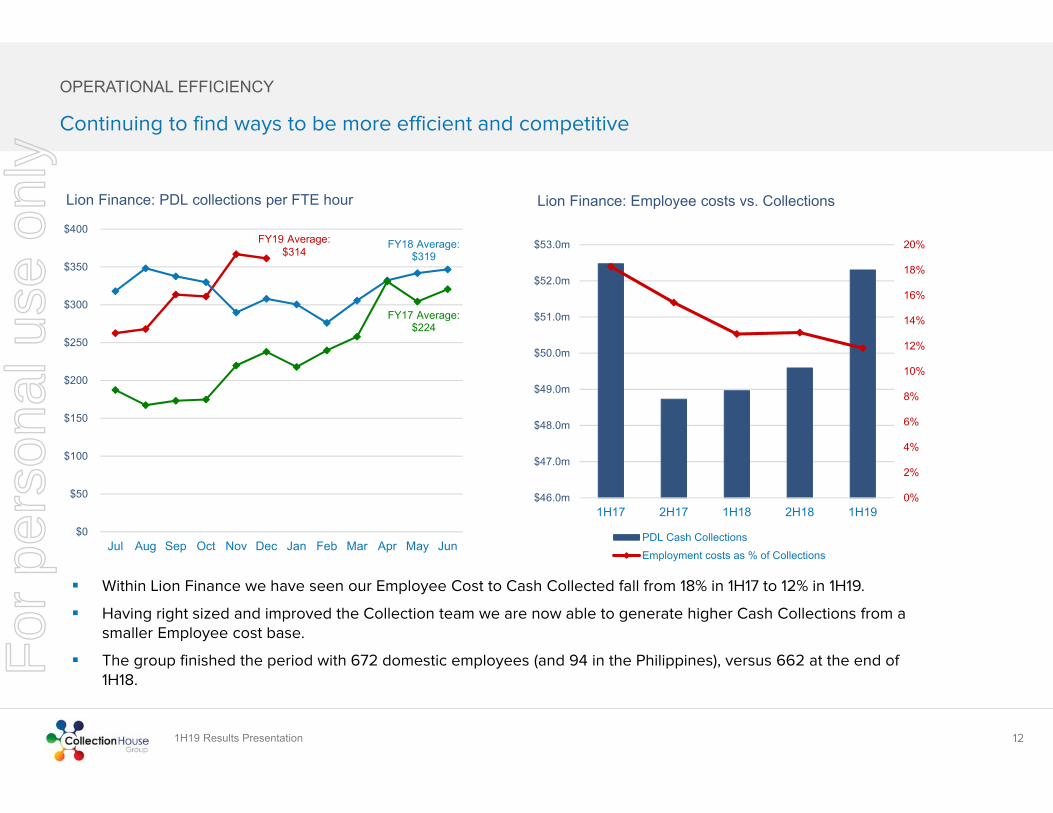
Within Lion Finance we have seen our Employee Cost to Cash Collected fall from 18% in 1H17 to 12% in 1H19.
Having right sized and improved the Collection team we are now able to generate higher Cash Collections from a smaller Employee cost base.
The group finished the period with 672 domestic employees (and 94 in the Philippines), versus 662 at the end of 1H18.
12
Continuing to find ways to be more efficient and competitive
OPERATIONAL EFFICIENCY
FY18 Average: $319
FY17 Average: $224
$0
$50
$100
$150
$200
$250
$300
$350
$400
Jul Aug Sep Oct Nov Dec Jan Feb Mar Apr May Jun
Lion Finance: PDL collections per FTE hour
FY19 Average: $314
0%
2%
4%
6%
8%
10%
12%
14%
16%
18%
20%
$46.0m
$47.0m
$48.0m
$49.0m
$50.0m
$51.0m
$52.0m
$53.0m
1H17 2H17 1H18 2H18 1H19
Lion Finance: Employee costs vs. Collections
PDL Cash CollectionsEmployment costs as % of Collections
For
per
sona
l use
onl
y
1H19 Results Presentation
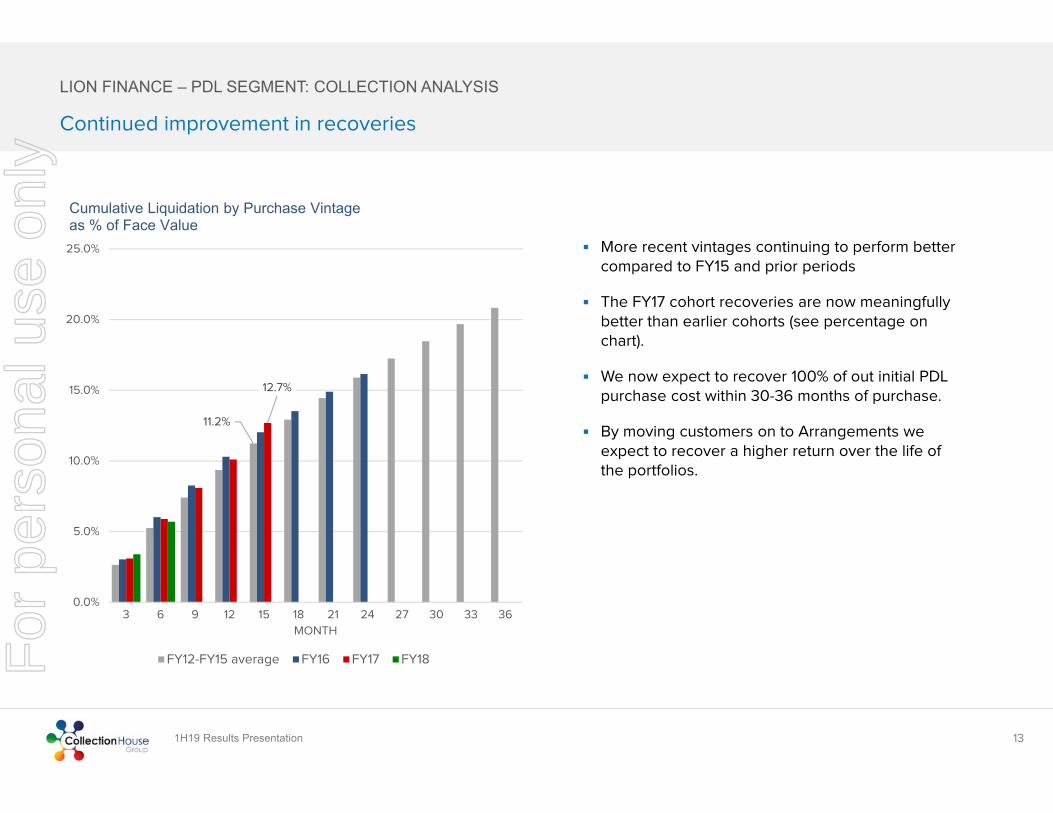
More recent vintages continuing to perform better compared to FY15 and prior periods
The FY17 cohort recoveries are now meaningfully better than earlier cohorts (see percentage on chart).
We now expect to recover 100% of out initial PDL purchase cost within 30-36 months of purchase.
By moving customers on to Arrangements we expect to recover a higher return over the life of the portfolios.
13
LION FINANCE – PDL SEGMENT: COLLECTION ANALYSIS
Continued improvement in recoveries
11.2%
12.7%
0.0%
5.0%
10.0%
15.0%
20.0%
25.0%
3 6 9 12 15 18 21 24 27 30 33 36
MONTH
Cumulative Liquidation by Purchase Vintage as % of Face Value
FY12-FY15 average FY16 FY17 FY18For
per
sona
l use
onl
y
1H19 Results Presentation
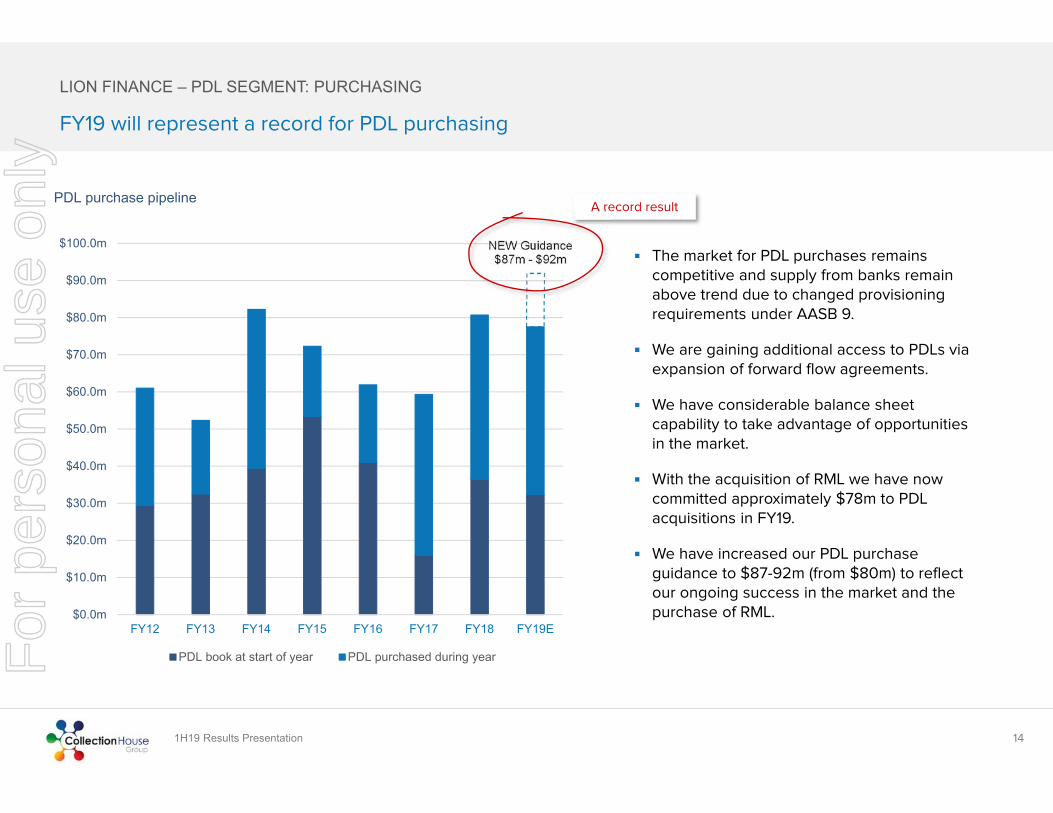
The market for PDL purchases remains competitive and supply from banks remain above trend due to changed provisioning requirements under AASB 9.
We are gaining additional access to PDLs via expansion of forward flow agreements.
We have considerable balance sheet capability to take advantage of opportunities in the market.
With the acquisition of RML we have now committed approximately $78m to PDL acquisitions in FY19.
We have increased our PDL purchase guidance to $87-92m (from $80m) to reflect our ongoing success in the market and the purchase of RML.
14
FY19 will represent a record for PDL purchasing
LION FINANCE – PDL SEGMENT: PURCHASING
NEW Guidance $87m - $92m
$0.0m
$10.0m
$20.0m
$30.0m
$40.0m
$50.0m
$60.0m
$70.0m
$80.0m
$90.0m
$100.0m
FY12 FY13 FY14 FY15 FY16 FY17 FY18 FY19E
PDL purchase pipeline
PDL book at start of year PDL purchased during year
A record result
For
per
sona
l use
onl
y
1H19 Results Presentation
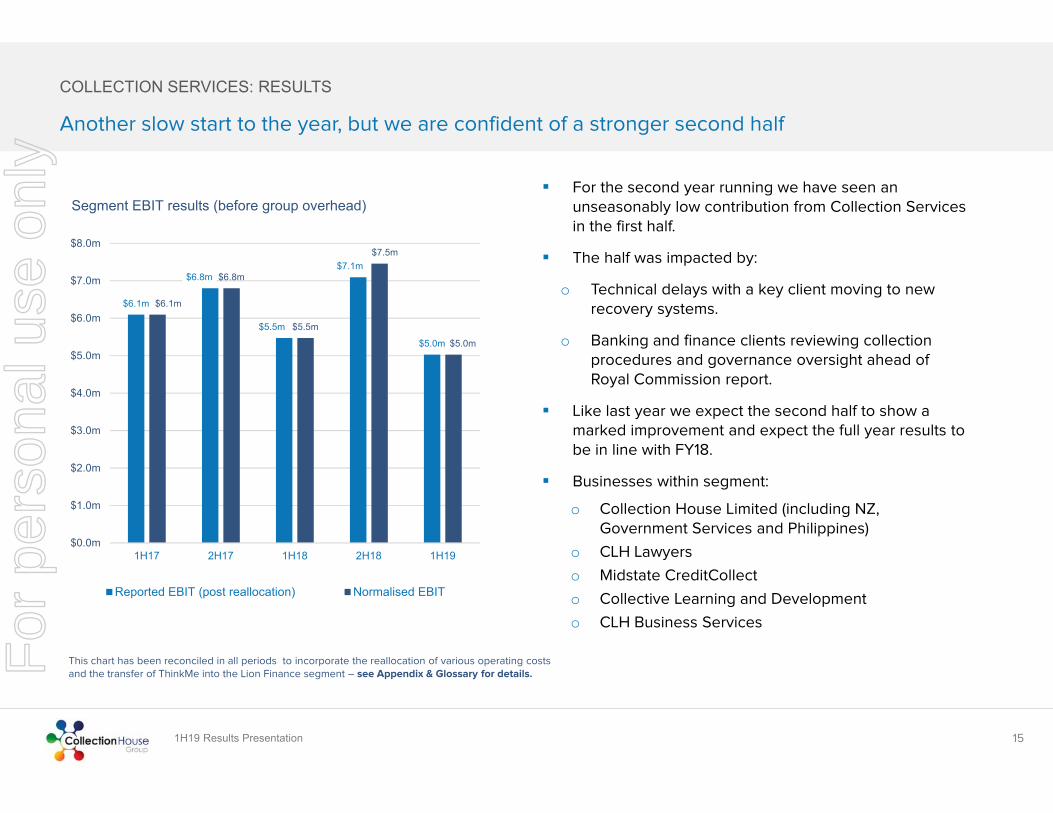
For the second year running we have seen an unseasonably low contribution from Collection Services in the first half.
The half was impacted by:
o Technical delays with a key client moving to new recovery systems.
o Banking and finance clients reviewing collection procedures and governance oversight ahead of Royal Commission report.
Like last year we expect the second half to show a marked improvement and expect the full year results to be in line with FY18.
Businesses within segment:
o Collection House Limited (including NZ, Government Services and Philippines)
o CLH Lawyers
o Midstate CreditCollect
o Collective Learning and Development
o CLH Business Services
15
COLLECTION SERVICES: RESULTS
Another slow start to the year, but we are confident of a stronger second half
This chart has been reconciled in all periods to incorporate the reallocation of various operating costs and the transfer of ThinkMe into the Lion Finance segment – see Appendix & Glossary for details.
$6.1m
$6.8m
$5.5m
$7.1m
$5.0m
$6.1m
$6.8m
$5.5m
$7.5m
$5.0m
$0.0m
$1.0m
$2.0m
$3.0m
$4.0m
$5.0m
$6.0m
$7.0m
$8.0m
1H17 2H17 1H18 2H18 1H19
Segment EBIT results (before group overhead)
Reported EBIT (post reallocation) Normalised EBIT
For
per
sona
l use
onl
y
1H19 Results Presentation 16
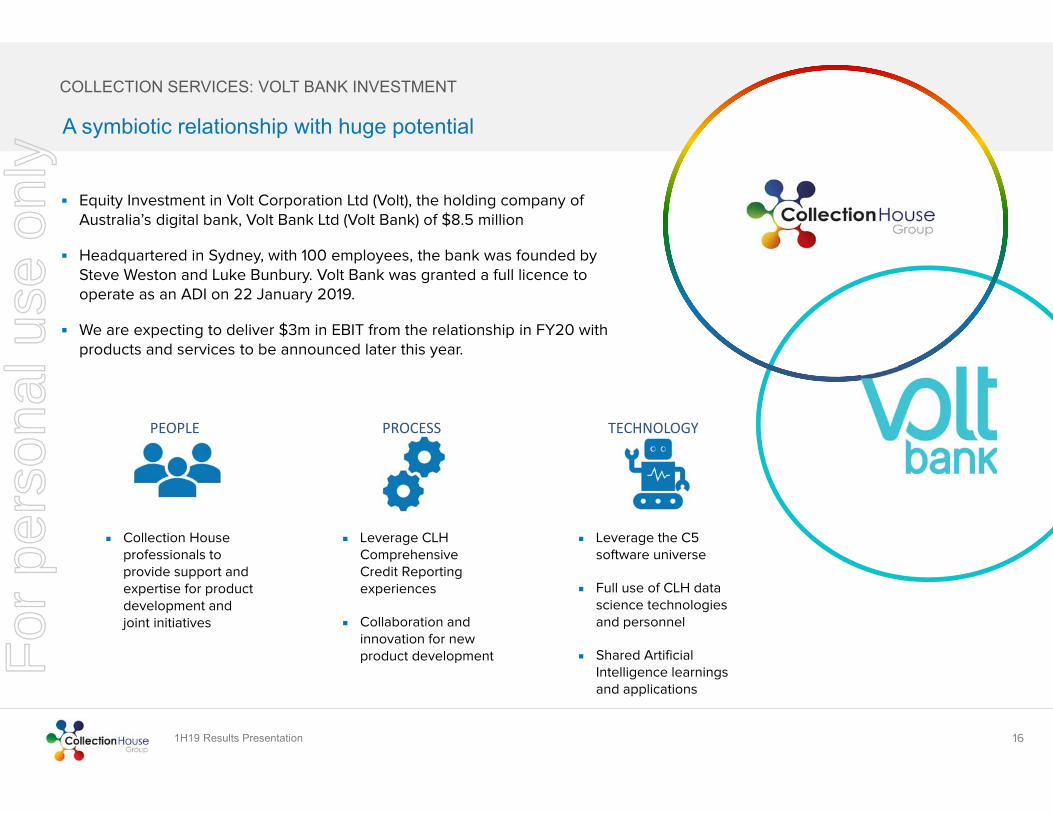
Equity Investment in Volt Corporation Ltd (Volt), the holding company of Australia’s digital bank, Volt Bank Ltd (Volt Bank) of $8.5 million
Headquartered in Sydney, with 100 employees, the bank was founded by Steve Weston and Luke Bunbury. Volt Bank was granted a full licence to operate as an ADI on 22 January 2019.
We are expecting to deliver $3m in EBIT from the relationship in FY20 with products and services to be announced later this year.
COLLECTION SERVICES: VOLT BANK INVESTMENT
PEOPLE PROCESS TECHNOLOGY
Collection House professionals to provide support and expertise for product development and joint initiatives
A symbiotic relationship with huge potential
Leverage CLH Comprehensive Credit Reporting experiences
Collaboration and innovation for new product development
Leverage the C5 software universe
Full use of CLH data science technologies and personnel
Shared Artificial Intelligence learnings and applications
For
per
sona
l use
onl
y
1H19 Results Presentation 17
EXECUTING THE BUINESS PLAN
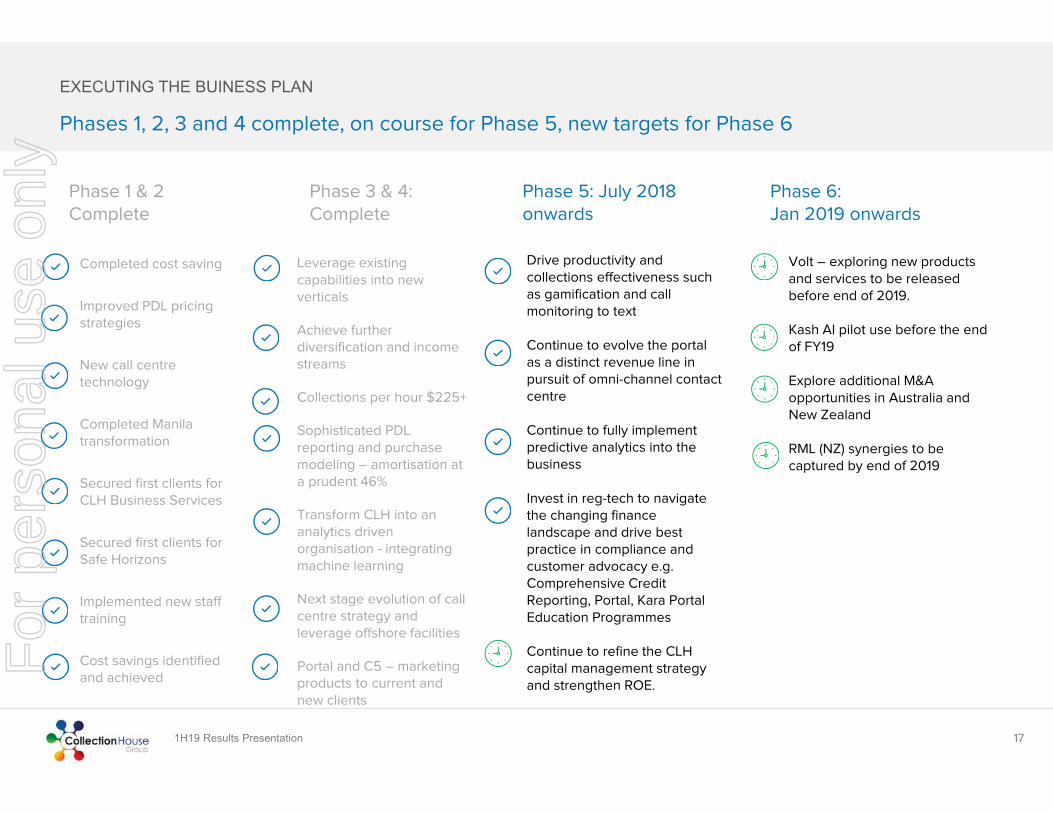
Phases 1, 2, 3 and 4 complete, on course for Phase 5, new targets for Phase 6
Completed cost saving
Improved PDL pricing strategies
New call centre technology
Completed Manila transformation
Secured first clients for CLH Business Services
Secured first clients for Safe Horizons
Implemented new staff training
Cost savings identified and achieved
Leverage existing capabilities into new verticals
Achieve further diversification and income streams
Collections per hour $225+
Sophisticated PDL reporting and purchase modeling – amortisation at a prudent 46%
Transform CLH into an analytics driven organisation - integrating machine learning
Next stage evolution of call centre strategy and leverage offshore facilities
Portal and C5 – marketing products to current and new clients
Phase 1 & 2Complete
Phase 3 & 4: Complete
Phase 5: July 2018 onwards
Phase 6: Jan 2019 onwards
Drive productivity and collections effectiveness such as gamification and call monitoring to text
Continue to evolve the portal as a distinct revenue line in pursuit of omni-channel contact centre
Continue to fully implement predictive analytics into the business
Invest in reg-tech to navigate the changing finance landscape and drive best practice in compliance and customer advocacy e.g. Comprehensive Credit Reporting, Portal, Kara Portal Education Programmes
Continue to refine the CLH capital management strategy and strengthen ROE.
Volt – exploring new products and services to be released before end of 2019.
Kash AI pilot use before the end of FY19
Explore additional M&A opportunities in Australia and New Zealand
RML (NZ) synergies to be captured by end of 2019
For
per
sona
l use
onl
y
1H19 Results Presentation 18
GROUP OUTLOOK
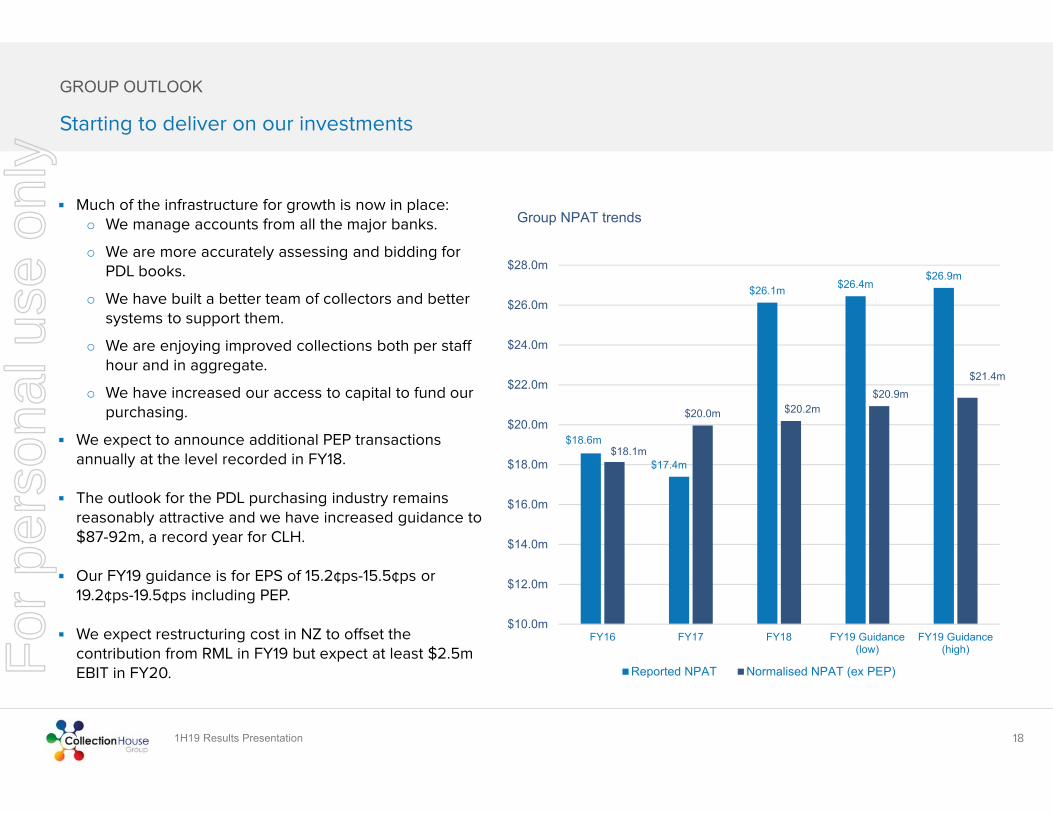
Starting to deliver on our investments
Much of the infrastructure for growth is now in place:o We manage accounts from all the major banks.
o We are more accurately assessing and bidding for PDL books.
o We have built a better team of collectors and better systems to support them.
o We are enjoying improved collections both per staff hour and in aggregate.
o We have increased our access to capital to fund our purchasing.
We expect to announce additional PEP transactions annually at the level recorded in FY18.
The outlook for the PDL purchasing industry remains reasonably attractive and we have increased guidance to $87-92m, a record year for CLH.
Our FY19 guidance is for EPS of 15.2¢ps-15.5¢ps or 19.2¢ps-19.5¢ps including PEP.
We expect restructuring cost in NZ to offset the contribution from RML in FY19 but expect at least $2.5m EBIT in FY20.
$18.6m
$17.4m
$26.1m $26.4m$26.9m
$18.1m
$20.0m $20.2m$20.9m
$21.4m
$10.0m
$12.0m
$14.0m
$16.0m
$18.0m
$20.0m
$22.0m
$24.0m
$26.0m
$28.0m
FY16 FY17 FY18 FY19 Guidance(low)
FY19 Guidance(high)
Group NPAT trends
Reported NPAT Normalised NPAT (ex PEP)For
per
sona
l use
onl
y
1H19 Results Presentation
Appendix
&
Glossary of Terms
19
For
per
sona
l use
onl
y
1H19 Results Presentation 20
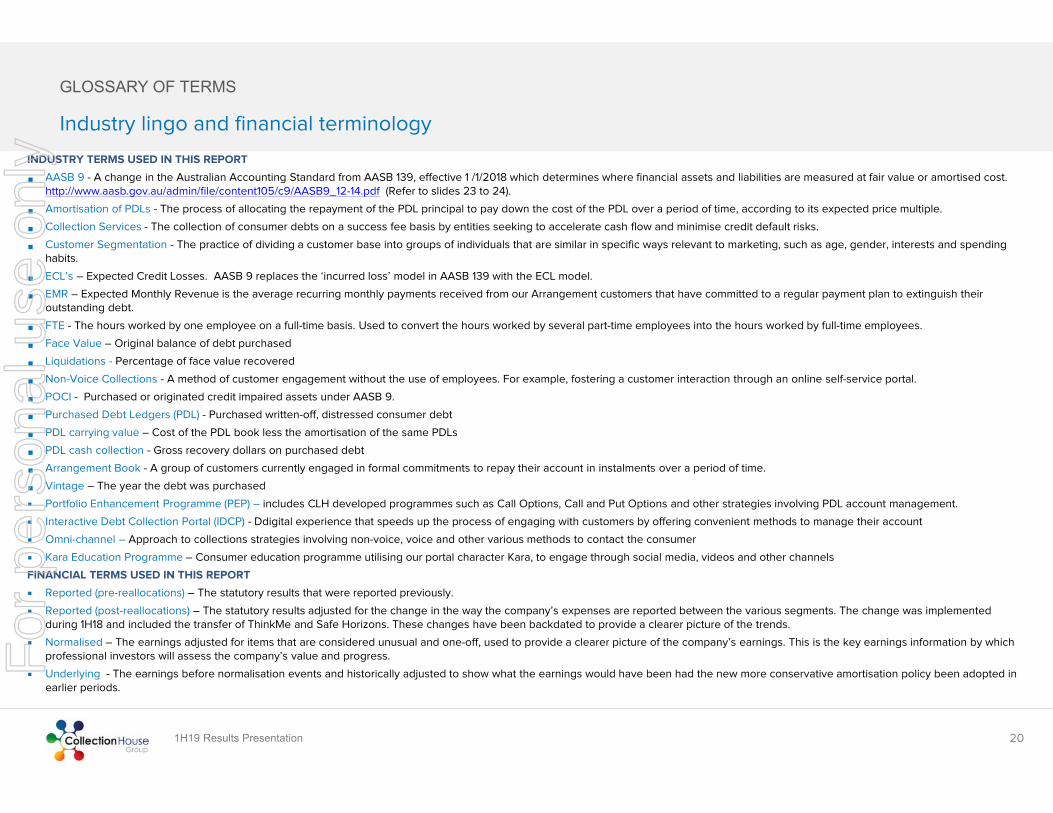
GLOSSARY OF TERMS
Industry lingo and financial terminology
INDUSTRY TERMS USED IN THIS REPORT
AASB 9 - A change in the Australian Accounting Standard from AASB 139, effective 1 /1/2018 which determines where financial assets and liabilities are measured at fair value or amortised cost. http://www.aasb.gov.au/admin/file/content105/c9/AASB9_12-14.pdf (Refer to slides 23 to 24).
Amortisation of PDLs - The process of allocating the repayment of the PDL principal to pay down the cost of the PDL over a period of time, according to its expected price multiple.
Collection Services - The collection of consumer debts on a success fee basis by entities seeking to accelerate cash flow and minimise credit default risks.
Customer Segmentation - The practice of dividing a customer base into groups of individuals that are similar in specific ways relevant to marketing, such as age, gender, interests and spending habits.
ECL’s – Expected Credit Losses. AASB 9 replaces the ‘incurred loss’ model in AASB 139 with the ECL model.
EMR – Expected Monthly Revenue is the average recurring monthly payments received from our Arrangement customers that have committed to a regular payment plan to extinguish their outstanding debt.
FTE - The hours worked by one employee on a full-time basis. Used to convert the hours worked by several part-time employees into the hours worked by full-time employees.
Face Value – Original balance of debt purchased
Liquidations - Percentage of face value recovered
Non-Voice Collections - A method of customer engagement without the use of employees. For example, fostering a customer interaction through an online self-service portal.
POCI - Purchased or originated credit impaired assets under AASB 9.
Purchased Debt Ledgers (PDL) - Purchased written-off, distressed consumer debt
PDL carrying value – Cost of the PDL book less the amortisation of the same PDLs
PDL cash collection - Gross recovery dollars on purchased debt
Arrangement Book - A group of customers currently engaged in formal commitments to repay their account in instalments over a period of time.
Vintage – The year the debt was purchased
Portfolio Enhancement Programme (PEP) – includes CLH developed programmes such as Call Options, Call and Put Options and other strategies involving PDL account management.
Interactive Debt Collection Portal (IDCP) - Ddigital experience that speeds up the process of engaging with customers by offering convenient methods to manage their account
Omni-channel – Approach to collections strategies involving non-voice, voice and other various methods to contact the consumer
Kara Education Programme – Consumer education programme utilising our portal character Kara, to engage through social media, videos and other channels
FINANCIAL TERMS USED IN THIS REPORT
Reported (pre-reallocations) – The statutory results that were reported previously.
Reported (post-reallocations) – The statutory results adjusted for the change in the way the company’s expenses are reported between the various segments. The change was implemented during 1H18 and included the transfer of ThinkMe and Safe Horizons. These changes have been backdated to provide a clearer picture of the trends.
Normalised – The earnings adjusted for items that are considered unusual and one-off, used to provide a clearer picture of the company’s earnings. This is the key earnings information by which professional investors will assess the company’s value and progress.
Underlying - The earnings before normalisation events and historically adjusted to show what the earnings would have been had the new more conservative amortisation policy been adopted in earlier periods.
For
per
sona
l use
onl
y
1H19 Results Presentation 21
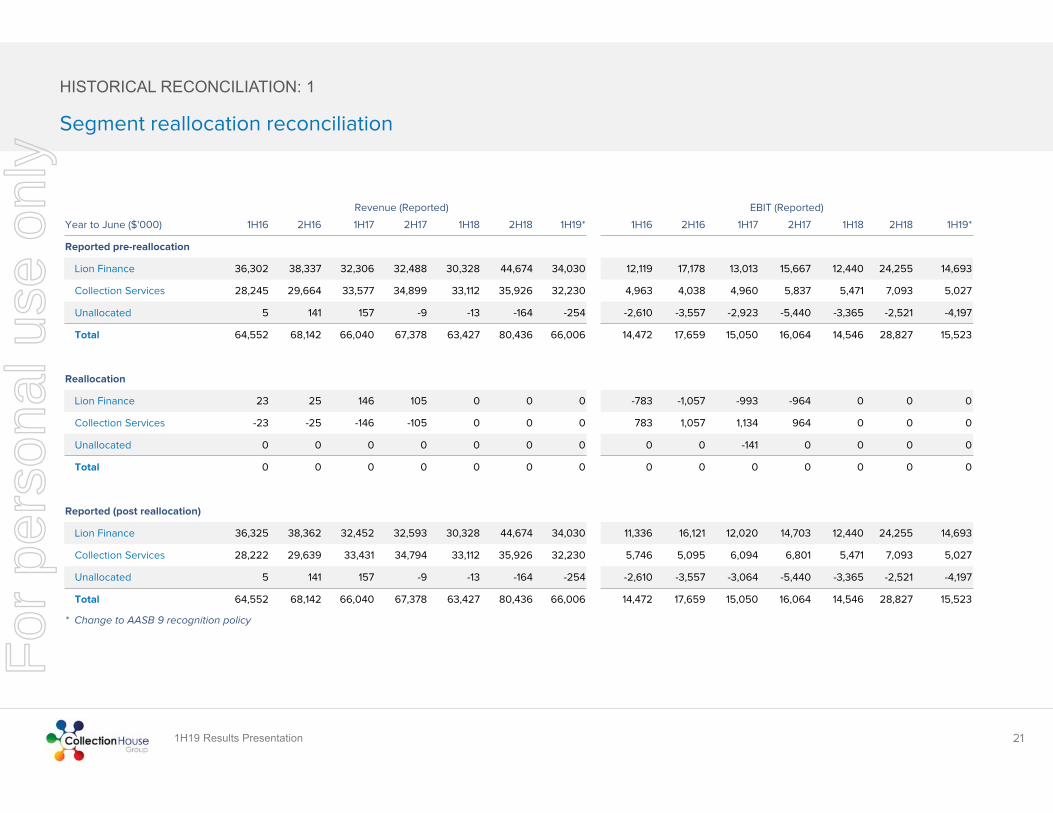
HISTORICAL RECONCILIATION: 1
Segment reallocation reconciliation
Revenue (Reported) EBIT (Reported)
Year to June ($'000) 1H16 2H16 1H17 2H17 1H18 2H18 1H19* 1H16 2H16 1H17 2H17 1H18 2H18 1H19*
Reported pre-reallocation
Lion Finance 36,302 38,337 32,306 32,488 30,328 44,674 34,030 12,119 17,178 13,013 15,667 12,440 24,255 14,693
Collection Services 28,245 29,664 33,577 34,899 33,112 35,926 32,230 4,963 4,038 4,960 5,837 5,471 7,093 5,027
Unallocated 5 141 157 -9 -13 -164 -254 -2,610 -3,557 -2,923 -5,440 -3,365 -2,521 -4,197
Total 64,552 68,142 66,040 67,378 63,427 80,436 66,006 14,472 17,659 15,050 16,064 14,546 28,827 15,523
Reallocation
Lion Finance 23 25 146 105 0 0 0 -783 -1,057 -993 -964 0 0 0
Collection Services -23 -25 -146 -105 0 0 0 783 1,057 1,134 964 0 0 0
Unallocated 0 0 0 0 0 0 0 0 0 -141 0 0 0 0
Total 0 0 0 0 0 0 0 0 0 0 0 0 0 0
Reported (post reallocation)
Lion Finance 36,325 38,362 32,452 32,593 30,328 44,674 34,030 11,336 16,121 12,020 14,703 12,440 24,255 14,693
Collection Services 28,222 29,639 33,431 34,794 33,112 35,926 32,230 5,746 5,095 6,094 6,801 5,471 7,093 5,027
Unallocated 5 141 157 -9 -13 -164 -254 -2,610 -3,557 -3,064 -5,440 -3,365 -2,521 -4,197
Total 64,552 68,142 66,040 67,378 63,427 80,436 66,006 14,472 17,659 15,050 16,064 14,546 28,827 15,523
* Change to AASB 9 recognition policy
For
per
sona
l use
onl
y
1H19 Results Presentation 22
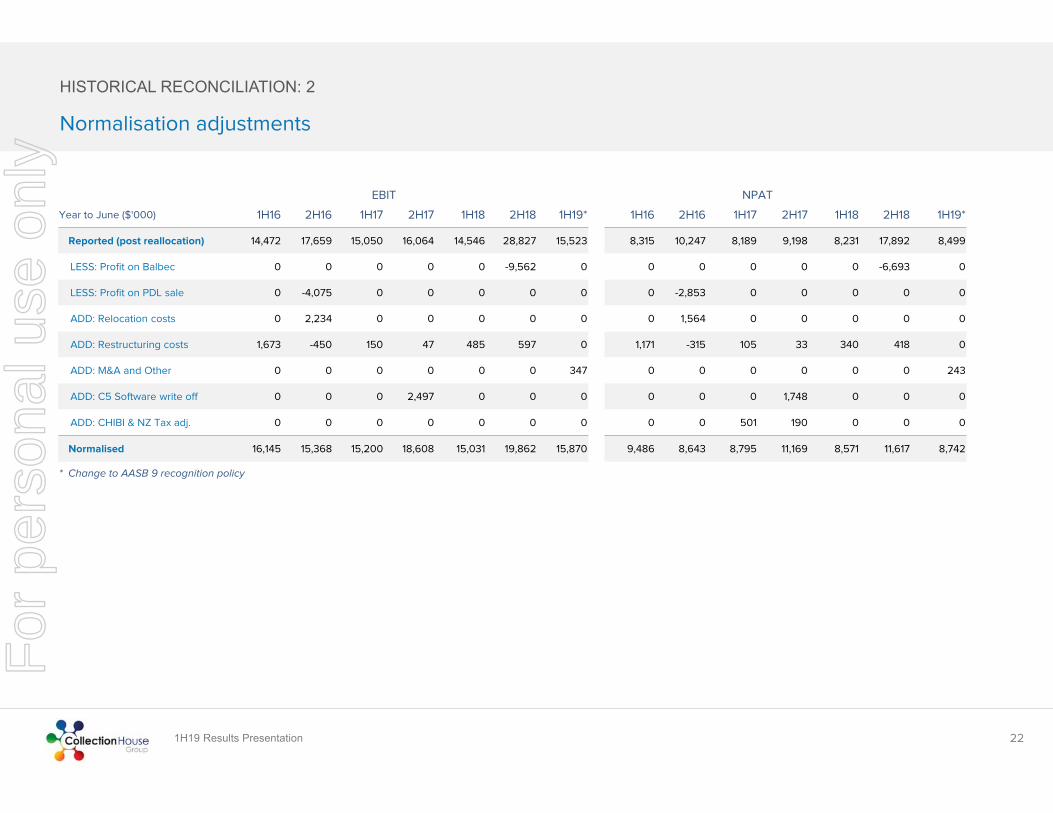
HISTORICAL RECONCILIATION: 2
Normalisation adjustments
EBIT NPAT
Year to June ($'000) 1H16 2H16 1H17 2H17 1H18 2H18 1H19* 1H16 2H16 1H17 2H17 1H18 2H18 1H19*
Reported (post reallocation) 14,472 17,659 15,050 16,064 14,546 28,827 15,523 8,315 10,247 8,189 9,198 8,231 17,892 8,499
LESS: Profit on Balbec 0 0 0 0 0 -9,562 0 0 0 0 0 0 -6,693 0
LESS: Profit on PDL sale 0 -4,075 0 0 0 0 0 0 -2,853 0 0 0 0 0
ADD: Relocation costs 0 2,234 0 0 0 0 0 0 1,564 0 0 0 0 0
ADD: Restructuring costs 1,673 -450 150 47 485 597 0 1,171 -315 105 33 340 418 0
ADD: M&A and Other 0 0 0 0 0 0 347 0 0 0 0 0 0 243
ADD: C5 Software write off 0 0 0 2,497 0 0 0 0 0 0 1,748 0 0 0
ADD: CHIBI & NZ Tax adj. 0 0 0 0 0 0 0 0 0 501 190 0 0 0
Normalised 16,145 15,368 15,200 18,608 15,031 19,862 15,870 9,486 8,643 8,795 11,169 8,571 11,617 8,742
* Change to AASB 9 recognition policy
For
per
sona
l use
onl
y
1H19 Results Presentation
AASB 9 – the forward looking ‘expected credit loss’ model
23
AASB 9 Financial Instruments (“AASB 9”) addresses the classification, measurement and derecognition of financial assets and liabilities, introduces new rules for hedge accounting and a new impairment model for financial assets.
This standard replaces AASB 139 Financial Instruments: Recognition and Measurement.
AASB 9 replaces the ‘incurred loss’ model in AASB 139 with an ‘expected credit loss’ (“ECL”) model.
ECLs are measured as the present value of all future cashflows i.e. the difference between the cashflows due to the entity inaccordance with the contract and the cashflows that the Group actually expects to receive based on practical experience of working on the accounts and exogenous factors such as economic conditions.
The Group measures ECLs at an amount equal to lifetime expected credit losses and these are incorporated into the calculation of the Effective Interest Rate (“EIR”).
Where the balance sheet carrying amount is different from the Present Value of the estimated future cashflows (discounted at the asset’s original EIR), the Group recognises an impairment gain or loss through the P&L, which is then applied to the balance sheet as a positive or negative provision.
The attraction of this model is that it will more readily adjust the gross carry value of our PDL portfolio to the actual expected cash return, versus the previous method which simply adopted the original valuation based on expectations at the time of purchase.
CLH will provide disclosure on any provisions (losses or gains) recognised through the P&L to provide full transparency.
In our first period of adoption (1H19) no adjustments have been necessary.
ACCOUNTING CHANGES
For
per
sona
l use
onl
y
1H19 Results Presentation
AASB 9 – CLH Preparation for AASB 9 in 2017 - 2018
24
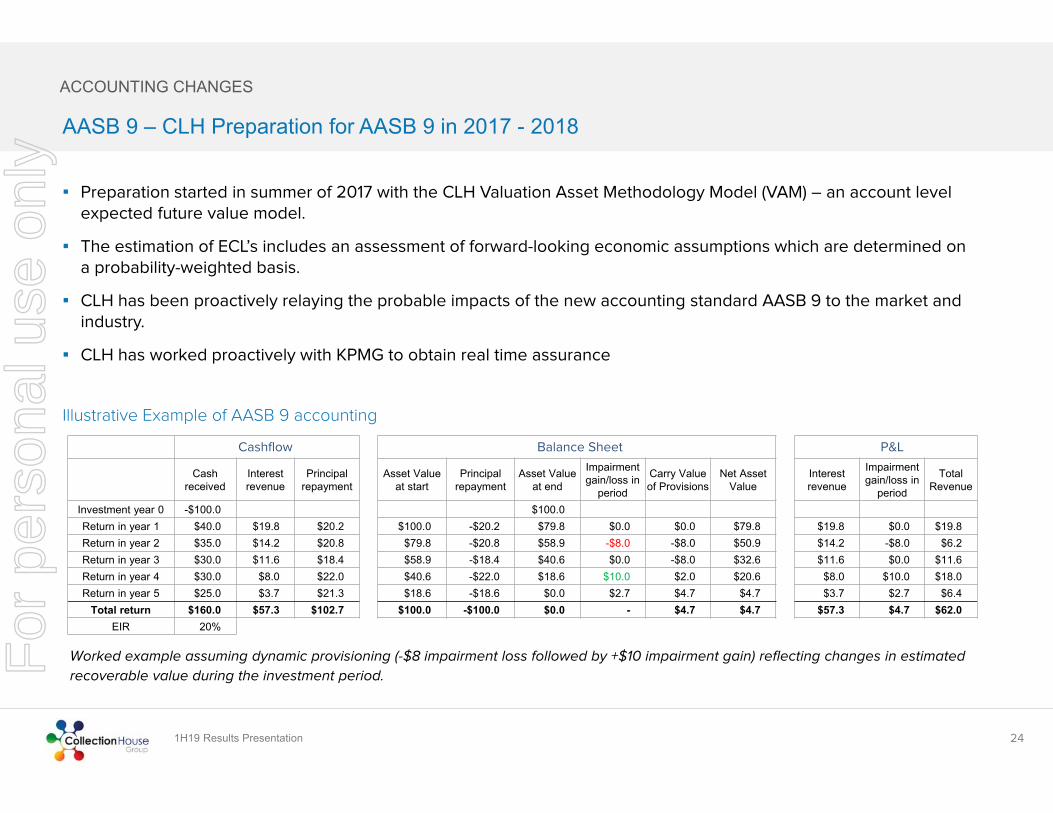
Preparation started in summer of 2017 with the CLH Valuation Asset Methodology Model (VAM) – an account level expected future value model.
The estimation of ECL’s includes an assessment of forward-looking economic assumptions which are determined on a probability-weighted basis.
CLH has been proactively relaying the probable impacts of the new accounting standard AASB 9 to the market and industry.
CLH has worked proactively with KPMG to obtain real time assurance
Illustrative Example of AASB 9 accounting
ACCOUNTING CHANGES
Cashflow Balance Sheet P&L
Cash received
Interest revenue
Principal repayment
Asset Value at start
Principal repayment
Asset Value at end
Impairment gain/loss in
period
Carry Value of Provisions
Net Asset Value
Interest revenue
Impairment gain/loss in
period
Total Revenue
Investment year 0 -$100.0 $100.0Return in year 1 $40.0 $19.8 $20.2 $100.0 -$20.2 $79.8 $0.0 $0.0 $79.8 $19.8 $0.0 $19.8Return in year 2 $35.0 $14.2 $20.8 $79.8 -$20.8 $58.9 -$8.0 -$8.0 $50.9 $14.2 -$8.0 $6.2Return in year 3 $30.0 $11.6 $18.4 $58.9 -$18.4 $40.6 $0.0 -$8.0 $32.6 $11.6 $0.0 $11.6Return in year 4 $30.0 $8.0 $22.0 $40.6 -$22.0 $18.6 $10.0 $2.0 $20.6 $8.0 $10.0 $18.0Return in year 5 $25.0 $3.7 $21.3 $18.6 -$18.6 $0.0 $2.7 $4.7 $4.7 $3.7 $2.7 $6.4
Total return $160.0 $57.3 $102.7 $100.0 -$100.0 $0.0 - $4.7 $4.7 $57.3 $4.7 $62.0EIR 20%
Worked example assuming dynamic provisioning (-$8 impairment loss followed by +$10 impairment gain) reflecting changes in estimated
recoverable value during the investment period.For
per
sona
l use
onl
y
1H19 Results Presentation
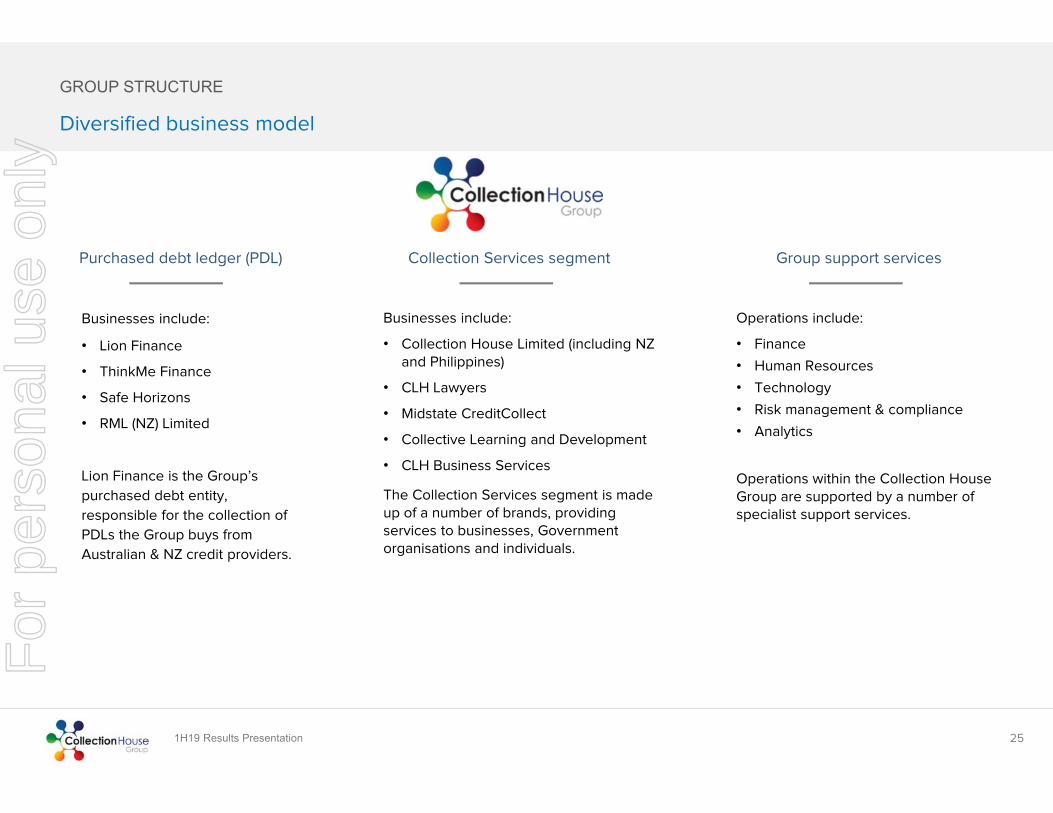
Businesses include:
• Lion Finance
• ThinkMe Finance
• Safe Horizons
• RML (NZ) Limited
Lion Finance is the Group’s
purchased debt entity,
responsible for the collection of
PDLs the Group buys from
Australian & NZ credit providers.
Purchased debt ledger (PDL)
Businesses include:
• Collection House Limited (including NZ and Philippines)
• CLH Lawyers
• Midstate CreditCollect
• Collective Learning and Development
• CLH Business Services
The Collection Services segment is made up of a number of brands, providing services to businesses, Government organisations and individuals.
Collection Services segment
Operations include:
• Finance
• Human Resources
• Technology
• Risk management & compliance
• Analytics
Operations within the Collection House Group are supported by a number of specialist support services.
Group support services
25
GROUP STRUCTURE
Diversified business model
For
per
sona
l use
onl
y
1H19 Results Presentation
www.collectionhouse.com.au
Adelaide | Auckland | Brisbane | Manila | Melbourne | Sydney
CONTACT INFORMATIONEmail [email protected] 1300 662 537
26
For
per
sona
l use
onl
y