Embed Size (px)
Citation preview
Inca Minerals Limited For the year ended 30 June 2016
ACN 128 512 907
Annual Financial Report For the year ended 30 June 2016
For
per
sona
l use
onl
y
Inca Minerals Limited For the year ended 30 June 2016
CONTENTS
Corporate Particulars 1
Directors’ Report 2
Financial Report
Consolidated Statement of Profit or Loss and Other Comprehensive Income
10
Consolidated Statement of Financial Position 11
Consolidated Statement of Changes in Equity 12
Consolidated Statement of Cash Flows 13
Notes to the Financial Statements 14
Directors’ Declaration 37
Auditor’s Independence Declaration 38
Independent Auditor’s Report 39
For
per
sona
l use
onl
y
1
Inca Minerals Limited For the year ended 30 June 2016
CORPORATE PARTICULARS
Directors
Mr Ross Brown Mr Justin Walawski Mr Gareth Lloyd
Managing Director Director Director
Company Secretary Mr Justin Walawski
Registered Office Suite 1, 16 Nicholson Road Subiaco, WA, 6008
Corporate Office
Suite 1, 16 Nicholson Road Subiaco, WA, 6008
Mailing Address PO Box 38 West Perth, WA, 6872
Share Registry
Advanced Share Registry Services Pty Ltd 110 Stirling Highway Perth, WA, 6009
Auditor
Stantons International Level 2, 1 Walker Avenue West Perth, WA, 6005
For
per
sona
l use
onl
y
2
Inca Minerals Limited For the year ended 30 June 2016
DIRECTORS’ REPORT The Directors of Inca Minerals Limited (“Inca” or “Company”) present their financial report on the Company and its controlled entities for the year ended 30 June 2016. Directors The names of directors in office at any time during or since the end of the financial year are listed hereunder. Directors were in office since the start of the financial year to the date of this report unless otherwise stated.
Ross Brown, Managing Director
Justin Walawski, Director and Company Secretary
Gareth Lloyd, Director Information on Directors ROSS BROWN B.Sc (Hons), M.Aus.IMM. Managing Director A geologist by profession, Mr Brown has over 30 years’ experience in mineral exploration in Australia, Asia, Africa and South America and he has worked in a broad range of commodities, including gold, base metals, uranium, phosphate and diamonds. Mr Brown has a rare ability in recognising the commercial potential of exploration projects and geological process, and has a proven track record of bringing technical-based exploration concepts and projects to market. In 2009 Mr Brown co-founded the gold/copper exploration company, Mystic Sands Pty Ltd, which was established for the purposes of conducting exploration in Chile, South America. With the assistance of other technical management, Mr Brown was responsible for the composition of the initial project portfolio. Mystic Sands was purchased by an Australian-listed explorer White Star Minerals Ltd. As part of the transaction, Sandfire Resources NL became a shareholder of White Star Minerals Ltd. Mr Brown turned his attention to Peru in 2009 and through his network of Peruvian-based businessmen and geologists assessed the potential of more than a hundred projects. Mr Brown recognised the great potential of mineral discovery in that country and has subsequently secured a number of projects for the Company including the Riqueza and Cerro Rayas zinc-silver-lead projects which the Company is currently exploring and evaluating. Mr Brown was the co-founder and Managing Director of Urcaguary Pty Ltd, the Company’s fully owned subsidiary (formerly called Inca Minerals Limited) and he became the Company’s Managing Director after its takeover of Urcaguary. As at 30 June 2016, and in addition to his position with the Company, Mr Brown remains a Director of Urcaguary and the Company’s other subsidiary companies. In the previous 3 years, Mr Brown has not been a director of any other ASX listed companies. Mr Brown has been a member of AusIMM since 1988, and is also a member of GSA, SEG and AICD.
For
per
sona
l use
onl
y
3
Inca Minerals Limited For the year ended 30 June 2016
DIRECTORS’ REPORT (continued) JUSTIN WALAWSKI BBus.,P.Grad.Dip., PhD, FCPA, MAICD Director and Company Secretary As at 30 June 2016, in addition to his position with Inca, Mr Walawski was also a Director and Company Secretary of Inca’s subsidiary companies, Chairman of FAB Industries Pty Ltd (a private equity investment company) and Facilitator for the AICD’s Company Directors course in areas of financial literacy and financial strategy. Mr Walawski has previously held positions as Chairman, Deputy Chairman and Chief Executive of the North West Iron Ore Alliance, Chief Executive of the Association of Mining & Exploration Companies, Chairman of Special Olympics Australia (WA) and Director of CPA Australia (WA). He is a former member of the ASX’s Supervisory Liaison Committee, the Federal Australian Government’s Mineral Exploration Action Implementation Committee and the West Australian Government’s State Tax Reference Committee. In the previous 3 years Mr Walawski has been a director of one other ASX listed company being IFS Construction Services Limited (appointed 31 August 2012 to present). Mr Walawski is a Fellow of CPA Australia, a Member of the AICD and holds undergraduate, post-graduate and doctoral degrees in accounting/auditing. GARETH LLOYD B.Sc (Hons) Director As at 30 June 2016, in addition to his position with Inca, Mr Lloyd was also a Director of Inca’s subsidiary companies. Mr Lloyd has over 30 years’ experience with mining and exploration companies and brings considerable technical, commercial and capital raising expertise to the Company. A mining engineer by training, he has operating experience in gold, base metals and coal operations in Australia, South Africa and the United Kingdom. Mr Lloyd is a part owner of the Element group, a Perth-based boutique advisory and funds management group focused on the resources sector through which Mr Lloyd provides strategic advice and fund raising services to both listed and unlisted companies (predominantly mining and exploration companies) using both equity and mezzanine instruments. Prior to establishing Element (in 2008), Mr Lloyd was an Associate Director at the Rothschild Group where he helped establish the Golden Arrow Funds I and II, the latter fund becoming the ASX-listed LinQ Resources Fund. At the time of his departure from LinQ, the fund was one of Australia’s largest listed resource funds with funds under management of over $475m. He has held a number of senior positions at Australian resource-focused stockbroking firms including Research Director at Hartleys and Resources Analyst at Eyres Reed. In the previous 3 years, Mr Lloyd has not been a director of any other ASX listed companies.
For
per
sona
l use
onl
y
4
Inca Minerals Limited For the year ended 30 June 2016
DIRECTORS’ REPORT (continued) OPERATING AND FINANCIAL REVIEW Principal Activities The Company’s principal activities during the year were conducting exploration and evaluation work on existing and newly acquired tenements. Inca Minerals Limited is a Peruvian and Western Australian focused exploration company whose aims are to find, develop and/or demonstrate the potential of projects to others. Inca will continue to seek opportunities for acquiring or farming in to new tenements, and to divest or joint venture where there is benefit to shareholders. Operating Results The operating loss after income tax of the Company for the year ended 30 June 2016 was $13,137,190 (2015: loss of $4,503,572). Review of Operations The Company’s current exploration position and other activities appear in announcements released to the Australian Securities Exchange throughout the year ended 30 June 2016 (“report period”) and should be read in conjunction with this report. During the report period the Company’s net operating cash outflows, including exploration expenditure, totalled $4.54 million. Of this amount, $3.85 million (84.71%) represents net operating cash outflows on exploration and $0.69 million (15.29%) represents net operating cash outflows on administration. These figures highlight the Company’s continued focus on minimising administrative costs and investing shareholder funds in exploration on the Company’s projects. Throughout the report period the Company explored and evaluated its Peruvian projects and in particular the Company’s Chanape and Riqueza projects. Exploration and drilling results at the Chanape project led to the Board’s judgement that further investment and exploration in the project was not in the Company’s best commercial interests and to the decision in April 2016 to drop the Chanape project. During the report period the Company executed a 5-year mining concession transfer option and assignment agreement for concessions making up the zinc-silver-lead (Zn-Ag-Pb) Riqueza project in Peru. The Company conducted a number of mapping and sampling programs (hereafter referred to as Program 1 and Program 2) at the Riqueza project. Shortly after the report period the Company conducted a third mapping and sampling program at Riqueza (Program 3). Programs 1, 2 and 3 identified some 61 highly-mineralised bodies located within three prospects: Humaspunco, Uchpanga and Pinta. The majority of mineralised bodies are veins and mantos. Very high grades have consistently been reported in Programs 1 and 2 (eg 20.96% Zn, 920g/t Ag, 16.71% Pb and 3.59g/t Au) and, at time of writing, assay results from Program 3 are pending. Mineralised veins are present at all three prospects (Humaspunco, Uchpanga and Pinta) with an exceptional concentration of both vein and manto mineralisation at Humaspunco already confirmed. Manto mineralisation appears to extend some 2km x 800m between Humaspunco and Pinta (in an east-west direction) and is open ended to the south. During the report period the Company secured agreements with the communities that have interests in the Riqueza project area and this has resulted in a very productive and mutually beneficial relationship. Importantly, that community support extended to and has been critical for progress on the Company’s application for a drilling permit at Riqueza. The Company’s communications with Peruvian authorities have confirmed the quality of the permit application and absence of any objections or deficiencies to date. At the time of writing the Company is planning further extensive mapping and sampling programs with a view to identifying the optimal drill targets in readiness for approval of the Company’s maiden drill program at Riqueza.
For
per
sona
l use
onl
y
5
Inca Minerals Limited For the year ended 30 June 2016
DIRECTORS’ REPORT (continued)
During the report period the Company executed an option to acquire the Cerro Rayas Zn-Ag-Pb project. In conducting its due diligence, the Company completed a small sampling program to confirm the existence of mineralisation at one of the old artisanal mine workings (Torrepata). Mineralisation at Torrepata was found to occur as a near-massive sulphide vein up to 2m across with peak grades from early sampling being 32.07% Zn, 349g/t Ag and 20.19% Pb. Given the very-high grade mineralisation at Cerro Rayas the Company plans to conduct exploration work in the 2016/2017 financial year. During the report period the Company raised $4.79 million in capital before associated costs. At the commencement of the report period the Company completed a rights issue and placement to raise approximately $3 million and shortly thereafter raised a further $1.3 million through a placement to Resource Capital Funds (“RCF”) - one of the world’s largest and most respected specialist resources investment funds. The Company completed three further placements to existing shareholders to raise $0.49 million (before associated costs). The quality of the Company’s projects underpinned the strong capital raising support from its shareholders throughout the report period and continues to do so immediately post the report period. Financial Position The net assets of the Group were $477,512 as at 30 June 2016 ($9,047,284 as at 30 June 2015). Significant Changes in the State of Affairs The Company raised $4,789,549 (before broker commissions and other costs of the capital raising) in capital during the financial year via the issuance of 592,143,786 fully paid ordinary shares. There were no other significant changes in the state of affairs of the Group during the financial year.
Dividends Paid or Recommended The directors do not recommend the payment of a dividend and no dividends have been paid or declared since the start of the financial year. Significant Events After Reporting Date The Company completed a capital raising in July 2016 raising $2,906,949 (before broker commissions and other costs of the capital raising) through a rights issue and placement of 726,737,334 fully paid ordinary shares. No other matters or circumstances have arisen since the end of the financial year which significantly affected or may significantly affect the operations of the Company or the state of affairs of the Company in future financial years. In September 2016, the Company issued 10,000,000 fully paid ordinary shares at $0.005 per share, in lieu of cash, as remuneration to an unrelated party, in relation to the provision of services to the Company. Likely Developments and Expected Results The Company expects to maintain the present status and level of operation and hence there are no likely unwarranted developments in the entity’s operations. Environmental Issues The Company is subject to environmental regulation in respect of its exploration activities in Peru and Australia. The Company ensures the appropriate standard of environmental care is achieved and, in doing so, that it is aware of and is in compliance with all environmental legislation. The directors of the Company are not aware of any breach of environmental legislation for the year.
For
per
sona
l use
onl
y
6
Inca Minerals Limited For the year ended 30 June 2016
DIRECTORS’ REPORT (continued)
Proceedings on Behalf of the Company No person has applied for leave of the Court to bring proceedings on behalf of the Company or intervene in any proceedings to which the Company is a party for the purpose of taking responsibility on behalf of the Company for all or any part of those proceedings. The Company was not a party to any such proceedings during the year. Indemnification of Officers and Insurance Premiums The consolidated entity has paid premiums to insure the directors against liabilities for costs and expenses incurred by them in defending legal proceedings arising from their conduct while acting in the capacity of director of the consolidated entity, other than conduct involving a wilful breach of duty in relation to the consolidated entity. The premiums paid in respect of Directors’ and Officers’ insurance during the year amounted to $14,554 (2015: $14,554). Options At the date of this report, there were no unissued ordinary shares of Inca Minerals Limited under option. Risk Management The Board is responsible for ensuring that risks and opportunities are identified in a timely manner and that activities are aligned with the risks and opportunities identified by the Board. Meetings of Directors During the financial year, 12 meetings of directors were held. Attendances by each director during the year were as follows:
Board Meetings
No. of meetings eligible to attend
Number attended
Mr Justin Walawski 12 12
Mr Ross Brown 12 12
Mr Gareth Lloyd 12 12
REMUNERATION REPORT (AUDITED) This report outlines the remuneration arrangements in place for directors and executives of the Company. Remuneration Policy The remuneration policy of Inca Minerals Limited aligns director and executive objectives with shareholder and business objectives by providing a fixed remuneration component and, where the Board believes it appropriate, may also include specific long-term incentives based on key performance areas affecting the Company’s ability to attract and retain the best executives and directors to run and manage the Company. The remuneration policy setting out the terms and conditions for the executive directors and other senior executives was developed by the Board. All executives receive a base salary (which is based on factors such as ability and experience). The Board reviews executive packages annually by reference to the economic entity’s performance, executive performance, and comparable information from industry sectors and other listed companies in similar industries. The performance of the executive directors is measured against the objective of promoting growth in shareholder value.
For
per
sona
l use
onl
y
7
Inca Minerals Limited For the year ended 30 June 2016
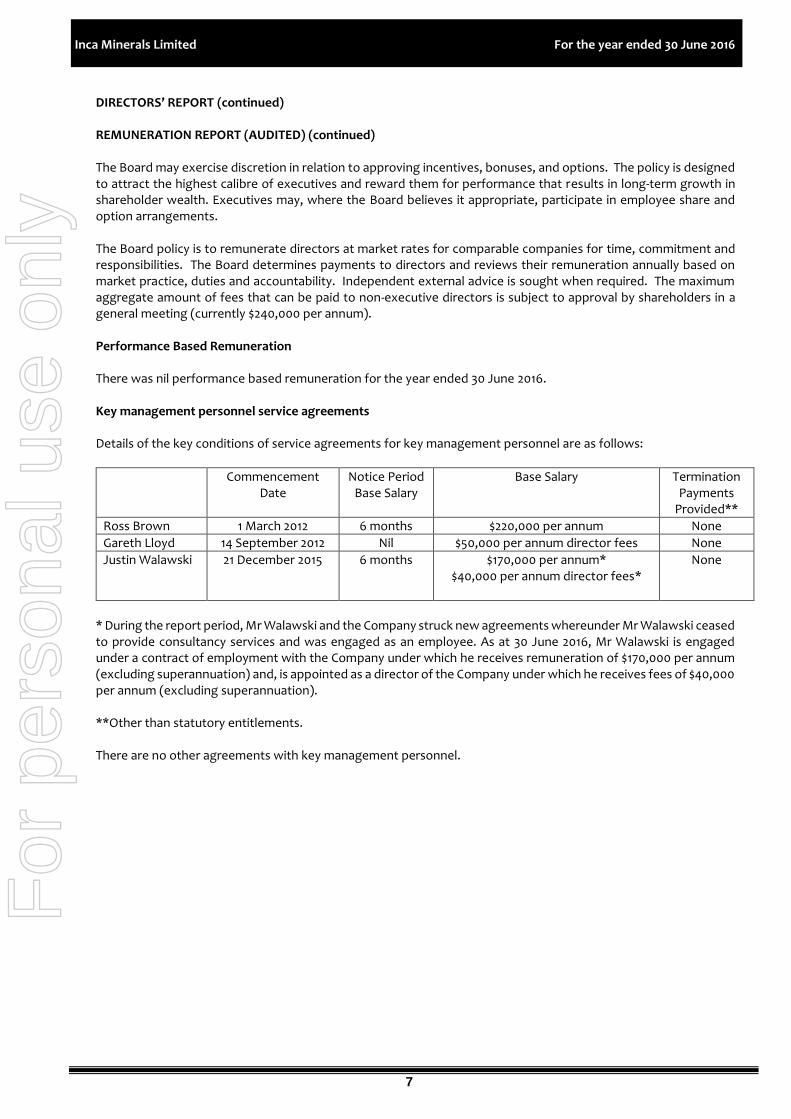
DIRECTORS’ REPORT (continued) REMUNERATION REPORT (AUDITED) (continued) The Board may exercise discretion in relation to approving incentives, bonuses, and options. The policy is designed to attract the highest calibre of executives and reward them for performance that results in long-term growth in shareholder wealth. Executives may, where the Board believes it appropriate, participate in employee share and option arrangements. The Board policy is to remunerate directors at market rates for comparable companies for time, commitment and responsibilities. The Board determines payments to directors and reviews their remuneration annually based on market practice, duties and accountability. Independent external advice is sought when required. The maximum aggregate amount of fees that can be paid to non-executive directors is subject to approval by shareholders in a general meeting (currently $240,000 per annum). Performance Based Remuneration There was nil performance based remuneration for the year ended 30 June 2016. Key management personnel service agreements Details of the key conditions of service agreements for key management personnel are as follows:
Commencement Date
Notice Period Base Salary
Base Salary
Termination Payments
Provided**
Ross Brown 1 March 2012 6 months $220,000 per annum None
Gareth Lloyd 14 September 2012 Nil $50,000 per annum director fees None
Justin Walawski 21 December 2015
6 months $170,000 per annum* $40,000 per annum director fees*
None
* During the report period, Mr Walawski and the Company struck new agreements whereunder Mr Walawski ceased to provide consultancy services and was engaged as an employee. As at 30 June 2016, Mr Walawski is engaged under a contract of employment with the Company under which he receives remuneration of $170,000 per annum (excluding superannuation) and, is appointed as a director of the Company under which he receives fees of $40,000 per annum (excluding superannuation). **Other than statutory entitlements. There are no other agreements with key management personnel.
For
per
sona
l use
onl
y
8
Inca Minerals Limited For the year ended 30 June 2016
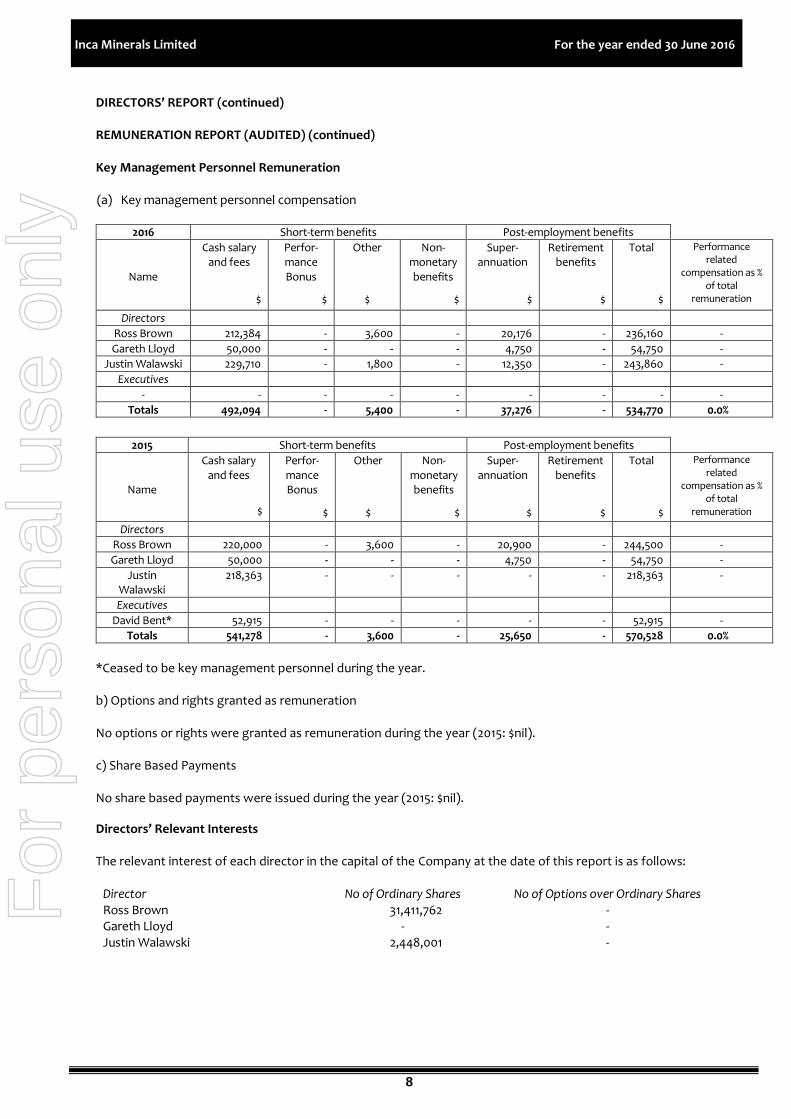
DIRECTORS’ REPORT (continued) REMUNERATION REPORT (AUDITED) (continued) Key Management Personnel Remuneration (a) Key management personnel compensation
2016 Short-term benefits Post-employment benefits
Name
Cash salary and fees
$
Perfor-mance Bonus
$
Other
$
Non-monetary benefits
$
Super- annuation
$
Retirement benefits
$
Total
$
Performance related
compensation as % of total
remuneration
Directors
Ross Brown 212,384 - 3,600 - 20,176 - 236,160 -
Gareth Lloyd 50,000 - - - 4,750 - 54,750 -
Justin Walawski 229,710 - 1,800 - 12,350 - 243,860 -
Executives
- - - - - - - - -
Totals 492,094 - 5,400 - 37,276 - 534,770 0.0%
2015 Short-term benefits Post-employment benefits
Name
Cash salary and fees
$
Perfor-mance Bonus
$
Other
$
Non-monetary benefits
$
Super- annuation
$
Retirement benefits
$
Total
$
Performance related
compensation as % of total
remuneration
Directors
Ross Brown 220,000 - 3,600 - 20,900 - 244,500 -
Gareth Lloyd 50,000 - - - 4,750 - 54,750 -
Justin Walawski
218,363 - - - - - 218,363 -
Executives
David Bent* 52,915 - - - - - 52,915 -
Totals 541,278 - 3,600 - 25,650 - 570,528 0.0%
*Ceased to be key management personnel during the year. b) Options and rights granted as remuneration No options or rights were granted as remuneration during the year (2015: $nil). c) Share Based Payments No share based payments were issued during the year (2015: $nil).
Directors’ Relevant Interests The relevant interest of each director in the capital of the Company at the date of this report is as follows:
Director No of Ordinary Shares No of Options over Ordinary Shares Ross Brown 31,411,762 - Gareth Lloyd - - Justin Walawski 2,448,001 -
For
per
sona
l use
onl
y
9
Inca Minerals Limited For the year ended 30 June 2016
DIRECTORS’ REPORT (continued)
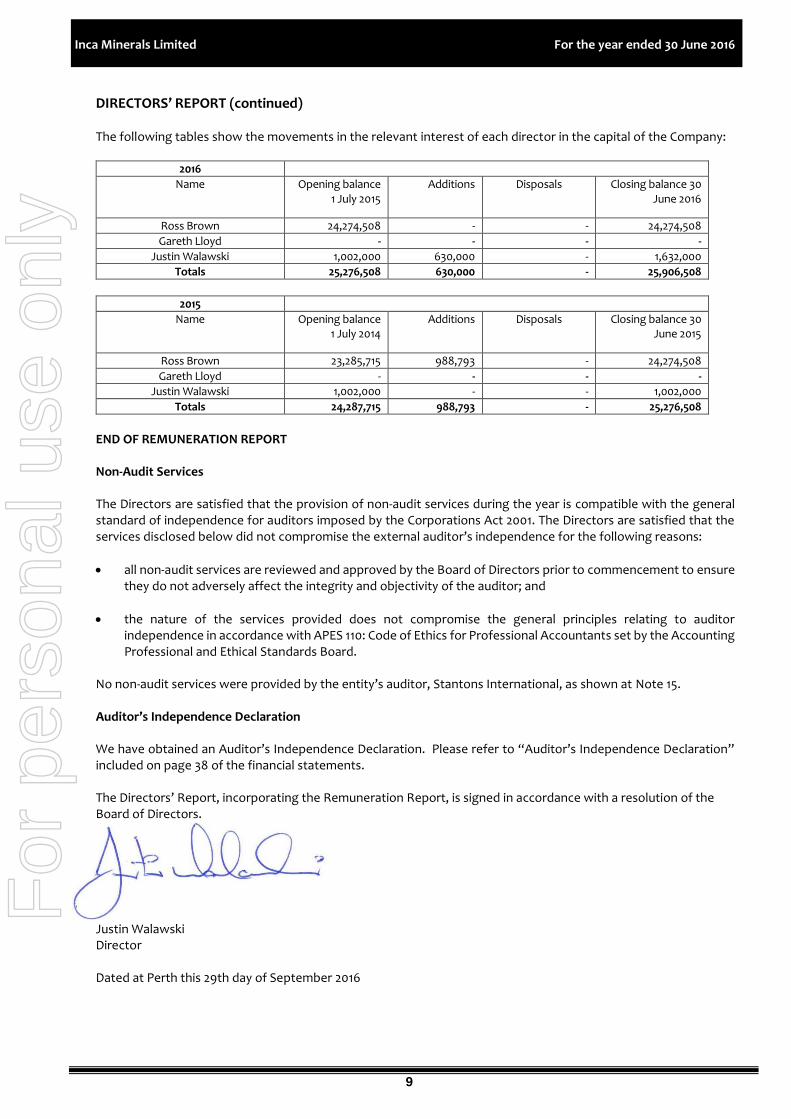
The following tables show the movements in the relevant interest of each director in the capital of the Company:
2016
Name Opening balance 1 July 2015
Additions Disposals Closing balance 30 June 2016
Ross Brown 24,274,508 - - 24,274,508
Gareth Lloyd - - - -
Justin Walawski 1,002,000 630,000 - 1,632,000
Totals 25,276,508 630,000 - 25,906,508
2015
Name Opening balance 1 July 2014
Additions Disposals Closing balance 30 June 2015
Ross Brown 23,285,715 988,793 - 24,274,508
Gareth Lloyd - - - -
Justin Walawski 1,002,000 - - 1,002,000
Totals 24,287,715 988,793 - 25,276,508
END OF REMUNERATION REPORT
Non-Audit Services The Directors are satisfied that the provision of non-audit services during the year is compatible with the general standard of independence for auditors imposed by the Corporations Act 2001. The Directors are satisfied that the services disclosed below did not compromise the external auditor’s independence for the following reasons:
all non-audit services are reviewed and approved by the Board of Directors prior to commencement to ensure they do not adversely affect the integrity and objectivity of the auditor; and
the nature of the services provided does not compromise the general principles relating to auditor independence in accordance with APES 110: Code of Ethics for Professional Accountants set by the Accounting Professional and Ethical Standards Board.
No non-audit services were provided by the entity’s auditor, Stantons International, as shown at Note 15. Auditor’s Independence Declaration We have obtained an Auditor’s Independence Declaration. Please refer to “Auditor’s Independence Declaration” included on page 38 of the financial statements. The Directors’ Report, incorporating the Remuneration Report, is signed in accordance with a resolution of the Board of Directors.
Justin Walawski Director Dated at Perth this 29th day of September 2016
For
per
sona
l use
onl
y
10
Inca Minerals Limited For the year ended 30 June 2016
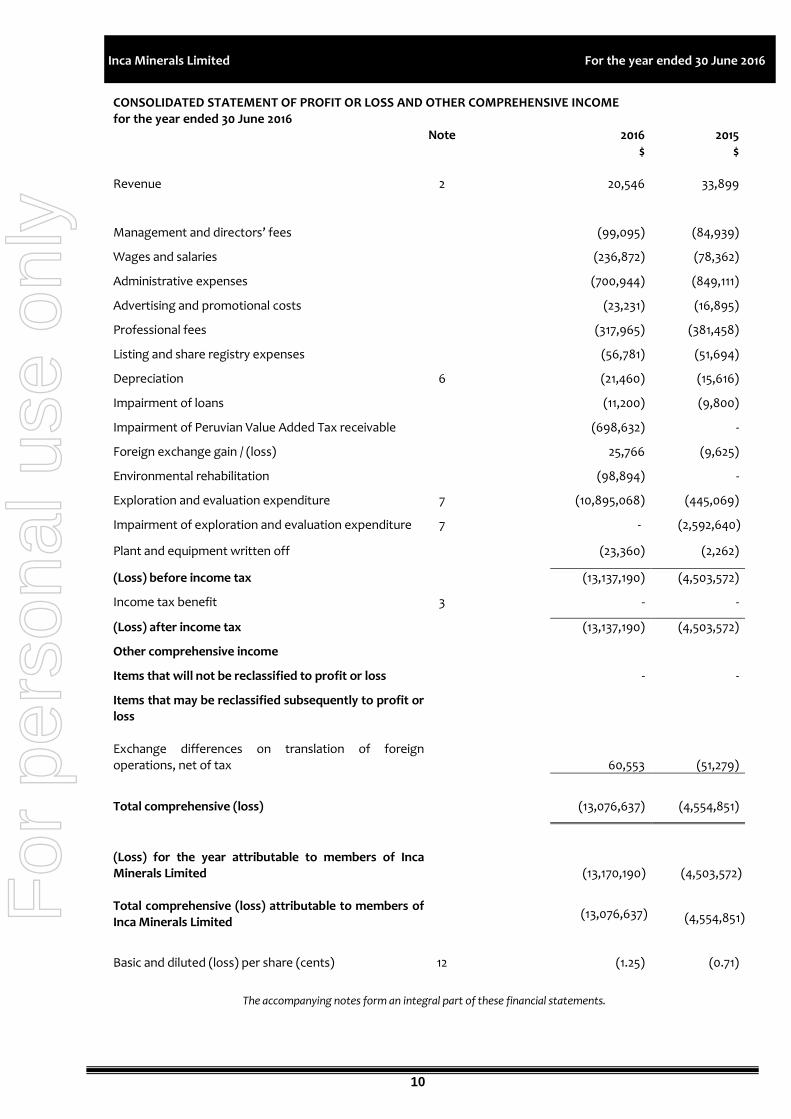
CONSOLIDATED STATEMENT OF PROFIT OR LOSS AND OTHER COMPREHENSIVE INCOME for the year ended 30 June 2016 Note 2016 2015
$ $ Revenue 2 20,546 33,899
Management and directors’ fees (99,095) (84,939)
Wages and salaries (236,872) (78,362)
Administrative expenses (700,944) (849,111)
Advertising and promotional costs (23,231) (16,895)
Professional fees (317,965) (381,458)
Listing and share registry expenses (56,781) (51,694)
Depreciation 6 (21,460) (15,616)
Impairment of loans (11,200) (9,800)
Impairment of Peruvian Value Added Tax receivable (698,632) -
Foreign exchange gain / (loss) 25,766 (9,625)
Environmental rehabilitation (98,894) -
Exploration and evaluation expenditure 7 (10,895,068) (445,069)
Impairment of exploration and evaluation expenditure 7 - (2,592,640)
Plant and equipment written off (23,360) (2,262)
(Loss) before income tax (13,137,190) (4,503,572)
Income tax benefit 3 - -
(Loss) after income tax (13,137,190) (4,503,572)
Other comprehensive income
Items that will not be reclassified to profit or loss - -
Items that may be reclassified subsequently to profit or loss
Exchange differences on translation of foreign operations, net of tax
60,553
(51,279)
Total comprehensive (loss)
(13,076,637)
(4,554,851)
(Loss) for the year attributable to members of Inca Minerals Limited
(13,170,190)
(4,503,572)
Total comprehensive (loss) attributable to members of Inca Minerals Limited
(13,076,637)
(4,554,851)
Basic and diluted (loss) per share (cents) 12 (1.25) (0.71)
The accompanying notes form an integral part of these financial statements.
For
per
sona
l use
onl
y
11
Inca Minerals Limited For the year ended 30 June 2016
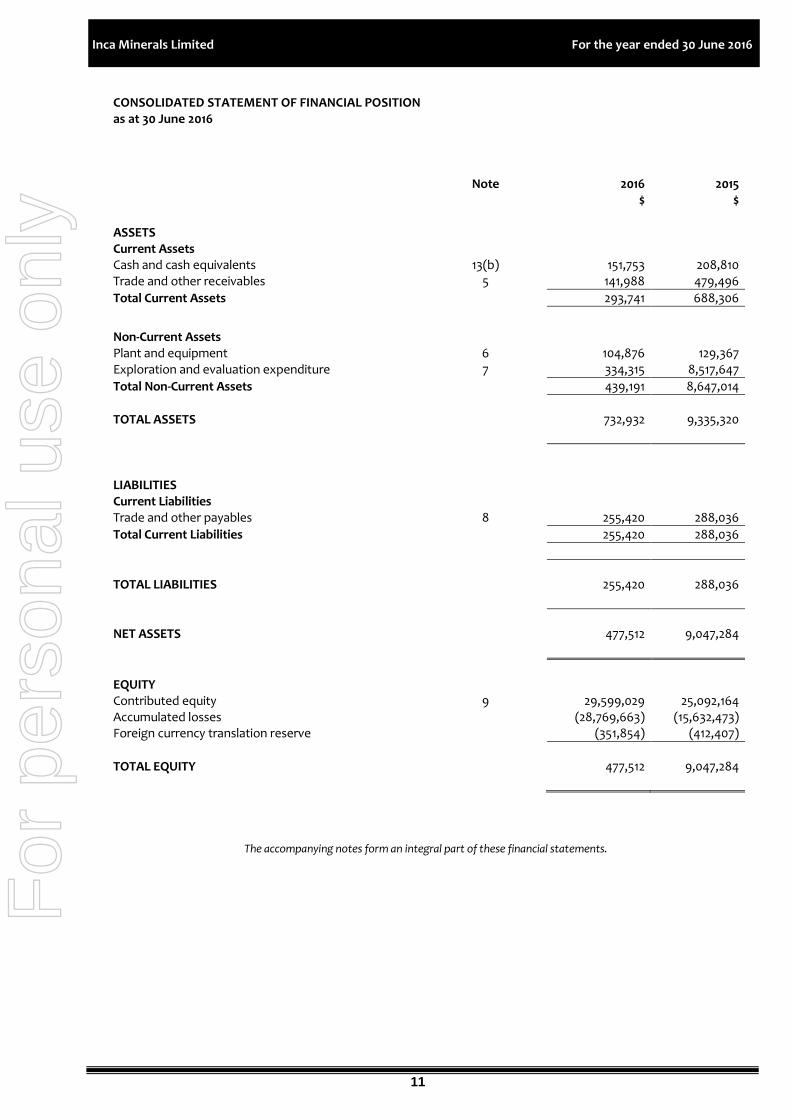
CONSOLIDATED STATEMENT OF FINANCIAL POSITION as at 30 June 2016
Note 2016 2015 $ $
ASSETS Current Assets Cash and cash equivalents 13(b) 151,753 208,810 Trade and other receivables 5 141,988 479,496
Total Current Assets 293,741 688,306
Non-Current Assets Plant and equipment 6 104,876 129,367 Exploration and evaluation expenditure 7 334,315 8,517,647
Total Non-Current Assets 439,191 8,647,014
TOTAL ASSETS
732,932
9,335,320
LIABILITIES Current Liabilities Trade and other payables 8 255,420 288,036
Total Current Liabilities 255,420 288,036
TOTAL LIABILITIES
255,420
288,036
NET ASSETS
477,512
9,047,284
EQUITY Contributed equity 9 29,599,029 25,092,164 Accumulated losses (28,769,663) (15,632,473) Foreign currency translation reserve (351,854) (412,407)
TOTAL EQUITY
477,512
9,047,284
The accompanying notes form an integral part of these financial statements. F
or p
erso
nal u
se o
nly
12
Inca Minerals Limited For the year ended 30 June 2016
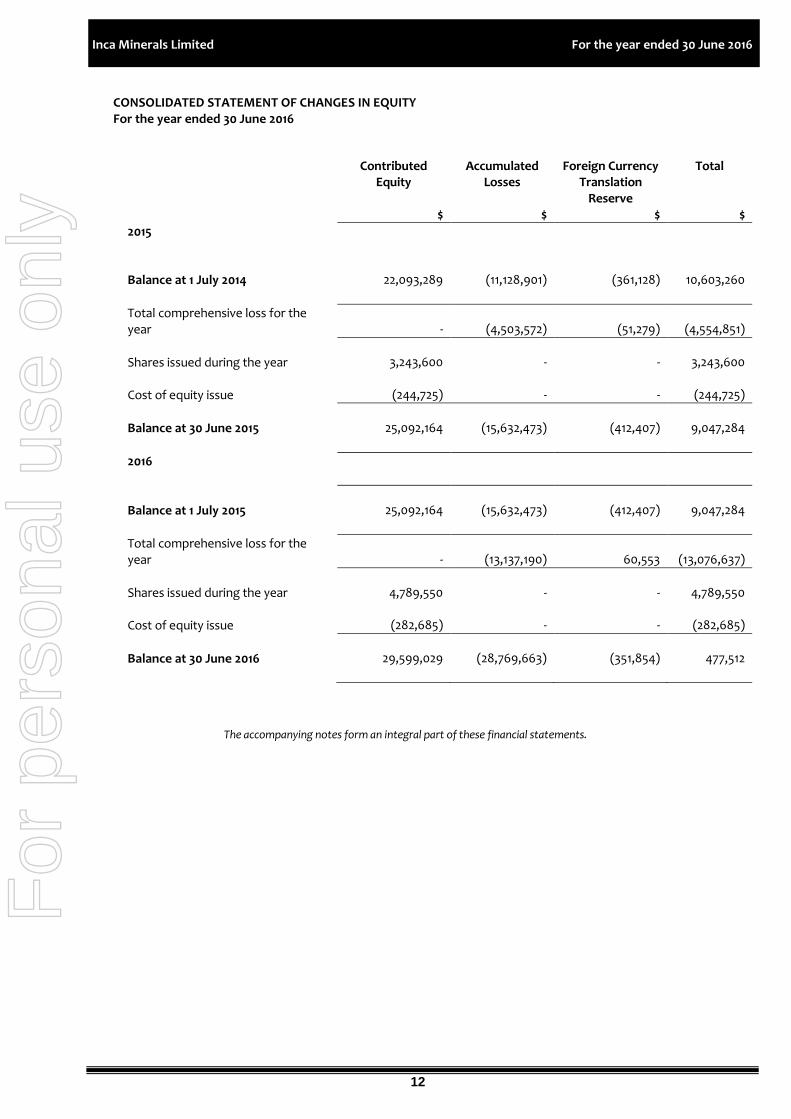
CONSOLIDATED STATEMENT OF CHANGES IN EQUITY For the year ended 30 June 2016
Contributed Equity
Accumulated Losses
Foreign Currency Translation
Reserve
Total
$ $ $ $
2015
Balance at 1 July 2014
22,093,289 (11,128,901) (361,128) 10,603,260
Total comprehensive loss for the year - (4,503,572) (51,279) (4,554,851)
Shares issued during the year 3,243,600 - - 3,243,600
Cost of equity issue (244,725) - - (244,725)
Balance at 30 June 2015
25,092,164 (15,632,473) (412,407) 9,047,284
2016
Balance at 1 July 2015
25,092,164 (15,632,473) (412,407) 9,047,284
Total comprehensive loss for the year - (13,137,190) 60,553 (13,076,637)
Shares issued during the year 4,789,550 - - 4,789,550 Cost of equity issue (282,685) - - (282,685)
Balance at 30 June 2016
29,599,029 (28,769,663) (351,854) 477,512
The accompanying notes form an integral part of these financial statements.
For
per
sona
l use
onl
y
13
Inca Minerals Limited For the year ended 30 June 2016
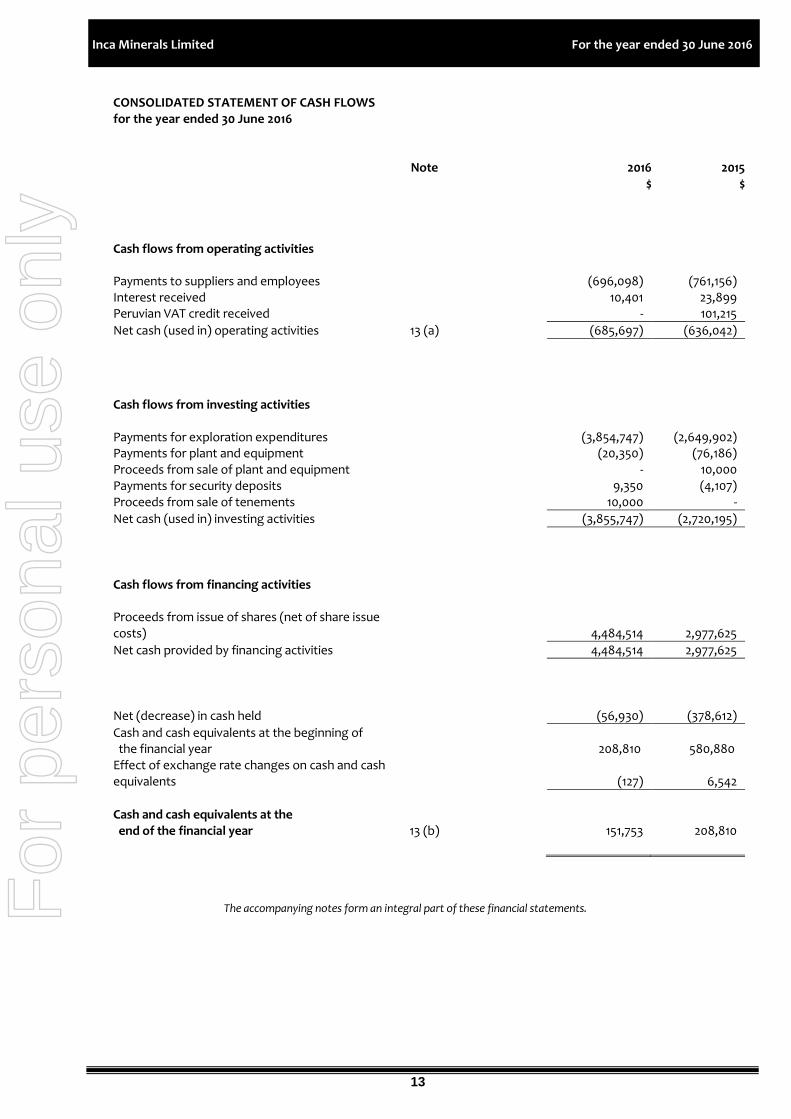
CONSOLIDATED STATEMENT OF CASH FLOWS for the year ended 30 June 2016 Note 2016 2015 $ $ Cash flows from operating activities
Payments to suppliers and employees (696,098) (761,156) Interest received 10,401 23,899 Peruvian VAT credit received - 101,215
Net cash (used in) operating activities 13 (a) (685,697) (636,042)
Cash flows from investing activities
Payments for exploration expenditures (3,854,747) (2,649,902) Payments for plant and equipment (20,350) (76,186) Proceeds from sale of plant and equipment - 10,000 Payments for security deposits 9,350 (4,107) Proceeds from sale of tenements 10,000 -
Net cash (used in) investing activities (3,855,747) (2,720,195)
Cash flows from financing activities
Proceeds from issue of shares (net of share issue costs)
4,484,514
2,977,625
Net cash provided by financing activities 4,484,514 2,977,625
Net (decrease) in cash held (56,930) (378,612)
Cash and cash equivalents at the beginning of the financial year
208,810
580,880
Effect of exchange rate changes on cash and cash equivalents
(127)
6,542
Cash and cash equivalents at the end of the financial year
13 (b)
151,753
208,810
The accompanying notes form an integral part of these financial statements. F
or p
erso
nal u
se o
nly
14
Inca Minerals Limited For the year ended 30 June 2016
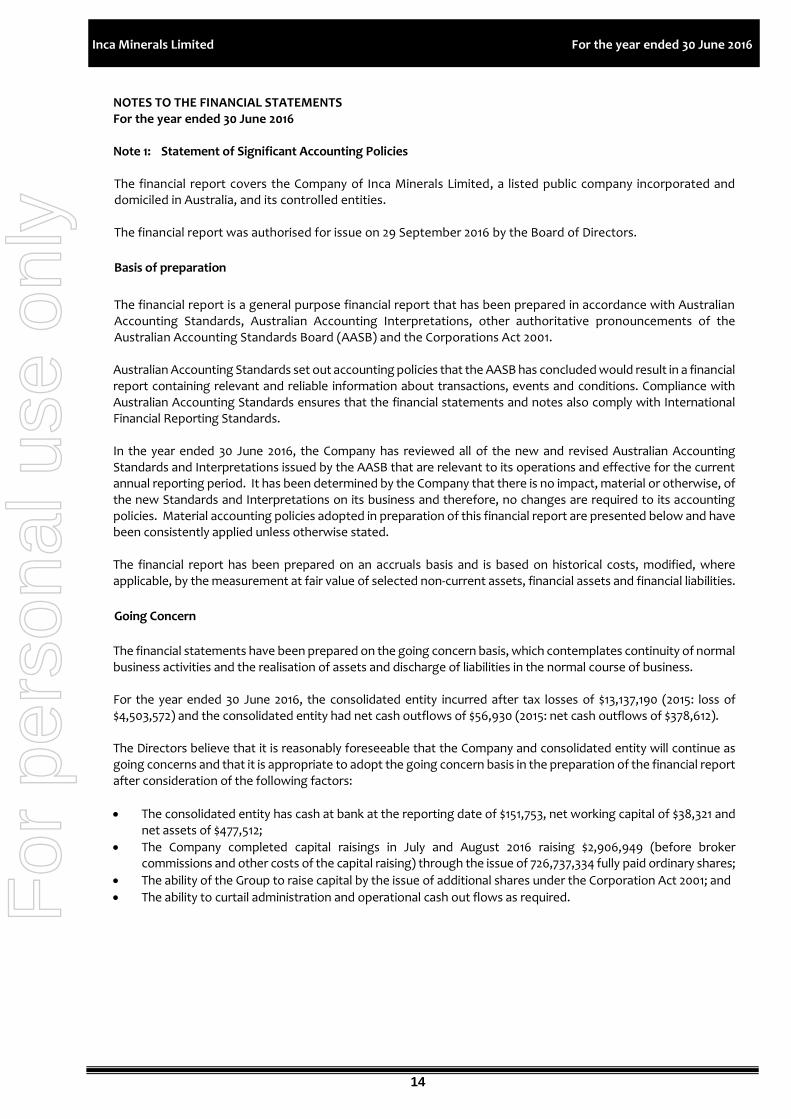
NOTES TO THE FINANCIAL STATEMENTS For the year ended 30 June 2016 Note 1: Statement of Significant Accounting Policies
The financial report covers the Company of Inca Minerals Limited, a listed public company incorporated and domiciled in Australia, and its controlled entities. The financial report was authorised for issue on 29 September 2016 by the Board of Directors.
Basis of preparation
The financial report is a general purpose financial report that has been prepared in accordance with Australian Accounting Standards, Australian Accounting Interpretations, other authoritative pronouncements of the Australian Accounting Standards Board (AASB) and the Corporations Act 2001.
Australian Accounting Standards set out accounting policies that the AASB has concluded would result in a financial report containing relevant and reliable information about transactions, events and conditions. Compliance with Australian Accounting Standards ensures that the financial statements and notes also comply with International Financial Reporting Standards. In the year ended 30 June 2016, the Company has reviewed all of the new and revised Australian Accounting Standards and Interpretations issued by the AASB that are relevant to its operations and effective for the current annual reporting period. It has been determined by the Company that there is no impact, material or otherwise, of the new Standards and Interpretations on its business and therefore, no changes are required to its accounting policies. Material accounting policies adopted in preparation of this financial report are presented below and have been consistently applied unless otherwise stated. The financial report has been prepared on an accruals basis and is based on historical costs, modified, where applicable, by the measurement at fair value of selected non-current assets, financial assets and financial liabilities.
Going Concern
The financial statements have been prepared on the going concern basis, which contemplates continuity of normal business activities and the realisation of assets and discharge of liabilities in the normal course of business.
For the year ended 30 June 2016, the consolidated entity incurred after tax losses of $13,137,190 (2015: loss of $4,503,572) and the consolidated entity had net cash outflows of $56,930 (2015: net cash outflows of $378,612).
The Directors believe that it is reasonably foreseeable that the Company and consolidated entity will continue as going concerns and that it is appropriate to adopt the going concern basis in the preparation of the financial report after consideration of the following factors:
The consolidated entity has cash at bank at the reporting date of $151,753, net working capital of $38,321 and net assets of $477,512;
The Company completed capital raisings in July and August 2016 raising $2,906,949 (before broker commissions and other costs of the capital raising) through the issue of 726,737,334 fully paid ordinary shares;
The ability of the Group to raise capital by the issue of additional shares under the Corporation Act 2001; and
The ability to curtail administration and operational cash out flows as required.
For
per
sona
l use
onl
y
15
Inca Minerals Limited For the year ended 30 June 2016
NOTES TO THE FINANCIAL STATEMENTS For the year ended 30 June 2016 Note 1: Statement of Significant Accounting Policies (continued) Accounting Policies The Group has consistently applied the following accounting policies to all periods presented in the financial statements. The Group has considered the implications of new and amended Accounting Standards applicable for annual reporting periods beginning after 1 July 2015 but determined that their application to the financial statements is either not relevant or not material. a) Principles of Consolidation The consolidated financial statements incorporate all of the assets, liabilities and results of the parent, Inca Minerals Limited and all of the subsidiaries. Subsidiaries are entities the parent controls. The parent controls an entity when it is exposed to, or has rights to, variable returns from its involvement with the entity and has the ability to affect those returns through its power over the entity. A list of the subsidiaries is provided in Note 20. The assets, liabilities and results of all subsidiaries are fully consolidated into the financial statements of the Group from the date on which control is obtained by the Group. The consolidation of a subsidiary is discontinued from the date that control ceases. Intercompany transactions, balances and unrealised gains or losses on transactions between Group entities are fully eliminated on consolidation. Accounting policies of subsidiaries have been changed and adjustments made where necessary to ensure uniformity of the accounting policies adopted by the Group. Equity interests in a subsidiary not attributable, directly or indirectly, to the Group are presented as “non-controlling interests". The Group initially recognises non-controlling interests that are present ownership interests in subsidiaries and are entitled to a proportionate share of the subsidiary's net assets on liquidation at either fair value or at the non-controlling interests' proportionate share of the subsidiary's net assets. Subsequent to initial recognition, non-controlling interests are attributed their share of profit or loss and each component of other comprehensive income. Non-controlling interests are shown separately within the equity section of the statement of financial position and statement of comprehensive income. b) Revenue Recognition
Interest revenue is recognised on a time proportionate basis that takes into account the effective yield on the financial asset. c) Income Tax The income tax expense / (income) for the year comprises current income tax expense (income) and deferred tax expense / (income). Current income tax expense charged to the profit of loss is the tax payable on taxable income calculated using applicable income tax rates enacted, or substantially enacted, as at reporting date. Current tax liabilities (assets) are therefore measured at the amounts expected to be paid to (recovered from) the relevant taxation authority. Deferred income tax expense reflects movements in deferred tax asset and deferred tax liability balances during the year as well as unused tax losses. Current and deferred income tax expense (income) is charged or credited directly to equity instead of profit or loss when the tax related to items that are credited or charged directly to equity. Deferred tax assets and liabilities are ascertained based on temporary differences arising between the tax bases of assets and liabilities and their carrying amounts in the financial statements. Deferred tax assets also result where amounts have been fully expensed but future tax deductions are available. No deferred income tax will be recognised from the initial recognition of an asset or liability, excluding a business combination, where there is no effect on accounting or taxable profit or loss.
For
per
sona
l use
onl
y
16
Inca Minerals Limited For the year ended 30 June 2016
NOTES TO THE FINANCIAL STATEMENTS For the year ended 30 June 2016 Note 1: Statement of Significant Accounting Policies (continued) c) Income Tax (continued) Deferred tax assets and liabilities are calculated at the tax rates that are expected to apply to the year when the asset is realised or the liability is settled, based on tax rates enacted or substantially enacted at reporting date. Their measurement also reflects the manner in which management expects to recover or settle the carrying amount of the related asset or liability. Deferred tax assets relating to temporary differences and unused tax losses are recognised only to the extent that it is probable that future taxable profit will be available against which the benefits of the deferred tax asset can be utilised. Where temporary differences exist in relation to investments in subsidiaries, branches, associates, and joint ventures, deferred tax assets and liabilities are not recognised where the timing of the reversal of the temporary difference can be controlled and it is not probable that the reversal will occur in the foreseeable future. Current tax assets and liabilities are offset where a largely enforceable right of set-off exists and it is intended that net settlement or simultaneous realisation and settlement of the respective asset and liability will occur. Deferred tax assets and liabilities are offset where a legally enforceable right of set-off exists, the deferred tax assets and liabilities related to income taxes levied by the same taxation authority on either the same taxable entity or different taxable entities where it is intended that net settlement or simultaneous realisation and settlement of the respective asset and liability will occur in future periods in which significant amounts of deferred tax assets or liabilities are expected to be recovered or settled. d) Mining Tenements and Exploration and Development Expenditure Mining tenements are carried at cost, less accumulated impairment losses. Exploration, evaluation and development expenditure incurred is accumulated in respect of each identifiable area of interest. These costs are only carried forward to the extent that they are expected to be recouped through the successful development and/or sale of the area or where activities in the area have not yet reached a stage that permits reasonable assessment of the existence of economically recoverable reserves. Accumulated costs in relation to an abandoned area are written off in full against profit or loss in the year in which the decision to abandon the area is made. When production commences, the accumulated costs for the relevant area of interest are amortised over the life of the area according to the rate of depletion of the economically recoverable reserves. A regular review is undertaken of each area of interest to determine the appropriateness of continuing to carry forward costs in relation to that area of interest. Costs of site restoration are provided for over the life of the facility from when exploration commences and are included in the costs of that stage. Site restoration costs include the dismantling and removal of mining plant, equipment and building structures, waste removal, and rehabilitation of the site in accordance with clauses of the mining permits. Such costs are determined using estimates of future costs, current legal requirements and technology on an undiscounted basis. Any changes in the estimates for the costs are accounted for on a prospective basis. In determining the costs of site restoration, there is uncertainty regarding the nature and extent of the restoration due to community expectations and future legislation. Accordingly, the costs have been determined on the basis that the restoration will be completed within one year of abandoning the site.
For
per
sona
l use
onl
y
17
Inca Minerals Limited For the year ended 30 June 2016
NOTES TO THE FINANCIAL STATEMENTS For the year ended 30 June 2016 Note 1: Statement of Significant Accounting Policies (continued)
e) Financial Instruments Financial instruments, incorporating financial assets and financial liabilities, are recognised when the entity becomes a party to the contractual provisions of the instrument. Trade date accounting is adopted for financial assets that are delivered within timeframes established by marketplace convention. Financial instruments are initially measured at fair value plus transactions costs where the instrument is not classified as at fair value through profit or loss. Transaction costs related to instruments classified as at fair value through profit or loss are expensed to profit or loss immediately. Financial instruments are classified and measured as set out below. Derecognition Financial assets are derecognised where the contractual rights to receipt of cash flows expires or the asset is transferred to another party whereby the entity no longer has any significant continuing involvement in the risks and benefits associated with the asset. Financial liabilities are derecognised where the related obligations are either discharged, cancelled or expire. The difference between the carrying value of the financial liability extinguished or transferred to another party and the fair value of consideration paid, including the transfer of non-cash assets or liabilities assumed, is recognised in profit or loss. Classification and Subsequent Measurement i. Financial assets at fair value through profit or loss Financial assets are classified at fair value through profit or loss when they are held for trading for the purpose of short term profit taking, where they are derivatives not held for hedging purposes, or designed as such to avoid an accounting mismatch or to enable performance evaluation where a group of financial assets is managed by key management personnel on a fair value basis in accordance with a documented risk management or investment strategy. Realised and unrealised gains and losses arising from changes in fair value are included in profit or loss in the period in which they arise. ii. Loans and receivables Loans and receivables are non-derivative financial assets with fixed or determinable payments that are not quoted in an active market and are subsequently measured at amortised cost using the effective interest rate method. iii. Held-to-maturity investments Held-to-maturity investments are non-derivative financial assets that have fixed maturities and fixed or determinable payments, and it is the Company’s intention to hold these investments to maturity. They are subsequently measured at amortised cost using the effective interest rate method. iv. Available-for-sale financial assets Available-for-sale financial assets are non-derivative financial assets that are either designated as such or that are not classified in any of the other categories. They comprise investments in the equity of other entities where there is neither a fixed maturity nor fixed or determinable payments. v. Financial liabilities Non-derivative financial liabilities (excluding financial guarantees) are subsequently measured at amortised cost using the effective interest rate method.
For
per
sona
l use
onl
y
18
Inca Minerals Limited For the year ended 30 June 2016
NOTES TO THE FINANCIAL STATEMENTS For the year ended 30 June 2016 Note 1: Statement of Significant Accounting Policies (continued)
e) Financial Instruments (continued) Fair value The Group measures some of its assets and liabilities at fair value on either a recurring or non-recurring basis, depending on the requirements of the applicable Accounting Standard. Fair value is the price the Group would receive to sell an asset or would have to pay to transfer a liability in an orderly (ie unforced) transaction between independent, knowledgeable and willing market participants at the measurement date. As fair value is a market-based measure, the closest equivalent observable market pricing information is used to determine fair value. Adjustments to market values may be made having regard to the characteristics of the specific asset or liability. The fair values of assets and liabilities that are not traded in an active market are determined using one or more valuation techniques. These valuation techniques maximise, to the extent possible, the use of observable market data. To the extent possible, market information is extracted from either the principal market for the asset or liability (ie the market with the greatest volume and level of activity for the asset or liability) or, in the absence of such a market, the most advantageous market available to the entity at the end of the reporting period (ie the market that maximises the receipts from the sale of the asset or minimises the payments made to transfer the liability, after taking into account transaction costs and transport costs). For non-financial assets, the fair value measurement also takes into account a market participant's ability to use the asset in its highest and best use or to sell it to another market participant that would use the asset in its highest and best use. The fair value of liabilities and the entity's own equity instruments (excluding those related to share-based payment arrangements) may be valued, where there is no observable market price in relation to the transfer of such financial instruments, by reference to observable market information where such instruments are held as assets. Where this information is not available, other valuation techniques are adopted and, where significant, are detailed in the respective note to the financial statements. Valuation Techniques In the absence of an active market for an identical asset or liability, the Group selects and uses one or more valuation techniques to measure the fair value of the asset or liability. The Group selects a valuation technique that is appropriate in the circumstances and for which sufficient data is available to measure fair value. The availability of sufficient and relevant data primarily depends on the specific characteristics of the asset or liability being measured. The valuation techniques selected by the Group are consistent with one or more of the following valuation approaches: · Market approach: valuation techniques that use prices and other relevant information generated by market
transactions for identical or similar assets or liabilities. · Income approach: valuation techniques that convert estimated future cash flows or income and expenses into
a single discounted present value. · Cost approach: valuation techniques that reflect the current replacement cost of an asset at its current service
capacity. Each valuation technique requires inputs that reflect the assumptions that buyers and sellers would use when pricing the asset or liability, including assumptions about risks. When selecting a valuation technique, the Group gives priority to those techniques that maximise the use of observable inputs and minimise the use of unobservable inputs. Inputs that are developed using market data (such as publicly available information on actual transactions) and reflect the assumptions that buyers and sellers would generally use when pricing the asset or liability are considered observable, whereas inputs for which market data is not available and therefore are developed using the best information available about such assumptions are considered unobservable.
For
per
sona
l use
onl
y
19
Inca Minerals Limited For the year ended 30 June 2016
NOTES TO THE FINANCIAL STATEMENTS For the year ended 30 June 2016 Note 1: Statement of Significant Accounting Policies (continued) e) Financial Instruments (continued) Fair value hierarchy AASB 13 requires the disclosure of fair value information by level of the fair value hierarchy, which categorises fair value measurements into one of three possible levels based on the lowest level that an input that is significant to the measurement can be categorised into as follows: Level 1 Measurements based on quoted prices (unadjusted) in active markets for identical assets or liabilities that the entity can access at the measurement date. Level 2 Measurements based on inputs other than quoted prices included in Level 1 that are observable for the asset or liability, either directly or indirectly. Level 3 Measurements based on unobservable inputs for the asset or liability. The fair values of assets and liabilities that are not traded in an active market are determined using one or more valuation techniques. These valuation techniques maximise, to the extent possible, the use of observable market data. If all significant inputs required to measure fair value are observable, the asset or liability is included in Level 2. If one or more significant inputs are not based on observable market data, the asset or liability is included in Level 3. The Group would change the categorisation within the fair value hierarchy only in the following circumstances: (i) if a market that was previously considered active (Level 1) became inactive (Level 2 or Level 3) or vice versa; or (ii) if significant inputs that were previously unobservable (Level 3) became observable (Level 2) or vice versa. When a change in the categorisation occurs, the Group recognises transfers between levels of the fair value hierarchy (ie transfers into and out of each level of the fair value hierarchy) on the date the event or change in circumstances occurred. f) Impairment of Assets At each reporting date, the entity reviews the carrying values of its tangible and intangible assets to determine whether there is any indication that those assets have been impaired. If such an indication exists, the recoverable amount of the asset, being the higher of the asset’s fair value less costs to sell and value in use, is compared to the asset’s carrying value. Any excess of the asset’s carrying value over its recoverable amount is expensed to profit or loss. Recoverable amount is the higher of fair value less costs to sell and value in use. In assessing value in use, the estimated future cash flows are discounted to their present value using a pre-tax discount rate that reflects current market assessments of the time value of money and the risks specific to the asset for which the estimates of future cash flows have not been adjusted.
For
per
sona
l use
onl
y
20
Inca Minerals Limited For the year ended 30 June 2016
NOTES TO THE FINANCIAL STATEMENTS For the year ended 30 June 2016 Note 1: Statement of Significant Accounting Policies (continued) f) Impairment of Assets (continued) If the recoverable amount of an asset is estimated to be less than its carrying amount, the carrying amount of the asset is reduced to its recoverable amount. An impairment loss is recognised in profit or loss immediately, unless the relevant asset is carried at fair value, in which case the impairment loss is treated as a revaluation decrease. Where an impairment loss subsequently reverses, the carrying amount of the asset is increased to the revised estimate of its recoverable amount, but only to the extent that the increased carrying amount does not exceed the carrying amount that would have been determined had no impairment loss been recognised for the asset in prior years. A reversal of an impairment loss is recognised in profit or loss immediately, unless the relevant asset is carried at fair value, in which case the reversal of the impairment loss is treated as a revaluation increase. g) Plant and Equipment
Plant and equipment are measured on the cost basis and therefore carried at cost less accumulated depreciation and any accumulated impairment. In the event the carrying amount of plant and equipment is greater than the estimated recoverable amount, the carrying amount is written down immediately to the estimated recoverable amount and impairment losses are recognised either in profit or loss or as a revaluation decrease if the impairment losses relate to a revalued asset.
The carrying amount of plant and equipment is reviewed annually by directors to ensure it is not in excess of the recoverable amount from these assets. The recoverable amount is assessed on the basis of the expected net cash flows that will be received from the asset’s employment and subsequent disposal. The expected net cash flows have been discounted to their present values in determining recoverable amounts.
Subsequent costs are included in the asset’s carrying amount or recognised as a separate asset, as appropriate, only when it is probable that future economic benefits associated with the item will flow to the Company and the cost of the item can be measured reliably. All other repairs and maintenance are charged to the statement of comprehensive income during the financial period in which they are incurred.
Depreciation
The depreciable amount of all fixed assets, is depreciated on a straight-line basis over the asset’s useful life to the Company commencing from the time the asset is held ready for use.
The depreciation rates used for each class of depreciable assets are:
Class of fixed asset Depreciation rate
Plant and equipment 20–33%
Motor vehicles 20–33%
IT equipment 33%
Leasehold improvements 20%
The assets’ residual values and useful lives are reviewed, and adjusted if appropriate, at the end of each reporting period.
An asset’s carrying amount is written down immediately to its recoverable amount if the asset’s carrying amount is greater than its estimated recoverable amount.
Gains and losses on disposals are determined by comparing proceeds with the carrying amount. These gains and losses are included in the profit or loss.
For
per
sona
l use
onl
y
21
Inca Minerals Limited For the year ended 30 June 2016
NOTES TO THE FINANCIAL STATEMENTS For the year ended 30 June 2016
Note 1: Statement of Significant Accounting Policies (continued)
h) Cash and Cash Equivalents
Cash and cash equivalents include cash on hand and deposits held at call with banks.
i) Goods and Services Tax
Revenues, expenses and assets are recognised net of the amount of GST, except where the amount of GST incurred is not recoverable from the Australian Tax Office. In these circumstances the GST is recognised as part of the cost of acquisition of the asset or as part of an item of the expense. Receivables and payables in the statement of financial position are shown inclusive of GST. Cash flows are presented in the statement of cash flows on a gross basis, except for the GST component of investing and financing activities, which are disclosed as operating cash flows. j) Contributed Equity
Ordinary shares are classified as equity. Incremental costs directly attributable to the issue of new shares or options are shown in equity as a deduction, net of tax, from the proceeds. Incremental costs directly attributable to the issue of new shares or options for the acquisition of a business are not included in the cost of the acquisition as part of the purchase consideration. k) Earnings per Share (i) Basic earnings per share Basic earnings per share is calculated by dividing the profit attributable to equity holders of the Company, excluding any costs of servicing equity other than ordinary shares, by the weighted average number of ordinary shares outstanding during the financial year. (ii) Diluted earnings per share Diluted earnings per share adjusts the figures used in the determination of basic earnings per share to take into account the after income tax effect of interest and other financing costs associated with dilutive potential ordinary shares and the weighted average number of shares assumed to have been issued for no consideration in relation to dilutive potential ordinary shares. l) Leases
Leases of fixed assets, where substantially all the risks and benefits incidental to the ownership of the asset, but not the legal ownership that are transferred to the economic entity, are classified as finance leases.
Finance leases are capitalised by recording an asset and a liability at the lower of the amounts equal to the fair value of the leased property or the present value of the minimum lease payments, including any guaranteed residual values. Lease payments are allocated between the reduction of the lease liability and the lease interest expense for the period. Leased assets are depreciated on a straight-line basis over the shorter of their estimated useful lives or the lease term. Lease payments for operating leases, where substantially all the risks and benefits remain with the lessor, are charged as expenses in the periods in which they are incurred.
For
per
sona
l use
onl
y
22
Inca Minerals Limited For the year ended 30 June 2016
NOTES TO THE FINANCIAL STATEMENTS For the year ended 30 June 2016 Note 1: Statement of Significant Accounting Policies (continued) m) Employee Benefits
Provision is made for the Company’s liability for employee benefits arising from services rendered by employees to reporting date. Employee benefits that are expected to be settled within one year have been measured at the amounts expected to be paid when the liability is settled, plus related on-costs. Employee benefits payable later than one year have been measured at the present value of the estimated future cash outflows to be made for those benefits. n) Segment Reporting
Operating segments are reported in a manner consistent with the internal reporting provided to the chief operating decision maker. The chief operating decision maker, who is responsible for allocating resources and assessing performance of the operating segments, has been identified as the Board of Directors. o) Trade and Other Receivables Trade and other receivables include amounts due from customers for goods sold and services performed in the ordinary course of business. Receivables expected to be collected within 12 months of the end of the reporting period are classified as current assets. All other receivables are classified as non-current assets. Trade and other receivables are initially recognised at fair value and subsequently measured at amortised cost using the effective interest method, less any provision for impairment. p) Trade and Other Payables
Trade and other payables represent the liabilities for goods and services received by the entity that remain unpaid at the end of the reporting period. The balance is recognised as a current liability with the amounts normally paid within 30 days of recognition of the liability. q) Foreign Currency Transactions Balances Functional and presentation currency The functional currency of each of the Group’s entities is measured using the currency of the primary economic environment in which that entity operates. The consolidated financial statements are presented in Australian dollars, which is the parent entity’s functional currency. Transactions and balances Foreign currency transactions are translated into functional currency using the exchange rates prevailing at the date of the transaction. Foreign currency monetary items are translated at the year-end exchange rate. Non-monetary items measured at historical cost continue to be carried at the exchange rate at the date of the transaction. Non-monetary items measured at fair value are reported at the exchange rate at the date when fair values were determined. Exchange differences arising on the translation of monetary items are recognised in profit or loss, except where deferred in equity as a qualifying cash flow or net investment hedge. Exchange differences arising on the translation of non-monetary items are recognised directly in other comprehensive income to the extent that the underlying gain or loss is recognised in other comprehensive income; otherwise the exchange difference is recognised in profit or loss.
For
per
sona
l use
onl
y
23
Inca Minerals Limited For the year ended 30 June 2016
NOTES TO THE FINANCIAL STATEMENTS For the year ended 30 June 2016 Note 1: Statement of Significant Accounting Policies (continued)
q) Foreign Currency Transactions Balances (continued)
Group companies The financial results and position of foreign operations, whose functional currency is different from the Group’s presentation currency, are translated as follows:
assets and liabilities are translated at exchange rates prevailing at the end of the reporting period;
income and expenses are translated at average exchange rates for the period; and
retained earnings are translated at the exchange rates prevailing at the date of the transaction. Exchange differences arising on translation of foreign operations with functional currencies other than Australian dollars are recognised in other comprehensive income and included in the foreign currency translation reserve in the statement of financial position. These differences are recognised in profit or loss in the period in which the operation is disposed of. r) Critical Accounting Estimates and Other Accounting Judgements
Estimates and judgements are continually evaluated and are based on historical experience and other factors, including expectations of future events that are believed to be reasonable under the circumstances. The Company is of the view that there are no critical accounting estimates and judgements in this financial report, other than accounting estimates and judgements in relation to the carrying value of mineral exploration expenditure.
Key judgements Deferred exploration and evaluation expenditure Exploration and evaluation costs are carried forward where right of tenure of the area of interest is current. These costs are carried forward in respect of an area that has not at reporting date reached a stage that permits reasonable assessment of the existence of economically recoverable reserves, or alternatively, are expected to be sold. Refer to the accounting policy stated in Note 1(d).
s) New Standards and Interpretations Not Yet Adopted
A number of new standards, amendments to standards and interpretations issued by the AASB which are not yet mandatorily applicable to the Group have not been applied in preparing these consolidated financial statements. Those which may be relevant to the Group are set out below. The Group does not plan to adopt these standards early.
AASB 9 Financial Instruments and associated Amending Standards (applicable for annual reporting period commencing 1 January 2018).
The Standard will be applicable retrospectively (subject to the comment on hedge accounting below) and includes revised requirements for the classification and measurement of financial instruments, revised recognition and derecognition requirements for financial instruments and simplified requirements for hedge accounting.
For
per
sona
l use
onl
y
24
Inca Minerals Limited For the year ended 30 June 2016
NOTES TO THE FINANCIAL STATEMENTS For the year ended 30 June 2016 Note 1: Statement of Significant Accounting Policies (continued)
s) New Standards and Interpretations Not Yet Adopted (continued)
Key changes made to this standard that may affect the Group on initial application include certain simplifications to the classification of financial assets, simplifications to the accounting of embedded derivatives, and the irrevocable election to recognise gains and losses on investments in equity instruments that are not held for trading in other comprehensive income. The directors anticipate that the adoption of AASB 9 will not have a material impact on the Group’s financial instruments.
AASB 15: Revenue from Contracts with Customers (applicable to annual reporting periods commencing on or after 1 January 2018).
When effective, this Standard will replace the current accounting requirements applicable to revenue with a single, principles-based model. Except for a limited number of exceptions, including leases, the new revenue model in AASB 15 will apply to all contracts with customers as well as non-monetary exchanges between entities in the same line of business to facilitate sales to customers and potential customers. The core principle of the Standard is that an entity will recognise revenue to depict the transfer of promised goods or services to customers in an amount that reflects the consideration to which the entity expects to be entitled in exchange for the goods or services. To achieve this objective, AASB 15 provides the following five-step process: - identify the contract(s) with a customer; - identify the performance obligations in the contract(s); - determine the transaction price; - allocate the transaction price to the performance obligations in the contract(s); and - recognise revenue when (or as) the performance obligations are satisfied. This Standard will require retrospective restatement, as well as enhanced disclosures regarding revenue. Although the directors anticipate that the adoption of AASB 15 may have an impact on the Group's financial statements, the directors anticipate that the adoption of AASB 15 will not have a material impact on the Group’s revenue recognition and disclosures.
AASB 16: Leases (applicable to annual reporting periods commencing on or after 1 January 2019). AASB 16 removes the classification of leases as either operating leases or finance leases for the lessee effectively treating all leases as finance leases. Short term leases (less than 12 months) and leases of a low value are exempt from the lease accounting requirements. Lessor accounting remains similar to current practice. Although the directors anticipate that the adoption of AASB 16 may have an impact on the Group's financial statements, the directors anticipate that the adoption of AASB 15 will not have a material impact on the Group’s recognition of leases and disclosures.
AASB 2014-3: Amendments to Australian Accounting Standards – Accounting for Acquisitions of Interests in Joint Operations [AASB 1 & AASB 11].
For
per
sona
l use
onl
y
25
Inca Minerals Limited For the year ended 30 June 2016
NOTES TO THE FINANCIAL STATEMENTS For the year ended 30 June 2016 Note 1: Statement of Significant Accounting Policies (continued)
s) New Standards and Interpretations Not Yet Adopted (continued)
AASB 2014-3 amends AASB 11 Joint Arrangements to provide guidance on the accounting for acquisitions of interests in joint operations in which the activity constitutes a business. The amendments require: (a) the acquirer of an interest in a joint operation in which the activity constitutes a business, as defined in
AASB 3 Business Combinations, to apply all of the principles on business combinations accounting in AASB 3 and other Australian Accounting Standards except for those principles that conflict with the guidance in AASB 11.
(b) the acquirer to disclose the information required by AASB 3 and other Australian Accounting Standards for business combinations.
This Standard also makes an editorial correction to AASB 11. The directors anticipate that the adoption of these amendments will not have a material impact on the financial statements.
AASB 2014-9: Amendments to Australian Accounting Standards – Equity Method in Separate Financial Statements (AASB 2014-9 applies to annual reporting periods beginning on or after 1 January 2016. Early adoption permitted).
AASB 2014-9 amends AASB 127 Separate Financial Statements, and consequentially amends AASB 1 First-time Adoption of Australian Accounting Standards and AASB 128 Investments in Associates and Joint Ventures, to allow entities to use the equity method of accounting for investments in subsidiaries, joint ventures and associates in their separate financial statements. AASB 2014-9 also makes editorial corrections to AASB 127. The directors anticipate that the adoption of these amendments will not have a material impact on the financial statements.
Other standards not yet applicable. There are no other standards that are not yet effective and that would be expected to have a material impact on the entity in the current or future reporting periods and on foreseeable future transactions. t) Comparative Figures
When required by Accounting Standards, comparative figures have been adjusted to conform to changes in presentation for the current financial year. Note 2: Revenue
Consolidated 2016 2015 $ $
Interest received 10,546 23,899 Sale of assets 10,000 10,000
20,546 33,899
For
per
sona
l use
onl
y
26
Inca Minerals Limited For the year ended 30 June 2016
NOTES TO THE FINANCIAL STATEMENTS For the year ended 30 June 2016 Note 3: Income Tax (a) Income tax recognised in profit No income tax is payable by the Company as it recorded losses for income tax purposes for the year. (b) Numerical reconciliation between income tax expense and the loss before income tax.
Consolidated 2016 2015 $ $
Loss before income tax (13,137,190) (4,503,572) Income tax at 30% (3,941,157) (1,351,071) Tax effect of:
Deferred tax asset not recognised 2,549,790 576,600 Movement in unrecognised temporary differences 1,391,277 774,281
Tax effect of permanent differences 90 190
Income tax benefit - -
(c) Unrecognised deferred tax balances
Tax losses available to the Company
21,626,210
13,359,976
Potential tax benefit at 30% 6,487,863 4,007,992
A deferred tax asset attributable to income tax losses has not been recognised at reporting date as the probability criteria disclosed in Note 1(c) is not satisfied and such benefit will only be available if the conditions of deductibility, also disclosed in Note 1(c), are satisfied. The corporate income tax rate in Peru has reduced from 30% to 28%. Note 4: Dividends No dividends were paid or declared since the start of the financial year. No recommendation for payment of dividends has been made. Note 5: Trade and Other Receivables
Consolidated 2016 2015 $ $ Current Other receivables 20,479 30,137 GST and VAT 121,509 429,759 Loans (i) - 239,480 Less: provision for impairment - (219,880)
141,988 479,496
None of the trade and other receivables are past due date.
(i) Loans consist of interest-free loans given to former senior executives in order to purchase shares in the
Company. These loans were forfeited by the former senior executives during the year and the shares that were acquired were transferred back to the Company.
For
per
sona
l use
onl
y
27
Inca Minerals Limited For the year ended 30 June 2016
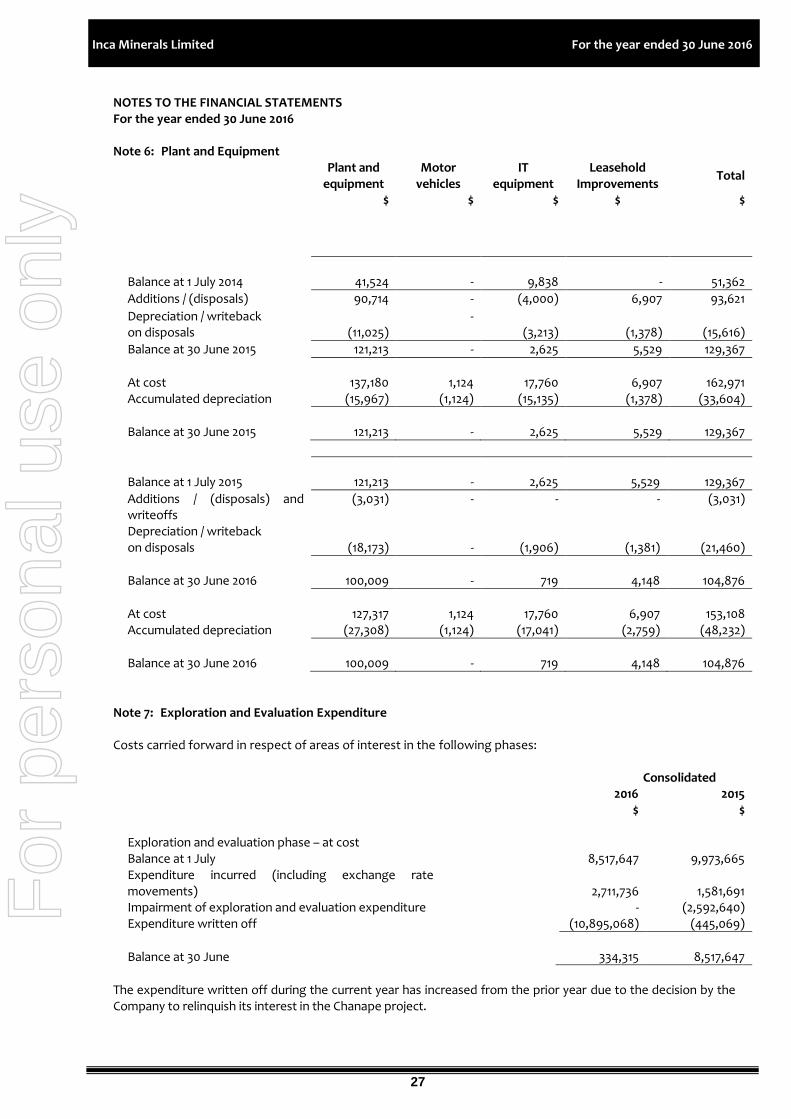
NOTES TO THE FINANCIAL STATEMENTS For the year ended 30 June 2016 Note 6: Plant and Equipment
Plant and equipment
Motor vehicles
IT equipment
Leasehold Improvements
Total
$ $ $ $ $
Balance at 1 July 2014
41,524
-
9,838
-
51,362
Additions / (disposals) 90,714 - (4,000) 6,907 93,621
Depreciation / writeback on disposals
(11,025)
- (3,213)
(1,378)
(15,616)
Balance at 30 June 2015 121,213 - 2,625 5,529 129,367
At cost
137,180
1,124
17,760
6,907
162,971
Accumulated depreciation (15,967) (1,124) (15,135) (1,378) (33,604)
Balance at 30 June 2015
121,213
-
2,625
5,529
129,367
Balance at 1 July 2015
121,213
-
2,625
5,529
129,367
Additions / (disposals) and writeoffs
(3,031) - - - (3,031)
Depreciation / writeback on disposals
(18,173)
-
(1,906)
(1,381)
(21,460)
Balance at 30 June 2016
100,009
-
719
4,148
104,876
At cost
127,317
1,124
17,760
6,907
153,108
Accumulated depreciation (27,308) (1,124) (17,041) (2,759) (48,232)
Balance at 30 June 2016
100,009
-
719
4,148
104,876
Note 7: Exploration and Evaluation Expenditure Costs carried forward in respect of areas of interest in the following phases:
Consolidated 2016 2015 $ $
Exploration and evaluation phase – at cost Balance at 1 July 8,517,647 9,973,665 Expenditure incurred (including exchange rate movements)
2,711,736
1,581,691
Impairment of exploration and evaluation expenditure - (2,592,640) Expenditure written off (10,895,068) (445,069)
Balance at 30 June
334,315
8,517,647
The expenditure written off during the current year has increased from the prior year due to the decision by the Company to relinquish its interest in the Chanape project.
For
per
sona
l use
onl
y
28
Inca Minerals Limited For the year ended 30 June 2016
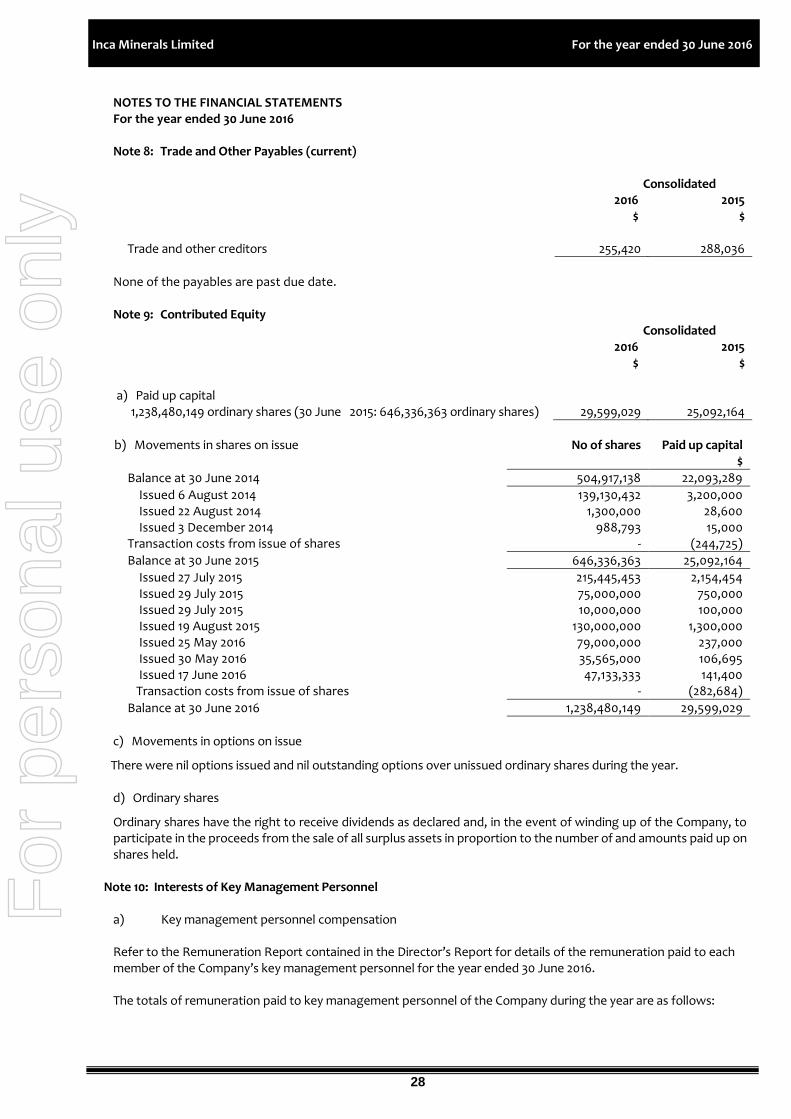
NOTES TO THE FINANCIAL STATEMENTS For the year ended 30 June 2016 Note 8: Trade and Other Payables (current)
Consolidated 2016 2015 $ $
Trade and other creditors 255,420 288,036
None of the payables are past due date. Note 9: Contributed Equity
Consolidated 2016 2015 $ $
a) Paid up capital 1,238,480,149 ordinary shares (30 June 2015: 646,336,363 ordinary shares) 29,599,029 25,092,164
b) Movements in shares on issue No of shares Paid up capital
$
Balance at 30 June 2014 504,917,138 22,093,289
Issued 6 August 2014 139,130,432 3,200,000 Issued 22 August 2014 1,300,000 28,600 Issued 3 December 2014 988,793 15,000 Transaction costs from issue of shares - (244,725)
Balance at 30 June 2015 646,336,363 25,092,164
Issued 27 July 2015 215,445,453 2,154,454 Issued 29 July 2015 75,000,000 750,000 Issued 29 July 2015 10,000,000 100,000 Issued 19 August 2015 130,000,000 1,300,000 Issued 25 May 2016 79,000,000 237,000 Issued 30 May 2016 35,565,000 106,695 Issued 17 June 2016 47,133,333 141,400 Transaction costs from issue of shares - (282,684)
Balance at 30 June 2016 1,238,480,149 29,599,029
c) Movements in options on issue
There were nil options issued and nil outstanding options over unissued ordinary shares during the year. d) Ordinary shares
Ordinary shares have the right to receive dividends as declared and, in the event of winding up of the Company, to participate in the proceeds from the sale of all surplus assets in proportion to the number of and amounts paid up on shares held.
Note 10: Interests of Key Management Personnel a) Key management personnel compensation
Refer to the Remuneration Report contained in the Director’s Report for details of the remuneration paid to each member of the Company’s key management personnel for the year ended 30 June 2016. The totals of remuneration paid to key management personnel of the Company during the year are as follows:
For
per
sona
l use
onl
y
29
Inca Minerals Limited For the year ended 30 June 2016
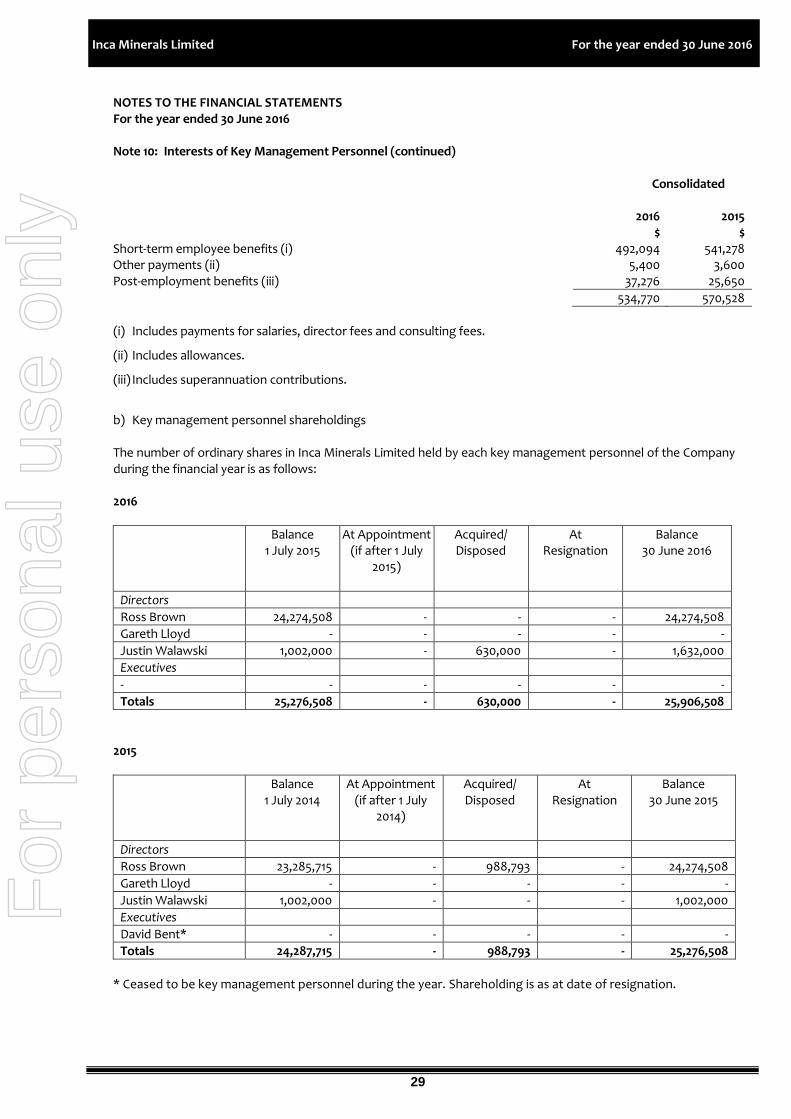
NOTES TO THE FINANCIAL STATEMENTS For the year ended 30 June 2016 Note 10: Interests of Key Management Personnel (continued)
Consolidated
2016 2015 $ $
Short-term employee benefits (i) 492,094 541,278 Other payments (ii) 5,400 3,600 Post-employment benefits (iii) 37,276 25,650
534,770 570,528
(i) Includes payments for salaries, director fees and consulting fees.
(ii) Includes allowances.
(iii) Includes superannuation contributions.
b) Key management personnel shareholdings The number of ordinary shares in Inca Minerals Limited held by each key management personnel of the Company during the financial year is as follows:
2016
Balance 1 July 2015
At Appointment (if after 1 July
2015)
Acquired/ Disposed
At Resignation
Balance 30 June 2016
Directors
Ross Brown 24,274,508 - - - 24,274,508
Gareth Lloyd - - - - -
Justin Walawski 1,002,000 - 630,000 - 1,632,000
Executives
- - - - - -
Totals 25,276,508 - 630,000 - 25,906,508
2015
Balance 1 July 2014
At Appointment (if after 1 July
2014)
Acquired/ Disposed
At Resignation
Balance 30 June 2015
Directors
Ross Brown 23,285,715 - 988,793 - 24,274,508
Gareth Lloyd - - - - -
Justin Walawski 1,002,000 - - - 1,002,000
Executives
David Bent* - - - - -
Totals 24,287,715 - 988,793 - 25,276,508
* Ceased to be key management personnel during the year. Shareholding is as at date of resignation.
For
per
sona
l use
onl
y
30
Inca Minerals Limited For the year ended 30 June 2016
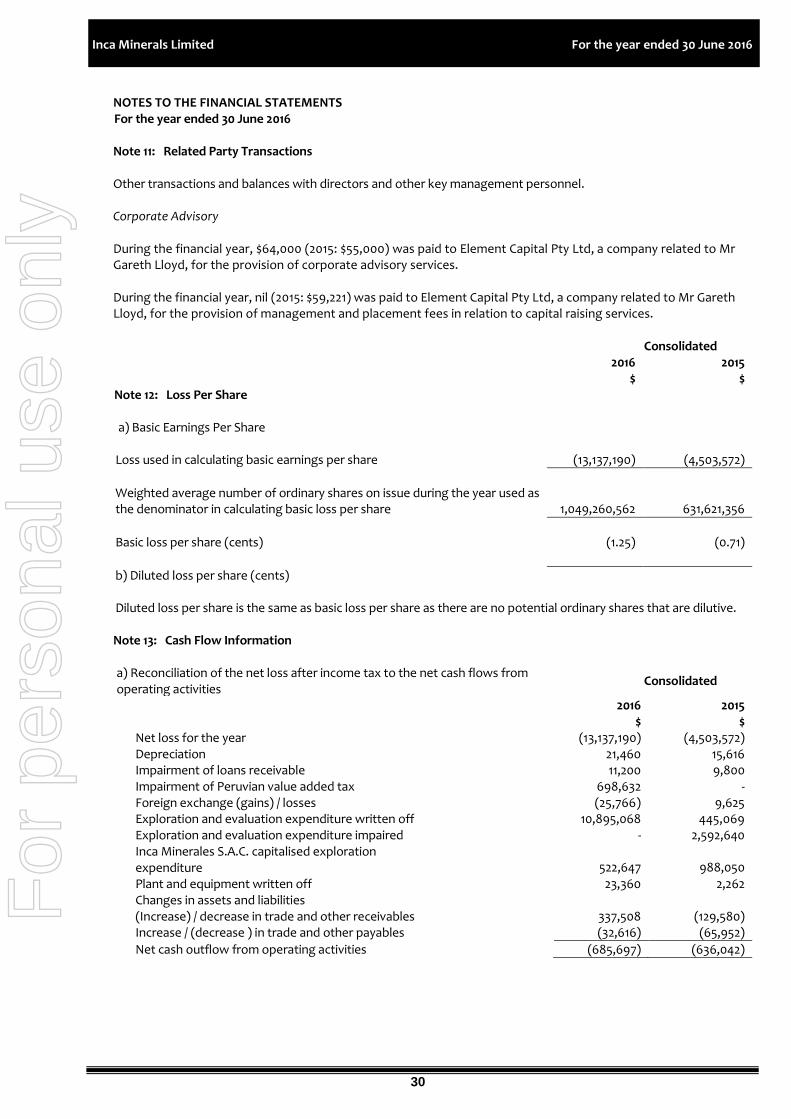
NOTES TO THE FINANCIAL STATEMENTS For the year ended 30 June 2016 Note 11: Related Party Transactions Other transactions and balances with directors and other key management personnel.
Corporate Advisory During the financial year, $64,000 (2015: $55,000) was paid to Element Capital Pty Ltd, a company related to Mr Gareth Lloyd, for the provision of corporate advisory services. During the financial year, nil (2015: $59,221) was paid to Element Capital Pty Ltd, a company related to Mr Gareth Lloyd, for the provision of management and placement fees in relation to capital raising services.
Consolidated 2016 2015 $ $
Note 12: Loss Per Share a) Basic Earnings Per Share
Loss used in calculating basic earnings per share (13,137,190) (4,503,572)
Weighted average number of ordinary shares on issue during the year used as the denominator in calculating basic loss per share 1,049,260,562 631,621,356
Basic loss per share (cents) (1.25) (0.71)
b) Diluted loss per share (cents)
Diluted loss per share is the same as basic loss per share as there are no potential ordinary shares that are dilutive. Note 13: Cash Flow Information a) Reconciliation of the net loss after income tax to the net cash flows from operating activities
Consolidated
2016 2015 $ $ Net loss for the year (13,137,190) (4,503,572) Depreciation 21,460 15,616 Impairment of loans receivable 11,200 9,800 Impairment of Peruvian value added tax 698,632 - Foreign exchange (gains) / losses Exploration and evaluation expenditure written off
(25,766) 10,895,068
9,625 445,069
Exploration and evaluation expenditure impaired - 2,592,640 Inca Minerales S.A.C. capitalised exploration expenditure
522,647 988,050
Plant and equipment written off 23,360 2,262 Changes in assets and liabilities (Increase) / decrease in trade and other receivables 337,508 (129,580) Increase / (decrease ) in trade and other payables (32,616) (65,952)
Net cash outflow from operating activities (685,697) (636,042)
For
per
sona
l use
onl
y
31
Inca Minerals Limited For the year ended 30 June 2016
NOTES TO THE FINANCIAL STATEMENTS For the year ended 30 June 2016 Note 13: Cash Flow Information (continued)
Consolidated 2016 2015 $ $
(b) Reconciliation of cash and cash equivalents Cash balance comprises: - cash assets 151,753 208,810
(c) Non-cash financing activities There were no non-cash financing activities during the year ended 30 June 2016. Note 14: Expenditure Commitments The Group has certain commitments to meet minimum expenditure requirements on the mineral exploration assets in which it has an interest. These commitments are optional and only required if the Company wishes to maintain its rights of earn-in or rights of tenure. Outstanding exploration commitments for not later than one year and for between one and five years are as follows:
Consolidated
30 June 2016
Consolidated 30 June
2015
$ $ Not later than one year 324,307 2,294,435 Between one and five years 2,995,907 6,303,757
3,320,214 8,598,192
The exploration expenditure commitments above include commitments related to agreements for the acquisition of interests in mining concessions pertaining to the Group’s Riqueza and Cerro Rayas projects in Peru. As at 30 June 2016 the Group has met all of its obligations in respect of the agreements and all future exploration commitments are payable at the Group’s discretion and dependent upon the Group acquiring the exclusive rights to the mining concessions. The key terms of the agreement pertaining to the Riqueza and Cerro Rayas projects are set out below.
1. A 5 year mining concession transfer option and assignment agreement signed 24 March 2016 granting the
Group the exclusive option to acquire 100% interest in mining concessions referred to as the Riqueza Project. The Group has the exclusive right to terminate at any time during the transfer option and assignment period and any unpaid amounts are not payable to the vendor. Other key terms are:
For
per
sona
l use
onl
y
32
Inca Minerals Limited For the year ended 30 June 2016
NOTES TO THE FINANCIAL STATEMENTS For the year ended 30 June 2016 Note 14: Expenditure Commitments (continued)
Total Mining Concession Transfer Option & Assignment (MCTOA) Consideration
US$1,773,000
Timing of Payment of MCTOA Consideration
MCTOA Payment on Execution Date (ED): US$30,000*
MCTOA Payment 6 months from ED: US$20,000
MCTOA Payment 12 months from ED: US$50,000
MCTOA Payment 18 months from ED: US$60,000
MCTOA Payment 24 months from ED: US$50,000
MCTOA Payment 30 months from ED: US$63,000
MCTOA Payment 36 months from ED: US$100,000
MCTOA Payment 42 months from ED: US$100,000
MCTOA Payment 48 months from ED: US$150,000
MCTOA Payment 54 months from ED: US$150,000
MCTOA Payment 60 months from ED: US$1,000,000
Mining assignment period 5 years from the Execution Date
NSR Royalty 2% NSR. The Group has a 20-year option to buy back 50% of the NSR for US$1,000,000 leaving a 1% NSR to the vendor.
Cancellability The Group has the exclusive right to terminate at any time during the option and assignment period without cost or penalty. Any unpaid amounts are not payable to the vendor.
* The Company has met all of its applicable commitments under the agreement with MRC. 2. A 2.5 year mining concession transfer option and assignment agreement commencing 24 October 2015
granting the Group the exclusive option to acquire 100% interest in a mining concession referred to as the Cerro Rayas Project. The Group has the exclusive right to terminate at any time during the transfer option and assignment period and any unpaid amounts are not payable to the vendor. Other key terms are:
Total Mining Concession Transfer Option & Assignment (MCTOA) Consideration
US$250,000
Timing of Payment of MCTOA Consideration
Exclusive Option Payment (EOP) Commencement Date (CD): US$5,000*
4 x EOPs of US$1,250 each at 2, 3, 4 and 5 months from CD: US$5,000*
EOP at 3 months from CD: US$1,250*
EOP at 4 months from CD: US$1,250*
EOP at 5 months from CD: US$1,250*
Mining assignment and purchase option payments (MAPOP):
MAPOP at 5 months from CD: US$15,000*
MAPOP at 17 months from CD: US$100,000
12 x monthly MAPOPs of US$5,000 18 – 30 months from CD: US$60,000
MAPOP at 30 months from CD: US$65,000
Mining assignment period 2.5 years from the Commencement Date
Cancellability The Group has the exclusive right to terminate at any time during the option and assignment period without cost or penalty. Any unpaid amounts are not payable to the vendor.
* The Company has met all of its applicable commitments under the agreement with the vendor.
For
per
sona
l use
onl
y
33
Inca Minerals Limited For the year ended 30 June 2016
NOTES TO THE FINANCIAL STATEMENTS For the year ended 30 June 2016 Note 14: Expenditure Commitments (continued)
In addition to exploration expenditure commitments the Group has certain operating commitments pertaining to non-cancellable operating leases and other non-cancellable agreements contracted for but not recognised in the financial statements:
Consolidated
30 June 2016
Consolidated 30 June
2015 $ $ Not later than one year 73,595 92,330 Between one and five years 4,500 21,620
78,095 113,950
Note 15: Auditor’s Remuneration
Statutory audit by auditor of the parent company
Audit and review of financial statements of parent entity 24,000 24,035
Audit and review of financial statements of subsidiary entity 950 950
24,950 24,985
Statutory audit by auditor of Inca Minerales SAC 11,446 11,056
Note 16: Segment Information The Company has identified its operating segments based on the internal reports that are reviewed and used by the Board of directors (chief operating decision makers) in assessing performance and determining the allocation of resources. The Company operates in the segments of mineral exploration within Peru and Australia. The Company is domiciled in Australia. All revenue from external parties is generated from Australia only. Segment revenues are allocated based on the country in which the party is located. Operating revenues of approximately Nil (2015: Nil) are derived from a single external party. All the assets are located in Peru and Australia. Segment assets are allocated to countries based on where the assets are located.
Reportable segments: Australia Peru Consolidated $ $ $ Segment revenue 2016 20,546 - 20,546 2015 33,899 - ---- 33,899 Segment result 2016 (835,806) (12,301,384) (13,137,190) 2015 (1,226,481) (3,277,091) (4,503,572) Segment assets 2016 68,456 664,476 732,932 2015 560,330 8,774,990 9,335,320 Segment liabilities 2016 (112,142) (143,278) (255,420) 2015 (132,138) (155,898) (288,036) Depreciation and amortisation expense 2016 (3,477) (17,983) (21,460) 2015 (15,616) - (15,616)
For
per
sona
l use
onl
y
34
Inca Minerals Limited For the year ended 30 June 2016
NOTES TO THE FINANCIAL STATEMENTS For the year ended 30 June 2016 Note 17: Financial Risk Management Objectives and Policies a) Interest rate risk The Company’s exposure to interest rate risk which is the risk that a financial instruments value will fluctuate as a result of changes in market interest rates and the effective weighted average interest rate for each class of financial assets and financial liabilities as set out below:
Weighted average
Floating interest rate
Fixed interest maturing
Fixed interest maturing
interest rate (%) $
1 year or less $
1 to 5 years $
Total $
30 June 2016 Cash and cash equivalents
0.27 131,753 20,000 -
151,753
30 June 2015 Cash and cash equivalents
0.92 188,810 20,000 -
208,810
Interest rate sensitivity analysis At 30 June 2016, if interest rates had changed by 25 basis points during the entire year with all other variables held constant, profit for the year and equity would have been $451 higher/lower (2015: $987), mainly as a result of higher/lower interest income from cash and cash equivalents. A 25 basis point increase or decrease is used when reporting interest rate risk internally to key management personnel and represents management’s assessment of the possible change in interest rates.
(b) Credit risk The maximum exposure to credit risk at reporting date on financial assets of the Company is the carrying amount, net of any provisions for doubtful debts, as disclosed in the statement of financial position and notes to the financial statements. (c) Commodity price risk The Company is not exposed to commodity price risk as the operations of the Company are not yet at the production stage.
(d) Liquidity risk
The Company manages liquidity risk by monitoring forecast cash flows. The table below analyses the entity’s financial liabilities into relevant maturity groupings based on the remaining period from the statement of financial position date to the contractual maturity date. As the amounts disclosed in the table are the contractual undiscounted cash flows, these balances will not necessarily agree with the amounts disclosed in the statement of financial position. F
or p
erso
nal u
se o
nly
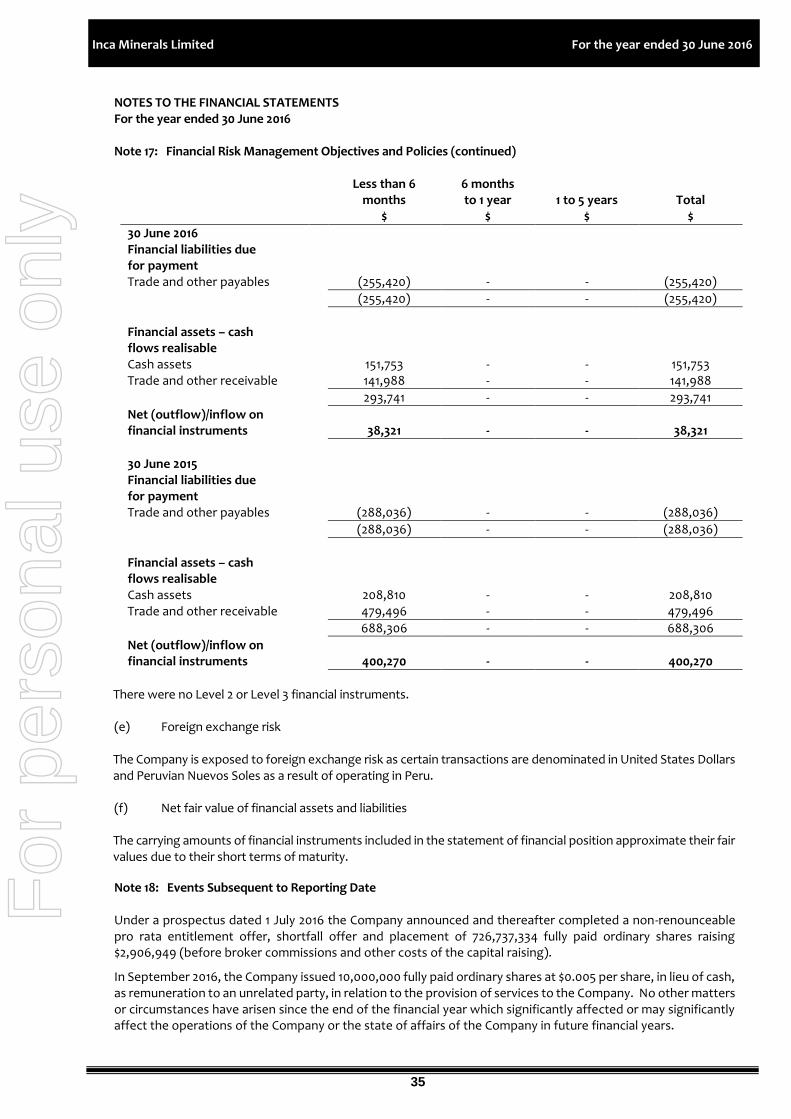
35
Inca Minerals Limited For the year ended 30 June 2016
NOTES TO THE FINANCIAL STATEMENTS For the year ended 30 June 2016 Note 17: Financial Risk Management Objectives and Policies (continued)
Less than 6 months
$
6 months to 1 year
$ 1 to 5 years
$
Total $
30 June 2016 Financial liabilities due for payment
Trade and other payables (255,420) - - (255,420)
(255,420) - - (255,420)
Financial assets – cash flows realisable
Cash assets 151,753 - - 151,753 Trade and other receivable 141,988 - - 141,988
293,741 - - 293,741
Net (outflow)/inflow on financial instruments 38,321 - -
38,321
30 June 2015 Financial liabilities due for payment
Trade and other payables (288,036) - - (288,036)
(288,036) - - (288,036)
Financial assets – cash flows realisable
Cash assets 208,810 - - 208,810 Trade and other receivable 479,496 - - 479,496
688,306 - - 688,306
Net (outflow)/inflow on financial instruments 400,270 - -
400,270
There were no Level 2 or Level 3 financial instruments. (e) Foreign exchange risk
The Company is exposed to foreign exchange risk as certain transactions are denominated in United States Dollars and Peruvian Nuevos Soles as a result of operating in Peru. (f) Net fair value of financial assets and liabilities The carrying amounts of financial instruments included in the statement of financial position approximate their fair values due to their short terms of maturity.
Note 18: Events Subsequent to Reporting Date
Under a prospectus dated 1 July 2016 the Company announced and thereafter completed a non-renounceable pro rata entitlement offer, shortfall offer and placement of 726,737,334 fully paid ordinary shares raising $2,906,949 (before broker commissions and other costs of the capital raising).
In September 2016, the Company issued 10,000,000 fully paid ordinary shares at $0.005 per share, in lieu of cash, as remuneration to an unrelated party, in relation to the provision of services to the Company. No other matters or circumstances have arisen since the end of the financial year which significantly affected or may significantly affect the operations of the Company or the state of affairs of the Company in future financial years.
For
per
sona
l use
onl
y
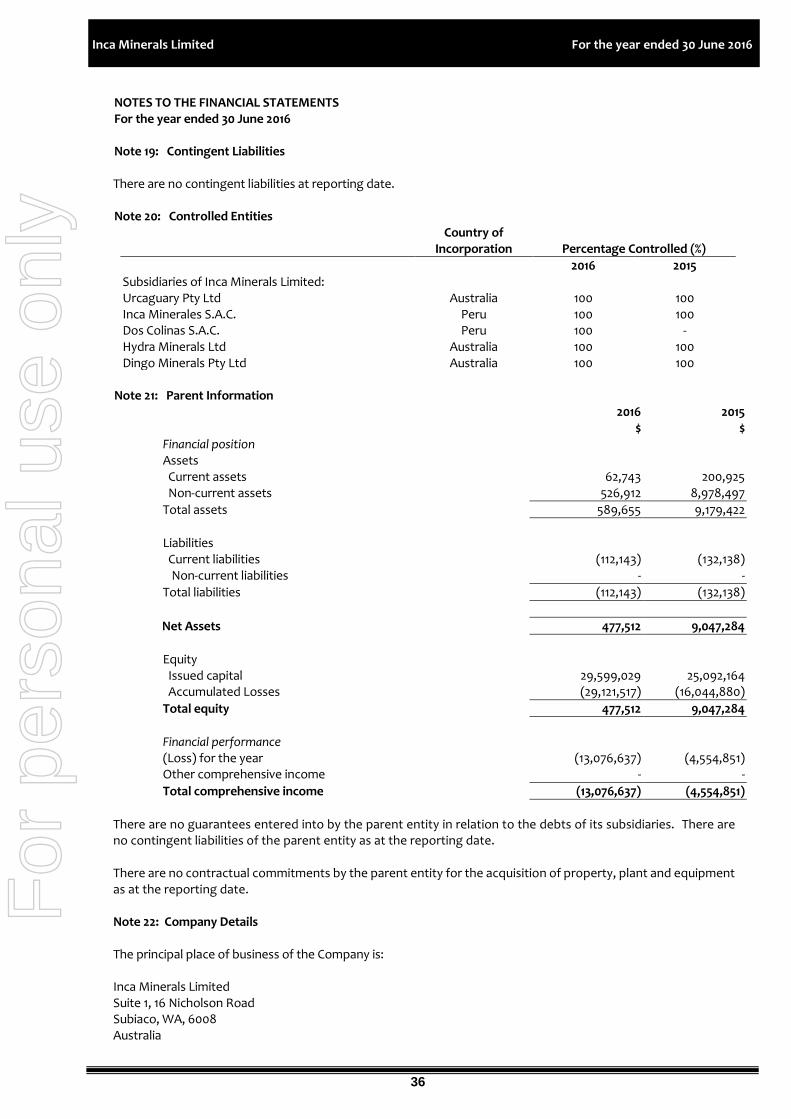
36
Inca Minerals Limited For the year ended 30 June 2016
NOTES TO THE FINANCIAL STATEMENTS For the year ended 30 June 2016 Note 19: Contingent Liabilities
There are no contingent liabilities at reporting date. Note 20: Controlled Entities
Country of Incorporation
Percentage Controlled (%)
2016 2015 Subsidiaries of Inca Minerals Limited: Urcaguary Pty Ltd Australia 100 100 Inca Minerales S.A.C. Peru 100 100 Dos Colinas S.A.C. Peru 100 - Hydra Minerals Ltd Australia 100 100 Dingo Minerals Pty Ltd Australia 100 100
Note 21: Parent Information 2016
$ 2015
$ Financial position Assets Current assets 62,743 200,925 Non-current assets 526,912 8,978,497
Total assets 589,655 9,179,422
Liabilities Current liabilities (112,143) (132,138)
Non-current liabilities - -
Total liabilities (112,143) (132,138)
Net Assets 477,512 9,047,284
Equity Issued capital 29,599,029 25,092,164 Accumulated Losses (29,121,517) (16,044,880)
Total equity 477,512 9,047,284
Financial performance (Loss) for the year (13,076,637) (4,554,851) Other comprehensive income - -
Total comprehensive income (13,076,637) (4,554,851)
There are no guarantees entered into by the parent entity in relation to the debts of its subsidiaries. There are no contingent liabilities of the parent entity as at the reporting date. There are no contractual commitments by the parent entity for the acquisition of property, plant and equipment as at the reporting date. Note 22: Company Details
The principal place of business of the Company is: Inca Minerals Limited Suite 1, 16 Nicholson Road Subiaco, WA, 6008 Australia
For
per
sona
l use
onl
y
37
Inca Minerals Limited For the year ended 30 June 2016
DIRECTORS’ DECLARATION
The Directors of the Company declare that:
1. the financial statements and notes, as set out on pages 10 to 36, are in accordance with the Corporations Act 2001 and:
a. comply with Accounting Standards, which, as stated in accounting policy Note 1 to the financial statements, constitutes explicit and unreserved compliance with International Financial Reporting Standards (IFRS);
b. give a true and fair view of the financial position as at 30 June 2016 and of the performance for the year ended on that date of the consolidated entity;
2. the Directors have been given the declarations required by s295A of the Corporations Act 2001 that:
a. the financial records of the Company for the financial year have been properly maintained in accordance with S286 of the Corporations Act 2001;
b. the financial statements and notes for the financial year comply with Accounting Standards;
c. the financial statements and notes for the financial year give a true and fair view;
3. in the Directors’ opinion there are reasonable grounds to believe that the Company will be able to pay its debts as and when they become due and payable.
This declaration is made in accordance with a resolution of the Board of Directors.
On behalf of the Directors:
Justin Walawski Director Dated at Perth this 29th day of September 2016
For
per
sona
l use
onl
y
For
per
sona
l use
onl
y
For
per
sona
l use
onl
y
For
per
sona
l use
onl
y