Embed Size (px)
Citation preview
Annual Report 2012
For
per
sona
l use
onl
y

Contents
ABN 82 062 091 909
Annual Report 2012
Chairman’s review 1
Review of projects 2
Corporate governance statement 12
Directors report 16
Consolidated fi nancial statements 22
Shareholder information 47
List of mining tenements Inside back cover
Corporate directory Inside back cover
For
per
sona
l use
onl
y

Chairman’s review
Atlantic Gold Annual Report 2012 1
2012 has been a year of solid progress for Atlantic Gold in bringing the Touquoy Gold Project in Nova Scotia, Canada towards production. A vesting order was made by the Minister of Natural Resources for acquisition of the remaining 14 (of 63) surface properties overlying the Touquoy mine site and titles to all of these properties are now held by Atlantic Gold.
Physical possession of the properties – the second step in the acquisition process provided for under the terms of the Expropriation Act – has now been achieved in relation to all but one of the 14 properties. Atlantic Gold is confi dent that possession of the single remaining property will be obtained following an appeal against the Minister’s decision which is to be heard in April 2013.
Concurrently the application for Industrial Approval – the fi nal permit required – has been submitted to Nova Scotia Environment and can be granted once Atlantic Gold is in possession of all surface titles.
Financing discussions are continuing in earnest with detailed proposals being developed with several interested fi nanciers.
During the year the acquisition of 100% of the Cochrane Hill Gold property was completed, enhancing the outcome for shareholders from the conceptual combined Touquoy–Cochrane Hill production plan. In addition the company has continued its methodical assessment of exploration targets in Nova Scotia with similar geological attributes to the Touquoy Gold Deposit.
We welcome new director Rod Hanson to the company. Our personal knowledge of Rod’s technical and managerial expertise and his superior work ethic ensure that his Board membership is a valuable resource for Atlantic Gold.
Once again, we thank our shareholders – including our major shareholder Au Mining Limited and several new large shareholders – for their support in our capital raising initiatives, sharing our aim to bring our projects towards production.
On behalf of the company it is with a refreshed sense of conviction that I convey our gratitude to Wally Bucknell for his expertise and tenacity in realising our objectives in Nova Scotia and to all the employees, consultants and contractors who support us.
We look forward with undiminished enthusiasm not only to commencing development of the Touquoy Gold Mine, but also to beginning signifi cant development of the substantial gold potential that rests in Nova Scotia. Th e company’s persistence will lead to providing employment for the keen local workforce, supporting local businesses and suppliers, and not least to providing a return to our loyal and patient shareholders.
Ronald J HawkesChairman28 March 2013
For
per
sona
l use
onl
y

Review of projects
HALIFAX
Scotia Mine
Lunenberg
Bridgewater
Yarmouth
West Caledonia
Caduesky
West Gore
15 MileBrook
TOUQUOYGOLD DEPOSITS656,000 oz
COCHRANE HILLGOLD DEPOSIT
0
N
30km
Historic gold workings
Atlantic Gold farm-ins
Atlantic Gold 100%
Granite
Goldenville group
Halifax groupMeguma Terrane{
Figure 1: The Touquoy and Cochrane Hill Gold Deposits are located in the northeastern Meguma Terrane of the province of Nova Scotia in the southeast of Canada. Exploration in Nova Scotia is targeted at areas of the Meguma Terrane with characteristics similar to existing deposits at Touquoy and Cochrane Hill
2 Atlantic Gold Annual Report 2012
For
per
sona
l use
onl
y
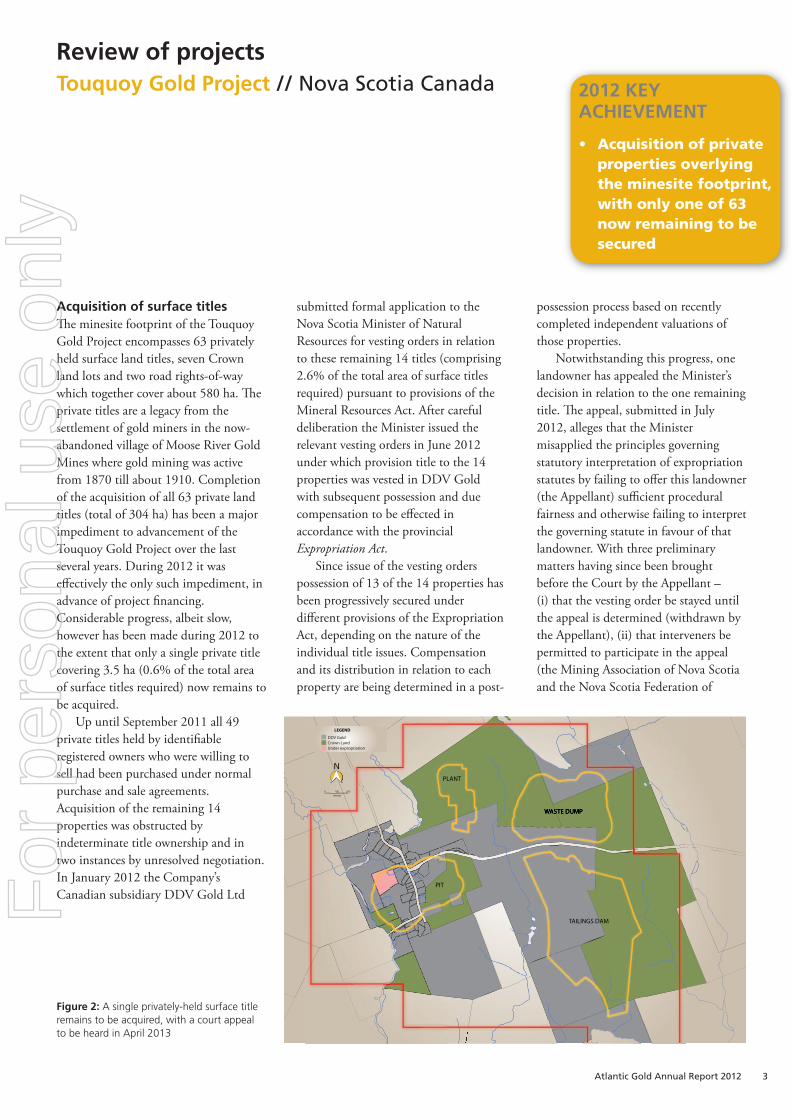
Figure 2: A single privately-held surface title remains to be acquired, with a court appeal to be heard in April 2013
Acquisition of surface titlesTh e minesite footprint of the Touquoy Gold Project encompasses 63 privately held surface land titles, seven Crown land lots and two road rights-of-way which together cover about 580 ha. Th e private titles are a legacy from the settlement of gold miners in the now-abandoned village of Moose River Gold Mines where gold mining was active from 1870 till about 1910. Completion of the acquisition of all 63 private land titles (total of 304 ha) has been a major impediment to advancement of the Touquoy Gold Project over the last several years. During 2012 it was eff ectively the only such impediment, in advance of project fi nancing. Considerable progress, albeit slow, however has been made during 2012 to the extent that only a single private title covering 3.5 ha (0.6% of the total area of surface titles required) now remains to be acquired.
Up until September 2011 all 49 private titles held by identifi able registered owners who were willing to sell had been purchased under normal purchase and sale agreements.Acquisition of the remaining 14 properties was obstructed by indeterminate title ownership and in two instances by unresolved negotiation. In January 2012 the Company’s Canadian subsidiary DDV Gold Ltd
submitted formal application to the Nova Scotia Minister of Natural Resources for vesting orders in relation to these remaining 14 titles (comprising 2.6% of the total area of surface titles required) pursuant to provisions of the Mineral Resources Act. After careful deliberation the Minister issued the relevant vesting orders in June 2012 under which provision title to the 14 properties was vested in DDV Gold with subsequent possession and due compensation to be eff ected in accordance with the provincial Expropriation Act.
Since issue of the vesting orders possession of 13 of the 14 properties has been progressively secured under diff erent provisions of the Expropriation Act, depending on the nature of the individual title issues. Compensation and its distribution in relation to each property are being determined in a post-
possession process based on recently completed independent valuations of those properties.
Notwithstanding this progress, one landowner has appealed the Minister’s decision in relation to the one remaining title. Th e appeal, submitted in July 2012, alleges that the Minister misapplied the principles governing statutory interpretation of expropriation statutes by failing to off er this landowner (the Appellant) suffi cient procedural fairness and otherwise failing to interpret the governing statute in favour of that landowner. With three preliminary matters having since been brought before the Court by the Appellant – (i) that the vesting order be stayed until the appeal is determined (withdrawn by the Appellant), (ii) that interveners be permitted to participate in the appeal (the Mining Association of Nova Scotia and the Nova Scotia Federation of
DDV GoldCrown LandUnder expropriation
LEGEND
N
200100metres
0
WASTE DUMP
TAILINGS DAM
PIT
PLANT
2012 KEY ACHIEVEMENT
Acquisition of private properties overlying the minesite footprint, with only one of 63 now remaining to be secured
•
Review of projectsTouquoy Gold Project // Nova Scotia Canada
Atlantic Gold Annual Report 2012 3
For
per
sona
l use
onl
y

Agriculture so permitted), and (iii) that the appeal be heard as a trial de novo (dismissed by the Court) – the appeal is now set down to be heard on 24–26 and 29 April 2013.
Th e Company fi rmly believes the Minister’s decision was made in accordance with the process set out under Nova Scotia’s Mineral Resources Act after fair, transparent and unhurried consideration of all relevant information received from, and meetings with, the aff ected landowners and Atlantic Gold. Th e Company remains confi dent that this appeal will be dismissed.
It has taken considerable eff ort, diligence, expense, and notably time to reach this critical point in the private surface properties acquisition program. Its conclusion, if successfully achieved as expected, will be a major milestone in the development timeline of the Touquoy Gold Project as the Company prepares to move the Project towards production.
Th e seven Crown land lots, which together comprise 280 ha, are under off er for lease by the Department of Natural Resources (Land Services Branch), subject to appropriate conditions precedent including DDV Gold’s acquisition of all required private properties and receipt of approvals from Nova Scotia Environment (Environmental Assessment Approval (granted) and Industrial Approval). Acquisition of the two public road rights-of-way is subject to DDV Gold’s replacement by alternative routing to the satisfaction of the Nova Scotia Department of Transportation and Infrastructure Renewal.
Final environmental permittingEnvironmental Assessment Approval, the primary and critical environmental permit, has previously been granted for the Touquoy Gold Project and remains in eff ect. In compliance with the terms of this Approval, and in consultation with Nova Scotia Environment and the Department of Natural Resources, a plan to procure appropriate lands near the Project site for the purposes of conservation is being further developed.
Mining Lease ML-11-1, covering 793 ha, was granted by the Department of Natural Resources for a 20 year term in August 2011.
Application for Industrial Approval, the requisite adjunct to Environmental Assessment Approval for the development, operation and reclamation of the Touquoy Gold Project, was submitted to the Minister of Environment pursuant to Part V of the Environment Act of Nova Scotia in November 2012. Th e application is under review and the Company is in ongoing discussion with representatives of Nova Scotia Environment. It is not expected that Industrial Approval will be
granted before acquisition of the last private property is complete. Grant of Industrial Approval will complete the essential licence to develop the Project.
Th e Company looks forward to ongoing cooperation with the Department of Natural Resources and Nova Scotia Environment as it continues to work closely with industry associations from all natural resource sectors, other government departments, First Nations, environmental groups and the local community as it sets the stage for the development of a major and modern gold mining operation long awaited by many in Nova Scotia.
Defi nitive Feasibility StudyTh e Defi nitive Feasibility Study (“DFS”) for the Touquoy Gold Project was originally completed in July 2010 and updated in early 2012 to refl ect costs and revenues where changed from the original DFS. Th e DFS re-affi rms the strong viability of the Touquoy Gold Project as a signifi cant development opportunity. All inputs relating to ore reserves, pit design, mining plan, processing and site infrastructure are unchanged from the original 2010 DFS.
Table 1: Summary results of the Defi nitive Feasibility Study
Ore reserves 9.59 Mt @ 1.49 g/t for 454,000 contained ouncesTotal production 1 422,000 ouncesAnnual production rate (unchanged) 84,000 ouncesPlant All new 2.0 Mtpa conventional gravity/CIL plantMine life 5.0 yearsPre-production capital cost 2 $140 million (nominal). Includes $10 million of working capital and $10 million reclamation bond.Gold price $1600/ozCash operating cost $597/oz. Includes royalty payments of US$37/ozNet cash surplus (pre-tax) $296 millionPayback period 21 months after fi rst gold pourNPV (8%, pre-tax) $178 millionInternal rate of return 47.3%
Note 1: Production excludes 26,000 ounces of in-pit Inferred Resources, and any input from the Touquoy West satellite deposits (previously reported Indicated and Inferred Resources of 2.0 Mt @ 1.5 g/t for 99,000 ounces). DFS remains based on original pit design optimised using a gold price of US$950/oz.Note 2: The DFS is prepared in Canadian dollars. Exchange rates at parity (A$1=C$1=US$1) are used in the Study.
Review of projectsTouquoy Gold Project // Nova Scotia Canada
4 Atlantic Gold Annual Report 2012
For
per
sona
l use
onl
y

HistoryAbout 26,000 ounces of gold were reported to have been recovered from Moose River Gold Mines, site of the Touquoy Project, during the gold rush from 1877 to 1910. Apart from a failed attempt to re-open the mine in 1935-36, the site remained dormant from an exploration, development and production perspective for the next 75 years.Several exploration campaigns, including diamond and percussion drilling and a 57,000 tonne bulk sample, were conducted between 1986 and 2003.
OwnershipAtlantic Gold, through its wholly-owned local subsidiary DDV Gold Limited, entered into an option agreement in May 2003 with the property owners, Moose River Resources Inc (MRRI), a local private company. As the operator and manager of the Touquoy Gold Project DDV Gold sole funds all capital and exploration expenditure. Once gold production at Touquoy has commenced DDV Gold will receive 100% of the Touquoy cashfl ow until all these expenditures plus interest have been recouped. Thereafter DDV Gold will share the pre-tax profi t on a 60:40 basis with the vendor of the Touquoy tenements. A third party holds 3% royalty of which two-thirds can be purchased for $2.5 million. The fi nancial considerations above are net of royalty. Upon DDV Gold’s securing fi nancing for project development its nominal interest in the Exploration Block – defi ned by 77 mineral claims outside the 12-claim Development Block which covers the known resources – increases from 60% to 75%.
GeologyThe Touquoy gold deposit is a shale-hosted, disseminated gold deposit. It is located in the Meguma Group, a belt of sedimentary rocks (Cambro-Ordovician turbidites) extending about 400 km long by 80 km wide through central and southwestern Nova Scotia. Since the fi rst gold discovery in 1861 about sixty underground gold deposits within the Meguma Group have been mined, for a recorded aggregate production of about 1.2 million ounces. The bulk of this production was prior to World War 1. The common geological setting of these many gold deposits is along the crests of anticlinal axes which were mapped over a century ago as extending throughout the length of the Meguma Group.
The Touquoy deposit is similarly located on the crest of an anticlinal axis but is fundamentally different from the many small underground quartz-vein hosted deposits mined historically because the gold mineralisation is disseminated throughout the host sediments. The very wide intersections of relatively even grade gold mineralisation, some in excess of 100 m, and the compact and shallow disposition of the deposit present the Touquoy deposit as a substantial, open-pit, bulk mining proposition with a very favourably low waste:ore ratio.
Th e DFS update was undertaken in association with Merit Engineers Pty Ltd, Ausenco Limited, Australian Mine Design and Development Pty Ltd and Gemell Mining Engineers, all of these parties having been similarly involved with generation of the original DFS.Th e summary in Table 1 refl ects that presented in the Company’s previous Annual Report, though using the current gold price of US$1,600/oz for the revenue returns. Th e capital and operating cost inputs will be next updated once (and assuming) the last private property is eventually acquired, at which time tenders for the mine development and construction of the processing plant and associated infrastructure will be off ered to appropriate parties. Th e project development descriptions following also refl ect those presented in the Company’s previous Annual Report.
As 100% of the Touquoy cashfl ows will be available to service project debt the summary DFS results are reported below on 100% basis (refer to box for ownership details).
Details of the Defi nitive Feasibility Study1. Mining Th e pit is to be developed in two stages with a cutback to the fi nal pit limits in Year 3. Th e fi nal pit will be 760 m long x 400 m wide with a maximum depth of 140 m. Waste-to-ore ratio over life-of-mine is 2.6:1 Mining is planned to be carried out using a leased, owner-operated fl eet of eight 91-tonne payload trucks and two 110-tonne excavators at a projected daily rate of approximately 15,000 tonnes of ore and waste.
2. ProcessingDesign, operation and estimation of capital and operating costs of the Touquoy processing plant have been developed by Ausenco Limited, and
based on comprehensive comminution and metallurgical investigations previously undertaken by Orway Mineral Consultants (WA) Pty Ltd, SGS Lakefi eld Research Limited, Peter Lewis & Associates and Ammtec Limited.
Th e processing plant is designed to treat free milling gold ore at a rate of 2.0 million tonnes per annum using conventional technology. Free gold is recovered using gravity concentration and intensive cyanidation, with the remaining gold recovered by cyanidation in a hybrid carbon-in-leach (CIL) process. Leach residues are detoxifi ed before delivery to the tailings management facility. Th e process plant design is based on a fl ow sheet with unit operations that are well proven in the gold industry.
Th e main areas include:• three-stage crushing of run-of-mine
ore• single-stage ball milling of crushed
ore to a P80 of 150 micron • centrifugal gravity concentration of
gold followed by high intensity cyanidation of the gravity concentrate
• thickening of CIL feed• hybrid leach–CIL using one leach
tank and six adsorption tanks• desorption of precious metals from
carbon using a pressure Zadra elution circuit
• destruction of cyanide in CIL tailings
• pumping of tailings to the tailings management facility for storage.
• Excess site water is treated, for arsenic removal, at a dedicated effl uent treatment plant.
3. InfrastructureTh e mine site is readily accessible by road being located at the former village of Moose River Gold Mines 70 minutes drive along sealed roads from Halifax, the provincial capital. No on-site accommodation will be necessary. During operation the workforce will commute to site from nearby
Atlantic Gold Annual Report 2012 5
For
per
sona
l use
onl
y

communities. Th e site is now serviced by landline telephone, broadband wireless internet and 7.2 kV single phase power.
Maximum power demand is 6 MW, with annual power consumption of 42,000MWh. Connection of 25 kV grid power to site will require construction of 6km of new line and upgrade of 5 km of existing line to site from single phase to three phase power.
A positive water balance prevails at the site. Suffi cient process water is therefore available by recycling from the Tailings Management Facility. Th e minimal fresh and potable water requirement will be sourced locally.
Site facilities will include an administration offi ce, a mobile equipment workshop–warehouse building, reagent storage area, laydown yard, laboratory and miscellaneous process plant buildings.
4. Capital cost estimateTh e capital cost estimate for the project is $140 million:
Table 2: Capital cost estimateITEM $ millionMine 5Process plant 59Tailings management facility 10Site infrastructure 22Other 6EPCM (Engineering, Procurement,Construction Management) 18Sub-total 120Working capital 10Reclamation Bond 10Total 140
The capital cost estimate is based on all new equipment. All Canadian dollars, with currency exchange rate at parity (C$1.00 = US$1.00).All estimates have a base date of Q4 2011.Local labour, services and materials are to be used to the maximum extent feasible.
•
•
••
5. Operating costsTh e total life-of-mine cash operating cost estimate for the Project is $252 million, with unit cash costs of $597/oz.
Table 3: Operating cost estimate TOTAL
LIFE-OF-MINE UNIT COSTS
$ million $/tonne $/oz
Mining 124 12.98 294Processing 88 9.19 209Site administration 22 2.28 52Sub-total 234 24.45 555Off-site costs 2 0.22 5Royalties 16 1.63 37Total 252 26.30 597
6. Implementation ScheduleTh e strategy for project implementation contemplates development under an Engineering, Procurement and Construction Management (“EPCM”) contract. Th e project implementation schedule indicates a duration of 83 weeks from contract award to practical completion. Critical path for the project is delivery of the grinding mill which is presently approximately 50 weeks from placement of order.
Project fi nancingFinancing structures to fund construction of the Touquoy Gold Project continue to be refi ned and evaluated in fi ner detail as the moment of project “de-risking” appears to approach. Indicative responses from a range of major banks confi rm the Company’s view that conventional debt is available to form the major component of the project funding requirement. Th e optimal project funding package will be one which is least dilutive to our existing shareholders.
0 180 360
Metres
N
Existing pit
Proposed pit
Road
Haulroad
Site boundary
Park and museumrelocated
Carpark
Admin
Truck shop
MillROM pad
Crusher
WASTE ROCK PILE
PIT
Ore haulroad
POLISHING POND
Waste haulroad
Square Lake
Scraggy Lake
Fish River
Moose River
TAILINGS POND
Figure 3: The active site, covering a compact area of 265 ha, is located in an area harvested by the forestry industry and directly accessible by sealed public road.
Review of projectsTouquoy Gold Project // Nova Scotia Canada
6 Atlantic Gold Annual Report 2012
For
per
sona
l use
onl
y

OVER 900,000 oz IN-PIT POTENTIALFOR COMBINED NOVA SCOTIA GOLD PROJECTS – TOUQUOY AND COCHRANE HILL
// Nova Scotia Canada
Table 4: Projected conceptual outcomes – 100% BasisTouquoy and Cochrane Hill Gold Projects combined
Th roughput 19.0 Mt @ 1.5 g/t for 970,000 contained ouncesProduction 900,000 ouncesAverage annual production 93,000 ouncesPlant 2 Mtpa Re-located to Cochrane Hill post-TouquoyInitial mine life 9.7 yearsPre-production capital cost $140 millionTotal life-of-mine capital cost $254 millionGold price $1600/ozCash operating cost $646/oz. Includes royalty payments of $37/oz.Net cash surplus (pre-tax) $633 millionPayback period 21 months after fi rst gold pourProject NPV (8%, pre-tax) $320 millionInternal rate of return 48%
Table 5: Nova Scotia Ore Reserves and Mineral Resource inventory
TONNES GRADE CONTAINED GOLD million g/t ounces
ORE RESERVES *
TouquoyProved 2.49 1.48 118,000Probable 7.10 1.47 336,000Total Reserves 9.59 1.48 454,000
MINERAL RESOURCES
TouquoyMeasured resource 2.8 1.5 130,000Indicated resource 7.3 1.5 350,000Inferred resource 1.6 1.5 77,000Total Touquoy 1 11.7 1.5 557,000
Touquoy WestIndicated resource 0.9 1.9 54,000Inferred resource 0.6 2.2 45,000Total Touquoy West 2 1.5 2.0 99,000Total Touquoy Project 13.2 1.5 656,000
Cochrane HillIndicated resource 4.5 1.8 251,000Inferred resource 5.6 1.6 298,000Total Cochrane Hill Project 3 10.1 1.7 549,000TOTAL NOVA SCOTIA 23.3 1.6 1,205,000
* Ore Reserves are included in Mineral Resources, and are not additive. Touquoy Ore Reserves contain no Mineral Resources from Touquoy West. There are an estimated 26,000 additional ounces of gold identifi ed as Inferred Resources within the fi nal pit and which do not form part of the Ore Reserves.Notes 1–3: See page 11.
Review of projects
Th e Touquoy Gold Project represents the fi rst stage of a 10-year production plan of 900,000 ounces for the combined Touquoy and Cochrane Hill Gold Projects. Th is combined production plan involves the re-location of the Touquoy processing plant 80 km to the east to Cochrane Hill upon completion of the Touquoy operation. Cochrane Hill is the Company’s second gold development project in the Nova Scotia goldfi elds.
In addition to the Touquoy DFS this combined production plan considers: (i) production from the Touquoy
Inferred Resources of 26,000 contained ounces located within the designed pit but excluded from the established Ore Reserves and
(ii) recovery of 450,000 ounces gold from Cochrane Hill following completion of the Touquoy operation. It excludes any input from the
satellite resource at Touquoy West (previously reported 2.0 Mt @ 1.5 g/t for 99,000 ounces).
Given the approximation of economic inputs to the development of Cochrane Hill this Extended Case is a study at a conceptual level, and on 100% basis:
Atlantic Gold Annual Report 2012 7
For
per
sona
l use
onl
y

Review of projectsCochrane Hill Gold Project // Nova Scotia Canada
Cochrane Hill is an advanced gold exploration property located 80 km east of Atlantic Gold’s Touquoy Gold Project and where Atlantic Gold has established the following Mineral Resources (as reported to ASX on 18 September 2009, and on 8 March 2011 as Canadian NI43-101 compliant resources):
Table 6: Cochrane Hill Mineral Resources
TONNES GRADE CONTAINED GOLD million g/t ounces
Indicated resource 4.5 1.8 251,000Inferred resource 5.6 1.6 298,000Total Cochrane Hill Project 3 10.1 1.7 549,000
Th is Mineral Resource estimate incorporates results from 39 diamond holes (3,102 m) drilled by Atlantic Gold in 2008 and 2009; 79 holes (11,098 m) drilled during the 1970s and 1980s by previous explorers; and infi ll sampling undertaken by Atlantic Gold on this historic core recovered from storage.
Th e gold mineralisation is developed within a 30 m steeply dipping wide zone of sulphidic and quartz-veined sediments over a length of about 700 m. Coarse (visible) gold is common and the gold is expected to be free-milling on indications from historic testwork and similarities to other gold deposits in this district. Th e mineralised zone plunges gently to the west and it remains open down-plunge in this direction.
Based on this resource inventory and the assumption – to be confi rmed by infi ll drilling yet to be undertaken – that all Inferred Resources can be converted to Measured and Indicated Resources, a conceptual open-pit has been optimised using similar costs and operating plan – 2 Mtpa gravity/CIL – to those presently applicable to the Touquoy Gold Project. For a gold price of US$1050/oz production of 8.9 million tonnes grading 1.7 g/t to recover 450,000 ounces gold (as reported to ASX on 18 September 2009) is indicatively projected:
Following favourable resolution of a third party dispute in relation to the Company’s exercise of its pre-emptive right to purchase 100% interest in the Cochrane Hill gold property, Atlantic Gold completed the purchase mid-year. Th e full purchase price paid to the former owner, Scorpio Gold (Canada) Corporation, was C$1.6 million.
Th e opportunity to acquire 100% interest in the Cochrane Hill Gold Project for what amounts to less than C$3.00 per resource ounce is a very positive step forward in Atlantic Gold’s plan for a minimum one million ounces of gold production from its Nova Scotia properties.
Table 7: Conceptual Cochrane Hill output
GOLD PRICE TONNES GRADE GOLD RECOVERED STRIP RATIO
millions (g/t) ounces
US$875/oz 8.9 1.7 450,000 1:5.8
HistoryGold was fi rst discovered at Cochrane Hill in 1868 with 1354 ounces of gold recovered between 1877 and 1929. Modern exploration commenced in 1974 with 152 diamond core holes and bulk samples.
GeologyAs with the Touquoy Gold Deposit, the Cochrane Hill gold deposit is also developed close to a regional anticlinal axis and in broadly similar fi ne grained sedimentary rocks of the Meguma Group. The 30 m wide mineralised sequence of sulphidic and quartz veined slates which hosts the Cochrane Hill resource is developed within the steeply dipping southern limb of the overturned Cochrane Hill anticline.This mineralised sequence, largely obscured by overburden, has been traced intermittently for 5 km across the property and is identifi ed by several areas of anomalous gold geochemistry. Gold mineralisation that appears to be confi ned to plunging shoots in a similar stratigraphic and structural position to Cochrane Hill has been identifi ed by shallow reconnaissance interface drilling and follow-up diamond drilling by Atlantic Gold between 600 m and 1100 m west of the resource. Further intensive property-wide exploration is yet to be undertaken on this property.
8 Atlantic Gold Annual Report 2012
For
per
sona
l use
onl
y

Review of projectsExploration // Nova Scotia Canada
Th e Nova Scotia goldfi elds, in the so-called Meguma Terrane, are highly prospective for major open-pittable gold reserves similar in style to those at Touquoy and Cochrane Hill. At Touquoy in particular, most of the gold is disseminated throughout dark grey shales devoid of quartz veining. However this unusual style of gold mineralisation in Nova Scotia, now demonstrably commercially viable via open pit mining and conventional gravity/CIL processing, is not widely appreciated. Th erefore, apart from Atlantic Gold’s active, and admittedly insuffi cient, investigations within the Meguma Terrane, regional exploration directed to the discovery of gold reserves of this type has never previously been undertaken.
Furthermore 90% of the Meguma Terrane is estimated to be covered by a veneer of glacial till – on average 5-10 m of unconsolidated sand, clay and boulders transported and dumped during the last ice age. All of the gold deposits known in the Meguma Terrane were found by the “old timers” – and the last gold discovery was reportedly made in the 1890s – only where streams had cut through this overburden and exposed outcropping quartz veins bearing gold. Our careful orientation investigations at Touquoy confi rm that this overburden is geochemically opaque; that is, the geochemical characteristics of soil and plants at surface provide no representation of the bedrock or of the orebody beneath.
Th us in order to effi ciently explore this terrain it is necessary to drill through the overburden and retrieve several metres of bedrock for visual and geochemical analysis. We refer to this as “interface drilling”. In collaboration with a local driller we have developed a reverse circulation drilling rig mounted on a logging transporter, capable of drilling to about 30 m depth and adapted specifi cally for Nova Scotia conditions.
Th e resultant regional exploration land package is a dynamic holding since claims will be dropped and new claims pegged or acquired as results demand. Th e current land position is approximately 400 km2.
Application of this “greenfi elds” work over the last several years has identifi ed a number of (previously described) early stage prospects earmarked for follow-up as exploration funding permits – West Caledonia, Caduesky Lake, East Rawdon, Fifteen Mile Brook and Moses Lake (refer to regional map). Th e Company’s small exploration team based in Moose River undertakes low-cost fi eldwork on these and other gold prospects within the Meguma Terrane, maintains contact with local prospectors and evaluates new opportunities identifi ed through ongoing research.
Directors Wally Bucknell, Ron Hawkes and Rod Hanson inspect core with geologist Caitlin Cameron and visit the Touquoy mini-pit
Atlantic Gold Annual Report 2012 9
For
per
sona
l use
onl
y

In September 2012 Atlantic Gold entered into an option agreement with a private company to earn an interest in the Kemptville gold property located in southwest Nova Scotia (refer to regional map). Atlantic Gold may earn 100% interest in the claims, subject to a 20% carried interest to production in favour of the optionor with aggregate cash payments of $170,000 and expenditure of $1.3 million over 4 years (extendable under defi ned conditions).
Over 3,000 ounces of gold were recovered at Kemptville during 1881–1918 from workings spaced over 600 m. Typically, masking glacial overburden is extensive. Since 1975, 32 diamond core holes have been drilled on the property by previous explorers, with intersections of up to 11.1 m @ 1.9 g/t gold (KV-03-01), 15.1 m @ 0.8 g/t gold (KV-03-02) and 6.3 m @ 5.8 g/t gold (KV-03-03) reported. Of particular signifi cance are two clusters of mineralised boulders from which samples have assayed up to 308 g/t gold (refer to accompanying property plan). Th e previous diamond drilling however does not appear to have intersected the distinctive geochemistry and alteration represented in these mineralised boulders. Th eir source to date remains undiscovered.
A fi rst-pass drilling program of 52 shallow (average 12 m) vertical narrow-diameter reverse circulation (RC) holes on four traverses has now been undertaken over the 1 km-long “main zone” to better defi ne the extent and focus of the known gold mineralisation and to attempt to trace the source of the mineralised boulders.
KEMPTVILLE SH
EAR
272
5m
E
500
mE
272
5m
E
4,881,500 mN
4,882,000 mN
4,881,750 mN
4,881,250 mN
272
00m
E
271
50
mE
271
70
E
20
272
0,0 5
m
, 70
,, ,
KV-03-01KV-03-02
KV-03-03
((
(
(
(
(
(((
(
(
((
(((
(
(((
(( (
((
(
((
(
(
((
(
(
((
(
(
(
((
((
(
((
((
(
(
(
(
(
(
(
N
Historic diamond drill hole
Historic workings
Boulder samples >1 g/t gold
Assay > 0.5 g/t Au
Assay 0.1 - 0.5 g/t Au
All assays < 0.1 g/t Au
Vertical RC hole (DDV Gold drilling)
BED
DIN
G /
FOLI
ATIO
N
MIN
ERA
LISE
DZO
NE
OVERBURDEN
KV-03-
02
(dril
led 20
03)
MRG37
68
MRG37
67
MRG37
66
MRG37
65
MRG37
64
MRG37
63
MRG37
62
MRG37
61
15m15m17m13m
9m6m
16m
114m
6m
1.6m1.2
6.1m1.3
8.0m2.7
-50mRL
0mRL
50mRL
LEGEND
0.1 - 0.5 g/t (RC holes only)
Sampled intervals (DDH hole only)
6.1m1.3
Width (m)Gold (g/t)
0 50m
SENW
BEDDIN
G /
FOLIA
TION
OVERBURDEN
-50mRL
0mRL
50mRL
MRG37
79
MRG37
78
MRG37
77
MRG37
76
MRG37
75
MRG37
74 MRG37
73
MRG37
72
MRG37
71
MRG37
70
MRG37
69
KV-03-
04
(dril
led 20
03)
18m
26m
15m12m9m
9m6m
8m5m
6m9m
93m
2.0m0.7
5.0m1.9
4.0m1.2
2.0m0.6
Single 70cm sampletaken from this
diamond core hole
LEGEND
0.1 - 0.5 g/t (RC holes only)
6.1m1.2 Width (m)
Gold (g/t)
> 0.5 g/t (RC holes only)
0 50m
SENW
Figure 4: Widespread gold geochemical anomalism, as indicated on the plan above and sections below, is being followed up at the Kemptville gold property located in southwest Nova Scotia
Review of projectsExplorationNova Scotia Canada
10 Atlantic Gold Annual Report 2012
For
per
sona
l use
onl
y

Notes to Table 2: Nova Scotia mineral resource inventoryNote 1:Estimation technique: Multiple Indicator Kriging with block variance adjustment applied. Ore selectivity is assumed to be 5 metres (north) by 5 metres (east) by 2.5 metres (elevation) via an open pit mining scenario.Drillholes: 298 NQ diamond core holes for 27,200 m of which Atlantic Gold has drilled 129 holes for 10,480 m.Variable spacing, averages 30 m x 20 m.Assay methodology (all based on ½ NQ core):ATV: Fire assay of pulverised whole-sample (32% of database), with all samples ≥ 0.5 g/t or within ore-grade intervals screen fi re assayed (1825 samples or 6% of database).Historic: Whole-sample fi re assay of +100# gravity concentrate weight–averaged with fi re assay of -100# fraction (28% of database) adjusted in accordance with Atlantic Gold’s trial grade control study, fi re assay of pulverised split from crushed parent (28% of database) and screen fi re assay (6% of database).Bulk density: 2.80 g/cm3. Based on 183 determinations.Lower cut-off grade: 0.5 g/t, to maximum depth of 150 m.Note 2:Estimation technique: Multiple Indicator Kriging with block variance adjustment applied. Ore selectivity is assumed to be 5 metres (north) by 2 metres (east) by 2.5 metres (elevation) via an open pit mining scenario.Assay methodology (all based on ½ NQ core):Fire assays on pulverised split from crushed parent from 116 diamond drill holes.Bulk density: 2.80 g/cm3.Lower cut-off grade: 1.0 g/t.Drillhole spacing: Variable, averages 30 m x 25 m.Note 3:• Estimation technique: Multiple Indicator Kriging with block variance adjustment applied. Data fl agged to mineralised
wireframe. Ore selectivity is assumed to be 4 metres (north) by 8 metres (east) by 2.5 metres (elevation) via an open pit mining scenario.
• Lower cut-off grade 0.5g/t• All Atlantic Gold holes are NQ diameter with half sawn core sampled at 1m intervals and fi re assayed following total
sample pulverisation.• Atlantic Gold’s quality control procedures include routing submission of drill core blanks and accredited standards,
together with selected submission of blank standards immediately following samples containing visible gold. • Bulk density: 2.76g/cm3 (67 mineralised samples).• Resource estimate based on 6,665 sample assays from 39 holes (3,102 m) drilled by Atlantic Gold and 79 holes
(11,098 m) drilled in the 1970s and 1980s. Samples from historic holes fi re assayed, with screened fi re assay on samples bearing visible gold. Results for the 56 underground drillholes (table below) are considered unreliable and have not been used. Seventeen historic surface holes are located beyond the resource limits.
• All samples (six) over 100 g/t cut to 100 g/t.• Hole spacing: Averages 20 m x 20 m in the central portion of the deposit to a depth of 100 m from surface. Outside
this area the drilling sections average 30 metre centres and holes on section are irregularly spaced. • Details of previous diamond drilling campaigns:
Company Year Location No. holes Metres Core size/sampleMassval Mines 1974 Surface 44 4840 A,BQ/splitNorthumberland 1981 Surface 21 3932 A,BQ/splitScominex 1984-87 Surface 31 5107 NQ/sawnScominex 1984-87 Underground* 28 830 NQ/sawnNovagold 1988 Underground* 28 2044 NQ/sawn
152 16753 *Assays from underground drilling have not been used in present resource estimate.
• Bulk sampling: Approximately 14,900 tonnes from 25,000 tonnes development material excavated from surface and underground during 1982-88 were treated by various means:
Company Year Sample type Tonnage Treated Grade (g/t)Northumberland 1982-83 Pit 13,500 13,041 1.6Scominex 1987 Underground 4,443 2.8 1.9Novagold 1988 Underground 7,400 1860 2.1
• Details as to grade control methodology, metallurgical recovery and sample representivity applying at the time are not clear and resultant grades are therefore considered unreliable. These, and the historic tonnage mined (approx 32,000 tonnes in total), have not been deducted from the resource estimate.
The geological information in this report relating to exploration and Mineral Resources has beencomplied by WR Bucknell who is a director of Atlantic Gold NL and a Member of the AustralasianInstitute of Mining and Metallurgy (AusIMM). He has suffi cient experience which is relevant to the styleof mineralisation and type of deposit under consideration to qualify as a Competent Person in respect of the 2004 Australasian Code for Reporting of Exploration Results, Mineral Resources and Ore Reserves (the JORC Code).The resource estimates for Touquoy and Cochrane Hill described in this report were completed by Mr Neil Schofi eld, a principal of Hellman and Schofi eld Pty Ltd. Mr Schofi eld is a Member of AusIMMand qualifi es as a Competent Person in respect of the 2004 JORC Code by virtue of having suffi cientexperience which is relevant to the Touquoy style of mineralisation and deposit type. Mr Schofi eld hasconsented to the inclusion of this information in the form and context in which it appears in this report.The resource estimate for Touquoy West described in this report was completed by Mr Nic Johnson, an employee of Hellman and Schofi eld Pty Ltd. Mr Johnson is a Member of AIG and qualifi es as aCompetent Person in respect of the 2004 JORC Code by virtue of having suffi cient experience which is relevant to the Touquoy West style of mineralisation and deposit type. Mr Johnson has consented to theinclusion of this information in the form and context in which it appears in this report.
Th e best result from this program was 2.7 g/t gold over 8 m1 from 8 m depth (~5 m true width, to end-of-hole) from an apparent 15 m-wide zone partially addressed by old workings. Th e mineralisation is hosted in very strongly sheared greywackes (mylonites) within the so-called Kemptville Shear , and is strengthening towards the northeast. (Refer to accompanying plan and sections).
Re-logging and infi ll sampling of the available diamond drill core is being conducted to further characterise and extend the mineralisation. Only about a quarter of the 4,000 m of core from the 32 diamond holes drilled on this property since 1975 has been sampled, and about 2,900 m of core (from 21 diamond holes) remains intact.
Assay results so far received indicate widespread gold geochemical anomalism with some extended intervals of sub-ore grade (to 0.3 g/t gold over 16 m) and occasional isolated spikes (max 61.2 g/t gold over 1 m) to be generally associated with more intense quartz veining. Th ese investigations are ongoing.
Atlantic Gold has now secured about 20 km strike length elsewhere along the prospective northeast trending Kemptville Shear, through options and pegging in its own right. Th e Kemptville mineralisation was discovered in 1881 by virtue of its exposure as a window of outcrop. Apart from minor outcrop to the southwest, the Kemptville Shear is obscured by glacial overburden, and as such remains eff ectively unexplored. Further work here is planned in 2013.
1 All RC assays are fi re assay of 0.5 kg grab samples of 2 m composites. i.e. not riffl e-split.
Atlantic Gold Annual Report 2012 11
For
per
sona
l use
onl
y
Corporate governance statement
Th e Company’s corporate governance policies have been formulated to ensure that it is a responsible corporate citizen. Th is statement outlines the main corporate governance practices that are in place and which comply with the Australian Stock Exchange Corporate Governance Council recommendations, unless stated otherwise. Th is statement is organised under headings based on the Australian Securities Exchange (ASX) Corporate Governance Council’s Corporate Governance Principles and Recommendations (2nd edition August 2007 with 2010 amendments).
1 Lay solid foundations for management and oversightEstablish and disclose the respective roles and responsibilities of board and management1.1 Establish and disclose the functions reserved to the board and those delegated to senior executives.
Th e directors are responsible to shareholders for the overall corporate governance of the Atlantic Gold Group including its strategic direction, establishing goals for management and monitoring of achievement of these goals. Th e board has also established a framework for the management of the Consolidated Entity including a system of internal control, a business risk management process and the establishment of appropriate ethical standards. Th e board delegates responsibility for day-to-day management of the Company to the Chief Executive Offi cer (CEO). However, the CEO must consult the Board on matters that are sensitive, extraordinary or of a strategic nature.
1.2 Disclose the process for evaluating the performance of senior executives.Th e performance of senior executives is continuously assessed against functions and milestones specifi ed in their contracts of employment, which is considered appropriate for a company of this size.
1.3 Provide the information indicated in the Guide to reporting on Principle 1.Th e Company’s Board Charter is available on the Company’s website.
2 Structure the board to add valueHave a board of an eff ective composition, size and commitment to adequately discharge its responsibilities and duties2.1 A majority of the board should be independent directors.
Th e board consists of non-executive chairman Mr Ronald Hawkes, non-executive directors Mr Robert Symons and Mr Rodney Hanson and executive director and chief executive offi cer Mr Wally Bucknell. Messrs Symons and Hanson are considered independent directors. Mr Hawkes may be considered as not independent as a long-term major shareholder in the Company. On 1 January 2013 the board appointed an additional non-executive director Mr Rod Hanson. Th e size and composition of the Board is considered appropriate to a company of this size. Independent professional advice can be obtained by directors at the Company’s expense on authority of the board or the CEO.
2.2 The chair should be an independent director.Th e Chairman, Mr Ronald Hawkes may be considered as not independent as a long-term major shareholder in the Company. Mr Hawkes brings to the Board extensive experience in the gold mining industry in Australia and Canada. Th e Company considers that Mr Hawkes acts in the best interest of the Company at all times.
2.3 The roles of chair and chief executive offi cer should not be exercised by the same individual.Mr Ronald Hawkes is Chairman and Mr Wally Bucknell is Executive Director and CEO.
2.4 The board should establish a nomination committee.Th is role is performed by the Board which is considered appropriate for a company, and a board of directors, of this size.
2.5 Disclose the process for evaluating the performance of the board, its committees and individual directors.Th e performance of the Board, committees, individual directors and offi cers is continuously assessed which is considered appropriate for a board, and a company, of this size.
2.6 Provide the information indicated in the Guide to reporting on Principle 2.Th e Company is committed to providing a fair and equitable workplace, free from discrimination related to age, gender, ethnic, cultural or other personal factors, in which the exchange of ideas, experiences and perspectives benefi ts all employees and the communities in which we operate.Th e Board Charter is available on the Company’s website. Additional information is provided in the Directors’ Report.
12 Atlantic Gold Annual Report 2012
For
per
sona
l use
onl
y

3 Promote ethical and responsible decision makingActively promote ethical and responsible decision making3.1 Establish and disclose a code of conduct to guide as to:
the practices necessary to maintain confi dence in the company’s integrity; the practices necessary to take into account their legal obligations and the reasonable expectations of their stakeholders; the responsibility and accountability of individuals for reporting and investigating reports of unethical practices.
All directors, offi cers and employees are expected to act with the utmost integrity and objectivity, striving at all times to enhance the reputation and performance of the Company. Th e Code of Conduct is available on the Company’s website.
3.2 Establish a policy concerning diversity including measurable objectives for achieving gender diversity and for the board to assess annually both the objectives and progress in achieving them.
Th e Company has established a Diversity Policy, which includes objectives for achieving gender diversity and for the board to review annually both the policy and progress in achieving the objectives.
3.3 Disclose the measurable objectives for achieving gender diversity and progress towards achieving them.At this time, given the size and composition of the Company’s workforce, the Board has not formalised measurable objectives for achieving gender diversity, however it is committed to providing equal employment opportunity and a fair and equitable workplace, free from discrimination.
3.4 Disclose the proportion of women employees in the whole organisation, women in senior executive positions and women on the board.
Th e proportion of women in the whole organisation, in senior executive positions and on the Board as at the date of this Report are as follows: 2012 2011Whole organisation 3 out of 11 27% 2 out of 7 29%Senior Executive positions 1 out of 3 33% 1 out of 3 33%Board 0 out of 4 0% 0 out of 3 0%In addition to the employees included in the above table, the Company engages contractors from time to time and at all times provides equal employment opportunity to men and women.
3.5 Provide the information indicated in the Guide to reporting on Principle 3.Th e Code of Conduct and the Diversity Policy are available on the Company’s website.
4 Safeguard integrity in fi nancial reportingHave a structure to independently verify and safeguard the integrity of the company’s fi nancial reporting4.1 The board should establish an audit committee.
Th e Board has appointed an Audit Committee. Th e Board has adopted an Audit Committee Charter which is available on the Company’s website.
4.2 Structure the audit committee so that it consists of: only non-executive directors majority of independent directors an independent chairman, who is not chairman of the board at least three members.
Th e members of the Audit Committee are Mr Robert Symons (Chairman), Mr Ronald Hawkes and Mr Rod Hanson. Messrs Symons and Hanson are considered independent directors. Mr Hawkes may be considered as not independent as a long-term major shareholder in the Company. Th e size and structure of the Audit Committee are considered appropriate for a company, and a board of directors, of this size.
4.3 The audit committee should have a formal charter.Th e Audit Committee Charter is available on the Company’s website.
4.4 Provide the information indicated in the Guide to reporting on Principle 4.Further details of members of the Audit Committee are available in the Directors’ Report. Th e Audit Committee Charter is available on the Company’s website. Th e engagement of auditors, including rotation of individuals playing a signifi cant role in the audit, is considered annually.
Atlantic Gold Annual Report 2012 13
For
per
sona
l use
onl
y

5 Make timely and balanced disclosurePromote timely and balanced disclosure of all material matters concerning the company5.1 Establish and disclose written policies and procedures designed to ensure compliance with ASX Listing Rule disclosure
requirements and to ensure accountability at a senior executive level for that compliance.Th e Company provides information on its activities and fi nancial position quarterly, half-yearly and annually. Th e CEO is responsible for overseeing disclosure of Information to the ASX in accordance with continuous disclosure requirements contained in the ASX Listing Rules, and communication of information to the media, analysts, brokers and shareholders. Reports and releases provided to the ASX are available on the Company’s website for shareholders and other interested parties to review. Th e Company’s Continuous Disclosure Policy is available on its website.
5.2 Provide the information indicated in the Guide to reporting on Principle 5.A copy of the Continuous Disclosure Policy is available on the Company’s website.
6 Respect the rights of shareholdersRespect the rights of shareholders and facilitate the eff ective exercise of those rights6.1 Design and disclose a communications policy for promoting effective communication with shareholders and encouraging their
participation at general meetings.Th e board aims to ensure that shareholders are informed of all major developments aff ecting the Company’s state of aff airs. Th e board has adopted the following Communications Strategy: Th e annual report is distributed to all shareholders (unless a shareholder has specifi cally requested not to receive
the document). Th e Board ensures that the annual report includes relevant information about the operations of the Company during the year, changes in the state of aff airs of the Company and details of future developments, in addition to other disclosures required by the Corporations Act 2001.
Th e half yearly report contains summarised fi nancial information and a review of the operations of the Company during the period. Th e report is prepared in accordance with the requirements of Australian Accounting Standards and the Corporations Act 2001. Th e report is sent to any shareholder upon request.
Quarterly Cashfl ow and Activities Report is submitted each quarter to the ASX. Proposed major changes in the Company which may impact on share ownership rights are submitted to a vote of
shareholders.Th e Board encourages full participation of shareholders at the Annual General Meeting to ensure a high level of accountability and identifi cation with the Company’s strategy and goals. Important issues are presented to shareholders as single resolutions.Th e Company’s website provides up to date information to shareholders and other interested parties in relation to the Company’s activities, information on its projects, history of the Company and copies of announcements and reports released to the ASX. In addition, reports and releases are sent by email to shareholders and other interested parties at their request. Emails addresses are verifi ed and kept confi dential in accordance with privacy legislation.
6.2 Provide the information indicated in the Guide to reporting on Principle 6.Th e Communications Strategy is available on the Company’s website.
Corporate governance statement
14 Atlantic Gold Annual Report 2012
For
per
sona
l use
onl
y

7 Recognise and manage riskEstablish a sound system of risk oversight and management and internal control7.1 Establish and disclose policies for the oversight and management of material business risks.
A Risk Management Policy has been adopted which is designed to allow the board to identify and manage the material business risks and statutory fi nancial reporting and continuous disclosure risks associated with the company’s activities. Th e Risk Management Policy is available on the Company’s website.
7.2 Require management to design and implement the risk management and internal control system to manage the company’s material business risks and report to it on whether those risks are being managed effectively.
Th e CEO is responsible for implementing the risk management strategies approved by the board. Material business risks are monitored continuously. A Risk Management Plan, identifying and assessing each risk and proposing an appropriate strategy for its management, has been developed and is reviewed, updated and submitted to the Board at least annually. Th e CEO has reported to the Board on his review of the Risk Management Plan for the current period in accordance with this paragraph.
7.3 Disclose whether the board has received assurance from the CEO and CFO that the declaration in accordance with s.295A of the Corporations Act is founded on a sound system of risk management and internal control and that the system is operating effectively in all material respects in relation to fi nancial reporting risks.
Th e Board has received a statement in writing from the CEO and CFO attesting to the above.7.4 Provide the information indicated in the Guide to reporting on Principle 7.
Th e Risk Management Policy is available on the Company’s website.
8 Remunerate fairly and responsiblyEnsure that the level and composition of remuneration is suffi cient and reasonable and that its relationship to performance is clear8.1 The board should establish a remuneration committee.
Th e Board has appointed a Remuneration Committee. Th e Board has adopted a Remuneration Committee Charter which is available on the Company’s website.
8.2 The remuneration committee should be structured so that it: consists of a majority of independent directors is chaired by an independent director has at least three members.
Th e members of the Remuneration Committee are Mr Robert Symons (Chairman), Mr Ronald Hawkes and Mr Rod Hanson. Messrs Symons and Hanson are considered independent directors. Mr Hawkes may be considered as not independent as a long-term major shareholder in the Company. Th e size and composition of the Remuneration Committee is considered appropriate to a company of this size.
8.3 Clearly distinguish the structure of non-executive directors’ remuneration from that of executive directors and senior executives.
Non-executive directors receive a fi xed fee for their services as directors of the Company. Th e aggregate sum of fees paid to non-executive directors is approved by shareholders. Where shareholders have approved the issue of share options to non-executive directors, such share options are issued at premium to the share price at the time of issue. Any benefi t to directors will only accrue from an increase in share price.
8.4 Provide the information indicated in the Guide to reporting on Principle 8.Th e Remuneration Committee Charter is available on the Company’s website.
Please refer to the Company’s website www.atlanticgold.com.au/corpgov.
Atlantic Gold Annual Report 2012 15
For
per
sona
l use
onl
y

16 Atlantic Gold Annual Report 2012
Directors’ report
The directors present their report together with the fi nancial report of Atlantic Gold NL and the Group, being Atlantic Gold NL (the Company) and its subsidiaries and the Group’s interest in associated and jointly controlled entities, for the fi nancial year ended 31 December 2012, and the Auditor’s Report thereon.
DirectorsThe names of directors in offi ce at any time during or since the end of the fi nancial year are shown below. All directors have been in offi ce since the start of the fi nancial year to the date of this report unless otherwise noted.
Mr Robert H N SymonsBA LLB (Hons)Independent non-executive director
Qualifi cations and experienceBoard member since31 December 2005 Mr Symons is general counsel and practice director and a former senior partner of the law fi rm Norton Rose Australia (formerly Deacons). He has extensive experience in many aspects of corporate and commercial legal practice with particular expertise in resources, energy and infrastructure.He is a member of the Audit Committee and the Remuneration Committee.
Mr Ronald J HawkesBSc, FAusIMM, FGACNon-executive chairman
Qualifi cations and experienceBoard member since18 January 1999Mr Hawkes has 48 years’ experience in the mining industry and was formerly the Managing Director of Plutonic Resources Limited.He is a member of the Audit Committee and the Remuneration Committee.
Mr Wally R BucknellBSc (Hons), FAusIMM, FGAC, MSEGExecutive director
Qualifi cations and experienceBoard member since18 January 1999Mr Bucknell has 44 years’ experience in the mining industry and was formerly the General Manager – Exploration of Plutonic Resources Limited.
Company SecretaryJulie FidlerMs Fidler was appointed to the position of company secretary on 10 December 2003. She assisted with company secretarial functions in the company for 3 years prior to being appointed Company Secretary.
Directors’ report
There are no offi cers of the company during the fi nancial year who were previously partners of the current audit fi rm, KPMG, at a time when KPMG undertook an audit of the company.
Mr Rodney J HansonBe(Min)(Hons), MBA, FAusIMM, MAICDIndependent non-executive director
Qualifi cations and experienceAppointed1 January 2013Mr Hanson has over 40 years’ experience in mine development, operations, project evaluation and corporate management roles, principally in gold but also in base metals and coal. He has managed mines and projects in Australia, the Pacifi c Islands and China. He is currently a non-executive director of ASX-listed Dampier Gold Limited.
For
per
sona
l use
onl
y

Atlantic Gold Annual Report 2012 17
Directors’ meetings heldThe number of directors’ meetings (including meetings of committees of directors) and number of meetings attended by each of the directors of the company during the fi nancial year are: AUDIT REMUNERATION BOARD COMMITTEE COMMITTEE
Meetings held 14 1 1Meetings attended: R J Hawkes 14 1 1 W R Bucknell 14 – – R H N Symons 14 1 1 R J Hanson – – –
Principal activitiesThe principal activity of the Group during the fi nancial year was precious minerals exploration, primarily for gold. There was no change in the nature of the Group’s principal activity during the fi nancial year.
Operating resultsThe consolidated loss of the Group after income tax amounted to $1,783,154 (2011 loss $1,219,668).
Dividends paid or recommendedNo dividends have been paid or declared during the year. The directors do not recommend the payment of a dividend in respect of the year ended 31 December 2012.
State of affairsThe company made the following issue of shares during the year to provide additional working capital:• Issue of 25,000,000 ordinary shares at 3 cents per share pursuant to placement raising $750,000.• Issue of 91,639,916 ordinary shares at 3 cents per share pursuant to rights issue raising $2,749,197.• Issue of 22,735,000 ordinary shares at 3 cents per share pursuant to placement raising $682,050.
Share performance and shareholder wealthThe company’s share price at the beginning of the period was 3.1 cents and 3.4 cents at the end of the period. During the period the share price ranged from a low of 2.6 cents to a high of 4.5 cents. There was no return of capital to shareholders.
Non-audit servicesDuring the year KPMG provided to the Group audit services amounting to $70,000 (2011: $65,400), taxation services amounting to $8,547 (2011: $6,269) and other assurance services amounting to $9,875 (2011: $5,600). The directors are satisfi ed that provision of taxation services or other assurance services does not compromise audit independence.
Events subsequent to balance dateMr Rodney J Hanson was appointed as a director of the Company on 1 January 2013.
The Company issued 74,000,000 shares on 13 March 2013 pursuant to placement at 3.5 cents per share raising $2,590,000.
DDV Gold Limited has signed an extension of the loan agreement with Brianna Holdings Pty Ltd to 31 July 2014. The loan is still able to be paid in advance at any time without penalty.
There has not arisen in the interval between the end of the fi nancial year and the date of this report any other item, transaction or event of a material or unusual nature likely, in the opinion of the directors of the Company, to affect signifi cantly the operations of the Group, the results of those operations, or the state of affairs of the Group, in future fi nancial years.
Likely developmentsThe Group will continue to focus on the further advancement of the Touquoy and Cochrane Hill Gold Projects and gold exploration in Nova Scotia, Canada.
For
per
sona
l use
onl
y

18 Atlantic Gold Annual Report 2012
Remuneration report – auditedThe Remuneration Committee is responsible for making recommendations to the Board on remuneration policies applicable to Board members and senior executives of the Company. The broad remuneration policy is to ensure the remuneration package properly refl ects the person’s duties and responsibilities and that remuneration is competitive in attracting and retaining appropriately qualifi ed and experienced directors and executives.
The terms of employment for senior executives directly employed by the Company are unlimited in term, with statutory notice and termination provisions.
The aggregate sum that may be paid in directors’ fees to non-executive directors is determined by a resolution of shareholders. The aggregate sum may be divided among those directors in such proportion and manner as they agree or in default of agreement equally. Shareholders approved an aggregate remuneration that may be paid to non-executive directors of $200,000 at the Annual General Meeting on 21 May 2004.
Fixed compensation consists of base compensation which is calculated on a total cost basis and includes employer contributions to superannuation funds. Compensation levels are reviewed annually by the Remuneration Committee through a process that considers individual, segment and overall performance of the Group. A senior executive’s compensation is also reviewed on promotion.
The Company to date has not granted other benefi ts.
SHORT TERM POST EMPLOYMENT % OF TOTAL SALARY DIRECTORS’ FEES CONSULTING FEES CASH BONUS % REMUNERATION SUPERANNUATION TOTAL AUD AUD AUD AUD % AUD AUD
2012DirectorsR J Hawkes – 60,000 – – – 8,168 68,168W R Bucknell 268,200 – – 40,000 1 12% 27,855 336,055R H N Symons – 30,000 – – – 2,700 32,700R J Hanson 2 – – – – – – –
There were no termination benefi ts, non-monetary benefi ts or share-based payments relating to options or rights during the year.
2011 - restatedDirectorsR J Hawkes – 60,000 78,000 3 – – 5,400 143,400W R Bucknell 260,400 – – – – 23,436 283,836R H N Symons – 30,000 – – – 2,700 32,700
There were no termination benefi ts, non-monetary benefi ts or share-based payments relating to options or rights during the year.Notes:1 In October 2012 the Remuneration Committee decided to pay a discretionary cash bonus to Mr Bucknell of $40,000 in recognition of his services in
advancing the Touquoy Gold Project through granting of vesting orders by the Province of Nova Scotia, successful completion of the purchase of the Cochrane Hill Gold Project and management of the regional exploration program which continued to identify areas of interest for further more detailed exploration.
2 Mr Hanson was appointed to the Board on 1 January 2013.3 In 2012 Mr Hawkes submitted invoices totalling $198,000 for services rendered in previous years - $120,000 for 2010 and $78,000 for 2011. These were
services rendered in addition to his duties as Chairman of the Company. Directors, Mr Symons and Mr Bucknell, agreed to pay these amounts in recognition of the signifi cant additional services provided by Mr Hawkes during the 2010 and 2011 years, and during previous years for which no such recognition has been sought. These services included attendance at meetings with corporate advisers, investors and potential investors, banks and other fi nancial lenders in Australia, Canada and other jurisdictions, promoting the Company and in particular the Touquoy Gold Project.Mr Hawkes has advised the Company that there will be no charge for any additional services in 2012 and will in future submit timely invoices for any such additional services.
Directors’ reportF
or p
erso
nal u
se o
nly

Atlantic Gold Annual Report 2012 19
Options provided as remunerationThe Company’s approved Employee Share Option Plan has no performance criteria and options over ordinary shares in the Company provided as remuneration to directors and specifi ed executives pursuant to the Employee Share Option Plan have progressive vesting: 20% of the grant is vested on issue, with 30% vested one year later and the balance of 50% vested after 2 years. Unless exercised the options expire 4 years from date of issue. The options cannot be transferred and will not be listed on the Australian Securities Exchange (ASX).
On 29 August 2008 the Company issued 2,000,000 options to Mr Bucknell under the Employee Share Option Plan. These options lapsed on 28 August 2012.
On 9 March 2010 the Company issued 400,000 fully vested options to Mr A A Pilkington pursuant to contract of employment. These options lapsed on 14 October 2012.
Options granted as remuneration NO. OF OPTIONS NO. OF OPTIONS EXERCISE ISSUED DURING LAPSED DURING OUTSTANDING VESTED DURING VESTED PRICE ISSUE DATE EXPIRY DATE THE YEAR THE YEAR AT 31 DEC 2012 THE YEAR AT 31 DEC 2012
$
DirectorsW R Bucknell 0.155 29 Aug 08 28 Aug 12 – 2,000,000 – – –ExecutivesA A Pilkington 0.15 03 Mar 10 14 Oct 12 – 400,000 – – –
Ordinary shares held by directors and executives BALANCE AT GRANTED AS EXERCISE OF PURCHASE BALANCE AT 1 JAN 2012 COMPENSATION OPTIONS OF SHARES 31 DEC 2012
Fully paid ordinary sharesDirectorsR J Hawkes 27,256,561 – – – 27,256,561W R Bucknell 6,289,479 – – 1,126,013 7,415,492R H N Symons 493,500 – – 102,250 595,750R J Hanson 2,608,090 – – 459,487 3,067,577Partly paid ordinary sharesDirectorsR J Hawkes 5,750,000 – – – 5,750,000W R Bucknell 1,036,860 – – – 1,036,860R H N Symons – – – – –R J Hanson 330,732 – – – 330,732
Directors’ interestsThe relevant interest of each Director in the share capital of the companies within the Group as notifi ed by the Directors to the Australian Stock Exchange in accordance with section 205G(1) of the Corporations Act 2001, at the date of this report is as follows: FULLY PAID SHARES PARTLY PAID SHARES OPTIONS
R J Hawkes 27,256,561 5,750,000 –W R Bucknell 7,415,492 1,036,860 –R H N Symons 595,750 – –R J Hanson 3,067,577 330,732 –
[End of Audited Remuneration Report]
For
per
sona
l use
onl
y

20 Atlantic Gold Annual Report 2012
Environmental regulationThe Group’s operations are subject to signifi cant environmental regulation under the laws of both Australia and Canada. The directors are not aware of any breaches of the legislation during the fi nancial year which are material in nature.
Indemnifi cation and insurance of offi cers and auditorsThe Company has entered into an agreement to indemnify the following current directors of the Company, Mr Ronald J Hawkes, Mr Walter R Bucknell, Mr Robert H N Symons and Mr Rodney J Hanson, and the Company Secretary, Ms Julie Fidler, against any liability, including costs and expenses incurred in defending such actions, incurred by that person that may arise from their position as a director or offi cer of the Company and its Controlled Entities, except where the liability arises out of conduct involving a lack of good faith.
During the year to 31 December 2012 the Company has paid insurance premiums in respect of the directors’ and offi cers’ liability and legal expenses insurance contracts for current directors and offi cers of the Company and its Controlled Entities. The insurance policy prohibits disclosure of the amount of the premium and of the nature of the liabilities covered.
Lead Auditor’s Independence Declaration Under Section 307C of the Corporations Act 2001The lead auditor’s independence declaration is set out on page 21 and forms part of the Directors’ Report for the year ended 31 December 2012.
Signed in accordance with a resolution of the Board of Directors.
W R Bucknell, DirectorSydney, 26 March 2013
Directors’ report
Brian Bolton (General Manager Corporate), Wally Bucknell (Executive Director) and John Utley (Senior Geologist) represented Atlantic Gold at Mines & Money 2013 in Hong Kong in March 2013
For
per
sona
l use
onl
y

Atlantic Gold Annual Report 2012 21
Lead auditor’s independence declaration
Lead Auditor’s Independence Declaration under Section 307C of the Corporations Act 2001
To the Directors of Atlantic Gold NL
I declare that, to the best of my knowledge and belief, in relation to the audit for the fi nancial year ended 31 December 2012 there have been:
(i) no contraventions of the auditor independence requirements as set out in the Corporations Act 2001in relation to the audit; and
(ii) no contraventions of any applicable code of professional conduct in relation to the audit.
KPMG
Shane O’ConnorPartner
Sydney26 March 2013
For
per
sona
l use
onl
y

22 Atlantic Gold Annual Report 2012
Consolidated statement of comprehensive incomeFor the year ended 31 December 2012
NOTE CONSOLIDATED
2012 2011
$ $
Continuing operationsOther income 2 – 4,884Impairment of exploration assets 2 (675,257) (615,658)General and administrative expenses 2 (1,072,061) (707,186)Results from operating activities (1,747,318) (1,317,960)
Financial income 31,761 98,307Financial expenses (67,597) (15)Net fi nance income/(expense) (35,836) 98,292
Loss before income tax (1,783,154) (1,219,668)
Income tax expense 4 – –Loss for the year (1,783,154) (1,219,668)
Other comprehensive incomeForeign currency translation differences for foreign operations 50,834 (297,933)Net change in fair value of available for sale assets (34,902) (64,332)Other comprehensive income/(loss) for the yearnet of income tax 15,932 (362,265)
Total comprehensive loss for the year (1,767,222) (1,581,933)
Basic and diluted earnings per share (cents per share) 5 (0.28) (0.25)
The consolidated statement of comprehensive income is to be read in conjunction with the notes to the fi nancial statements set out on pages 26 to 43.
For
per
sona
l use
onl
y

Atlantic Gold Annual Report 2012 23
Consolidated statement of fi nancial positionAs at 31 December 2012
NOTE CONSOLIDATED
2012 2011
$ $
Current assetsCash and cash equivalents 6 1,028,960 1,473,999Trade and other receivables 7 800,801 251,985Prepayments 36,762 13,903Total current assets 1,866,523 1,739,887 Non-current assets Receivables 8 173,297 124,564Other fi nancial assets 9 31,925 70,727Property, plant and equipment 10 3,595,153 3,218,840Exploration and evaluation assets – intangibles 11 20,361,944 18,580,710Total non-current assets 24,162,319 21,994,841Total assets 26,028,842 23,734,728
Current liabilities Trade and other payables 12 249,274 1,266,096Loans and borrowings 13 1,000,000 –Employee benefi ts 232,596 190,000Total current liabilities 1,481,870 1,456,096
Non-current liabilities Employee benefi ts 10,200 7,300Total non-current liabilities 10,200 7,300Total liabilities 1,492,070 1,463,396 NET ASSETS 24,536,772 22,271,332
Share capital 14 50,792,939 46,760,277Reserves (1,175,750) (1,191,682)Accumulated losses (25,080,417) (23,297,263)TOTAL EQUITY 24,536,772 22,271,332
The consolidated statement of fi nancial position is to be read in conjunction with the notes to the fi nancial statements set out on pages 26 to 43.
For
per
sona
l use
onl
y

24 Atlantic Gold Annual Report 2012
FOREIGN
CURRENCY FAIR
SHARE TRANSLATION VALUE OPTIONS RETAINED TOTAL
CAPITAL RESERVE RESERVE RESERVE EARNINGS EQUITY
$ $ $ $ $ $
CONSOLIDATED2011Balance 1 January 2011 43,412,914 (1,272,976) 15,990 427,569 (22,077,595) 20,505,902
Total comprehensive income for the period
Loss for the period – – – – (1,219,668) (1,219,668)
Other comprehensive income
Foreign currency translation differences – (297,933) – – – (297,933)
Net change in fair value of available for sale assets – – (64,332) – – (64,332)
Total other comprehensive income (297,933) (64,332) – (1,219,668) (1,581,933)
Total comprehensive income for the period (297,933) (64,332) – (1,219,668) (1,581,933)
Transactions with owners recorded directly in equity
Contributions by and distributions to owners
Share options exercised 4,247 – – – – 4,247
Placements 1,624,627 – – – – 1,624,627
Proceeds of Share Purchase Plan 1,757,004 – – – – 1,757,004
Costs of issues (38,515) – – – – (38,515)
Total contributions by and distributions to owners 3,347,363 – – – – 3,347,363
Total transactions with owners 3,347,363 – – – – 3,347,363
Balance 31 December 2011 46,760,277 (1,570,909) (48,342) 427,569 (23,297,263) 22,271,332
2012Balance 1 January 2012 46,760,277 (1,570,909) (48,342) 427,569 (23,297,263) 22,271,332
Total comprehensive income for the period
Loss for the period – – – – (1,783,154) (1,783,154)
Other comprehensive income
Foreign currency translation differences – 50,834 – – – 50,834)
Net change in fair value of available for sale assets – – (34,902) – – (34,902)
Total other comprehensive income – 50,834 (34,902) – (1,783,154) (1,767,222)
Total comprehensive income for the period 50,834 (34,902) – (1,783,154) (1,767,222)
Transactions with owners recorded directly in equity
Contributions by and distributions to owners
Placements 1,432,050 – – – – 1,432,050
Rights issue receipts 2,749,197 – – – – 2,749,197
Costs of issues (148,585) – – – – (148,585)
Total contributions by and distributions to owners 4,032,662 – – – – 4,032,662
Total transactions with owners 4,032,662 – – – – 4,032,662
Balance 31 December 2012 50,792,939 (1,520,075) (83,244) 427,569 (25,080,417) 24,536,772
The consolidated statement of changes in equity is to be read in conjunction with the notes to the fi nancial statements set out on pages 26 to 43.
Consolidated statement of changes in equityFor the year ended 31 December 2012
For
per
sona
l use
onl
y

Atlantic Gold Annual Report 2012 25
Statements of cash fl owsFor the year ended 31 December 2012
NOTE CONSOLIDATED
2012 2011
$ $
Cash fl ows from operating activities Payments to suppliers and employees (996,590) (603,662)Interest received 37,796 98,307Interest paid (67,703) (15)Net cash used in operating activities 16(b) (1,026,497) (505,370)
Cash fl ows from investing activities Purchase of property, plant and equipment (387,819) (1,649,788)Payments for exploration and evaluation assets (3,339,835) (3,742,499)Payments for investments (725,268) (95,662)Sale of available for sale fi nancial asset 3,900 12,000Net cash used in investing activities (4,449,022) (5,475,949)
Cash fl ows from fi nancing activities Proceeds from rights issue 2,749,197 –Proceeds from placements 1,432,050 1,624,627Proceeds from exercise of options – 4,247Proceeds from Share Purchase Plan – 1,757,004Payment for share issue costs (148,586) (38,515)Proceeds from borrowings 1,000,000 –Net cash from fi nancing activities 5,032,661 3,347,363
Net increase/(decrease) in cash and cash equivalents (442,858) (2,633,954)Cash and cash equivalents at beginning of period 1,473,999 4,145,389Effect of exchange rate fl uctuations on cash held (2,181) (37,436)Cash and cash equivalents at end of period 16(a) 1,028,960 1,473,999
The consolidated statement of cash fl ows is to be read in conjunction with the notes to the fi nancial statements set out on pages 26 to 43.
For
per
sona
l use
onl
y

26 Atlantic Gold Annual Report 2012
NOTE 1: STATEMENT OF SIGNIFICANT ACCOUNTING POLICIES
Atlantic Gold NL (‘Company’) is a for-profi t company domiciled in Australia. The consolidated fi nancial report of the Company as at and for the year ended 31 December 2012 comprise the Company and its subsidiaries (together referred to as the ‘Group’) and the Group’s interest in associates and jointly controlled entities.
a. Statement of complianceThe consolidated fi nancial report is a general purpose fi nancial report which has been prepared in accordance with Australian Accounting Standards (AASBs) (including Australian Interpretations) adopted by the Australian Accounting Standards Board (AASB) and the Corporations Act 2001. The consolidated fi nancial report complies with International Financial Reporting Standards (IFRSs) and interpretations adopted by the International Accounting Standards Board (IASB).
The consolidated fi nancial statements were authorised for issue by the Board of Directors as at the date of the Directors’ Report.
b. Basis of preparationThe fi nancial report is prepared on the historical cost basis except for available for sale fi nancial assets which are measured at fair value. The consolidated fi nancial statements are presented in Australian dollars, which is the Company’s functional currency.
The preparation of a fi nancial report in conformity with Australian Accounting Standards requires management to make judgements, estimates and assumptions that affect the application of policies and reported amounts of assets and liabilities, income and expenses.
The estimates and associated assumptions are based on historical experience and various other factors that are believed to be reasonable under the circumstances, the results of which form the basis of making the judgements about carrying values of assets and liabilities that are not readily apparent from other sources. Actual results may differ from these estimates.
The estimates and underlying assumptions are reviewed on an ongoing basis. Revisions to accounting estimates are recognised in the period in which the estimate is revised and in any future periods affected.
Exploration and evaluation expenditure has been incurred in respect of projects which have yet to reach a stage of development where a determination of technical feasibility and commercial viability of the project can be assessed on a comprehensive basis. In these circumstances, the directors have used their experience to determine whether there is any indication that these assets have been impaired and have concluded that there are currently no such indications.
The accounting policies have been applied consistently by the Group.
c. Going concernThe fi nancial report has been prepared on the basis of a going concern. This basis presumes that funds will be available to fi nance future operations and that the realisation of assets and settlement of liabilities will occur in the normal course of business.
The directors believe that the Company and the Group will be able to fund future operations through equity raisings (including the issue of shares to existing shareholders and public placements of new shares) or using other asset exploitation arrangements, such as farm-out, joint venture or sale.
d. Basis of consolidationControlled EntitiesThe fi nancial statements of Controlled Entities are included from the date control commences until the date control ceases. Joint controlled operationsA jointly controlled operation is a joint venture carried on by each venturer using its own assets in pursuit of the joint operations. The consolidated fi nancial statements include the assets that the Group controls and the liabilities that it incurs in the course of pursuing the joint operation, and the expenses that the Group incurs and its share of the income that it earns from the joint operation.Transactions eliminated on consolidationUnrealised gains and losses and intragroup balances resulting from transactions with or between Controlled Entities are eliminated in full on consolidation. Unrealised gains resulting from transactions with jointly controlled entities are eliminated to the extent of the Group’s interest. Unrealised gains relating to jointly controlled entities are eliminated against the carrying amount of the investment. Unrealised losses are eliminated in the same way as unrealised gains, but only to the extent that there is no evidence of impairment.
e. Foreign Currency TranslationTransactionsForeign currency transactions are initially translated into Australian currency at the rate of exchange at the date of the transaction. At reporting date monetary assets and liabilities in foreign currencies are translated to Australian currency at rates of exchange current on that date. Resulting exchange differences are recognised in determining the profi t and loss for the year.
Notes to the fi nancial statementsFor the year ended 31 December 2012
For
per
sona
l use
onl
y

Atlantic Gold Annual Report 2012 27
Foreign exchange gains and losses arising from a monetary item receivable from or payable to a foreign operation, the settlement of which is neither planned nor likely in the foreseeable future, are considered to form part of a net investment in a foreign operation and are recognised directly in other comprehensive income.Foreign controlled entitiesForeign operations’ assets and liabilities are translated into Australian currency at rates of exchange current at reporting date, while its revenues and expenses are translated at exchange rates current when the transactions occurred. Exchange differences arising on translation are recognised directly in equity.
f. Net fi nancing costsNet fi nancing costs comprise interest payable on borrowings calculated using the effective interest rate method, interest receivable on funds invested, dividend income and foreign exchange gains and losses that are recognised in the consolidated statement of comprehensive income.
Interest income is recognised in the consolidated statement of comprehensive income as it accrues, using the effective interest method.
g. Leased assetsLease payments made under operating leases, where substantially all the risks and rewards of ownership remain with the lessor, are recognised in the consolidated statement of comprehensive income on a straight line basis over the term of the lease.
h. Income taxIncome tax expense comprises current and deferred tax. Current tax and deferred tax are recognised in profi t or loss except to the extent that they relate to a business combination, or items recognised directly in equity or in other comprehensive income.
Current tax is the expected tax payable or receivable on the taxable income or loss for the year, using tax rates enacted or substantively enacted at the reporting date, and any adjustment to tax payable in respect of previous years. Current tax payable also includes any tax liability arising from the declaration of dividends.
Deferred tax is recognised in respect of temporary differences between the carrying amounts of assets and liabilities for fi nancial reporting purposes and the amounts used for taxation purposes. Deferred tax is not recognised for:• temporary differences on the initial
recognition of assets or liabilities in a transaction that is not a business combination and that affects neither accounting nor taxable profi t or loss
• temporary differences relating to investments in subsidiaries and jointly controlled entities to the extent that it is probable that they will not reverse in the foreseeable future
• taxable temporary differences arising on the initial recognition of goodwill.Deferred tax is measured at the tax
rates that are expected to be applied to temporary differences when they reverse, based on the laws that have been enacted or substantively enacted by the reporting date.
Deferred tax assets and liabilities are offset if there is a legally enforceable right to offset current tax liabilities and assets, and they relate to income taxes levied by the same tax authority on the same taxable entity, or on different tax entities, but they intend to settle current tax liabilities and assets on a net basis or their tax assets and liabilities will be realised simultaneously.
A deferred tax asset is recognised for unused tax losses, tax credits and deductible temporary differences, to the extent that it is probable that future taxable profi ts will be available against which they can be utilised. Deferred tax assets are reviewed at each reporting date and are reduced to the extent that it is no longer probable that the related tax benefi t will be realised.
Additional income tax expenses that arise from the distribution of cash dividends are recognised at the same time that the liability to pay the related dividend is recognised. The Group does not distribute non-cash assets as dividends to its shareholders.
In determining the amount of current and deferred tax the Group takes into account the impact of uncertain tax positions and whether additional taxes and interest may be due. This assessment relies on estimates and assumptions and may involve a series of judgements about future events. New information may become available that causes the Group to change its judgement regarding the adequacy of existing tax liabilities; such changes to tax liabilities will impact tax expense in the period that such a determination is made.
The Company and its wholly owned Australian resident entities are part of a tax-consolidated group. As a consequence, all members of the tax-consolidated group are taxed as a single entity. The head entity within the tax-consolidated group is Atlantic Gold NL.
For
per
sona
l use
onl
y

28 Atlantic Gold Annual Report 2012
NOTE 1: STATEMENT OF SIGNIFICANT ACCOUNTING POLICIES continued:
i. Earnings per shareThe Group presents basic and diluted earnings per share (EPS) data for its ordinary shares. Basic EPS is calculated by dividing the profi t or loss attributable to ordinary shareholders of the Company by the weighted average number of ordinary shares outstanding during the period. Diluted EPS is determined by adjusting the profi t or loss attributable to ordinary shareholders and the weighted average number of ordinary shares outstanding for the effects of all dilutive potential ordinary shares, which comprise share options granted.
The partly paid shares are classifi ed as ‘ordinary shares’ for the purpose of calculating earnings per share.
j. Cash and cash equivalentsCash and cash equivalents comprise cash balances and call deposits. Bank overdrafts that are repayable on demand and form an integral part of the Group’s cash management are included as a component of cash and cash equivalents for the purpose of the statements of cash fl ows.
k. Non-derivative fi nancial instrumentsAvailable-for-sale fi nancial assetsThe Group’s investments in equity securities and certain debt securities are classifi ed as available-for-sale fi nancial assets. Subsequent to initial recognition, they are measured at fair value and changes therein, other than impairment losses (see note 1q), are recognised directly in a separate component of equity. When an investment is derecognised, the cumulative gain or loss in equity is transferred to profi t or loss.
Loans and receivablesLoans and receivables are fi nancial assets with fi xed or determinable payments that are not quoted in an active market. Such assets are recognised initially at fair value plus any directly attributable transaction costs. Subsequent to initial recognition loans and receivables are measured at amortised cost using the effective interest method, less any impairment loss.
l. InvestmentsControlled entitiesInvestments in Controlled Entities are carried in the Company’s fi nancial statements at cost less any impairment.
m. Trade and other receivablesTrade and other receivables are stated at their amortised cost less impairment losses (refer note 1q).
n. Goods and Services TaxRevenues, expenses and assets are recognised net of the amount of goods and services tax (GST), except where the amount of GST incurred is not recoverable from the taxation authority. In these circumstances the GST is recognised as part of the cost of acquisition of the asset or as part of the expense.
Receivables and payables are stated with the amount of GST included. The net amount of GST recoverable from, or payable to, the taxation authority is included as a current asset or liability in the consolidated statement of fi nancial position.
Cash fl ows are included in the statement of cash fl ows on a gross basis. The GST components of cash fl ows arising from investing and fi nancing activities which are recoverable from, or payable to, the taxation authority are classifi ed as operating cash fl ows.
o. Property, plant and equipmentAll assets acquired including property, plant and equipment are stated at cost or deemed cost of acquisition at the date of acquisition less accumulated depreciation and any impairment losses (refer note 1q). DepreciationDepreciation is charged to the consolidated statement of comprehensive income. All assets have limited useful lives and are depreciated using the straight line method over their useful lives. Depreciation methods and useful lives, as well as residual values, are reassessed annually. Assets are depreciated from the date they are available for use. Land is not depreciated.The depreciation rates used for each class of depreciable assets are:Plant and equipment 20–40%Leasehold improvements 10%
p. Exploration and evaluation expenditurePre-licence costs are recognised in the consolidated statement of comprehensive income as incurred.
Exploration and evaluation expenditure, including the costs of acquiring licences, are capitalised either as tangible or intangible depending on their nature on a project by project basis pending determination of technical feasibility and commercial viability. These costs are only carried forward to the extent that they are expected to be recouped through the successful development of the area or where activities in the area have not yet reached a stage which permits reasonable assessment of the existence of economically recoverable reserves.
Expenditure deemed to be unsuccessful is recognised in the consolidated statement of comprehensive income immediately.
Notes to the fi nancial statementsFor the year ended 31 December 2012
For
per
sona
l use
onl
y
Atlantic Gold Annual Report 2012 29
Exploration and evaluation assets are assessed for impairment only when facts and circumstances suggest that the carrying amount of an exploration and evaluation asset may exceed its recoverable amount. Unlike other assets, there is no requirement to assess whether an indication of impairment exists at each reporting date until an entity has suffi cient information to reach a conclusion about commercial viability and the feasibility of extraction.
q. ImpairmentFinancial assetsA fi nancial asset is assessed at each reporting date to determine whether there is any objective evidence that it is impaired. A fi nancial asset is considered to be impaired if objective evidence indicates that one or more events have had a negative effect on the estimated future cash fl ows of that asset.
An impairment loss in respect of a fi nancial asset measured at amortised cost is calculated as the difference between its carrying amount, and the present value of the estimated future cash fl ows discounted at the original effective interest rate. An impairment loss in respect of an available-for-sale fi nancial asset is calculated by reference to its fair value.
Individually signifi cant fi nancial assets are tested for impairment on an individual basis. The remaining fi nancial assets are assessed collectively in groups that share similar credit risk characteristics.
All impairment losses are recognised in profi t or loss. Any cumulative loss in respect of an available-for-sale fi nancial asset recognised previously in equity is transferred to profi t or loss.
An impairment loss is reversed if the reversal can be related objectively to an event occurring after the impairment loss was recognised. For fi nancial assets measured at amortised cost and available-for-sale fi nancial assets that are debt securities, the reversal is recognised in profi t or loss. For available-for-sale fi nancial assets that are equity securities, the reversal is recognised in the consolidated statement of comprehensive income.Non-fi nancial assetsThe carrying amounts of the Group’s non-fi nancial assets, other than deferred tax assets (refer note 1h), are reviewed at each reporting date to determine whether there is any indication of impairment. If any such indication exists then the asset’s recoverable amount is estimated. For intangible assets that have indefi nite lives or that are not yet available for use, the recoverable amount is estimated each year at the same time.
The recoverable amount of an asset or cash-generating unit is the greater of its value in use and its fair value less costs to sell. In assessing value in use, the estimated future cash fl ows are discounted to their present value using a pre-tax discount rate that refl ects current market assessments of the time value of money and the risks specifi c to the asset. For the purpose of impairment testing, assets are grouped together into the smallest group of assets that generates cash infl ows from continuing use that are largely independent of the cash infl ows of other assets or groups of assets (the ‘cash-generating unit’). The goodwill acquired in a business combination, for the purpose of impairment testing, is allocated to cash-generating units that are expected to benefi t from the synergies of the combination.
An impairment loss is recognised if the carrying amount of an asset or its cash-generating unit exceeds its recoverable amount. Impairment losses are recognised in profi t or loss. Impairment losses recognised in respect of cash-generating units are allocated fi rst to reduce the carrying amount of any goodwill allocated to the units and then to reduce the carrying amount of the other assets in the unit (group of units) on a pro rata basis.
An impairment loss in respect of goodwill is not reversed. In respect of other assets, impairment losses recognised in prior periods are assessed at each reporting date for any indications that the loss has decreased or no longer exists. An impairment loss is reversed if there has been a change in the estimates used to determine the recoverable amount. An impairment loss is reversed only to the extent that the asset’s carrying amount does not exceed the carrying amount that would have been determined, net of depreciation or amortisation, if no impairment loss had been recognised.
r. Trade and other payablesTrade and other payables are recognised initially at fair value plus directly attributable transaction costs. Subsequent to initial recognition they are stated at amortised cost.
s. ProvisionsA provision is recognised in the consolidated statement of fi nancial position when the Group has a present legal or constructive obligation that can be estimated reliably as a result of a past event, and it is probable that an outfl ow of economic benefi ts will be required to settle the obligation. Provisions are determined by discounting the expected future cash fl ows at a pre-tax rate that refl ects current market assessments of the time value of money and the risks specifi c to the liability.
For
per
sona
l use
onl
y

30 Atlantic Gold Annual Report 2012
NOTE 1: STATEMENT OF SIGNIFICANT ACCOUNTING POLICIES continued:
t. Employee benefi tsWages, salaries, annual leave and sick leaveLiabilities for employee benefi ts for wages, salaries, annual leave and sick leave expected to be settled within 12 months of the year end, represent present obligations resulting from employees’ services provided up to the reporting date, are calculated at undiscounted amounts based on current remuneration and salary rates that the Group expects to pay as at the reporting date including related on-costs.SuperannuationA defi ned contribution plan is a post-employment benefi t plan under which an entity pays fi xed contributions into a separate entity and will have no legal or constructive obligation to pay further amounts. Obligations for contributions to defi ned contribution superannuation plans are recognised as an expense in the consolidated statement of comprehensive income as incurred.Long-term service benefi tsThe Group’s net obligation in respect of long-term service benefi ts is the amount of future benefi t that employees have earned in return for their service in the current and prior periods. The obligation is calculated using expected future increases in wage and salary rates including related on-costs and expected settlement dates, and is discounted using the rates attached to the Commonwealth Government bonds at the date of the consolidated statement of fi nancial position which have maturity dates approximating to the terms of the Group’s obligation.
Share-based payment transactionsThe grant date fair value of options granted to employees is recognised as an employee expense, with a corresponding increase in equity, over the period the employees become unconditionally entitled to the options. The amount recognised as an expense is adjusted to refl ect the actual number of share options that vest.
u. Determination of fair valuesA number of the Group’s accounting policies and disclosures require the determination of fair value, for both fi nancial and non-fi nancial assets and liabilities. Fair values have been determined for measurement and/or disclosure purposes based on the following methods. Where applicable, further information about the assumptions made in determining fair values is disclosed in the notes specifi c to that asset or liability.Property, plant and equipmentThe fair value of property, plant and equipment recognised as a result of a business combination is based on market values. The market value of property is the estimated amount for which a property could be exchanged on the date of valuation between a willing buyer and a willing seller in an arm’s length transaction after proper marketing wherein the parties had each acted knowledgeably, prudently and without compulsion. The market value of items of plant, equipment, fi xtures and fi ttings is based on the quoted market prices for similar items.Investments in equity and debt securitiesThe fair value of fi nancial assets at fair value through profi t or loss, held-to-maturity investments and available-for-sale fi nancial assets is determined by reference to their quoted bid price at the reporting date. The fair value of held-to-maturity investments is determined for disclosure purposes only.
Trade and other receivablesThe fair value of trade and other receivables is estimated as the present value of future cash fl ows, discounted at the market rate of interest at the reporting date. For short dated receivables the carrying value approximates fair value.Non-derivative fi nancial liabilitiesFair value, which is determined for disclosure purposes, is calculated based on the present value of future principal and interest cash fl ows, discounted at the market rate of interest at the reporting date.Share-based payment transactionsThe fair value of employee stock options is measured using a binomial lattice model. The fair value of share appreciation rights is measured using a binomial option pricing model which takes into account the share price at time of issue and expected volatility of the underlying share, the exercise price and term of the option, the risk free interest rate and expected dividends, adjusted to refl ect the prohibition on sale or transfer of options and vesting conditions. Measurement inputs include share price on measurement date, exercise price of the instrument, expected volatility, weighted average expected life of the instruments (based on historical experience and general option holder behaviour), expected dividends, and the risk-free interest rate (based on government bonds). Service and non-market performance conditions attached to the transactions are not taken into account in determining fair value.
Notes to the fi nancial statementsFor the year ended 31 December 2012
For
per
sona
l use
onl
y

Atlantic Gold Annual Report 2012 31
v. Share capitalOrdinary sharesOrdinary shares are classifi ed as equity. Incremental costs directly attributable to issue of ordinary shares and share options are recognised as a deduction from equity, net of any tax effects.
x. ReservesForeign currency translation reserveThe translation reserve comprises all foreign currency differences arising from the translation of the fi nancial statements of foreign operations.Fair value reserveThe fair value reserve comprises the cumulative net change in the fair value of available-for-sale fi nancial assets until the investment is derecognised or impaired.Options reserveThe option reserve comprises the fair value of options granted to directors and employees meeting vesting conditions as well as the fair value of options granted in relation to fi nancial liabilities representing transaction costs.
u. Segment reportingThe Group determines and presents operating segments based on information that internally is provided to the Executive Director, who is the Group’s chief operating decision maker. The Group has determined that it has only one operating segment, being exploration and development of the Group’s properties in Nova Scotia, Canada. Unallocated items comprise mainly corporate assets, head offi ce expenses and income tax assets and liabilities. Segment capital expenditure is the total cost incurred during the period to acquire property, plant and equipment and intangible assets other than goodwill.
y. New standards and interpretations not yet adoptedA number of new standards, amendments to standards and interpretations are effective for annual periods beginning after 1 January 2012, and have not been applied in preparing these consolidated fi nancial statements.
AASB 9 Financial Instruments, which becomes mandatory for the Group’s 2015 consolidated fi nancial statements, could change the classifi cation and measurement of fi nancial assets. The Group does not plan to adopt this standard early and the extent of the impact has not been determined.
AASB 10 Consolidated Financial Statements, AASB 11 Joint Arrangements, AASB 12 Disclosure of Interests in Other Entities, AASB 13 Fair Value Measurement and AASB 119 Employee Benefi ts will be mandatory for the Group’s 2013 consolidated fi nancial statements. None of these is expected to have a signifi cant effect on the consolidated fi nancial statements of the Group.
For
per
sona
l use
onl
y

32 Atlantic Gold Annual Report 2012
NOTE 2: LOSS BEFORE TAX Loss from ordinary activities before income tax has been arrived at after charging/(crediting) the following items: Exploration expenditure written off 1 675,257 615,658 Profi t on disposal of available for sale fi nancial asset – (4,884)
Note 1: On the basis of reconnaissance exploration, regional exploration titles are retained orturned over and new claims pegged or acquired. Expenditure on surrendered or lapsed claims is written off.
General and administrative expenses Administrative costs 455,580 264,229Amounts set aside to provision for employee benefi ts 45,486 32,500Corporate costs 154,722 108,134Depreciation and amortisation expense 18,572 16,980Employee and Director benefi ts expense 164,971 52,508Superannuation 108,077 111,496Net loss on disposal of investments 816 –Occupancy expense 42,321 27,588Other expenses from ordinary activities 81,516 93,751 1,072,061 707,186
NOTE 3: FINANCIAL INCOME AND EXPENSESFinancial income 31,761 98,307Financial expenses (67,597) (15)Net fi nancial income and expenses (35,836) 98,292Financial income relates to interest received from term deposits.Financial expenses comprise interest payments.
NOTE 4: INCOME TAX EXPENSENumerical reconciliation between tax benefi t and pre-tax net lossLoss before tax (1,783,154) (1,219,668)Total income tax benefi t calculated at 30% (534,946) (365,900)Increase in income tax expense due to: Other non-allowable items 818 619 (534,128) (365,281)Deferred tax asset not brought to account 534,128 365,281Income tax expense on pre-tax loss – –Recognised tax assets and liabilitiesDeferred tax assets and liabilities are attributable to the following: Exploration and evaluation expenditure – 999,845 Provisions – (59,190) Other – (89,074) Tax benefi t/(loss) carry-forwards – (851,581)Net deferred tax liability/(asset) – –
Deferred tax asset not taken to accountTax losses carried forward: Tax losses 6,756,053 5,442,688 Tax losses utilised – (851,581) 6,756,053 4,591,107
CONSOLIDATED
2012 2011
$ $
Notes to the fi nancial statementsFor the year ended 31 December 2012
For
per
sona
l use
onl
y
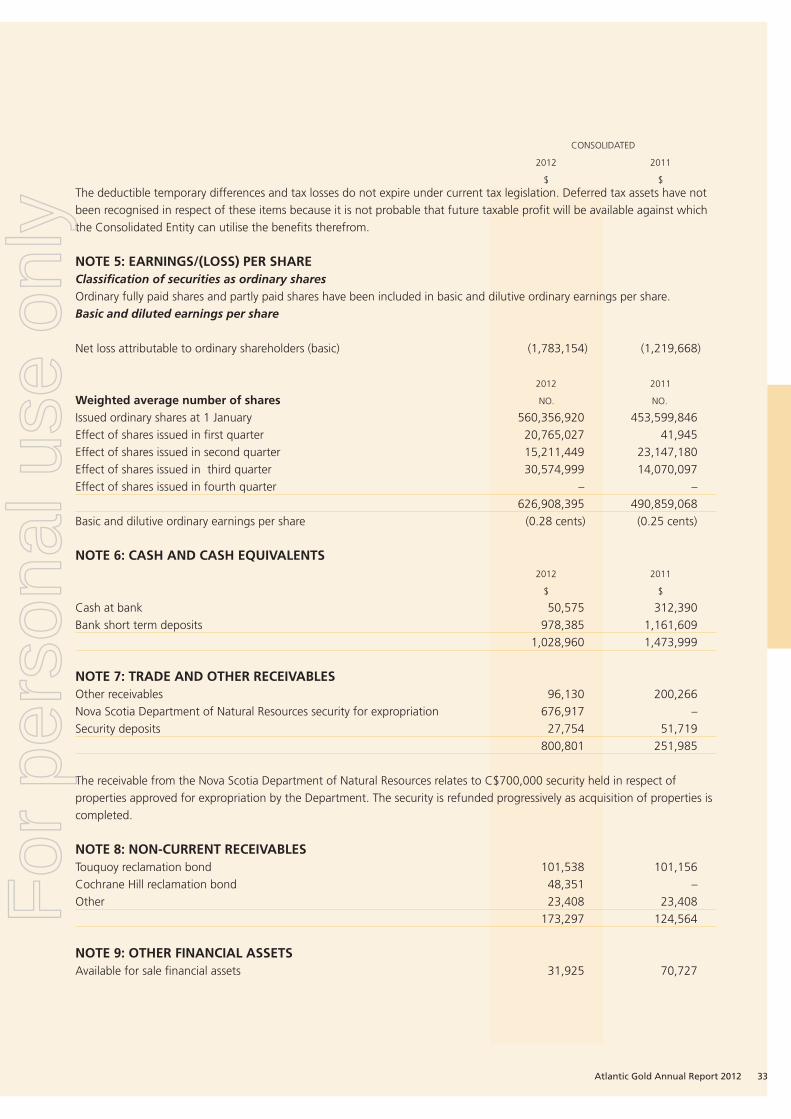
Atlantic Gold Annual Report 2012 33
The deductible temporary differences and tax losses do not expire under current tax legislation. Deferred tax assets have not been recognised in respect of these items because it is not probable that future taxable profi t will be available against which the Consolidated Entity can utilise the benefi ts therefrom.
NOTE 5: EARNINGS/(LOSS) PER SHAREClassifi cation of securities as ordinary sharesOrdinary fully paid shares and partly paid shares have been included in basic and dilutive ordinary earnings per share.Basic and diluted earnings per share
Net loss attributable to ordinary shareholders (basic) (1,783,154) (1,219,668)
2012 2011
Weighted average number of shares NO. NO.
Issued ordinary shares at 1 January 560,356,920 453,599,846Effect of shares issued in fi rst quarter 20,765,027 41,945Effect of shares issued in second quarter 15,211,449 23,147,180Effect of shares issued in third quarter 30,574,999 14,070,097Effect of shares issued in fourth quarter – – 626,908,395 490,859,068Basic and dilutive ordinary earnings per share (0.28 cents) (0.25 cents)
NOTE 6: CASH AND CASH EQUIVALENTS 2012 2011
$ $
Cash at bank 50,575 312,390Bank short term deposits 978,385 1,161,609 1,028,960 1,473,999
NOTE 7: TRADE AND OTHER RECEIVABLES Other receivables 96,130 200,266Nova Scotia Department of Natural Resources security for expropriation 676,917 –Security deposits 27,754 51,719 800,801 251,985
The receivable from the Nova Scotia Department of Natural Resources relates to C$700,000 security held in respect of properties approved for expropriation by the Department. The security is refunded progressively as acquisition of properties is completed.
NOTE 8: NON-CURRENT RECEIVABLESTouquoy reclamation bond 101,538 101,156Cochrane Hill reclamation bond 48,351 –Other 23,408 23,408 173,297 124,564
NOTE 9: OTHER FINANCIAL ASSETSAvailable for sale fi nancial assets 31,925 70,727
CONSOLIDATED
2012 2011
$ $
For
per
sona
l use
onl
y

34 Atlantic Gold Annual Report 2012
NOTE 10: PROPERTY, PLANT AND EQUIPMENTLandLand at cost 3,531,436 2,996,492Surface title purchase deposits – 140,132 3,531,436 3,136,624Plant and equipment At cost 100,159 97,021Accumulated depreciation (78,678) (59,789) 21,481 37,232Intangibles At cost 967 964Accumulated depreciation – – 967 964Leasehold improvements At cost 47,159 45,295Accumulated amortisation (5,890) (1,275)Total leasehold improvements 41,269 44,020Total property, plant and equipment 3,595,153 3,218,840
ReconciliationsReconciliation of the carrying amounts for each class of property, plant and equipment are set out below:LandCarrying amount at beginning of year 3,136,624 1,572,435Effect of movement in exchange rates 11,829 (32,570)Additions 533,314 1,596,759Disposals (150,331) –Carrying amount at end of year 3,531,436 3,136,624
Plant and equipment Carrying amount at beginning of year 37,232 31,247Effect of movement in exchange rates 68 (73)Additions 6,969 26,541Disposals (398) (595)Depreciation (22,390) (19,888)Carrying amount at end of year 21,481 37,232
Intangibles Carrying amount at beginning of year 964 –Effect of movement in exchange rates 3 964Amortisation – –Carrying amount at end of year 967 964
Leasehold improvements Carrying amount at beginning of year 44,020 –Effect of movement in exchange rates 22 –Additions 1,842 45,295Amortisation (4,615) (1,275)Carrying amount at end of year 41,269 44,020
CONSOLIDATED
2012 2011
$ $
Notes to the fi nancial statementsFor the year ended 31 December 2012
For
per
sona
l use
onl
y
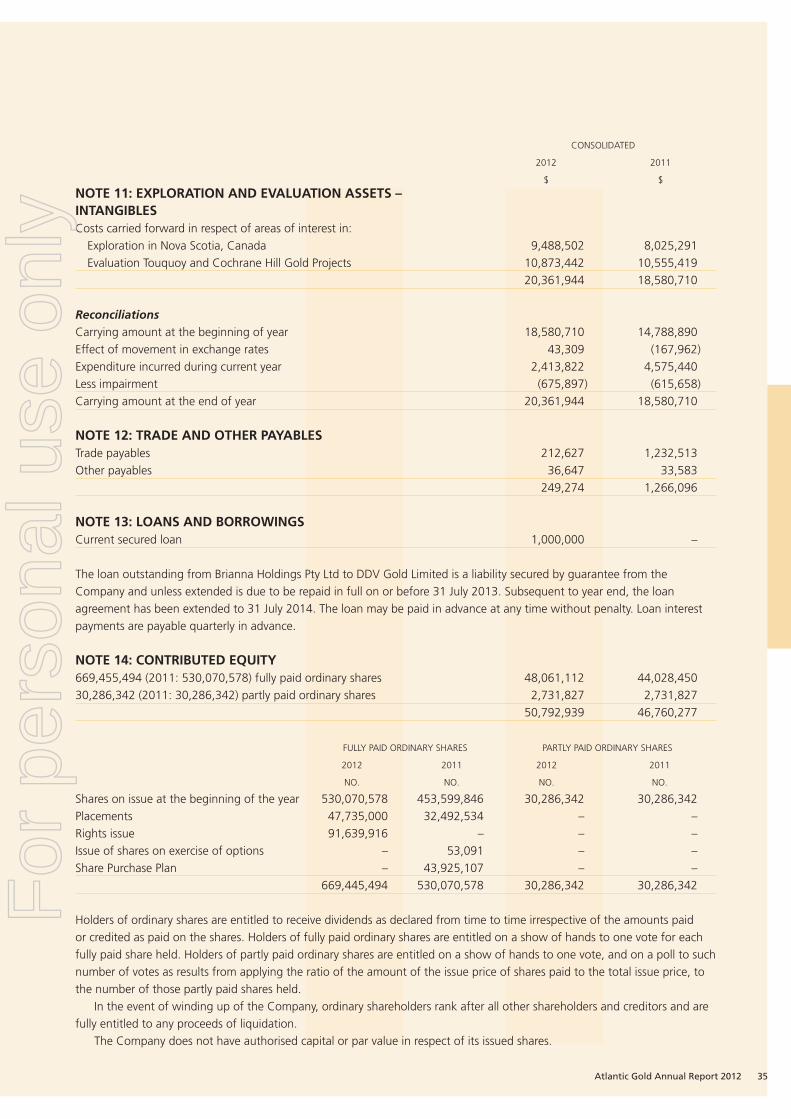
Atlantic Gold Annual Report 2012 35
CONSOLIDATED
2012 2011
$ $
NOTE 11: EXPLORATION AND EVALUATION ASSETS –INTANGIBLESCosts carried forward in respect of areas of interest in: Exploration in Nova Scotia, Canada 9,488,502 8,025,291 Evaluation Touquoy and Cochrane Hill Gold Projects 10,873,442 10,555,419 20,361,944 18,580,710
Reconciliations Carrying amount at the beginning of year 18,580,710 14,788,890Effect of movement in exchange rates 43,309 (167,962)Expenditure incurred during current year 2,413,822 4,575,440Less impairment (675,897) (615,658)Carrying amount at the end of year 20,361,944 18,580,710
NOTE 12: TRADE AND OTHER PAYABLESTrade payables 212,627 1,232,513Other payables 36,647 33,583 249,274 1,266,096
NOTE 13: LOANS AND BORROWINGSCurrent secured loan 1,000,000 –
The loan outstanding from Brianna Holdings Pty Ltd to DDV Gold Limited is a liability secured by guarantee from the Company and unless extended is due to be repaid in full on or before 31 July 2013. Subsequent to year end, the loan agreement has been extended to 31 July 2014. The loan may be paid in advance at any time without penalty. Loan interest payments are payable quarterly in advance.
NOTE 14: CONTRIBUTED EQUITY669,455,494 (2011: 530,070,578) fully paid ordinary shares 48,061,112 44,028,45030,286,342 (2011: 30,286,342) partly paid ordinary shares 2,731,827 2,731,827 50,792,939 46,760,277
FULLY PAID ORDINARY SHARES PARTLY PAID ORDINARY SHARES
2012 2011 2012 2011
NO. NO. NO. NO.
Shares on issue at the beginning of the year 530,070,578 453,599,846 30,286,342 30,286,342Placements 47,735,000 32,492,534 – –Rights issue 91,639,916 – – –Issue of shares on exercise of options – 53,091 – –Share Purchase Plan – 43,925,107 – – 669,445,494 530,070,578 30,286,342 30,286,342
Holders of ordinary shares are entitled to receive dividends as declared from time to time irrespective of the amounts paid or credited as paid on the shares. Holders of fully paid ordinary shares are entitled on a show of hands to one vote for each fully paid share held. Holders of partly paid ordinary shares are entitled on a show of hands to one vote, and on a poll to such number of votes as results from applying the ratio of the amount of the issue price of shares paid to the total issue price, to the number of those partly paid shares held.
In the event of winding up of the Company, ordinary shareholders rank after all other shareholders and creditors and are fully entitled to any proceeds of liquidation.
The Company does not have authorised capital or par value in respect of its issued shares.
For
per
sona
l use
onl
y

36 Atlantic Gold Annual Report 2012
NOTE 15: OPTIONS OUTSTANDING AT ISSUED DURING EXERCISED DURING LAPSED DURING OUTSTANDING AT
EXPIRY DATE EXERCISE PRICE 31 DEC 2011 YEAR YEAR YEAR 31 DEC 2012
Unlisted28 August 2012 $0.155 2,000,000 3 – – 2,000,000 –14 October 2012 $0.15 400,000 3 – – 400,000 – 2,400,000 – – 2,400,000 –
Note 3 For further detail please refer to the Remuneration Report contained in the Directors’ Report.
NOTE 16: NOTES TO THE STATEMENTS OF CASH FLOWS(a) Reconciliation of Cash Cash at the end of the fi nancial year as shown in thestatements of cash fl ows is reconciled to items in theconsolidated statement of fi nancial position as follows:
CONSOLIDATED
2012 2011
$ $
Cash at bank 50,575 312,390Bank short term deposits 978,385 1,161,609 1,028,960 1,473,999
(b) Reconciliation of loss after income taxto net cash used in operating activities Loss from ordinary activities after income tax (1,783,154) (1,219,668)Add/(less) non-cash items: Effect of movement in exchange rates 8,036 (37,936) Amortisation 4,615 1,275 Depreciation 13,961 15,705 Amounts set aside to provisions 45,496 32,500 Impairment of exploration expenditure 675,257 615,658 (Gain)/loss on sale of non-current assets 816 (4,884) Unrealised foreign exchange (24,273) 38,800
Changes in assets and liabilities, net of the effects ofpurchase and disposal of Controlled Entitiesduring the fi nancial year: (Increase)/decrease in receivables 20,180 (3,595) (Increase)/decrease in prepayments 675 45,003 Increase/(decrease) in payables 11,894 11,772Net cash used in operating activities (1,026,497) (505,370)
Notes to the fi nancial statementsFor the year ended 31 December 2012
For
per
sona
l use
onl
y

Atlantic Gold Annual Report 2012 37
NOTE 17: PARENT ENTITY DISCLOSURES COMPANY
2012 2011
$ $
Current assets 983,635 1,244,989Total assets 24,841,278 22,517,262
Current liabilities 177,506 136,230Total liabilities 304,506 245,930
Issued capital 50,792,939 46,760,277Reserves 427,569 427,569Retained losses (26,683,736) (24,916,514)Total equity 24,536,772 22,271,332
Loss for the year (1,767,222) (1,581,934)Other comprehensive income – –Total comprehensive income (1,767,222) (1,581,934)
NOTE 18: COMMITMENTSOperating Lease Commitments The Group leases property and equipment. Leases generally provide the Group with a right of renewal at which time all terms are re-negotiated.
CONSOLIDATED
2012 2011
$ $
Future operating lease commitments not provided forin the fi nancial statements and payable: within 1 year 43,048 26,973 greater than 1 year and less than 5 years 83,483 34,979 126,531 61,952
Exploration Tenement CommitmentsIn order to maintain current rights of tenure to exploration tenements, the Group is required to outlay in the year ending 31 December 2013 an amount of approximately $16,636 (2012: 10,524) in respect of exploration expenditure.
NOTE 19: CONTINGENT LIABILITIESNative titleThe value of the mining tenements is dependent on the discovery of commercially viable reserves and the successful development or alternatively sale, of the respective tenements. The Group’s exploration properties may at some future time be subject to claims under native title or contain sacred sites or sites of signifi cance to aboriginal people. In the event of any such claim being made and the National Native Title Tribunal or other relevant authority ratifying such claim, the Group’s exploration properties or areas within the tenements may be subject to exploration and/or mining restrictions or compensation.
For
per
sona
l use
onl
y
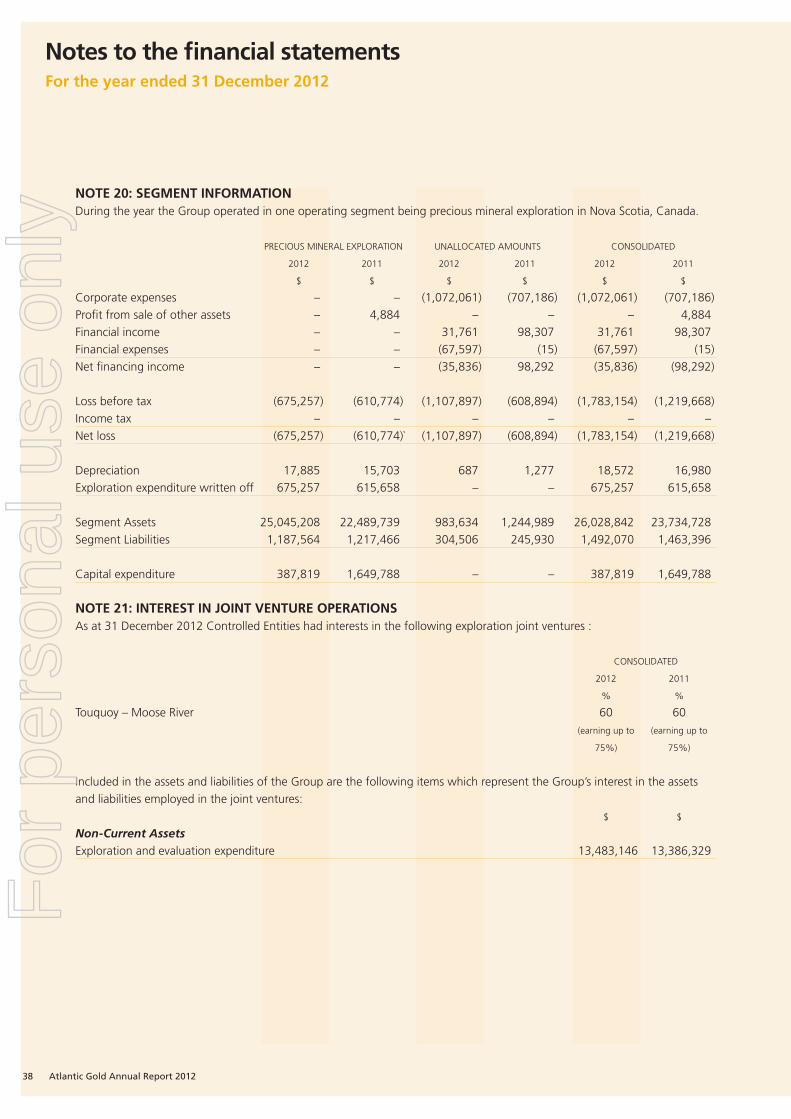
38 Atlantic Gold Annual Report 2012
NOTE 20: SEGMENT INFORMATIONDuring the year the Group operated in one operating segment being precious mineral exploration in Nova Scotia, Canada.
PRECIOUS MINERAL EXPLORATION UNALLOCATED AMOUNTS CONSOLIDATED
2012 2011 2012 2011 2012 2011
$ $ $ $ $ $
Corporate expenses – – (1,072,061) (707,186) (1,072,061) (707,186)Profi t from sale of other assets – 4,884 – – – 4,884Financial income – – 31,761 98,307 31,761 98,307 Financial expenses – – (67,597) (15) (67,597) (15)Net fi nancing income – – (35,836) 98,292 (35,836) (98,292)
Loss before tax (675,257) (610,774) (1,107,897) (608,894) (1,783,154) (1,219,668)Income tax – – – – – –Net loss (675,257) (610,774)` (1,107,897) (608,894) (1,783,154) (1,219,668)
Depreciation 17,885 15,703 687 1,277 18,572 16,980Exploration expenditure written off 675,257 615,658 – – 675,257 615,658
Segment Assets 25,045,208 22,489,739 983,634 1,244,989 26,028,842 23,734,728 Segment Liabilities 1,187,564 1,217,466 304,506 245,930 1,492,070 1,463,396
Capital expenditure 387,819 1,649,788 – – 387,819 1,649,788
NOTE 21: INTEREST IN JOINT VENTURE OPERATIONSAs at 31 December 2012 Controlled Entities had interests in the following exploration joint ventures :
CONSOLIDATED
2012 2011
% %
Touquoy – Moose River 60 60 (earning up to (earning up to
75%) 75%)
Included in the assets and liabilities of the Group are the following items which represent the Group’s interest in the assets and liabilities employed in the joint ventures: $ $
Non-Current AssetsExploration and evaluation expenditure 13,483,146 13,386,329
Notes to the fi nancial statementsFor the year ended 31 December 2012
For
per
sona
l use
onl
y

Atlantic Gold Annual Report 2012 39
NOTE 22: CONTROLLED ENTITIES COUNTRY OF PERCENTAGE OWNED
INCORPORATION 2012 2011
% %
Particulars in relation to Controlled EntitiesParent Entity Atlantic Gold NL AustraliaControlled Entities Atlantic Gold Exploration Pty Ltd Australia 100 100 DDV Gold Limited Canada 100 100
NOTE 23: KEY MANAGEMENT PERSONNEL DISCLOSURESRemuneration of specifi ed directors and specifi ed executives by the Group The Remuneration Committee is responsible for making recommendations to the Board on remuneration policies applicable to Board members and senior executives of the Company. The broad remuneration policy is to ensure the remuneration package properly refl ects the person’s duties and responsibilities and that remuneration is competitive in attracting and retaining appropriately qualifi ed and experienced executives.
The aggregate sum that may be paid as directors’ fees to non-executive directors is determined by a resolution of shareholders. The terms of employment for senior executives directly employed by the Company are unlimited in term, with statutory notice and termination provisions.
The key management personnel remuneration comprised: CONSOLIDATED
2012 2011
$ $
Short term employment benefi ts 398,200 428,400Post-employment benefi ts 38,723 31,526Share based payments – – 436,923 459,926
For further detail including options granted as remuneration please refer to the Remuneration Report contained in the Directors’ Report.
NOTE 24: RELATED PARTIESDirectorsThe names of each person holding the position of director of Atlantic Gold NL during the fi nancial year are:
Ronald J HawkesWalter R BucknellRobert H N Symons
Robert H N Symons is an employee of Norton Rose Australia. During the fi nancial year an amount of $145,737 (2011: $38,754) was paid to Norton Rose for the provision of legal services to the Group on normal commercial terms.
Details of directors’ remuneration including options granted as remuneration are set out in note 23 and the Remuneration Report contained in the Directors’ Report.
Apart from the details disclosed in this note, no director has entered into a material contract with the Company or the Group since the end of the previous fi nancial year and there were no material contracts involving directors’ interests subsisting at year end.
For
per
sona
l use
onl
y

40 Atlantic Gold Annual Report 2012
NOTE 24: RELATED PARTIES continued:Directors’ and Executive Offi cer’s holdings of shares and share optionsThe aggregate interests of Directors and the Executive Offi cer of the reporting entity and their Director-related entities in shares and share options of entities within the Group at year end are set out below.
HELD AT HELD AT2012 1 JAN 2012 ACQUISITIONS EXERCISED LAPSED 31 DEC 2012
Fully paid ordinary sharesDirectors R J Hawkes 27,256,561 – – – 27,256,561 W R Bucknell 6,289,479 1,126,013 1 – – 7,415,492 R H N Symons 493,500 102,250 1 – – 595,750 R J Hanson 2,608,090 459,487 1 – – 3,067,577Partly paid ordinary sharesDirectors R J Hawkes 5,750,000 – – – 5,750,000 W R Bucknell 1,036,860 – – – 1,036,860 R H N Symons – – – – – R J Hanson 330,732 – – – 330,732OptionsDirectors R J Hawkes – – – – – W R Bucknell 2,000,000 – – (2,000,000) – R H N Symons – – – – – R J Hanson – – – – –Note 1 Shares acquired as part of an offer to all shareholders.
HELD AT HELD AT2011 1 JAN 2011 ACQUISITIONS1 EXERCISED LAPSED 31 DEC 2011
Fully paid ordinary sharesDirectors R J Hawkes 27,256,561 – – – 27,256,561 W R Bucknell 5,901,718 387,761 – – 6,289,479 R H N Symons 290,000 203,500 – – 493,500Partly paid ordinary sharesDirectors R J Hawkes 5,750,000 – – – 5,750,000 W R Bucknell 1,036,860 – – – 1,036,860 R H N Symons – – – – –OptionsDirectors R J Hawkes 125,000 – – 125,000 – W R Bucknell 2,012,761 – 12,761 – 2,000,000 R H N Symons 3,500 – 3,500 – –Note 1 Shares acquired as part of an offer to all shareholders and exercise of options.
Non-Director related partiesTransactions between related parties are on normal commercial terms and conditions no more favourable than those available to other parties unless otherwise stated.
Notes to the fi nancial statementsFor the year ended 31 December 2012
For
per
sona
l use
onl
y

Atlantic Gold Annual Report 2012 41
NOTE 25: AUDITORS’ REMUNERATIONAudit services – KPMG 70,000 65,400Taxation services – KPMG (Australia and Canada) 8,547 6,269Other assurance services – KPMG 9,875 5,600 88,422 77,269
NOTE 26: EVENTS SUBSEQUENT TO REPORTING DATEMr Rodney J Hanson was appointed as a director of the Company on 1 January 2013.The Company issued 74,000,000 shares on 13 March 2013 pursuant to placement at 3.5 cents per share raising $2,590,000.DDV Gold Limited has signed an extension of the loan agreement with Brianna Holdings Pty Ltd to 31 July 2014. The loan is still able to be paid in advance at any time without penalty.There has not arisen in the interval between the end of the fi nancial year and the date of this report any other item, transaction or event of a material or unusual nature likely, in the opinion of the directors of the Company, to affect signifi cantly the operations of the Group, the results of those operations, or the state of affairs of the Group, in future fi nancial years.
NOTE 27: FINANCIAL INSTRUMENTS RISK EXPOSURESOverviewThe Group has exposure to the following risks from their use of fi nancial instruments:• credit risk• liquidity risk• market risk.This note presents information about the Group’s exposure to each of the above risks, the objectives, policies and processes for measuring and managing risk, and the management of capital.Risk management frameworkThe directors have overall responsibility for the establishment and oversight of the Group’s risk management framework. Risk management policies are established to identify and analyse the risks faced, to set appropriate risk limits and controls, and to monitor risks and adherence to limits. Risk management policies and systems are reviewed regularly to refl ect changes in market conditions and the Group’s activities.
CONSOLIDATED
2012 2011
$ $
For
per
sona
l use
onl
y
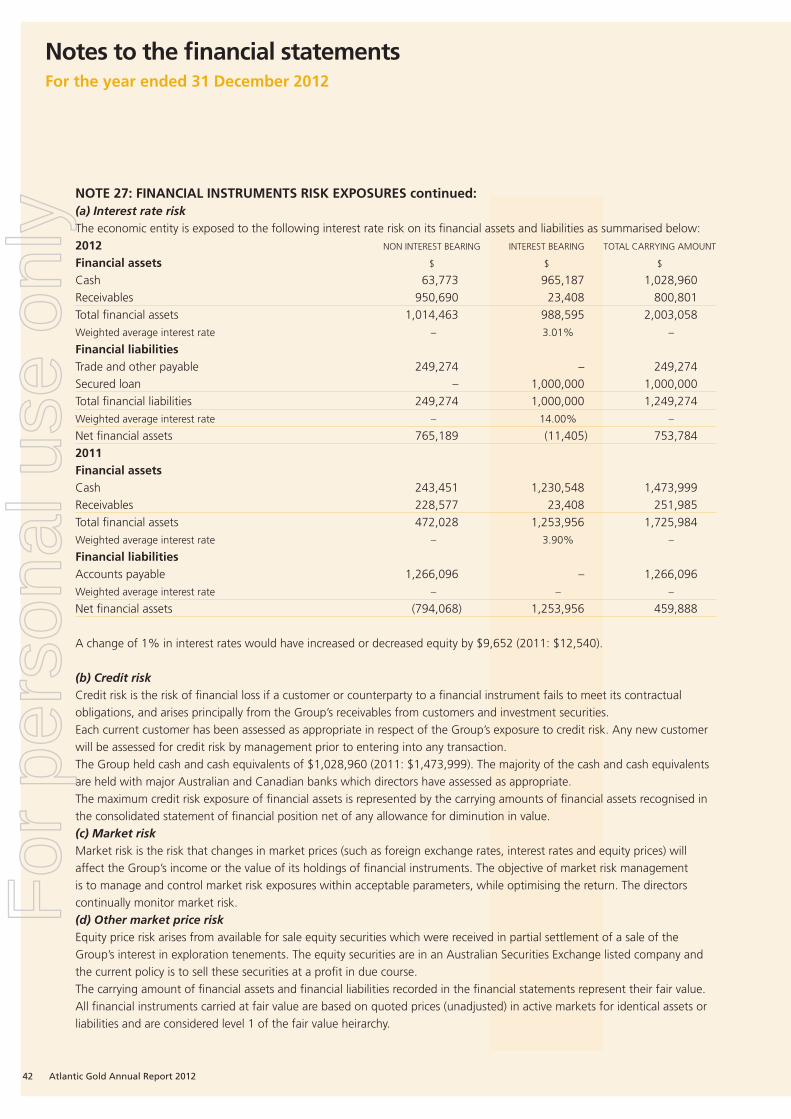
42 Atlantic Gold Annual Report 2012
NOTE 27: FINANCIAL INSTRUMENTS RISK EXPOSURES continued:(a) Interest rate riskThe economic entity is exposed to the following interest rate risk on its fi nancial assets and liabilities as summarised below:2012 NON INTEREST BEARING INTEREST BEARING TOTAL CARRYING AMOUNT
Financial assets $ $ $
Cash 63,773 965,187 1,028,960Receivables 950,690 23,408 800,801Total fi nancial assets 1,014,463 988,595 2,003,058Weighted average interest rate – 3.01% –
Financial liabilitiesTrade and other payable 249,274 – 249,274Secured loan – 1,000,000 1,000,000Total fi nancial liabilities 249,274 1,000,000 1,249,274Weighted average interest rate – 14.00% –
Net fi nancial assets 765,189 (11,405) 753,7842011Financial assetsCash 243,451 1,230,548 1,473,999Receivables 228,577 23,408 251,985Total fi nancial assets 472,028 1,253,956 1,725,984Weighted average interest rate – 3.90% –
Financial liabilitiesAccounts payable 1,266,096 – 1,266,096Weighted average interest rate – – –
Net fi nancial assets (794,068) 1,253,956 459,888
A change of 1% in interest rates would have increased or decreased equity by $9,652 (2011: $12,540).
(b) Credit riskCredit risk is the risk of fi nancial loss if a customer or counterparty to a fi nancial instrument fails to meet its contractual obligations, and arises principally from the Group’s receivables from customers and investment securities. Each current customer has been assessed as appropriate in respect of the Group’s exposure to credit risk. Any new customer will be assessed for credit risk by management prior to entering into any transaction. The Group held cash and cash equivalents of $1,028,960 (2011: $1,473,999). The majority of the cash and cash equivalents are held with major Australian and Canadian banks which directors have assessed as appropriate.The maximum credit risk exposure of fi nancial assets is represented by the carrying amounts of fi nancial assets recognised in the consolidated statement of fi nancial position net of any allowance for diminution in value.(c) Market riskMarket risk is the risk that changes in market prices (such as foreign exchange rates, interest rates and equity prices) will affect the Group’s income or the value of its holdings of fi nancial instruments. The objective of market risk management is to manage and control market risk exposures within acceptable parameters, while optimising the return. The directors continually monitor market risk.(d) Other market price riskEquity price risk arises from available for sale equity securities which were received in partial settlement of a sale of the Group’s interest in exploration tenements. The equity securities are in an Australian Securities Exchange listed company and the current policy is to sell these securities at a profi t in due course.The carrying amount of fi nancial assets and fi nancial liabilities recorded in the fi nancial statements represent their fair value. All fi nancial instruments carried at fair value are based on quoted prices (unadjusted) in active markets for identical assets or liabilities and are considered level 1 of the fair value heirarchy.
Notes to the fi nancial statementsFor the year ended 31 December 2012
For
per
sona
l use
onl
y
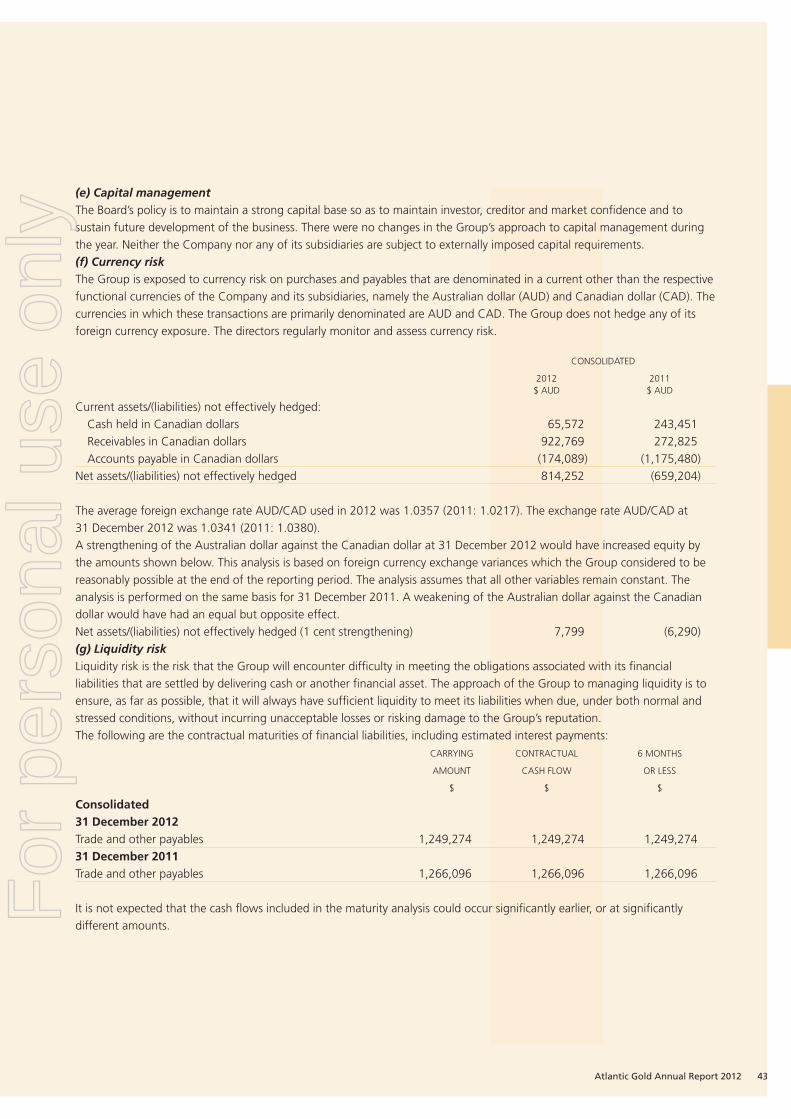
Atlantic Gold Annual Report 2012 43
(e) Capital managementThe Board’s policy is to maintain a strong capital base so as to maintain investor, creditor and market confi dence and to sustain future development of the business. There were no changes in the Group’s approach to capital management during the year. Neither the Company nor any of its subsidiaries are subject to externally imposed capital requirements.(f) Currency riskThe Group is exposed to currency risk on purchases and payables that are denominated in a current other than the respective functional currencies of the Company and its subsidiaries, namely the Australian dollar (AUD) and Canadian dollar (CAD). The currencies in which these transactions are primarily denominated are AUD and CAD. The Group does not hedge any of its foreign currency exposure. The directors regularly monitor and assess currency risk.
CONSOLIDATED
2012 2011 $ AUD $ AUD
Current assets/(liabilities) not effectively hedged: Cash held in Canadian dollars 65,572 243,451 Receivables in Canadian dollars 922,769 272,825 Accounts payable in Canadian dollars (174,089) (1,175,480)Net assets/(liabilities) not effectively hedged 814,252 (659,204)
The average foreign exchange rate AUD/CAD used in 2012 was 1.0357 (2011: 1.0217). The exchange rate AUD/CAD at 31 December 2012 was 1.0341 (2011: 1.0380).A strengthening of the Australian dollar against the Canadian dollar at 31 December 2012 would have increased equity by the amounts shown below. This analysis is based on foreign currency exchange variances which the Group considered to be reasonably possible at the end of the reporting period. The analysis assumes that all other variables remain constant. The analysis is performed on the same basis for 31 December 2011. A weakening of the Australian dollar against the Canadian dollar would have had an equal but opposite effect.Net assets/(liabilities) not effectively hedged (1 cent strengthening) 7,799 (6,290)(g) Liquidity riskLiquidity risk is the risk that the Group will encounter diffi culty in meeting the obligations associated with its fi nancial liabilities that are settled by delivering cash or another fi nancial asset. The approach of the Group to managing liquidity is to ensure, as far as possible, that it will always have suffi cient liquidity to meet its liabilities when due, under both normal and stressed conditions, without incurring unacceptable losses or risking damage to the Group’s reputation.The following are the contractual maturities of fi nancial liabilities, including estimated interest payments: CARRYING CONTRACTUAL 6 MONTHS
AMOUNT CASH FLOW OR LESS
$ $ $
Consolidated31 December 2012Trade and other payables 1,249,274 1,249,274 1,249,27431 December 2011Trade and other payables 1,266,096 1,266,096 1,266,096
It is not expected that the cash fl ows included in the maturity analysis could occur signifi cantly earlier, or at signifi cantly different amounts.F
or p
erso
nal u
se o
nly

44 Atlantic Gold Annual Report 2012
Directors’ declaration
In the opinion of the Directors of Atlantic Gold NL (the Company):
1 the consolidated fi nancial statements and notes and the Remuneration report in the Directors’ report are in accordance with the Corporations Act 2001, including:
(a) giving a true and fair view of the fi nancial position of the Consolidated Entity as at 31 December 2012 and of its performance for the year ended on that date; and
(b) complying with Australian Accounting Standards (including the Australian Accounting Interpretations) and the Corporations Regulations 2001; and
2 there are reasonable grounds to believe that the Company will be able to pay its debts as and when they become due and payable.
3 Th e directors have been given the declarations required by section 295A of the Corporations Act 2001 from the executive director and the chief fi nancial offi cer for the fi nancial year ended 31 December 2012.
4 Th e directors draw attention to note 1(a) to the consolidated fi nancial statements, which includes a statement of compliance with International Financial Reporting Standards.
Signed in accordance with a resolution of the Directors.
Walter R BucknellDirector
Sydney, 26 March 2013
For
per
sona
l use
onl
y

Atlantic Gold Annual Report 2012 45
Independent auditor’s report
Report on the fi nancial reportWe have audited the accompanying fi nancial report of Atlantic Gold NL (the Company), which comprises the consolidated statement of fi nancial position as at 31 December 2012, and consolidated statement of comprehensive income, consolidated statement of changes in equity and consolidated statement of cash fl ows for the year ended on that date, notes 1 to 27 comprising a summary of signifi cant accounting policies and other explanatory information and the directors’ declaration of the Group comprising the Company and the entities it controlled at the year’s end or from time to time during the fi nancial year.
Directors’ responsibility for the fi nancial report Th e directors of the Company are responsible for the preparation of the fi nancial report that gives a true and fair view in accordance with Australian Accounting Standards and the Corporations Act 2001 and for such internal control as the directors determine is necessary to enable the preparation of the fi nancial report that is free from material misstatement whether due to fraud or error. In note 1, the directors also state, in accordance with Australian Accounting Standard AASB 101 Presentation of Financial Statements, that the fi nancial statements of the Group comply with International Financial Reporting Standards.
Auditor’s responsibilityOur responsibility is to express an opinion on the fi nancial report based on our audit. We conducted our audit in accordance with Australian Auditing Standards. Th ese Auditing Standards require that we comply with relevant ethical requirements relating to audit engagements and plan and perform the audit to obtain reasonable assurance whether the fi nancial report is free from material misstatement.
An audit involves performing procedures to obtain audit evidence about the amounts and disclosures in the fi nancial report. Th e procedures selected depend on the auditor’s judgement, including the assessment of the risks of material misstatement of the fi nancial report, whether due to fraud or error. In making those risk assessments, the auditor considers internal control relevant to the entity’s preparation of the fi nancial report that gives a true and fair view in order to design audit procedures that are appropriate in the circumstances, but not for the purpose of expressing an opinion on the eff ectiveness of the entity’s internal control. An audit also includes evaluating the appropriateness of accounting policies used and the reasonableness of accounting estimates made by the directors, as well as evaluating the overall presentation of the fi nancial report.
We performed the procedures to assess whether in all material respects the fi nancial report presents fairly, in accordance with the Corporations Act 2001 and Australian Accounting Standards, a true and fair view which is consistent with our understanding of the Group’s fi nancial position and of its performance.
We believe that the audit evidence we have obtained is suffi cient and appropriate to provide a basis for our audit opinion.
IndependenceIn conducting our audit, we have complied with the independence requirements of the Corporations Act 2001.
Auditor’s opinionIn our opinion:1 the fi nancial report of the Group is in accordance with the Corporations Act 2001, including:
(a) giving a true and fair view of the Group’s fi nancial position as at 31 December 2012 and of its performance for the year ended on that date; and
(b) complying with Australian Accounting Standards and the Corporations Regulations 2001.2 the fi nancial report also complies with International Financial Reporting Standards as disclosed in note 1.
to the members of Atlantic Gold NLF
or p
erso
nal u
se o
nly

46 Atlantic Gold Annual Report 2012
Report on the remuneration reportWe have audited the Remuneration Report included in the directors’ report for the year ended 31 December 2012. Th e directors of the company are responsible for the preparation and presentation of the remuneration report in accordance with Section 300A of the Corporations Act 2001. Our responsibility is to express an opinion on the remuneration report, based on our audit conducted in accordance with auditing standards.
Auditor’s opinionIn our opinion, the remuneration report of Atlantic Gold NL for the year ended 31 December 2012, complies with Section 300A of the Corporations Act 2001.
KPMG
Shane O’Connor, Partner
Sydney, 26 March 2013
Independent auditor’s reportto the members of Atlantic Gold NL continued
For
per
sona
l use
onl
y
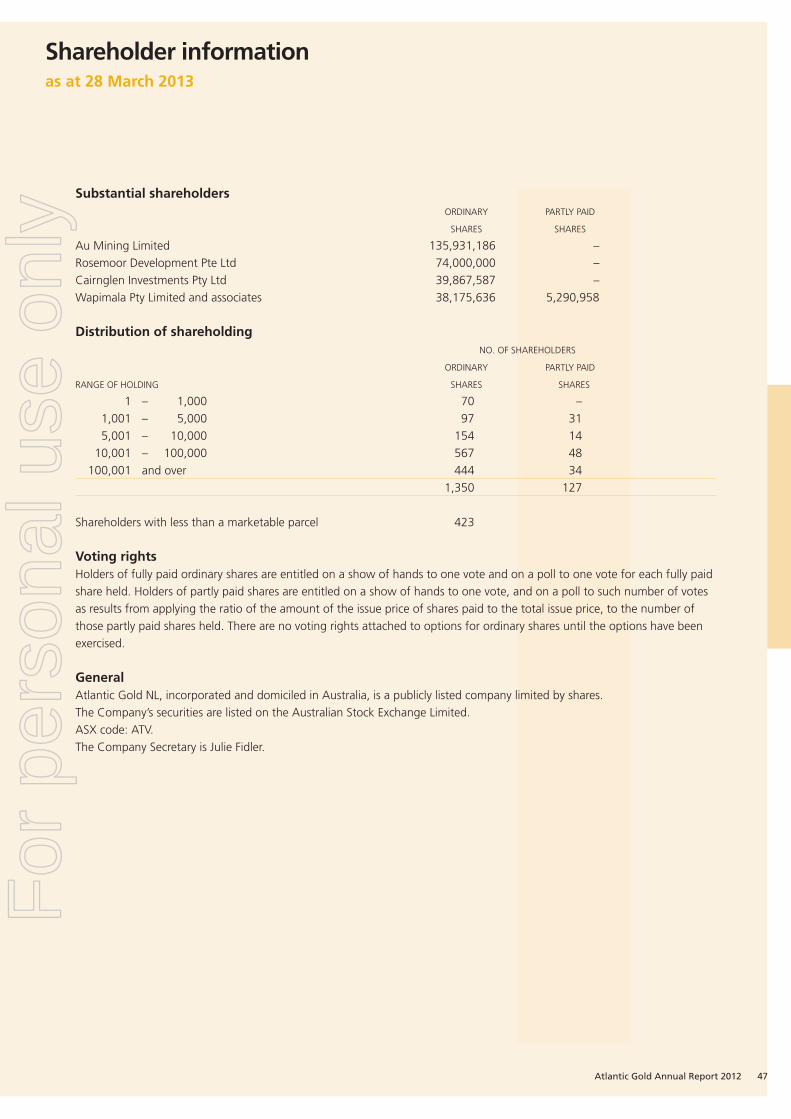
Shareholder informationas at 28 March 2013
Atlantic Gold Annual Report 2012 47
Substantial shareholders ORDINARY PARTLY PAID
SHARES SHARES
Au Mining Limited 135,931,186 –Rosemoor Development Pte Ltd 74,000,000 –Cairnglen Investments Pty Ltd 39,867,587 –Wapimala Pty Limited and associates 38,175,636 5,290,958
Distribution of shareholding NO. OF SHAREHOLDERS
ORDINARY PARTLY PAID
RANGE OF HOLDING SHARES SHARES
1 – 1,000 70 – 1,001 – 5,000 97 31 5,001 – 10,000 154 14 10,001 – 100,000 567 48 100,001 and over 444 34 1,350 127 Shareholders with less than a marketable parcel 423
Voting rightsHolders of fully paid ordinary shares are entitled on a show of hands to one vote and on a poll to one vote for each fully paid share held. Holders of partly paid shares are entitled on a show of hands to one vote, and on a poll to such number of votes as results from applying the ratio of the amount of the issue price of shares paid to the total issue price, to the number of those partly paid shares held. There are no voting rights attached to options for ordinary shares until the options have been exercised.
GeneralAtlantic Gold NL, incorporated and domiciled in Australia, is a publicly listed company limited by shares.The Company’s securities are listed on the Australian Stock Exchange Limited.ASX code: ATV.The Company Secretary is Julie Fidler.
For
per
sona
l use
onl
y

48 Atlantic Gold Annual Report 2012
Shareholder information
Twenty largest shareholdersOrdinary fully paid shares
RANK NAME NUMBER PERCENTAGE
1 Au Mining Limited 135,931,186 18.28 2 Rosemoor Development Pte Ltd 74,000,000 9.95 3 Cairnglen Investments Pty Ltd 39,867,587 5.36 4 Mr Peter Hing Woon Chen 32,600,000 4.38 5 Australian Pioneer Pty Ltd 27,297,636 3.67 6 Mr Kim Wan Loke 20,000,000 2.69 7 Lonway Pty Limited 19,400,109 2.61 8 Regency Hallmarks Holdings Pty Ltd 18,942,393 2.55 9 Wapimala Pty Limited 18,775,527 2.53 10 Macquarie Bank Limited 15,548,074 2.80 11 Forsyth Barr Custodians Limited 13,399,136 1.80 12 Mr Gee Ho James Hong 11,850,832 1.59 13 Mr Ronald Joseph Hawkes 8,314,168 1.12 14 Callisten Pty Ltd 7,415,492 1.00 15 Funding Securities Pty Ltd 6,400,000 0.86 16 Mr Donald Ross MacLeod and Ms Parry Imberlong 4,277,621 0.77 17 Dr Kok Kian Lim 4,912,000 0.66 18 Century Three x Seven Resource Fund Inc. 4,673,534 0.63 19 HSBC Custody Nominees (Australia) Limited 4,200,862 0.57 20 Dr Dean Andary 4,102,699 0.55 TOTAL 472,788,460 63.59Percentage holding of twenty largest shareholders is 63.59%.Total ordinary fully paid shares on issue at 28 March 2013: 743,445,494 shares.
as at 28 March 2013
Twenty largest shareholdersOrdinary partly paid shares RANK NAME NUMBER PERCENTAGE
1 Regency Hallmarks Holdings Pty Ltd 5,750,000 18.99 2 Wapimala Pty Limited 5,290,958 17.47 3 Mr Brent David Connolly 2,704,639 8.93 4 Rare Earths & Minerals Pty Ltd 2,046,300 6.76 5 Mr Nosherwan Byram Irani 1,265,250 4.18 6 Ms Antonia Louise Catto 1,046,582 3.46 7 Callisten Pty Ltd 1,036,860 3.42 8 Graham Charles Powell 1,015,000 3.35 9 Brianna Holdings Pty Limited 755,600 2.49 10 Batoka Pty Ltd 680,259 2.25 11 Andamax Investments Pty Ltd 563,334 1.86 12 Dr Dean Andary 520,734 1.72 13 Marketglobe (IOM) Limited 466,667 1.54 14 Ms Annabel Peta Sophie Catto 450,480 1.49 15 Mrs Susan Holt 400,000 1.32 16 Marne Street Pty Ltd 400,000 1.32 17 Mr Leon Trevelyan Mitchell 375,000 1.24 18 Mrs Liliana Teofi lova 340,000 1.12 19 Mr Rodney John Hanson 330,732 1.09 20 Technica Pty Ltd 275,000 0.91 TOTAL 25,713,395 84.92 Percentage holding of twenty largest shareholders is 84.92%.Total ordinary partly paid shares on issue at 28 March 2013: 30,286,342 shares.
For
per
sona
l use
onl
y

DirectorsRonald J HawkesNon-Executive ChairmanWalter R BucknellExecutive DirectorRobert H N SymonsNon-Executive DirectorRodney J HansonNon-Executive Director
Company secretaryJulie Fidler
Registered offi ce andprincipal place of businessSuite 506 815 Pacifi c HighwayChatswood NSW 2067 AustraliaPh: 02-9410 0993Fax: 02-9410 0958
Websitewww.atlanticgold.com.au
Share registryComputershare Investor Services Pty LtdLevel 3 60 Carrington StreetSydney NSW 2000
SolicitorsNorton Rose AustraliaRACV Tower, 485 Bourke StreetMelbourne Vic 3000
AuditorKPMG10 Shelley StreetSydney NSW 2000
BankersWestpac Banking Corporation60 Martin PlaceSydney NSW 2000
Corporate directory
List of mining tenementsas at 28 March 2013
PROJECT TENEMENT NUMBER INTEREST
Nova Scotia, CanadaTouquoy 1 Mineral Lease (8 km2) 60% 1 exploration licence (8 km2) 60%Cochrane Hill 1 exploration licence (8 km2) 100%Regional 83 exploration licences (360 km2) 100% 11 optioned exploration licences (42 km2) 0%
For
per
sona
l use
onl
y

ATLA
NTIC
GO
LD N
L AN
NU
AL R
EPOR
T 2012 AB
N 82 062 091 909 w
ww
.atlanticg
old
.com
.au
For
per
sona
l use
onl
y