Embed Size (px)
Citation preview

ANNUAL REPORT
ABN: 40 125 578 743
www.spitfi reresources.com
For
per
sona
l use
onl
y

For
per
sona
l use
onl
y

CORPORATE DIRECTORY AND CONTENTS
2
DIRECTORS & OFFICERS James Hamilton Executive Chairman Russell Hardwick Non-Executive Director Ian Huitson Non-Executive Director COMPANY SECRETARY Russell Hardwick REGISTERED OFFICE 41 York Street SUBIACO WA 6008 P: + 61 8 6382 3700 F: + 61 8 6382 3777 LEGAL ADVISORS Steinepreis Paganin Level 4, Next Building 16 Milligan Street PERTH WA 6000 P: + 61 8 9321 4000 F: + 61 8 9321 4333
AUSTRALIAN SECURITIES EXCHANGE The Company has shares and options listed on the Australian Securities Exchange. ASX Code: SPI, SPIOA EXPLORATION CONSULTANT Stuart Peterson BSc MAusIMM AUDITORS Bentleys Level 1, 12 Kings Park Road WEST PERTH WA 6005 P: + 61 8 9226 4500 F: + 61 8 9226 4300 SHARE REGISTRY Security Transfers Registrars Pty Ltd 770 Canning Highway APPLECROSS WA 6153 P: + 61 8 9315 2333 F: + 61 8 9315 2233
CONTENTS
Corporate Directory .............................................................................................................................................................................
Chairman’s Report ...............................................................................................................................................................................
Review of Operations ..........................................................................................................................................................................
Directors' Report .................................................................................................................................................................................
Auditor’s Independence Declaration ...............................................................................................................................................
Financial Statements ...........................................................................................................................................................................
Directors' Declaration.........................................................................................................................................................................
Independent Audit Report ................................................................................................................................................................
ASX Additional Information .............................................................................................................................................................
3
3
4
6
17
33
34
70
71
73
For
per
sona
l use
onl
y

CHAIRMAN’S REPORT
3
Dear Shareholder, I am pleased to present the 2015 Annual Report for Spitfire Resources (‘Spitfire’ or ‘the Company’). In recent years I have provided plenty of commentary around the Australian junior resources sector and the fact that we are enduring a long and brutal bear market. Therefore it gives me no pleasure at all to report again this year that many of my key negative observations about the market still stand true. Indeed, the situation may now be worse. Put simply, a toxic cocktail of record low commodity prices, negative industry sentiment and a vastly diminished appetite for risk by those with capital has punished values in the Australian mining and exploration sector. It appears very few companies have been able to escape the claws of the bear in 2015 and, generally speaking, resource company share prices remain depressed across the board. Whilst more optimistic observers are now calling the bottom of the bear cycle, those who label themselves pragmatists are still wondering just how long this run along the bottom will continue and exactly when prices and sentiment will start heading north again. So what can be done? As Winston Churchill is often claimed to have said: “If you’re going through hell, keep going.” That has certainly been Spitfire’s mantra this year as we’ve kept our discipline throughout these difficult times, carefully husbanding our resources and keenly managing our overheads. We have also worked particularly hard to find new growth opportunities for the Company which are outside traditional resource investment norms. Spitfire has been looking at projects that are not only different but also offer the potential to access new pools of money and fresh investor interest. It is with this in mind that I am pleased to report that just prior to writing this review, Spitfire shareholders approved a new pathway for the Company via the acquisition of the White Lion limestone project in Zambia. White Lion sits on a granted Large Scale Mining Licence covering 245 square kilometres and is located approximately 100km (by sealed road) from the Zambian capital Lusaka. Interpretive work from airborne geophysical surveys and preliminary ground mapping and sampling shows that the limestone deposition outcrops at surface and covers a massive area of approximately 60 square kilometres. Spitfire believes the size and strategic nature of White Lion is such that it can support a multi-pronged development approach. Primarily this consists of sampling, drilling and scoping work on the project to support a large cement works. In addition, we plan to explore the supply of aggregates and construction materials as an integrated business to generate cash flow until the cement works plans are further progressed, providing a low cost entry into the sector. To reiterate, one of the key reasons Spitfire has moved away from traditional metals to construction materials is to find clear promotional air. International investors in Europe, Africa and China are very interested in emerging market opportunities (particularly those in Africa) and like the construction/infrastructure space.
4
For
per
sona
l use
onl
y

CHAIRMAN’S REPORT
4
Spitfire’s preliminary outreach campaigns to those with existing exposure to the sector have been warmly received, and we look forward to showcasing White Lion to more parties in the near future. We believe their interest and possible investment will go a long way to reinvigorating your company’s shareholder base. In conclusion, I’m pleased to say that Spitfire is flying out of the dark clouds of 2015 and into a new financial year full of optimism. We have a strong balance sheet with $2.7 million in cash at 30 June, no debt, an exciting new project to get on with and a well-connected management team. Finally, I would like to take this opportunity to thank my fellow Directors for their hard work during the year. I also thank our shareholders for their support and patience. Yours faithfully,
James Hamilton Executive Chairman
5
For
per
sona
l use
onl
y
DIRECTORS’ REPORT
5
REVIEW OF OPERATIONS
SOUTH WOODIE WOODIE MANGANESE PROJECT
The South Woodie Woodie Manganese Project comprises 12 granted Exploration Licences covering a total area of more than 600 square kilometres in Western Australia’s East Pilbara Manganese Province. The tenements lie along strike and to the south of the Woodie Woodie Manganese Mining Centre (operated by Consolidated Minerals Limited), in close proximity to several emerging manganese projects. During the year Spitfire Resources Limited (‘Spitfire’ or ‘the Company’) drilled 38 reverse circulation holes at the project. The drilling was concentrated on the western side of tenement E46/835 (now referenced by the Company as ‘the Western Front’). Until now this area has had no previous exploration. Assays from the Western Front returned a number of near-surface intersections including:
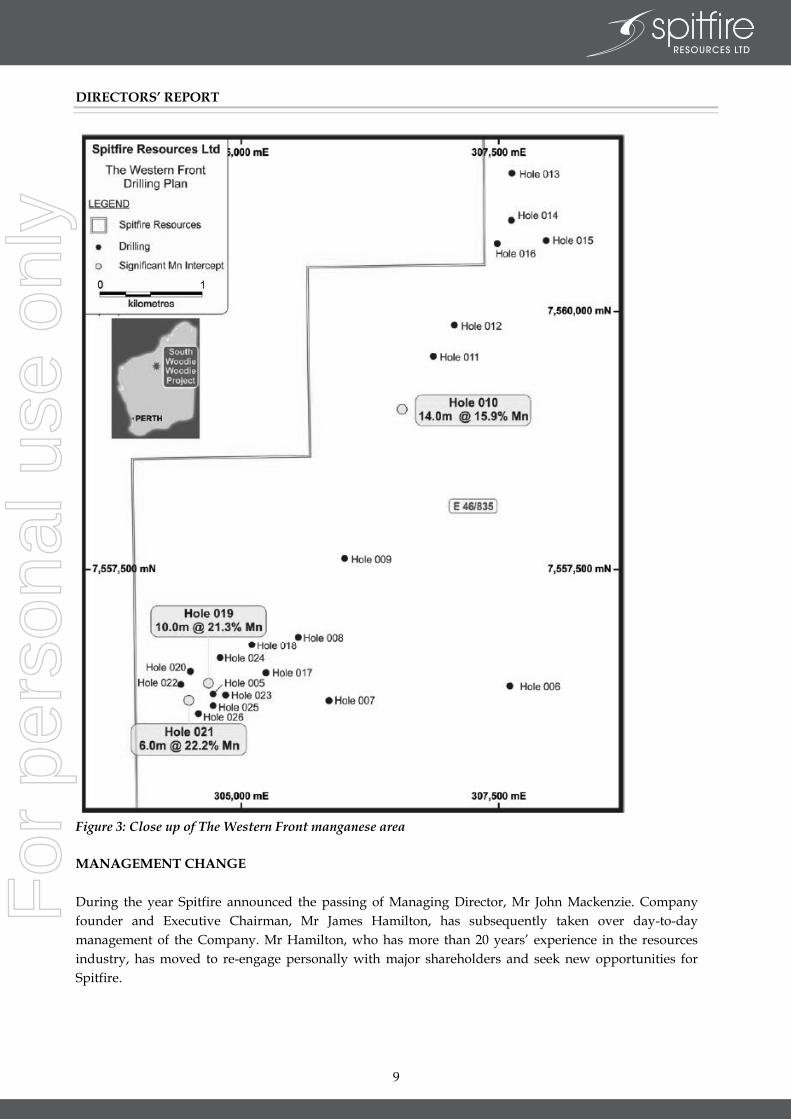
Hole no. 021: 6m @ 22.2%Mn from 43m, including 4m @ 26.9%Mn; Hole no. 019: 10m @ 21.3%Mn from 43m, including 5m @ 25.0%Mn; & Hole no. 010: 14m @ 15.9%Mn from 51m, including 3m @ 22.0%Mn.
(Full details showing all drilling collar locations are shown in Appendix 1. A plan projection of the Western Front target area is shown on Figures 2 & 3.) The Western Front exhibits no surface manganese signature but was identified as prospective following radiometric, geophysical and geological structure analysis of certain areas based on similarities in composition to the anomalies found at Spitfire’s Contact/Contact North deposit. The distance between the intercepts at drill hole 19 and 21 to drill hole number 10 is approximately 3.3km. This represents a large area that could potentially host more manganese discoveries. However, despite the excellent drilling results at the Western Front, Spitfire has decided to suspend further fieldwork at South Woodie Woodie due to the current lack of investment community interest in greenfields mineral exploration. This position has been reinforced by the fall in the price of manganese, which during the year dropped from $4.45 per dry metric tonne unit to $3.10/dmtu. Currently the short to mid-term price outlook for manganese remains depressed given the slowing of China’s steel production. China is the world’s biggest importer of manganese ore, which is a critical feedstock in the making of specialty steels. Consequently, Spitfire has put the South Woodie Woodie project up for joint venture or possible sale but to date has failed to receive offers that fully acknowledge the potential future value of the project. Because of this, the Company will retain the project until market conditions improve and will cut its holding costs by reducing its land position in the Pilbara to the most prospective areas and those with drilled resources.
6
For
per
sona
l use
onl
y

DIRECTORS’ REPORT
6
Figure 1. South Woodie Woodie tenement map
7
For
per
sona
l use
onl
y

DIRECTORS’ REPORT
7
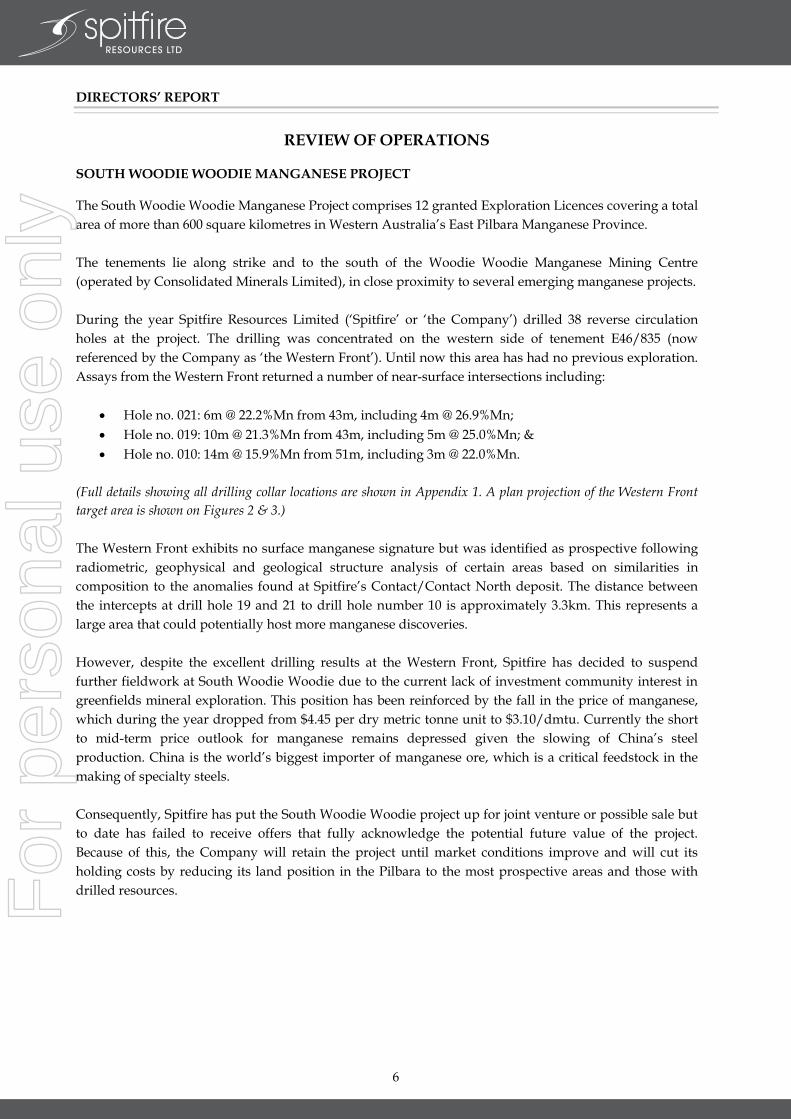
Figure 2. The Western Front manganese area
8
For
per
sona
l use
onl
y
DIRECTORS’ REPORT
8
Figure 3: Close up of The Western Front manganese area MANAGEMENT CHANGE
During the year Spitfire announced the passing of Managing Director, Mr John Mackenzie. Company founder and Executive Chairman, Mr James Hamilton, has subsequently taken over day-to-day management of the Company. Mr Hamilton, who has more than 20 years’ experience in the resources industry, has moved to re-engage personally with major shareholders and seek new opportunities for Spitfire.
DIRECTORS’ REPORT
7
Figure 2. The Western Front manganese area
9
For
per
sona
l use
onl
y

DIRECTORS’ REPORT
9
WHITE LION LIMESTONE PROJECT ACQUISITION
Subsequent to the reporting period, and following a General Meeting, Spitfire announced that its shareholders had approved the acquisition of the White Lion limestone project in Zambia. The White Lion limestone project is located approximately 100km North West from the Zambian capital Lusaka. It sits on a granted Large Scale Mining Licence (14948-HQ-LML) and covers a total area of 245 square kilometres. Initial mapping and airborne surveys of the White Lion project indicate that the large, flat lying limestone deposition covers an area of approximately 60 square kilometres. Planning for a series of mapping, sampling and drilling programs is well underway, with Spitfire personnel expected to start sampling work in September. Strong GDP growth across Africa is driving infrastructure developments and therefore strong cement and construction material demand. This is particularly true for Zambia where GDP and construction growth have been most robust. The White Lion acquisition is designed to build on this growth and to establish itself as a future key construction materials supplier for the region. The upfront consideration for the White Lion acquisition was $A2.1 million in fully paid ordinary Spitfire Resources shares based on a 30 day weighted average price. These shares are escrowed for 12 months in accordance with Chapter 9 of the ASX Listing Rules. A second conditional payment of A$4.2 million in fully paid ordinary Spitfire Resources shares will be paid when not less than 80 million tonnes of limestone is delineated into an inferred JORC resource and upon the Company receiving a Scoping Study that demonstrates the potential for a large scale, long life, economic limestone orebody to be developed and mined; and the Board resolving to proceed with the development of the project. With the acquisition has come access to an in-country development team with more than four years’ experience in Zambia. Spitfire personnel have also been given access to office and operational infrastructure in Johannesburg, Lusaka and at the White Lion exploration site. Given the change in direction, Spitfire’s management has begun a coordinated program of communication with industry participants. This first phase has involved introductory meetings with individuals, funds and brokers who are African-focused and construction materials-savvy. This program, directed at predominantly international groups, will be ramped up as part of a strategy to reinvigorate the Company’s shareholder base.
10
For
per
sona
l use
onl
y

DIRECTORS’ REPORT
10
Figure 1. White Lion location map.
Figure 2. Industrial minerals geologist Robert Barnett inspecting a large limestone outcrop at the White Lion project.
11
For
per
sona
l use
onl
y

DIRECTORS’ REPORT
12
RESOURCE STATEMENT The following sets out a summary of the resources at the South Woodie Woodie manganese project in the East Pilbara region of Western Australia. Contact and Contact North deposits situated on the E46/787
JORC Inferred Resource Mt Mn% Al203 % Fe % Si02% P % LOI
(1000) Contact 2.8 13.6 5.1 15.7 42.9 0.054 8.4
Contact North 8.5 15.4 3.0 15.0 42.4 0.057 8.6
Contact & Contact North Combined 11.3 15.0 3.5 15.2 42.5 0.057 8.5
Contact & Contact North combined deposit summary @ 10.1% Mn Cut off Tally-Ho deposit situated on the E46/616
JORC Inferred Resource Mt Mn% Al203 % Fe % Si02% P % LOI
(1000) Tally-Ho 2.9 7.1 6.7 9.1 62.9 0.043 7.95
The Project hosts combined JORC (2004) Inferred Mineral Resources of **14.2Mt @ 13.3% Mn from within three defined deposits. JORC Inferred Resource Mt Mn% Al203 % Fe % Si02% P % LOI
(1000) Contact 2.8 13.6 5.1 15.7 42.9 0.054 8.4
Contact North 8.5 15.4 3.0 15.0 42.4 0.057 8.6
Tally-Ho 2.8 13.6 5.1 15.7 42.9 0.054 7.95
Total 14.2 13.3 4.2 13.9 46.7 0.053 8.45
Weighted average summary of combined mineral resource estimates for deposits at South Woodie Woodie The Inferred resources for the Tally-Ho and the Contact/Contact North deposits have not changed since their initial release in 2009 and 2011 respectively. They were reported under the 2004 JORC code and, due to no additional work being performed since their release, have not been updated to the 2012 JORC requirements If further work is performed on these deposits which changes the current resource standing, they will then be updated to the 2012 JORC reporting standards. Beneficiation test work undertaken to date indicates that manganese from the two main deposits, Contact and Contact North, is able to be upgraded to a saleable manganese product of ~40% Mn. SUMMARY OF GOVERNANCE AND INTERNAL CONTROLS The resources detailed in this report are subject to strict quality controls as part of Spitfire’s internal governance. The Contact/Contact North deposit resource model was created by Widenbar and Associates and the Tally-Ho resource model was created by Optiro Ltd. Both of the deposits have been independently validated during the resource building stage to meet the required industry QAQC standards prior to release.
DIRECTORS’ REPORT
11
Figure 3. This existing quarry has been mined to 10 metres depth for road base – sampling shows it contains cement grade limestone and that the mineralisation is open in all directions and at depth.
Figure 4. Outcropping limestone is abundant at White Lion. The estimated size of the deposition is 60 square kilometres.
12
For
per
sona
l use
onl
y

DIRECTORS’ REPORT
12
RESOURCE STATEMENT The following sets out a summary of the resources at the South Woodie Woodie manganese project in the East Pilbara region of Western Australia. Contact and Contact North deposits situated on the E46/787
JORC Inferred Resource Mt Mn% Al203 % Fe % Si02% P % LOI
(1000) Contact 2.8 13.6 5.1 15.7 42.9 0.054 8.4
Contact North 8.5 15.4 3.0 15.0 42.4 0.057 8.6
Contact & Contact North Combined 11.3 15.0 3.5 15.2 42.5 0.057 8.5
Contact & Contact North combined deposit summary @ 10.1% Mn Cut off Tally-Ho deposit situated on the E46/616
JORC Inferred Resource Mt Mn% Al203 % Fe % Si02% P % LOI
(1000) Tally-Ho 2.9 7.1 6.7 9.1 62.9 0.043 7.95
The Project hosts combined JORC (2004) Inferred Mineral Resources of **14.2Mt @ 13.3% Mn from within three defined deposits. JORC Inferred Resource Mt Mn% Al203 % Fe % Si02% P % LOI
(1000) Contact 2.8 13.6 5.1 15.7 42.9 0.054 8.4
Contact North 8.5 15.4 3.0 15.0 42.4 0.057 8.6
Tally-Ho 2.8 13.6 5.1 15.7 42.9 0.054 7.95
Total 14.2 13.3 4.2 13.9 46.7 0.053 8.45
Weighted average summary of combined mineral resource estimates for deposits at South Woodie Woodie The Inferred resources for the Tally-Ho and the Contact/Contact North deposits have not changed since their initial release in 2009 and 2011 respectively. They were reported under the 2004 JORC code and, due to no additional work being performed since their release, have not been updated to the 2012 JORC requirements If further work is performed on these deposits which changes the current resource standing, they will then be updated to the 2012 JORC reporting standards. Beneficiation test work undertaken to date indicates that manganese from the two main deposits, Contact and Contact North, is able to be upgraded to a saleable manganese product of ~40% Mn. SUMMARY OF GOVERNANCE AND INTERNAL CONTROLS The resources detailed in this report are subject to strict quality controls as part of Spitfire’s internal governance. The Contact/Contact North deposit resource model was created by Widenbar and Associates and the Tally-Ho resource model was created by Optiro Ltd. Both of the deposits have been independently validated during the resource building stage to meet the required industry QAQC standards prior to release.
13
For
per
sona
l use
onl
y

DIRECTORS’ REPORT
13
CORPORATE & FINANCIAL SUMMARY
Spitfire recorded a pre-tax operating loss of $1,139,000 for the financial year. During the year Spitfire received a research and development tax rebate from the Australian Taxation Office totalling $949,289 for the 2013 financial year. In addition a claim was filed for a research and development tax rebate of $43,849 for the 2014 financial year. Significant expenditure items during the period include:
Exploration and evaluation costs of $425,571 (June 2014: $298,000) Consulting fees of $442,573 (June 2014: $626,000)
The group began the year with $2,939,000 in cash and ended the year with $2,735,262 in cash. Finally, I would like to thank my fellow Directors and Spitfire’s staff for their hard work and efforts during another challenging year for mineral exploration companies.
James Hamilton Executive Chairman Competent Person’s Statement SOUTH WOODIE WOODIE PROJECT The information in this report relating to exploration results and mineral resources is based on information compiled by Mr Stuart Peterson, the Company’s Consulting Exploration Manager, who is a Member of the Australian Institute of Mining and Metallurgy. This information in relation to mineral resources was prepared and first disclosed under the JORC Code 2004. It has not been updated since to comply with the JORC Code 2012 on the basis that the information has not materially changed since it was last reported. Mr Peterson has sufficient experience relevant to the style of mineralisation and to the type of activity described to qualify as a competent person as defined in the 2004 Edition of the ‘Australasian Code for Reporting of Exploration Results, Mineral Resources and Ore Reserves.’ WHITE LION LIMESTONE PROJECT The information in this report relating to exploration results and mineral resources is based on information compiled by Mr Stuart Peterson, the Company’s Consulting Exploration Manager, who is a Member of the Australian Institute of Mining and Metallurgy. Mr Peterson has sufficient experience relevant to the styles of mineralisation mentioned and to the type of activities described to qualify as a competent person as defined in the 2012 Edition of the ‘Australasian Code for Reporting of Exploration Results, Mineral Resources and Ore Reserves.’
14
For
per
sona
l use
onl
y

DIRECTORS’ REPORT
14
Appendix 1: Summary of drilling collar locations
Hole ID Easting Northing RL Dip Azimuth EOH Depth Hole 1 304515 7551862 346 ‐90 0 100 Hole 2 304561 7551888 343 ‐90 0 80 Hole 3 304541 7551951 345 ‐90 0 80 Hole 4 304388 7553746 357 ‐90 0 76 Hole 5 304728 7556286 348 ‐90 0 88 Hole 6 307606 7556363 336 ‐90 0 80 Hole 7 305854 7556222 352 ‐90 0 113 Hole 8 305557 7556839 356 ‐90 0 83 Hole 9 306002 7557609 356 ‐90 0 87 Hole 10 306562 7559055 354 ‐90 0 88 Hole 11 306866 7559568 354 ‐90 0 70 Hole 12 307068 7559870 353 ‐90 0 80 Hole 13 307625 7561352 353 ‐90 0 88 Hole 14 307622 7560891 353 ‐90 0 80 Hole 15 307961 7560697 353 ‐90 0 80 Hole 16 307485 7560667 353 ‐90 0 80 Hole 17 305242 7556492 354 ‐90 0 80 Hole 18 305104 7556767 354 ‐90 0 118 Hole 19 304686 7556396 353 ‐90 0 94 Hole 20 304509 7556505 353 ‐90 0 82 Hole 21 304492 7556228 353 ‐90 0 82 Hole 22 304417 7556382 353 ‐90 0 82 Hole 23 304852 7556276 353 ‐90 0 75 Hole 24 304796 7556641 353 ‐90 0 88 Hole 25 304730 7556175 353 ‐90 0 82 Hole 26 304586 7556096 346 ‐90 0 61 Hole 27 304546 7551994 343 ‐90 0 58 Hole 28 304702 7552233 346 ‐90 0 64 Hole 29 304267 7551825 343 ‐90 0 80 Hole 30 304468 7551722 362 ‐90 0 80 Hole 31 309122 7544160 362 ‐90 0 80 Hole 32 309369 7544078 362 ‐90 0 80 Hole 33 309355 7544172 362 ‐90 0 80 Hole 34 309484 7544176 363 ‐90 0 80 Hole 35 304565 7547025 382 ‐90 0 120 Hole 36 304580 7547075 380 ‐90 0 80 Hole 37 304747 7547293 379 ‐90 0 80 Hole 38 304847 7547421 377 ‐90 0 80
15
For
per
sona
l use
onl
y

DIRECTORS’ REPORT
15
Appendix 2: Schedule of Tenements
16
For
per
sona
l use
onl
y

DIRECTORS’ REPORT
16
The Directors of Spitfire Resources Limited submit herewith the Annual Report of the Company and its controlled entities (“Group”), for the period from 1 July 2014 to 30 June 2015. In order to comply with the provisions of the Corporations Act 2001, the Directors report as follows: 1. DIRECTORS The Directors in office of the Company at any time during or since the end of the financial year, unless otherwise stated, are:
Name, qualifications and independence status
Experience, special responsibilities and other Directorships in listed entities
James Hamilton MAICD Executive Chairman
Experience Mr Hamilton is an international business developer with more than 21 years’ experience in the resources sector specialising in the analysis of exploration projects, mines and management teams across a large spectrum of mineral commodities. He has founded three public resource companies both in Australia and the United Kingdom. During this time he has held senior roles in operations management, marketing, treasury, project development and corporate compliance. Mr Hamilton is a Member of the Australian Institute of Company Directors. Special responsibilities None Directorships held in other listed entities during the three years prior to the current year Nil Interest in shares and options 28,511,349 ordinary shares in Spitfire Resources Limited and options to acquire a further 4,722,222 ordinary shares.
Russell Hardwick BBus, ACIS, CPA, MAICD Director/Secretary
Experience Mr Hardwick is a Certified Practicing Accountant with 20 years’ experience in a variety of private and public companies. Mr Hardwick is a member of the Australian Institute of Company Directors and is a Chartered Secretary. Mr Hardwick has extensive experience in corporate secretarial, capital raising and commercial management. He has held the positions of Director or Company Secretary for both AIM-listed and ASX listed companies as well as Senior Executive positions within private companies. Special responsibilities Mr Hardwick is the chairman of the audit committee. Directorships held in other listed entities during the three years prior to the current year Director of UK ISDX listed Imperial Minerals Plc Interest in shares and options 8,586,626 ordinary shares in Spitfire Resources Limited and options to acquire a further 3,559,724 ordinary shares.
17
For
per
sona
l use
onl
y

DIRECTORS’ REPORT
17
Ian Huitson BEng, FAusIMM, CP(Min), MAICD Non-Executive Director
Experience Mr. Huitson, a qualified Mining Engineer has 30 years’ experience in operational and technical roles in the manganese, chromite, gold, silver and nickel mining industries in Australia. Ian has extensive manganese experience in Australia through roles as the Chief Operating Officer at Auvex Resources Ltd (2009-2011), Group Mining Engineer at Consolidated Minerals Ltd (2005-2007) and Resident Manager at Consolidated Minerals Ltd’s Woodie Woodie mine site (1999-2005). Special responsibilities Mr Huitson is a member of the audit committee. Directorships held in other listed entities during the three years prior to the current year Nil Interest in shares and options 2,099,337 ordinary shares in Spitfire Resources Limited and options to acquire a further 2,547,619 ordinary shares.
John Mackenzie (Ceased being a director on the 19th October 2014)
Mr Mackenzie passed away on the 19th October 2014.
2. COMPANY SECRETARY
Name and qualifications Particulars
Russell Hardwick BBus, ACIS CPA, MAICD
The Company Secretary is Mr Russell Hardwick. Mr Hardwick is a Certified Practicing Accountant and an Associate Member of the Institute of Chartered Secretaries. Mr Hardwick has also held the role of Company Secretary with other ASX listed companies for 14 years. Mr Hardwick has acted as the company secretary since 29th May 2007.
18
For
per
sona
l use
onl
y

DIRECTORS’ REPORT
18
3. DIRECTORS’ MEETINGS The following table sets out the number of Directors’ meetings held during the financial year and the number attended by each Director. During the financial year, six board meetings were held.
Director Meetings Audit Committee Meetings
Director Number entitled to attend
Attendance Number entitled to attend
Attendance
James Hamilton 6 6 - -
John Mackenzie 2 2 - -
Russell Hardwick 6 6 2 2
Ian Huitson 6 6 2 2 4. REMUNERATION REPORT This report details the background, policy and amount of remuneration for each key management person of Spitfire Resources Limited. 4.1 Remuneration Policy Key management personnel and Executive Directors have authority and responsibility for planning, directing and controlling the activities of the Company and the Group. Compensation levels for key management personnel and Secretary of the Company and Group are competitively set to attract and retain appropriately qualified and experienced Directors and Executives. The Board obtains independent advice as required on the appropriateness of compensation packages of both the Company and the Group given trends of comparative companies and the objectives of the Company’s compensation strategy. The compensation structures explained below are designed to attract suitably qualified candidates, reward the achievement of strategic objectives, and achieve the broader outcome of creation of value for shareholders. The compensation structures take into account:
The capability and experience of the key management personnel; Size of the Group; The key management personnel’s ability to control the performance; and The Group’s exploration success and identification of new investments
The performance of key management personnel is measured against criteria agreed annually with each Executive. The Board may exercise its discretion in relation to approving incentives, bonuses and options in line with individual performance, exploration results and the performance of the Group. The policy is designed to attract the highest calibre of Executives and reward them for performance that results in long-term growth in shareholder wealth. Key management personnel are also entitled to participate in the employee share option plan. Options are valued using the Black-Scholes methodology. The key management personnel receive superannuation guarantee contributions required by the government, which is currently 9.50% (2014: 9.25%) and do not receive any other retirement benefits.
19
For
per
sona
l use
onl
y

DIRECTORS’ REPORT
19
The Board policy is to remunerate Non-Executive Directors at market rates for time, commitment and responsibilities. Directors also provide consultancy services to the Company and are remunerated at market rates. The Board determines payments to the Non-Executive Directors and reviews their remuneration annually, based on market practice, duties and accountability. Independent external advice is sought when required. The maximum aggregate amount of fees that can be paid to Non-Executive Directors is subject to approval by shareholders at the Annual General Meeting. Fees for Non-Executive Directors are not linked to the performance of the Group. However, to align Directors’ interests with shareholder interests, the Directors are encouraged to hold shares in the Company. 4.2 Company performance, shareholder wealth and Director and Executive remuneration The remuneration policy has been tailored to increase goal congruence between Shareholders, Directors and Executives. As part of each of the key management personnel’s remuneration package, there is a performance-based component consisting of the issue of options to encourage the alignment of management and Shareholders’ interests. The Board determines appropriate option pricing that includes a premium over the prevailing share price to provide potential rewards over a period of time. Conditions in the junior resources sector remain challenging and the Company’s share price remained constant at $0.01 at 30 June 2015 and 30 June 2014. The result being that the incentive share options issued to Directors and Executives are currently significantly below the prevailing share price. A summary of the operating losses and share prices at year end for the last five years are as follows:
2011 2012 2013 2014 2015
Net Profit/(Loss) ($1,754,230) ($4,368,232) ($13,592,240) $369,022 ($1,095,101)
Share price at year end $0.165 $0.079 $0.012 $0.01 $0.01
This policy has been deemed by the Board to be the most appropriate performance-based compensation method for a company in the minerals exploration industry. 4.3 Key Management Personnel The remuneration structure for key management personnel and Executive Directors is based on a number of factors including length of service, particular experience of the individual concerned and the requirements and overall performance of the Company. The Company has entered into a consulting agreement with Goldregis Corporation Pty Ltd to provide the services of Mr James Hamilton to the Company which commenced on 19 November 2014 on a continuing basis with no fixed term. The agreement specifies the duties and obligations for the consultancy services including managing the business of the Company including strategic and tactical plans and managing operational functions; developing new opportunities and expanding the Company’s current activities and market share and formulating strategies to promote and improve the financial performance of the Company. The agreement contains normal termination clauses including the provision of three months’ notice by the Consultant. On termination of the agreement by the Company, for any reason except a serious breach of any of the provisions of the Agreement, the Company can give either three months’ notice and at the end of the three month period make a payment of three months standard consulting fees, or give notice immediately and make a payment of six months standard consulting fees.
20
For
per
sona
l use
onl
y
DIRECTORS’ REPORT
20
The Company has entered into a consulting agreement with Ravenhill Corporate Pty Ltd to provide the services of Mr Russell Hardwick to the Company. The agreement commenced on 1 February 2009 on a continuing basis with no fixed term. The agreement was amended on the 6 September 2013 to reduce the base remuneration. The agreement specifies the duties and obligations for the consultancy services including all aspects of provision of compliance with the ASX, ASIC and also the provision of general management consulting services. The agreement contains normal termination clauses including the Company or the consultant providing six months’ notice. On termination of the agreement by the Company, for any reason except a serious breach of any of the provisions of this Agreement committed by the consultant, the consultant shall be entitled to 12 months standard consulting fees. The employment agreements and contracts of service between the Company and any other key management and staff are on a continuing basis. The Company may terminate an employment contract by providing one month’s written notice or making payment in lieu of notice, based on the individual's annual salary component. Termination payments are generally not payable on resignation or dismissal for serious misconduct. In the instance of serious misconduct, the Company can terminate employment at any time. Fixed compensation Fixed compensation consists of base compensation (which is calculated on a total cost basis and includes any FBT charges related to employee benefits), as well as employer contributions to superannuation funds. Compensation levels are reviewed annually by the Board through a process that considers individual performance against agreed key performance indicators and the overall performance and exploration success of the Group. In addition, the Board refers to external consultants or publications as required to provide analysis and advice to ensure the Directors’ and Senior Executives’ compensation is competitive in the market place.
21
For
per
sona
l use
onl
y

DIRECTORS’ REPORT
21
Long-term incentive Options are issued under the Spitfire Employee Share Option Plan (ESOP) to employees. It provides for key management personnel to receive options over ordinary shares for no consideration. Any options issued to Directors require the approval of shareholders. The Board determines the proportion of fixed and variable compensation for each key Director and management personnel. The following table sets out the remuneration for the Directors and key management expensed during the 2015 financial year:
2015 Short Term Benefits Salaries
or Director
Fees
Consulting Fees
Performance Bonuses
Options Post-
Employment Super
Total
Value of options as
proportion of remuneration
$ $ $ $ $ $ % Executive Directors James Hamilton 7,552 186,558 - 9,351 - 203,461 4.6% John Mackenzie* - 72,493 - 2,860 - 75,353 3.8%
Non-Executive Directors Russell Hardwick ** 25,000 84,927 - 7,188 2,375 119,490 6.02% Ian Huitson 25,000 9,197 - 5,152 2,375 41,724 12.35% Executives Stuart Peterson - 103,331 - - - 103,331 0%
* Mr Mackenzie ceased being a director of Spitfire Resources Limited on 19th October 2014 ** Mr Hardwick also acts as the Company Secretary
22
For
per
sona
l use
onl
y

DIRECTORS’ REPORT
22
2014 Short Term Benefits Salaries
or Director
Fees
Consulting Fees
Performance Bonuses
Options Post-
Employment Super
Total
Value of options as
proportion of remuneration
$ $ $ $ $ $ % Executive Directors James Hamilton 27,500 61,800 - 12,920 - 102,220 12.64% John Mackenzie - 252,409 - 12,920 - 265,329 4.87%
Non-Executive Directors Russell Hardwick * 27,500 86,872 - 12,920 2,559 129,851 9.95% Ian Huitson 27,500 - - 8,614 2,559 38,673 22.27% Executives Stuart Peterson ** 80,105 56,831 - - 7,410 144,346 0%
* Mr Hardwick also acts as the Company Secretary ** Mr Peterson ceased full-time employment in November 2013 and subsequently continues to provide
consultancy services to the group. There are no specific performance hurdles attached to remuneration options, however the board determines a premium for the exercise price over the prevailing share price as appropriate. This ensures any future value for the remuneration options reflect an increase in value for all shareholders and provide rewards over a period of time. This has been determined as the most appropriate remuneration structure considering the size of the Company and its position in the junior resources industry. The following factors and assumptions were used in determining the fair value on the grant date of options previously granted to key management personnel and employees that vested during the year under the Spitfire Employee Share Option Plan. There were 6,500,000 options granted during the year ended 30 June 2015 (2014: nil)
Grant Date Option Life
Fair value per
option
Exercise price
Price of shares on grant date
Expected volatility
Risk free interest
rate
Dividend Yield
28 November 2014 5 $0.0049 $0.045 $0.015 66% 2.7% -
22 November 2012 5 $0.0192 $0.110 $0.047 70% 2.7% - 4.4 Share-based compensation The Company has adopted the Spitfire Employee Share Option Plan which was approved by Shareholders at the November 2013 Annual General Meeting. The Board considers length of service, seniority, responsibilities, potential contribution and any other relevant matters in determining eligibility of participants. The Board has sole responsibility in determining the number of options and terms and conditions of options granted to any participant under the option plan. Any options issued under the option plan will be granted for nil consideration.
DIRECTORS’ REPORT
21
Long-term incentive Options are issued under the Spitfire Employee Share Option Plan (ESOP) to employees. It provides for key management personnel to receive options over ordinary shares for no consideration. Any options issued to Directors require the approval of shareholders. The Board determines the proportion of fixed and variable compensation for each key Director and management personnel. The following table sets out the remuneration for the Directors and key management expensed during the 2015 financial year:
2015 Short Term Benefits Salaries
or Director
Fees
Consulting Fees
Performance Bonuses
Options Post-
Employment Super
Total
Value of options as
proportion of remuneration
$ $ $ $ $ $ % Executive Directors James Hamilton 7,552 186,558 - 9,351 - 203,461 4.6% John Mackenzie* - 72,493 - 2,860 - 75,353 3.8%
Non-Executive Directors Russell Hardwick ** 25,000 84,927 - 7,188 2,375 119,490 6.02% Ian Huitson 25,000 9,197 - 5,152 2,375 41,724 12.35% Executives Stuart Peterson - 103,331 - - - 103,331 0%
* Mr Mackenzie ceased being a director of Spitfire Resources Limited on 19th October 2014 ** Mr Hardwick also acts as the Company Secretary
23
For
per
sona
l use
onl
y

DIRECTORS’ REPORT
23
The expiry date of the employee options will be determined by the Board and will also lapse within 30 days of the participant ceasing to be an employee of the Company or a controlled entity (subject to certain exceptions). The options are not quoted on the ASX, however application will be made for an ASX quotation of any shares issued upon the exercise of the options. The aim of the Spitfire Employee Share Option Plan is to provide long term incentives to Executives to create and enhance Shareholder wealth and to provide a mechanism to assist the Company in its endeavours to retain key Executives and employees. During the year there were 6,500,000 options issued to Key Management Personal. 4.5 Analysis of options granted as compensation Details of vesting profiles of the options previously granted as remuneration to each key management person of the Group are detailed in the following table:
Number of options granted
Grant Date % vested in
2015 year % lapsed in year
Financial years in which grant vests
Executive Directors
James Hamilton 3,000,000 27 November 2009 Nil 100% Expired 27 Nov 2014
1,500,000 22 November 2012 50% Nil 50% in 2013/2014
50% in 2014/2015
3,000,000 28 November 2014 Nil Nil 50% in 2015/2016
50% in 2016/2017 John Mackenzie 4,000,000 1 October 2010 Nil Nil Vested 1,500,000 22 November 2012 Nil 50% Vested
Non-Executive Directors
Russell Hardwick 2,000,000 27 November 2009 Nil 100% Expired 27 Nov 2014
1,500,000 22 November 2012 50% Nil 50% in 2013/2014
50% in 2014/2015
2,000,000 28 November 2014 Nil Nil 50% in 2015/2016
50% in 2016/2017 Ian Huitson
1,000,000 22 November 2012 50% Nil 50% in 2013/2014
50% in 2014/2015
1,500,000 28 November 2014 Nil Nil 50% in 2015/2016
50% in 2016/2017 Executives/Consultants
Stuart Peterson 400,000 22 June 2010 Nil 100% Expired 22 June 2015
1,000,000 26 October 2010 Nil Nil Vested 1,000,000 15 August 2012 Nil Nil Vested
24
For
per
sona
l use
onl
y

DIRECTORS’ REPORT
24
4.6 Analysis of movements in options
The movement during the reporting period, by value, of options over ordinary shares in the Company held by each key management person is detailed as follows. These amounts are the total fair value of the options calculated at the grant date and amounts are allocated to remuneration over the vesting periods if applicable:
30 June 2015 Granted in year Value of options
exercised Lapsed in year
$ $ $ Executive Directors John Mackenzie - - 14,400 James Hamilton 14,700 - 108,600 Non-Executive Directors Russell Hardwick 9,800 - 72,400 Ian Huitson 7,350 - - Executives Stuart Peterson - - 18,400
Total 31,850 - 213,800
30 June 2014 Granted in year Value of options
exercised Lapsed in year
$ $ $ Executive Directors John Mackenzie - - - James Hamilton - - 119,200 Non-Executive Directors Russell Hardwick - - 44,700 Ian Huitson - - -
Total - - 163,900
25
For
per
sona
l use
onl
y

DIRECTORS’ REPORT
25
4.7 Key management personnel equity holdings
Refer to Note 5: Key Management Personnel for further information
Number of Options held by Key Management Personnel: The number of options over ordinary shares held by each Key Management Personnel of the Group during the financial year is as follows:
30 June 2015 Balance
1 July 2014 Granted as
Compensation
Other changes
during the year
Options Exercised
Balance 30 June 2015
Executive Directors James Hamilton 4,722,222 3,000,000 (3,000,000) - 4,722,222 John Mackenzie 5,600,000 - (750,000) - 4,850,000 Non-Executive Directors
Russell Hardwick 3,559,724 2,000,000 (2,000,000) - 3,559,724 Ian Huitson 1,047,619 1,500,000 - - 2,547,619 Executives Stuart Peterson 2,400,000 - (400,000) - 2,000,000
30 June 2015 Balance
30 June 2015
Total Vested
30 June 2015
Total Exercisable 30 June 2015
Total Unexercisable 30 June 2015
Executive Directors James Hamilton 4,722,222 1,722,222 1,722,222 3,000,000 John Mackenzie 4,850,000 4,850,000 4,850,000 - Non-Executive Directors
Russell Hardwick 3,559,724 1,559,724 1,559,724 2,000,000 Ian Huitson 2,547,619 1,047,619 1,047,619 1,500,000 Executives Stuart Peterson 2,000,000 2,000,000 2,000,000 -
26
For
per
sona
l use
onl
y

DIRECTORS’ REPORT
26
30 June 2014 Balance
1 July 2013 Granted as
Compensation
Other changes
during the year
Options Exercised
Balance 30 June 2014
Executive Directors James Hamilton 8,444,444 - (3,722,222) - 4,722,222 John Mackenzie 8,200,000 - (2,600,000) - 5,600,000 Non-Executive Directors
Russell Hardwick 5,119,448 - (1,559,724) - 3,559,724 Ian Huitson 1,095,238 - (47,619) - 1,047,619 Executives Stuart Peterson 2,400,000 - - - 2,400,000
30 June 2014 Balance
30 June 2014
Total Vested
30 June 2014
Total Exercisable 30 June 2014
Total Unexercisable 30 June 2014
Executive Directors James Hamilton 4,722,222 3,972,222 3,972,222 750,000 John Mackenzie 5,600,000 4,850,000 4,850,000 750,000 Non-Executive Directors
Russell Hardwick 3,559,724 2,809,724 2,809,724 750,000 Ian Huitson 1,047,619 647,619 647,619 500,000 Executives Stuart Peterson 2,400,000 2,400,000 2,400,000 -
27
For
per
sona
l use
onl
y

DIRECTORS’ REPORT
27
Number of Shares held by Key Management Personnel: The number of ordinary shares in Spitfire Resources Limited held by each Key Management Personnel of the Group during the financial year is as follows:
30 June 2015 Balance
1 July 2014 Received as
Compensation Options
Exercised Net Change
Other Balance
30 June 2015 Executive Directors James Hamilton 21,166,681 - - 6,944,668 28,111,349 John Mackenzie 1,600,000 - - - 1,600,000 Non-Executive Directors
Russell Hardwick 8,286,626 - - - 8,286,626 Ian Huitson 446,857 - - 1,052,480 1,499,337 Executives Stuart Peterson - - - - -
30 June 2014 Balance
1 July 2013 Received as
Compensation Options
Exercised Net Change
Other Balance
30 June 2014 Executive Directors James Hamilton 2,666,666 - - 18,500,015 21,166,681 John Mackenzie 1,000,000 - - 600,000 1,600,000 Non-Executive Directors
Russell Hardwick 786,626 - - 7,500,000 8,286,626 Ian Huitson 446,857 - - - 446,857 Executives Stuart Peterson - - - - -
4.8 Key management personnel loans
As at 30 June 2015 there were no loans payable from any Directors (2014: $506).
28
For
per
sona
l use
onl
y

DIRECTORS’ REPORT
28
4.9 Related party transactions
Consolidated 2015
$000 2014 $000
Transactions between related parties are on normal commercial terms and conditions no more favorable than those available to other parties unless otherwise stated.
EXPENDITURE Consultancy fees paid to Goldregis Corporation Pty Ltd (a company associated with Mr. James Hamilton), a related party of Spitfire Resources Limited. The amount of $22,000 was owing to Goldregis Corporation Pty Ltd as at 30 June 2015 (2014: $11,400)
187 62
Consultancy fees paid to Ravenhill Corporate Pty Ltd (a company associated with Mr. Russell Hardwick), a related party of Spitfire Resources Limited. The amount of $7,785 was owing to Ravenhill Corporate Pty Ltd as at 30 June 2015 (2014: $7,077)
84 87
Consultancy fees paid to Manhattan Holdings Pty Ltd (a company associated with Mr. John Mackenzie), a related party of Spitfire Resources Limited. There was no amount owing to Manhattan Holdings Pty Ltd as at 30 June 2015 (2014: $20,000)
72 252
Consultancy fees paid to Peterson Geological Consulting (an entity associated with Mr Stuart Peterson), a related party of Spitfire Resources Limited. The amount of $8,066 was owing to Peterson Geological as at 30 June 2015 (2014: $8,066)
103 57
OTHER RECEIVABLES
Other receivables as at 30 June 2015 (2014: $506). - 1
OTHER PAYABLES
Russell Hardwick – Directors Fees 6,250 -
Ian Huitson – Directors Fees 6,250 -
Goldregis Corporation Pty Ltd 22,000 12,540
Ravenhill Corporate Pty Ltd 7,785 7,785
Manhattan Holdings Pty Ltd - 22,000
Peterson Geological Consulting 8,066 8,066
End of Remuneration Report
29
For
per
sona
l use
onl
y

DIRECTORS’ REPORT
29
5. SHARE OPTIONS Unissued shares under options At the date of this report, unissued ordinary shares of the Company under option are:
Expiry Date Grant Date Exercise Price Number of options
1 October 2015 1 October 2010 $0.125 2,000,000 $0.175 2,000,000
26 October 2015 26 October 2010 $0.15 1,000,000 31 March 2016 14 April 2013 $0.12 45,018,606 15 August 2017
15 August 2012 $0.12 1,000,000
22 November 2017 22 November 2012 $0.11 4,750,000 28 November 2019 28 November 2014 $0.45 6,500,000 62,268,606
6. CORPORATE GOVERNANCE STATEMENT
The Company’s Corporate Governance Statement is set out on the Company’s website at http://www.spitfireresources.com/home/corporate/corporate-governance.html 7. PRINCIPAL ACTIVITIES
The principal activities of the Group during the course of the 2014/2015 financial year were to maintain
the South Woodie Woodie Manganese Project, and to examine other opportunities in Australia and offshore both within and outside the resources sector. 8. OPERATING AND FINANCIAL REVIEW The Group incurred a loss for the year of $1,095,101 (2014 Profit: $369,022). The result for the year reflected: - Exploration and Evaluation expenditure of $425,571; and - Corporate overheads associated with statutory and regulatory requirements of being listed on the
Australian Securities Exchange. Financial Position The net assets of the Group have decreased to $2,750,343 as at 30 June 2015. This decrease has largely resulted from expenditure on administrative overheads and working capital.
30
For
per
sona
l use
onl
y

DIRECTORS’ REPORT
30
The Directors believe the Group is in a stable financial position to continue to review its exploration projects and to identify new opportunities both inside and outside the resources sector. Significant Changes in State of Affairs Other than detailed elsewhere in this report, there were no other significant changes in the nature of the consolidated group’s principal activities during the financial year. Further information on the financial performance of the Company is included in the Review of Operations. 9. DIVIDENDS The Directors do not recommend the payment of a dividend and no amount has been paid or declared by way of a dividend as at the date of printing this Report. 10. EVENTS SUBSEQUENT TO REPORTING DATE
On 17th August 2015 shareholders approved the acquisition of the White Lion Limestone Project. Subsequently the company issued 216,718,266 fully paid ordinary shares and 100 performance shares to the vendors of White Lion Group Limited. These shares are escrowed for 12 months from the date of issue. Oher than the above, there has not been any other matter or circumstance occurring subsequent to the end of the financial year, that has significantly affected or may significantly affect the operations of the Group, the results of those operations, or the state of affairs of the Group in future financial years. 11. LIKELY DEVELOPMENTS Likely developments, future prospects and business strategies of the operations of the Group and the expected results of those operations have not been included in this Report as the Directors believe, on reasonable grounds, that the inclusion of such information would be likely to result in unreasonable prejudice to the Group. 12. ENVIRONMENTAL ISSUES The Group is aware of its environmental obligations with regards to its exploration activities and ensures that it complies with all regulations when carrying out any exploration work. The Directors of the Group are not aware of any breach of environmental legislation for the year under review.
13. INDEMNIFICATION AND INSURANCE OF OFFICERS AND AUDITORS In accordance with the constitution, except as may be prohibited by the Corporations Act 2001, every Officer, Auditor or Agent of the Company shall be indemnified out of the property of the Company against any liability incurred by him in his capacity as Officer, Auditor or Agent of the Company or any related corporation in respect of any act or omission whatsoever and howsoever occurring or in
31
For
per
sona
l use
onl
y

DIRECTORS’ REPORT
31
defending any proceedings, whether civil or criminal. The Company has paid a Directors and Officers Liability premium of $10,738.
14. NON-AUDIT SERVICES The Group may decide to employ the auditor on assignments additional to their statutory audit duties where the auditor’s expertise and experience with the Company and/or Group are important. Should the Group engage the auditor for non-audit related services; the provision of the non-audit services is compatible with the general standard of independence for the auditors imposed by the Corporations Act 2001. During the financial year ended 30 June 2015 the group’s auditors Bentley’s did not provide the Group with any non-audit related services. 15. PROCEEDINGS ON BEHALF OF COMPANY
No person has applied for leave of Court to bring proceedings on behalf of the Company or intervene in any proceedings to which the Company is a party for the purpose of taking responsibility on behalf of the Company for all or any part of those proceedings. The Company was not a party to any such proceedings during the financial year. 16. AUDITOR’S INDEPENDENCE DECLARATION
The Auditor’s Independence Declaration for the year ended 30 June 2015 has been received and can be found on page 32. 17. ROUNDING OF AMOUNTS The Company is an entity to which ASIC Class Order 98/100 applies and, accordingly, amounts in the financial statements and Directors’ Report have been rounded to the nearest thousand dollars. Signed in accordance with a resolution of Directors made pursuant to s298 (2) of the Corporations Act 2001. This Report is made with a resolution of the Directors.
James Hamilton Executive Chairman Dated at Perth this 10th day of September 2015
32
For
per
sona
l use
onl
y

To The Board of Directors
As lead audit director for the audit of the financial statements of Spitfire Resources Limited for the financial year ended 30 June 2015, I declare that to the best of my knowledge and belief, there have been no contraventions of:
the auditor independence requirements of the Corporations Act 2001 in relation to the audit; and
any applicable code of professional conduct in relation to the audit.
Yours faithfully
BENTLEYS MARK DELAURENTIS CA
Chartered Accountants Director
Dated at Perth this 10th day of September 2015
33
For
per
sona
l use
onl
y

CONSOLIDATED STATEMENT OF PROFIT OR LOSS AND OTHER COMPREHENSIVE INCOME For the year ended 30 June 2015
33
Consolidated Note 2015 2014 $000 $000 Continuing Operations Interest received 2 105 119 Other income 2 7 12 Gross profit/(loss) 112 131 Depreciation expense (25) (65) Consulting expenses (443) (626) Occupancy costs (42) (36) Travel expenses (75) (23) Exploration and evaluation costs expensed (426) (298) Share Based Payment (25) (46) Administrative expenses (215) (278) Loss before income tax 3 (1,139) (1,241) Income tax (expense)/revenue 4 44 1,610 Profit from continuing operations (1,095) 369 Other comprehensive income - - Total comprehensive income (loss) for the period - - Total comprehensive income (loss) attributable to the members of the Company
(1,095) 369
Profit / Loss per share From continuing operations: Basic and diluted loss per share 7 (0.43c) 0.14c
The accompanying notes form part of these financial statements
34
For
per
sona
l use
onl
y
CONSOLIDATED STATEMENT OF FINANCIAL POSITION As at 30 June 2015
34
Consolidated Note 2015 2014
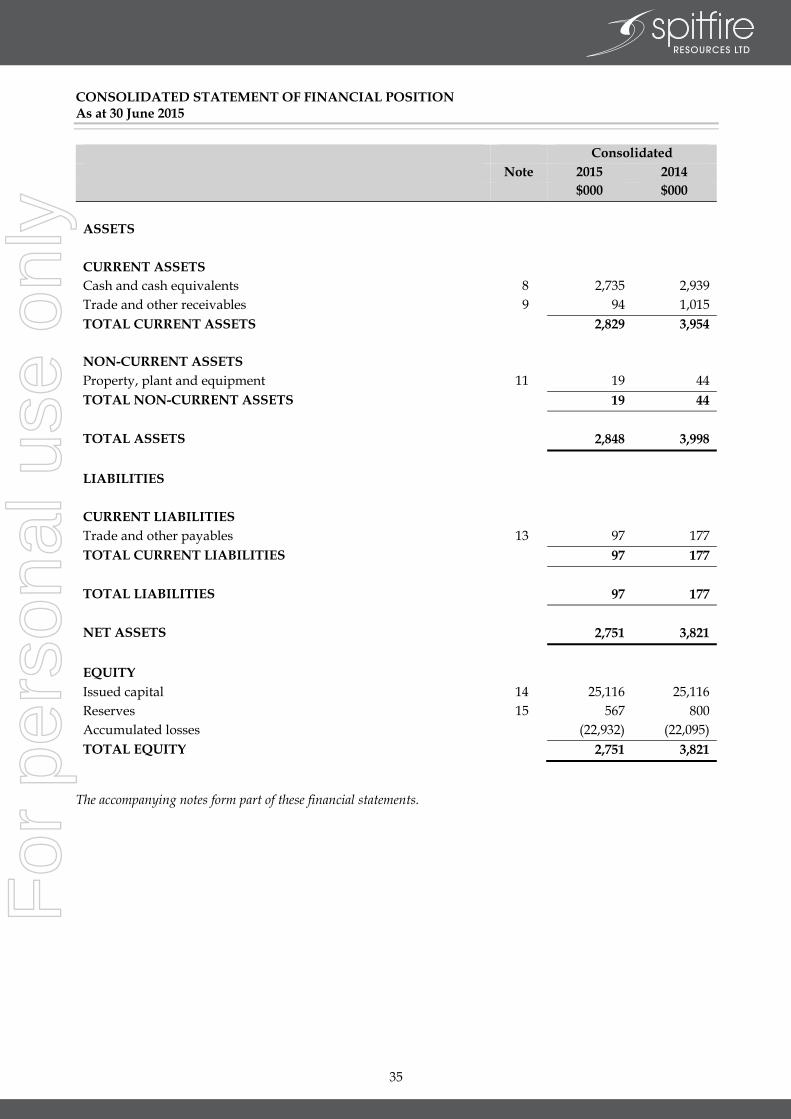
$000 $000 ASSETS CURRENT ASSETS Cash and cash equivalents 8 2,735 2,939 Trade and other receivables 9 94 1,015 TOTAL CURRENT ASSETS 2,829 3,954 NON-CURRENT ASSETS Property, plant and equipment 11 19 44 TOTAL NON-CURRENT ASSETS 19 44 TOTAL ASSETS 2,848 3,998 LIABILITIES CURRENT LIABILITIES Trade and other payables 13 97 177 TOTAL CURRENT LIABILITIES 97 177 TOTAL LIABILITIES 97 177 NET ASSETS 2,751 3,821 EQUITY Issued capital 14 25,116 25,116 Reserves 15 567 800 Accumulated losses (22,932) (22,095) TOTAL EQUITY 2,751 3,821
The accompanying notes form part of these financial statements.
35
For
per
sona
l use
onl
y

CONSOLIDATED STATEMENT OF CHANGES IN EQUITY For the year ended 30 June 2015
35
Consolidated Note Issued Capital
Option Reserve
Accumulated Losses Total Equity
$000 $000 $000 $000
Balance at 1 July 2013 25,115 950 (22,660) 3,405
Profit for the year - - 369 369
Other comprehensive income - - - - Total comprehensive income for the year
- - 369 369
Transactions with owners, recorded directly in equity
Issue of ordinary shares 1 - - 1
Share based payments 15 - 46 - 46
Expiry of share options 15 - (196) 196 -
Balance at 30 June 2014 25,116 800 (22,095) 3,821
Balance at 1 July 2014 25,116 800 (22,095) 3,821
Loss for the year - - (1,095) (1,095)
Other comprehensive income - - - - Total comprehensive income for the year
- - (1,095) (1,095)
Transactions with owners, recorded directly in equity
Share based payments 15 - 25 - 25
Expiry of share options 15 - (258) 258 -
Balance at 30 June 2015 25,116 567 (22,932) 2,751
The accompanying notes form part of these financial statements
36
For
per
sona
l use
onl
y

CONSOLIDATED STATEMENT OF CASH FLOWS For the year ended 30 June 2015
36
Consolidated Note 2015 2014 $000 $000 CASH FLOWS FROM OPERATING ACTIVITIES Cash paid to suppliers and employees (808) (896) Payments for exploration and evaluation (457) (274) Income tax benefit– Research and Development 946 788 Other revenue 7 13 Interest received 108 123 Net cash used in operating activities 19a (204) (246) CASH FLOWS FROM INVESTING ACTIVITIES Other (tenement bond refund) - 50 Net cash (used in)/from investing activities - 50 Net increase/(decrease) in cash and cash equivalents (204) (196) Cash and cash equivalents at the beginning of the period 2,939 3,135 Cash and cash equivalents at the end of the period 8 2,735 2,939
The accompanying notes form part of these financial statements.
CONSOLIDATED STATEMENT OF CHANGES IN EQUITY For the year ended 30 June 2015
35
Consolidated Note Issued Capital
Option Reserve
Accumulated Losses Total Equity
$000 $000 $000 $000
Balance at 1 July 2013 25,115 950 (22,660) 3,405
Profit for the year - - 369 369
Other comprehensive income - - - - Total comprehensive income for the year
- - 369 369
Transactions with owners, recorded directly in equity
Issue of ordinary shares 1 - - 1
Share based payments 15 - 46 - 46
Expiry of share options 15 - (196) 196 -
Balance at 30 June 2014 25,116 800 (22,095) 3,821
Balance at 1 July 2014 25,116 800 (22,095) 3,821
Loss for the year - - (1,095) (1,095)
Other comprehensive income - - - - Total comprehensive income for the year
- - (1,095) (1,095)
Transactions with owners, recorded directly in equity
Share based payments 15 - 25 - 25
Expiry of share options 15 - (258) 258 -
Balance at 30 June 2015 25,116 567 (22,932) 2,751
The accompanying notes form part of these financial statements
37
For
per
sona
l use
onl
y

NOTES TO THE FINANCIAL STATEMENTS For the year ended 30 June 2015
37
NOTE 1: STATEMENT OF SIGNIFICANT ACCOUNTING POLICIES REPORTING ENTITY Spitfire Resources Limited (the “Company”) is a Company domiciled in Australia. The address of the Company’s registered office is 41 York Street, Subiaco, WA 6008. The consolidated financial statements of the Company as at and for the year ended 30 June 2015 comprise the Company and its subsidiaries (together referred to as the “Group” and individually as “Group entities”) and the Group’s interest in associates and jointly controlled entities. The Group primarily is involved in the minerals exploration industry.
BASIS OF PREPARATION a) Statement of compliance The Financial Report is a General Purpose Financial Report, which has been prepared in accordance with Australian Accounting Standards Board (AASB) (including Australian Accounting interpretations and other authoritative pronouncements) adopted by the Australian Accounting Standards Board (AASB) and the Corporations Act 2001. The consolidated Financial Report of the Group and the Financial Report of the Company comply with International Financial Reporting Standards (IFRS’) and interpretations adopted by the International Accounting Standards Board (IASB). b) Basis of measurement The Financial Report has been prepared on an accruals basis and is based on historical costs modified by the revaluation of selected non-current assets, and financial assets and financial liabilities for which the fair value basis of accounting has been applied. c) Functional and presentation currency These consolidated financial statements are presented in Australian dollars, which is the Company’s functional currency and the functional currency of the Group. The Company is of a kind referred to in ASIC Class Order 98/100 dated 10 July 1998 and in accordance with that Class Order, all financial information presented in Australian dollars has been rounded to the nearest thousand unless otherwise stated.
SIGNIFICANT ACCOUNTING POLICIES The accounting policies set out below have been applied consistently to all periods presented in these consolidated financial statements, and have been applied consistently by Group entities. (a) Principles of consolidation
(i) Subsidiaries Subsidiaries are entities controlled by the Group. Control exists when the Group has the power to govern the financial and operating policies of an entity so as to obtain benefits from its activities. In assessing control, potential voting rights that are currently exercisable are taken into account. The financial statements of subsidiaries are included in the consolidated financial statements from the date that control commences until the date that control ceases. In the Company’s financial statements, investments in subsidiaries are carried at cost.
38
For
per
sona
l use
onl
y

NOTES TO THE FINANCIAL STATEMENTS For the year ended 30 June 2015
38
(ii) Business combinations Business combinations occur where an acquirer obtains control over one or more businesses and results in the consolidation of its assets and liabilities. A business combination is accounted for by applying the acquisition method, unless it is a combination involving entities or businesses under common control. The acquisition method requires that for each business combination one of the combining entities must be identified as the acquirer (i.e. parent entity). The business combination will be accounted for as at the acquisition date, which is the date that control over the acquiree is obtained by the parent entity. At this date, the parent shall recognise, in the consolidated accounts, and subject to certain limited exceptions, the fair value of the identifiable assets acquired and liabilities assumed. In addition, contingent liabilities of the acquiree will be recognised where a present obligation has been incurred and its fair value can be reliably measured. The acquisition may result in the recognition of goodwill or a gain from a bargain purchase. The method adopted for the measurement of goodwill will impact on the measurement of any non-controlling interest to be recognised in the acquiree where less than 100% ownership interest is held in the acquiree. The acquisition date fair value of the consideration transferred for a business combination plus the acquisition date fair value of any previously held equity interest shall form the cost of the investment in the separate financial statements. Consideration may comprise the sum of the assets transferred by the acquirer, liabilities incurred by the acquirer to the former owners of the acquiree and the equity interests issued by the acquirer. Fair value uplifts in the value of pre-existing equity holders are taken to the statement of comprehensive income. Where changes in the value of such equity holdings had previously been recognised in other comprehensive income, such amounts are recycled to profit or loss. Included in the measurement of consideration transferred is any asset or liability resulting from a contingent consideration arrangement. Any obligation incurred relating to contingent consideration is classified as either a financial liability or equity instrument, depending upon the nature of the arrangement. Rights to refunds of consideration previously paid are recognised as a receivable. Subsequent to initial recognition, contingent consideration classified as equity is not remeasured and its subsequent settlement is accounted for within equity. Contingent consideration classified as an asset or a liability is remeasured each reporting period to fair value through the statement of comprehensive income unless the change in value can be identified as existing at acquisition date. All transaction costs incurred in relation to the business combination are expensed to the statement of comprehensive income.
NOTES TO THE FINANCIAL STATEMENTS For the year ended 30 June 2015
37
NOTE 1: STATEMENT OF SIGNIFICANT ACCOUNTING POLICIES REPORTING ENTITY Spitfire Resources Limited (the “Company”) is a Company domiciled in Australia. The address of the Company’s registered office is 41 York Street, Subiaco, WA 6008. The consolidated financial statements of the Company as at and for the year ended 30 June 2015 comprise the Company and its subsidiaries (together referred to as the “Group” and individually as “Group entities”) and the Group’s interest in associates and jointly controlled entities. The Group primarily is involved in the minerals exploration industry.
BASIS OF PREPARATION a) Statement of compliance The Financial Report is a General Purpose Financial Report, which has been prepared in accordance with Australian Accounting Standards Board (AASB) (including Australian Accounting interpretations and other authoritative pronouncements) adopted by the Australian Accounting Standards Board (AASB) and the Corporations Act 2001. The consolidated Financial Report of the Group and the Financial Report of the Company comply with International Financial Reporting Standards (IFRS’) and interpretations adopted by the International Accounting Standards Board (IASB). b) Basis of measurement The Financial Report has been prepared on an accruals basis and is based on historical costs modified by the revaluation of selected non-current assets, and financial assets and financial liabilities for which the fair value basis of accounting has been applied. c) Functional and presentation currency These consolidated financial statements are presented in Australian dollars, which is the Company’s functional currency and the functional currency of the Group. The Company is of a kind referred to in ASIC Class Order 98/100 dated 10 July 1998 and in accordance with that Class Order, all financial information presented in Australian dollars has been rounded to the nearest thousand unless otherwise stated.
SIGNIFICANT ACCOUNTING POLICIES The accounting policies set out below have been applied consistently to all periods presented in these consolidated financial statements, and have been applied consistently by Group entities. (a) Principles of consolidation
(i) Subsidiaries Subsidiaries are entities controlled by the Group. Control exists when the Group has the power to govern the financial and operating policies of an entity so as to obtain benefits from its activities. In assessing control, potential voting rights that are currently exercisable are taken into account. The financial statements of subsidiaries are included in the consolidated financial statements from the date that control commences until the date that control ceases. In the Company’s financial statements, investments in subsidiaries are carried at cost.
39
For
per
sona
l use
onl
y

NOTES TO THE FINANCIAL STATEMENTS For the year ended 30 June 2015
39
(iii) Transactions eliminated on consolidation Intra-group balances, and any unrealised income and expenses arising from intra-group transactions, are eliminated in preparing the consolidated financial statements. Unrealised gains arising from transactions with equity accounted investees are eliminated against the investment to the extent of the Group’s interest in the investee. Unrealised losses are eliminated in the same way as unrealised gains, but only to the extent that there is no evidence of impairment. Gains and losses are recognised when the contributed assets are consumed or sold by the equity accounted investees or, if not consumed or sold by the equity accounted investee, when the Group’s interest in such entities is disposed of.
(b) Property, plant and equipment (i) Recognition and measurement
Items of property, plant and equipment are measured at cost less accumulated depreciation and accumulated impairment losses. Cost includes expenditure that is directly attributable to the acquisition of the asset. The cost of self-constructed assets includes the cost of materials and direct labour, any other costs directly attributable to bringing the asset to a working condition for its intended use, and the costs of dismantling and removing the items and restoring the site on which they are located. When parts of an item of property, plant and equipment have different useful lives, they are accounted for as separate items (major components) of property, plant and equipment.
(ii) Depreciation Depreciation is recognised in profit or loss on a straight line basis over the estimated useful lives of each part of an item of property, plant and equipment. Depreciation methods, useful lives and residual values are reviewed at each reporting date. The depreciation rates used for each class of depreciable assets are: Class of Fixed Asset Depreciation Rate Leasehold Improvements 20%
Plant and Equipment 33%
(c) Impairment (i) Financial assets
A financial asset is assessed at each reporting date to determine whether there is any objective evidence that it is impaired. A financial asset is considered to be impaired if objective evidence indicates that one or more events have had a negative effect on the estimated future cash flows of that asset. An impairment loss in respect of a financial asset measured at amortised cost is calculated as the difference between its carrying amount, and the present value of the estimated future cash flows discounted at the original effective interest rate. An impairment loss in respect of an available-for-sale financial asset is calculated by reference to its fair value.
40
For
per
sona
l use
onl
y

NOTES TO THE FINANCIAL STATEMENTS For the year ended 30 June 2015
40
Individually significant financial assets are tested for impairment on an individual basis. The remaining financial assets are assessed collectively in groups that share similar credit risk characteristics. All impairment losses are recognised in profit or loss. Any cumulative loss in respect of an available-for-sale financial asset recognised previously in equity is transferred to profit or loss. An impairment loss is reversed if the reversal can be related objectively to an event occurring after the impairment loss was recognised. For financial assets measured at amortised cost and available-for-sale financial assets that are debt securities, the reversal is recognised in profit or loss. For available-for-sale financial assets that are equity securities, the reversal is recognised directly in equity.
(ii) Non-financial assets The carrying amounts of the Group’s non-financial assets, other than biological assets, investment property, inventories and deferred tax assets, are reviewed at each reporting date to determine whether there is any indication of impairment. If any such indication exists then the asset’s recoverable amount is estimated. For goodwill and intangible assets that have indefinite lives or that are not yet available for use, the recoverable amount is estimated at each reporting date.
The recoverable amount of an asset or cash-generating unit is the greater of its value in use and its fair value less costs to sell. In assessing value in use, the estimated future cash flows are discounted to their present value using a pre-tax discount rate that reflects current market assessments of the time value of money and the risks specific to the asset. For the purpose of impairment testing, assets are grouped together into the smallest group of assets that generates cash inflows from continuing use that are largely independent of the cash inflows of other assets or groups of assets (the “cash-generating unit”). The goodwill acquired in a business combination, for the purpose of impairment testing, is allocated to cash-generating units that are expected to benefit from the synergies of the combination. An impairment loss is recognised if the carrying amount of an asset or its cash-generating unit exceeds its recoverable amount. Impairment losses are recognised in profit or loss. Impairment losses recognised in respect of cash-generating units are allocated first to reduce the carrying amount of any goodwill allocated to the units and then to reduce the carrying amount of the other assets in the unit (group of units) on a pro rata basis. An impairment loss in respect of goodwill is not reversed. In respect of other assets, impairment losses recognised in prior periods are assessed at each reporting date for any indications that the loss has decreased or no longer exists. An impairment loss is reversed if there has been a change in the estimates used to determine the recoverable amount. An impairment loss is reversed only to the extent that the asset’s carrying amount does not exceed the carrying amount that would have been determined, net of depreciation or amortisation, if no impairment loss had been recognised.
NOTES TO THE FINANCIAL STATEMENTS For the year ended 30 June 2015
39
(iii) Transactions eliminated on consolidation Intra-group balances, and any unrealised income and expenses arising from intra-group transactions, are eliminated in preparing the consolidated financial statements. Unrealised gains arising from transactions with equity accounted investees are eliminated against the investment to the extent of the Group’s interest in the investee. Unrealised losses are eliminated in the same way as unrealised gains, but only to the extent that there is no evidence of impairment. Gains and losses are recognised when the contributed assets are consumed or sold by the equity accounted investees or, if not consumed or sold by the equity accounted investee, when the Group’s interest in such entities is disposed of.
(b) Property, plant and equipment (i) Recognition and measurement
Items of property, plant and equipment are measured at cost less accumulated depreciation and accumulated impairment losses. Cost includes expenditure that is directly attributable to the acquisition of the asset. The cost of self-constructed assets includes the cost of materials and direct labour, any other costs directly attributable to bringing the asset to a working condition for its intended use, and the costs of dismantling and removing the items and restoring the site on which they are located. When parts of an item of property, plant and equipment have different useful lives, they are accounted for as separate items (major components) of property, plant and equipment.
(ii) Depreciation Depreciation is recognised in profit or loss on a straight line basis over the estimated useful lives of each part of an item of property, plant and equipment. Depreciation methods, useful lives and residual values are reviewed at each reporting date. The depreciation rates used for each class of depreciable assets are: Class of Fixed Asset Depreciation Rate Leasehold Improvements 20%
Plant and Equipment 33%
(c) Impairment (i) Financial assets
A financial asset is assessed at each reporting date to determine whether there is any objective evidence that it is impaired. A financial asset is considered to be impaired if objective evidence indicates that one or more events have had a negative effect on the estimated future cash flows of that asset. An impairment loss in respect of a financial asset measured at amortised cost is calculated as the difference between its carrying amount, and the present value of the estimated future cash flows discounted at the original effective interest rate. An impairment loss in respect of an available-for-sale financial asset is calculated by reference to its fair value.
41
For
per
sona
l use
onl
y

NOTES TO THE FINANCIAL STATEMENTS For the year ended 30 June 2015
41
(d) Employee benefits
(i) Share-based payment transactions The grant date fair value of options granted to employees is recognised as an employee expense, with a corresponding increase in equity, over the period that the employees become unconditionally entitled to the options. The amount recognised as an expense is adjusted to reflect the actual number of share options that vest, except for those that fail to vest due to market conditions not being met. The fair value of the amount payable to employees in respect of share appreciation rights, which are settled in cash, is recognised as an expense, with a corresponding increase in liabilities, over the period that the employees become unconditionally entitled to payment. The liability is remeasured at each reporting date and at settlement date. Any changes in the fair value of the liability are recognised as personnel expense in profit or loss. When the Company grants options over its shares to employees of subsidiaries, the fair value at grant date is recognised as an increase in the investments in subsidiaries, with a corresponding increase in equity over the vesting period of the grant.
(e) Provisions A provision is recognised if, as a result of a past event, the Group has a present legal or constructive obligation that can be estimated reliably, and it is probable that an outflow of economic benefit will be required to settle the obligation. Provisions are determined by discounting the expected future cash flows at a pre-tax rate that reflects current market assessments of the time value of money and the risks specific to the liability.
(f) Finance income and expenses Finance income comprises interest income on funds invested (including available-for-sale financial assets), dividend income, gains on the disposal of available-for-sale financial assets, changes in the fair value of financial assets at fair value through profit or loss, and gains on hedging instruments that are recognised in profit or loss. Interest income is recognised as it accrues in profit or loss, using the effective interest method. Finance expense comprises interest expense on borrowings, unwinding of the discount on provisions, dividends on preference shares classified as liabilities, changes in the fair value of financial assets at fair value through profit or loss, impairment losses recognised on financial assets, and losses on hedging instruments that are recognised in profit or loss. All borrowing costs are recognised in profit or loss using the effective interest method.
(g) Income tax Income tax expense (revenue) for the year comprises current income tax expense (income) and deferred tax expense (income). Current income tax expense charged to profit or loss is the tax payable on taxable income. Current tax liabilities (assets) are measured at the amounts expected to be paid to (recovered from) the relevant taxation authority.
42
For
per
sona
l use
onl
y
NOTES TO THE FINANCIAL STATEMENTS For the year ended 30 June 2015
42
Deferred income tax expense reflects movements in deferred tax asset and deferred tax liability balances during the year as well as unused tax losses. Current and deferred income tax expense (income) is charged or credited outside profit or loss when the tax relates to items that are recognised outside profit or loss. Except for business combinations, no deferred income tax is recognised from the initial recognition of an asset or liability where there is no effect on accounting or taxable profit or loss. Deferred tax assets and liabilities are calculated at the tax rates that are expected to apply to the period when the asset is realised or the liability is settled and their measurement also reflects the manner in which management expects to recover or settle the carrying amount of the related asset or liability. Deferred tax assets relating to temporary differences and used tax losses are recognised only to the extent that it is probable that future taxable profit will be available against which the benefits of the deferred tax asset can be utilised. Where temporary differences exist in relation to investments in subsidiaries, branches, associates and joint ventures, deferred tax assets and liabilities are not recognised where the timing of the reversal of the temporary difference can be controlled and it is not probable that the reversal will occur in the foreseeable future.
Current tax assets and liabilities are offset where a legally enforceable right to set-off exists and it is intended that net settlement or simultaneous realisation and settlement of the respective asset and liability will occur. Deferred tax assets and liabilities are offset where: (a) a legally enforceable right of set-off exists; and (b) the deferred tax assets and liabilities relate to income taxes levied by the same taxation authority on either the same taxable entity or different taxable entities where it is intended that net settlement or simultaneous realisation and settlement of respective asset and liability will occur in future periods in which significant amount of deferred tax assets or liabilities are expected to be recovered or settled.
(h) Tax consolidation
Spitfire Resources Limited and its 100% owned controlled entities have formed a tax consolidated group.
(i) Goods and services tax Revenues, expenses and assets are recognised net of the amount of GST, except where the amount of GST incurred is not recoverable from the Australian Tax Office. In these circumstances the GST is recognised as part of the cost of acquisition of the asset or as part of an item of the expense. Receivables and payables in the statement of financial position are shown inclusive of GST. Cash flows are presented in the statement of cash flows on a gross basis, except for the GST component of investing and financing activities, which are disclosed as operating cash flows.
43
For
per
sona
l use
onl
y

NOTES TO THE FINANCIAL STATEMENTS For the year ended 30 June 2015
43
(j) Earnings per share The Group presents basic and diluted earnings per share (EPS) data for its ordinary shares. Basic EPS is calculated by dividing the profit or loss attributable to ordinary Shareholders of the Company by the weighted average number of ordinary shares outstanding during the period. Diluted EPS is determined by adjusting the profit or loss attributable to ordinary shareholders and the weighted average number of ordinary shares outstanding for the effects of all dilutive potential ordinary shares, which comprise convertible notes and share options granted to employees.
(k) Segment reporting
Operating segments are reported in a manner consistent with the internal reporting provided to the chief operating decision maker. The chief operating decision maker, who is responsible for allocating resources and assessing performance of the operating segments, has been identified as the full Board of Directors.
The Board considers the business from both a functional and geographic perspective and has identified two reportable segments including the South Woodie Woodie Manganese Segment with these activities forming the Australian manganese exploration segment. The other segment includes the administration, fund raising and investment activities of the Group which forms the Treasury and unallocated segments.
All assets, liabilities, revenues and expenses are monitored by the Board of Directors.
(l) Exploration and evaluation expenditure
The Group impairs the value of accumulated expenditure in respect of each identifiable area of interest if, after the completion of two financial years in which the expenditure is incurred, a decision to mine has not been made. Any remaining and ongoing costs are only carried forward to the extent that they are expected to be recouped through the successful development of the area or where activities in the area have not yet reached a stage that permits reasonable assessment of the existence of economically recoverable reserves. When production commences, the accumulated costs for the relevant area of interest are amortised over the life of the area according to the rate of depletion of the economically recoverable reserves. A regular review is undertaken of each area of interest to determine the appropriateness of continuing to carry forward costs in relation to that area of interest.
(m) Revenue and other income
Revenue is measured at the fair value of the consideration received or receivable after taking into account any trade discounts and volume rebates allowed. Any consideration deferred is treated as the provision of finance and is discounted at a rate of interest that is generally accepted in the market for similar arrangements. The difference between the amount initially recognised and the amount ultimately received is interest revenue.
Revenue from the sale of goods is recognised at the point of delivery as this corresponds to the transfer of significant risks and rewards of ownership of the goods and the cessation of all involvement in those goods.
44
For
per
sona
l use
onl
y

NOTES TO THE FINANCIAL STATEMENTS For the year ended 30 June 2015
44
Interest revenue is recognised using the effective interest rate method, which, for floating rate financial assets, is the rate inherent in the instrument. Dividend revenue is recognised when the right to receive a dividend has been established.
Revenue recognition relating to the provision of services is determined with reference to the stage of completion of the transaction at reporting date and where outcome of the contract can be estimated reliably. Stage of completion is determined with reference to the services performed to date as a percentage of total anticipated services to be performed. Where the outcome cannot be estimated reliably, revenue is recognised only to the extent that related expenditure is recoverable.
Investment property revenue is recognised on a straight line basis over the period of lease term so as to reflect a constant periodic rate of return on the net investment. All revenue is stated net of the amount of goods and services tax (GST).
(n) Cash and cash equivalents
Cash and cash equivalents include cash in hand, deposits held at call with banks, and other short-term highly liquid investments.
(o) Financial instruments
Recognition and Initial Measurement Financial instruments, incorporating financial assets and financial liabilities, are recognised when the entity becomes a party to the contractual provisions of the instrument. Trade date accounting is adopted for financial assets that are delivered within timeframes established by marketplace convention. Financial instruments are initially measured at fair value plus transaction costs where the instrument is not classified as at fair value through profit or loss. Transaction costs related to instruments classified as at fair value through profit or loss are expensed to profit or loss immediately. Financial instruments are classified and measured as set out below:
Derecognition Financial assets are derecognised where the contractual rights to receipt of cash flows expires or the asset is transferred to another party whereby the entity no longer has any significant continuing involvement in the risks and benefits associated with the asset. Financial liabilities are derecognised where the related obligations are either discharged, cancelled or expire. The difference between the carrying value of the financial liability extinguished or transferred to another party and the fair value of consideration paid, including the transfer of non-cash assets or liabilities assumed, is recognised in profit or loss.
Classification and Subsequent Measurement i. Financial assets at fair value through profit or loss
Financial assets are classified at fair value through profit or loss when they are held for trading for the purpose of short term profit taking, where they are derivatives not held for hedging purposes, or designated as such to avoid an accounting mismatch or to enable performance evaluation where a group of financial assets is managed by key management personnel on a fair value basis in accordance with a documented risk management or investment strategy. Realised and unrealised
NOTES TO THE FINANCIAL STATEMENTS For the year ended 30 June 2015
43
(j) Earnings per share The Group presents basic and diluted earnings per share (EPS) data for its ordinary shares. Basic EPS is calculated by dividing the profit or loss attributable to ordinary Shareholders of the Company by the weighted average number of ordinary shares outstanding during the period. Diluted EPS is determined by adjusting the profit or loss attributable to ordinary shareholders and the weighted average number of ordinary shares outstanding for the effects of all dilutive potential ordinary shares, which comprise convertible notes and share options granted to employees.
(k) Segment reporting
Operating segments are reported in a manner consistent with the internal reporting provided to the chief operating decision maker. The chief operating decision maker, who is responsible for allocating resources and assessing performance of the operating segments, has been identified as the full Board of Directors.
The Board considers the business from both a functional and geographic perspective and has identified two reportable segments including the South Woodie Woodie Manganese Segment with these activities forming the Australian manganese exploration segment. The other segment includes the administration, fund raising and investment activities of the Group which forms the Treasury and unallocated segments.
All assets, liabilities, revenues and expenses are monitored by the Board of Directors.
(l) Exploration and evaluation expenditure
The Group impairs the value of accumulated expenditure in respect of each identifiable area of interest if, after the completion of two financial years in which the expenditure is incurred, a decision to mine has not been made. Any remaining and ongoing costs are only carried forward to the extent that they are expected to be recouped through the successful development of the area or where activities in the area have not yet reached a stage that permits reasonable assessment of the existence of economically recoverable reserves. When production commences, the accumulated costs for the relevant area of interest are amortised over the life of the area according to the rate of depletion of the economically recoverable reserves. A regular review is undertaken of each area of interest to determine the appropriateness of continuing to carry forward costs in relation to that area of interest.
(m) Revenue and other income
Revenue is measured at the fair value of the consideration received or receivable after taking into account any trade discounts and volume rebates allowed. Any consideration deferred is treated as the provision of finance and is discounted at a rate of interest that is generally accepted in the market for similar arrangements. The difference between the amount initially recognised and the amount ultimately received is interest revenue.
Revenue from the sale of goods is recognised at the point of delivery as this corresponds to the transfer of significant risks and rewards of ownership of the goods and the cessation of all involvement in those goods.
45
For
per
sona
l use
onl
y

NOTES TO THE FINANCIAL STATEMENTS For the year ended 30 June 2015
45
gains and losses arising from changes in fair value are included in profit or loss in the period in which they arise.
ii. Loans and receivables Loans and receivables are non-derivative financial assets with fixed or determinable payments that are not quoted in an active market and are subsequently measured at amortised cost using the effective interest rate method.
iii. Held-to-maturity investments Held-to-maturity investments are non-derivative financial assets that have fixed maturities and fixed or determinable payments, and it is the Group’s intention to hold these investments to maturity. They are subsequently measured at amortised cost using the effective interest rate method.
iv. Available-for-sale financial assets
Available-for-sale financial assets are non-derivative financial assets that are either designated as such or that are not classified in any of the other categories. They comprise investments in the equity of other entities where there is neither a fixed maturity nor fixed or determinable payments.
v. Financial liabilities Non-derivative financial liabilities (excluding financial guarantees) are subsequently measured at amortised cost using the effective interest rate method.
Fair Value Fair value is determined based on current bid prices for all quoted investments. Valuation techniques are applied to determine the fair value for all unlisted securities, including recent arm’s length transactions, reference to similar instruments and option pricing models.
Impairment At each reporting date, the Group assesses whether there is objective evidence that a financial instrument has been impaired. In the case of available-for-sale financial instruments, a prolonged decline in the value of the instrument is considered to determine whether impairment has arisen. Impairment losses are recognised in the income statement.
(p) New and revised AASB’s affecting amounts reported and/or disclosures in the financial statements
In the current year, the Group has applied a number of amendments to AASBs and a new interpretation issued by the Australian Accounting Standards Board (AASB) that is mandatorily effective from an accounting period on or after 1 July 2014. The application of these amendments and interpretation does not have any material impact on the Group’s consolidated financial statements. Standards and Interpretations in issue not yet adopted At the date of authorisation of the financial statements, the Standards and Interpretations that were issued but not yet effective are listed below.
46
For
per
sona
l use
onl
y

NOTES TO THE FINANCIAL STATEMENTS For the year ended 30 June 2015
46
Standard/Interpretation
Effective for annual reporting
periods beginning on or after
Expected to be initially applied in
the financial year ending
AASB 9 ‘Financial Instruments’, and the relevant amending standards
1 January 2018 30 June 2019
AASB 15 ‘Revenue from Contracts with Customers’ and AASB 2014-5 ‘Amendments to Australian Accounting Standards arising from
AASB 15’
1 January 2017 30 June 2018
AASB 2014-3 ‘Amendments to Australian Accounting Standards – Accounting for Acquisitions of Interests in Joint Operations’
1 January 2016 30 June 2017
AASB 2014-4 ‘Amendments to Australian Accounting Standards – Clarification of Acceptable Methods of Depreciation and Amortisation’
1 January 2016 30 June 2017
AASB 2014-6 ‘Amendments to Australian Accounting Standards – Agriculture: Bearer Plants’
1 January 2016 30 June 2017
AASB 2014-9 ‘Amendments to Australian Accounting Standards – Equity Method in Separate Financial Statements’
1 January 2016 30 June 2017
AASB 2014-10 ‘Amendments to Australian Accounting Standards – Sale or Contribution of Assets between an Investor and its Associate or Joint Venture’
1 January 2016 30 June 2017
AASB 2015-1 ‘Amendments to Australian Accounting Standards – Annual Improvements to Australian Accounting Standards 2012-2014 Cycle’
1 January 2016 30 June 2017
AASB 2015-2 ‘Amendments to Australian Accounting Standards – Disclosure Initiative: Amendments to AASB 101’
1 January 2016 30 June 2017
AASB 2015-3 ‘Amendments to Australian Accounting Standards arising from the Withdrawal of AASB 1031 Materiality’
1 July 2015 30 June 2016
AASB 2015-4 ‘Amendments to Australian Accounting Standards – Financial Reporting Requirements for Australian Groups with a Foreign Parent’
1 July 2015 30 June 2016
AASB 2015-5 ‘Amendments to Australian Accounting Standards – Investment Entities: Applying the Consolidation Exception’
1 January 2016 30 June 2017
47
For
per
sona
l use
onl
y

NOTES TO THE FINANCIAL STATEMENTS For the year ended 30 June 2015
47
Note that the following new Standards and Interpretations are not applicable for the Group but are relevant for the period: AASB 14 ‘Regulatory Deferral Accounts’ and AASB 2014-1 ‘Amendments to Australian Accounting Standards – Part D: ’Consequential Amendments arising from AASB 14’ is not applicable to the Group as the Group is not a first-time adopter of Australian Accounting Standards. AASB 1056 ‘Superannuation Entities’ is not applicable to the Group as the Group is not a superannuation entity. AASB 2015-6 ‘Amendments to Australian Accounting Standards – Extending Related Party Disclosures to Not-for-Profit Public Sector Entities’ is not applicable to the Group as the Group is a for-profit entity
(q) Critical Accounting Estimates and Judgements The Directors evaluate estimates and judgements incorporated into the Financial Report based on historical knowledge and best available current information. Estimates assume a reasonable expectation of future events and are based on current trends and economic data, obtained both externally and within the Group. Impairment The Group assesses impairment at each reporting date by evaluating conditions specific to the Group that may lead to impairment of assets. Where an impairment trigger exists, the recoverable amount of the asset is determined. Value-in-use calculations performed in assessing recoverable amounts incorporate a number of key estimates.
Provision for Impairment of Receivables The Company has written down the value of its intercompany loans to nil, as at the reporting date the recovery of intercompany loans is not virtually certain. Other than the intercompany loans, no provision for impairment of receivables has been made at 30 June 2014.
Exploration and Evaluation Costs The value of accumulated expenditure in respect of each identifiable area of interest is impaired if, after the completion of two financial years in which the expenditure is incurred, a decision to mine has not been made. Any remaining and ongoing costs are only carried forward to the extent that they are expected to be recouped through the successful development of the area or where activities in the area have not yet reached a stage that permits reasonable assessment of the existence of economically recoverable reserves.
Share-based Payment Transactions The Group measures the cost of equity-settled transactions with employees by reference to the fair value of the equity instruments at the date at which they are granted. The fair value is determined by an internal valuation using the Black-Scholes option pricing model.
Environmental Issues Balances disclosed in the financial statements and notes thereto are not adjusted for any pending or enacted environmental legislation, and the Directors understanding thereof. At the current stage of the Company’s development and its current environmental impact, the Directors believe such treatment is reasonable and appropriate.
48
For
per
sona
l use
onl
y

NOTES TO THE FINANCIAL STATEMENTS For the year ended 30 June 2015
48
Taxation Balances disclosed in the financial statements and the notes thereto, related to taxation, and are based on the best estimates of Directors. These estimates take into account both the financial performance and position of the Company as they pertain to current income taxation legislation, and the Directors’ understanding thereof. No adjustment has been made for pending or future taxation legislation. The current income tax position represents the Directors’ best estimate, pending any assessment by the Australian Taxation Office.
Fair Value of Assets and Liabilities The Group measures some of its assets and liabilities at fair value on either a recurring or non-recurring basis, depending on the requirements of the applicable Accounting Standard. Fair value is the price the Group would receive to sell an asset or would have to pay to transfer a liability in an orderly (ie unforced) transaction between independent, knowledgeable and willing market participants at the measurement date. As fair value is a market-based measure, the closest equivalent observable market pricing information is used to determine fair value. Adjustments to market values may be made having regard to the characteristics of the specific asset or liability. The fair values of assets and liabilities that are not traded in an active market are determined using one or more valuation techniques. These valuation techniques maximise, to the extent possible, the use of observable market data. To the extent possible, market information is extracted from either the principal market for the asset or liability (ie the market with the greatest volume and level of activity for the asset or liability) or, in the absence of such a market, the most advantageous market available to the entity at the end of the reporting period (ie the market that maximises the receipts from the sale of the asset or minimises the payments made to transfer the liability, after taking into account transaction costs and transport costs). For non-financial assets, the fair value measurement also takes into account a market participant's ability to use the asset in its highest and best use or to sell it to another market participant that would use the asset in its highest and best use. The fair value of liabilities and the entity's own equity instruments (excluding those related to share-based payment arrangements) may be valued, where there is no observable market price in relation to the transfer of such financial instruments, by reference to observable market information where such Instruments are held as assets. Where this information is not available, other valuation techniques are adopted and, where significant, are detailed in the respective note to the financial statements.
Valuation techniques In the absence of an active market for an identical asset or liability, the Group selects and uses one or more valuation techniques to measure the fair value of the asset or liability, The Group selects a valuation technique that is appropriate in the circumstances and for which sufficient data is available to measure fair value. The availability of sufficient and relevant data primarily depends on the specific characteristics of the asset or liability being measured. The valuation techniques selected by the Group are consistent with one or more of the following valuation approaches: Market approach: valuation techniques that use prices and other relevant information generated by market transactions for identical or similar assets or liabilities. Income approach: valuation techniques that convert estimated future cash flows or income and expenses into a single discounted present value.
49
For
per
sona
l use
onl
y

NOTES TO THE FINANCIAL STATEMENTS For the year ended 30 June 2015
49
Cost approach: valuation techniques that reflect the current replacement cost of an asset at its current service capacity. Each valuation technique requires inputs that reflect the assumptions that buyers and sellers would use when pricing the asset or liability, including assumptions about risks. When selecting a valuation technique, the Group gives priority to those techniques that maximise the use of observable inputs and minimise the use of unobservable inputs. Inputs that are developed using market data (such as publicly available information on actual transactions) and reflect the assumptions that buyers and sellers would generally use when pricing the asset or liability are considered observable, whereas inputs for which market data is not available and therefore are developed using the best information available about such assumptions are considered unobservable. Fair value hierarchy AASB 13 requires the disclosure of fair value information by level of the fair value hierarchy, which categorises fair value measurements into one of three possible levels based on the lowest level that an input that is significant to the measurement can be categorised into as follows:
Level 1 Measurements based on quoted prices (unadjusted) in active markets for identical assets or liabilities that the entity can access at the measurement date. Measurements based on inputs other than quoted prices included in Level 1 that are observable for the asset or liability, either directly or indirectly. Level 2 Measurements based on inputs other than quoted prices included in Level 1 that are observable for the asset or liability, either directly or indirectly Level 3 Measurements based on unobservable inputs for the asset or liability. The fair values of assets and liabilities that are not traded in an active market are determined using one or more valuation techniques. These valuation techniques maximise, to the extent possible, the use of observable market data. If all significant inputs required to measure fair value are observable, the asset or liability is included in Level 2. If one or more significant inputs are not based on observable market data, the asset or liability is included in Level 3.
The Group would change the categorisation within the fair value hierarchy only in the following circumstances:
(i) if a market that was previously considered active (Level 1) became inactive (Level 2 or Level 3) or vice versa; or
(ii) if significant inputs that were previously unobservable (Level 3) became observable (Level 2) or vice versa.
When a change in the categorisation occurs, the Group recognises transfers between levels of the fair value hierarchy (i.e. transfers into and out of each level of the fair value hierarchy) on the date the event or change in circumstances occurred.
50
For
per
sona
l use
onl
y

NOTES TO THE FINANCIAL STATEMENTS For the year ended 30 June 2015
50
NOTE 2: REVENUE AND OTHER INCOME
Consolidated 2015
$000 2014 $000
Other income - Interest revenue from financial institutions 94 106 - Interest revenue from other institutions 11 13 - Government Funding (Paid Parental Leave) - 11 - Insurance claim - 1 - Fuel tax rebate 7 -
Total revenue 112 131
NOTE 3: PROFIT/LOSS FOR THE YEAR
Consolidated 2015
$000 2014 $000
a) Expenses Rental expense on operating leases - Minimum lease payments 42 36
b) Significant expenses
Consulting fees 443 626 Directors fees 58 83 Salaries and wages - 58 Superannuation 5 11 Share options expense 25 46 Exploration & Evaluation costs expensed 426 298
51
For
per
sona
l use
onl
y

NOTES TO THE FINANCIAL STATEMENTS For the year ended 30 June 2015
51
NOTE 4: INCOME TAX EXPENSE Consolidated 2015
$000 2014 $000
Major components of income tax expense for the years ended 30 June 2015 and 2014 are: INCOME STATEMENT Current Income
Current income tax charge - - Research & Development refundable tax offset 44 1,610 Deferred income tax
Relating to origination and reversal of temporary differences - - Benefit from previously unrecognised tax loss used to reduce deferred tax expense - -
Income Tax (expense)/benefit reported in income statement 44 1,610
A reconciliation of income tax expense (benefit) applicable to accounting loss before income tax at the statutory income tax rate to income tax expense at the Company’s effective income tax rate for the years ended 30 June 2015 and 2014 is as follows:
Accounting loss before income tax (1,139) (1,241)
At the statutory income tax rate of 30% (2014: 30%) (342) (372)
Add: Non-deductible expenses 8 15 Temporary differences and tax losses not brought to account 422 3,577 Less:
Non – assessable income R&D refundable tax offset (44) (1,610)
Income tax (expense)/benefit 44 1,610
Effective income tax rate of 0% 0% 0%
52
For
per
sona
l use
onl
y
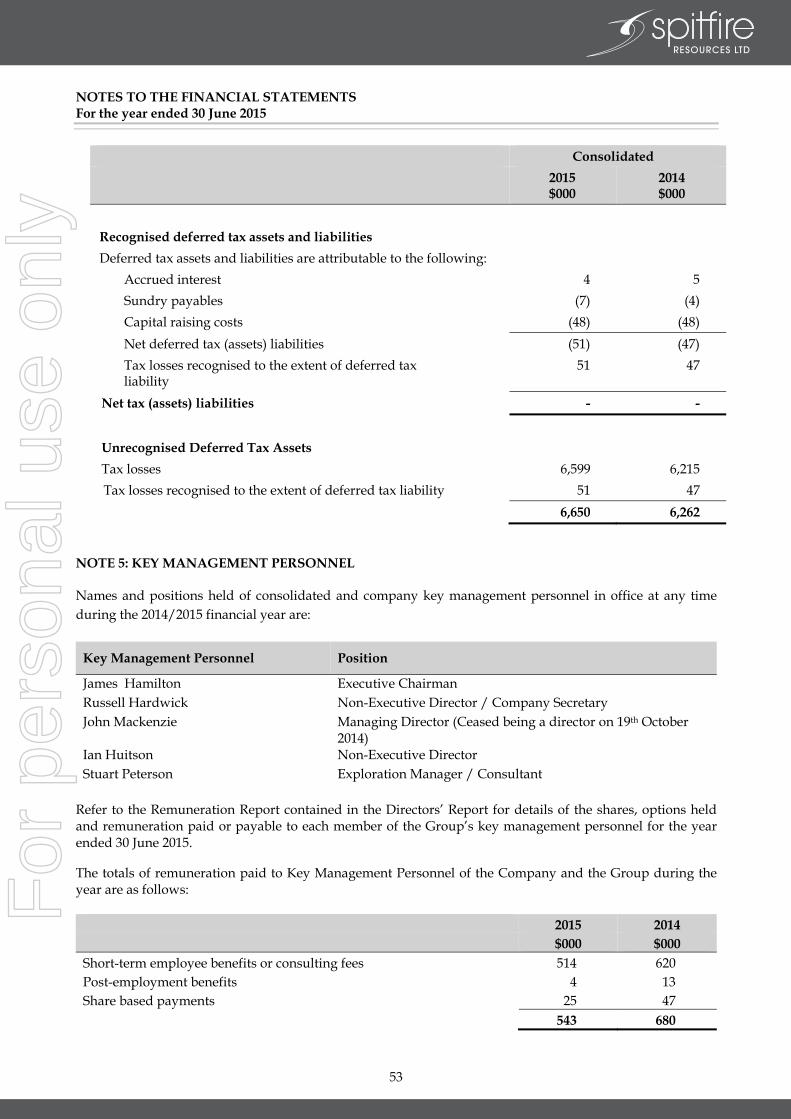
NOTES TO THE FINANCIAL STATEMENTS For the year ended 30 June 2015
52
Consolidated 2015
$000 2014 $000
Recognised deferred tax assets and liabilities Deferred tax assets and liabilities are attributable to the following:
Accrued interest 4 5 Sundry payables (7) (4) Capital raising costs (48) (48) Net deferred tax (assets) liabilities (51) (47) Tax losses recognised to the extent of deferred tax liability
51 47
Net tax (assets) liabilities - -
Unrecognised Deferred Tax Assets Tax losses 6,599 6,215
Tax losses recognised to the extent of deferred tax liability 51 47 6,650 6,262
NOTE 5: KEY MANAGEMENT PERSONNEL Names and positions held of consolidated and company key management personnel in office at any time during the 2014/2015 financial year are:
Key Management Personnel Position
James Hamilton Executive Chairman Russell Hardwick Non-Executive Director / Company Secretary John Mackenzie Managing Director (Ceased being a director on 19th October
2014) Ian Huitson Non-Executive Director Stuart Peterson Exploration Manager / Consultant
Refer to the Remuneration Report contained in the Directors’ Report for details of the shares, options held and remuneration paid or payable to each member of the Group’s key management personnel for the year ended 30 June 2015.
The totals of remuneration paid to Key Management Personnel of the Company and the Group during the year are as follows:
2015 2014 $000 $000 Short-term employee benefits or consulting fees 514 620 Post-employment benefits 4 13 Share based payments 25 47 543 680
53
For
per
sona
l use
onl
y

NOTES TO THE FINANCIAL STATEMENTS For the year ended 30 June 2015
53
Refer to the remuneration report for other related party transactions for Key Management Personnel. There are no other related party transactions other than to Key Management Personnel identified above. NOTE 6: AUDITORS’ REMUNERATION
Consolidated 2015
$000 2014 $000
Remuneration of the Auditor of the parent entity for: - Auditing or reviewing the Financial Report 21 20
No other services have been provided by the Auditors.
NOTE 7: PROFIT/ (LOSS) PER SHARE Consolidated 2015
$000 2014 $000
a) Earnings/(loss) used to calculate basic and diluted EPS from
continuing and discontinued operations (1,095) 369
Basic earnings/(loss) per share (cents per share) (0.43c) 0.14c
b) Earnings/(loss) used to calculate basic and diluted EPS from continuing operations
(1,095) 369
Basic earnings/(loss) per share (cents per share) (0.43c) 0.14c Number of shares Number of shares
c) Weighted average number of ordinary shares outstanding during the year used in calculation of basic EPS 255,113,474 255,112,696
At 30 June 2015, 62,268,606 (2014: 63,118,606) share options are non-dilutive based on the average market prices of the Company’s shares.
54
For
per
sona
l use
onl
y

NOTES TO THE FINANCIAL STATEMENTS For the year ended 30 June 2015
54
NOTE 8: CASH AND CASH EQUIVALENTS Consolidated 2015
$000 2014 $000
Cash at bank and in hand 96 82 Cash management account 175 195 Short-term bank deposits 2,464 2,662 2,735 2,939
The effective interest rate on short term bank deposits was 2.87% (2014: 3.5%); these deposits have an average maturity of 97 days (2014: 97 days).
NOTE 9: TRADE AND OTHER RECEIVABLES
Consolidated 2015
$000 2014 $000
CURRENT
GST receivable 22 25 Interest receivable 13 17 Research & Development refundable tax offset 44 946 Other receivables 15 27 94 1,015
Refer to Note 24 for risk management policies in place.
NOTE 10: CONTROLLED ENTITIES a. Controlled Entities Consolidated
Country of Incorporation Percentage Owned (%)* 2015 2014
Subsidiaries of Spitfire Resources Ltd:
Spitfire Australia (SWW) Pty Ltd Australia 100% 100%
Spitfire Global Pty Ltd Australia 100% 100% Bellpiper Pty Ltd Australia 100% 100%
* Percentage of voting power is in proportion to ownership.
55
For
per
sona
l use
onl
y

NOTES TO THE FINANCIAL STATEMENTS For the year ended 30 June 2015
55
NOTE 11: PROPERTY, PLANT AND EQUIPMENT
Consolidated 2015
$000 2014 $000
PLANT AND EQUIPMENT At cost 224 224 Accumulated depreciation (205) (181) Total Plant and Equipment 19 43
LEASEHOLD IMPROVEMENTS At cost 77 77 Accumulated depreciation (77) (76) Total Leasehold Improvements - 1
19 44
Movements in Carrying Amounts Movements in the carrying amounts for each class of property, plant and equipment between the beginning and the end of the current financial year:
Plant and Equipment
Leasehold Improvements Total
$000 $000 $000
Balance at 30 June 2013 107 2 109 Depreciation expense (64) (1) (65) Balance at 30 June 2014 43 1 44 Depreciation expense (24) (1) (25) Balance at 30 June 2015 19 - 19
NOTE 12: EXPLORATION AND EVALUATION ASSETS
Exploration and Evaluation expenditure amounting to $457,075 (2014: $273,608) have been included in cash flows from operating activities in the cash flow statement.
56
For
per
sona
l use
onl
y
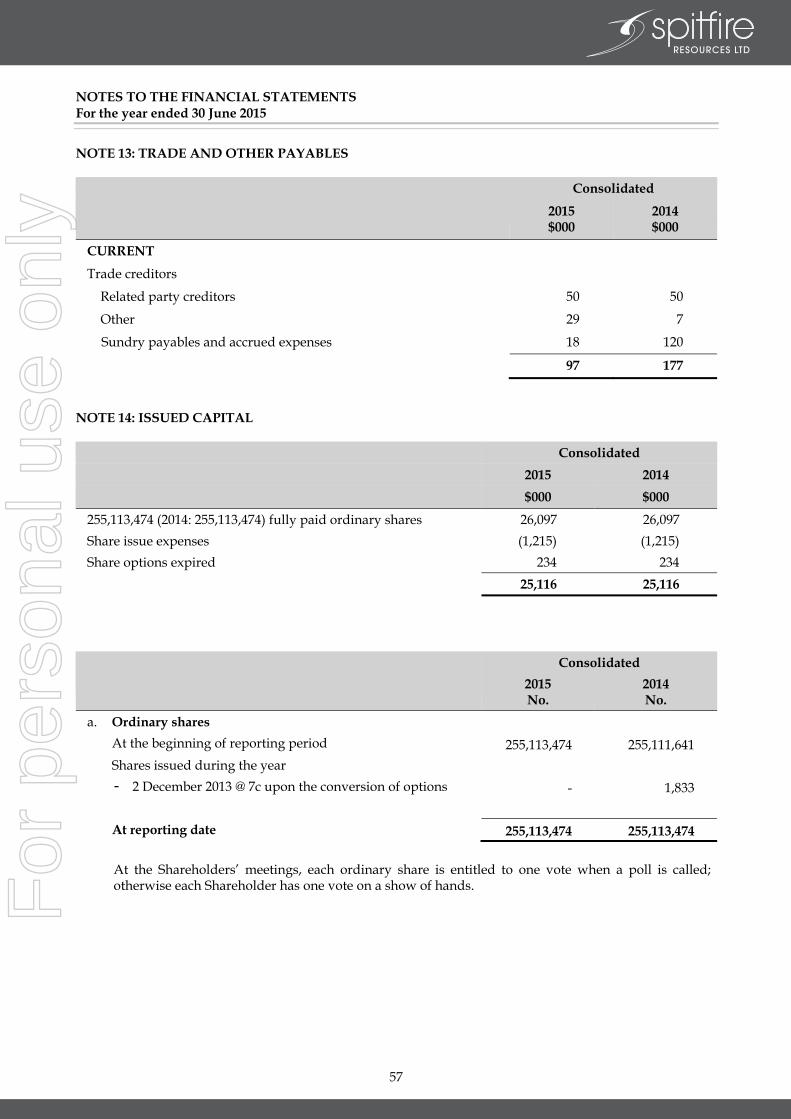
NOTES TO THE FINANCIAL STATEMENTS For the year ended 30 June 2015
56
NOTE 13: TRADE AND OTHER PAYABLES
Consolidated
2015 $000
2014 $000
CURRENT
Trade creditors
Related party creditors 50 50
Other 29 7
Sundry payables and accrued expenses 18 120
97 177
NOTE 14: ISSUED CAPITAL
Consolidated 2015 2014
$000 $000
255,113,474 (2014: 255,113,474) fully paid ordinary shares 26,097 26,097 Share issue expenses (1,215) (1,215) Share options expired 234 234 25,116 25,116
Consolidated 2015
No. 2014 No.
a. Ordinary shares At the beginning of reporting period 255,113,474 255,111,641 Shares issued during the year - 2 December 2013 @ 7c upon the conversion of options - 1,833 At reporting date 255,113,474 255,113,474
At the Shareholders’ meetings, each ordinary share is entitled to one vote when a poll is called; otherwise each Shareholder has one vote on a show of hands.
57
For
per
sona
l use
onl
y

NOTES TO THE FINANCIAL STATEMENTS For the year ended 30 June 2015
57
b. Options On the 18th November 2014, 750,000 Share options exercisable into ordinary shares at 0.11c per share expired. On the 27th November 2014, 6,000,000 Share options exercisable into ordinary shares at 0.168c per share expired. On the 15th December 2014, 100,000 Share options exercisable into ordinary shares at 0.15c per share expired. On the 22nd June 2015, 500,000 Share options exercisable into ordinary shares at 0.175c per share expired. For information relating to the Spitfire Resources Limited Employee Option Plan, including details of options issued, exercised and lapsed during the financial year and the options outstanding at year end refer to Note 21 Share-based Payments.
c. Capital Management
Due to the nature of the Group’s activities, being exploration, the Group does not have ready access to credit facilities, with the primary source of funding being equity raisings. Therefore, the focus of the Group’s capital risk management is the current working capital position against the requirements of the Group to meet exploration programs and corporate overheads. The Group’s strategy is to ensure appropriate liquidity is maintained to meet anticipated operating requirements, with a view to initiating appropriate capital raisings as required. The working capital position of the Group at 30 June 2015 and 30 June 2014 are as follows:
Consolidated 2015 2014 $000 $000 Cash and cash equivalents 2,735 2,939
Trade and other receivables 94 1,015
Trade and other payables (97) (177)
Working capital position 2,732 3,777
58
For
per
sona
l use
onl
y

NOTES TO THE FINANCIAL STATEMENTS For the year ended 30 June 2015
58
NOTE 15: RESERVES
Consolidated 2015 2014 $000 $000 Equity settled employee benefits reserve:
Balance at Beginning of Period 800 950
Share Options issued 22 November 2012 10 46
Share Option expired 19 September 2013 - (3)
Share Options expired 06 March 2014 - (193)
Share Options expired 18 November 2014 (14) -
Share Options expired 27 November 2014 (218) -
Share Options issued 28 November 2014 15 -
Share Options expired 15 December 2014 (3) -
Share Options expired 22 June 2015 (23) -
567 800
Movements in reserves are set out in the Statement of Changes in Equity.
Equity settled employee benefits reserve
The equity settled employee benefits reserve arises on the grant and vesting of share options to Employees, Consultants and Directors. Amounts are transferred out of the reserve into issued capital when the options are exercised.
NOTE 16: CONTINGENT LIABILITIES AND CONTINGENT ASSETS There were no contingent liabilities/ assets at 30 June 2015.
59
For
per
sona
l use
onl
y
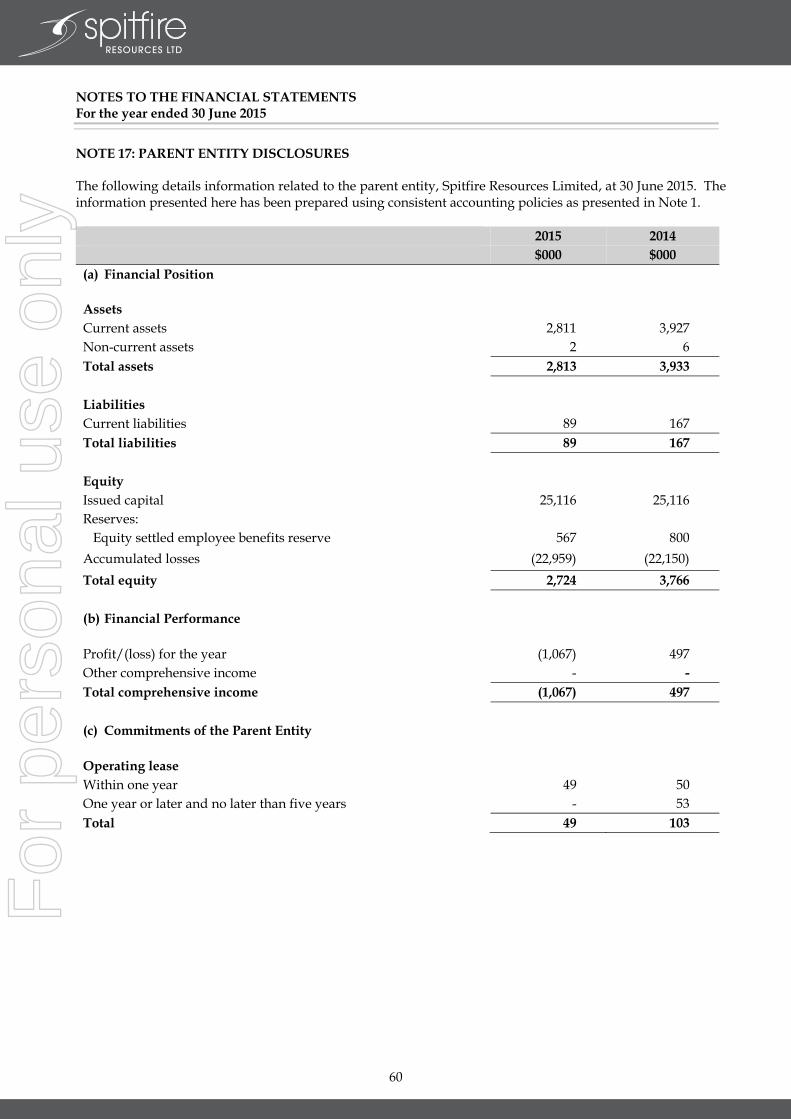
NOTES TO THE FINANCIAL STATEMENTS For the year ended 30 June 2015
59
NOTE 17: PARENT ENTITY DISCLOSURES The following details information related to the parent entity, Spitfire Resources Limited, at 30 June 2015. The information presented here has been prepared using consistent accounting policies as presented in Note 1.
2015 2014 $000 $000 (a) Financial Position Assets Current assets 2,811 3,927 Non-current assets 2 6 Total assets 2,813 3,933 Liabilities Current liabilities 89 167 Total liabilities 89 167 Equity Issued capital 25,116 25,116 Reserves: Equity settled employee benefits reserve 567 800 Accumulated losses (22,959) (22,150) Total equity 2,724 3,766 (b) Financial Performance Profit/(loss) for the year (1,067) 497 Other comprehensive income - - Total comprehensive income (1,067) 497 (c) Commitments of the Parent Entity Operating lease Within one year 49 50 One year or later and no later than five years - 53 Total 49 103
60
For
per
sona
l use
onl
y

NOTES TO THE FINANCIAL STATEMENTS For the year ended 30 June 2015
60
NOTE 18: SEGMENT REPORTING Identification of reportable segments The group has identified its operating segments based on the internal reports that are reviewed and used by the board of directors (chief operating decision makers) in assessing performance and determining the allocation of resources. The Group is managed primarily on the basis of its individual exploration commodity and the remaining treasury function. Operating segments are therefore determined on the same basis. Types of exploration by project segment (i) Australia – Manganese Exploration
The manganese exploration segment is the maintenance of the Manganese project at South Woodie in the East Pilbara. Segment assets, including any capitalised exploration expenditure are reported on in this segment.
(ii) Australia – Treasury
In addition the Company has included a Treasury segment that includes the surplus cash of which the majority is invested in Bank term deposits.
Basis of accounting for purposes of reporting by operating segments Accounting policies adopted Unless stated otherwise, all amounts reported to the Board of Directors, as the chief decision maker with respect to operating segments, are determined in accordance with accounting policies that are consistent with those adopted in the annual financial statements of the Group. Segment assets Where an asset is used across multiple segments, the asset is allocated to the segment that receives the majority of economic value from the asset. In the majority of instances, segment assets are clearly identifiable on the basis of their nature and physical location. Unless indicated otherwise in the segment assets note, investments in financial assets, deferred tax assets and intangible assets have not been allocated to operating segments. Segment liabilities Liabilities are allocated to segments where there is direct nexus between the incurrence of the liability and the operations of the segment. Borrowings and tax liabilities are generally considered to relate to the Group as a whole and are not allocated. Segment liabilities include trade and other payables and certain direct borrowings. Unallocated items The following items of revenue, expense, assets and liabilities are not allocated to operating segments as they are not considered part of the core operations of any segment:
• Other corporate charges
61
For
per
sona
l use
onl
y

NOTES TO THE FINANCIAL STATEMENTS For the year ended 30 June 2015
61
Consolidated 30 June 2015
Australia – Manganese Exploration
Australia – Treasury
Consolidated Group
$000 $000 $000
SEGMENT PERFORMANCE
Finance revenue - 105 105
Total segment and group revenue - 105 105
Reconciliation of segment revenue to group revenue Other revenue 7 Total group revenue 112 Segment net profit/(loss) from continuing operations before tax (420) 105 (315)
Reconciliation of segment result to group net profit/(loss) before tax
- Other tax revenue 44 - 44 Unallocated Items - Consulting Fees (443) - Salaries - - Depreciation (25) - Other (356)
Net Profit/(loss) before tax from continuing operations (1,095)
SEGMENT ASSETS
Segment assets 82 2,720 2,802
Reconciliation of segment assets to group assets
Unallocated items - Other 46
Total group assets 2,848 Segment asset increases/(decreases) for the period:
- Cash (2) (202) (204) - Other (946) - (946)
(948) (202) (1,150) SEGMENT LIABILITIES Segment liabilities 8 - 8 Reconciliation of segment liabilities to group liabilities
Unallocated items - Other 89
Total group liabilities 97
62
For
per
sona
l use
onl
y

NOTES TO THE FINANCIAL STATEMENTS For the year ended 30 June 2015
62
Consolidated 30 June 2014
Australia – Manganese Exploration
Australia – Treasury
Consolidated Group
$000 $000 $000
SEGMENT PERFORMANCE
Finance revenue - 119 119
Total segment and group revenue - 119 119
Reconciliation of segment revenue to group revenue Other revenue 12 Total group revenue 131 Segment net profit/(loss) from continuing operations before tax (359) 119 (240)
Reconciliation of segment result to group net profit/(loss) before tax
- Other tax revenue 1,610 - 1,610 Unallocated Items - Consulting Fees (626) - Salaries (58) - Depreciation (65) - Other (252)
Net Profit/(loss) before tax from continuing operations 1,251 369
SEGMENT ASSETS
Segment assets 1,018 2,924 3,942
Reconciliation of segment assets to group assets
Unallocated items - Other 56
Total group assets 3,998 Segment asset increases/(decreases) for the period:
- Cash 12 (205) (193) - Other 783 - 783
795 (205) (590) SEGMENT LIABILITIES Segment liabilities 105 - 105 Reconciliation of segment liabilities to group liabilities
Unallocated items - Other 72
Total group liabilities 177
63
For
per
sona
l use
onl
y

NOTES TO THE FINANCIAL STATEMENTS For the year ended 30 June 2015
63
NOTE 19: CASH FLOW INFORMATION
Consolidated 2015
$000 2014 $000
(a) Reconciliation of Cash Flow from Operations with Profit/Loss after Income Tax
Profit/(Loss) after income tax from continuing operations (1,095) 369
Non-cash flows in profit/(loss) - Depreciation 25 65 - Share options expensed 25 47 - Impairment of exploration & evaluation capitalised
expenditure - 77
Changes in assets and liabilities, net of the effects of purchase and disposal of subsidiaries
- (Increase)/decrease in trade and term receivables 921 (843) - Increase/(decrease) in trade payables and accruals (80) 44
- (Decrease)/ increase in provisions - (5)
Cashflow from operations (204) (246)
NOTE 20: COMMITMENTS a) Operating Lease Commitments
Consolidated 2015
$000 2014 $000
Non-cancellable operating lease contracted for but not capitalised in the financial statements:
Payable - Within one year 49 50 - One year or later and no later than five years - 53
49 103
The above amounts relate to a property lease at 41 York Street, Subiaco which is a 36 month lease term expiring on 31 May 2016, with rent payable monthly in advance.
64
For
per
sona
l use
onl
y
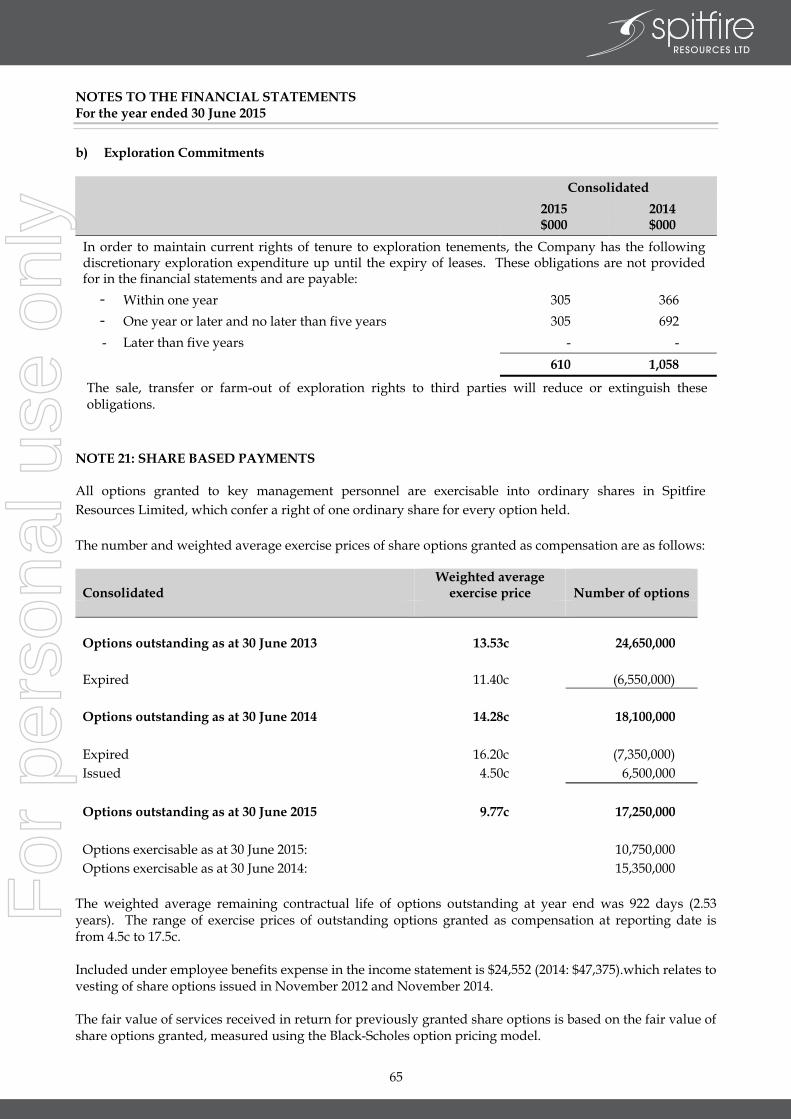
NOTES TO THE FINANCIAL STATEMENTS For the year ended 30 June 2015
64
b) Exploration Commitments
Consolidated 2015
$000 2014 $000
In order to maintain current rights of tenure to exploration tenements, the Company has the following discretionary exploration expenditure up until the expiry of leases. These obligations are not provided for in the financial statements and are payable:
- Within one year 305 366 - One year or later and no later than five years 305 692
- Later than five years - - 610 1,058
The sale, transfer or farm-out of exploration rights to third parties will reduce or extinguish these obligations.
NOTE 21: SHARE BASED PAYMENTS All options granted to key management personnel are exercisable into ordinary shares in Spitfire Resources Limited, which confer a right of one ordinary share for every option held. The number and weighted average exercise prices of share options granted as compensation are as follows:
Consolidated Weighted average
exercise price
Number of options Options outstanding as at 30 June 2013 13.53c 24,650,000 Expired 11.40c (6,550,000) Options outstanding as at 30 June 2014 14.28c 18,100,000 Expired 16.20c (7,350,000) Issued 4.50c 6,500,000 Options outstanding as at 30 June 2015 9.77c 17,250,000 Options exercisable as at 30 June 2015: 10,750,000 Options exercisable as at 30 June 2014: 15,350,000
The weighted average remaining contractual life of options outstanding at year end was 922 days (2.53 years). The range of exercise prices of outstanding options granted as compensation at reporting date is from 4.5c to 17.5c. Included under employee benefits expense in the income statement is $24,552 (2014: $47,375).which relates to vesting of share options issued in November 2012 and November 2014. The fair value of services received in return for previously granted share options is based on the fair value of share options granted, measured using the Black-Scholes option pricing model.
65
For
per
sona
l use
onl
y

NOTES TO THE FINANCIAL STATEMENTS For the year ended 30 June 2015
65
NOTE 22: EVENTS AFTER BALANCE SHEET DATE On 17th August 2015 shareholders approved the acquisition of the White Lion Limestone Project. Subsequently the company issued 216,718,266 fully paid ordinary shares and 100 performance shares to the vendors of White Lion Group Limited. These shares are escrowed for 12 months from the date of issue. Other than the above, there has not been any other matter or circumstance occurring subsequent to the end of the financial year, that has significantly affected or may significantly affect the operations of the Group, the results of those operations, or the state of affairs of the Group in future financial years. NOTE 23: FINANCIAL RISK MANAGEMENT
Significant accounting policies Details of the significant accounting policies in respect of financial instruments are disclosed in Note 1 of the financial statements. Financial risk management The Board seeks to minimise its exposure to financial risk by reviewing and agreeing policies for managing each financial risk and monitoring them on a regular basis. No formal policies have been put in place in order to hedge the Group and Company’s activities to the exposure to currency risk or interest risk, however if the Group enters commercial production this may be considered. No derivatives or hedges were entered into during the period. General objectives, policies and processes The Board has overall responsibility for the determination of the Group’s risk management objectives and policies and, whilst retaining ultimate responsibility for them, it has delegated the authority for designing and operating processes that ensure the effective implementation of the objectives and policies to the Group’s finance function. The Board receives regular reports through which it reviews the effectiveness of the processes put in place and the appropriateness of the objectives and policies it sets.
The Group is exposed through its operations to the following financial risks:
Liquidity risk; Credit risk; Foreign exchange risk; and Interest rate risk.
The overall objective of the Board is to set policies that seek to reduce risk as far as possible without unduly affecting the Group’s competitiveness and flexibility. Further details regarding these policies are set out below: Liquidity risk Prudent liquidity risk management requires the Group to maintain sufficient cash to meet exploration and other commitments and is managed centrally by the Board. The board monitors rolling cash forecasts to manage liquidity risks and to ensure adequate cash reserves are maintained. Any exploration programs and budgets are set and agreed by the Board in advance, enabling the Group’s cash requirements to be anticipated and managed. The main financial liabilities of the Group at balance date are trade and other payables.
66
For
per
sona
l use
onl
y

NOTES TO THE FINANCIAL STATEMENTS For the year ended 30 June 2015
66
Credit risk The credit risk on liquid funds is limited because the counterparties are banks with high credit ratings assigned by international credit rating agencies. The Group has made investments and advances of $413,038 (2014: $231,583) into subsidiary companies, recovery of which is dependent on future income generation of those subsidiaries. The Group’s maximum exposure to credit risk by class of individual financial instrument is shown in the table below:
2015 2014 Carrying
value Maximum exposure
Carrying value
Maximum exposure
$ $ $ $ Cash and cash equivalents
- AA Rated 2,735 2,735 2,939 2,939
Trade and other receivables 94 94 1,015 1,015
2,829 2,829 3,954 3,954 Price risk Price conscious risk relates to the risk that the fair value of future cash flows of a financial instrument will fluctuate because of changes in market prices largely due to demand and supply factors for commodities. The Group is currently involved in the exploration for manganese and should sufficient economic resources be delineated then the Group will be exposed to the particular commodity price risk. There are no hedges in place at balance date. Foreign exchange risk The Group has no exposure to foreign exchange risk during the year ended 30 June 2015. The Group will be exposed to movements in the AUD v USD following the acquisition of the White Lion Project. Interest rate risk The Group’s exposure to interest rate risk, which is the risk that a financial instrument’s value will fluctuate as a result of changes in market interest rates and the effective weighted average interest rate for each class of financial assets and financial liabilities comprises:
67
For
per
sona
l use
onl
y
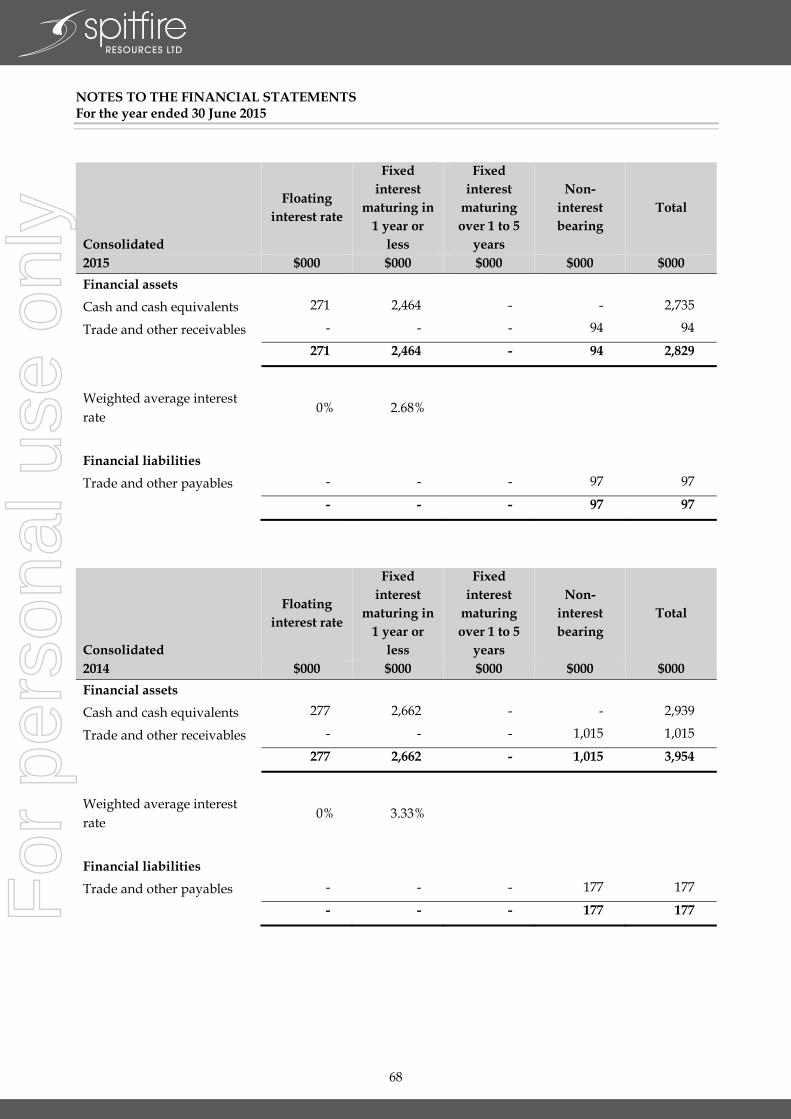
NOTES TO THE FINANCIAL STATEMENTS For the year ended 30 June 2015
67
Consolidated
Floating interest rate
Fixed interest
maturing in 1 year or
less
Fixed interest
maturing over 1 to 5
years
Non-interest bearing
Total
2015 $000 $000 $000 $000 $000 Financial assets
Cash and cash equivalents 271 2,464 - - 2,735
Trade and other receivables - - - 94 94
271 2,464 - 94 2,829
Weighted average interest rate
0% 2.68%
Financial liabilities
Trade and other payables - - - 97 97
- - - 97 97
Consolidated
Floating interest rate
Fixed interest
maturing in 1 year or
less
Fixed interest
maturing over 1 to 5
years
Non-interest bearing
Total
2014 $000 $000 $000 $000 $000 Financial assets
Cash and cash equivalents 277 2,662 - - 2,939
Trade and other receivables - - - 1,015 1,015
277 2,662 - 1,015 3,954
Weighted average interest rate
0% 3.33%
Financial liabilities
Trade and other payables - - - 177 177
- - - 177 177
68
For
per
sona
l use
onl
y

NOTES TO THE FINANCIAL STATEMENTS For the year ended 30 June 2015
68
Sensitivity Analysis Interest rate risk The Group has performed sensitivity analysis relating to its exposure to interest rate risk at balance date. The sensitivity analysis demonstrates the effect on the current financial year results and equity which could result from a change in these risks. Interest Rate Sensitivity Analysis A sensitive analysis has been determined based on the exposure to changes in interest rates on available cash during the financial year. A 100 basis point increase or decrease has been used as management’s assessment of the risk of possible changes in interest rates. At 30 June 2015, if interest rates had been 100 basis points higher or lower and all other variables were held constant, the Group’s net profit would increase by $38,934 or decrease by $38,934 (2014: increase by $35,676 or decrease by $35,676). This is due mainly to the Group’s exposure to variable interest rates on cash and cash equivalents.
Net Fair Value The carrying value and net fair value of financial assets and liabilities at balance date are:
2015 2014 Carrying
Amount Net Fair Value Carrying
Amount Net Fair Value
$000 $000 $000 $000 Financial assets Cash and cash equivalents 2,735 2,735 2,939 2,939 Trade and other receivables 94 94 1,015 1,015 2,829 2,829 3,954 3,954 Financial liabilities Trade and other payables 97 97 177 177 97 97 177 177
69
For
per
sona
l use
onl
y

DIRECTORS’ DECLARATION
69
The Directors of the Company declare that:
1. The financial statements and notes, as set out on pages 33 to 68, are in accordance with the Corporations Act 2001 and:
a. Comply with Accounting Standards; b. Are in accordance with International Financial Reporting Standards issued by the International
Accounting Standards Board as stated in note 1 to the financial statements; and c. Give a true and fair view of the financial position as at 30 June 2015 and of the performance for the
year ended on that date of the Company and consolidated Group. 2. The Managing Director and Chief Financial Officer have each declared that:
a. The financial records of the Company for the financial year have been properly maintained in accordance with section 286 of the Corporations Act 2001;
b. The financial statements and notes for the financial year comply with the Accounting Standards; and c. The financial statements and notes for the financial year give a true and fair view.
3. In the Directors’ opinion, there are reasonable grounds to believe that the Company will be able to pay its
debts as and when they become due and payable. This declaration is made in accordance with a resolution of the Board of Directors.
JAMES HAMILTON Executive Chairman Dated this 10th day of September 2015
70
For
per
sona
l use
onl
y

We have audited the accompanying financial report of Spitfire Resources Limited (“the
Company”) and Controlled Entities (“the Consolidated Entity”), which comprises the
statement of financial position as at 30 June 2015, and the statement of profit or loss and
other comprehensive income, statement of changes in equity and statement of cash
flows for the year then ended, notes comprising a summary of significant accounting
policies and other explanatory information, and the directors’ declaration of the
Consolidated Entity, comprising the Company and the entities it controlled at the year’s
end or from time to time during the financial year.
The directors of the Company are responsible for the preparation of the financial report
that gives a true and fair view in accordance with Australian Accounting Standards and
the Corporations Act 2001 and for such internal control as the directors determine is
necessary to enable the preparation of the financial report that gives a true and fair view
and is free from material misstatement, whether due to fraud or error. In Note 1, the
directors also state, in accordance with Accounting Standards AASB 101: Presentation
of Financial Statements, that the financial statements comply with International Financial
Reporting Standards.
Our responsibility is to express an opinion on the financial report based on our audit. We
conducted our audit in accordance with Australian Auditing Standards. These Auditing
Standards require that we comply with relevant ethical requirements relating to audit
engagements and plan and perform the audit to obtain reasonable assurance whether
the financial report is free from material misstatement.
An audit involves performing procedures to obtain audit evidence about the amounts and
disclosures in the financial report. The procedures selected depend on the auditor’s
judgment, including the assessment of the risks of material misstatement of the financial
report, whether due to fraud or error. In making those risk assessments, the auditor
considers internal control relevant to the entity’s preparation of the financial report that
gives a true and fair view in order to design audit procedures that are appropriate in the
circumstances, but not for the purpose of expressing an opinion on the effectiveness of
the entity’s internal control. An audit also includes evaluating the appropriateness of
accounting policies used and the reasonableness of accounting estimates made by the
directors, as well as evaluating the overall presentation of the financial report.
We believe that the audit evidence we have obtained is sufficient and appropriate to
provide a basis for our audit opinion.
71
For
per
sona
l use
onl
y

In conducting our audit, we have complied with the independence requirements of the Corporations Act 2001.
In our opinion:
a. The financial report of Spitfire Resources Limited is in accordance with the Corporations Act 2001,
including:
i. giving a true and fair view of the Consolidated Entity’s financial position as at 30 June 2015 and of its
performance for the year ended on that date; and
ii. complying with Australian Accounting Standards and the Corporations Regulations 2001;
b. The financial statements also comply with International Financial Reporting Standards as disclosed in
Note 1.
We have audited the Remuneration Report included in the directors’ report for the year ended 30 June 2015.
The directors of the Company are responsible for the preparation and presentation of the Remuneration Report
in accordance with section 300A of the Corporations Act 2001. Our responsibility is to express an opinion on
the Remuneration Report, based on our audit conducted in accordance with Australian Auditing Standards.
In our opinion, the Remuneration Report of Spitfire Resources Limited for the year ended 30 June 2015,
complies with section 300A of the Corporations Act 2001.
BENTLEYS MARK DELAURENTIS CA
Chartered Accountants Director
Dated at Perth this 10th day of September 2015
72
For
per
sona
l use
onl
y

ADDITIONAL INFORMATION FOR PUBLICLY LISTED COMPANIES
72
ADDITIONAL SHAREHOLDER INFORMATION AS AT 31 AUGUST 2015
1. SHAREHOLDING INFORMATION a. Distribution of equity security holders
Category (size of holding) Listed shares - Number
Ordinary Shares 1 – 1,000 24
1,001 – 5,000 60
5,001 – 10,000 109
10,001 – 100,000 394
100,001 and over 206
793
Category (size of holding) 12c Share Options (Expiring 31 March 2016)
1 – 1,000 39
1,001 – 5,000 102
5,001 – 10,000 31
10,001 – 100,000 67
100,001 and over 51
290 The Company has 100 unlisted performance shares held by one holder White Lion Group Limited. b. The number of shareholdings held in less than a marketable parcel is 477.
There is no current on-market buy-back
c. The names of the substantial shareholders listed in the holding company’s register as at 31 August 2015 are:
Number Shareholder Ordinary
Shares %
White Lion Group Limited 216,718,266 45.93
UOB Kay Hian Private Ltd 29,222,195 6.19
James Tyson Hamilton 28,511,349 6.04 d. Voting Rights
There are a total of 471,831,740 fully paid ordinary shares on issue. At shareholders’ meetings, each ordinary share is entitled to one vote when a poll is called, otherwise each member present at a meeting or by proxy has one vote on a show of hands. Share options (Quoted and Unquoted) and Performance shares do not have voting rights.
e. Restricted securities or securities subject to voluntary escrow 216,718,266 Fully paid ordinary shares under escrow until 18th August 2016 100 Performance shares under escrow until 18th August 2016
73
For
per
sona
l use
onl
y

ADDITIONAL INFORMATION FOR PUBLICLY LISTED COMPANIES
73
f. 20 Largest Shareholders – Ordinary Shares
Name Number of Ordinary
Fully Paid Shares Held
% Held of Issued Ordinary Capital
1. White Lion Group Ltd 216,718,266 45.93
2. UOB Kay Hian Private Ltd 29,222,195 6.19
3. James Tyson Hamilton 28,511,349 6.04
4. Julie Avotins 13,249,794 2.81
5. Palace Trading Inv Ltd 11,972,109 2.54
6. Citicorp Nominees PL 11,965,000 2.54
7. Russell Neil Creagh 9,543,334 2.02
8. Eralloys Holdings AS 8,650,000 1.83
9. HSBC Custody Nominees Aust Ltd 8,289,452 1.76
10. Mary-Louise Hardwick 7,636,666 1.62
11. Northern Manganese Ltd 6,545,531 1.39
12. RYU FAM PL 6,000,000 1.27
13. Leet Inv PL 4,800,000 1.02
14. Barden Ian Lawton 4,587,000 0.97
15. Leet Inv PL < Super Fund A/c > 4,434,728 0.94
16. JP Morgan Nom Aust Ltd 3,237,654 0.69
17. John Campbell Smyth <Smyth S/F A/c> 2,500,000 0.53
18. Sandhurst TTees Ltd 2,440,636 0.52
19. Jon Alfred Avotins 2,002,795 0.42
20. Gecko Res PL 2,000,000 0.42
TOTAL 384,306,509 81.45
74
For
per
sona
l use
onl
y

ADDITIONAL INFORMATION FOR PUBLICLY LISTED COMPANIES
74
g. 20 Largest Holders – Share Options (12c expiring 31 March 2016)
Name Number of Share Options Held
% Held of Class of Share Options
1. Intersuisse Nom PL 7,180,952 15.95
2. DannyThai Quang 6,098,866 13.55
3. DJ Carmichael PL 2,500,000 5.55
4. Creagh Russell Neil 2,123,174 4.72
5. Goffacan PL 2,000,000 4.44
6. Genesta Holdings PL 2,000,000 4.44
7. Jose Enrique Benedetto 2,000,000 4.44
8. Nicant PL 1,428,717 3.17
9. Barden Ian Lawton + LC 1,195,667 2.66
10. Alnus PL 1,008,700 2.24
11. Andrew J + C L Blatch 1,000,000 2.22
12. Lim Weng Chew + HA Ngoc N 990,000 2.20
13. Paul Raymond Smith 917,475 2.04
14. Damere PL 854,047 1.90
15. Oak Stream PL 744,565 1.65
16. Joshua Karl Schumacher 582,525 1.29
17. Julie Avotins 558,238 1.24
18. Lawrence Crowe Cons PL 555,204 1.23
19. Mark Paul Halley 514,137 1.14
20. Aust Trade Access PL 512,428 1.14
TOTAL 34,764,695 77.21
2. COMPANY SECRETARY The name of the Company Secretary is Russell Hardwick. 3. PRINCIPAL REGISTERED OFFICE The address of the principal registered office in Australia is: 41 York Street SUBIACO WA 6008 Telephone +61 8 6382 3700 4. REGISTER OF SECURITIES Security Transfer Registrars Pty Ltd 770 Canning Highway Applecross WA 6153 Telephone +61 8 9315 2333 5. SECURITIES EXCHANGE LISTING Quotation has been granted for all the ordinary shares, and 12c March 2016 share options of the Company on all Member Exchanges of the Australian Securities Exchange Limited.
75
For
per
sona
l use
onl
y
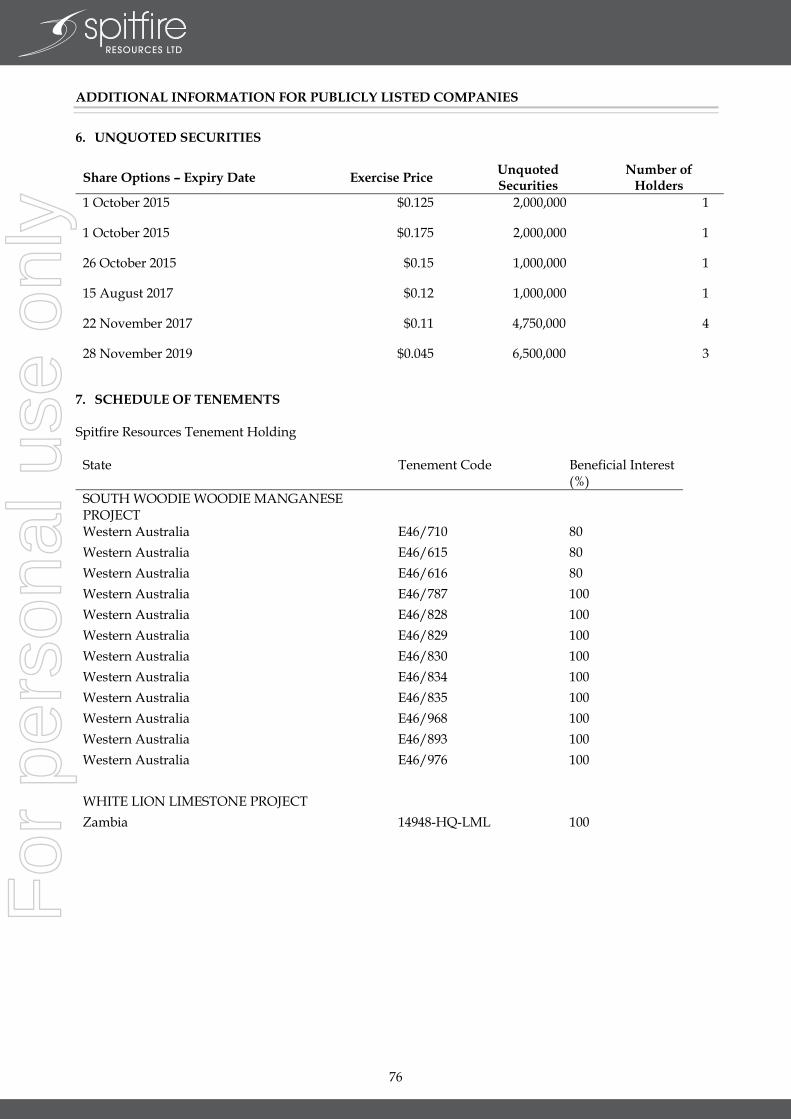
ADDITIONAL INFORMATION FOR PUBLICLY LISTED COMPANIES
75
6. UNQUOTED SECURITIES
Share Options – Expiry Date Exercise Price Unquoted Securities
Number of Holders
1 October 2015 $0.125 2,000,000 1
1 October 2015 $0.175 2,000,000 1
26 October 2015 $0.15 1,000,000 1
15 August 2017 $0.12 1,000,000 1
22 November 2017 $0.11 4,750,000 4
28 November 2019 $0.045 6,500,000 3
7. SCHEDULE OF TENEMENTS Spitfire Resources Tenement Holding
State Tenement Code Beneficial Interest (%)
SOUTH WOODIE WOODIE MANGANESE PROJECT
Western Australia E46/710 80 Western Australia E46/615 80 Western Australia E46/616 80 Western Australia E46/787 100 Western Australia E46/828 100 Western Australia E46/829 100 Western Australia E46/830 100 Western Australia E46/834 100 Western Australia E46/835 100 Western Australia E46/968 100 Western Australia E46/893 100 Western Australia E46/976 100 WHITE LION LIMESTONE PROJECT Zambia 14948-HQ-LML 100
76
For
per
sona
l use
onl
y

For
per
sona
l use
onl
y

ANNUAL REPORT
ABN: 40 125 578 743
www.spitfi reresources.com
For
per
sona
l use
onl
y