Embed Size (px)
Citation preview
MOLOPO ENERGY LIMITED
MOLOPO ENERGY LIMITED
September 2010
For
per
sona
l use
onl
y
MOLOPO ENERGY LIMITED 2
INVESTMENT HIGHLIGHTS
A diversified, globally significant portfolio of unconventional oil and gas projects
Existing 2P reserves of 9.3MMstb of oil and 245Bscf of gas
Substantial land holdings in the leading tight oil and shale gas regions of North America obtained through early mover strategy and distressed asset sales
Significant near term revenue, reserves and cash flow growth to be driven by active development programme in the Bakken and Spearfish plays in the Williston Basin
Longer term value to be created through ongoing exploration, appraisal and development of gas assets in the portfolio
Relatively low risk investment proposition
- Targeting known oil and gas deposits
- Low technology risk
- Experienced management team
Compelling value relative to Canadian and Australian peersFor
per
sona
l use
onl
y
MOLOPO ENERGY LIMITED
Donald Beard
Stephen Mitchell
Geoff Phillips
David Hobday
Ian Gorman
Monty Bowers
Anthony Bishop
Ric Sotelo
Scott Greenshields
Lanny Fenwick
3
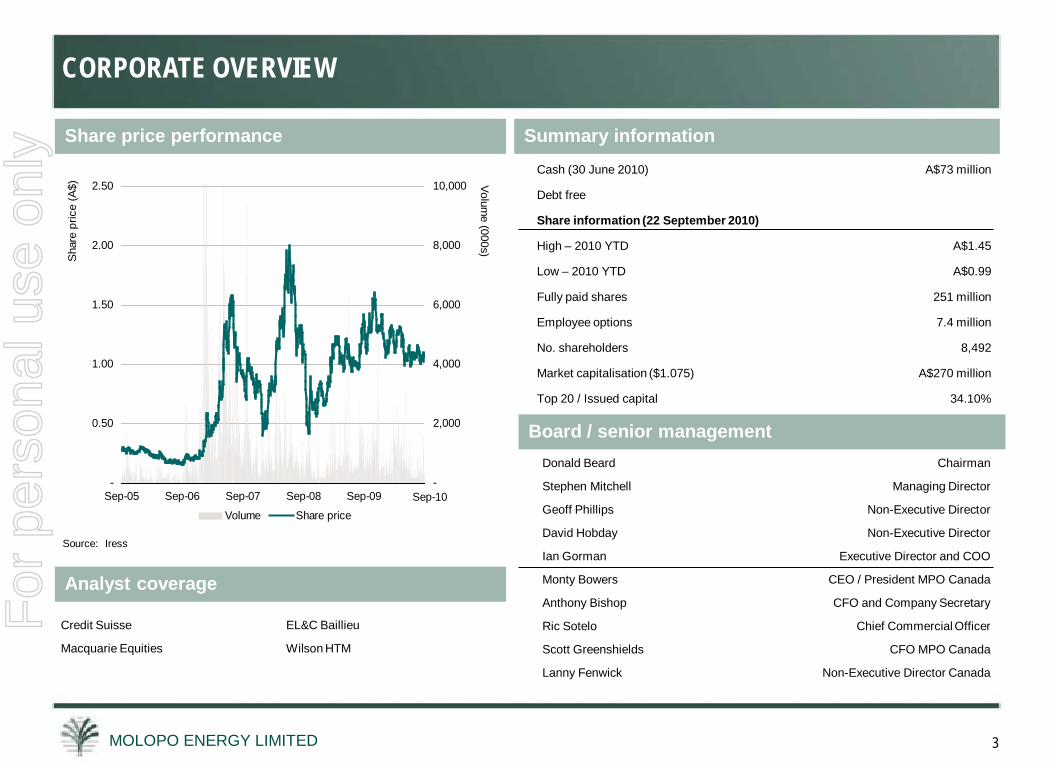
Cash (30 June 2010) A$73 million
Debt free
Share information (22 September 2010)
High – 2010 YTD A$1.45
Low – 2010 YTD A$0.99
Fully paid shares 251 million
Employee options 7.4 million
No. shareholders 8,492
Market capitalisation ($1.075) A$270 million
Top 20 / Issued capital 34.10%
Share price performance Summary information
Board / senior managementChairman
Managing Director
Non-Executive Director
Non-Executive Director
Executive Director and COO
CEO / President MPO Canada
CFO and Company Secretary
Chief Commercial Officer
CFO MPO Canada
Non-Executive Director Canada
CORPORATE OVERVIEW
Analyst coverage
Credit Suisse EL&C Baillieu
Macquarie Equities Wilson HTM
Source: Iress
-
0.50
1.00
1.50
2.00
2.50
Sep-05 Sep-06 Sep-07 Sep-08 Sep-09
Sha
re p
rice
(A$)
-
2,000
4,000
6,000
8,000
10,000 Volume (000s)
Volume Share priceSep-10
For
per
sona
l use
onl
y
MOLOPO ENERGY LIMITED 4
STRATEGY – PROVING UP AND DEVELOPING KEY RESOURCES
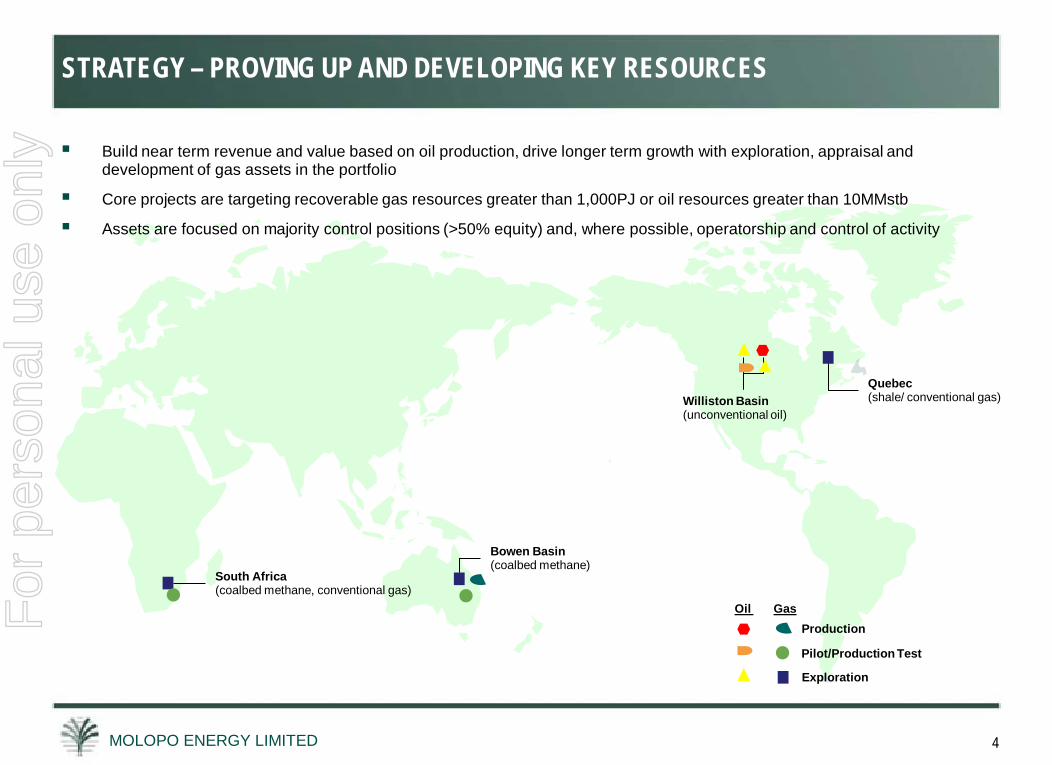
Bowen Basin(coalbed methane)
Quebec(shale/ conventional gas)
South Africa(coalbed methane, conventional gas)
Williston Basin(unconventional oil)
Pilot/Production Test
Production
Exploration
Oil Gas
Build near term revenue and value based on oil production, drive longer term growth with exploration, appraisal and development of gas assets in the portfolio
Core projects are targeting recoverable gas resources greater than 1,000PJ or oil resources greater than 10MMstb
Assets are focused on majority control positions (>50% equity) and, where possible, operatorship and control of activity
For
per
sona
l use
onl
y
MOLOPO ENERGY LIMITED 5
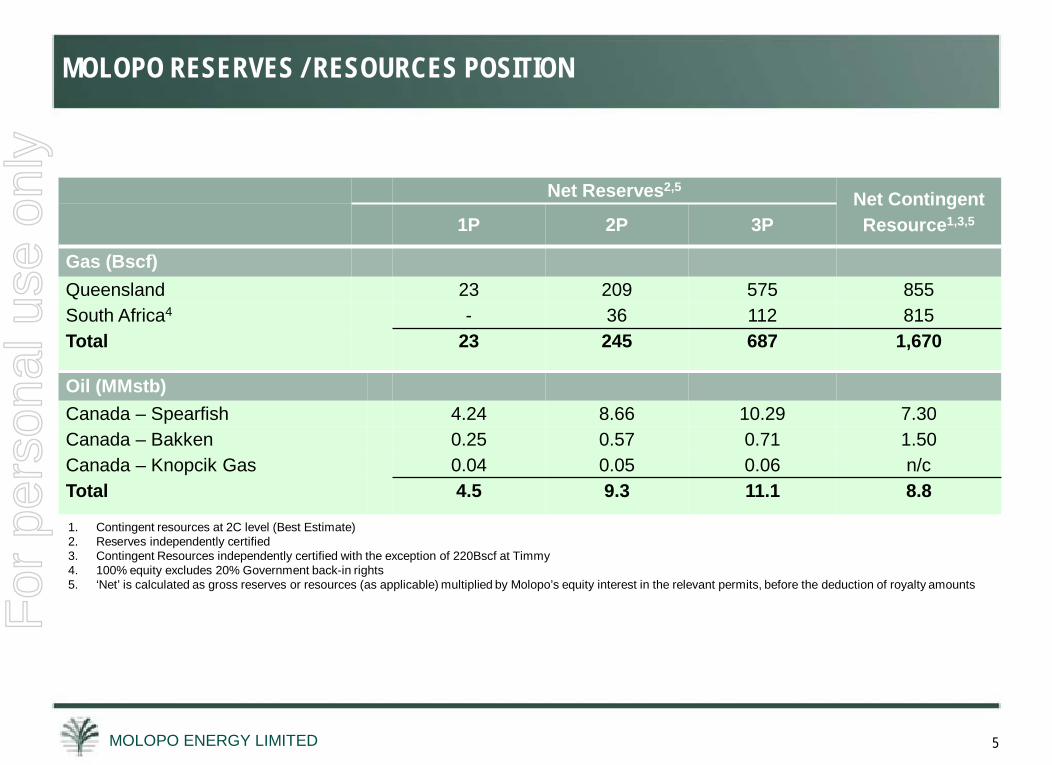
1. Contingent resources at 2C level (Best Estimate)2. Reserves independently certified3. Contingent Resources independently certified with the exception of 220Bscf at Timmy4. 100% equity excludes 20% Government back-in rights5. ‘Net’ is calculated as gross reserves or resources (as applicable) multiplied by Molopo’s equity interest in the relevant permits, before the deduction of royalty amounts
MOLOPO RESERVES / RESOURCES POSITION
Net Reserves2,5Net Contingent Resource1,3,51P 2P 3P
Gas (Bscf)Queensland 23 209 575 855South Africa4 - 36 112 815Total 23 245 687 1,670
Oil (MMstb)Canada – Spearfish 4.24 8.66 10.29 7.30Canada – Bakken 0.25 0.57 0.71 1.50Canada – Knopcik Gas 0.04 0.05 0.06 n/cTotal 4.5 9.3 11.1 8.8
For
per
sona
l use
onl
y
MOLOPO ENERGY LIMITED
MOLOPO ENERGY LIMITEDCANADIAN PROJECTS
66
For
per
sona
l use
onl
y
MOLOPO ENERGY LIMITED 7
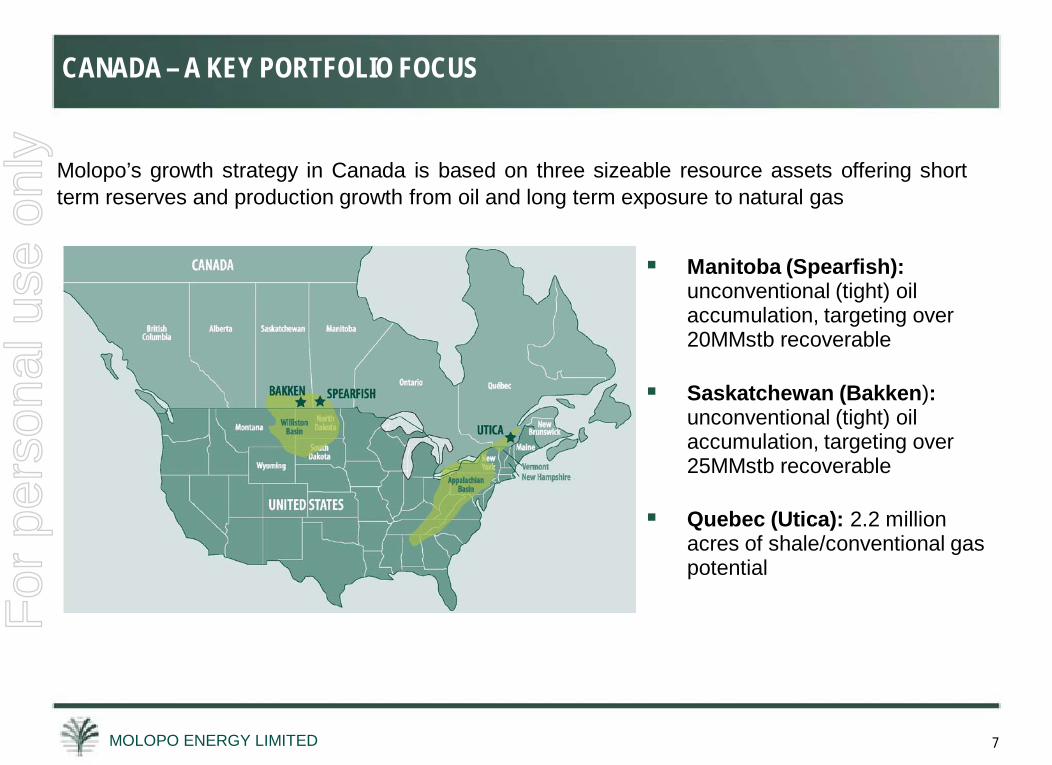
Molopo’s growth strategy in Canada is based on three sizeable resource assets offering shortterm reserves and production growth from oil and long term exposure to natural gas
Manitoba (Spearfish): unconventional (tight) oil accumulation, targeting over 20MMstb recoverable
Saskatchewan (Bakken):unconventional (tight) oil accumulation, targeting over 25MMstb recoverable
Quebec (Utica): 2.2 million acres of shale/conventional gas potential
CANADA – A KEY PORTFOLIO FOCUSF
or p
erso
nal u
se o
nly
MOLOPO ENERGY LIMITED 8
CANADA – RESERVES UPDATE
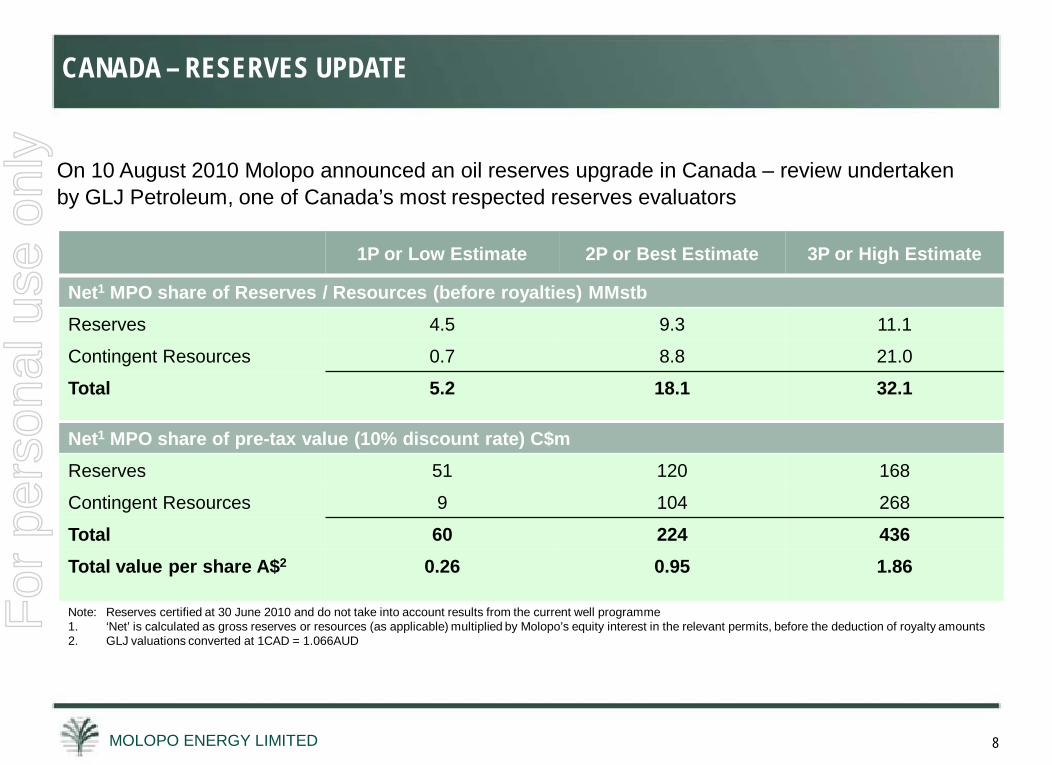
Note: Reserves certified at 30 June 2010 and do not take into account results from the current well programme1. ‘Net’ is calculated as gross reserves or resources (as applicable) multiplied by Molopo’s equity interest in the relevant permits, before the deduction of royalty amounts2. GLJ valuations converted at 1CAD = 1.066AUD
1P or Low Estimate 2P or Best Estimate 3P or High Estimate
Net1 MPO share of Reserves / Resources (before royalties) MMstbReserves 4.5 9.3 11.1
Contingent Resources 0.7 8.8 21.0
Total 5.2 18.1 32.1
Net1 MPO share of pre-tax value (10% discount rate) C$mReserves 51 120 168
Contingent Resources 9 104 268
Total 60 224 436Total value per share A$2 0.26 0.95 1.86
On 10 August 2010 Molopo announced an oil reserves upgrade in Canada – review undertaken by GLJ Petroleum, one of Canada’s most respected reserves evaluators
For
per
sona
l use
onl
y
MOLOPO ENERGY LIMITED
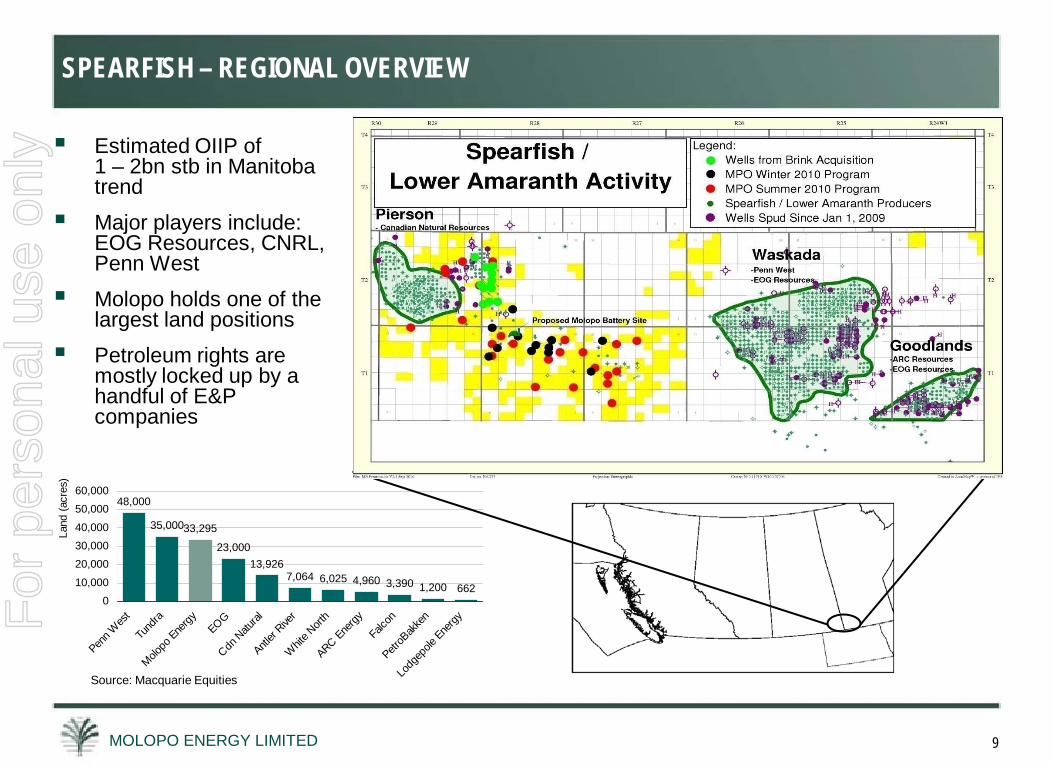
48,000
35,00033,295
23,00013,926
7,064 6,025 4,960 3,390 1,200 6620
10,000
20,00030,00040,000
50,00060,000
Penn W
est
Tund
ra
Molopo
Energy EOG
Cdn N
atural
Antler
River
Whit
e Nort
h
ARC Energy
Falcon
PetroB
akke
n
Lodg
epole
Energy
Land
(acr
es)
9
Estimated OIIP of 1 – 2bn stb in Manitoba trend
Major players include: EOG Resources, CNRL, Penn West
Molopo holds one of the largest land positions
Petroleum rights are mostly locked up by a handful of E&P companies
Source: Macquarie Equities
SPEARFISH – REGIONAL OVERVIEWF
or p
erso
nal u
se o
nly
MOLOPO ENERGY LIMITED 10
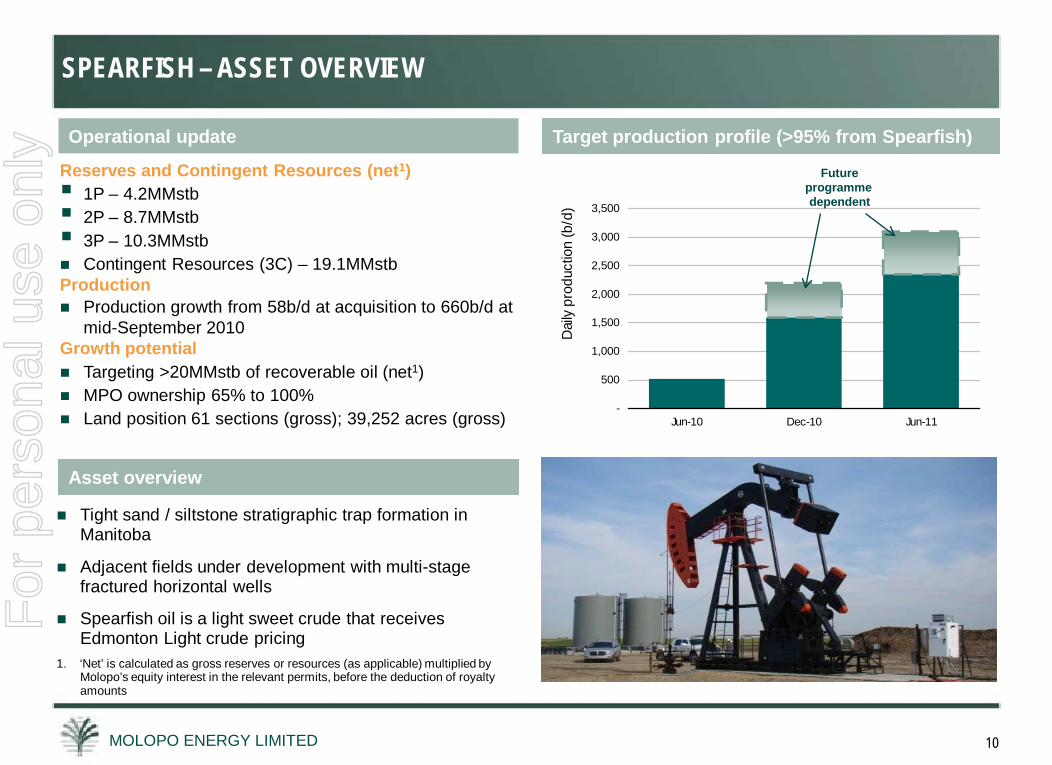
Operational update
Reserves and Contingent Resources (net1) 1P – 4.2MMstb 2P – 8.7MMstb 3P – 10.3MMstb Contingent Resources (3C) – 19.1MMstbProduction Production growth from 58b/d at acquisition to 660b/d at
mid-September 2010Growth potential Targeting >20MMstb of recoverable oil (net1) MPO ownership 65% to 100% Land position 61 sections (gross); 39,252 acres (gross)
Target production profile (>95% from Spearfish)
[Insert production target chart from Spearfish]
-
500
1,000
1,500
2,000
2,500
3,000
3,500
Jun-10 Dec-10 Jun-11
Dai
ly pr
oduc
tion
(b/d
)
SPEARFISH – ASSET OVERVIEW
Asset overview
Tight sand / siltstone stratigraphic trap formation in Manitoba
Adjacent fields under development with multi-stage fractured horizontal wells
Spearfish oil is a light sweet crude that receives Edmonton Light crude pricing
1. ‘Net’ is calculated as gross reserves or resources (as applicable) multiplied by Molopo’s equity interest in the relevant permits, before the deduction of royalty amounts
Future programme dependent
For
per
sona
l use
onl
y
MOLOPO ENERGY LIMITED 11
Activity pre-30 June 2010 Targeted recovery – key assumptions
Core areas (prospective) 30 sections (gross)
Additional exploration land 31 sections (gross)
OIIP per prospective section (average) 12MMstb (gross)
Total OIIP (estimated) – core acreage ~360MMstb (gross)
Recovery factors 10% – 15%
Development potential (12 wells/section) –core acreage 360 wells (gross)
Total ultimate recovery23MMstb (net1) – initial
35MMstb (net1) – eventual
Estimated cost/well ~C$1.5m – $1.8m
Estimated oil recoverable/long horizontal well~ 100,000bbl – initial (GLJ)
~ 150,000bbl (MPO long-term estimate)
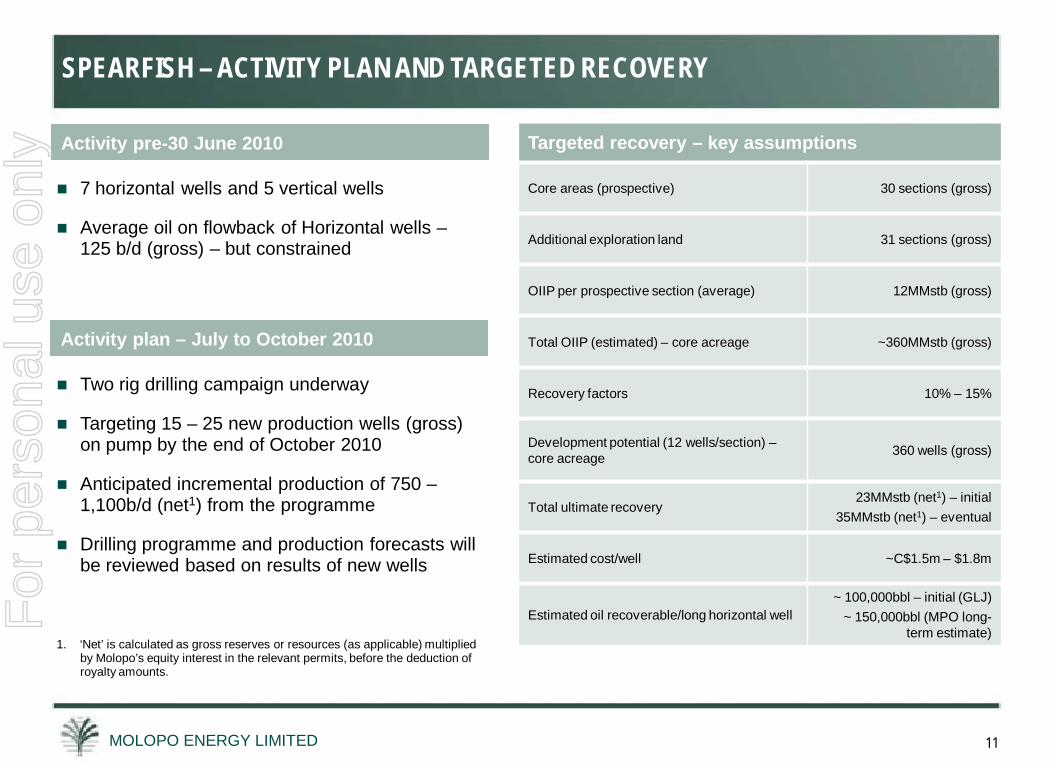
7 horizontal wells and 5 vertical wells
Average oil on flowback of Horizontal wells –125 b/d (gross) – but constrained
Activity plan – July to October 2010
Two rig drilling campaign underway
Targeting 15 – 25 new production wells (gross) on pump by the end of October 2010
Anticipated incremental production of 750 –1,100b/d (net1) from the programme
Drilling programme and production forecasts will be reviewed based on results of new wells
1. ‘Net’ is calculated as gross reserves or resources (as applicable) multiplied by Molopo’s equity interest in the relevant permits, before the deduction of royalty amounts.
SPEARFISH – ACTIVITY PLAN AND TARGETED RECOVERYF
or p
erso
nal u
se o
nly
MOLOPO ENERGY LIMITED 12
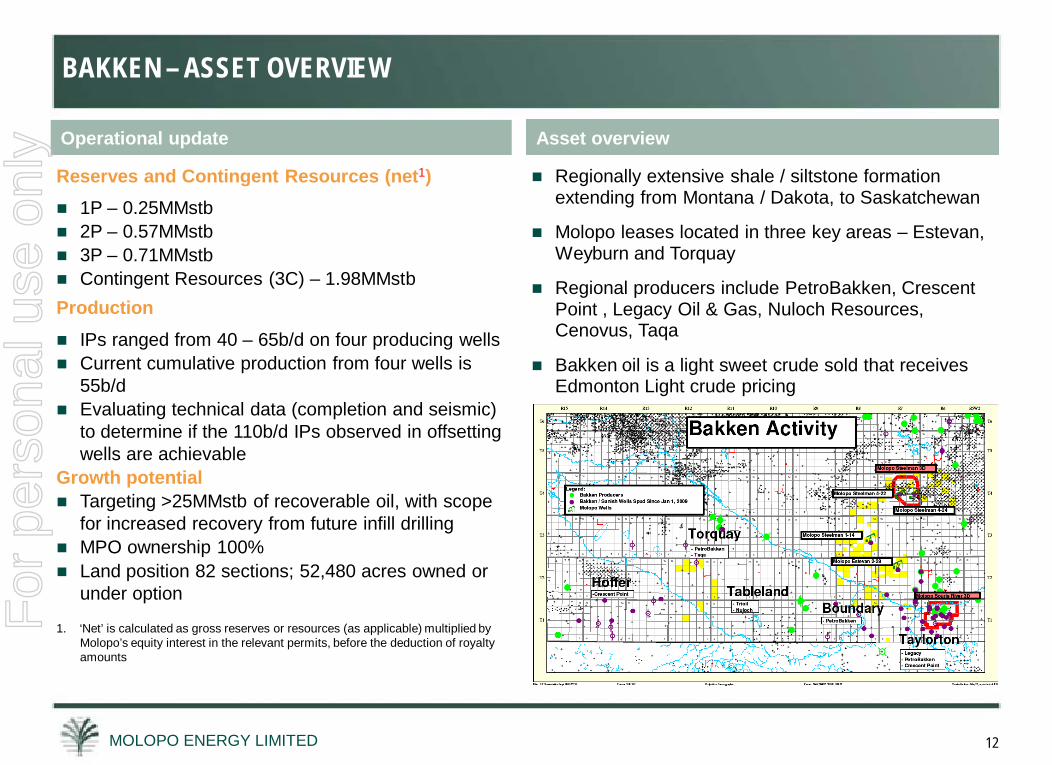
Reserves and Contingent Resources (net1) 1P – 0.25MMstb 2P – 0.57MMstb 3P – 0.71MMstb Contingent Resources (3C) – 1.98MMstbProduction IPs ranged from 40 – 65b/d on four producing wells Current cumulative production from four wells is
55b/d Evaluating technical data (completion and seismic)
to determine if the 110b/d IPs observed in offsetting wells are achievable
Growth potential Targeting >25MMstb of recoverable oil, with scope
for increased recovery from future infill drilling MPO ownership 100% Land position 82 sections; 52,480 acres owned or
under option
1. ‘Net’ is calculated as gross reserves or resources (as applicable) multiplied by Molopo’s equity interest in the relevant permits, before the deduction of royalty amounts
Operational update
BAKKEN – ASSET OVERVIEW
Asset overview
Regionally extensive shale / siltstone formation extending from Montana / Dakota, to Saskatchewan
Molopo leases located in three key areas – Estevan, Weyburn and Torquay
Regional producers include PetroBakken, Crescent Point , Legacy Oil & Gas, Nuloch Resources, Cenovus, Taqa
Bakken oil is a light sweet crude sold that receives Edmonton Light crude pricing
For
per
sona
l use
onl
y
MOLOPO ENERGY LIMITED 13
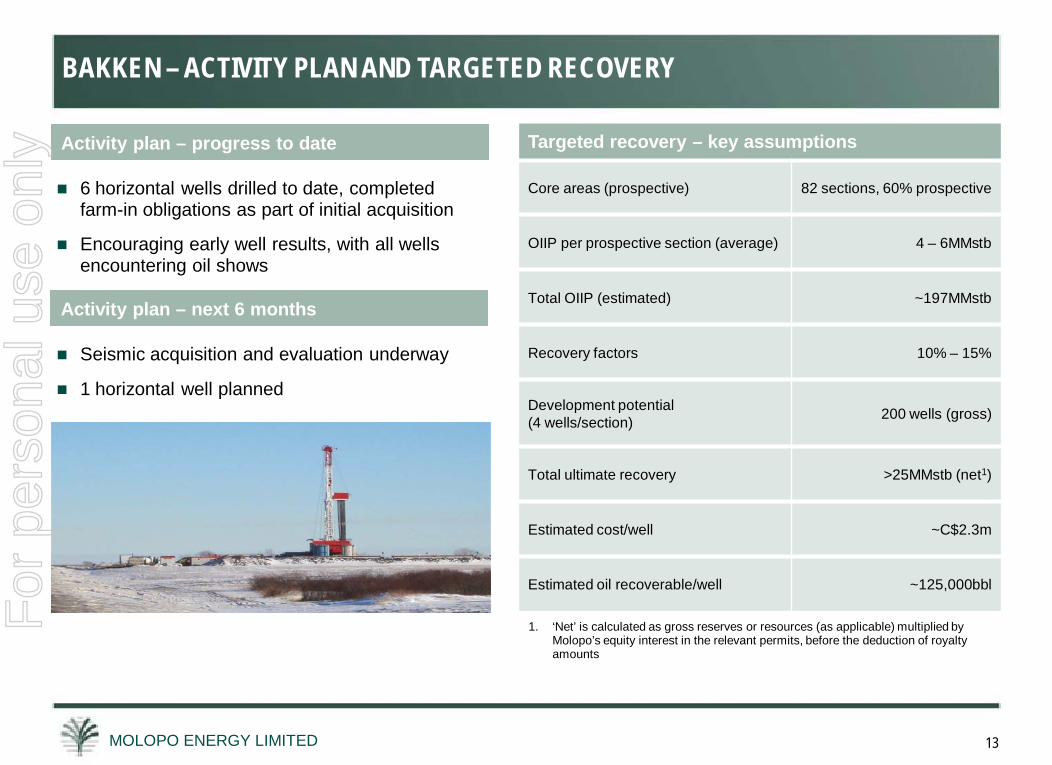
Activity plan – progress to date Targeted recovery – key assumptions
Core areas (prospective) 82 sections, 60% prospective
OIIP per prospective section (average) 4 – 6MMstb
Total OIIP (estimated) ~197MMstb
Recovery factors 10% – 15%
Development potential (4 wells/section) 200 wells (gross)
Total ultimate recovery >25MMstb (net1)
Estimated cost/well ~C$2.3m
Estimated oil recoverable/well ~125,000bbl
6 horizontal wells drilled to date, completed farm-in obligations as part of initial acquisition
Encouraging early well results, with all wells encountering oil shows
Activity plan – next 6 months
Seismic acquisition and evaluation underway
1 horizontal well planned
BAKKEN – ACTIVITY PLAN AND TARGETED RECOVERY
1. ‘Net’ is calculated as gross reserves or resources (as applicable) multiplied by Molopo’s equity interest in the relevant permits, before the deduction of royalty amounts
For
per
sona
l use
onl
y
MOLOPO ENERGY LIMITED 14
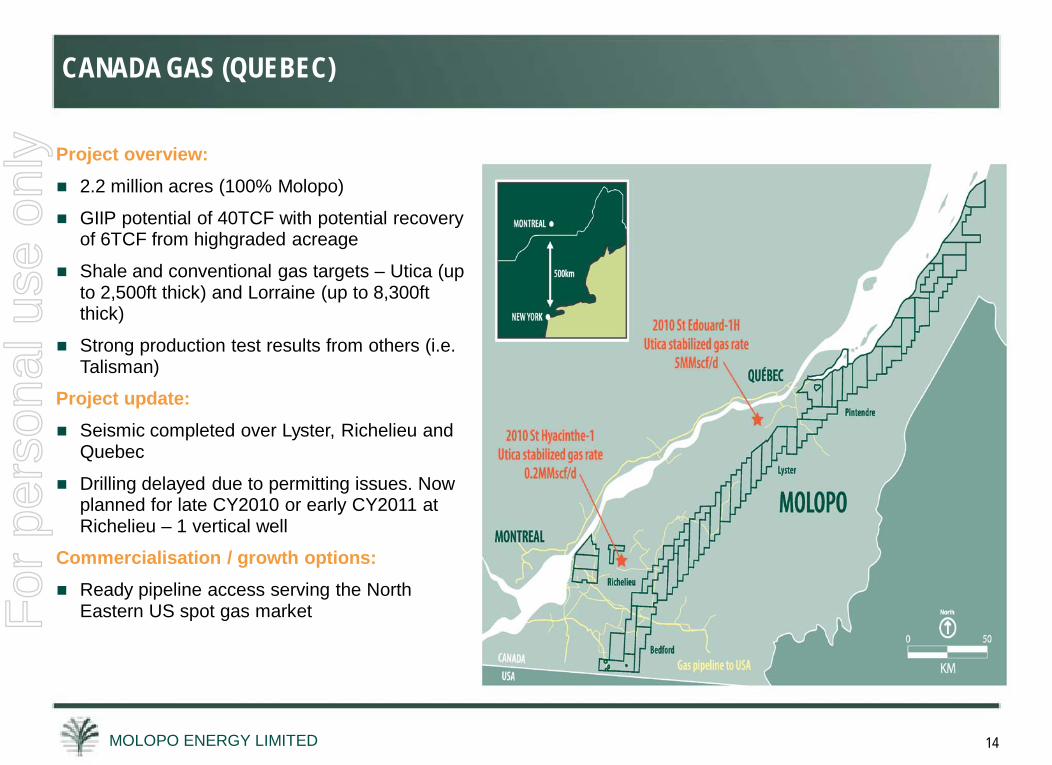
Project overview: 2.2 million acres (100% Molopo)
GIIP potential of 40TCF with potential recovery of 6TCF from highgraded acreage
Shale and conventional gas targets – Utica (up to 2,500ft thick) and Lorraine (up to 8,300ft thick)
Strong production test results from others (i.e. Talisman)
Project update: Seismic completed over Lyster, Richelieu and
Quebec
Drilling delayed due to permitting issues. Now planned for late CY2010 or early CY2011 at Richelieu – 1 vertical well
Commercialisation / growth options: Ready pipeline access serving the North
Eastern US spot gas market
CANADA GAS (QUEBEC)F
or p
erso
nal u
se o
nly
MOLOPO ENERGY LIMITED
MOLOPO ENERGY LIMITEDAUSTRALIAN PROJECTS
For
per
sona
l use
onl
y
MOLOPO ENERGY LIMITED 16
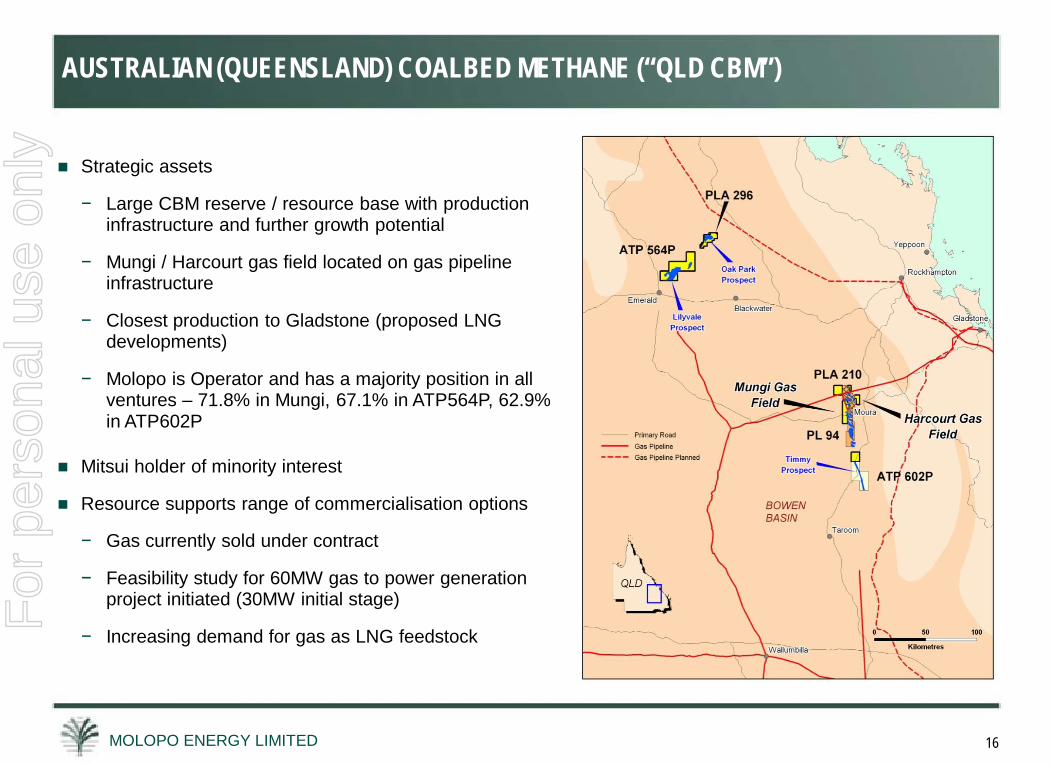
Strategic assets
− Large CBM reserve / resource base with production infrastructure and further growth potential
− Mungi / Harcourt gas field located on gas pipeline infrastructure
− Closest production to Gladstone (proposed LNG developments)
− Molopo is Operator and has a majority position in all ventures – 71.8% in Mungi, 67.1% in ATP564P, 62.9% in ATP602P
Mitsui holder of minority interest
Resource supports range of commercialisation options
− Gas currently sold under contract
− Feasibility study for 60MW gas to power generation project initiated (30MW initial stage)
− Increasing demand for gas as LNG feedstock
AUSTRALIAN (QUEENSLAND) COALBED METHANE (“QLD CBM”)F
or p
erso
nal u
se o
nly
MOLOPO ENERGY LIMITED 17
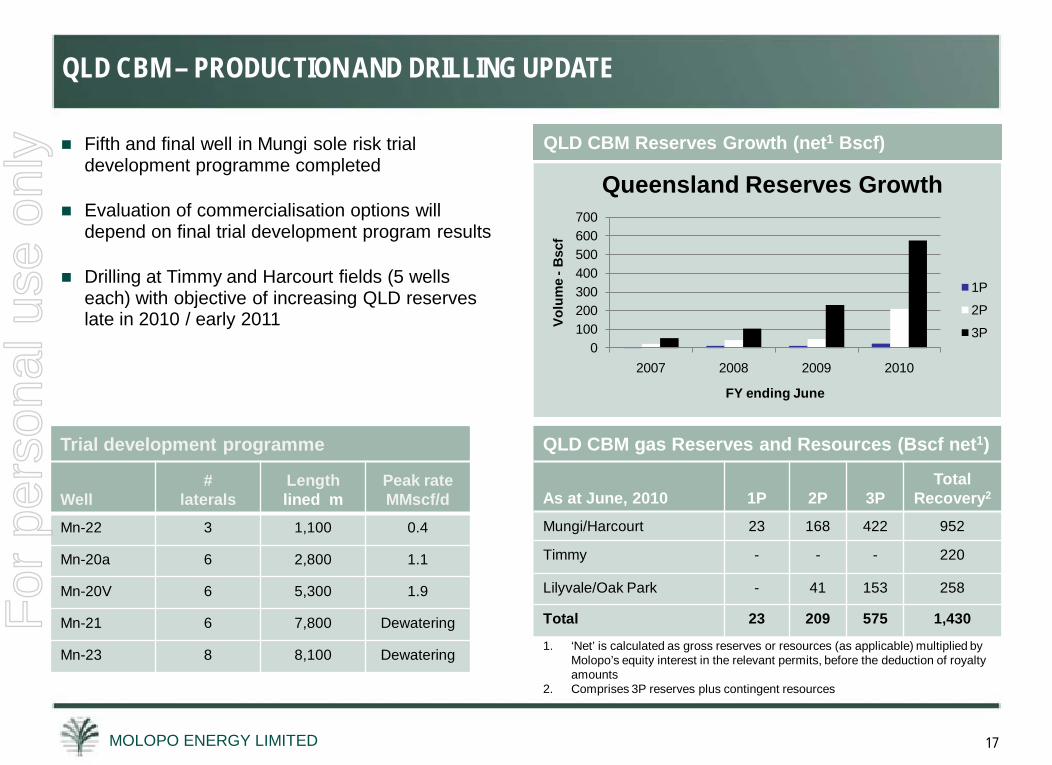
Trial development programme
Well#
laterals Lengthlined m
Peak rate MMscf/d
Mn-22 3 1,100 0.4
Mn-20a 6 2,800 1.1
Mn-20V 6 5,300 1.9
Mn-21 6 7,800 Dewatering
Mn-23 8 8,100 Dewatering
Fifth and final well in Mungi sole risk trial development programme completed
Evaluation of commercialisation options will depend on final trial development program results
Drilling at Timmy and Harcourt fields (5 wells each) with objective of increasing QLD reserves late in 2010 / early 2011
QLD CBM – PRODUCTION AND DRILLING UPDATE
QLD CBM gas Reserves and Resources (Bscf net1)
As at June, 2010 1P 2P 3PTotal
Recovery2
Mungi/Harcourt 23 168 422 952
Timmy - - - 220
Lilyvale/Oak Park - 41 153 258
Total 23 209 575 1,430
QLD CBM Reserves Growth (net1 Bscf)
0100200300400500600700
2007 2008 2009 2010
Volu
me
-Bsc
f
FY ending June
Queensland Reserves Growth
1P
2P
3P
1. ‘Net’ is calculated as gross reserves or resources (as applicable) multiplied by Molopo’s equity interest in the relevant permits, before the deduction of royalty amounts
2. Comprises 3P reserves plus contingent resources
For
per
sona
l use
onl
y
MOLOPO ENERGY LIMITED 18
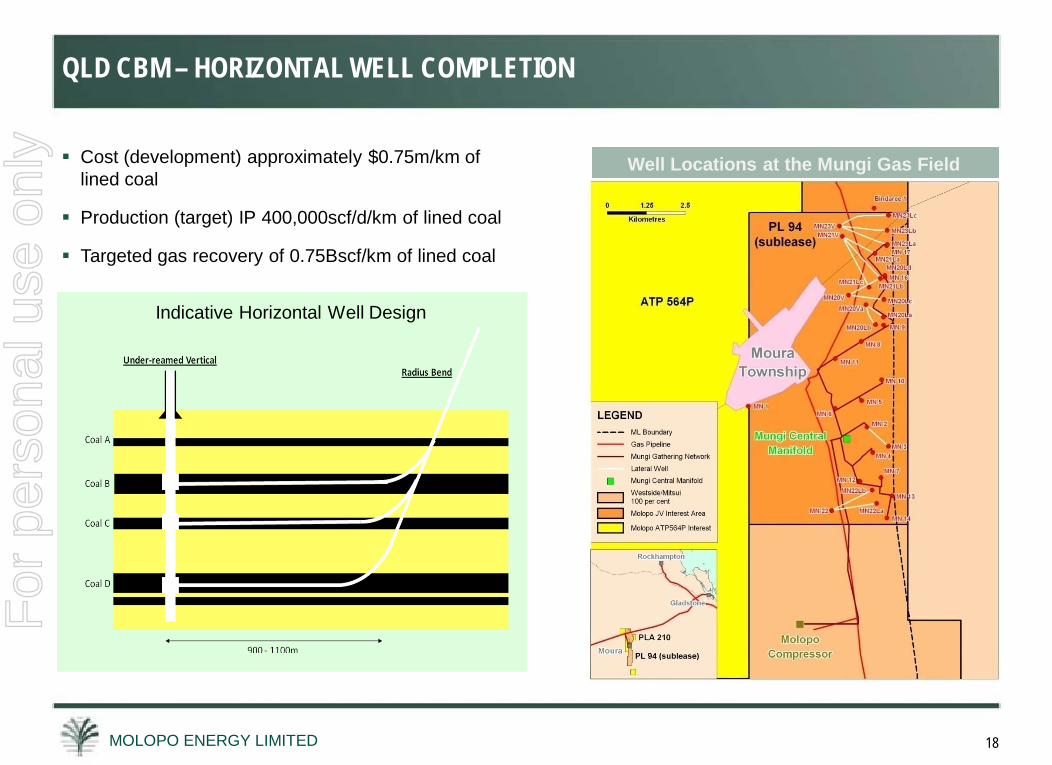
QLD CBM – HORIZONTAL WELL COMPLETION
Cost (development) approximately $0.75m/km of lined coal
Production (target) IP 400,000scf/d/km of lined coal
Targeted gas recovery of 0.75Bscf/km of lined coal
Indicative Horizontal Well Design
Well Locations at the Mungi Gas Field
For
per
sona
l use
onl
y
MOLOPO ENERGY LIMITED
MOLOPO ENERGY LIMITEDSOUTH AFRICAN PROJECTS
For
per
sona
l use
onl
y
MOLOPO ENERGY LIMITED 20
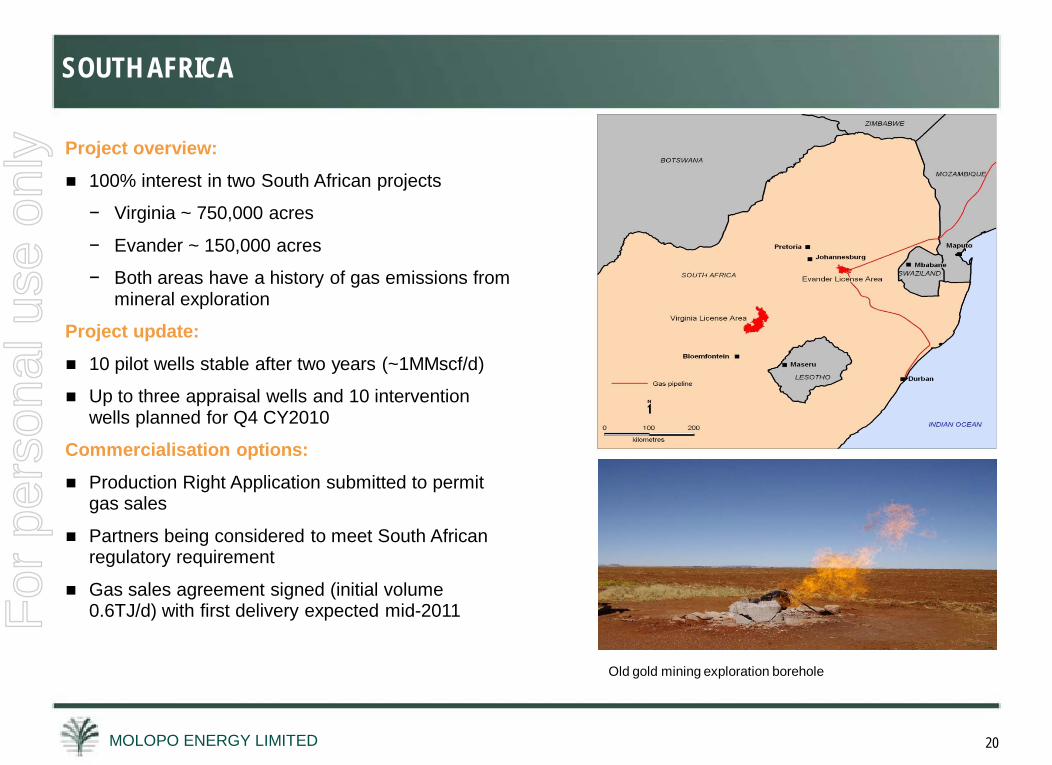
Project overview:
100% interest in two South African projects
− Virginia ~ 750,000 acres
− Evander ~ 150,000 acres
− Both areas have a history of gas emissions from mineral exploration
Project update:
10 pilot wells stable after two years (~1MMscf/d)
Up to three appraisal wells and 10 intervention wells planned for Q4 CY2010
Commercialisation options:
Production Right Application submitted to permit gas sales
Partners being considered to meet South African regulatory requirement
Gas sales agreement signed (initial volume 0.6TJ/d) with first delivery expected mid-2011
Old gold mining exploration borehole
SOUTH AFRICAF
or p
erso
nal u
se o
nly

MOLOPO ENERGY LIMITED
MOLOPO ENERGY LIMITEDSUMMARY
For
per
sona
l use
onl
y
MOLOPO ENERGY LIMITED 22
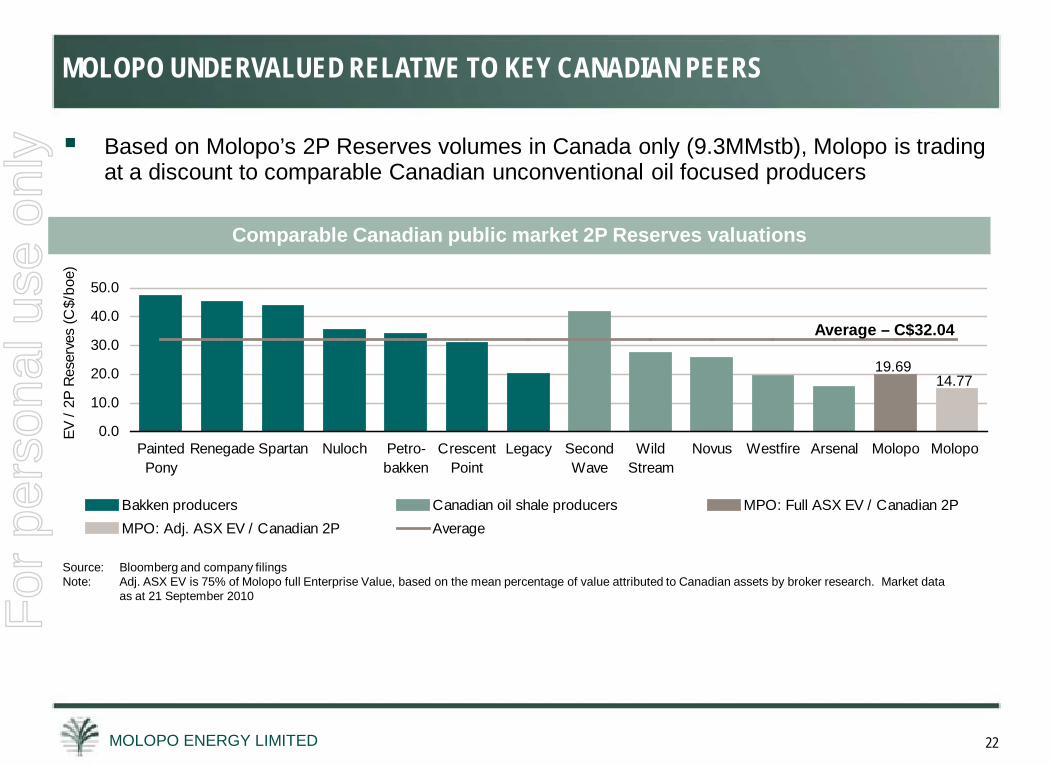
Based on Molopo’s 2P Reserves volumes in Canada only (9.3MMstb), Molopo is trading at a discount to comparable Canadian unconventional oil focused producers
Comparable Canadian public market 2P Reserves valuations
Source: Bloomberg and company filingsNote: Adj. ASX EV is 75% of Molopo full Enterprise Value, based on the mean percentage of value attributed to Canadian assets by broker research. Market data
as at 21 September 2010
MOLOPO UNDERVALUED RELATIVE TO KEY CANADIAN PEERS
19.6914.77
0.0
10.0
20.0
30.0
40.0
50.0
PaintedPony
Renegade Spartan Nuloch Petro-bakken
CrescentPoint
Legacy SecondWave
WildStream
Novus Westfire Arsenal Molopo Molopo
EV /
2P R
eser
ves
(C$/
boe)
Bakken producers Canadian oil shale producers MPO: Full ASX EV / Canadian 2PMPO: Adj. ASX EV / Canadian 2P Average
Average – C$32.04
For
per
sona
l use
onl
y
MOLOPO ENERGY LIMITED 23
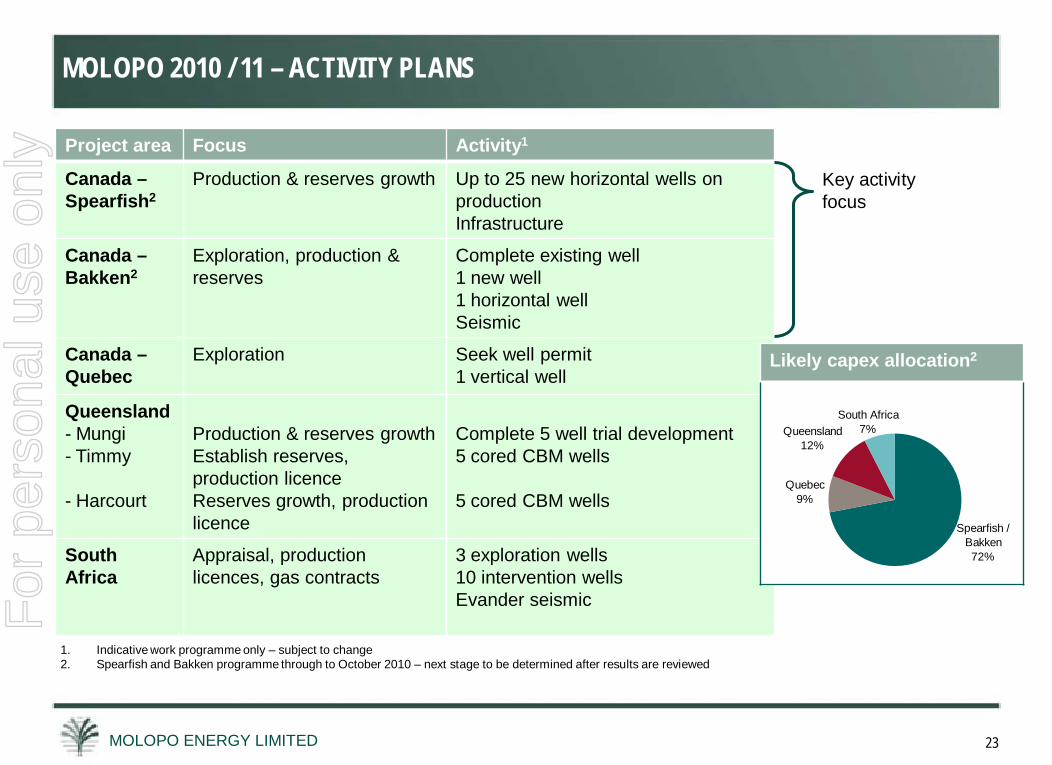
Project area Focus Activity1
Canada –Spearfish2
Production & reserves growth Up to 25 new horizontal wells on productionInfrastructure
Canada –Bakken2
Exploration, production & reserves
Complete existing well1 new well1 horizontal wellSeismic
Canada –Quebec
Exploration Seek well permit1 vertical well
Queensland- Mungi- Timmy
- Harcourt
Production & reserves growthEstablish reserves, production licenceReserves growth, production licence
Complete 5 well trial development5 cored CBM wells
5 cored CBM wells
South Africa
Appraisal, production licences, gas contracts
3 exploration wells10 intervention wellsEvander seismic
1. Indicative work programme only – subject to change2. Spearfish and Bakken programme through to October 2010 – next stage to be determined after results are reviewed
Key activity focus
MOLOPO 2010 / 11 – ACTIVITY PLANS
Likely capex allocation2
Quebec9%
Queensland12%
South Africa7%
Spearfish / Bakken72%
For
per
sona
l use
onl
y
MOLOPO ENERGY LIMITED 24
The information in this presentation has been compiled by persons meeting the criteria in ASX Listing Rule 5.11. The identity of the relevant persons is dealt with in the releases to ASX.
References to “possible hydrocarbon reserves”, “probable hydrocarbon reserves” and “proved hydrocarbon reserves” have the same meaning as the ASX Listing Rules. The assessment of reserves involves matters of judgement. All amounts involve varying degrees of probability and uncertainty.
This presentation contains forward looking statements, i.e. statements that are not of historical fact. Such forward looking statements include statements regarding Molopo’s future production, profitability, financial position and cash-flow, Molopo’s business strategy, the plans and objectives of Molopo’s management for future operations, Molopo’s development plans, and Molopo’s reserve and resource positions.
Actual results, performance, achievements, outcomes or occurrences may be materially different from any forecast, prediction, estimate or other forward looking statement in this presentation, including those implied by any such forward looking statements.
Forward looking statements are based on numerous assumptions regarding Molopo’s present and future business strategies and the environment in which Molopo will operate in the future. Among the important factors that could cause Molopo’s actual results, performance or achievements to differ materially from any prediction, estimate, forecast or other forward looking statement in this presentation are – changes in levels of demand and market prices, increases in relevant input costs, drilling and production results, producible reserves being lower than anticipated, technical and other problems in the production and transportation of products, loss of market, delays in implementing projects, the impact of foreign currency exchange rates on market prices and operating costs, operational problems, political uncertainty, economic conditions in relevant areas of the world, actions of competitors, and the activities of governmental authorities (including changes in taxation, business regulation, environmental laws and fiscal policy).
The uncertainties and risks affecting forward looking statements should be taken into account when considering them and the extent to which it is prudent make decisions based on them.
All forward looking statements are applicable only as of the date of this presentation. Molopo disclaims any obligation or undertaking (except as required by applicable laws) to up-date or revise any forward looking statement to reflect any change in Molopo’s expectations or assessment regarding any such forward looking statement.
Nothing in this presentation is to be regarded as constituting advice or a recommendation regarding the making of any investment in Molopo or any dealing in securities of Molopo.
DISCLAIMERF
or p
erso
nal u
se o
nly
MOLOPO ENERGY LIMITED 25
For
per
sona
l use
onl
y