Embed Size (px)
Citation preview

DANAKALI LTD
ABN 56 097 904 302
AUDITED FINANCIAL REPORT
FOR THE YEAR ENDED
31 DECEMBER 2017
For
per
sona
l use
onl
y

Corporate Information
DANAKALI LIMITED ABN 56 097 904 302
2
Directors
Seamus Ian Cornelius (Non-Executive Chairman) Paul Michael Donaldson (Non-Executive Director) John Daniel Fitzgerald (Non-Executive Director) Zhang Jing (Non-Executive Director) Robert Gordon Connochie (Non-Executive Director) Andre Liebenberg (Non-Executive Director)
Executive Management
Danny Goeman (Chief Executive Officer) Stuart Tarrant (Chief Financial Officer)
Company Secretary
Catherine Grant Edwards (Joint Company Secretary) Melissa Chapman (Joint Company Secretary)
Registered Office and Principal Place of Business
Level 1, 234 Churchill Avenue Churchill Court SUBIACO WA 6008 Telephone: +61 (0)8 6315 1444
Bank
National Australia Bank Level 12, 100 St Georges Terrace PERTH WA 6005
Share Register
Computershare Investor Services Pty Limited Level 11, 172 St Georges Terrace PERTH WA 6000 Telephone: 1300 850 505 (Inside Australia) +61 (0)3 9415 4000 (Outside Australia) Facsimile: +61 (0)3 9473 2500 www.computershare.com
Auditors
Ernst and Young
11 Mounts Bay Road
PERTH WA 6000
Website
www.danakali.com
Stock Exchange Listing
Danakali Ltd (Code: DNK) is listed on the Australian Securities Exchange with trading available on the Frankfurt and Berlin exchange:
Frankfurt: SO3-Fra: http://en.boerse-frankfurt.de/stock/Danakali-share
Berlin: SO3-Ber: https://www.boerse-berlin.de/index.php/Aktien?isin=AU000000DNK9
American Depository Receipts
The Bank of New York Mellon sponsors DNK's Level 1 American Depository Receipts Program (ADR) in the United States of America. DNK's ADRs are traded on the over-the-counter (OTC) securities market in the US under the symbol DNKLY and CUSIP: 23585T101. One ADR represents one ordinary share in DNK.
US OTC Market information is available here: http://www.otcmarkets.com/stock/DNKLY/quote
DNK's ADR information can also be viewed here: https://www.adrbnymellon.com/?cusip=23585T101
ADR Holders seeking information on their shareholding should contact: [email protected] OR
LONDON NEW YORK
Mark Lewis Rick Maehr
[email protected] [email protected]
Telephone +44 207 163 7407 Telephone +1 212 815 2275
For
per
sona
l use
onl
y

Contents
DANAKALI LIMITED ABN 56 097 904 302
3
Page
Directors' Report 4
Audit Independence Declaration 30
Consolidated Statement of Profit or Loss and Other Comprehensive Income 31
Consolidated Statement of Financial Position 32
Consolidated Statement of Changes in Equity 33
Consolidated Statement of Cash Flows 34
Notes to the Consolidated Financial Statements 35
Directors' Declaration 59
Independent Audit Report 60
For
per
sona
l use
onl
y

Directors’ Report
DANAKALI LIMITED ABN 56 097 904 302
4
The directors present their report together with the financial statements of the consolidated entity being, Danakali Ltd (“Danakali” or the “Company”) and its controlled entities (“the Group”) for the financial year ended 31 December 2017.
DIRECTORS
The names and details of the Company’s directors in office during the financial period and until the date of this report are as follows. Where applicable, all current and former directorships held in listed public companies over the last three years have been detailed below. Directors were in office for this entire period unless otherwise stated.
Names, qualifications, experience and special responsibilities:
Seamus Ian Cornelius
Non-Executive Chairman, LLB, LLM, appointed 15 July 2013
Mr Cornelius is a corporate lawyer and former partner of one of Australia’s leading international law firms. He has a high degree of expertise in cross-border transactions, particularly in the resources and finance sectors.
Mr Cornelius has been based in China since 1993, and has advised global companies, banks, major resource companies and Chinese State-owned entities on resource project investments both within China and abroad.
Mr Cornelius is currently the Non-Executive Chairman of Buxton Resources Ltd (appointed 29 November 2010), Montezuma Mining Company Ltd (appointed 30 June 2011), and Duketon Mining Ltd (appointed 8 February 2013).
Special Responsibilities:
Mr Cornelius is a member of the Audit Committee and a member of the Technical and Risk Committee.
Paul Michael Donaldson
Managing Director and Chief Executive Officer; Master’s Degree - Mining Engineering, Master’s Degree - Business and Technology, BEng Chemical (Honours, University Medal), Assoc Dip. Applied Science (Metallurgy), initially appointed Chief Operating Officer 29 November 2012, transitioned to Chief Executive Officer 1 February 2013 and additionally appointed Managing Director 29 April 2014, transitioned from Chief Executive Office and Managing Director role to Non-Executive Director role on 21 December 2017.
Mr Donaldson joined Danakali from a series of senior management roles spanning more than 25 years with BHP Billiton (“BHP”). At BHP Mr Donaldson managed large scale, open cut mining operations, significant growth and sustaining capital projects, and complex pyro metallurgical, beneficiation and manufacturing processes. Mr Donaldson headed the BHP Carbon Steel Materials Technical Marketing Team, managed the Port Hedland iron ore facility as well as occupying key roles in product and infrastructure planning across large scale supply chains.
Mr Donaldson also brings extensive experience in high-level business improvement and logistics from base metal operations and a high degree of integrated supply chain management, technical operational management and frontline leadership experience in the steel industry.
Special Responsibilities:
Mr Donaldson is a Chairman of the Technical and Risk Committee and a member of the Remuneration and Nomination Committee.
John Daniel Fitzgerald
Independent Non-Executive Director, CA, appointed 19 February 2015
Mr Fitzgerald has over 30 years of finance and corporate advisory experience in the resource sector.
Previously, he held senior positions at NM Rothschild and Sons, Investec Bank Australia, Commonwealth Bank, HSBC Precious Metals and Optimum Capital.
Mr Fitzgerald is Non-Executive Chairman of Carbine Resources Limited (appointed 13 April 2016) and Novo Litio Minerals Limited (appointed 23 December 2015) and a Non-Executive Director of Northern Star Resources Limited (appointed 30 November 2012),
Previously Mr Fitzgerald was Non-Executive Chairman of Atherton Resources Limited (14 December 2009 to 9 November 2015).
Mr Fitzgerald is a Chartered Accountant, a Fellow of the Financial Services Institute of Australasia (FINSIA) and a graduate member of the Australian Institute of Company Directors.
Special Responsibilities:
Mr Fitzgerald is Chairman of the Audit Committee and member of the Remuneration and Nomination Committee.
For
per
sona
l use
onl
y

Directors’ Report
DANAKALI LIMITED ABN 56 097 904 302
5
Zhang Jing
Non-Executive Director, M. Sc, appointed 17 June 2016
Ms Zhang has more than 15 years of international trading and business development experience in China and previously held investment and project managerial roles in public listed companies.
Ms Zhang holds a Master’s degree in International Consultancy and Accounting from the university or Reading in the United Kingdom.
Special Responsibilities:
None
Robert Gordon Connochie
Independent Non-Executive Director, B.A. Sc, M.B.A., appointed 6 February 2017
Mr Connochie is a highly-experienced potash and mining specialist with over 40 years of industry experience. He brings extensive senior line management experience from the potash industry, including marketing, corporate development, evaluations, financing and acquisitions.
Previously, Mr. Connochie held positions as Chairman of Canpotex (a world leading potash exporter for over 40 years) and Chairman of Behre Dolbear Capital, Inc.
Further, Mr Connochie was Chairman and CEO of Potash Company of America, CEO Asia Pacific Potash, Director of Athabasca Potash, Chairman of the Phosphate and Potash Institute, Director of the Fertiliser Institute, and Director of the Saskachewan Potash Producers Association.
Special Responsibilities:
Mr Connochie is a member of the Technical and Risk Committee.
Andre Liebenberg
Independent Non-Executive Director, MBA, BSc (Elec) Eng., appointed 2 October 2017
Mr. Liebenberg is an experienced mining industry professional with extensive investor, market, finance, business development and leadership experience, and has spent over 25 years in private equity, investment banking, and held senior roles within QKR Corporation and BHP Billiton.
In a previous role, Mr. Liebenberg had the opportunity to visit Eritrea and is familiar with the jurisdiction. In addition to the CFO role at QKR Corporation, Mr. Liebenberg occupied senior executive roles within BHP Billiton including Head of Group Investor Relations, as well as CFO roles for the Energy Coal and Diamonds and Speciality Products divisions. These roles were based in London, Melbourne and Sydney.
Mr. Liebenberg’s experience within BHP Billiton also included key roles in the BHP Billiton merger, the bid for Rio Tinto and the bid for Potash Corp. of Saskatchewan. Prior to BHP Billiton, Mr. Liebenberg worked at UBS in London and Standard Bank Group in South Africa.
Special Responsibilities:
Mr Liebenberg is Chairman of the Remuneration and Nomination Committee and a member of the Audit Committee.
Anthony William Kiernan
Independent Non-Executive Director, LLB, appointed 15 October 2012, resigned 6 February 2017
Mr Kiernan has over 25 years of experience in the mining industry and was previously a commercial lawyer. He is currently a corporate advisor and has extensive experience in the administration and operation of public listed companies. He brings skills in the areas of Government relations, corporate strategy and corporate governance.
Mr Kiernan is currently the Non-Executive Chairman of Pilbara Minerals Ltd (appointed 1 July 2016), Venturex Resources Limited (appointed 14 July 2010) and Chalice Gold Mines Ltd (appointed 15 February 2007).
In addition, Mr Kiernan is Chairman of the Fiona Wood Foundation which focuses on research into burn injuries.
Previously Mr Kiernan was Non-Executive Chairman of BC Iron Ltd (11 October 2006 until 7 December 2016).
Special Responsibilities:
During his appointment Mr Kiernan was Chairman of the Remuneration and Nomination Committee and a member of the Audit and Risk Committee.
For
per
sona
l use
onl
y
Directors’ Report
DANAKALI LIMITED ABN 56 097 904 302
6
Liam Raymond Cornelius
Non-Executive Director, BApp.Sc, appointed 21 August 2001, resigned 17 November 2017
Mr Cornelius graduated from Curtin University of Technology with a BApp.Sc in Geology and has been involved in the exploration industry within Australia, Asia and Africa for over 20 years. Mr Cornelius has experience with a wide range of commodities including gold, nickel, copper, platinum, uranium and potash.
As a founding member of Danakali Ltd, Mr Cornelius has played a key role in outlining areas of interest for the Company.
Special Responsibilities:
During his appointment Mr Cornelius was a member of the Remuneration and Nomination Committee.
COMPANY SECRETARY
Catherine Grant-Edwards and Melissa Chapman
Appointed Joint Company Secretary 7 July 2017
Ms Melissa Chapman (Certified Practicing Accountant (CPA), AGIA/ACIS, GAICD) and Ms Catherine Grant-Edwards (Chartered Accountant (CA)) were appointed as Joint Company Secretary on 7 July 2017. Ms Chapman and Ms Grant-Edwards are directors of Bellatrix Corporate Pty Ltd (Bellatrix), a company that provides company secretarial and accounting services to a number of ASX listed company. Between them, Ms Chapman and Ms Grant-Edwards have over 30 years’ experience in the provision of accounting, finance and company secretarial services to public listed resource and private companies in Australia and the UK, and in the field of public practice external audit.
Christiaan Philippus Els
B. Com (Hons), CA, appointed 1 February 2016, resigned 7 July 2017
Mr Els is an associate member of the Chartered Institute of Management Accountants, a member of the Certified Practicing Accountants of Australia and the Chartered Global Management Accountants. Mr Els was appointed as Chief Financial Officer from 3 December 2015.
INTERESTS IN SHARES, OPTIONS AND PERFORMANCE RIGHTS OF THE COMPANY
As at the date of this report, the interests of the directors in the shares, options and performance rights of Danakali Limited were:
Director Ordinary Shares
Options over Ordinary Shares
Performance
Rights
S I Cornelius 9,798,184 1,675,000 -
P M Donaldson 2,768,334 600,000 800,000
J D Fitzgerald 258,334 1,475,000 -
Z Jing - 100,000 -
R G Connochie - 500,000 -
A Liebenberg - - -
PRINCIPAL ACTIVITIES
The principal activity of the Group during the period was advancing the Colluli Potash Project in Eritrea, East Africa. There was no significant change in the nature of the Group’s activities during the financial year ended 31 December 2017.
CORPORATE STRUCTURE
Danakali Limited is a company limited by shares that is incorporated and domiciled in Australia.
For
per
sona
l use
onl
y
Directors’ Report
DANAKALI LIMITED ABN 56 097 904 302
7
REVIEW OF OPERATIONS
PROJECT OVERVIEW
The Colluli Potash Project (Colluli, or the Project) is located in the Danakil Depression region of Eritrea, East Africa. Colluli is approximately 177km south-east of the capital, Asmara, and 180km from the port of Massawa, which is Eritrea’s key import/export facility. The Project is a joint venture between the Eritrean National Mining Company (ENAMCO) and Danakali with each having 50% ownership of the joint venture company, the Colluli Mining Share Company (CMSC). CMSC is responsible for the development of the Project.
The Danakil Depression is an emerging potash province, which commences in Eritrea and extends south across the border into Ethiopia. It is one of the largest unexploited potash basins globally; over 6Bt of potassium bearing salts suitable for production of potash fertilisers have been identified in the region to date (ASX announcement 25 February 2015 and http://circumminerals.com/resources).
Colluli is located approximately 75km from the Red Sea coast providing unrivalled future logistics potential. The Project resides on the Eritrean side of the border, giving Colluli a significant advantage relative to all other potash development projects in the Danakil Depression, which need to ship from the Tadjoura Port in Djibouti – over 600km by road from the closest project on the Ethiopian side of the border.
Colluli boasts the shallowest mineralisation in the Danakil Depression. Mineralisation commences at just 16m below surface. In addition, the potassium bearing salts are present in solid form (in contrast with production of SOP from brines). Shallow access to salts in solid form provides Colluli with significant mining, logistics and, in turn, capital and operating cost advantages over other potash development projects globally. The Project also carries a significantly lower level of complexity as a consequence of predictable processing plant feed grade and predictable production rates due to low reliance on ambient conditions.
Shallow mineralisation makes the resource amenable to open cut mining: a proven, high productivity mining method. Open cut mining provides higher resource recoveries relative to underground and solution mining methods, is generally safer, and can be more easily expanded.
The Colluli resource comprises three potassium bearing salts in solid form: Sylvinite, Carnallitite and Kainitite. These salts are suitable for high yield, low energy production of Sulphate of Potash (SOP), which is a high-quality potash fertiliser carrying a price premium over the more common Muriate of Potash (MOP). SOP is chlorine free and is commonly applied to high value crops such as fruit, vegetables, nuts, and coffee. Economic resources for primary production of SOP are geologically scarce and there are few current primary producers.
The JORC-2012 compliant Mineral Resource for Colluli is estimated at 1.289Bt @ 11% K2O for 260Mt of contained SOP equivalent (ASX announcement 25 February 2015). The JORC-2012 compliant Ore Reserve estimate for Colluli is estimated at 1,100Mt @ 10.5% K2O for 203Mt of contained SOP equivalent (ASX announcement 19 February 2018). The Measured and Indicated Mineral Resources are inclusive of those Mineral Resources modified to produce the Ore Reserves.
Colluli will be developed to its full potential by adopting the principles of risk management, resource utilisation and modularity, using the first module as a platform for growth. The Colluli FEED modules are:
• Module I – 472ktpa SOP production • Module II – additional 472ktpa SOP production commencing in year 6
The massive Colluli Ore Reserve has significant capacity to underpin further expansions and support decades of growth beyond Modules I and II.
Colluli has significant diversification potential beyond SOP, including the option to produce additional potash and salt products such as MOP, SOP-M, kieserite (MgSO4.H2O), gypsum (CaSO4.2H2O), magnesium chloride (MgCl2), and rock salt (NaCl). The Colluli SOP Mineral Resource also comprises an 85Mt Kieserite (magnesium sulphate) Mineral Resource (ASX announcement 15 August 2016). Kieserite is a suitable fertiliser for magnesium deficient soils. A 347Mt Rock Salt (sodium chloride) Mineral Resource (ASX announcement 23 September 2015) has also been established at Colluli. Unprocessed Rock Salt can be used for de-icing, processed Rock Salt can be used as table salt.
Subsequent to year end, on 29 January 2018, the Company announced it had completed the Front-End Engineering Design (FEED) for Colluli. FEED firmly establishes Colluli as the most progressed, economically attractive, and fundable SOP greenfield development project globally. It provides offtakers and funders with a high level of study detail and accuracy and is the final study stage before project execution. The FEED results reaffirm the outstanding project economics of Colluli. Industry leading capital intensity achieved in the DFS (ASX announcement 30 November 2015) further reduced as a result of lower development capital requirements for Module I and increased annual production rate. This, combined with forecast first quartile operating costs, resulted in a Project Net Present Value (NPV10) of US$902M and Internal Rate of Return (IRR) of 29.9%. The Danakali economic outcomes were an NPV10 of US$439M and IRR of 31.3%.
Mining Agreement Executed and Mining Licenses Awarded
As announced on 1 February 2017, CMSC entered into a mining agreement (Mining Agreement) with the Eritrean Ministry of Energy and Mines (MoEM) and was awarded mining licenses (Mining Licenses) for the exploitation of mineral resources within the Colluli tenements.
For
per
sona
l use
onl
y
Directors’ Report
DANAKALI LIMITED ABN 56 097 904 302
8
The Mining Agreement is applicable to the entire 1.3Bt JORC-2012 compliant Mineral Resource and provides exclusive rights to CMSC to apply for mining licenses to exploit the potassium, magnesium, calcium and sodium salts within the resource, as well as bromine.
The award of the Mining Licenses follows the completion of a series of pre-requisites including the completion and submission of the DFS, submission of a comprehensive social and environmental impact assessment and associated management plans, a series of pre and post DFS stakeholder engagements with local and regional communities and stakeholders, and the signing of the Mining Agreement.
Front End Engineering Design (FEED)
As announced on 9 January 2017, internationally recognised and highly reputable construction and engineering company Fluor, was awarded the contract to conduct the FEED and optimisation work for the Colluli project. Global Potash Solutions (GPS), Elemental Engineering (EE) and Knight Piésold joined the FEED team to optimise and refine the DFS engineering, further refine capital and operating cost estimates and prepare the project for construction.
GPS oversaw the metallurgical test program, process flowsheet development and initial optimisation work for Colluli throughout the prefeasibility and definitive feasibility study phases of the project and have worked closely with the Fluor process engineering team and EE to finalise the process, select the plant equipment and develop commissioning procedures.
FEED was finalised during the 2017 year, with results announced on 29 January 2018. FEED builds upon the disciplined study execution and project de-risking approach adopted by Danakali and its joint venture partner ENAMCO. FEED has established Colluli as the most progressed SOP greenfield development project globally. There is no other known SOP greenfield development project that has completed FEED.
FEED results underpin the Financial Model prepared for the debt providers and provides offtakers with additional confidence on project economics and fundability, which will support finalisation of bankable offtake agreements. FEED is the final study stage before execution of the Project (ASX announcement 29 January 2018).
Operational Contracts
Operating cost estimates for FEED were supported by competitive bids in the key operating contract areas of mining and power generation. The operational contracts help to firm the Project economics as Colluli advances towards construction, and act as key inputs to support the ongoing funding discussions.
Mining – Mining contract technical and commercial evaluation complete
Following a comprehensive bidding process for the Colluli mining contract, the technical and commercial compliance process is complete. Participating bidders visited Eritrea, the Port of Massawa, and the future Colluli mine site. A comprehensive review of the Colluli mine plan and selected mining method was also undertaken.
Conforming bids have been evaluated and incorporated into the FEED results. The technical and commercial compliance was evaluated and confirmed by AMC Consultants and the FEED mining costs were in line with DFS estimates.
The mining bids have been shortlisted to two competitive bids from highly qualified bidders. Commercial negotiations are currently in progress.
Power – Finalising negotiations with preferred power provider
Inglett and Stubbs International has been appointed as the preferred power provider.
EPCM – Evaluations underway, preliminary negotiations expected in March 2018 Quarter
Towards the end of the year, Danakali developed an Engineering Procurement Construction & Management (EPCM) enquiry document in consultation with project management consultants Turner & Townsend. The EPCM enquiry document was issued to targeted industry participants seeking competitive bids. The EPCM enquiry period has now closed, and submissions are under evaluation.
Danakali is seeking to commence negotiations with the preferred EPCM consultants by March 2018, with the aim of confirming appointments within the June 2018 Quarter.
MARKETING AND PROJECT FINANCE UPDATE
Off-take
The Company is progressing its offtake strategy on behalf of CMSC and is working with several offtakers who continue to express a strong interest in securing a future supply of granular and standard SOP product. Negotiations in the December 2017 Quarter were focused primarily on finalising remaining commercial terms contained in the bankable offtake agreements. Norton Rose Fulbright, who has significant experience in developing potash offtake agreements, continue to support negotiations and associated legal drafting.
Negotiations are advancing with several parties close to final binding offtake agreements.
Project Financing
Danakali and CMSC continues to work with its debt advisor, Endeavour Financial, on the funding solution for the project development.
For
per
sona
l use
onl
y
Directors’ Report
DANAKALI LIMITED ABN 56 097 904 302
9
The Project is fully permitted and ready to advance into engineering and construction upon securing funding. A Social and Environmental Impact Assessment (SEIA) and associated Social and Environmental Management Plans have been completed to ensure consistency with the Equator Principles. Stakeholder engagements have been completed throughout the study phases, and the Project has strong support from local communities.
During the year, independent experts visited Colluli on behalf of potential debt providers. The completion of FEED is a key milestone in advancing the debt funding discussions, it provides potential debt providers with a high level of study detail and accuracy; updated financials; and completion of equipment and supplier lists. Other key debt funding milestones include the finalisation of key operational contracts and the bankable offtake agreements.
A site visit was conducted by independent experts on behalf of potential debt providers towards the end of 2017. Meetings were held with the Ministry of Energy and Mines, the Ministry of Land, Water and Environment, and elders and administrators of communities close to Colluli. Visits were made to the key project locations including Colluli, Massawa Port, and Anfile Bay.
A Colluli Financial Model has been prepared for potential debt providers which incorporates the FEED results.
Kieserite resource defined – in excess of 85 million tonnes
In August 2016, the Kieserite content in the Colluli Mineral Resource was quantified by AMC Consultants (refer the Resource and Reserve section of this report). Kieserite (magnesium sulphate monohydrate) is a commonly used, chloride free, multi-nutrient fertiliser with limited primary production centres globally.
The Resource contains 18Mt of Kieserite in Measured Resource, 66Mt in Indicated Resource, and 3Mt in Inferred Resource.
Table 1: Kieserite contained by Resource Classification
Measured Indicated Inferred Total1
Mt Contained
Kieserite (Mt) Mt Contained
Kieserite (Mt) Mt Contained
Kieserite (Mt) Total (Mt)
Contained Kieserite (Mt)
Kieserite %
Sylvinite 90 0 160 0 15 0 265 0 0.03%
Carnallitite 80 16 303 59 15 3 398 78 20%
Kainitite 133 2 488 7 5 0 626 9 1%
Total 303 18 951 66 35 3 1,289 87 7% 1 Weighted Average
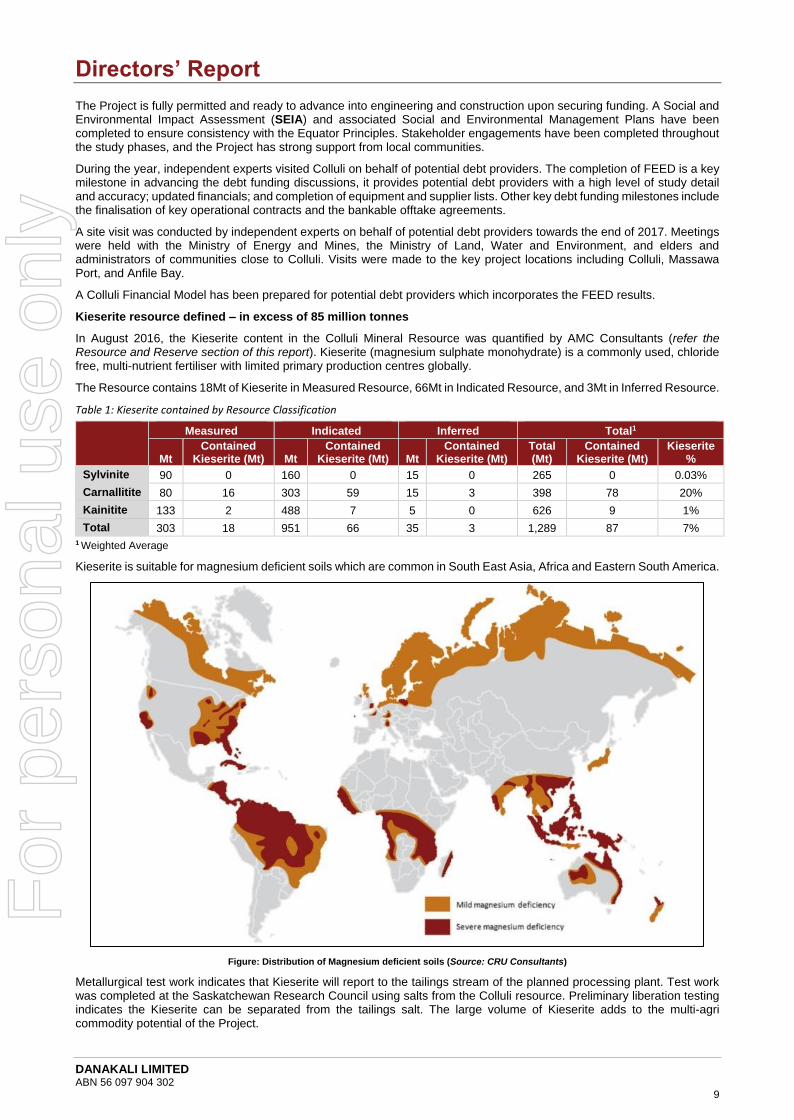
Kieserite is suitable for magnesium deficient soils which are common in South East Asia, Africa and Eastern South America.
Figure: Distribution of Magnesium deficient soils (Source: CRU Consultants)
Metallurgical test work indicates that Kieserite will report to the tailings stream of the planned processing plant. Test work was completed at the Saskatchewan Research Council using salts from the Colluli resource. Preliminary liberation testing indicates the Kieserite can be separated from the tailings salt. The large volume of Kieserite adds to the multi-agri commodity potential of the Project.
For
per
sona
l use
onl
y

Directors’ Report
DANAKALI LIMITED ABN 56 097 904 302
10
CORPORATE
Board Changes During the year, the Company made the following changes to its Board:
▪ Mr Robert Connochie was appointed as a non-executive director 6 February 2017; ▪ Mr Andre Liebenberg was appointed as a non-executive director 2 October 2017; ▪ Mr Paul Donaldson transitioned from an executive to non-executive director role 21 December 2017; ▪ Mr Anthony Kiernan resigned as a non-executive director 6 February 2017; and ▪ Mr Liam Cornelius resigned as a non-executive director 17 November 2017.
Chief Executive Officer Appointment
Mr Danny Goeman was appointed as Chief Executive Officer (CEO) of the Company from 21 December 2017, upon transition of Mr Paul Donaldson from Managing Director to a non-executive director role.
Mr Goeman is a highly experienced mining industry professional who joined Danakali in 2016 as Head of Marketing and has since developed the offtake strategy and offtake contract frameworks and led the offtake negotiations on behalf of CMSC. Prior to joining Danakali Mr Goeman worked within Rio Tinto, with leading roles in commodity price negotiations, market analysis, market segmentation, and price forecasting. He has experience across multiple commodities in multiple jurisdictions and has significant customer engagement and international experience.
Chief Financial Officer Appointment During the year, the board announced the appointment of Mr Stuart Tarrant as the Company’s new Chief Financial Officer effective 12 June 2017. Mr Tarrant, formerly Head of Finance of Danakali, a fellow of the Association of Chartered Certified Accountants (ACCA) and former accounting executive with both BHP and HWE Mining has extensive experience in the mining industry with core skills in financial modelling, financial systems development, procurement, budgeting, and cost analysis and optimisation. Mr Tarrant has established relationships with Endeavour Financial who are progressing the procurement led funding process for the project financing of the Colluli Sulphate of Potash Project and was responsible for the development and integrity of the Colluli financial model underpinning the prefeasibility and definitive feasibility studies.
Head of Corporate Development and External Affairs Appointment
Mr William Sandover was appointed as Head of Corporate Development and External Affairs on 12 October 2017. Prior to his appointment, Mr Sandover was an executive director at independent capital markets advisory form, Vesparum Capital, and is a former employee of top tier investment banks including Macquarie and UBS.
Mr Sandover has extensive experience in the areas of corporate strategy, equity capital markets, advanced financial modelling and project valuation, mergers and acquisitions, and strategic partnerships. During his career, Mr Sandover has carried out high profile transactions and provided corporate advisory services for companies such as Barrick Gold, Galaxy Resources, Goodman Group, and QBE. He has also acted as strategic investor relations advisor to numerous mid-cap ASX listed companies across the metals and mining, financial services, funds management, and sustainable technology sectors, and possesses skills in the sophisticated analysis of markets, sectors, valuations, and funding sources.
Company Secretary Change
Effective 7 July 2017, Ms Catherine Grant-Edwards and Ms Melissa Chapman were appointed joint company secretaries of Danakali. Mr Christiaan Els resigned as company secretary of the Company on 7 July 2017.
Project Manager Appointment
During the year, Mr Tony Harrington was appointed as Project Manager for the construction phase of the Colluli Potash Project. Mr. Harrington has over 37 years’ experience in the mining industry delivering EPC, lump sum and EPCM projects in the capacity of both client representative and service provider over a diverse range of commodities, with a wide range of mineral processing units, across multiple jurisdictions including East Africa, West Africa, Southern Africa, China, Continental Europe, UK and Australia. Mr. Harrington has extensive experience in construction and assembly of surface infrastructure, materials handling systems, flotation circuits, pumping systems, tanks, cyclones, liberation circuits, thickeners and tailings storage facilities. He brings significant experience and an excellent track record in working in remote locations in developing jurisdictions.
Restructure of Board Committees
During the year, the board committees were restructured to support the transition of the Company to Project execution. As 31 December 2017, the committees were made up as follows:
▪ Remuneration and Nomination Committee - Mr Liebenberg as Chairman, with Mr Fitzgerald and Mr Donaldson as members;
▪ Audit Committee – Mr Fitzgerald as Chairman, with Mr Liebenberg and Mr Cornelius as members (on 21 December 2017, the former Audit and Risk Committee was consolidated to become the Audit Committee); and
▪ Technical and Risk Committee - Mr Donaldson as Chairman, with Mr Cornelius and Mr Connochie as members.
Placement
On 23 May 2017, Danakali issued 19,920,645 shares (Placement Shares) to institutional and sophisticated investors in the United Kingdom and Australia to raise gross proceeds of A$12.35 million at an issue price of $0.62 cents per share
For
per
sona
l use
onl
y

Directors’ Report
DANAKALI LIMITED ABN 56 097 904 302
11
(Placement).
The Placement Shares were issued using the Company’s 15% capacity pursuant to Listing Rule 7.1.
Shares
During the year, the Company issued the following fully paid ordinary shares:
▪ 19,920,645 shares at an issue price of $0.62 each (being the Placement Shares); ▪ 1,356,365 shares on exercise of unlisted options at $0.35 each ▪ 351,000 shares on exercise of unlisted options at $0.405 each ▪ 200,000 shares on exercise of unlisted options at $0.408 each ▪ 4,600,000 shares on exercise of unlisted options at $0.278 each ▪ 775,000 shares on vesting of performance rights (Class 2: 75,000; Class 4: 700,000)
At 31 December 2017, there were a total of 251,475,868 fully paid ordinary shares on issue.
Options
During the year, the Company issued the following unlisted options:
▪ 1,440,000 unlisted options exercisable at $0.94 each expiring 19 May 2020 ▪ 400,000 unlisted options exercisable at $0.96 each expiring 20 June 2019
The following unlisted options were exercised and converted to shares during the year:
▪ 1,356,365 unlisted options exercisable at $0.35 each expiring 30 March 2018 ▪ 351,000 unlisted options exercisable at $0.405 each expiring 13 May 2018 ▪ 200,000 unlisted options exercisable at $0.408 each expiring 4 November 2018 ▪ 4,600,000 unlisted options exercisable at $0.278 each expiring 17 November 2017
The following unlisted options were cancelled during the year:
▪ 800,000 unlisted options exercisable at $0.408 each expiring 4 November 2018 ▪ 550,000 unlisted options exercisable at $0.543 each expiring 7 October 2019
There were no unlisted options that expired during the year.
At 31 December 2017, there were a total of 19,195,821 unlisted options on issue at various exercise prices and expiry dates.
Performance Rights
During the year, the Company issued the following performance rights:
▪ 100,000 Class 5 performance rights ▪ 50,000 Class 6 performance rights ▪ 50,000 Class 7 performance rights ▪ 100,000 Class 8 performance rights
The following performance rights vested and were converted to shares during the year:
▪ 75,000 Class 2 performance rights vested and converted to shares ▪ 700,000 Class 4 performance rights vested and converted to shares
The following performance rights were forfeited during the year:
▪ 75,000 Class 2 performance rights were forfeited
At 31 December 2017, there were a total of 1,408,000 performance rights on issue in the following classes:
▪ 308,000 Class 1 performance rights ▪ 800,000 Class 4 performance rights ▪ 100,000 Class 5 performance rights ▪ 50,000 Class 6 performance rights ▪ 50,000 Class 7 performance rights ▪ 100,000 Class 8 performance rights
Annual General Meeting
The Company’s annual general meeting was held on 19 May 2017 (AGM). All resolutions put to the meeting were passed.
Sustainable Development Framework
Danakali and CMSC have a strong commitment to sustainable development which is underpinned by the principles that mineral projects should be financially, technically and environmentally sound and socially responsible.
Therefore, the company implemented a Sustainable Development Framework to govern its Corporate Social Responsibilities (CSR) and Sustainability and is aligned with its Corporate Governance Framework. The policies developed using this framework directly supported the management plans associated with the SEIA and SEMP for the project.
For
per
sona
l use
onl
y

Directors’ Report
DANAKALI LIMITED ABN 56 097 904 302
12
The following policies were approved during 2017:
• DNK Human Rights Policy
• DNK Health and Safety Policy
• DNK Environmental Policy
• DNK Community Policy
• DNK Anti-Corruption Policy
This framework and policies were endorsed and adopted by joint venture partner, CMSC.
RESERVE AND RESOURCE OVERVIEW
Colluli has a JORC-2012 compliant resource of 1.289 billion tonnes as shown in Table 2 as at 31 December 2016. Apart from the inclusion of Kieserite as discussed earlier in this report, there have been no changes to the Mineral Resource since 25 February 2015.
The Colluli JORC-2012 compliant mineral resource estimate as at 31 December 2016 is as follows:
Table 2: Colluli Mineral Resource Estimate, 25 February 2015, with Kieserite added
Rock Unit
Tonnes Density K2O Equiv. Kieserite
Mt t/m3 % %
Sylvinite 265 2.2 12% 0.03%
Upper Carnallitite 51 2.1 12% 3%
Lower Carnallitite 347 2.1 7% 22%
Kainitite 626 2.1 12% 1%
Total 1,289 2.1 11% 7%
Within the JORC-2012 compliant, 1.289 billion tonnes, Mineral Resource Estimate, the JORC-2012 compliant Ore Reserve Estimate for Colluli’s potassium sulphate potash fertiliser is approximately 1.1 billion tonnes comprising 287 million tonnes of Proved and 827 million tonnes of Probable Ore Reserve and is shown below in Table 3. The Ore Reserve was updated in line with FEED and this update is included below (ASX announcement 19 February 2018).
The Colluli JORC-2012 compliant Ore Reserve estimate by potash mineral as at 29 January 2018 is as follows:
Table 3: JORC-2012 Colluli Potassium Sulphate Ore Reserve as at 29 January 2018
Occurrence
Proved Probable Total
Mt K2O
Equiv % Mt K2O
Equiv % Mt K2O
Equiv % K2SO4
Equiv % K2SO4
Equiv Mt1
Sylvinite
(KCl.NaCl) 77 15.0% 173 12.1% 250 13.0%
Carnallitite
(KCl.MgCl2.H2O) 77 6.9% 279 7.8% 356 7.6%
Kainitite
(KCl.MgSO4.H2O) 131 11.8% 363 11.2% 494 11.4%
Total 285 11.3% 815 10.3% 1,100 10.5% 18.5 205
1 Equivalent K2SO4 (SOP) calculated by multiplying %K2O by 1.85
In addition to potassium sulphate, substantial quantities of rock salt exist. A JORC-2012 compliant Rock Salt Mineral Resource Estimate of over 300 million tonnes has been completed for the area considered for mining in the DFS as shown in Table 4. There have been no changes to the Mineral Resource estimate since 23 September 2015.
As at 31 December 2016, the JORC-2012 compliant Rock Salt Mineral Resource is as follows:
Table 4: JORC 2012 Colluli Rock Salt Mineral Resource as at 23 September 2015
Classification Tonnes (Mt) NaCl K Mg CaSO4 Insolubles
Measured 28 97.2 0.05 0.05 2.2 0.23
Indicated 180 96.6 0.07 0.06 2.3 0.24
Inferred 139 97.2 0.05 0.05 1.8 0.25
Total 347 96.9 0.06 0.05 2.1 0.24
SAFETY
Danakali is committed to ensuring all work activities are carried out safely with all practical measures taken to remove risks to health, safety and welfare of workers, contractors, authorised visitors, and anyone else who may be affected by the Group’s activities.
Since the Company commenced exploration in 2010, no injuries have been reported. This safety performance, along with a strong safety culture, bodes well for the company as it moves into the construction and production phases at Colluli.
For
per
sona
l use
onl
y

Directors’ Report
DANAKALI LIMITED ABN 56 097 904 302
13
ENVIRONMENT
The Group is subject to environmental regulation in respect to its exploration and development activities. Danakali aims to ensure the appropriate standard of environmental care is achieved, and in doing so, that it is aware of and is in compliance with relevant environmental legislation. There were no breaches of environmental legislation for the period under review.
EVENTS OCCURRING AFTER THE BALANCE DATE
On 29 January 2018, the Company announced the results of the FEED phase for the Colluli Potash Project. On 31 January 2018 the Company released a presentation detailing the FEED results.
On 19 February, the Company released an updated JORC-2012 Colluli Potassium Sulphate Ore Reserve.
Subsequent to balance date up to the reporting date, the Company issued the following fully paid ordinary shares:
▪ 400,000 shares on exercise of unlisted options at $0.405 each ▪ 775,000 shares on exercise of unlisted options at $0.35 each
Subsequent to balance date up to the reporting date, the Company issued 25,000 shares on the vesting of performance rights.
No other matters or circumstances have arisen since the end of the financial year which significantly affected or may significantly affect the operations of the Group, the results of those operations, or the state of affairs of the Group in future financial years.
ACTIVITIES PLANNED FOR 2018
The following key activities are scheduled over the coming year:
• Progress negotiations to final binding offtake agreements
• Finalise negotiations with shortlisted EPCM contract bidders
• Finalise negotiations with shortlisted mining contract bidders
• Finalise negotiations with preferred power provider Inglett & Stubbs International
• Dual listing on the London Stock Exchange
• Finalise arrangements with commercial lenders
FINANCE REVIEW
The Group recorded a net loss after tax of $6,839,936 for the financial year to 31 December 2017 compared to a loss of $4,925,558 for the financial year to 31 December 2016. As the Group is still in the exploration and development stage, revenue streams mainly relate to interest earned on investing of surplus funds from capital raisings. The net losses after tax reflect the Groups’ exploration and development expenditure on the Colluli Potash Project and ongoing administration costs.
The Groups’ net assets increased by 19.2% compared to the net assets as at 31 December 2016, which is consistent with the increase in cash balance due to the successful equity raises during 2017 and the net increase in the investment and loan to the Colluli Mining Share Company.
Total consolidated cash on hand at the end of the financial year was $15,559,980 (31 December 2016: $10,904,760).
Operating activities utilised $1,279,679 (31 December 2016: $1,670,534 utilised) of net cash flows. Net cash outflow from investing activities of $7,721,815 (31 December 2016: $2,955,454) was primarily in relation to expenditure made to advance the Colluli Project in relation to:
• Execution of Mining Agreement and award of Mining Licenses for the Colluli project
• Completion of the FEED
• Advancing off-take agreement negotiations
• Advancing financing negotiations
• Advancing key operational contracts
Net cash inflow from financing activities of $13,656,714 (31 December 2016: $12,774,407) was due to the placement of shares and the exercise of options to fund the ongoing exploration and development work to advance the project.
SIGNIFICANT CHANGES IN THE STATE OF AFFAIRS
There were no other significant changes in the Company’s state of affairs other than that referred to in the financial statements or notes thereto.
For
per
sona
l use
onl
y

Directors’ Report
DANAKALI LIMITED ABN 56 097 904 302
14
DEVELOPMENTS AND EXPECTED RESULTS
Details of important developments occurring in this financial year have been covered in the Review of Operations section of the Directors’ Report. The Group will continue to invest in the Colluli Potash Project to advance activities in the exploration, evaluation and development of the project with the objective of developing a significant mining operation. Any significant information or data will be released to the market and the shareholders pursuant to the Continuous Disclosure rules as and when they come to hand.
DIVIDENDS
No dividends were paid or declared during the financial year to 31 December 2017. No recommendation for payment of dividends has been made.
DIRECTORS’ MEETINGS
The number of meetings of the Company’s Board of Directors held during the financial year ended 31 December 2017 and the number of meetings attended by each Director were:
Director
Total Directors Meetings
Total Directors Meetings Attended
Total
Audit and Risk Committee Meetings
Total Audit and Risk
Committee Meetings Attended
Total Remuneration
and Nomination Committee Meetings
Total Remuneration
and Nomination Committee Meetings Attended
S I Cornelius 9 9 2 2 2 2
P M Donaldson 9 9 - - - -
J D Fitzgerald 9 9 2 2 3 3
J Zhang 9 6 - - - -
R Connochie 9 9 2 2 - -
A Liebenberg 4 4 - - - -
L R Cornelius 8 8 - - 3 3
A W Kiernan - - - - 1 1
There were no Technical and Risk Committee meetings held during the year.
For
per
sona
l use
onl
y

Directors’ Report
DANAKALI LIMITED ABN 56 097 904 302
15
OPTIONS
At the date of this report, unissued ordinary shares in respect of which options are outstanding are as follows:
Number of options
Balance at the beginning of the year 25,213,186
Movements of share options during the financial year ended 31 December 2017:
Exercised, exercisable at $0.278 on or before 17 November 2017 (4,600,000)
Exercised, exercisable at $0.408 on or before 4 November 2018 (200,000)
Exercised, exercisable at $0.405 on or before 13 May 2018 (351,000)
Exercised, exercisable at $0.350 on or before 30 March 2018 (1,356,365)
Cancelled, exercisable at $0.408, on or before 4 November 2018 (800,000)
Cancelled, exercisable at $0.543, on or before 7 October 2019 (550,000)
Issued, exercisable at $0.940, on or before 19 May 2020 1,440,000
Issued, exercisable at $0.960, on or before 20 June 2019 400,000
Share options outstanding at 31 December 2017 19,195,821
Movements of share options during period since the financial year ended 31 December 2017:
Exercised, exercisable at $0.405, on or before 13 May 2018 (400,000)
Exercised, exercisable at $0.350, on or before 13 May 2018 (100,000)
Exercised, exercisable at $0.350, on or before 30 March 2018 (675,000)
Total number of share options outstanding as at the date of this report 18,020,821
Expiry date Exercise price Number of options
30 March 2018 $0.350 8,981,821
13 May 2018 $0.350 700,000
13 May 2018 $0.405 1,949,000
29 May 2018 $0.527 750,000
31 May 2018 $0.550 600,000
23 June 2018 $0.450 200,000
4 November 2018 $0.550 750,000
31 December 2018 $0.550 1,000,000
8 August 2019 $0.558 1,000,000
7 October 2019 $0.543 250,000
19 May 2020 $0.940 1,440,000
20 June 2019 $0.960 400,000
Total number of share options outstanding at the date of this report 18,020,821
No option holder has any right under the option to participate in any share issue of the Company or any other entity. No options were granted to key management personnel of the Company since the end of the financial year.
PERFORMANCE RIGHTS
Details of performance rights over unissued shares in Danakali Ltd as at the date of this report are set out below:
Number of rights
Balance at the beginning of the year 1,958,000
Movements of performance rights during the year
Issued 300,000
Vested and Exercised (a) (775,000)
Forfeited (b) (75,000)
Performance rights outstanding at 31 December 2017 1,408,000
Movements since the financial year ended 31 December 2017:
Vested (25,000)
Total number of performance rights as at the date of this report 1,383,000
Note: (a) Performance rights vested upon the grant of the mining lease. (b) Performance rights forfeited upon the resignation of non-executive director, Anthony Kiernan on 6 February 2017.
No performance rights holder has any right to participate in any other share issue of the company or any other entity.
INDEMNIFICATION AND INSURANCE OF DIRECTORS AND OFFICERS
Indemnification
An indemnity agreement has been entered into with each of the directors and company secretary of the Company named earlier in this report. Under the agreements, the Company has agreed to indemnify those officers against any claim or for
For
per
sona
l use
onl
y
Directors’ Report
DANAKALI LIMITED ABN 56 097 904 302
16
any expense or cost which may arise as a result of work performed in their respective capacities to the extent permitted by law. There is no monetary limit to the extent of this indemnity.
Insurance
During the period, the Company paid an insurance premium in respect of Directors’ and Officers’ insurance. The premiums relate to costs and expenses incurred by the relevant officers in defending proceedings, whether civil or criminal and whatever their outcome, and other liabilities that may arise from their position, with the exception of conduct involving a wilful breach of duty or improper use of information or position to gain a personal advantage. Premiums totalling $35,625 (2016: $8,000) were paid in respect of directors’ and officers’ liability cover. The insurance policies outlined above do not contain details of the premiums paid in respect of individual officers of the Company.
INDEMNIFICATION OF AUDITORS
To the extent permitted by law, the Company has agreed to indemnify its auditors, Ernst and Young, as part of the terms of its audit engagement agreement against claims by third parties arising from the audit (for an unspecified amount). No payment has been made to indemnify Ernst and Young during or since the financial year.
AUDIT COMMITTEE
The Audit and Risk Committee (consolidated during the year to become the Audit Committee) has a documented charter, approved by the Board. All members are non-executive directors. The committee advises on the establishment and maintenance of a framework of internal control and appropriate ethical standards for the management of the Group.
The members of the Audit Committee are:
• Mr John Fitzgerald - Chairman
• Mr Seamus Cornelius - Member
• Mr Andre Liebenberg - Member
The Audit and Risk Committee met twice during the year and the committee members’ attendance record is disclosed in the table of Directors’ meetings in section of the Directors’ Report.
NON-AUDIT SERVICES
The Board has considered the non-audit services provided during the financial year by the auditor and is satisfied that the provision of those non-audit services is compatible with, and did not compromise, the auditor’s independence requirements of the Corporations Act 2001.
All non-audit services provided during the financial year were subject to the corporate governance procedures adopted by the Company and have been reviewed by the Board to ensure they do not impact the integrity and objectivity of the auditor; and the non-audit services provided do not undermine the general principles relating to auditor independence as set out in APES 110 Code of Ethics for Professional Accountants, as they did not involve reviewing or auditing the auditor’s own work, acting in a management or decision making capacity for the Company, acting as an advocate for the Company or jointly sharing risks and rewards.
During the period, Ernst and Young, the Company’s auditors, performed the following services in addition to their statutory duties:
• Preparation and lodgement of income tax returns.
• Corporate Advisory Services.
2017
$
2016
$
(a) Audit services
Ernst and Young 41,391 33,621
41,391 33,621
(b) Non-audit services
Ernst and Young 6,000 33,103
6,000 33,103
CORPORATE GOVERNANCE
The Company’s corporate governance statement can be found at the following URL: http://www.danakali.com.au/our-business/corporate-governance.
For
per
sona
l use
onl
y

Directors’ Report
DANAKALI LIMITED ABN 56 097 904 302
17
PROCEEDINGS ON BEHALF OF THE COMPANY
No person has applied to the Court under section 237 of the Corporations Act 2001 for leave to bring proceedings on behalf of the Company, or to intervene in any proceedings to which the Company is a party, for the purpose of taking responsibility on behalf of the company for all or any part of those proceedings.
No proceedings have been brought or intervened in or on behalf of the Company with leave of the Court under section 237 of the Corporations Act 2001.
AUDITOR’S INDEPENDENCE DECLARATION
A copy of the auditor's independence declaration as required under section 307C of the Corporations Act 2001 is set out separately in this report.
REMUNERATION REPORT (AUDITED)
The Remuneration Report outlines the director and executive remuneration arrangements of the Group in accordance with the requirements of the Corporations Act 2001 (Cth) and its Regulations. For the purposes of this report, Key Management Personnel (KMP) of the Group are defined as those persons having authority and responsibility for planning, directing and controlling the major activities of the Group, directly or indirectly, including any director (whether executive or otherwise) of the Company. For the purposes of this report, the term ‘Executive’ includes the Chief Executive Officer and senior executives of the Group.
The Key Management Personnel of Danakali Ltd and the Group during the financial year to 31 December 2017 were:
Directors
S I Cornelius Non-Executive Chairman P M Donaldson Non-Executive Director (Transitioned from Managing Director and Chief Executive Officer to Non-
Executive Director 21 December 2017) J D Fitzgerald Non-Executive Director J Zhang Non-Executive Director R Connochie Non-Executive Director (Appointed 6 February 2017) A Liebenberg Non-Executive Director (Appointed 2 October 2017) A W Kiernan Non-Executive Director (Resigned 6 February 2017) L R Cornelius Non-Executive Director (Resigned 17 November 2017)
Named Executives
D Goeman Chief Executive Officer (Appointed 21 December 2017) S Tarrant Chief Financial Officer (Appointed 12 June 2017) C Grant-Edwards Joint Company Secretary (Appointed 7 July 2017) M Chapman Joint Company Secretary (Appointed 7 July 2017) C P Els Chief Financial Officer (Resigned 12 June 2017) and Company Secretary (Resigned 7 July 2017)
All of the above persons were key management personnel during the financial year to 31 December 2017 unless otherwise stated. The information provided in this remuneration report has been audited as required by section 308 (3C) of the Corporations Act 2001.
Key Elements of Key Management Personnel / Executive Remuneration Strategy
The remuneration strategy for Danakali Ltd is designed to provide rewards that achieve the following:
• attract, retain, motivate and reward executives;
• reward executives for Company and individual performance against targets set by reference to appropriate benchmarks;
• link reward with the strategic goals and performance of the Company;
• provide remuneration that is competitive by market standards;
• align executive interests with those of the Company’s shareholders; and
• comply with applicable legal requirements and appropriate standards of governance.
The Company is satisfied that its remuneration framework reflects current business needs, shareholder views and contemporary market practice and is appropriate to attract, motivate, retain and reward employees.
For
per
sona
l use
onl
y
Directors’ Report
DANAKALI LIMITED ABN 56 097 904 302
18
A summary of the key elements of the current remuneration arrangement is as follows:
Remuneration Component
Item Purpose Link to
Performance
Fixed Remuneration • Base salary
• Superannuation contributions
• Other benefits
Provide competitive remuneration with reference to the role and responsibilities, market and experience, to attract high calibre people.
Executive performance and remuneration packages are reviewed at least annually by the Board and Remuneration and Nomination Committee. The review process includes consideration of the individual’s performance in addition to the overall performance of the Group.
Performance Based
Short Term Incentive (STI)
• Cash bonus Provide reward to executives for the achievement of individual and Group performance targets linked to the Company’s strategic objectives.
Award of STI linked directly to achievement of KPI’s and performance targets.
Performance Based:
Long Term Incentive (LTI)
• Shares
• Options
• Performance Rights Plan
Provide reward to executives for their continued service and their contribution to achieving corporate objectives set by the Board to ensure the long-term growth of the Company.
Award of LTI linked directly to achievement of strategic Company objectives.
The Remuneration Report has been set out under the following headings:
a) Decision Making Authority for Remuneration b) Principles Used to Determine the Nature and Amount of Remuneration c) Voting and Comments Made at the Last Annual General Meeting d) Details of Remuneration e) Service Agreements f) Details of Share Based Compensation g) Equity Instruments Held by Key Management Personnel h) Loans to Key Management Personnel i) Other Transactions with Key Management Personnel j) Additional Information
a) Decision Making Authority for Remuneration
The Company’s remuneration policy and strategies are overseen by the Remuneration and Nomination Committee on behalf of the Board. The Remuneration and Nomination Committee is responsible for making recommendations to the Board on all aspects of remuneration arrangements for key management personnel including:
• the Company’s remuneration policy and framework;
• the remuneration arrangements for the Chief Executive Officer and other senior executives;
• the terms and conditions of long term incentives and short-term incentives for the Chief Executive Officer and other senior executives;
• the terms and conditions of employee incentive schemes; and
• the appropriate remuneration to be paid to non-executive Directors.
The Remuneration and Nomination Committee Charter is approved by the Board and is published on the Company’s website. Remuneration levels of the Directors and Key Management Personnel are set by reference to other similar sized mining and exploration companies with similar risk profiles and are set to attract and retain executives capable of managing the Group’s operations.
Remuneration levels for the Chief Executive Officer and key management personnel are determined by the Board based upon recommendations from the Remuneration and Nomination Committee. Remuneration of non-executive directors is determined by the Board within the maximum levels approved by the shareholders from time to time.
b) Principles Used to Determine the Nature and Amount of Remuneration
The Company’s remuneration practices are designed to attract, retain, motivate and reward high calibre people capable of delivering the strategic objectives of the Company. The Company’s Key Management Personnel remuneration framework aligns their remuneration with the achievement of strategic objectives and the creation of value for shareholders and conforms with market practice for delivery of reward.
The Remuneration and Nomination Committee ensures that the remuneration of Key Management Personnel is competitive and reasonable, acceptable to shareholders and aligns remuneration with performance. The structure and level of remuneration for key management personnel is conducted annually by the Remuneration and Nomination Committee relative to the Company’s circumstances, size, nature of business and performance.
For
per
sona
l use
onl
y

Directors’ Report
DANAKALI LIMITED ABN 56 097 904 302
19
Remuneration of Non-Executive Directors
Fees and payments to non-executive Directors reflect the demands which are made on, and the responsibilities of the directors. Non-executive Directors are remunerated with both cash salary and annual option grants to enable the company to preserve cash reserves and to align the Directors interests to those of the shareholders. The Board views this approach to be reasonable relative to the stage of development of its flagship project. Non-executive directors’ fees and payments are reviewed annually by the Board. The Board at times receives advice from independent remuneration consultants to ensure non-executive Directors fees and payments are appropriate and in line with the market. No advice was received during the period.
The general principles of non-executive Directors compensation are:
• Non-executive Directors are paid a base fee ($40,000 per annum) prior to any statutory superannuation payments;
• Additional fees are paid to non-executive Directors who serve on the board sub-committees;
• Under the current remuneration structure and subject to shareholder approval, an annual grant of Options is made;
• Any options granted and approved have a term of at least 3 years and will be struck at significant premium to the 30-day VWAP. This is typically 140% of the 30 day VWAP;
• The amount of options proposed for each non-executive director is proportional to the equivalent underlying cash fees; and
• Adjustments may be made in the event that a specific non-executive Director’s contribution warrants an adjustment. Such adjustments are at the recommendation of the board.
Chairman’s fees are determined independently to the fees of non-executive directors based on comparative roles in the external market and the specific requirements that the Company has of the Chairman.
• The Chairman is not present at any of the discussions relating to the determination of his own remuneration.
Fees for the Chairman and non-executive directors are determined within an aggregate directors’ fee pool limit of $400,000 as approved by shareholders on 17 November 2014. The disclosed Chairman and non-executive directors’ fees are inclusive of committee fees.
Remuneration of Key Management Personnel
The Company’s remuneration and reward framework is designed to ensure reward structures are aligned with shareholders’ interest by:
• being market competitive to attract and retain high calibre individuals;
• rewarding high individual performance;
• recognising the contribution of each key management personnel to the contributed growth and success of the Company; and
• ensuring that long term incentives are linked to shareholder value.
To achieve these objectives, the remuneration of key management personnel may comprise a fixed salary component and an ‘at risk’ variable component linked to performance of the individual and the Company as a whole. Fixed remuneration comprises base salary, superannuation contributions and other defined benefits. ‘At risk’ variable remuneration comprises both short term and long-term incentives.
The remuneration and reward framework for key management personnel may consist of the following areas:
i) Fixed Remuneration ii) Variable Short-Term Incentives iii) Variable Long-Term Incentives
The combination of these would comprise the key management personnel’s total remuneration.
i) Fixed Remuneration
The fixed remuneration for each senior executive is influenced by the nature and responsibilities of each role and knowledge, skills and experience required for each position. Fixed remuneration provides a base level of remuneration which is market competitive and comprises a base salary and statutory superannuation. It is structured as a total employment cost package, which may be delivered as a combination of cash and prescribed non-financial benefits at the executives’ discretion.
Key management personnel are offered a competitive base salary that comprises the fixed component of pay and rewards. External remuneration consultants may provide analysis and advice to ensure base pay is set to reflect the market for a comparable role. No external advice was taken this period. Base salary for key management personnel is reviewed annually to ensure the executives’ pay is competitive with the market. The pay of key management personnel is also reviewed on promotion. There is no guaranteed pay increase included in any key management personnel’s contract.
For
per
sona
l use
onl
y

Directors’ Report
DANAKALI LIMITED ABN 56 097 904 302
20
ii) Variable Remuneration – Short Term Incentives (STI)
The Danakali Ltd Short-Term Incentive Scheme applies to executives in the Company and is designed to link any STI payment with the achievement by each Key Management Personnel of specified key performance indicators (KPI’s) which are in turn linked to the Company’s strategic objectives and targets.
A maximum of up to 50% of the fixed remuneration can be payable under the STI and the Board has the discretion to reduce or suspend any bonus payments where Company circumstances render it appropriate.
Given the current phase of Danakali’s life cycle, the Board determined that the LTI is a more appropriate incentive measure to align KMP performance with company objectives. In reference to this, no KPI’s were set and no STI’s granted in the current period.
iii) Variable Remuneration – Long Term Incentives (LTI)
Long term incentives have been provided to directors and employees through the issue of options and performance rights.
The Danakali Ltd Performance Rights Plan (PRP) was re-approved by shareholders at the general meeting held 17 November 2014. The PRP provides incentives, which promote the long-term performance and growth of the Company. The performance conditions were chosen to strengthen the links between the Company objectives and the role performed by its Directors and employees.
The PRP is designed to increase the range of potential incentives available to Directors and employees and to recognise their contribution to the Company’s success.
Under the PRP, performance rights are granted over ordinary shares in the Company on an annual basis. The vesting conditions in respect of performance rights issued to KMP under the PRP that are outstanding at 31 December 2017 are as follows:
Class 4:
• 800,000 upon commencement of construction of the production facility.
Class 6:
• 10,000 upon successful completion of a dual listing of the Company on the London stock exchange;
• 15,000 upon Endeavour Financial being paid its first milestone success fee which is linked to a letter of finance support from a lending institution; and
• 25,000 upon term sheets being signed for the project financing of the Colluli project. Class 7:
• 10,000 upon market announcement of a binding offtake agreement to support debt funding of the project;
• 10,000 upon market announcement on completion of FEED;
• 15,000 upon completion of a strategic investment at greater than 30-day VWAP plus 10%; and
• 15,000 on signing a debt terms sheet for project financing or debt is secured form a strategic investor.
Details of options issued to key management personnel can be found in section f(i) below.
Details of performance rights issued to key management personnel can be found in section f(ii) below.
Further performance rights details can be found in Note 22.
All performance rights will automatically expire on the earlier of the expiry date or the date the holder ceases to be an employee of the Company, unless the Board determines to vary the expiry date in the event the holder ceased to be an employee because of retirement, redundancy, death or total and permanent disability and such other cases the Board may determine. Performance rights granted under the PRP will carry no dividend or voting rights. When the vesting conditions have been met, each performance right will be converted into one ordinary share.
c) Voting and Comments Made at the Last Annual General Meeting
The Company received approximately 95% of ‘yes’ votes on its Remuneration Report for the financial year ending 31 December 2016 and received no specific feedback on its Remuneration Report at the Annual General Meeting or throughout the period.
d) Details of Remuneration
Details of the remuneration of the directors and other key management personnel of Danakali Ltd are set out in the following table.
For
per
sona
l use
onl
y

Directors’ Report
DANAKALI LIMITED ABN 56 097 904 302
21
Key management personnel of the Company for the financial year to 31 December 2017:
Financial Year to 31 December 2017
Short-Term Post-Employment
Long Term Benefits
LTI (j) Share Based Payments
Total Options percentage
of total remuneration
Salary and Fees
Annual Leave (k)
Super- annuation
Long Service Leave (l)
Shares Options
Performance Rights
$ $ $ $ $ $ $ $ %
Non-Executive Directors
S Cornelius 88,762 - - - - 60,734 - 149,496 41
P Donaldson (a) 1,534 - 146 - - - - 1,680 -
J Fitzgerald 56,298 - 5,348 - - 50,612 - 112,258 45
J Zhang 41,013 - - - - 20,245 - 61,258 33
R Connochie (b) 39,944 - - - - 101,224 - 141,168 72
A Liebenberg (c) 13,622 - - - - - - 13,622 -
L Cornelius (d) 39,049 - 3,710 - - 38,465 7,050 88,274 44
A Kiernan (e) 5,667 - 538 - - - 4,500 10,705 -
Executive Directors
P Donaldson (a) 347,481 4,235 29,452 (25,917) - 20,245 394,800 770,295 3
Other Key Management Personnel
D Goeman (f) 252,878 18,336 24,023 6,533 - 99,330 - 401,100 25
S Tarrant (g) 133,846 9,942 12,715 2,417 - - 49,513 208,433 -
C Grant-Edwards (h) 9,000 - - - - - - 9,000 -
M Chapman (h) 9,000 - - - - - - 9,000 -
C Els (i) 161,564 - 13,637 (5,403) - (78,691) - 91,107 (82)
TOTAL 1,199,658 32,513 89,569 (22,370) - 312,164 455,863 2,067,397 15
Note: (a) Mr Donaldson transitioned from role of Executive Director to Non-Executive Director 21 December 2017. Annual leave entitlements owing to Mr Donaldson at date of transition of $105,536 were paid
out in January 2018. (b) Mr Connochie was appointed Non-Executive Director 6 February 2017. (c) Mr Liebenberg was appointed Non-Executive Director 2 October 2017. (d) Mr L Cornelius resigned as Non-Executive Director 17 November 2017. The share price on the date of resignation was $0.70. At resignation Mr Cornelius retained 50,000 Class 1 performance rights,
400,000 unlisted options exercisable at $0.405 expiring 13 May 2018, 190,000 unlisted options exercisable at $0.94 expiring 19 May 2020 and 500,000 unlisted option exercisable at $0.35 expiring 30 March 2018. The value of Mr Cornelius’s options and performance rights had been fully amortised at the date of resignation.
(e) Mr Kiernan resigned as Non-Executive Director 6 February 2017. The share price on the date of resignation was $0.745. At resignation Mr Kiernan retained 75,000 Class 2 performance rights, 400,000 unlisted options exercisable at $0.405 expiring 13 May 2018, 50,000 unlisted options exercisable at $0.35 expiring 13 May 2018 and 1,300,000 unlisted option exercisable at $0.278 expiring 17 November 2017. The value of Mr Kiernan’s options and performance rights had been fully amortised at the date of resignation.
(f) Mr Goeman was appointed Chief Executive Officer 21 December 2017. (g) Mr Tarrant was appointed Chief Financial Officer 12 June 2017.
For
per
sona
l use
onl
y

Directors’ Report
DANAKALI LIMITED ABN 56 097 904 302
22
(h) Ms Grant-Edwards and Ms Chapman were appointed joint Company Secretary 7 July 2017. Company secretarial services are provided through Bellatrix. Fees charged by Bellatrix are on an arms-length basis.
(i) Mr Els resigned as Chief Financial Officer on 12 June 2017 and Company Secretary 7 July 2017. The options held by Mr Els at resignation were cancelled. (j) The recorded values of options will only be realised by the KMP’s in the event the Company’s share price exceeds the option exercise price. The recorded values of performance rights will only be
realised by the KMP’s in the event the Company achieves its stated objectives, which is expected to create further value for shareholders. (k) Annual leave amount included in this table refers to movements during the year. (l) Long service leave amount included in this table refers to movements during the year.
Key management personnel of the Company for the financial year to 31 December 2016:
Financial Year to 31 December 2016
Short-Term Post-Employment
Long Term Benefits
LTI (d) Share Based Payments
Total Options percentage
of total remuneration
Salary and Fees
Annual Leave (e)
Super- annuation
Long Service Leave (f)
Shares Options
Performance Rights
$ $ $ $ $ $ %
Non-Executive Directors
S Cornelius 68,604 - - - - 162,018 - 230,622 70
A Kiernan 57,725 - 5,484 - - 42,320 27,810 133,339 32
L Cornelius 42,308 - 4,019 - - 42,320 6,314 94,961 45
J Fitzgerald 57,778 - 5,489 - - 42,320 - 105,587 40
J Zhang (a) 21,556 - - - - - - 21,556 -
Executive Directors
P Donaldson 350,000 19,829 33,250 6,388 - 52,900 331,740 794,107 8
Other Key Management Personnel
C Els 275,000 19,156 26,199 5,403 - 122,881 - 448,639 23
A D Just (b) 5,250 - - - - - - 5,250 -
S Tarrant (c) 68,814 - - - - - - 68,814 -
TOTAL 947,035 38,985 74,441 11,791 - 464,759 365,864 1,902,875 23
Note: This table has changed during the year due to the inclusion of annual leave and long service leave.
(a) Ms Zhang was appointed a non-executive director on 17 June 2016. (b) Ms Just resigned as company secretary on 1 February 2016. (c) Mr Tarrant provided his services through Mars Consulting Pty Ltd. Fees charged by Mars are on an arms-length basis. The arrangement ended 22 April 2016. (d) The recorded values of options will only be realised by the KMP’s in the event the Company’s share price exceeds the option exercise price. The recorded values of performance rights will only be
realised by the KMP’s in the event the Company achieves its stated objectives, which is expected to create further value for shareholders. (e) Annual leave amount included in this table refers to movements during the year. (f) Long service leave amount included in this table refers to movements during the year.
For
per
sona
l use
onl
y

Directors’ Report
DANAKALI LIMITED ABN 56 097 904 302
23
The relative proportions of remuneration that are linked to performance and those that are fixed are as follows:
Name
Financial Year to 31 December 2017
Fixed Remuneration At risk – STI At risk - LTI
Non-Executive Directors
S Cornelius 59% - 41%
P Donaldson 100% - -
J Fitzgerald 55% - 45%
J Zhang 67% - 33%
R Connochie 28% - 72%
A Liebenberg 100% - -
L Cornelius 48% - 52%
A Kiernan 58% - 42%
Executive Directors
P Donaldson 54% - 46%
Other Key Management Personnel
D Goeman 76% - 24%
S Tarrant 76% - 24%
C Grant-Edwards 100% - -
M Chapman 100% - -
C Els 182% - (82%)
e) Service Agreements
Remuneration and other terms of employment for the executive managers are formalised in employment contracts. Other major provisions of the agreements relating to remuneration are set out below.
D Goeman, Chief Executive Officer:
• Appointed 21 December 2017
• No set term of agreement.
• Base salary of $330,000 per annum plus statutory superannuation
• Notice period of six months, required to be given by either party for termination.
S Tarrant, Chief Financial Officer
• Appointed 12 June 2017
• Agreement expiry date 31 August 2018
• Base salary of $240,000 per annum plus statutory superannuation
• Notice period of three months, required to be given by either party for termination.
C Grant-Edwards and M Chapman, Joint Company Secretary Ms Melissa Chapman and Ms Catherine Grant-Edwards were appointed as Joint Company Secretary on 22 November 2017. Ms Chapman and Ms Grant-Edwards are directors of Bellatrix Corporate Pty Ltd (Bellatrix), a company that provides company secretarial and accounting services to a number of ASX listed company. Pursuant to an agreement, Bellatrix is entitled to receive $36,000 per annum for the provision of company secretarial services to the Company. In addition, Bellatrix also provides accounting services to the Company for an additional fee on an arms-length basis.
f) Details of Share Based Compensation
(i) Options
The terms and conditions of each grant of options affecting remuneration in the current or a future reporting period are as set out in the following table:
Grant date Vesting and first
exercise date Expiry date Number of
Options Exercise
price
Value per option at
grant date
Vested and exercisable
%
19 May 2017 19 May 2017 (a) 19 May 2020 1,440,000 $0.940 $0.202 100%
Total Options 1,440,000
Note: (a) The options were issued in recognition of skill and expertise brought to the Company and therefore, there were no conditions attached
to the options.
Details of options over ordinary shares in the Company, provided as remuneration to key management personnel are set out in the following table.
Options will automatically expire on the earlier of the expiry date or the date the holder ceases to be an employee of the Company, unless the Board determines to vary the expiry date in the event the holder ceased to be an employee because of retirement, redundancy, death or total and permanent disability and such other cases the Board may determine.
For
per
sona
l use
onl
y

Directors’ Report
DANAKALI LIMITED ABN 56 097 904 302
24
When exercisable, each option is convertible into one ordinary share. Further information on the options is set out in note 22.
Name Year of grant
Year in which
options vest
Number of options granted
Value of options at grant date
Number of options
vested during the period
Vested and
exercisable
Number of options
forfeited during the period
C P Els 2015 2017 200,000 $25,270 - - 200,000
C P Els 2015 2017 300,000 $37,800 - - 300,000
C P Els 2015 2017 300,000 $37,800 - - 300,000
S I Cornelius 2017 2017 300,000 $60,734 300,000 100% -
P M Donaldson 2017 2017 100,000 $20,245 100,000 100% -
J D Fitzgerald 2017 2017 250,000 $50,612 250,000 100% -
L Cornelius 2017 2017 190,000 $38,465 190,000 100% -
Z Jing 2017 2017 100,000 $20,245 100,000 100% -
R Connochie 2017 2017 500,000 $101,224 500,000 100% -
Total Options 2,240,000 1,440,000 800,000
3,000,000 options held by key management personnel were exercised during the year, raising $898,100 for working capital purposes.
Name
Number of options
exercised
Amount Paid
Fair Value
S I Cornelius 1,300,000 $361,400 $942,550
L Cornelius 1,000,000 $278,000 $700,000
P M Donaldson 200,000 $55,600 $140,000
C P Els 500,000 $203,100 $399,500
Total Options 3,000,000 $898,100 $2,182,050
(ii) Performance Rights
During the financial year, the following performance rights were granted to key management personnel.
Name Date of Issue
Class Number Fair Value per Right
at 31 December 2017
Expiry Date
S Tarrant 20 June 2017 Class 6 50,000 $0.715 None
S Tarrant 15 November 2017 Class 7 50,000 $0.715 None
The terms and conditions of each grant of Performance Rights to key personnel in the current or a future reporting period are as follows:
Name Year of grant
Performance rights granted
Number of performance rights vested
Performance rights
cancelled Total Unvested Class Number
In prior periods
In current period
A W Kiernan 2013 Class 2 225,000 75,000 75,000 75,000 -
S Tarrant 2017 Class 6 50,000 - - - 100%
S Tarrant 2017 Class 7 50,000 - - - 100%
L R Cornelius 2013 Class 1 100,000 50,000 - - 50%¹
P M Donaldson 2014 Class 4 2,450,000 950,000 700,000 - 33%
The performance rights on issue to key management personnel, as set out above, vest, subject to the following vesting conditions:
Class 1:
• 308,000 upon completion of a Feasibility Study for the Colluli Potash Project (vested November 2015); and
• 308,000 upon completion of securing finance for the development of the Colluli Potash Project
Class 2:
• 75,000 upon signing of the ENAMCO agreements for the Colluli Potash Project (vested November 2014);
• 75,000 upon granting of a Mining License for the Colluli Potash Project (vested February 2017); and
• 75,000 upon completion of securing finance for the development of the Colluli Potash Project (forfeited 6 February 2017).
For
per
sona
l use
onl
y

Directors’ Report
DANAKALI LIMITED ABN 56 097 904 302
25
Class 4:
• 300,000 upon completion of a Prefeasibility Study and the release of the study results to market (vested March 2015);
• 650,000 upon completion of a Definitive Feasibility Study and release of study results to market (vested November 2015);
• 700,000 upon awarding of the Colluli mining licence (vested February 2017); and
• 800,000 upon commencement of construction of the production facility.
Class 6:
• 10,000 upon successful completion of a dual listing of the Company on the London stock exchange;
• 15,000 upon Endeavour Financial being paid its first milestone success fee which is linked to a letter of finance support from a lending institution; and
• 25,000 upon term sheets being signed for the project financing of the Colluli project.
Class 7:
• 10,000 upon market announcement of a binding offtake agreement to support debt funding of the project;
• 10,000 upon market announcement on completion of FEED;
• 15,000 upon completion of a strategic investment at greater than 30-day VWAP plus 10%; and
• 15,000 on signing a debt terms sheet for project financing or debt is secured form a strategic investor.
During the year ended 31 December 2017, a total of 75,000 performance rights held by A Kiernan (Class 2) were forfeited during the year.
g) Equity Instruments Held by Key Management Personnel
(i) Shares
No shares were granted as remuneration during the year ended 31 December 2017.
The number of shares in the Company held during the financial period by each director of Danakali Ltd and other key management personnel of the Group, including their personally related parties, are set out in the following tables.
Note: (a) Upon his resignation on 6 February 2017, Mr Kiernan held 1,278,128 shares (b) Upon his resignation on 17 November 2017, Mr L Cornelius held 16,682,041 shares (c) Appointed 6 February 2017 (d) Appointed 2 October 2017 (e) Appointed 21 December 2017 (f) Upon his resignation on 7 July 2017, Mr C Els held 245,000 shares (g) Upon his appointment on 12 June 2017, Mr Tarrant held 218,434 shares (h) Appointed 7 July 2017
(ii) Options
Financial Year to 31 December 2017 Shares
Balance at 31 December
2016
Granted as compensatio
n
Received
on exercise of remuneration
options
Received on conversion of performance
rights
On market purchases/
(sales)
Other Balance at 31 December
2017
Directors
S I Cornelius 8,493,046 - 1,300,000 - 5,138 - 9,798,184
A W Kiernan (a) 1,203,128 - - 75,000 - (1,278,128) -
L R Cornelius (b) 15,682,041 - 1,000,000 - - (16,682,041) -
J D Fitzgerald 258,334 - - - - - 258,334
J Zhang - - - - - - -
R Connochie (c) - - - - - - -
A Liebenberg (d) - - - - - - -
P M Donaldson 1,818,334 - 200,000 700,000 - - 2,718,334
Other Key Management
Personnel
D Goeman (e) - - - - - - -
C P Els (f) 110,000 - 500,000 - (365,000) (245,000) -
S Tarrant (g) - - - - - 218,434 218,434
C Grant-Edwards(h)
M Chapman (h) - - - - - - -
TOTAL 27,564,883 - 3,000,000 775,000 (359,862) (17,986,735) 12,993,286 For
per
sona
l use
onl
y

Directors’ Report
DANAKALI LIMITED ABN 56 097 904 302
26
During the financial year to 31 December 2017, the Company issued 1,440,000 options over unissued ordinary shares in the Company to Key Management Personnel.
The numbers of options over ordinary shares in the Company held during the financial period by each director of Danakali Ltd and other Key Management Personnel of the Group, including their personally related parties, are set out in the following tables.
Financial Year to 31 December 2017
Balance at 31 December
2016
Granted Exercised Expired / Cancelled
Other Balance at 31 December
2017
Vested
and exercisable
Unvested
Directors
S I Cornelius 2,675,000 300,000 (1,300,000) - - 1,675,000 1,675,000 -
A W Kiernan (a) 1,750,000 - - - (1,750,000) - - -
L R Cornelius (b) 1,900,000 190,000 (1,000,000) - (1,090,000) - - -
J D Fitzgerald 1,225,000 250,000 - - - 1,475,000 1,475,000 -
J Zhang - 100,000 - - - 100,000 100,000 -
R Connochie (c) - 500,000 - - - 500,000 500,000 -
A Liebenberg (d) - - - - - - - -
P M Donaldson (e) 1,550,000 100,000 (200,000) - (800,000) 650,000 650,000 -
Other Management
Personnel
D Goeman (f) - - - - 1,000,000 1,000,000 900,000 100,000
C P Els (g) 1,300,000 - (500,000) (800,000) - - - -
S Tarrant (h) - - - - - - - -
C Grant-Edwards (i) - - - - - - - -
M Chapman (i) - - - - - - - -
TOTAL 10,400,000 1,440,000 (3,000,000) (800,000) (2,640,000) 5,400,000 5,300,000 100,000
Note: (a) Upon his resignation on 6 February 2017, Mr Kiernan held 1,750,000 options (b) Upon his resignation on 17 November 2017, Mr L Cornelius held 1,090,000 options (c) Appointed 6 February 2017 (d) Appointed 2 October 2017 (e) During the year, Mr Donaldson sold 800,000 unlisted options exercisable at $0.278 expiring 17 November 2017 via off market
transfers for $177,600 consideration (f) Upon his appointment on 21 December 2017, Mr Goeman held 1,000,000 options (g) Resigned 7 July 2017 (h) Appointed 12 June 2017 (i) Appointed 7 July 2017 (j) Options granted refer to remuneration options issued to directors, as approved at the Annual General Meeting of the Company
held 19 May 2017. The unlisted options are exercisable at $0.94 each expiring 19 May 2020.
(iii) Performance Rights held by Key Management Personnel
A total of 100,000 performance rights were granted as remuneration to Key Management Personnel during the year ended 31 December 2017 (31 December 2016: nil).
Movements in Performance Rights held by Key Management Personnel are as set out in the following table:
Financial Year to 31 December 2017 Performance Rights
Balance At 31
December 2016
Granted as Remuneration
Vested during the
period
Cancelled Other Balance at 31
December 2017
Directors
S I Cornelius - - - - - -
A W Kiernan (a) 150,000 - (75,000) (75,000) - -
L R Cornelius (b) 50,000 - - - (50,000) -
J D Fitzgerald - - - - - -
J Zhang - - - - - -
R Connochie (c) - - - - - -
A Liebenberg (d) - - - - - -
P M Donaldson 1,500,000 - (700,000) - - 800,000
For
per
sona
l use
onl
y

Directors’ Report
DANAKALI LIMITED ABN 56 097 904 302
27
Other Key Management Personnel
D Goeman (e) - - - - - -
C P Els (f) - - - - - -
S Tarrant (g) - 100,000 - - - 100,000
C Grant-Edwards (h) - - - - - -
M Chapman (h) - - - - - -
TOTAL 1,700,000 100,000 (775,000) (75,000) - 900,000
Note: (a) Resigned 6 February 2017 (b) Upon his resignation on 17 November 2017, Mr L Cornelius held 50,000 performance rights (c) Appointed 6 February 2017 (d) Appointed 2 October 2017 (e) Appointed 21 December 2017 (f) Resigned 7 July 2017 (g) Appointed 12 June 2017
h) Loans to Key Management Personnel
There were no loans to key management personnel during the period.
i) Other Transactions with Key Management Personnel
There were no other transactions with key management personnel during the period.
j) Additional Information
The remuneration structure has been set up with the objective of attracting and retaining the highest calibre staff who contribute to the success of the Company’s performance and individual rewards. The remuneration policies seek a balance between the interests of stakeholders and competitive market remuneration levels. The overall level of key management personnel compensation takes into account the performance of the Group over a number of years and the stage of activities the Company is engaged in.
During the period, there was a high level of development activity, project permitting and generally progressing the Colluli Potash Project. The remuneration paid during the period is commercially reasonable for an exploration and development stage mining company. Company performance is measured against a comparable list of companies operating in the same market segment. There was no increase in key management personnel compensation during the period.
The Group is still in the exploration and development stage and revenue streams only relate to interest earned on investing surplus funds from capital raisings. The net losses after tax reflect the ongoing costs of the Group’s exploration programs and development on the Colluli Potash Project. The table below shows the performance of the Group over the last 5 reporting periods:
Financial Year 31 Dec 2017 31 Dec 2016 31 Dec 2015 31 Dec 2014 (a) 30 Jun 2014
Basic EPS (Cents) (2.85) (2.35) (4.01) 2.18 0.16
Share Price $0.715 $0.48 $0.29 $0.19 $0.15
(Loss)/ Income for the period
($6,839,936) ($4,925,558) ($6,792,685) $2,999,972 $3,355,983
Note: (a) 31 December 2014 was a six-month transitional period while adjusting to a December year end.
As at the date of this report, the Company is in the process of reviewing its remuneration framework to ensure it reflects current business needs, shareholder views and contemporary market practice and remains appropriate to attract, motivate, retain and reward employees.
- - END OF REMUNERATION REPORT - -
Signed in accordance with a resolution of the directors.
Seamus Cornelius
CHAIRMAN Perth, 22 March 2018
For
per
sona
l use
onl
y

Directors’ Report
DANAKALI LIMITED ABN 56 097 904 302
28
Competent Persons and Responsibility Statements
Competent Persons Statement (Sulphate of Potash Mineral Resource) Colluli has a JORC-2012 compliant Measured, Indicated and Inferred Mineral Resource estimate of 1,289Mt @11% K20. The resource contains 303Mt @ 11% K20 of Measured Resources, 951Mt @ 11% K20 of Indicated Resources and 35Mt @ 10% K20 of Inferred Resources. The information relating to the 2015 Colluli Mineral Resource estimate was compiled by Mr. John Tyrrell, under the supervision of Mr. Stephen Halabura M. Sc. P. Geo. Fellow of Engineers Canada (Hon), Fellow of Geoscientists Canada, and a geologist with over 25 years’ experience in the potash mining industry. Mr. Tyrrell is a member of the Australian Institute of Mining and Metallurgy and a full-time employee of AMC. Mr. Tyrrell has more than 25 years’ experience in the field of Mineral Resource estimation. Mr. Halabura is a member of the Association of Professional Engineers and Geoscientists of Saskatchewan, a Recognised Professional Organisation (RPO) under the JORC Code and has sufficient experience relevant to the style of mineralisation and type of deposit under consideration and to the activity which he is undertaking to qualify as a Competent Person as defined in the 2012 Edition of the Australasian Code for Reporting of Exploration Results, Mineral Resources and Ore Reserves (the JORC Code). Mr. Tyrrell and Mr. Halabura consent to the inclusion of information relating to the 2015 Resource Statement in the form and context in which it appears. Competent Persons Statement (Sulphate of Potash Ore Reserve) The January 2018 Colluli Ore Reserve is reported according to the JORC Code and estimated at 1,100Mt @ 10.5% K2O Equiv. The Ore Reserve is classed as 285Mt @ 11.3% K2O Equiv. Proved and 815Mt @ 10.3% K2O Equiv. Probable. The Competent Person for the estimate is Mr Mark Chesher, a mining engineer with more than 30 years’ experience in the mining industry. Mr. Chesher is a Fellow of the AusIMM, a Chartered Professional, a full-time employee of AMC Consultants Pty Ltd, and has sufficient open pit mining activity experience relevant to the style of mineralisation and type of deposit under consideration to qualify as a Competent Person as defined in the JORC Code. Mr Chesher consents to the inclusion of information relating to the Ore Reserve in the form and context in which it appears. In reporting the Mineral Resources and Ore Reserves referred to in this public release, AMC Consultants Pty Ltd acted as an independent party, has no interest in the outcomes of Colluli and has no business relationship with Danakali other than undertaking those individual technical consulting assignments as engaged, and being paid according to standard per diem rates with reimbursement for out-of-pocket expenses. Therefore, AMC Consultants Pty Ltd and the Competent Persons believe that there is no conflict of interest in undertaking the assignments which are the subject of the statements. Competent Persons Statement (Rock Salt Mineral Resource) Colluli has a JORC-2012 compliant Measured, Indicated and Inferred Mineral Resource estimate of 347Mt @ 96.9% NaCl. The Mineral Resource estimate contains 28Mt @ 97.2% NaCl of Measured Resources, 180Mt @ 96.6% NaCl of Indicated Resources and 139Mt @ 97.2% NaCl of Inferred Resources. The information relating to the Colluli Rock Salt Mineral Resource estimate was compiled by Mr. John Tyrrell. Mr. Tyrrell is a member of the Australasian Institute of Mining and Metallurgy (AusIMM) and a full-time employee of AMC. Mr. Tyrrell has more than 25 years’ experience in the field of Mineral Resource estimation. He has sufficient experience relevant to the style of mineralisation and type of the deposit under consideration, and in resource model development, to qualify as a Competent Person as defined in the JORC Code. Mr Tyrrell consents to the inclusion of the information relating to the rock salt Mineral Resource in the form and context in which it appears. Quality control and quality assurance Danakali exploration programs follow standard operating and quality assurance procedures to ensure that all sampling techniques and sample results meet international reporting standards. Drill holes are located using GPS coordinates using WGS84 Datum, all mineralisation intervals are downhole and are true width intervals. The samples are derived from HQ diamond drill core, which in the case of carnallite ores, are sealed in heat-sealed plastic tubing immediately as it is drilled to preserve the sample. Significant sample intervals are dry quarter cut using a diamond saw and then resealed and double bagged for transport to the laboratory. Halite blanks and duplicate samples are submitted with each hole. Chemical analyses were conducted by Kali-Umwelttechnik GmBH, Sondershausen, Germany, utilising flame emission spectrometry, atomic absorption spectroscopy and ion chromatography. Kali-Umwelttechnik (KUTEC) has extensive experience in analysis of salt rock and brine samples and is certified according by DIN EN ISO/IEC 17025 by the Deutsche Akkreditierungsstelle GmbH (DAR). The laboratory follows standard procedures for the analysis of potash salt rocks chemical analysis (K+, Na+, Mg2+, Ca2+, Cl-, SO4
2-, H2O) and X-ray diffraction (XRD) analysis of the same samples as for chemical analysis to determine a qualitative mineral composition, which combined with the chemical analysis gives a quantitative mineral composition. Forward looking statements and disclaimer The information in this document is published to inform you about Danakali and its activities. Danakali has endeavoured to ensure that the information enclosed is accurate at the time of release, and that it accurately reflects the Company’s intentions. All statements in this document, other than statements of historical facts, that address future production, project development, reserve or resource potential, exploration drilling, exploitation activities, corporate transactions and events or developments that the Company expects to occur, are forward looking statements. Although the Company believes the expectations expressed in such statements are based on reasonable
For
per
sona
l use
onl
y

Directors’ Report
DANAKALI LIMITED ABN 56 097 904 302
29
assumptions, such statements are not guarantees of future performance and actual results or developments may differ materially from those in forward-looking statements. Factors that could cause actual results to differ materially from those in forward-looking statements include market prices of potash and, exploitation and exploration successes, capital and operating costs, changes in project parameters as plans continue to be evaluated, continued availability of capital and financing and general economic, market or business conditions, as well as those factors disclosed in the Company’s filed documents. There can be no assurance that the development of Colluli will proceed as planned. Accordingly, readers should not place undue reliance on forward looking information. Mineral Resources and Ore Reserves have been reported according to the JORC Code, 2012 Edition. To the extent permitted by law, the Company accepts no responsibility or liability for any losses or damages of any kind arising out of the use of any information contained in this document. Recipients should make their own enquiries in relation to any investment decisions. Mineral Resource, Ore Reserve, and financial assumptions made in this presentation are consistent with assumptions detailed in the Company’s ASX announcements dated 25 February 2015, 23 September 2015, 15 August 2016, 1 February 2017 and 29 January 2018, which continue to apply and have not materially changed. The Company is not aware of any new information or data that materially affects assumptions made.
For
per
sona
l use
onl
y

A member firm of Ernst & Young Global Limited Liability limited by a scheme approved under Professional Standards Legislation
GB:EH:DNK:031
Ernst & Young 11 Mounts Bay Road Perth WA 6000 Australia GPO Box M939 Perth WA 6843
Tel: +61 8 9429 2222 Fax: +61 8 9429 2436 ey.com/au
Auditor's Independence Declaration to the Directors of Danakali Limited
As lead auditor for the audit of Danakali Limited for the financial year ended 31 December 2017, I declare to the best of my knowledge and belief, there have been:
a) no contraventions of the auditor independence requirements of the Corporations Act 2001 in relation to the audit; and
b) no contraventions of any applicable code of professional conduct in relation to the audit.
This declaration is in respect of Danakali Limited and the entities it controlled during the financial year. Ernst & Young Gavin Buckingham Partner 22 March 2018
For
per
sona
l use
onl
y

Consolidated Statement of Profit or Loss and Other Comprehensive Income FOR THE YEAR ENDED 31 DECEMBER 2017
DANAKALI LIMITED ABN 56 097 904 302
31
2017 2016
Notes $ $
REVENUE
Interest income 4 221,189 109,537
Accretion relating to the unwinding of discount on joint venture loan 10 1,362,780 1,554,925
OTHER INCOME
Foreign exchange (loss)/gain (423,601) 224,230
Sundry 4,218 -
EXPENSES
Depreciation expense 5 (3,588) (10,131)
Administration expenses (1,684,367) (1,999,782)
Loss on disposal of fixed asset - (1,483)
Share based payment expense 22 (988,573) (1,290,347)
Loss on re-measurement of loan to joint venture carried at amortised cost 10 (216,909) (2,812,064)
Share of net loss of joint venture 10 (5,111,085) (700,443)
LOSS BEFORE INCOME TAX (6,839,936) (4,925,558)
Income tax expense 7 - -
LOSS FOR THE YEAR (6,839,936) (4,925,558)
OTHER COMPREHENSIVE INCOME
Items that may be reclassified to profit or loss in subsequent periods
Share of foreign currency translation reserve relating to equity accounted investment 10,14 (933,753) 269,925
OTHER COMPREHENSIVE INCOME FOR THE YEAR, NET OF TAX (933,753) 269,925
TOTAL COMPREHENSIVE LOSS FOR THE YEAR (7,773,689) (4,655,633)
Earnings per share for loss attributable to the ordinary equity holders of the Company:
Basic loss per share (cents per share) 17 (2.85) (2.35)
Diluted loss per share (cents per share) 17 (2.85) (2.35)
The above Consolidated Statement of Profit or Loss and Other Comprehensive Income should be read in conjunction with the accompanying notes.
For
per
sona
l use
onl
y

Consolidated Statement of Financial Position AS AT 31 DECEMBER 2017
DANAKALI LIMITED ABN 56 097 904 302
32
2017 2016
Notes $ $
CURRENT ASSETS
Cash 6 15,559,980 10,904,760
Trade and other receivables 8 174,321 93,985
Prepayments 50,094 25,101
TOTAL CURRENT ASSETS 15,784,395 11,023,846
NON-CURRENT ASSETS
Receivables 8 12,216,952 9,519,503
Investment in joint venture 10 13,811,946 13,502,312
Plant and equipment 9 15,110 7,920
TOTAL NON-CURRENT ASSETS 26,044,008 23,029,735
TOTAL ASSETS 41,828,403 34,053,581
CURRENT LIABILITIES
Trade and other payables 11 1,097,087 210,742
Provisions 12 166,219 134,701
TOTAL CURRENT LIABILITIES 1,263,306 345,443
NON-CURRENT LIABILITIES
Provisions 12 27,811 42,450
TOTAL NON-CURRENT LIABILITIES 27,811 42,450
TOTAL LIABILITIES 1,291,117 387,893
NET ASSETS 40,537,286 33,665,688
EQUITY
Issued capital 13 75,415,034 61,758,320
Reserves 14 12,521,599 12,466,779
Accumulated losses 15 (47,399,347) (40,559,411)
TOTAL EQUITY 40,537,286 33,665,688
The above Consolidated Statement of Financial Position should be read in conjunction with the accompanying notes
For
per
sona
l use
onl
y

Consolidated Statement of Changes in Equity FOR THE YEAR ENDED 31 DECEMBER 2017
DANAKALI LIMITED ABN 56 097 904 302
33
Notes
Issued Capital
Reserves
Accumulated Losses Total Equity
Share Based Payments
Foreign Currency Translation
$ $ $ $ $
BALANCE AT 1 JANUARY 2017 61,758,320 10,427,536 2,039,243 (40,559,411) 33,665,688
Loss for the period - - - (6,893,936) (6,893,936)
Other comprehensive income 14 - - (933,753) - (933,753)
Total comprehensive income for the period - - (933,753) (6,893,936) (7,773,689)
Transactions with owners in their capacity as owners:
Shares issued 13 14,328,083 - - - 14,328,083
Costs of capital raised 13 (671,369) - - - (671,369)
Options and performance rights issued 14 - 988,573 - - 988,573
BALANCE AT 31 DECEMBER 2017 75,415,034 11,416,109 1,105,490 (47,399,347) 40,537,286
BALANCE AT 1 JANUARY 2016 48,983,913 9,137,189 1,769,318 (35,633,853) 24,256,567
Loss for the period - - - (4,925,558) (4,925,558)
Other comprehensive income 14 - - 269,925 - 269,925
Total comprehensive income for the period - - 269,925 (4,925,558) (4,655,633)
Transactions with owners in their capacity as owners:
Shares issued 13 13,360,664 - - - 13,360,664
Costs of capital raised 13 (586,257) - - - (586,257)
Options and performance rights issued 14 - 1,290,347 - - 1,290,347
BALANCE AT 31 DECEMBER 2016 61,758,320 10,427,536 2,039,243 (40,559,411) 33,665,688
The above Consolidated Statement of Changes in Equity should be read in conjunction with the accompanying notes. For
per
sona
l use
onl
y

Consolidated Statement of Cash Flows FOR THE YEAR ENDED 31 DECEMBER 2017
DANAKALI LIMITED ABN 56 097 904 302
34
2017 2016
Notes $ $
CASH FLOWS FROM OPERATING ACTIVITIES
Interest received 231,693 104,964
Realised foreign exchange gain 71,924 169,987
Payments to suppliers and employees (1,583,296) (1,945,485)
NET CASH OUTFLOW FROM OPERATING ACTIVITIES 16 (1,279,679) (1,670,534)
CASH FLOWS FROM INVESTING ACTIVITIES
Funding of joint venture (7,711,037) (2,952,332)
Payments for plant and equipment (10,778) (3,122)
NET CASH OUTFLOW FROM INVESTING ACTIVITIES (7,721,815) (2,955,454)
CASH FLOWS FROM FINANCING ACTIVITIES
Proceeds from issues of ordinary shares 14,328,083 13,360,664
Costs of capital raised (671,369) (586,257)
NET CASH INFLOW FROM FINANCING ACTIVITIES 13,656,714 12,774,407
NET INCREASE / (DECREASE) IN CASH 4,655,220 8,148,419
Cash at the beginning of the financial year 10,904,760 2,756,341
CASH AT THE END OF THE YEAR 6 15,559,980 10,904,760
The above Consolidated Statement of Cash Flows should be read in conjunction with the accompanying notes.
For
per
sona
l use
onl
y

Notes to the Consolidated Financial Statements
FOR THE YEAR ENDED 31 DECEMBER 2017
DANAKALI LIMITED ABN 56 097 904 302
35
1. GENERAL INFORMATION
Danakali Ltd (‘Danakali or the ‘Company’) is a for profit company limited by shares, incorporated and domiciled in Australia, and whose shares are publicly traded on the Australian Securities Exchange (ASX). The consolidated financial Report of the Group as at, and for the year ended 31 December 2017 comprises the Company and its subsidiaries (together referred to as the ‘Group’). The address of the registered office is Level 1, Churchill Court, 234 Churchill Avenue, Subiaco, WA, 6008.
The financial statements are presented in the Australian currency.
The financial report of Danakali for the year ended 31 December 2017 was authorised for issue by the Directors on 21 March 2018. The directors have the power to amend and reissue the financial statements.
The nature of the operations and principal activities of the consolidated entity are described in the Directors’ Report.
2. BASIS OF PREPARATION
The principal accounting policies adopted in the preparation of the financial statements are set out below. These policies have been consistently applied to all the periods presented, unless otherwise stated.
These general purpose financial statements have been prepared in accordance with Australian Accounting Standards, other authoritative pronouncements of the Australian Accounting Standards Board, Australian Accounting Interpretations and the Corporations Act 2001.
The consolidated financial statements of the Danakali Ltd Group also comply with International Financial Reporting Standards (IFRS) as issued by the International Accounting Standards Board (IASB).
These financial statements have been prepared under the historical cost convention.
(a) Principles of consolidation
Subsidiaries are all entities over which the Group has control. The Group controls an entity when the Group is exposed to, or has rights to, variable returns from its involvement with the entity and has the ability to affect those returns through its power to direct the activities of the entity. Subsidiaries are fully consolidated from the date on which control is transferred to the Group. They are de-consolidated from the date that control ceases.
The acquisition method of accounting is used to account for business combinations by the Group. Intercompany transactions, balances and unrealised gains on transactions between Group companies are eliminated. Unrealised losses are also eliminated unless the transaction provides evidence of an impairment of the transferred asset. Accounting policies of subsidiaries have been changed where necessary to ensure consistency with the policies adopted by the Group.
(b) Segment reporting
Operating segments are reported in a manner consistent with the internal reporting provided to the chief operating decision maker. The chief operating decision maker, who is responsible for allocating resources and assessing performance of the operating segments, has been identified as the full Board of Directors.
(c) Foreign currency translation
(i) Functional and presentation currency
Items included in the financial statements of each of the Group’s entities are measured using the currency of the primary economic environment in which the entity operates (‘the functional currency’). The consolidated financial statements are presented in Australian dollars, which is Danakali's functional and presentation currency.
(ii) Transactions and balances
Foreign currency transactions are translated into the functional currency using the exchange rates prevailing at the dates of the transactions. Foreign exchange gains and losses resulting from the settlement of such transactions and from the translation at period end exchange rates of monetary assets and liabilities denominated in foreign currencies are recognised in profit or loss.
(iii) Foreign operations
The results and financial position of foreign operations (none of which has the currency of a hyperinflationary economy) that have a functional currency different from the presentation currency are translated into the presentation currency as follows:
• assets and liabilities for each statement of financial position presented are translated at the closing rate at the date of that statement of financial position;
• income and expenses for each statement of comprehensive income are translated at average exchange rates (unless that is not a reasonable approximation of the cumulative effect of the rates prevailing on the transaction dates, in which case income and expenses are translated at the dates of the transactions); and
• all resulting exchange differences are recognised in other comprehensive income.
When a foreign operation is sold or any borrowings forming part of the net investment are repaid, a proportionate share of such exchange differences is reclassified to profit or loss, as part of the gain or loss on sale where applicable.
For
per
sona
l use
onl
y

Notes to the Consolidated Financial Statements
FOR THE YEAR ENDED 31 DECEMBER 2017
DANAKALI LIMITED ABN 56 097 904 302
36
(d) Revenue recognition
Interest revenue is recognised on a time proportionate basis that takes into account the effective yield on the financial assets.
(e) Income tax
The income tax expense or revenue for the period is the tax payable on the current period’s taxable income based on the applicable income tax rate for each jurisdiction adjusted by changes in deferred tax assets and liabilities attributable to temporary differences and to unused tax losses.
The current income tax charge is calculated on the basis of the tax laws enacted or substantively enacted at the end of the reporting period in the countries where the Company’s subsidiaries operate and generate taxable income. Management periodically evaluates positions taken in tax returns with respect to situations in which applicable tax regulation is subject to interpretation. It establishes provisions where appropriate on the basis of amounts expected to be paid to the tax authorities.
Deferred income tax is provided in full, using the liability method, on temporary differences arising between the tax bases of assets and liabilities and their carrying amounts in the financial statements. However, the deferred income tax is not accounted for if it arises from initial recognition of an asset or liability in a transaction other than a business combination that at the time of the transaction affects neither accounting nor taxable profit or loss. Deferred income tax is determined using tax rates (and laws) that have been enacted or substantially enacted by the reporting date and are expected to apply when the related deferred income tax asset is realised, or the deferred income tax liability is settled.
Deferred tax assets are recognised for deductible temporary differences and unused tax losses only if it is probable that future taxable amounts will be available to utilise those temporary differences and losses.
Deferred tax assets and liabilities are offset when there is a legally enforceable right to offset current tax assets and liabilities and when the deferred tax balances relate to the same taxation authority. Current tax assets and tax liabilities are offset where the entity has a legally enforceable right to offset and intends either to settle on a net basis, or to realise the asset and settle the liability simultaneously.
Current and deferred tax is recognised in profit or loss, except to the extent that it relates to items recognised in other comprehensive income or directly in equity. In this case, the tax is also recognised in other comprehensive income or directly in equity, respectively.
(f) Leases
Leases of property, plant and equipment where the Group, as lessee, has substantially all the risks and rewards of ownership are classified as finance leases. Finance leases are capitalised at the lease’s inception at the fair value of the leased property or, if lower, the present value of the minimum lease payments. The corresponding rental obligations, net of finance charges, are included in other short-term and long-term payables. Each lease payment is allocated between the liability and finance cost. The finance cost is charged to profit or loss over the lease period so as to produce a constant periodic rate of interest on the remaining balance of the liability for each period. The property, plant and equipment acquired under finance leases is depreciated over the shorter of the asset’s useful life and the lease term.
Leases where a significant portion of the risks and rewards of ownership are not transferred to the Group as lessee are classified as operating leases. Payments made under operating leases (net of any incentives received from the lessor) are charged to profit or loss on a straight-line basis over the period of the lease.
(g) Impairment of assets
Assets are reviewed for impairment whenever events or changes in circumstances indicate that the carrying amount may not be recoverable.
An impairment loss is recognised for the amount by which the asset’s carrying amount exceeds its recoverable amount. The recoverable amount is the higher of an asset’s fair value less costs to sell and value in use. For the purposes of assessing impairment, assets are consolidated at the lowest levels for which there are separately identifiable cash inflows which are largely independent of the cash inflows from other assets (cash-generating units). Non-financial assets other than goodwill that suffered an impairment are reviewed for possible reversal of the impairment at each reporting date.
(h) Cash and cash equivalents
For Consolidated Statement of Cash Flows presentation purposes, cash and cash equivalents includes cash on hand, deposits held at call with financial institutions, other short-term highly liquid investments with original maturities of three months or less that are readily convertible to known amounts of cash and which are subject to insignificant risk of changes in value, and bank overdrafts.
(i) Trade and other receivables
Receivables are recognised and carried at original invoice amount less an allowance for any uncollectible debts. An estimate for doubtful debts is made when collection of the full amount is no longer probable. Bad debts are written-off as incurred.
For
per
sona
l use
onl
y

Notes to the Consolidated Financial Statements
FOR THE YEAR ENDED 31 DECEMBER 2017
DANAKALI LIMITED ABN 56 097 904 302
37
(j) Investments and other financial assets
Classification
The Group classifies its investments in the following categories: financial assets at fair value through profit or loss, loans and receivables, held-to-maturity investments and available-for-sale financial assets. The classification depends on the purpose for which the investments were acquired. Management determines the classification of its investments at initial recognition and, in the case of assets classified as held-to-maturity, re-evaluates this designation at each reporting date.
(i) Loans and receivables
Loans and receivables are non-derivative financial assets with fixed or determinable payments that are not quoted in an active market. They are included in current assets, except for those with maturities greater than 12 months after the reporting date which are classified as non-current assets. Loans and receivables are measured at amortised cost and are included in trade and other receivables in the statement of financial position.
(k) Investment in joint venture
A joint venture is a type of joint arrangement whereby the parties that have joint control of the arrangement have rights to the net assets of the joint venture. Joint control is the contractually agreed sharing of control of an arrangement, which exists only when decisions about the relevant activities require unanimous consent of the parties sharing control.
The Group’s investment in a joint venture is accounted for using the equity method.
Under the equity method, the investment in a joint venture is initially recognised at cost. The carrying amount of the investment is adjusted to recognise changes in the Group’s share of net assets of the joint venture since the acquisition date. Goodwill relating to the joint venture is included in the carrying amount of the investment and is neither amortised nor individually tested for impairment.
The statement of profit or loss reflects the Group’s share of the results of operations of the joint venture. Any change in other comprehensive income of those investees is presented as part of the Group’s other comprehensive income. In addition, when there has been a change recognised directly in the equity of the joint venture, the Group recognises its share of any changes, when applicable, in the statement of changes in equity. Unrealised gains and losses resulting from transactions between the Group and the joint venture are eliminated to the extent of the interest in the joint venture.
The aggregate of the Group’s share of profit or loss of a joint venture is shown on the face of the statement of profit or loss outside operating profit and represents profit or loss after tax and non-controlling interests in the subsidiaries of the joint venture.
The financial statements of the joint venture are prepared for the same reporting period as the Group. When necessary, adjustments are made to bring the accounting policies in line with those of the Group.
After application of the equity method, the Group determines whether it is necessary to recognise an impairment loss on its investment in its joint venture. At each reporting date, the Group determines whether there is objective evidence that the investment in the joint venture is impaired. If there is such evidence, the Group calculates the amount of impairment as the difference between the recoverable amount of the joint venture and its carrying value, then recognises the loss as ‘Share of profit of the equity accounted investment’ in profit or loss.
Upon loss of joint control over a joint venture, the Group measures and recognises any retained investment at its fair value. Any difference between the carrying amount of the joint venture upon loss of joint control and the fair value of the retained investment and proceeds from disposal is recognised in profit or loss.
(l) Plant and equipment
All plant and equipment is stated at historical cost less depreciation. Historical cost includes expenditure that is directly attributable to the acquisition of the items.
Subsequent costs are included in the asset’s carrying amount or recognised as a separate asset, as appropriate, only when it is probable that future economic benefits associated with the item will flow to the Group and the cost of the item can be measured reliably. The carrying amount of any component accounted for as a separate asset is de-recognised when replaced. All other repairs and maintenance are charged to profit or loss during the reporting period in which they are incurred.
Depreciation of plant and equipment is calculated using the straight-line basis so as to write off the net cost or other revalued amount of each asset over its expected useful life to its estimated residual value.
The assets’ residual values and useful lives are reviewed, and adjusted if appropriate, at each reporting date.
An asset’s carrying amount is written down immediately to its recoverable amount if the asset’s carrying amount is greater than its estimated recoverable amount (note 2(g)).
Gains and losses on disposals are determined by comparing proceeds with carrying amount. These are included in profit or loss. When revalued assets are sold, it is Group’s policy to transfer the amounts included in other reserves in respect of those assets to retained earnings.
For
per
sona
l use
onl
y

Notes to the Consolidated Financial Statements
FOR THE YEAR ENDED 31 DECEMBER 2017
DANAKALI LIMITED ABN 56 097 904 302
38
(m) Exploration and evaluation costs
Acquired exploration and evaluation costs are capitalised. Ongoing exploration and evaluation costs are expensed in the period they are incurred.
(n) Trade and other payables
These amounts represent liabilities for goods and services provided to the Group prior to the end of the financial period which are unpaid. The amounts are unsecured, non-interest bearing and are paid on normal commercial terms.
(o) Employee benefits
(i) Wages and salaries, annual leave and long service leave
Liabilities for wages and salaries, including non-monetary benefits, and annual leave expected to be settled within 12 months of the reporting date are recognised in other payables in respect of employees’ services up to the reporting date and are measured at the amounts expected to be paid when the liabilities are settled.
The liability for long service leave is recognised in the provision for employee benefits and measured as the present value of expected future payments to be made in respect of services provided by employees up to the reporting date.
(ii) Share-based payments
The Group provides benefits to employees (including directors) of the Group in the form of share-based payment transactions, whereby employees render services in exchange for options or rights over shares (‘equity-settled transactions’) refer to note 22.
The cost of these equity-settled transactions with employees is measured by reference to the fair value at the date at which they are granted. The fair value of options is determined by an internal valuation using a Black-Scholes option pricing model. The fair value of performance rights determined by consideration of the Company’s share price at the grant date.
The cost of equity-settled transactions is recognised, together with a corresponding increase in equity, over the period in which the performance conditions are fulfilled, ending on the date on which the relevant employees become fully entitled to the award (‘vesting date’).
The cumulative expense recognised for equity-settled transactions at each reporting date until vesting date reflects (i) the extent to which the vesting period has expired and (ii) the number of options or rights that, in the opinion of the directors of the Company, will ultimately vest. This opinion is formed based on the best available information at balance date. No adjustment is made for the likelihood of market performance conditions being met as the effect of these conditions is included in the determination of fair value at grant date.
No expense is recognised for awards that do not ultimately vest, except for awards where vesting is conditional upon a market condition.
Where an equity-settled award is cancelled, it is treated as if it had vested on the date of cancellation, and any expense not yet recognised for the award is recognised immediately. However, if a new award is substituted for the cancelled award and designated as a replacement award on the date that it is granted, the cancelled and new award are treated as if they were a modification of the original award.
(p) Issued capital
Ordinary shares are classified as equity. Incremental costs directly attributable to the issue of new shares or options are shown in equity as a deduction, net of tax, from the proceeds.
(q) Earnings per share
(i) Basic earnings per share
Basic earnings per share is calculated by dividing the profit or loss attributable to owners of the Company, excluding any costs of servicing equity other than ordinary shares, by the weighted average number of ordinary shares outstanding during the financial period, adjusted for bonus elements in ordinary shares issued during the period.
(ii) Diluted earnings per share
Diluted earnings per share adjusts the figures used in the determination of basic earnings per share to take into account the after-income tax effect of interest and other financing costs associated with dilutive potential ordinary shares and the weighted average number of shares assumed to have been issued for no consideration in relation to dilutive potential ordinary shares.
(r) Critical accounting judgements, estimates and assumptions
The preparation of these financial statements requires the use of certain critical accounting estimates. It also requires management to exercise its judgement in the process of applying the Group’s accounting policies. The areas involving a higher degree of judgement or complexity, or areas where assumptions and estimates are significant to the financial statements are:
For
per
sona
l use
onl
y

Notes to the Consolidated Financial Statements
FOR THE YEAR ENDED 31 DECEMBER 2017
DANAKALI LIMITED ABN 56 097 904 302
39
(i) Impairment
The Group assesses impairment of all assets at each reporting date by evaluating conditions specific to the Group and to the particular asset that may lead to impairment. The major assets are tested for impairment when there is objective evidence of impairment. As at 31 December 2017 the Group assessed that, no indicator of impairment existed (31 December 2016: Nil).
(ii) Interest in Joint Arrangement and measurement of loan receivable
The Group accounts for its 50% interest in CMSC as a joint venture using the equity method.
Danakali holds 3 of 5 CMSC Board seats, however in reference to certain material decisions which are reserved for Majority Shareholder approval it has been determined that the interest in CMSC is more appropriately classified as an interest in a joint venture and has been accounted for using the equity method. These shareholder voting rights are considered to be substantive rights particularly in the early stages of the project development.
The assumptions applied in accounting for the loan to the joint venture includes determining the timing of cash receipts and the discount rate applied. At 31 December 2017 a discount rate of 25% was applied, which is consistent with previous years. The timing of cash receipts has been adjusted according to management’s best estimate and it is currently estimated that receipts commence in the December 2020 quarter.
Further context is detailed in note 10.
(iii) Share based payment transactions
The Group measures the cost of equity-settled transactions with employees by reference to the fair value of the equity instruments at the date at which they are granted. The fair value of options is determined by an internal valuation using a Black-Scholes option pricing model, using the assumptions detailed in note 22.
The fair value of performance rights is determined by the share price at the date of valuation and consideration of the probability of the vesting condition being met.
(s) Goods and Services Tax (GST)
Revenues, expenses and assets are recognised net of the amount of associated GST, unless the GST incurred is not recoverable from the taxation authority. In this case, it is recognised as part of the cost of acquisition of the asset or as part of the expense.
Receivables and payables are stated inclusive of the amount of GST receivable or payable. The net amount of GST recoverable from, or payable to, the taxation authority is included with other receivables or payables in the Consolidated Statement of Financial Position.
Cash flows are presented on a gross basis. The GST components of cash flows arising from investing or financing activities which are recoverable from, or payable to the taxation authority, are presented as operating cash flows.
(t) Government grants
Government grants are recognised where there is reasonable assurance that the grant will be received, and all attached conditions will be complied with. When the grant relates to an expense item, it is recognised as income on a systematic basis over the periods that the related costs, for which it is intended to compensate, are expensed. When the grant relates to an asset, it is recognised as income in equal amounts over the expected useful life of the related asset.
(u) Application of new accounting standards
All new accounting standards or amendments applicable to the Group and effective at 1 January 2017 have been adopted. The adoption of these new and amended standards and interpretations did not result in any significant changes to the Group’s accounting policies.
The following relevant standards and interpretations have been applied for the first time for the year ended 31 December 2017:
Reference Title Summary
AASB 2016-1
Amendments to Australian Accounting Standards – Recognition of Deferred Tax Assets for Unrealised Losses
This Standard amends AASB 112 Income Taxes (July 2004) and AASB 112 Income Taxes (August 2015) to clarify the requirements on recognition of deferred tax assets for unrealised losses on debt instruments measured at fair value.
AASB 2016-2
Amendments to Australian Accounting Standards – Disclosure Initiative: Amendments to AASB 107
This Standard amends AASB 107 Statement of Cash Flows (August 2015) to require entities preparing financial statements in accordance with Tier 1 reporting requirements to provide disclosures that enable users of financial statements to evaluate changes in liabilities arising from financing activities, including both changes arising from cash flows and non-cash changes.
For
per
sona
l use
onl
y

Notes to the Consolidated Financial Statements
FOR THE YEAR ENDED 31 DECEMBER 2017
DANAKALI LIMITED ABN 56 097 904 302
40
Reference Title Summary
Annual Improvements
to IFRS Standards 2014–2016
Cycle
Annual Improvements to IFRS Standards 2014–2016 Cycle
This amending standard addresses the following:
• IFRS 12 Disclosure of Interests in Other Entities Clarification of the scope of the Standard (effective date 1 January 2017)
• IFRS 1 First-time Adoption of International Financial Reporting Standards - Deletion of short-term exemptions for first-time adopters (effective date 1 January 2018)
• IAS 28 Investments in Associates and Joint Ventures - Measuring an associate or joint venture at fair value. (effective date 1 January 2018)
(v) New accounting standards and interpretations not yet effective
Australian Accounting Standards that have recently been issued or amended but are not yet effective and have not been adopted by the Group for the annual reporting year ended 31 December 2017 are outlined in the table below. The potential effect of these Standards is yet to be fully determined.
Reference Title Summary Application date
of standard* for Group
AASB 9 Financial Instruments AASB 9 (December 2014) is a new standard which replaces AASB 139. This new version supersedes AASB 9 issued in December 2009 (as amended) and AASB 9 (issued in December 2010) and includes a model for classification and measurement, a single, forward-looking ‘expected loss’ impairment model and a substantially-reformed approach to hedge accounting.
AASB 9 is effective for annual periods beginning on or after 1 January 2018. However, the Standard is available for early adoption. The own credit changes can be early adopted in isolation without otherwise changing the accounting for financial instruments.
Classification and measurement
AASB 9 includes requirements for a simpler approach for classification and measurement of financial assets compared with the requirements of AASB 139. There are also some changes made in relation to financial liabilities.
The main changes are described below.
Financial assets
a) Financial assets that are debt instruments will be classified based on (1) the objective of the entity's business model for managing the financial assets; (2) the characteristics of the contractual cash flows give rise to cash flows that are solely payments of principle and interest (“SPPI test”).
b) Allows an irrevocable election on initial recognition to present gains and losses on investments in equity instruments that are not held for trading in other comprehensive income. Dividends in respect of these investments that are a return on investment can be recognised in profit or loss and there is no impairment or recycling on disposal of the instrument.
c) Financial assets can be designated and measured at fair value through profit or loss at initial recognition if doing so eliminates or significantly reduces a measurement or recognition inconsistency that would arise from measuring assets or liabilities, or recognising the gains and losses on them, on different bases.
Financial liabilities
Changes introduced by AASB 9 in respect of financial liabilities are limited to the measurement
1 January 2018
1 January 2018
For
per
sona
l use
onl
y

Notes to the Consolidated Financial Statements
FOR THE YEAR ENDED 31 DECEMBER 2017
DANAKALI LIMITED ABN 56 097 904 302
41
Reference Title Summary Application date
of standard* for Group
of liabilities designated at fair value through profit or loss (FVPL) using the fair value option.
Where the fair value option is used for financial liabilities, the change in fair value is to be accounted for as follows:
• The change attributable to changes in credit risk are presented in other comprehensive income (OCI)
• The remaining change is presented in profit or loss
AASB 9 also removes the volatility in profit or loss that was caused by changes in the credit risk of liabilities elected to be measured at fair value. This change in accounting means that gains or losses attributable to changes in the entity’s own credit risk would be recognised in OCI. These amounts recognised in OCI are not recycled to profit or loss if the liability is ever repurchased at a discount.
Impairment
The final version of AASB 9 introduces a new expected-loss impairment model that will require more timely recognition of expected credit losses. Specifically, the new Standard requires entities to account for expected credit losses from when financial instruments are first recognised and to recognise full lifetime expected losses on a more timely basis.
Hedge accounting
Amendments to AASB 9 (December 2009 and 2010 editions and AASB 2013-9) issued in December 2013 included the new hedge accounting requirements, including changes to hedge effectiveness testing, treatment of hedging costs, risk components that can be hedged and disclosures.
Consequential amendments were also made to other standards as a result of AASB 9.
Danakali assessment
In assessing the classification and measurement of the Loan to Colluli Mining Share Company (see note 8) under AASB 9, management is in the process of determining whether the current policy of carrying the loan at amortised cost will be appropriate. Should the loan fail the SSPI test due to the non-recourse nature of the loan, it will be classified as a financial asset at fair value through profit and loss.
AASB 15 Revenue from Contracts with Customers
AASB 15 Revenue from Contracts with Customers replaces the existing revenue recognition standards AASB 111 Construction Contracts, AASB 118 Revenue and related Interpretations (Interpretation 13 Customer Loyalty Programmes, Interpretation 15 Agreements for the Construction of Real Estate, Interpretation 18 Transfers of Assets from Customers, Interpretation 131 Revenue—Barter Transactions Involving Advertising Services and Interpretation 1042 Subscriber Acquisition Costs in the Telecommunications Industry). AASB 15 incorporates the requirements of IFRS 15 Revenue from Contracts with Customers issued by the International Accounting Standards Board (IASB) and developed jointly with the US Financial Accounting Standards Board (FASB).
AASB 15 specifies the accounting treatment for revenue arising from contracts with customers (except for contracts within the scope of other accounting standards such as leases or financial
1 January 2018
1 January 2018
For
per
sona
l use
onl
y

Notes to the Consolidated Financial Statements
FOR THE YEAR ENDED 31 DECEMBER 2017
DANAKALI LIMITED ABN 56 097 904 302
42
Reference Title Summary Application date
of standard* for Group
instruments). The core principle of AASB 15 is that an entity recognises revenue to depict the transfer of promised goods or services to customers in an amount that reflects the consideration to which the entity expects to be entitled in exchange for those goods or services. An entity recognises revenue in accordance with that core principle by applying the following steps:
a) Step 1: Identify the contract(s) with a customer
b) Step 2: Identify the performance obligations in the contract
c) Step 3: Determine the transaction price
d) Step 4: Allocate the transaction price to the performance obligations in the contract
e) Step 5: Recognise revenue when (or as) the entity satisfies a performance obligation
AASB 2015-8 amended the AASB 15 effective date so it is now effective for annual reporting periods commencing on or after 1 January 2018. Early application is permitted. AASB 2014-5 incorporates the consequential amendments to a number Australian Accounting Standards (including Interpretations) arising from the issuance of AASB 15. AASB 2016-3 Amendments to Australian Accounting Standards – Clarifications to AASB 15 amends AASB 15 to clarify the requirements on identifying performance obligations, principal versus agent considerations and the timing of recognising revenue from granting a licence and provides further practical expedients on transition to AASB 15.
AASB 2014-10
Amendments to Australian Accounting Standards – Sale or Contribution of Assets between an Investor and its Associate or Joint Venture
The amendments clarify that a full gain or loss is recognised when a transfer to an associate or joint venture involves a business as defined in AASB 3 Business Combinations. Any gain or loss resulting from the sale or contribution of assets that does not constitute a business, however, is recognised only to the extent of unrelated investors’ interests in the associate or joint venture.
AASB 2015-10 deferred the mandatory effective date (application date) of AASB 2014-10 so that the amendments were required to be applied for annual reporting periods beginning on or after 1 January 2018 instead of 1 January 2016. AASB 2017-5 further defers the effective date of the amendments made in AASB 2014-10 to periods beginning on or after 1 January 2022.
1 January 2022
1 January 2022
AASB 16
Leases The key features of AASB 16 are as follows:
Lessee accounting
• Lessees are required to recognise assets and liabilities for all leases with a term of more than 12 months, unless the underlying asset is of low value.
• Assets and liabilities arising from a lease are initially measured on a present value basis. The measurement includes non-cancellable lease payments (including inflation-linked payments), and also includes payments to be made in optional periods if the lessee is reasonably certain to exercise an option to extend the lease, or not to exercise an option to terminate the lease.
• AASB 16 contains disclosure requirements for lessees.
Lessor accounting
• AASB 16 substantially carries forward the lessor accounting requirements in AASB 117.
1 January 2019
1 January 2019
For
per
sona
l use
onl
y

Notes to the Consolidated Financial Statements
FOR THE YEAR ENDED 31 DECEMBER 2017
DANAKALI LIMITED ABN 56 097 904 302
43
Reference Title Summary Application date
of standard* for Group
Accordingly, a lessor continues to classify its leases as operating leases or finance leases, and to account for those two types of leases differently.
• AASB 16 also requires enhanced disclosures to be provided by lessors that will improve information disclosed about a lessor’s risk exposure, particularly to residual value risk.
AASB 16 supersedes:
a) AASB 117 Leases
b) Interpretation 4 Determining whether an Arrangement contains a Lease
c) SIC-15 Operating Leases—Incentives
d) SIC-27 Evaluating the Substance of Transactions Involving the Legal Form of a Lease
The new standard will be effective for annual periods beginning on or after 1 January 2019. Early application is permitted, provided the new revenue standard, AASB 15 Revenue from Contracts with Customers, has been applied, or is applied at the same date as AASB 16.
AASB 2016-5
Amendments to Australian Accounting Standards – Classification and Measurement of Share-based Payment Transactions
This standard amends AASB 2 Share-based Payment, clarifying how to account for certain types of share-based payment transactions. The amendments provide requirements on the accounting for:
• The effects of vesting and non-vesting conditions on the measurement of cash-settled share-based payments
• Share-based payment transactions with a net settlement feature for withholding tax obligations
• A modification to the terms and conditions of a share-based payment that changes the classification of the transaction from cash-settled to equity-settled
1 January 2018
1 January 2018
AASB Interpretation
22
Foreign Currency Transactions and Advance Consideration
The Interpretation clarifies that in determining the spot exchange rate to use on initial recognition of the related asset, expense or income (or part of it) on the derecognition of a non-monetary asset or non-monetary liability relating to advance consideration, the date of the transaction is the date on which an entity initially recognises the non-monetary asset or non-monetary liability arising from the advance consideration. If there are multiple payments or receipts in advance, then the entity must determine a date of the transaction for each payment or receipt of advance consideration.
1 January 2018 1 January 2018
AASB Interpretation
23, and relevant
amending standards
Uncertainty over Income Tax Treatments
The Interpretation clarifies the application of the recognition and measurement criteria in AASB 112 Income Taxes when there is uncertainty over income tax treatments. The Interpretation specifically addresses the following:
• Whether an entity considers uncertain tax treatments separately
• The assumptions an entity makes about the examination of tax treatments by taxation authorities
• How an entity determines taxable profit (tax loss), tax bases, unused tax losses, unused tax credits and tax rates
• How an entity considers changes in facts and circumstances.
1 January 2019
1 January 2019
For
per
sona
l use
onl
y

Notes to the Consolidated Financial Statements
FOR THE YEAR ENDED 31 DECEMBER 2017
DANAKALI LIMITED ABN 56 097 904 302
44
Reference Title Summary Application date
of standard* for Group
AASB 2017-7 Amendments to Australian Accounting Standards – Long-term Interests in Associates and Joint Ventures
This Standard amends AASB 128 Investments in Associates and Joint Ventures to clarify that an entity is required to account for long-term interests in an associate or joint venture, which in substance form part of the net investment in the associate or joint venture but to which the equity method is not applied, using AASB 9 Financial Instruments before applying the loss allocation and impairment requirements in AASB 128.
1 January 2019 1 January 2019
Not yet issued by the AASB
Annual Improvements to IFRS Standards 2015-2017 Cycle
The amendments clarify certain requirements in:
• IFRS 3 Business Combinations and IFRS 11 Joint Arrangements - previously held interest in a joint operation
• IAS 12 Income Taxes - income tax consequences of payments on financial instruments classified as equity
• IAS 23 Borrowing Costs - borrowing costs eligible for capitalisation.
1 January 2019 1 January 2019
3. SEGMENT INFORMATION
The Group operates in the mining industry in Eritrea. For management purposes, the Group is organised into one main operating segment which involves the exploration of minerals in Eritrea. All of the Group’s activities are interrelated and discrete financial information is reported to the Board (Chief Operating Decision Maker) as a single segment.
Accordingly, all significant operating decisions are based upon analysis of the Group as one segment. The financial results from this segment are equivalent to the financial statements of the Group as a whole.
The Group’s non-current assets are geographically located in Eritrea.
4. REVENUE
2017 $
2016 $
Interest 221,189 109,537
5. EXPENSES
2017 $
2016 $
Profit /(loss) before income tax includes the following specific expenses:
Lease payments relating to operating leases 144,152 116,691
Share based payment expense 988,573 1,290,347
Depreciation 3,588 10,131
Employee Benefits 1,535,460 1,181,957
6. CASH
2017 $
2016 $
Cash at bank and in hand 15,559,980 10,904,760
Cash at bank earns interest at floating rates based on daily bank deposit rates.
Short-term deposits are made for varying periods of between one day and three months depending on the immediate cash requirements of the Group and earn interest at the respective short-term deposit rates.
For
per
sona
l use
onl
y

Notes to the Consolidated Financial Statements
FOR THE YEAR ENDED 31 DECEMBER 2017
DANAKALI LIMITED ABN 56 097 904 302
45
7. INCOME TAX
2017 $
2016 $
(a) Income tax recognised in profit or loss
Current tax - -
Deferred tax - -
Total tax benefit/(expense) - -
(b) Reconciliation of income tax expense to prima facie tax payable
Loss before income tax expense (6,839,936) (4,925,558)
Prima facie tax benefit at the Australian tax rate of 27.5% (2016: 30%)
(1,880,982) (1,477,667)
Tax effect of amounts which are not deductible (taxable) in calculating taxable income:
Share-based payments 271,858 387,104
Share of net loss of equity accounted associate 1,405,548 210,133
Accretion relating to the unwinding of discount on joint venture loan (315,115) (466,478)
Movements in unrecognised temporary differences and tax effect of current year tax losses:
518,691 1,346,908
Income tax expense/(benefit) - -
(c) Deferred Income Tax
Deferred income tax at 31 December relates to the following:
Statement of Financial Position
Statement of Comprehensive Income
2017 $
2016 $
2017 $
2016 $
Deferred Tax Liabilities:
Interest receivable - (3,151) 3,151 (1,372)
Deferred Tax Assets:
Provision for employee entitlements 53,358 53,145 213 18,805
Accrued expenditure 12,309 6,600 5,709 600
s.40-880 expenditure 270,029 182,609 87,420 182,286
Revenue tax losses 4,248,669 4,660,393 (411,724) 699,581
Deferred tax assets not brought to account as realisation is not probable (4,584,365) (4,899,596)
315,231
(899,900)
- - - -
8. TRADE AND OTHER RECEIVABLES
2017 $
2016 $
Current
Net GST receivable 112,705 28,546
Accrued interest - 10,504
Other receivables 75 652
Other receivables 2,291 2,283
Security bonds 59,250 52,000
174,321 93,985
Non-Current
Loan to Colluli Mining Share Company 12,216,952 9,519,503
12,216,952 9,519,503
Danakali’s wholly owned subsidiary, STB Eritrea Pty Ltd, is presently funding the Colluli Mining Share Company (‘CMSC’) for the development of the Colluli Potash Project and 50% of the funding is represented in the form of a shareholder loan.
Repayment of this loan, as defined in the CMSC Shareholders Agreement, will be made preferentially from future operating cash flows. The shareholder loan is denominated in USD, non-interest bearing, unsecured and subordinate to any loans
For
per
sona
l use
onl
y
Notes to the Consolidated Financial Statements
FOR THE YEAR ENDED 31 DECEMBER 2017
DANAKALI LIMITED ABN 56 097 904 302
46
from third party secured lenders, under which CMSC may enter into in order to fund the Project Development Capital. For accounting purposes, the value of the loan has been discounted by applying an effective interest rate of 25%.
During the year ended 31 December 2017, the repayment profile of the receivable was updated to consider the results generated by the completion of the Front-End Engineering Design (“FEED”) on 29 January 2018 and timing of the completion of construction. This resulted in a loss on the re-measurement of the loan amounting to $216,909 (see note 10).
During the year ended 31 December 2016 the repayment profile of the receivable was updated to consider the results generated by the completion of the definitive feasibility study on 30 November 2015 and timing of the completion of construction. This resulted in a loss on the re-measurement of the loan amounting to $2,812,064 (see note 10).
The undiscounted underlying loan balance at 31 December 2017 is $27,176,517 (31 December 2016: $24,993,066).
9. PLANT AND EQUIPMENT
2017 $
2016 $
Plant and equipment
Gross carrying value – at cost 58,437 47,659
Accumulated depreciation (43,327) (39,739)
Net book amount 15,110 7,920
Plant and equipment
Opening net book amount 1 January 7,920 16,412
Additions 10,778 3,122
Disposals - (1,483)
Depreciation charge (3,588) (10,131)
Closing net book amount 31 December 15,110 7,920
10. INVESTMENT IN JOINT VENTURE
The Group has an interest in the following joint arrangement:
Equity Interest Carrying Value
Project Activities 2017
% 2016
%
2017
$
2016
$
Colluli Potash Mineral Exploration 50 50 13,811,946 13,502,312
The group acquired an interest in Colluli Mining Share Company (“CMSC”) at the date of its incorporation on 5 March 2014. This acquisition was in accordance with the Shareholders Agreement entered into with the Eritrean National Mining Corporation (“ENAMCO”) and executed in November 2013. CMSC was incorporated in Eritrea, in accordance with the Shareholders Agreement, to hold the Colluli project with Danakali and ENAMCO holding 50% of the equity each.
Under the terms of the Shareholders Agreement, at the date of incorporation of CMSC, consideration for the acquisition of shares in CMSC equated to half of the allowable historical exploration costs transferred to CMSC by STB Eritrea Pty Ltd, a wholly owned subsidiary of Danakali Limited. The balance of the allowable historic exploration costs transferred to CMSC are recoverable via a shareholder loan account (see note 8).
The Group’s 50% interest in CMSC is accounted for as a joint venture using the equity method. The following tables summarise the financial information of the Group’s investment in CMSC at 31 December 2017.
2017
$
2016
$
Reconciliation of movement in investments accounted for using the equity method:
Opening carrying amount at 1 January 13,502,312 12,064,742
Additional investment during the year 6,354,472 1,868,088
Share of net losses for the year (5,111,085) (700,443)
Other comprehensive income for the year (933,753) 269,925
Closing carrying amount at 31 December 13,811,946 13,502,312
For
per
sona
l use
onl
y
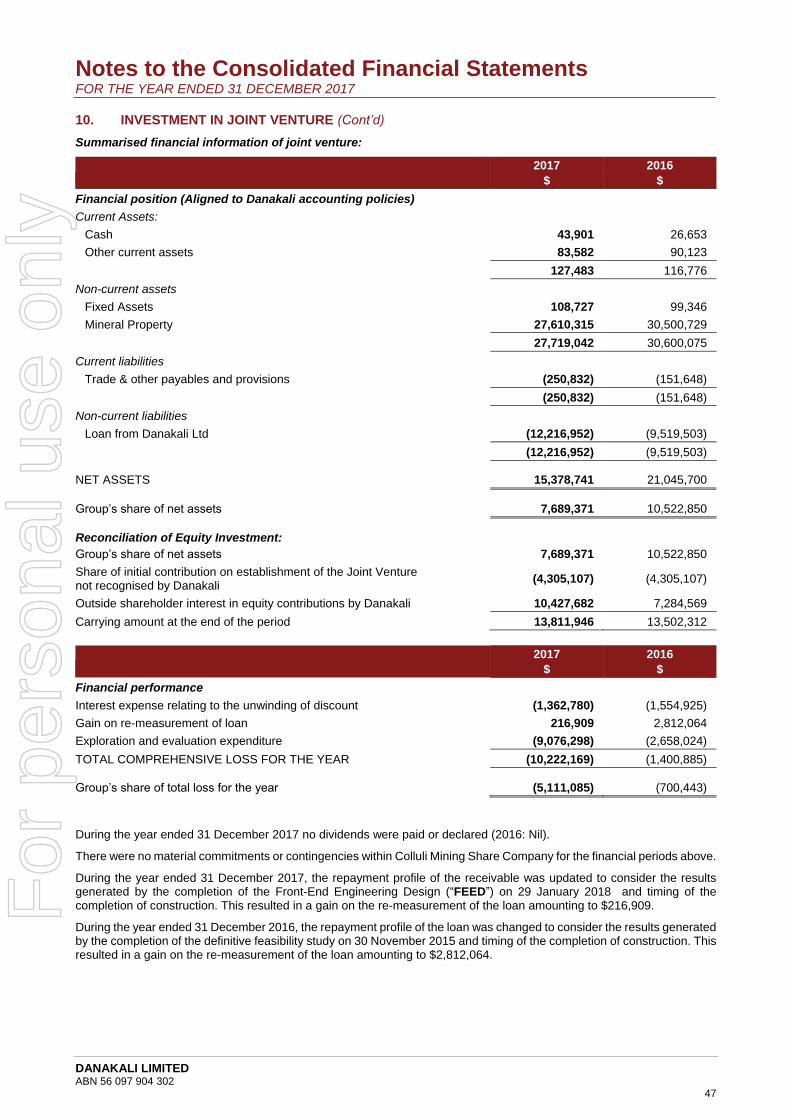
Notes to the Consolidated Financial Statements
FOR THE YEAR ENDED 31 DECEMBER 2017
DANAKALI LIMITED ABN 56 097 904 302
47
10. INVESTMENT IN JOINT VENTURE (Cont’d)
Summarised financial information of joint venture:
2017
$
2016
$
Financial position (Aligned to Danakali accounting policies)
Current Assets:
Cash 43,901 26,653
Other current assets 83,582 90,123
127,483 116,776
Non-current assets
Fixed Assets 108,727 99,346
Mineral Property 27,610,315 30,500,729
27,719,042 30,600,075
Current liabilities
Trade & other payables and provisions (250,832) (151,648)
(250,832) (151,648)
Non-current liabilities
Loan from Danakali Ltd (12,216,952) (9,519,503)
(12,216,952) (9,519,503)
NET ASSETS 15,378,741 21,045,700
Group’s share of net assets 7,689,371 10,522,850
Reconciliation of Equity Investment:
Group’s share of net assets 7,689,371 10,522,850
Share of initial contribution on establishment of the Joint Venture not recognised by Danakali
(4,305,107) (4,305,107)
Outside shareholder interest in equity contributions by Danakali 10,427,682 7,284,569
Carrying amount at the end of the period 13,811,946 13,502,312
2017
$
2016
$
Financial performance
Interest expense relating to the unwinding of discount (1,362,780) (1,554,925)
Gain on re-measurement of loan 216,909 2,812,064
Exploration and evaluation expenditure (9,076,298) (2,658,024)
TOTAL COMPREHENSIVE LOSS FOR THE YEAR (10,222,169) (1,400,885)
Group’s share of total loss for the year (5,111,085) (700,443)
During the year ended 31 December 2017 no dividends were paid or declared (2016: Nil).
There were no material commitments or contingencies within Colluli Mining Share Company for the financial periods above.
During the year ended 31 December 2017, the repayment profile of the receivable was updated to consider the results generated by the completion of the Front-End Engineering Design (“FEED”) on 29 January 2018 and timing of the completion of construction. This resulted in a gain on the re-measurement of the loan amounting to $216,909.
During the year ended 31 December 2016, the repayment profile of the loan was changed to consider the results generated by the completion of the definitive feasibility study on 30 November 2015 and timing of the completion of construction. This resulted in a gain on the re-measurement of the loan amounting to $2,812,064.
For
per
sona
l use
onl
y

Notes to the Consolidated Financial Statements
FOR THE YEAR ENDED 31 DECEMBER 2017
DANAKALI LIMITED ABN 56 097 904 302
48
11. TRADE AND OTHER PAYABLES
2017
$
2016
$
Trade payables 925,470 132,827
Accrued expenses 103,453 42,125
Other payables 68,164 35,790
1,097,087 210,742
12. PROVISIONS
2017
$
2016
$
Current
Employee entitlements 166,219 134,701
Non-Current
Employee entitlements 27,811 42,450
194,030 177,151
Employee entitlements relate to the balance of annual leave and long service leave accrued by the Group’s employees. Recognition and measurement criteria have been disclosed in note 2.
13. ISSUED CAPITAL
2017 2016
Number
of shares $
Number
of shares $
(a) Share capital
Ordinary shares fully paid 251,697,687 75,415,034 224,494,677 61,758,320
Total issued capital 251,697,687 75,415,034 224,494,677 61,758,320
(b) Movements in ordinary share capital
Balance at the beginning of the year 224,494,677 61,758,320 175,772,167 48,983,913
Issued during the year:
Issued at $0.220 per share - - 24,870,464 5,471,548
Issued at $0.278 per share on option exercise 4,600,000 1,278,800 400,000 111,200
Issued at $0.330 per share - - 20,200,000 6,666,000
Issued at $0.340 per share on option exercise - - 2,630,000 894,200
Issued at $0.350 per share on option exercise 1,356,365 474,728 622,046 217,716
Issued at $0.405 per share on option exercise 351,000 142,155 - -
Issued at $0.408 per share on option exercise 200,000 81,600 - -
Issued at $0.620 per share 19,920,645 12,350,800 - -
Costs of capital raised - (671,369) - (586,257)
Issued on vesting of performance rights 775,000 - - -
Balance at the end of the year 251,697,687 75,415,034 224,494,677 61,758,320
(c) Ordinary shares
Ordinary shares entitle the holder to participate in dividends and the proceeds on winding up of the Company in proportion to the number of and amounts paid on the shares held.
On a show of hands every holder of ordinary shares present at a meeting in person or by proxy, is entitled to one vote, and upon a poll each share is entitled to one vote.
Ordinary shares have no par value and the Company does not have a limited amount of authorised capital.
For
per
sona
l use
onl
y

Notes to the Consolidated Financial Statements
FOR THE YEAR ENDED 31 DECEMBER 2017
DANAKALI LIMITED ABN 56 097 904 302
49
13. ISSUED CAPITAL (Cont’d)
2017
Options
2016
Options
(d) Movements in options on issue
Balance at beginning of the year 25,213,186 16,350,000
Issued during the year:
Exercisable at $0.350, on or before 30 March 2018 - 11,635,232
Exercisable at $0.350, on or before 13 May 2018 - 800,000
Exercisable at $0.405, on or before 13 May 2018 - 2,700,000
Exercisable at $0.450, on or before 23 June 2018 - 200,000
Exercisable at $0.550, on or before 4 November 2018 - 750,000
Exercisable at $0.550, on or before 31 December 2018 - 1,000,000
Exercisable at $0.558, on or before 8 August 2019 - 1,000,000
Exercisable at $0.543, on or before 7 October 2018 - 800,000
Exercisable at $0.940, on or before 19 May 2020 1,440,000 -
Exercisable at $0.960, on or before 20 June 2019 400,000 -
Exercised, cancelled or expired during the year:
Expired, exercisable at $0.599, on or before 31 January 2016 - (700,000)
Expired, exercisable at $0.649, on or before 31 January 2016 - (1,000,000)
Expired, exercisable at $0.949, on or before 31 January 2016 - (1,300,000)
Exercised, exercisable at $0.278 on or before 17 November 2017 (4,600,000) (400,000)
Exercised, exercisable at $0.340 on or before 29 November 2016 - (2,630,000)
Expired, exercisable at $0.340, on or before 29 November 2016 - (3,370,000)
Exercised, exercisable at $0.350 on or before 30 March 2018 (1,356,365) (622,046)
Exercised, exercisable at $0.350 on or before 13 May 2018 (351,000) -
Exercised, exercisable at $0.408 on or before 4 November 2018 (200,000) -
Cancelled, exercisable at $0.408 on or before 4 November 2018 (800,000) -
Cancelled, exercisable at $0.543 on or before 7 October 2019 (550,000) -
Balance at end of the year 19,195,821 25,213,186
14. RESERVES
2017
$
2016
$
(a) Reserves
Share-based payments reserve
Balance at beginning of the year 10,427,536 9,137,189
Employee and contractor share options and performance rights (note 22) 988,573 1,290,347
Balance at end of the year 11,416,109 10,427,536
Foreign currency translation reserve
Balance at beginning of the year 2,039,243 1,769,318
Currency translation differences arising during the year/ period (933,753) 269,925
Balance at end of the year 1,105,490 2,039,243
Total reserves 12,521,599 12,466,779
(b) Nature and purpose of reserves
Share-based payments reserve The share-based payments reserve is used to recognise the fair value of share options and performance rights issued.
Foreign currency translation reserve The foreign currency translation reserve records the exchange differences arising on translation of a foreign joint arrangement.
For
per
sona
l use
onl
y
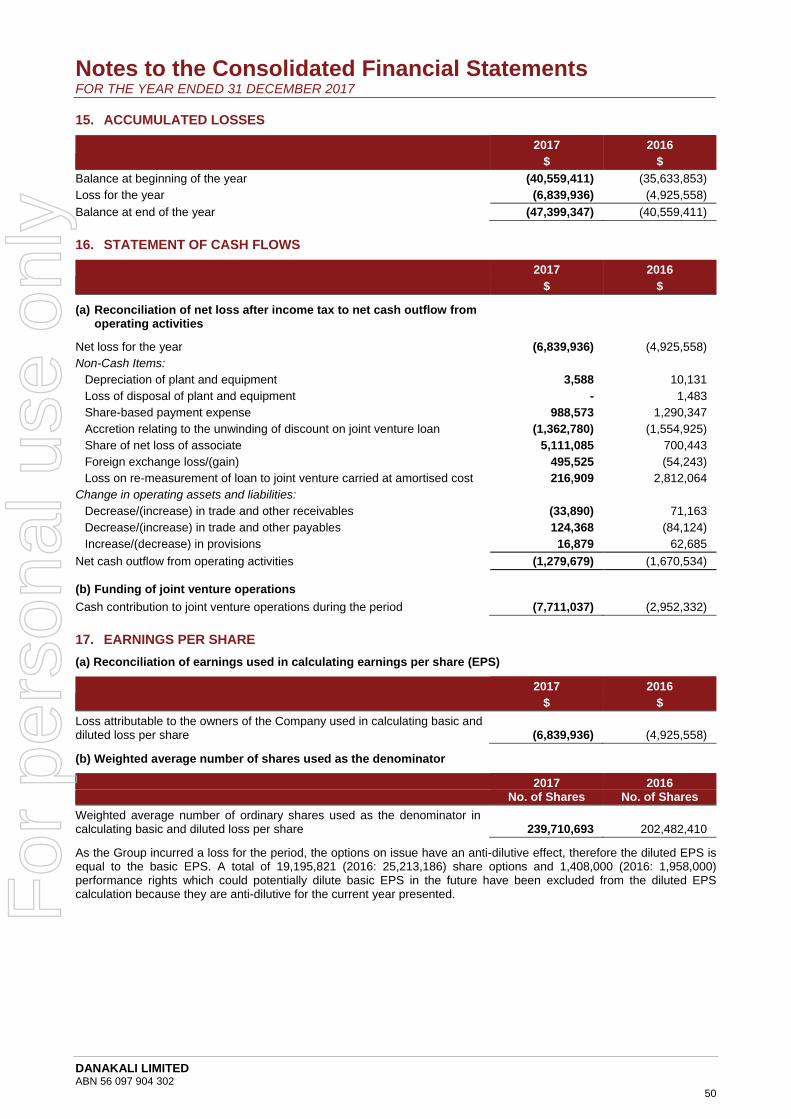
Notes to the Consolidated Financial Statements
FOR THE YEAR ENDED 31 DECEMBER 2017
DANAKALI LIMITED ABN 56 097 904 302
50
15. ACCUMULATED LOSSES
2017
$
2016
$
Balance at beginning of the year (40,559,411) (35,633,853)
Loss for the year (6,839,936) (4,925,558)
Balance at end of the year (47,399,347) (40,559,411)
16. STATEMENT OF CASH FLOWS
2017
$
2016
$
(a) Reconciliation of net loss after income tax to net cash outflow from operating activities
Net loss for the year (6,839,936) (4,925,558)
Non-Cash Items:
Depreciation of plant and equipment 3,588 10,131
Loss of disposal of plant and equipment - 1,483
Share-based payment expense 988,573 1,290,347
Accretion relating to the unwinding of discount on joint venture loan (1,362,780) (1,554,925)
Share of net loss of associate 5,111,085 700,443
Foreign exchange loss/(gain) 495,525 (54,243)
Loss on re-measurement of loan to joint venture carried at amortised cost 216,909 2,812,064
Change in operating assets and liabilities:
Decrease/(increase) in trade and other receivables (33,890) 71,163
Decrease/(increase) in trade and other payables 124,368 (84,124)
Increase/(decrease) in provisions 16,879 62,685
Net cash outflow from operating activities (1,279,679) (1,670,534)
(b) Funding of joint venture operations
Cash contribution to joint venture operations during the period (7,711,037) (2,952,332)
17. EARNINGS PER SHARE
(a) Reconciliation of earnings used in calculating earnings per share (EPS)
2017
$
2016
$
Loss attributable to the owners of the Company used in calculating basic and diluted loss per share (6,839,936) (4,925,558)
(b) Weighted average number of shares used as the denominator
2017 2016
No. of Shares No. of Shares
Weighted average number of ordinary shares used as the denominator in calculating basic and diluted loss per share 239,710,693 202,482,410
As the Group incurred a loss for the period, the options on issue have an anti-dilutive effect, therefore the diluted EPS is equal to the basic EPS. A total of 19,195,821 (2016: 25,213,186) share options and 1,408,000 (2016: 1,958,000) performance rights which could potentially dilute basic EPS in the future have been excluded from the diluted EPS calculation because they are anti-dilutive for the current year presented.
For
per
sona
l use
onl
y

Notes to the Consolidated Financial Statements
FOR THE YEAR ENDED 31 DECEMBER 2017
DANAKALI LIMITED ABN 56 097 904 302
51
18. FINANCIAL RISK MANAGEMENT
The Group’s activities expose it to market, liquidity and credit risks arising from its financial instruments.
The Group’s management of financial risk is aimed at ensuring net cash flows are sufficient to meet all of its financial commitments and maintain the capacity to fund the Colluli project and ancillary exploration activities. The Board of Directors has overall responsibility for the establishment and oversight of the risk management framework. Management monitors and manages the financial risks relating to the operations of the Group through regular reviews of risks.
Market (including foreign exchange and interest rate risks), liquidity and credit risks arise in the normal course of business. These risks are managed under Board approved treasury processes and transactions.
The principal financial instruments as at reporting date include cash, receivables and payables.
This note presents information about exposures to the above risks, the objectives, policies and processes for measuring and managing risk, and the management of capital.
(a) Market risk
(i) Foreign exchange risk
Foreign exchange risk arises from future commercial transactions and recognised assets and liabilities denominated in a currency that is not the entity’s functional currency and net investments in foreign operations. The Group has not formalised a foreign currency risk management policy however, it monitors its foreign currency expenditure in light of exchange rate movements. The international operations are at the start-up stage and there is limited exposure at the reporting date to assets and liabilities denominated in foreign currencies. The loan of $12,216,952 (2016: $9,519,503) to Colluli Mining Share Company is denominated in Eritrean Nakfa (Nakfa) which is pegged to the US Dollar.
The following table demonstrates the sensitivity to a reasonably possible change in Nakfa exchange rates, with all other variables held constant. A strengthening of the Australian Dollar rate results in an increased loss before tax. The Group’s exposure to foreign currency changes for all other currencies is not material.
Change in Nakfa Rate
%
Effect on Loss before tax
$
Year to 31 December 2017 +5% (610,848)
-5% 610,848
Year to 31 December 2016 +5% (475,975)
-5% 475,975
(ii) Interest rate risk
The Group is exposed to movements in market interest rates on cash. The Group’s policy is to monitor the interest rate yield curve out to six months to ensure a balance is maintained between the liquidity of cash assets and the interest rate return. The entire balance of cash for the Group of $15,559,980 (31 December 2016: $10,904,760) is subject to interest rate risk. The floating interest rates fluctuate during the period depending on current working capital requirements. The weighted average interest rate received on cash by the Group was 1.51% (31 December 2016: 1.10%).
Sensitivity analysis
At 31 December 2017, if interest rates had changed by -/+ 80 basis points from the weighted average rate for the period with all other variables held constant, post-tax loss for the Group would have been $117,048 higher/lower (31 December 2016: $87,238 higher/lower) as a result of lower/higher interest income from cash and cash equivalents.
(b) Liquidity risk
The Group manages liquidity risk by continuously monitoring forecast and actual cash flows and ensuring sufficient cash and marketable securities are available to meet the current and future commitments of the Group. Due to the nature of the Group’s activities, being mineral exploration, the Group does not have ready access to credit facilities, with the primary source of funding being equity raisings.
The Board of Directors constantly monitors the state of equity markets in conjunction with the Group’s current and future funding requirements, with a view to initiating appropriate capital raisings as required.
The financial liabilities of the Group are confined to trade and other payables as disclosed in the Consolidated Statement of Financial Position. All trade and other payables are non-interest bearing and due within 12 months of the reporting date.
(c) Credit risk
The Group’s significant concentration of credit risk is cash. The maximum exposure to credit risk at balance date is the carrying amount of cash and trade and other receivables as disclosed in the Consolidated Statement of Financial Position and Notes to the Consolidated Financial Statements.
For
per
sona
l use
onl
y
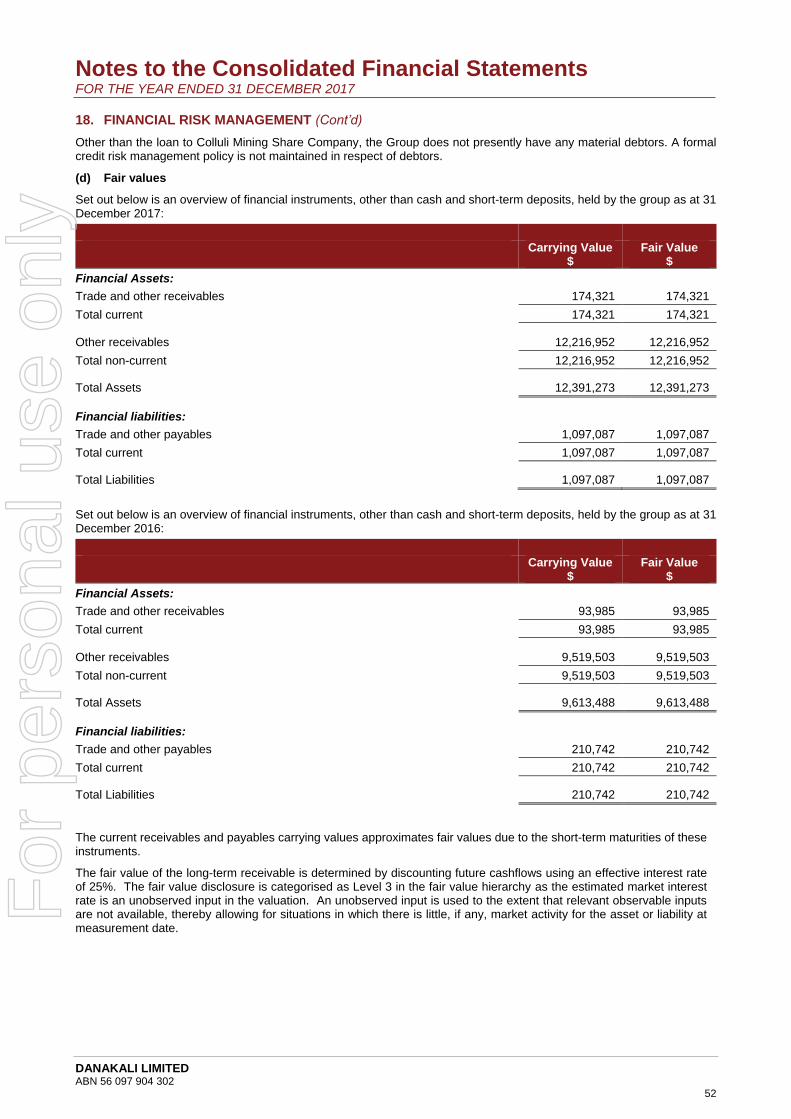
Notes to the Consolidated Financial Statements
FOR THE YEAR ENDED 31 DECEMBER 2017
DANAKALI LIMITED ABN 56 097 904 302
52
18. FINANCIAL RISK MANAGEMENT (Cont’d)
Other than the loan to Colluli Mining Share Company, the Group does not presently have any material debtors. A formal credit risk management policy is not maintained in respect of debtors.
(d) Fair values
Set out below is an overview of financial instruments, other than cash and short-term deposits, held by the group as at 31 December 2017:
Carrying Value $
Fair Value $
Financial Assets:
Trade and other receivables 174,321 174,321
Total current 174,321 174,321
Other receivables 12,216,952 12,216,952
Total non-current 12,216,952 12,216,952
Total Assets 12,391,273 12,391,273
Financial liabilities:
Trade and other payables 1,097,087 1,097,087
Total current 1,097,087 1,097,087
Total Liabilities 1,097,087 1,097,087
Set out below is an overview of financial instruments, other than cash and short-term deposits, held by the group as at 31 December 2016:
Carrying Value $
Fair Value $
Financial Assets:
Trade and other receivables 93,985 93,985
Total current 93,985 93,985
Other receivables 9,519,503 9,519,503
Total non-current 9,519,503 9,519,503
Total Assets 9,613,488 9,613,488
Financial liabilities:
Trade and other payables 210,742 210,742
Total current 210,742 210,742
Total Liabilities 210,742 210,742
The current receivables and payables carrying values approximates fair values due to the short-term maturities of these instruments.
The fair value of the long-term receivable is determined by discounting future cashflows using an effective interest rate of 25%. The fair value disclosure is categorised as Level 3 in the fair value hierarchy as the estimated market interest rate is an unobserved input in the valuation. An unobserved input is used to the extent that relevant observable inputs are not available, thereby allowing for situations in which there is little, if any, market activity for the asset or liability at measurement date.
For
per
sona
l use
onl
y

Notes to the Consolidated Financial Statements
FOR THE YEAR ENDED 31 DECEMBER 2017
DANAKALI LIMITED ABN 56 097 904 302
53
19. CAPITAL MANAGEMENT
The Group’s objectives when managing capital are to safeguard its ability to continue as a going concern, so that it may continue to provide returns for shareholders and benefits for other stakeholders.
Capital managed by the Board includes Shareholder equity, which was $40,537,286 (2016: $33,665,688). The focus of the Group’s capital risk management is the current working capital position against the requirements of the Group to meet exploration and project development programmes plus corporate overheads. The Group’s strategy is to ensure appropriate liquidity is maintained to meet anticipated operating requirements, with a view to initiating appropriate capital raisings as required.
20. CONTINGENCIES
There are no material contingent liabilities or contingent assets of the Group at balance date.
21. COMMITMENTS
2017
$
2016
$
Lease commitments: Group as lessee
Operating leases (non-cancellable):
Minimum lease payments
- within one year 70,000 47,885
- later than one year but not later than five years 11,667 -
Aggregate lease expenditure contracted for at reporting date but not recognised as liabilities
81,667 47,885
Technical services commitment:
Minimum payment
- within one year - 1,214,793
- later than one year but not later than five years - -
- 1,214,793
Total Commitments 81,667 1,262,678
Operating Leases:
The minimum future payments above relate to non-cancellable operating leases for offices. On 18 January 2018, the Company extended the office lease by 12 months commencing on 1 March 2018 for a total annual cost of $70,000.
Technical Services Commitment:
The payments above related to a contract for technical services to be provided in relation to the Colluli Project.
22. SHARE-BASED PAYMENTS
(a) Option Plans
The Group provides benefits to employees (including directors), contractors and consultants of the Group in the form of share-based payment transactions, whereby employees, contractors and consultants render services in exchange for options to acquire ordinary shares. All options issued have exercise prices ranging from $0.35 each to $0.96 each and expiry dates ranging from 30 March 2018 to 19 May 2020.
Options granted carry no dividend or voting rights. When exercisable, each option is convertible into one ordinary share of the Company with full dividend and voting rights. Set out below is a summary of the options granted.
2017 2016
Number of options
Weighted average exercise price
Number of options
Weighted average exercise price
Outstanding at the beginning of the year 25,213,186 $0.384 16,350,000 $0.420
Granted 1,840,000(a) (b) $0.944 18,885,232 $0.397
Exercised (6,507,365) $0.304 (3,652,046) $0.335
Expired (1,350,000) $0.463 (6,370,000) $0.547
Outstanding at end of the year 19,195,821 $0.459 25,213,186 $0.384
Exercisable at end of the year 18,845,821 $0.547 22,613,186 $0.370
Note:
For
per
sona
l use
onl
y
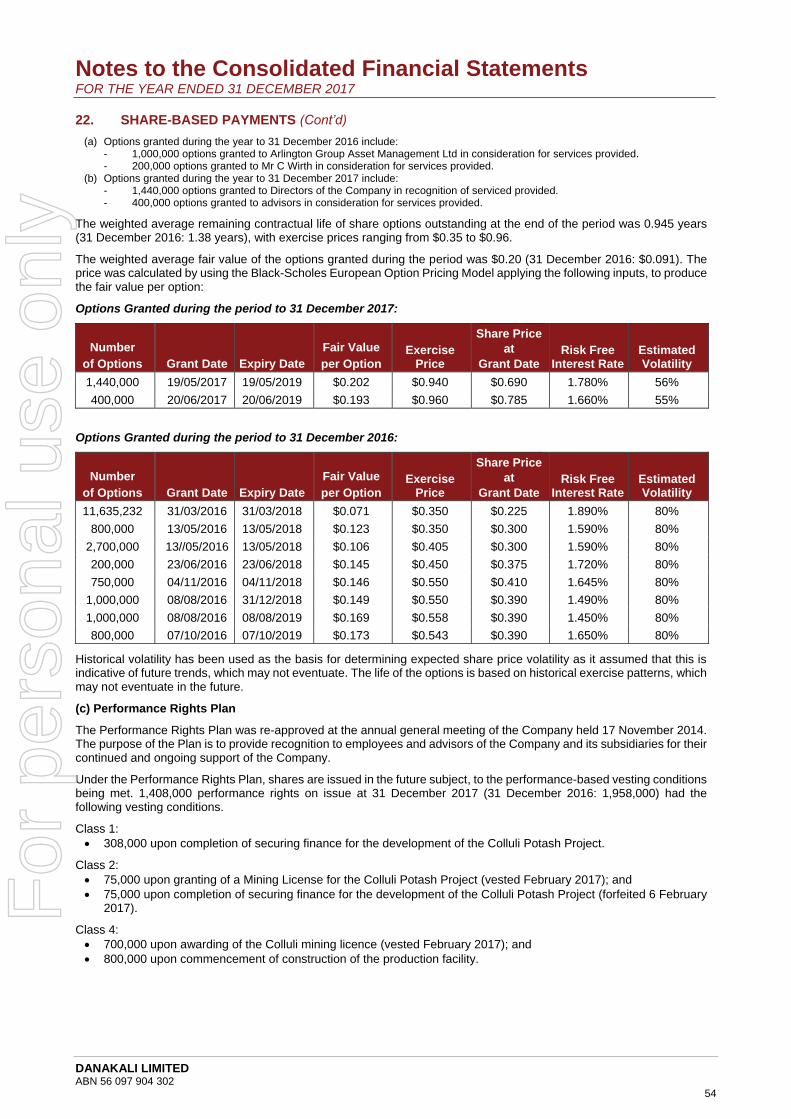
Notes to the Consolidated Financial Statements
FOR THE YEAR ENDED 31 DECEMBER 2017
DANAKALI LIMITED ABN 56 097 904 302
54
22. SHARE-BASED PAYMENTS (Cont’d)
(a) Options granted during the year to 31 December 2016 include: - 1,000,000 options granted to Arlington Group Asset Management Ltd in consideration for services provided. - 200,000 options granted to Mr C Wirth in consideration for services provided.
(b) Options granted during the year to 31 December 2017 include: - 1,440,000 options granted to Directors of the Company in recognition of serviced provided. - 400,000 options granted to advisors in consideration for services provided.
The weighted average remaining contractual life of share options outstanding at the end of the period was 0.945 years (31 December 2016: 1.38 years), with exercise prices ranging from $0.35 to $0.96.
The weighted average fair value of the options granted during the period was $0.20 (31 December 2016: $0.091). The price was calculated by using the Black-Scholes European Option Pricing Model applying the following inputs, to produce the fair value per option:
Options Granted during the period to 31 December 2017:
Number
of Options Grant Date Expiry Date
Fair Value
per Option Exercise
Price
Share Price
at
Grant Date Risk Free
Interest Rate Estimated Volatility
1,440,000 19/05/2017 19/05/2019 $0.202 $0.940 $0.690 1.780% 56%
400,000 20/06/2017 20/06/2019 $0.193 $0.960 $0.785 1.660% 55%
Options Granted during the period to 31 December 2016:
Number
of Options Grant Date Expiry Date
Fair Value
per Option Exercise
Price
Share Price
at
Grant Date Risk Free
Interest Rate Estimated Volatility
11,635,232 31/03/2016 31/03/2018 $0.071 $0.350 $0.225 1.890% 80%
800,000 13/05/2016 13/05/2018 $0.123 $0.350 $0.300 1.590% 80%
2,700,000 13//05/2016 13/05/2018 $0.106 $0.405 $0.300 1.590% 80%
200,000 23/06/2016 23/06/2018 $0.145 $0.450 $0.375 1.720% 80%
750,000 04/11/2016 04/11/2018 $0.146 $0.550 $0.410 1.645% 80%
1,000,000 08/08/2016 31/12/2018 $0.149 $0.550 $0.390 1.490% 80%
1,000,000 08/08/2016 08/08/2019 $0.169 $0.558 $0.390 1.450% 80%
800,000 07/10/2016 07/10/2019 $0.173 $0.543 $0.390 1.650% 80%
Historical volatility has been used as the basis for determining expected share price volatility as it assumed that this is indicative of future trends, which may not eventuate. The life of the options is based on historical exercise patterns, which may not eventuate in the future.
(c) Performance Rights Plan
The Performance Rights Plan was re-approved at the annual general meeting of the Company held 17 November 2014. The purpose of the Plan is to provide recognition to employees and advisors of the Company and its subsidiaries for their continued and ongoing support of the Company.
Under the Performance Rights Plan, shares are issued in the future subject, to the performance-based vesting conditions being met. 1,408,000 performance rights on issue at 31 December 2017 (31 December 2016: 1,958,000) had the following vesting conditions.
Class 1:
• 308,000 upon completion of securing finance for the development of the Colluli Potash Project.
Class 2:
• 75,000 upon granting of a Mining License for the Colluli Potash Project (vested February 2017); and
• 75,000 upon completion of securing finance for the development of the Colluli Potash Project (forfeited 6 February 2017).
Class 4:
• 700,000 upon awarding of the Colluli mining licence (vested February 2017); and
• 800,000 upon commencement of construction of the production facility.
For
per
sona
l use
onl
y

Notes to the Consolidated Financial Statements
FOR THE YEAR ENDED 31 DECEMBER 2017
DANAKALI LIMITED ABN 56 097 904 302
55
22. SHARE-BASED PAYMENTS (Cont’d)
Class 5:
• 20,000 upon commencement of the first development work on the ground at the Colluli site within 1 week of the scheduled development time;
• 60,000 upon 6-month construction mark if safety, costs and schedule are all on target; and
• 20,000 upon completion of commissioning and completion of performance testing (performance testing to meet contractual requirements).
Class 6:
• 10,000 upon successful completion of a dual listing of the Company on the London stock exchange;
• 15,000 upon Endeavour Financial being paid its first milestone success fee which is linked to a letter of finance support from a lending institution; and
• 25,000 upon term sheets being signed for the project financing of the Colluli project. Class 7:
• 10,000 upon market announcement of a binding offtake agreement to support debt funding of the project;
• 10,000 upon market announcement on completion of FEED;
• 15,000 upon completion of a strategic investment at greater than 30-day VWAP plus 10%; and
• 15,000 on signing a debt terms sheet for project financing or debt is secured form a strategic investor.
Class 8:
• 20,000 on completion of a London stock exchange listing;
• 5,000 on completion of an approval and issued CSR report befitting an ASX200 company prior to the London listing;
• 50,000 on securing a strategic equity partner;
• 5,000 on completion of executing of two high quality investor roadshows;
• 10,000 on finalising broker mandates which support the equity capital market strategy; and
• 10,000 upon execution of a high-quality FEED communication strategy.
Subject to achievement of either one of these performance conditions, one share will be issued for each Performance Right that has vested.
The fair value of performance rights is initially determined by consideration of the Company’s share price at the grant date.
There were 300,000 performance rights issued during the year to 31 December 2017 (31 December 2016: Nil). Details of performance rights on issue are set out in the following tables.
2017 Balance at 1 January 2017
Issued during the period
Vested and converted to
shares
Cancelled upon termination
Balance 31 December 2017
Grant Date
25 January 2012 (Class 1) 50,000 - - - 50,000
15 May 2012 (Class 1) 258,000 - - - 258,000
12 December 2012 (Class 2) 150,000 - (75,000) (75,000) -
9 December 2014 (Class 4) 1,500,000 - (700,000) 800,000
20 June 2017 (Class 5) - 100,000 - - 100,000
20 June 2017 (Class 6) - 50,000 - - 50,000
15 November 2017 (Class 7) - 50,000 - - 50,000
15 November 2017 (Class 8) - 100,000 - - 100,000
TOTAL 1,958,000 300,000 (775,000) (75,000) 1,408,000
2016 Balance at 1 January 2016
Issued during the period
Vested and converted to
shares
Cancelled upon termination
Balance 31 December 2016
Grant Date
25 January 2012 (Class 1) 50,000 - - - 50,000
15 May 2012 (Class 1) 258,000 - - - 258,000
12 December 2012 (Class 2) 150,000 - - - 150,000
9 December 2014 (Class 4) 1,500,000 - - - 1,500,000
TOTAL 1,958,000 - - - 1,958,000
For
per
sona
l use
onl
y

Notes to the Consolidated Financial Statements
FOR THE YEAR ENDED 31 DECEMBER 2017
DANAKALI LIMITED ABN 56 097 904 302
56
22. SHARE-BASED PAYMENTS (Cont’d)
(d) Expenses arising from share-based payment transactions
Total expenses arising from share-based payment transactions recognised during the period were as follows:
2017
$
2016
$
Shares - -
Options and Performance Rights issued to directors, employees and contractors
988,573 1,290,347
988,573 1,290,347
23. RELATED PARTY TRANSACTIONS
(a) Parent entity
The ultimate parent entity within the Group is Danakali Limited.
(b) Subsidiary
Interests in the subsidiary is set out in note 25.
(c) Investment in Joint Venture
Transactions with Colluli Mining Share Company are set out in notes 8 and 10 of this report.
(d) Key management personnel compensation
2017
$
2016
$
Short-term benefits 1,232,171 986,020
Post-employment benefits 67,199 86,232
Share-based payments 768,027 830,623
2,067,397 1,902,875
There were no material related party transactions.
(d) Key management personnel placement participation
In the previous financial year, on 13 May 2016, subsequent to shareholder approval, related parties participated in a placement of ordinary shares at an issue price of $0.22 per share to raise $352,000. In addition, one free attaching unlisted option was issued for every two shares purchased under the placement. The unlisted options are exercisable at $0.35 on or before 13 May 2018.
Participation by related parties in the transaction detailed above, is set out in the following table.
Related Party Position Placement
Shares Free Attaching
Unlisted Options
Seamus Ian Cornelius Non-Executive Chairman 250,000 125,000
Paul Michael Donaldson Managing Director 100,000 50,000
Anthony William Kiernan Non-Executive Director 100,000 50,000
Liam Raymond Cornelius Non-Executive Director 1,000,000 500,000
John Daniel Fitzgerald Non-Executive Director 150,000 75,000
1,600,000 800,000
For
per
sona
l use
onl
y

Notes to the Consolidated Financial Statements
FOR THE YEAR ENDED 31 DECEMBER 2017
DANAKALI LIMITED ABN 56 097 904 302
57
24. REMUNERATION OF AUDITORS
During the period, the following fees were paid or payable for services provided by the auditor of the Company, its related practices and non-related audit firms:
2017
$
2016
$
(a) Audit services
Ernst and Young 41,391 33,621
41,391 33,621
(b) Non-audit services
Ernst and Young – since appointment as auditor 6,000 33,013
6,000 33,103
25. SUBSIDIARY
Interest in subsidiary
The consolidated financial statements incorporate the assets, liabilities and results of the following subsidiary in accordance with the accounting policy:
Name Principal Activities Country of
Incorporation Class of Shares
Equity Holding 2017 2016
% %
STB Eritrea Pty Ltd Investment in
Potash Exploration Australia Ordinary 100 100
The proportion of ownership interest is equal to the proportion of voting power held.
26. PARENT ENTITY INFORMATION
The following information relates to the parent entity, Danakali Limited. The information presented here has been prepared using accounting policies consistent with those presented in note 2.
2017 $
2016 $
Current assets 15,784,395 11,023,845
Non-current assets 26,044,008 23,029,735
Total assets 41,828,403 34,053,580
Current liabilities 1,263,306 345,443
Non-current liabilities 27,811 42,450
Total liabilities 1,291,117 387,893
Issued capital 75,415,034 61,758,320
Share-based payments reserve 11,416,109 10,427,536
Accumulated losses (46,293,858) (38,520,169)
Total equity 40,537,286 33,665,687
Loss for the year (7,773,689) (4,655,632)
Total Comprehensive loss for the year (7,773,689) (4,655,632)
27. DIVIDENDS
No dividends were paid during the financial period. No recommendation for payment of dividends has been made.
For
per
sona
l use
onl
y

Notes to the Consolidated Financial Statements
FOR THE YEAR ENDED 31 DECEMBER 2017
DANAKALI LIMITED ABN 56 097 904 302
58
28. EVENTS OCCURRING AFTER THE BALANCE DATE
On 29 January 2018, the Company announced the results of the front-end engineering design (FEED) phase for the Colluli Potash Project. On 31 January 2018 the Company released a presentation detailing the FEED results.
On 19 February 2018, the Company released an updated JORC-2012 Colluli Potassium Sulphate Ore Reserve.
Subsequent to balance date up to the reporting date, the Company issued the following fully paid ordinary shares:
▪ 400,000 shares on exercise of unlisted options at $0.405 each ▪ 775,000 shares on exercise of unlisted options at $0.35 each
Subsequent to balance date up to the reporting date, the Company issued 25,000 shares on the vesting of performance rights.
No other matters or circumstances have arisen since the end of the financial year which significantly affected or may significantly affect the operations of the Group, the results of those operations, or the state of affairs of the Group in future financial years.
For
per
sona
l use
onl
y

Directors’ Declaration
DANAKALI LIMITED ABN 56 097 904 302
59
In the Directors’ opinion:
(a) the financial statements and notes set out on pages 31 to 58 are in accordance with the Corporations Act 2001, including:
(i) complying with Accounting Standards, the Corporations Regulations 2001 and other mandatory professional reporting requirements; and
(ii) giving a true and fair view of the Group’s financial position as at 31 December 2017 and of its performance for the financial period ended on that date;
(a) there are reasonable grounds to believe that the Company will be able to pay its debts as and when they become due and payable; and
The directors have been given the declarations by the Chief Executive Officer and Chief Financial Officer required by section 295A of the Corporations Act 2001.
This declaration is made in accordance with a resolution of the directors.
Seamus Cornelius
CHAIRMAN
Perth, 22 March 2018
For
per
sona
l use
onl
y

A member firm of Ernst & Young Global Limited Liability limited by a scheme approved under Professional Standards Legislation
GB:EH:DANAKALI:030
Ernst & Young 11 Mounts Bay Road Perth WA 6000 Australia GPO Box M939 Perth WA 6843
Tel: +61 8 9429 2222 Fax: +61 8 9429 2436 ey.com/au
INDEPENDENT AUDITOR’S REPORT
To the Shareholders of Danakali Limited
Report on the audit of the financial report
Opinion
We have audited the financial report of Danakali Limited (the Company), including its subsidiaries (the Group), which comprises the consolidated statement of financial position as at 31 December 2017, the consolidated statement of profit or loss and other comprehensive income, the consolidated statement of changes in equity and the consolidated statement of cash flows for the year then ended, notes comprising a summary of significant accounting policies and other explanatory information and the Directors’ Declaration.
In our opinion:
the accompanying financial report of the Group is in accordance with the Corporations Act 2001, including:
(i) giving a true and fair view of the Group’s consolidated financial position as at 31 December 2017 and of its consolidated financial performance for the year ended on that date; and
(ii) complying with Australian Accounting Standards and the Corporations Regulations 2001.
Basis for opinion
We conducted our audit in accordance with Australian Auditing Standards. Our responsibilities under those standards are further described in the Auditor’s Responsibilities for the Audit of the Financial Report section of our report. We are independent of the Group in accordance with the Corporations Act 2001 and the ethical requirements of the Accounting Professional and Ethical Standards Board’s APES110 Code of Ethics for Professional Accountants (the Code) that are relevant to our audit of the financial report in Australia; and we have fulfilled our other ethical responsibilities in accordance with the Code.
We believe that the audit evidence we have obtained is sufficient and appropriate to provide a basis for our opinion.
Key audit matters
Key audit matters are those matters that, in our professional judgment, were of most significance in our audit of the financial report of the current year. These matters were addressed in the context of our audit of the financial report as a whole, and in forming our opinion thereon, but we do not provide a separate opinion on these matters. For the matter below, our description of how our audit addressed the matter is provided in that context.
For
per
sona
l use
onl
y

A member firm of Ernst & Young Global Limited Liability limited by a scheme approved under Professional Standards Legislation
GB:EH:DANAKALI:030
We have fulfilled the responsibilities described in the Auditor’s Responsibilities for the Audit of the Financial Report section of our report, including in relation to these matters. Accordingly, our audit included the performance of procedures designed to respond to our assessment of the risks of material misstatement of the financial statements. The results of our audit procedures, including the procedures performed to address the matter below, provide the basis for our audit opinion on the accompanying financial report.
Accounting for the Group’s interest in Colluli Mining Share Company (“CMSC”)
Why significant How our audit addressed the key audit matter
The group acquired an interest in Colluli Mining Share Company (“CMSC”) at the date of CMSC’s incorporation on 5 March 2014. This acquisition was in accordance with the Shareholders Agreement entered into with the Eritrean National Mining Corporation (“ENAMCO”) which was executed in November 2013. CMSC was incorporated in Eritrea, in accordance with the Shareholders’ Agreement, to hold the Colluli project, with Danakali and ENAMCO each holding 50% of the equity.
The group’s interest in CMSC is accounted for as a joint venture using the equity method and as a shareholder loan receivable. The accounting for the results of and investment in CMSC is significant to our audit due to the complexity involved in measuring both the investment as well as the shareholder loan receivable. Specifically key assumptions underpinning the measurement of these balances relate to the timing as to when the group considers CMSC will have generated free cashflows from the project to enable repayment of monies loaned to them and an appropriate discount rate to reflect the risk applicable to the timing and repayment of the shareholder loan.
Refer to note (1)(r)(ii) and notes 8 and 10 to the financial report for further detail explaining the key judgements underpinning the accounting discussed in the two preceding paragraphs.
At 31 December 2017, the Investment in CMSC amounted to $13.8 million (refer to Note 10 in the financial statements) and the receivable from CMSC amounted to $12.2 million (refer to Note 8 in the financial statements).
Our procedures included the following:
► We reviewed the applicable Shareholders’ Agreement and the group’s position paper which concluded that it is appropriate for Danakali’s investment in CMSC to be equity accounted.
► We assessed the group’s calculations supporting the measurement of the investment and the shareholder loan. This calculation included the discounting of the shareholder loan balance based on the group’s current best estimate of when the shareholder loan will be repaid.
► We involved our valuation specialists to assess the assumed discount rate having regard to factors such as the project and country risk.
► We assessed the group’s shareholder loan repayment assumptions having regard to the current status of the project and the group’s best estimates of the timeline to finance, develop, commission and produce free cashflow from the project to repay the shareholder loan.
► We assessed the arithmetical accuracy of the group’s calculations, including where applicable any foreign currency translations embedded in the measurement process.
► We performed appropriate audit procedures over the results of CMSC and confirmed that Danakali’s 50% interest in these results were accounted for on an equity basis in the financial statements of the group.
► We considered whether there were any impairment indicators to suggest that Danakali’s investment in and shareholder loan to CMSC may be impaired at balance date.
For
per
sona
l use
onl
y

A member firm of Ernst & Young Global Limited Liability limited by a scheme approved under Professional Standards Legislation
GB:EH:DANAKALI:030
Information other than the financial statements and auditor’s report
The Directors are responsible for the other information. The other information comprises the information in the Group’s Annual Report for the year ended 31 December 2017, but does not include the financial report and the auditor’s report thereon. We obtained the Directors’ report prior to the date of our auditor’s report. The commentary on the Potash Project Overview, Economic outcome of the FEED, Development approach, Ownership and financing structure is expected to be made available to us after the date of this auditor’s report.
Our opinion on the financial report does not cover the other information and we do not express any form of assurance conclusion thereon.
In connection with our audit of the financial report, our responsibility is to read the other information and, in doing so, consider whether the other information is materially inconsistent with the financial report or our knowledge obtained in the audit or otherwise appears to be materially misstated. If, based upon the work we have performed on the other information obtained prior to the date of the auditor’s report, we conclude that there is a material misstatement of this other information, we are required to report that fact. We have nothing to report in this regard.
Directors’ responsibilities for the financial report
The Directors of the Company are responsible for the preparation of the financial report that gives a true and fair view in accordance with Australian Accounting Standards and the Corporations Act 2001 and for such internal control as the Directors determine is necessary to enable the preparation of the financial report that gives a true and fair view and is free from material misstatement, whether due to fraud or error.
In preparing the financial report, the Directors are responsible for assessing the Group’s ability to continue as a going concern, disclosing, as applicable, matters related to going concern and using the going concern basis of accounting unless the Directors either intend to liquidate the Group or cease operations, or have no realistic alternative but to do so.
Auditor’s responsibilities for the audit of the financial report
Our objectives are to obtain reasonable assurance about whether the financial report as a whole is free from material misstatement, whether due to fraud or error, and to issue an auditor’s report that includes our opinion. Reasonable assurance is a high level of assurance, but is not a guarantee that an audit conducted in accordance with Australian Auditing Standards will always detect a material misstatement when it exists. Misstatements can arise from fraud or error and are considered material if, individually or in the aggregate, they could reasonably be expected to influence the economic decisions of users taken on the basis of this financial report.
For
per
sona
l use
onl
y

A member firm of Ernst & Young Global Limited Liability limited by a scheme approved under Professional Standards Legislation
GB:EH:DANAKALI:030
As part of an audit in accordance with Australian Auditing Standards, we exercise professional judgment and maintain professional scepticism throughout the audit. We also:
► Identify and assess the risks of material misstatement of the financial report, whether due to fraud or error, design and perform audit procedures responsive to those risks, and obtain audit evidence that is sufficient and appropriate to provide a basis for our opinion. The risk of not detecting a material misstatement resulting from fraud is higher than for one resulting from error, as fraud may involve collusion, forgery, intentional omissions, misrepresentations, or the override of internal control.
► Obtain an understanding of internal control relevant to the audit in order to design audit procedures that are appropriate in the circumstances, but not for the purpose of expressing an opinion on the effectiveness of the entity’s internal control.
► Evaluate the appropriateness of accounting policies used and the reasonableness of accounting estimates and related disclosures made by the Directors.
► Conclude on the appropriateness of the Directors’ use of the going concern basis of accounting in the preparation of the financial report. We also conclude, based on the audit evidence obtained, whether a material uncertainty exists related to events and conditions that may cast significant doubt on the entity’s ability to continue as a going concern. If we conclude that a material uncertainty exists, we are required to draw attention in the auditor’s report to the disclosures in the financial report about the material uncertainty or, if such disclosures are inadequate, to modify the opinion on the financial report. However, future events or conditions may cause an entity to cease to continue as a going concern.
► Evaluate the overall presentation, structure and content of the financial report, including the disclosures, and whether the consolidated financial statements represent the underlying transactions and events in a manner that achieves fair presentation.
► Obtain sufficient appropriate audit evidence regarding the financial information of the entities or business activities within the Group to express an opinion on the financial report. We are responsible for the direction, supervision and performance of the Group audit. We remain solely responsible for our audit opinion.
We communicate with the Directors regarding, among other matters, the planned scope and timing of the audit and significant audit findings, including any significant deficiencies in internal control that we identify during our audit.
We also provide the Directors with a statement that we have complied with relevant ethical requirements regarding independence, and to communicate with them all relationships and other matters that may reasonably be thought to bear on our independence, and where applicable, related safeguards.
From the matters communicated to the Directors, we determine those matters that were of most significance in the audit of the financial report of the current year and are therefore the key audit matters. We describe these matters in our auditor’s report unless law or regulation precludes public disclosure about the matter or when, in extremely rare circumstances, we determine that a matter should not be communicated in our report because the adverse consequences of doing so would reasonably be expected to outweigh the public interest benefits of such communication.
For
per
sona
l use
onl
y
A member firm of Ernst & Young Global Limited Liability limited by a scheme approved under Professional Standards Legislation
GB:EH:DANAKALI:030
Report on the Remuneration Report
Opinion on the Remuneration Report
We have audited the Remuneration Report included in pages 17 to 27 of the Directors' Report for the year ended 31 December 2017.
In our opinion, the Remuneration Report of Danakali Limited for the year ended 31 December 2017, complies with section 300A of the Corporations Act 2001.
Responsibilities
The Directors of the Company are responsible for the preparation and presentation of the Remuneration Report in accordance with section 300A of the Corporations Act 2001. Our responsibility is to express an opinion on the Remuneration Report, based on our audit conducted in accordance with Australian Auditing Standards. Ernst & Young Gavin Buckingham Partner Perth 22 March 2018
For
per
sona
l use
onl
y

ASX Additional Information
DANAKALI LIMITED ABN 56 097 904 302
65
Additional information required by Australian Securities Exchange Ltd and not shown elsewhere in this report is as follows.
The information is current as at 28 February 2018.
(a) Distribution of equity securities
Analysis of numbers of equity security holders by size of holding:
Holders Securities %
1 - 1,000 577 250,940 0.10%
1,001 - 5,000 841 2,160,111 0.85%
5,001 - 10,000 352 2,673,943 1.06%
10,001 - 100,000 680 22,104,461 8.74%
100,001 and over 169 225,683,232 89.25%
TOTAL 2,619 252,872,687 100.00%
The number of shareholders holding less than a marketable parcel was 421.
(b) Twenty largest shareholders
The names of the twenty largest holders of quoted ordinary shares are:
Listed ordinary shares
Number of shares Percentage of
ordinary shares
1 J P Morgan Nominees Australia Ltd 51,110,446 20.21
2 Pershing Australia Nominees Pty Ltd (Well Efficient Ltd) 30,000,000 11.86
3 HSBC Custody Nominees (Australia) Ltd 24,871,646 9.84
4 Liam Cornelius 14,422,041 5.70
5 Montezuma Mining Company Ltd 7,271,925 2.88
6 Citicorp Nominees Pty Ltd 6,960,435 2.75
7 Paul Hartley Watts 5,000,000 1.98
8 BNP Paribas Noms Pty Ltd 4,693,206 1.86
9 Seamus Cornelius 4,300,883 1.70
10 Alpha Boxer Limited 4,245,000 1.68
11 Merrill Lynch (Australia) Nominees Pty Ltd 4,182,304 1.65
12 Kongming Investments Ltd 4,178,992 1.65
13 Ranguta Ltd 3,395,685 1.34
14 Paul Donaldson 2,718,334 1.07
15 BNP Paribas Nominees Pty Ltd 2,541,905 1.01
16 John Joseph Wallace 2,470,983 0.98
17 Dongarra Ltd 2,234,398 0.88
18 Anthony Maslin + Marite Norris 2,010,000 0.79
19 National Nominees Ltd 1,997,989 0.79
20 Grandor Pty Ltd 1,964,917 0.78
180,571,089 71.41
(c) Substantial shareholders
The names of substantial shareholders who have notified the Company in accordance with section 671B of the Corporations Act 2001 are:
Number of Shares
Well Efficient Ltd 30,000,000 JP Morgan Asset Management (UK) 20,200,000 The Capital Group Companies, Inc. 16,700,000 Liam Cornelius 14,422,041
(d) Voting rights
All ordinary shares (whether fully paid or not) carry one vote per share without restriction. Holders of unlisted options and performance rights do not have voting rights.
For
per
sona
l use
onl
y

ASX Additional Information
DANAKALI LIMITED ABN 56 097 904 302
66
(e) Unquoted securities At 28 February 2018 the Company has on issue 18,020,821 unlisted options over ordinary shares and 1,408,000 performance rights.
The names of security holders holding more than 20% of an unlisted class of security are listed below.
Holder
Unlisted Options
$0.405 13/5/2018
Unlisted Options
$0.45 23/6/2018
Unlisted Options
$0.558 8/8/2019
Unlisted Options
$0.543 7/10/2019
Unlisted Options
$0.55 31/12/2018
Unlisted Options
$0.55 4/11/2018
Unlisted Options
$0.94 19/5/2020
Unlisted Options
$0.527 29/5/2018
Unlisted Options
$0.55 31/5/2018
Unlisted Options
$0.35 30/3/2018
Unlisted Options
$0.35 13/5/2018
Unlisted Options
$0.96 20/6/2019
Mr Liam Cornelius 400,000 - - - - - - - - - - -
Mr Seamus Cornelius 500,000 - - - - 750,000 300,000 - - - - -
Mr Paul Donaldson 500,000 - - - - - - - - - - -
Mr John Fitzgerald 400,000 - - - - - - 750,000 - - - -
Mr Christian Wirth - 200,000 - - - - - - - - - -
Mr Danny Goeman - - 1,000,000 - - - - - - - - -
Mr James Durrant - - - 250,000 - - - - - - - -
Arlington Group Asset Management Ltd
- - - - 1,000,000 - - - 600,000 - - -
Mr Robert Connochie - - - - - - 500,000 - - - - -
Mr Hanns Huster - - - - - - - - - - - 200,000
Mr Cedric Middleton - - - - - - - - - - - 200,000
Montezuma Mining Company Ltd
- - - - - - - - - 2,272,728 - -
Well Efficient Ltd - - - - - - - - - 5,000,000 - -
Duketon Consolidated Pty Ltd
- - - - - - - - - - 500,000 -
Holders individually less than 20%
149,000 - - - - - 640,000 - - 1,709,093 200,000 -
Total 1,949,000 200,000 1,000,000 250,000 1,000,000 750,000 1,440,000 750,000 600,000 8,981,821 700,000 400,000
For
per
sona
l use
onl
y

ASX Additional Information
DANAKALI LIMITED ABN 56 097 904 302
67
Holder
Performance Rights
Class 1
Performance Rights
Class 4
Performance Rights
Class 5
Performance Rights
Class 6
Performance Rights
Class 7
Performance Rights
Class 8
Mr Zeray Lake 75,000 - - - - -
Mascots International Ltd 85,000 - - - - -
Mr Paul Donaldson - 800,000 - - - -
Mr Tony Harrington - - 100,000 - - -
Mr Stuart Tarrant - - - 50,000 50,000 -
Redgate Beach Investments Pty Ltd - - - - - 100,000
Holders individually less than 20% 148,000 - - - - -
Total 308,000 800,000 100,000 50,000 50,000 100,000
(f) Schedule of Interests in Mining Tenements
Tenement: Colluli, Eritrea
License Type: Exploration License
Nature of Interest: Owned
Current Equity: 50%
For
per
sona
l use
onl
y


![From: Kevin Lewis [mailto:Kevin.Lewis@asx.com.au] … Kevin Lewis [mailto:Kevin.Lewis@asx.com.au] Sent: Tuesday, 6 February 2018 11:55 AM To: Gary Morgan Cc: Rick Holliday-Smith; Dominic](https://img.pdfslide.us/doc/110x75/5b00a7c47f8b9ad85d8cead6/from-kevin-lewis-mailtokevinlewisasxcomau-kevin-lewis-mailtokevinlewisasxcomau.jpg)