Embed Size (px)
Citation preview

Smartgroup Corporation Ltd
Half-year report
30 June 2015
ABN 48 126 266 831
For
per
sona
l use
onl
y
Contents
Market release 2
Appendix 4D 3
Review of operations 4
Directors' report 6
Auditor's independence declaration 7
Half-year report 8
Statement of profit or loss and other comprehensive income
Statement of financial position
Statement of changes in equity
Statement of cash flows
Notes to the financial statements 12
Note 1. Basis of preparation
Note 2. Dividends
Note 3. Operating segments
Note 4. Borrowings
Note 5. Equity - issued capital
Note 6. Earnings per share
Note 7. Events after the reporting period
Directors' declaration 15
Independent review report 16
Corporate directory 18
Smartgroup Corporation Ltd
1
For
per
sona
l use
onl
y
Market release
26 August 2015
ASX Market Announcements Office
ASX Limited
20 Bridge Street
Sydney, NSW, Australia, 2000
Smartgroup Corporation Ltd - Results for announcement to the market
In accordance with the Listing Rules, Smartgroup Corporation Ltd encloses for immediate release the following information:
1. Appendix 4D,
2. Review of operations, and
3. Smartgroup Corporation Ltd half-year report 2015.
Smartgroup Corporation Ltd will conduct an analyst briefing on the results at 9:30 am (Sydney time) on 27 August 2015.
Amanda Morgan
General Counsel and Company Secretary
Smartgroup Corporation Ltd
2
For
per
sona
l use
onl
y

Appendix 4D
$'000
Revenue from ordinary activities up 27.8% to $44,818
Profit from ordinary activities after tax attributable to the owners of Smartgroup Corporation Ltd up 282.0% to $9,146
Net profit for the period attributable to the owners of Smartgroup Corporation Ltd up 282.0% to $9,146
Franked
Amount per amount per Tax rate for
Dividend information share (cents) share (cents) franking credit
Final 2014 dividend per share (paid 31 March 2015) 6.1 6.1 30%
Interim 2015 dividend per share (to be paid 30 September 2015) 7.9 7.9 30%
The record date for determining entitlement to the interim dividend is 15 September 2015.
There is no dividend reinvestment plan in place.
Net tangible assets 30 June 2014
Net tangible assets per ordinary security, cents per share (54.93)
Independent auditors review
The half-year financial report for the half-year ended 30 June 2015 has been reviewed by PricewaterhouseCoopers and
there is no review dispute or qualification.
Statutory results for announcement to the market
30 June 2015
10.30
The net tangible assets per ordinary share is calculated based on 101,461,150 ordinary shares on issue as at 30 June 2015
(30 June 2014: 78,000,000 ordinary shares), which excludes the 2,236,974 shares issued under the 2015 long-term
incentive plan.
Smartgroup Corporation Ltd
3
For
per
sona
l use
onl
y
Review of operations
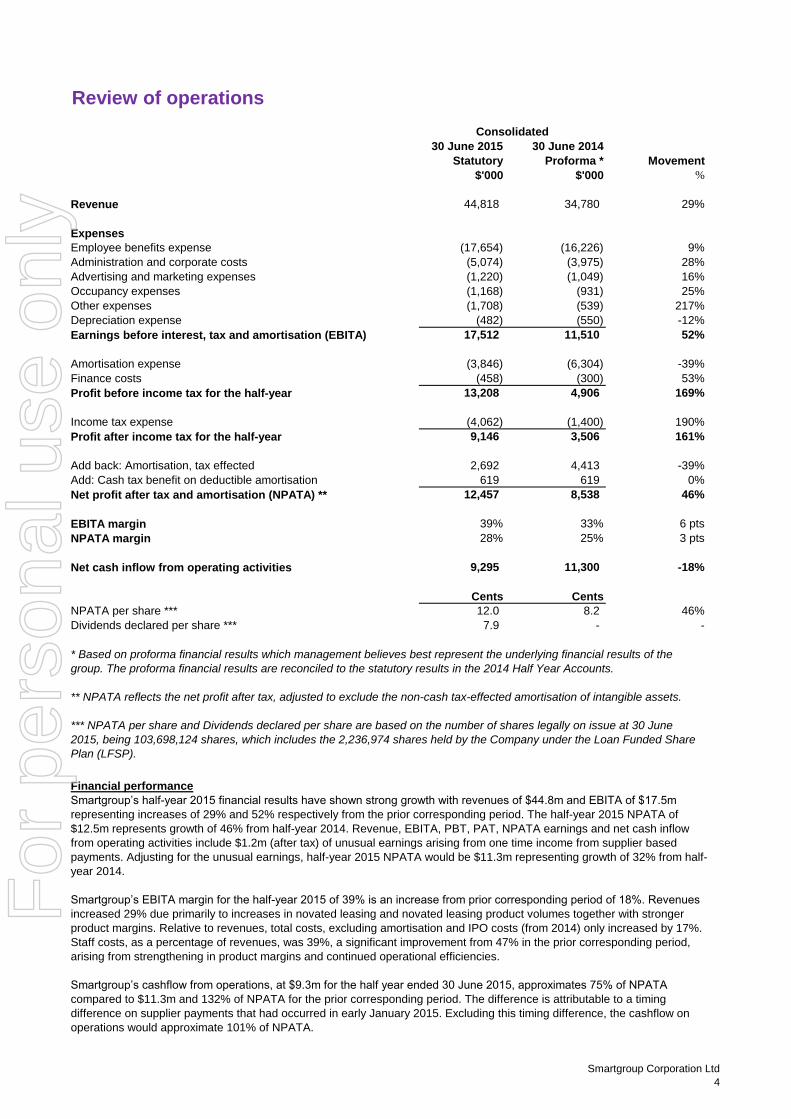
30 June 2015 30 June 2014
Statutory Proforma * Movement
$'000 $'000 %
44,818 34,780 29%
Employee benefits expense (17,654) (16,226) 9%
Administration and corporate costs (5,074) (3,975) 28%
Advertising and marketing expenses (1,220) (1,049) 16%
(1,168) (931) 25%
(1,708) (539) 217%
(482) (550) -12%
Earnings before interest, tax and amortisation (EBITA) 17,512 11,510 52%
(3,846) (6,304) -39%
(458) (300) 53%
Profit before income tax for the half-year 13,208 4,906 169%
(4,062) (1,400) 190%
Profit after income tax for the half-year 9,146 3,506 161%
Add back: Amortisation, tax effected 2,692 4,413 -39%
Add: Cash tax benefit on deductible amortisation 619 619 0%
Net profit after tax and amortisation (NPATA) ** 12,457 8,538 46%
EBITA margin 39% 33% 6 pts
NPATA margin 28% 25% 3 pts
Net cash inflow from operating activities 9,295 11,300 -18%
Cents Cents
NPATA per share *** 12.0 8.2 46%
Dividends declared per share *** 7.9 - -
Financial performance
Smartgroup’s half-year 2015 financial results have shown strong growth with revenues of $44.8m and EBITA of $17.5m
representing increases of 29% and 52% respectively from the prior corresponding period. The half-year 2015 NPATA of
$12.5m represents growth of 46% from half-year 2014. Revenue, EBITA, PBT, PAT, NPATA earnings and net cash inflow
from operating activities include $1.2m (after tax) of unusual earnings arising from one time income from supplier based
payments. Adjusting for the unusual earnings, half-year 2015 NPATA would be $11.3m representing growth of 32% from half-
year 2014.
Smartgroup’s EBITA margin for the half-year 2015 of 39% is an increase from prior corresponding period of 18%. Revenues
increased 29% due primarily to increases in novated leasing and novated leasing product volumes together with stronger
product margins. Relative to revenues, total costs, excluding amortisation and IPO costs (from 2014) only increased by 17%.
Staff costs, as a percentage of revenues, was 39%, a significant improvement from 47% in the prior corresponding period,
arising from strengthening in product margins and continued operational efficiencies.
Smartgroup’s cashflow from operations, at $9.3m for the half year ended 30 June 2015, approximates 75% of NPATA
compared to $11.3m and 132% of NPATA for the prior corresponding period. The difference is attributable to a timing
difference on supplier payments that had occurred in early January 2015. Excluding this timing difference, the cashflow on
operations would approximate 101% of NPATA.
* Based on proforma financial results which management believes best represent the underlying financial results of the
group. The proforma financial results are reconciled to the statutory results in the 2014 Half Year Accounts.
** NPATA reflects the net profit after tax, adjusted to exclude the non-cash tax-effected amortisation of intangible assets.
*** NPATA per share and Dividends declared per share are based on the number of shares legally on issue at 30 June
2015, being 103,698,124 shares, which includes the 2,236,974 shares held by the Company under the Loan Funded Share
Plan (LFSP).
Finance costs
Income tax expense
Revenue
Expenses
Depreciation expense
Amortisation expense
Occupancy expenses
Other expenses
Consolidated
Smartgroup Corporation Ltd
4
For
per
sona
l use
onl
y
Review of operations (cont'd)
Financial performance (cont'd)
Smartgroup’s balance sheet continues to strengthen. As at 30 June 2015, Smartgroup is in a debt free position with $9.1m of
cash at hand. This is an improvement of $3.2m from 31 December 2014 where Smartgroup had a net cash position of
$5.9m.
Smartgroup has declared an interim fully franked dividend of 7.9 cents per share. The record date is 15 September 2015 and
it will be paid on 30 September 2015. This compares to a nil dividend position for the prior corresponding period.
Customers
Smartgroup was pleased to announce in June 2015 that the Department of Defence has signed a new contract to continue
receiving salary packaging services exclusively from Smartgroup, effective from 1 July 2015. The term of the agreement,
including all possible extensions, runs until 30 June 2021. Defence is a large existing client for whom Smartgroup has
provided salary packaging services since 1999.
During the first half of 2015 Smartgroup completed the implementation of two significant salary packaging client contract
wins with Peter MacCallum Cancer Centre (c.1,900 packages) and NSW Health Pathology (c.2,700 packages). Further,
Smartgroup was added to the panel to provide salary packaging for CSIRO, an employer with c.5,000 eligible employees.
As at 30 June 2015, Smartgroup managed salary packages of 122,054 employee customers, an increase of 3,398
customers, representing growth of 3% from the year ended 31 December 2014. This growth from 31 December 2014 is
primarily attributable the new clients above which offsets the loss of Western Health with c.4,400 packages as they transition
to another provider from 1 April 2015. Organic package growth for the six months was c.3,100 packages.
Operations
Customer engagement
Smartgroup believes that the best proponent of its services comes from word-of-mouth customer referrals. As such,
Smartsalary introduced Net Promoter Score (NPS) in 2009 as a key metric to measure the quality of employee customer
engagement. NPS ranges from -100% to +100%. Smartsalary’s NPS score for the 12 months to 30 June 2015 was 45%, a
level attained by few organisations nationally.
Smartsalary was first accredited by the Customer Service Institute of Australia (CSIA) in 2008. It was the NSW State Winner
of the Australian Service Excellence Award (Medium Business Category) in 2011, 2012, 2013 and again in 2014 and was the
National Winner of the Australian Service Excellence Award (Medium Business Category) in 2012. Additionally, in 2014, our
Chief Operating Officer, Michael Ellies, was named the NSW Customer Service Executive of the Year. Smartsalary is
currently going through the accreditation process with the CSIA for 2015.
Employee engagement accreditation
People are at the foundation of our strategy and in 2013 and 2014 Smartsalary was one of only a handful of companies in
Australia and New Zealand to be accredited as an Aon Hewitt Best Employer. For 2015 our engagement score is 71%, which
puts us within the top quartile of engaged workplaces in the country and well inside the high engagement zone.
Unfortunately, we were not accredited as best employer for 2015 and we are focussing on the feedback received by our
team to improve on the areas of opportunity and increase levels of engagement. Simultaneously, we continue to drive the
positive aspect of our diverse and inclusive environment, our strong focus on customers, the collaborative workplace and the
strength of our brand’s reputation in the market.
Innovation and operational efficiencies
Smartgroup introduced innovation as a core capability in 2012. Smartsalary has since been recognised for the second year
running in the BRW list of Australia’s 50 Most Innovative Companies and is currently working towards implementing 100 staff
generated ideas for the calendar year.
In late 2014 Smartgroup launched its E-sign program aimed at reducing paperwork and delays in novated lease applications.
During 2015 we have seen more employer clients adopting the program, enabling our employee customers to submit
paperless online credit applications, complete with electronic signatures, which have reduced processing times by 75%.
A major driver of efficiency is the increasing uptake of online self-service by employee customers. Smartphone access
constitutes 30% of Smartsalary’s website traffic and is growing. In response, Smartgroup is finalising a major enhancement
of its www.smartsalary.com.au website to be mobile friendly. This development will ensure that employee customers have
full and easy access across all devices to their salary packaging accounts for new product sign-ups, benefit claims and
reporting.
Smartgroup Corporation Ltd
5
For
per
sona
l use
onl
y
Michael Carapiet (Chairman)
Deven Billimoria
John Prendiville
Gavin Bell
Andrew Bolam
Dr Ian Watt (appointed 1 July 2015)
Review of operations
Dividends
Rounding of amounts
26 August 2015, Sydney
The directors present their report, together with the financial statements, on the consolidated entity (referred to hereafter as
the 'Group') consisting of the Smartgroup Corporation Ltd (referred to hereafter as the 'Company' or 'parent entity') and the
entities it controlled for the half-year ended 30 June 2015.
DirectorsThe following persons were directors of Smartgroup Corporation Ltd for the half-year ended 30 June 2015 and up to the date
of this report, unless otherwise stated.
Principal activities
The profit after tax for the Group is $9,146,000 (30 June 2014: loss of $5,024,000). Refer to the Review of operations for
further commentary on the results.
The Company is of a kind referred to in Class Order 98/100, issued by the Australian Securities and Investments
Commission, relating to ‘rounding off’. Amounts in this report have been rounded off in accordance with that Class Order to
the nearest thousand dollars, or in certain cases, the nearest dollar.
This report is made in accordance with a resolution of directors.
On behalf of the directors,
Michael Carapiet
Directors' report
Chairman
During the half-year the principal activities of the Group consisted of salary packaging administration and fleet management
services.
On 26 August 2015, the directors declared a fully-franked dividend of 7.9 cents per ordinary share. The record date is 15
September 2015 and the dividend will be paid on 30 September 2015.
Smartgroup Corporation Ltd
6
For
per
sona
l use
onl
y
Auditor's independence declaration
Smartgroup Corporation Ltd
7
For
per
sona
l use
onl
y
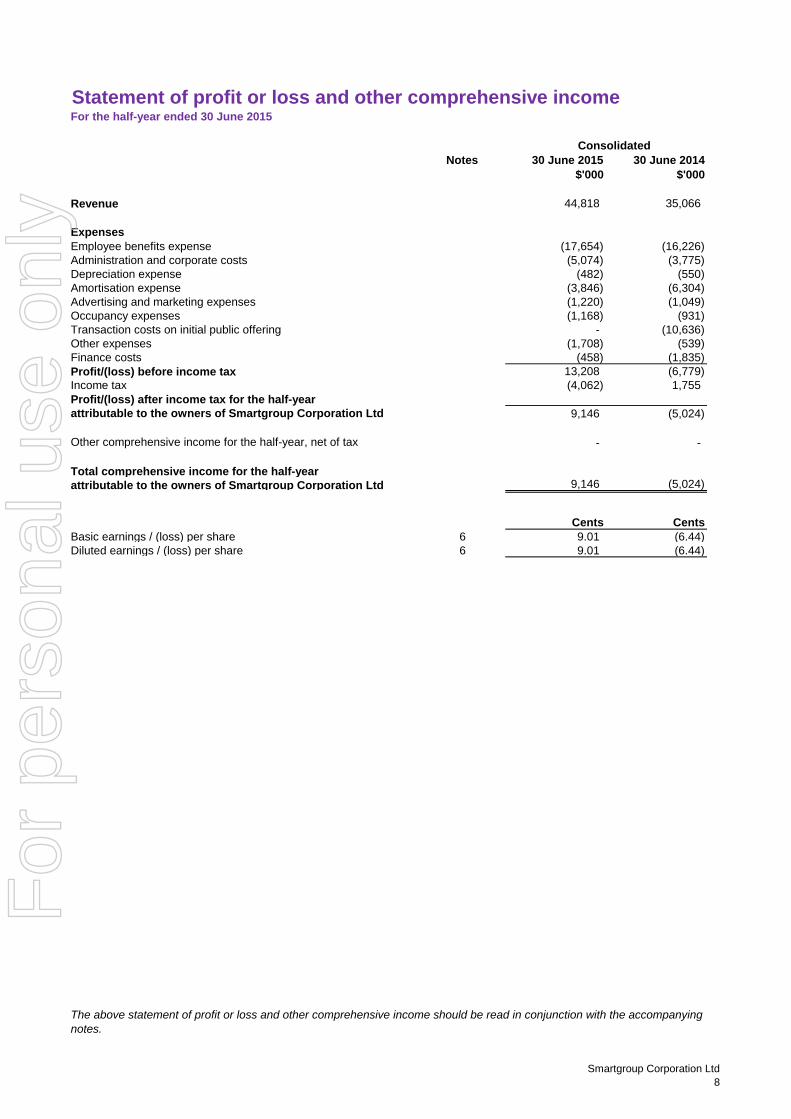
Consolidated
Notes 30 June 2015 30 June 2014
$'000 $'000
44,818 35,066
Employee benefits expense (17,654) (16,226)
Administration and corporate costs (5,074) (3,775)
(482) (550)
(3,846) (6,304)
Advertising and marketing expenses (1,220) (1,049)
(1,168) (931)
Transaction costs on initial public offering - (10,636)
(1,708) (539)
(458) (1,835)
Profit/(loss) before income tax 13,208 (6,779)
(4,062) 1,755
Profit/(loss) after income tax for the half-year
attributable to the owners of Smartgroup Corporation Ltd 9,146 (5,024)
Other comprehensive income for the half-year, net of tax - -
Total comprehensive income for the half-year
attributable to the owners of Smartgroup Corporation Ltd 9,146 (5,024)
Cents Cents
Basic earnings / (loss) per share 6 9.01 (6.44)
Diluted earnings / (loss) per share 6 9.01 (6.44)
Statement of profit or loss and other comprehensive income
The above statement of profit or loss and other comprehensive income should be read in conjunction with the accompanying
notes.
For the half-year ended 30 June 2015
Expenses
Revenue
Occupancy expenses
Other expenses
Depreciation expense
Amortisation expense
Finance costs
Income tax
Smartgroup Corporation Ltd
8
For
per
sona
l use
onl
y
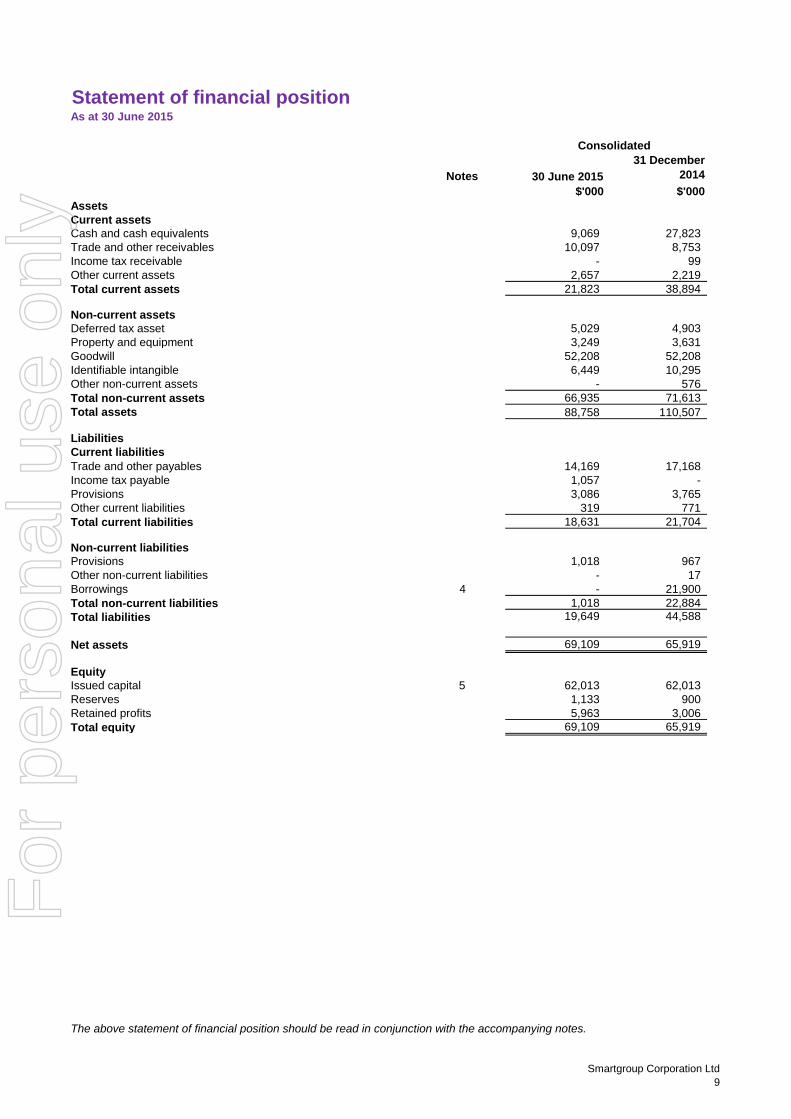
Consolidated
Notes 30 June 2015
31 December
2014
$'000 $'000
Cash and cash equivalents 9,069 27,823
Trade and other receivables 10,097 8,753
Income tax receivable - 99
Other current assets 2,657 2,219
21,823 38,894
Deferred tax asset 5,029 4,903
3,249 3,631
52,208 52,208
6,449 10,295
- 576
66,935 71,613
88,758 110,507
Trade and other payables 14,169 17,168
Income tax payable 1,057 -
Provisions 3,086 3,765
Other current liabilities 319 771
18,631 21,704
Provisions 1,018 967
Other non-current liabilities - 17
Borrowings 4 - 21,900
Total non-current liabilities 1,018 22,884 19,649 44,588
69,109 65,919
Issued capital 5 62,013 62,013
Reserves 1,133 900
Retained profits 5,963 3,006
Total equity 69,109 65,919
Liabilities
Goodwill
Current liabilities
Total current liabilities
Non-current liabilities
Non-current assets
Property and equipment
Identifiable intangible
Total non-current assets
The above statement of financial position should be read in conjunction with the accompanying notes.
Total assets
Other non-current assets
Statement of financial positionAs at 30 June 2015
Assets
Current assets
Total current assets
Total liabilities
Net assets
Equity
Smartgroup Corporation Ltd
9
For
per
sona
l use
onl
y
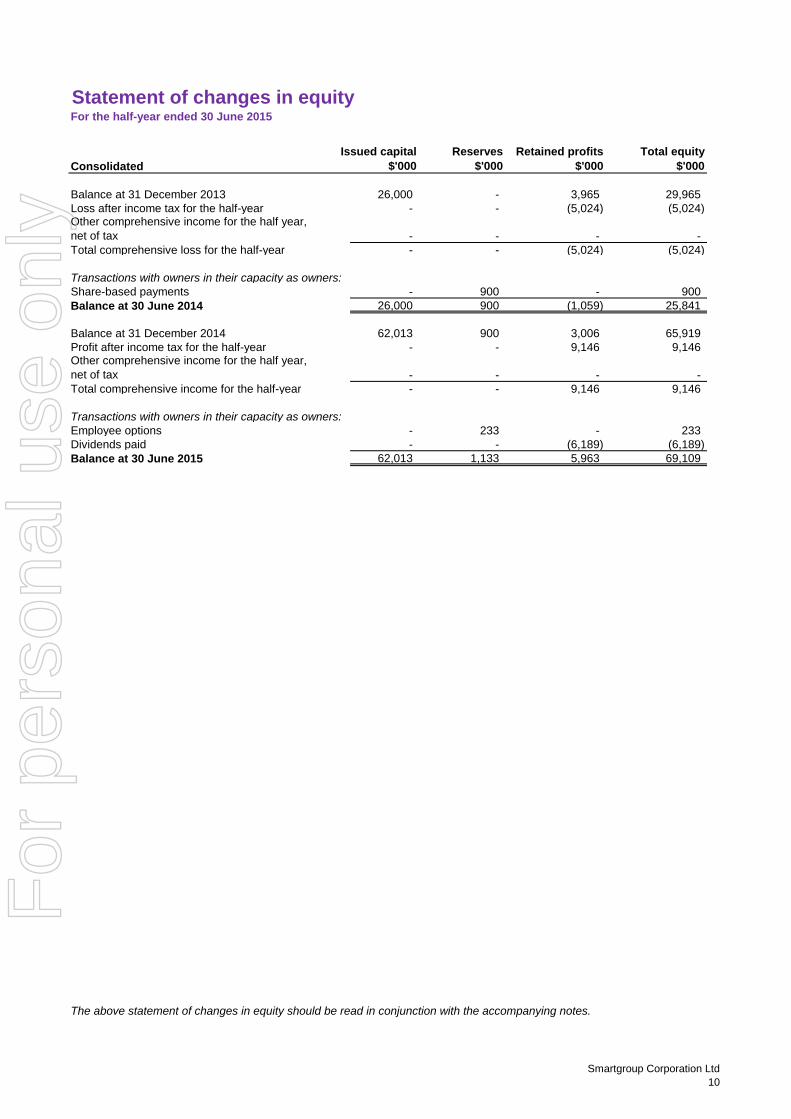
Issued capital Reserves Retained profits Total equity
Consolidated $'000 $'000 $'000 $'000
Balance at 31 December 2013 26,000 - 3,965 29,965
Loss after income tax for the half-year - - (5,024) (5,024)
- - - -
Total comprehensive loss for the half-year - - (5,024) (5,024)
Transactions with owners in their capacity as owners:
- 900 - 900
26,000 900 (1,059) 25,841
Balance at 31 December 2014 62,013 900 3,006 65,919
Profit after income tax for the half-year - - 9,146 9,146
- - - -
Total comprehensive income for the half-year - - 9,146 9,146
Transactions with owners in their capacity as owners:
Employee options - 233 - 233
Dividends paid - - (6,189) (6,189)
62,013 1,133 5,963 69,109
Other comprehensive income for the half year,
net of tax
Other comprehensive income for the half year,
net of tax
Balance at 30 June 2014
Balance at 30 June 2015
The above statement of changes in equity should be read in conjunction with the accompanying notes.
For the half-year ended 30 June 2015
Statement of changes in equity
Share-based payments
Smartgroup Corporation Ltd
10
For
per
sona
l use
onl
y
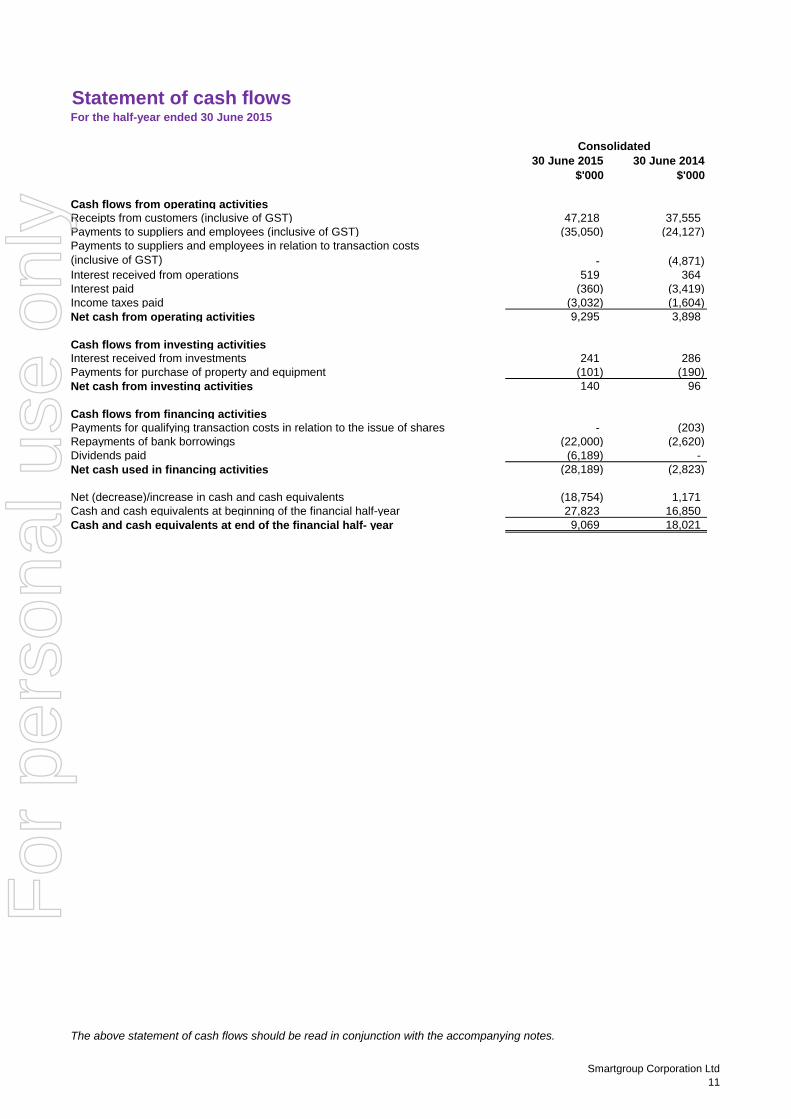
Consolidated
30 June 2015 30 June 2014
$'000 $'000
Cash flows from operating activities
Receipts from customers (inclusive of GST) 47,218 37,555
Payments to suppliers and employees (inclusive of GST) (35,050) (24,127)
- (4,871)
Interest received from operations 519 364
Interest paid (360) (3,419)
Income taxes paid (3,032) (1,604)
Net cash from operating activities 9,295 3,898
Cash flows from investing activities
Interest received from investments 241 286
Payments for purchase of property and equipment (101) (190)
Net cash from investing activities 140 96
Cash flows from financing activities
Payments for qualifying transaction costs in relation to the issue of shares - (203)
Repayments of bank borrowings (22,000) (2,620)
Dividends paid (6,189) -
Net cash used in financing activities (28,189) (2,823)
Net (decrease)/increase in cash and cash equivalents (18,754) 1,171
Cash and cash equivalents at beginning of the financial half-year 27,823 16,850
Cash and cash equivalents at end of the financial half- year 9,069 18,021
Payments to suppliers and employees in relation to transaction costs
(inclusive of GST)
The above statement of cash flows should be read in conjunction with the accompanying notes.
For the half-year ended 30 June 2015
Statement of cash flows
Smartgroup Corporation Ltd
11
For
per
sona
l use
onl
y
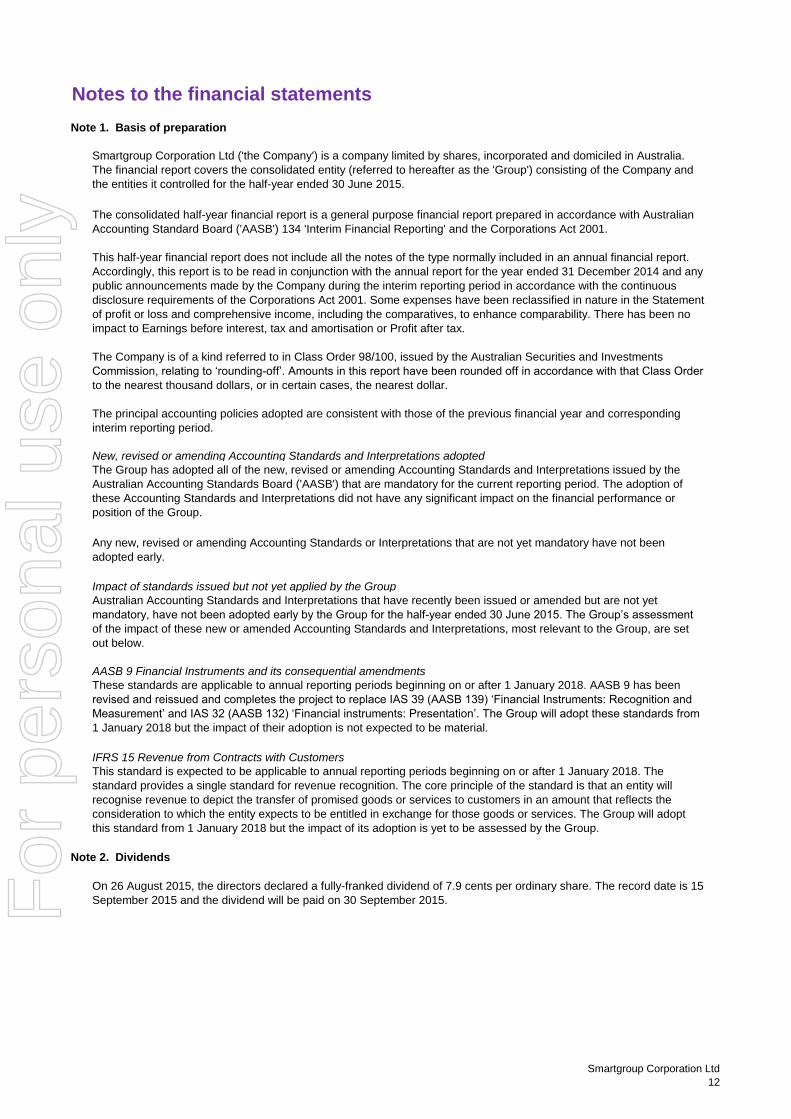
Note 1. Basis of preparation
New, revised or amending Accounting Standards and Interpretations adopted
Impact of standards issued but not yet applied by the Group
AASB 9 Financial Instruments and its consequential amendments
IFRS 15 Revenue from Contracts with Customers
Note 2. Dividends
Notes to the financial statements
Australian Accounting Standards and Interpretations that have recently been issued or amended but are not yet
mandatory, have not been adopted early by the Group for the half-year ended 30 June 2015. The Group’s assessment
of the impact of these new or amended Accounting Standards and Interpretations, most relevant to the Group, are set
out below.
On 26 August 2015, the directors declared a fully-franked dividend of 7.9 cents per ordinary share. The record date is 15
September 2015 and the dividend will be paid on 30 September 2015.
Smartgroup Corporation Ltd ('the Company') is a company limited by shares, incorporated and domiciled in Australia.
The financial report covers the consolidated entity (referred to hereafter as the 'Group') consisting of the Company and
the entities it controlled for the half-year ended 30 June 2015.
Any new, revised or amending Accounting Standards or Interpretations that are not yet mandatory have not been
adopted early.
The consolidated half-year financial report is a general purpose financial report prepared in accordance with Australian
Accounting Standard Board ('AASB') 134 'Interim Financial Reporting' and the Corporations Act 2001.
This half-year financial report does not include all the notes of the type normally included in an annual financial report.
Accordingly, this report is to be read in conjunction with the annual report for the year ended 31 December 2014 and any
public announcements made by the Company during the interim reporting period in accordance with the continuous
disclosure requirements of the Corporations Act 2001. Some expenses have been reclassified in nature in the Statement
of profit or loss and comprehensive income, including the comparatives, to enhance comparability. There has been no
impact to Earnings before interest, tax and amortisation or Profit after tax.
The Company is of a kind referred to in Class Order 98/100, issued by the Australian Securities and Investments
Commission, relating to ‘rounding-off’. Amounts in this report have been rounded off in accordance with that Class Order
to the nearest thousand dollars, or in certain cases, the nearest dollar.
The principal accounting policies adopted are consistent with those of the previous financial year and corresponding
interim reporting period.
The Group has adopted all of the new, revised or amending Accounting Standards and Interpretations issued by the
Australian Accounting Standards Board ('AASB') that are mandatory for the current reporting period. The adoption of
these Accounting Standards and Interpretations did not have any significant impact on the financial performance or
position of the Group.
These standards are applicable to annual reporting periods beginning on or after 1 January 2018. AASB 9 has been
revised and reissued and completes the project to replace IAS 39 (AASB 139) ‘Financial Instruments: Recognition and
Measurement’ and IAS 32 (AASB 132) ‘Financial instruments: Presentation’. The Group will adopt these standards from
1 January 2018 but the impact of their adoption is not expected to be material.
This standard is expected to be applicable to annual reporting periods beginning on or after 1 January 2018. The
standard provides a single standard for revenue recognition. The core principle of the standard is that an entity will
recognise revenue to depict the transfer of promised goods or services to customers in an amount that reflects the
consideration to which the entity expects to be entitled in exchange for those goods or services. The Group will adopt
this standard from 1 January 2018 but the impact of its adoption is yet to be assessed by the Group.
Smartgroup Corporation Ltd
12
For
per
sona
l use
onl
y
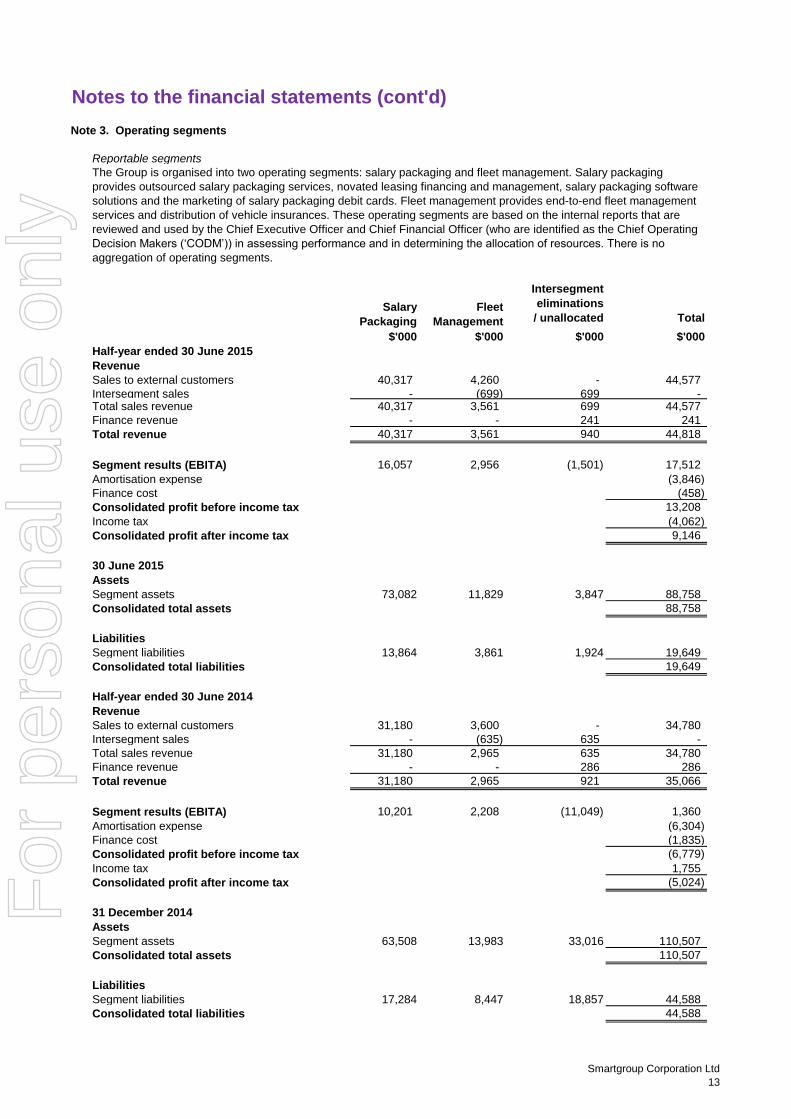
Note 3. Operating segments
Reportable segments
Salary
Packaging
Fleet
Management
Intersegment
eliminations
/ unallocated Total
$'000 $'000 $'000 $'000
Half-year ended 30 June 2015
Revenue
Sales to external customers 40,317 4,260 - 44,577
Intersegment sales - (699) 699 - Total sales revenue 40,317 3,561 699 44,577
Finance revenue - - 241 241
Total revenue 40,317 3,561 940 44,818
Segment results (EBITA) 16,057 2,956 (1,501) 17,512
Amortisation expense (3,846)
Finance cost (458)
Consolidated profit before income tax 13,208
Income tax (4,062)
Consolidated profit after income tax 9,146
30 June 2015
Assets
Segment assets 73,082 11,829 3,847 88,758
Consolidated total assets 88,758
Liabilities
Segment liabilities 13,864 3,861 1,924 19,649
Consolidated total liabilities 19,649
Half-year ended 30 June 2014
Revenue
Sales to external customers 31,180 3,600 - 34,780
Intersegment sales - (635) 635 -
Total sales revenue 31,180 2,965 635 34,780
Finance revenue - - 286 286
Total revenue 31,180 2,965 921 35,066
Segment results (EBITA) 10,201 2,208 (11,049) 1,360
Amortisation expense (6,304)
Finance cost (1,835)
Consolidated profit before income tax (6,779)
Income tax 1,755
Consolidated profit after income tax (5,024)
31 December 2014
Assets
Segment assets 63,508 13,983 33,016 110,507
Consolidated total assets 110,507
Liabilities
Segment liabilities 17,284 8,447 18,857 44,588
Consolidated total liabilities 44,588
Notes to the financial statements (cont'd)
The Group is organised into two operating segments: salary packaging and fleet management. Salary packaging
provides outsourced salary packaging services, novated leasing financing and management, salary packaging software
solutions and the marketing of salary packaging debit cards. Fleet management provides end-to-end fleet management
services and distribution of vehicle insurances. These operating segments are based on the internal reports that are
reviewed and used by the Chief Executive Officer and Chief Financial Officer (who are identified as the Chief Operating
Decision Makers (‘CODM’)) in assessing performance and in determining the allocation of resources. There is no
aggregation of operating segments.
Smartgroup Corporation Ltd
13
For
per
sona
l use
onl
y
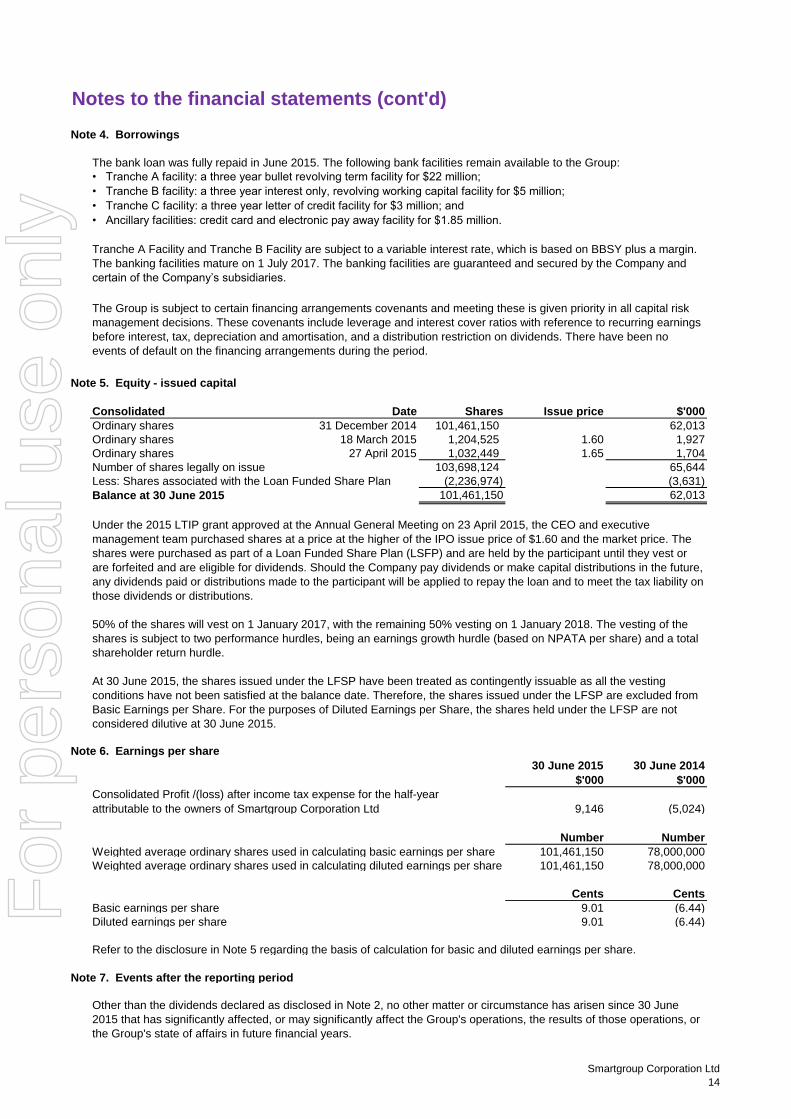
Note 4. Borrowings
• Tranche A facility: a three year bullet revolving term facility for $22 million;
• Tranche B facility: a three year interest only, revolving working capital facility for $5 million;
• Tranche C facility: a three year letter of credit facility for $3 million; and
• Ancillary facilities: credit card and electronic pay away facility for $1.85 million.
Note 5. Equity - issued capital
Consolidated Date Shares Issue price $'000
Ordinary shares 31 December 2014 101,461,150 62,013
Ordinary shares 18 March 2015 1,204,525 1.60 1,927
Ordinary shares 27 April 2015 1,032,449 1.65 1,704
Number of shares legally on issue 103,698,124 65,644
Less: Shares associated with the Loan Funded Share Plan (2,236,974) (3,631)
Balance at 30 June 2015 101,461,150 62,013
Note 6. Earnings per share
30 June 2015 30 June 2014
$'000 $'000
Consolidated Profit /(loss) after income tax expense for the half-year
attributable to the owners of Smartgroup Corporation Ltd 9,146 (5,024)
Number Number
Weighted average ordinary shares used in calculating basic earnings per share 101,461,150 78,000,000
Weighted average ordinary shares used in calculating diluted earnings per share 101,461,150 78,000,000
Cents Cents
Basic earnings per share 9.01 (6.44)
Diluted earnings per share 9.01 (6.44)
Refer to the disclosure in Note 5 regarding the basis of calculation for basic and diluted earnings per share.
Note 7. Events after the reporting period
Tranche A Facility and Tranche B Facility are subject to a variable interest rate, which is based on BBSY plus a margin.
The banking facilities mature on 1 July 2017. The banking facilities are guaranteed and secured by the Company and
certain of the Company’s subsidiaries.
The Group is subject to certain financing arrangements covenants and meeting these is given priority in all capital risk
management decisions. These covenants include leverage and interest cover ratios with reference to recurring earnings
before interest, tax, depreciation and amortisation, and a distribution restriction on dividends. There have been no
events of default on the financing arrangements during the period.
Under the 2015 LTIP grant approved at the Annual General Meeting on 23 April 2015, the CEO and executive
management team purchased shares at a price at the higher of the IPO issue price of $1.60 and the market price. The
shares were purchased as part of a Loan Funded Share Plan (LSFP) and are held by the participant until they vest or
are forfeited and are eligible for dividends. Should the Company pay dividends or make capital distributions in the future,
any dividends paid or distributions made to the participant will be applied to repay the loan and to meet the tax liability on
those dividends or distributions.
50% of the shares will vest on 1 January 2017, with the remaining 50% vesting on 1 January 2018. The vesting of the
shares is subject to two performance hurdles, being an earnings growth hurdle (based on NPATA per share) and a total
shareholder return hurdle.
At 30 June 2015, the shares issued under the LFSP have been treated as contingently issuable as all the vesting
conditions have not been satisfied at the balance date. Therefore, the shares issued under the LFSP are excluded from
Basic Earnings per Share. For the purposes of Diluted Earnings per Share, the shares held under the LFSP are not
considered dilutive at 30 June 2015.
Notes to the financial statements (cont'd)
The bank loan was fully repaid in June 2015. The following bank facilities remain available to the Group:
Other than the dividends declared as disclosed in Note 2, no other matter or circumstance has arisen since 30 June
2015 that has significantly affected, or may significantly affect the Group's operations, the results of those operations, or
the Group's state of affairs in future financial years.
Smartgroup Corporation Ltd
14
For
per
sona
l use
onl
y
(a)
(b)
(c)
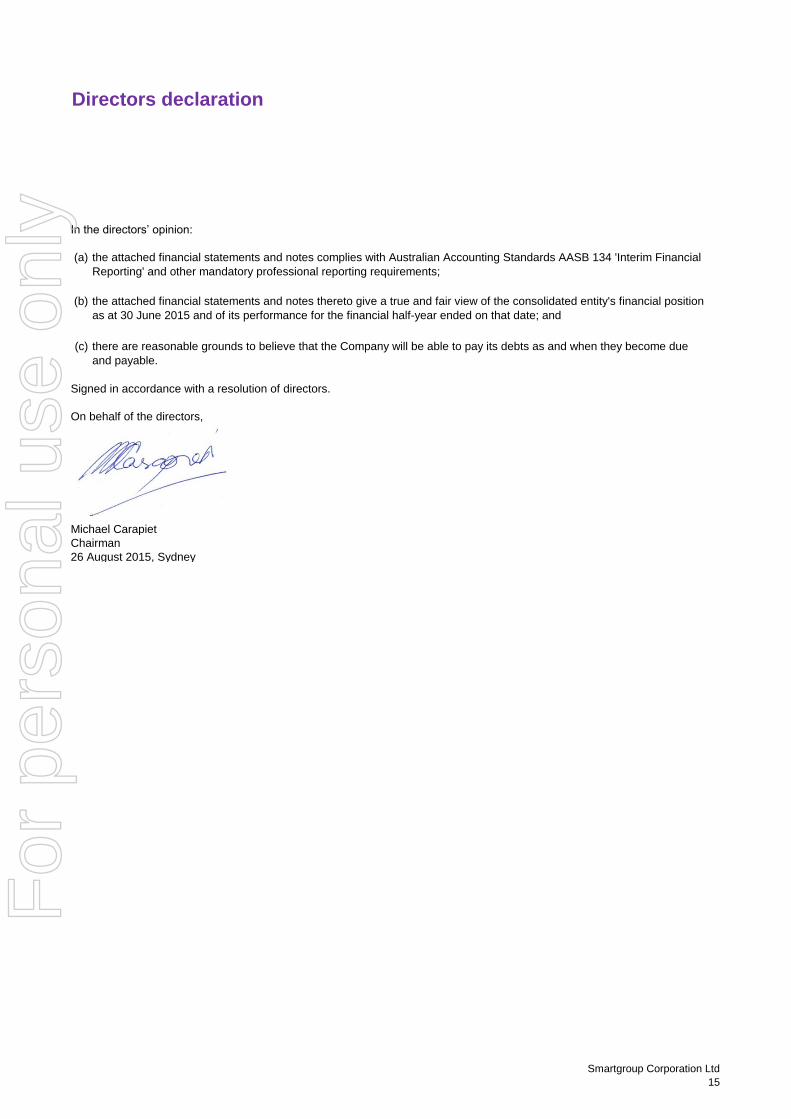
Michael Carapiet
Chairman
26 August 2015, Sydney
there are reasonable grounds to believe that the Company will be able to pay its debts as and when they become due
and payable.
Signed in accordance with a resolution of directors.
On behalf of the directors,
the attached financial statements and notes complies with Australian Accounting Standards AASB 134 'Interim Financial
Reporting' and other mandatory professional reporting requirements;
the attached financial statements and notes thereto give a true and fair view of the consolidated entity's financial position
as at 30 June 2015 and of its performance for the financial half-year ended on that date; and
Directors declaration
In the directors’ opinion:
Smartgroup Corporation Ltd
15
For
per
sona
l use
onl
y
Independent review report
Smartgroup Corporation Ltd
16
For
per
sona
l use
onl
y
Independent review report (cont'd)
Smartgroup Corporation Ltd
17
For
per
sona
l use
onl
y

Directors Michael Carapiet Auditor PricewaterhouseCoopers
Deven Billimoria Darling Park, Tower 2
John Prendiville 201 Sussex Street
Gavin Bell Sydney, NSW, Australia, 2000
Andrew Bolam
Dr Ian Watt
Company Timothy Looi Solicitors Minter Ellison Lawyers
secretaries Amanda Morgan Level 23, 525 Collins Street
Melbourne, VIC, Australia , 3000
Tel: 02 9921 8888
Registered office Smartgroup Corporation Ltd Bankers Australia and New Zealand
Level 8, 133 Castlereagh Street Banking Group Limited
Sydney, NSW, Australia, 2000 242 Pitt Street
Tel: 1300 476 278 Sydney, NSW, Australia, 2000
Principal place Smartgroup Corporation Ltd Stock Smartgroup Corporation Ltd
of business Level 8, 133 Castlereagh Street exchange shares are listed on
Sydney, NSW, Australia, 2000 listing the Australian Securities
Exchange (ASX Code: SIQ)
Share LINK Market Services Website www.smartgroup.com.au
registry Level 12, 680 George Street
Sydney, NSW, Australia, 2000
Tel: 1300 554 474
Corporate directory
Smartgroup Corporation Ltd
18
For
per
sona
l use
onl
y