Embed Size (px)
Citation preview
Morgan Stanley Asia Pacific Summit
17 November 2016For
per
sona
l use
onl
y
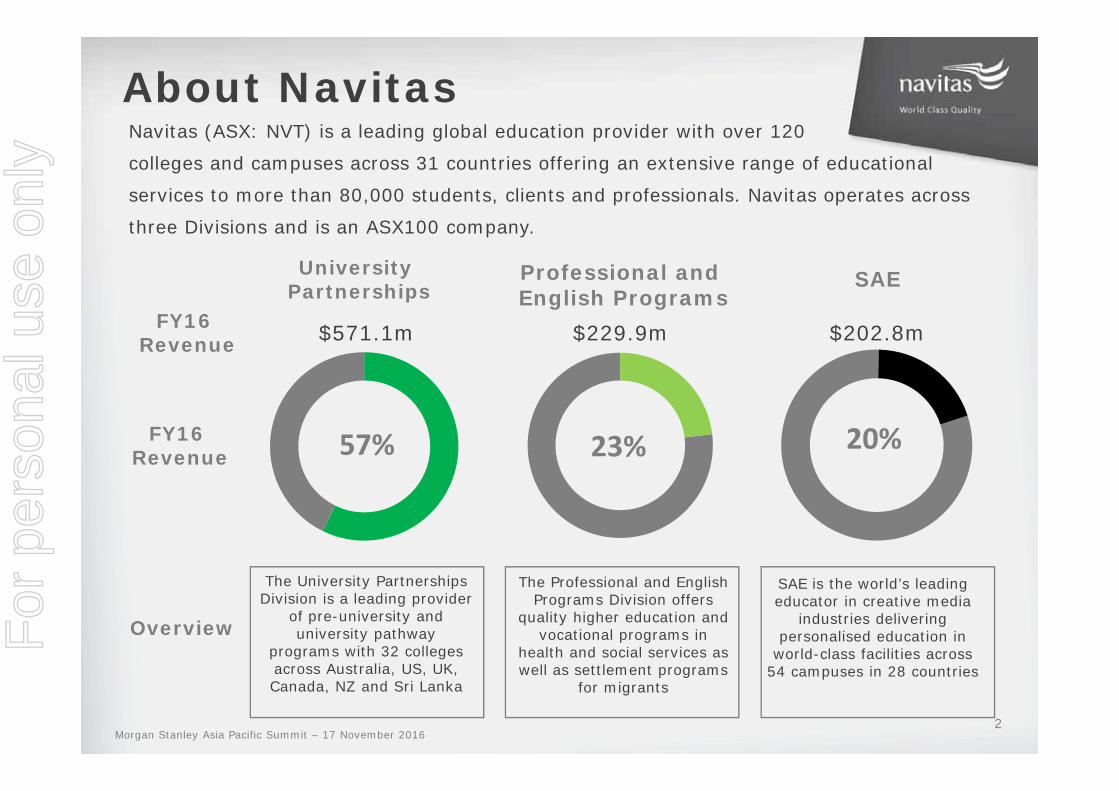
The University Partnerships Division is a leading provider
of pre-university and university pathway
programs with 32 colleges across Australia, US, UK, Canada, NZ and Sri Lanka
23% 20%57%
Navitas (ASX: NVT) is a leading global education provider with over 120
colleges and campuses across 31 countries offering an extensive range of educational
services to more than 80,000 students, clients and professionals. Navitas operates across
three Divisions and is an ASX100 company.
University Partnerships SAEProfessional and
English Programs
Overview
FY16 Revenue
FY16 Revenue $202.8m$229.9m$571.1m
The Professional and English Programs Division offers
quality higher education and vocational programs in
health and social services as well as settlement programs
for migrants
SAE is the world’s leading educator in creative media
industries delivering personalised education in
world-class facilities across 54 campuses in 28 countries
About Navitas
2Morgan Stanley Asia Pacific Summit – 17 November 2016
For
per
sona
l use
onl
y
3
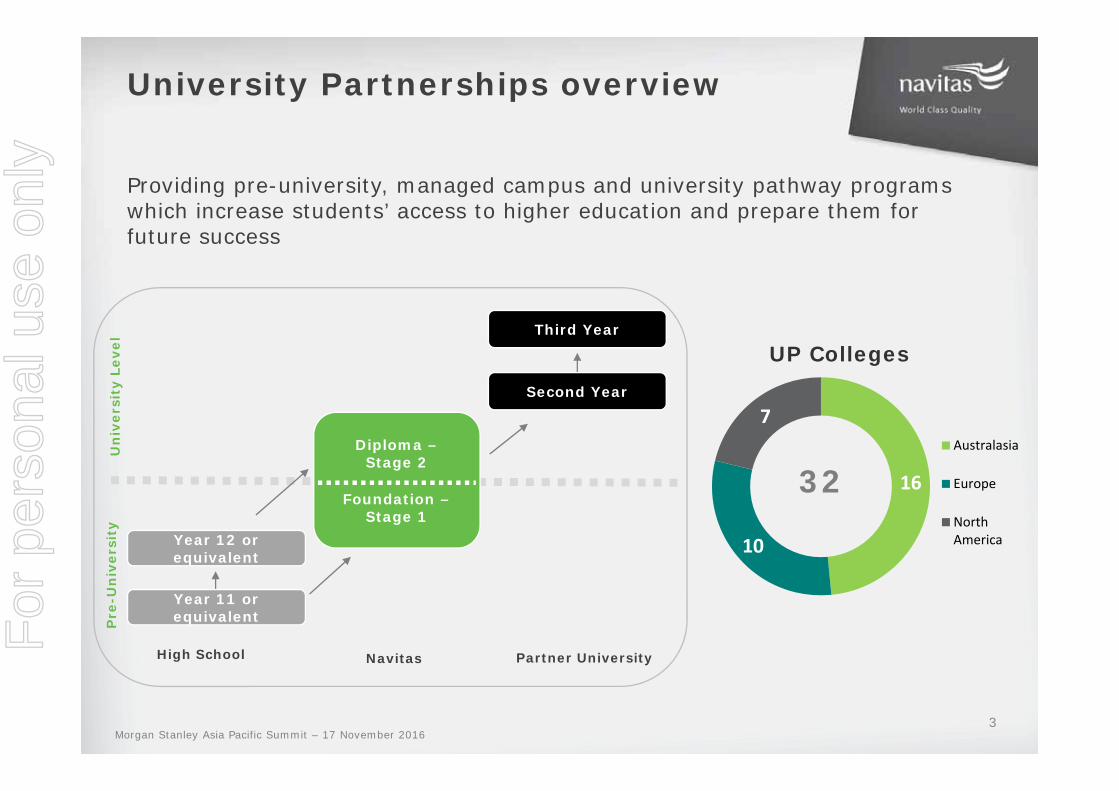
University Partnerships overview
16
10
7
UP Colleges
Australasia
Europe
NorthAmerica
Diploma –Stage 2
Foundation –Stage 1
Third Year
Year 12 or equivalent
Year 11 or equivalent
Second Year
High School Navitas Partner University
Pre
-Un
iver
sity
Un
iver
sity
Lev
el
Providing pre-university, managed campus and university pathway programs which increase students’ access to higher education and prepare them for future success
32
Morgan Stanley Asia Pacific Summit – 17 November 2016
For
per
sona
l use
onl
y
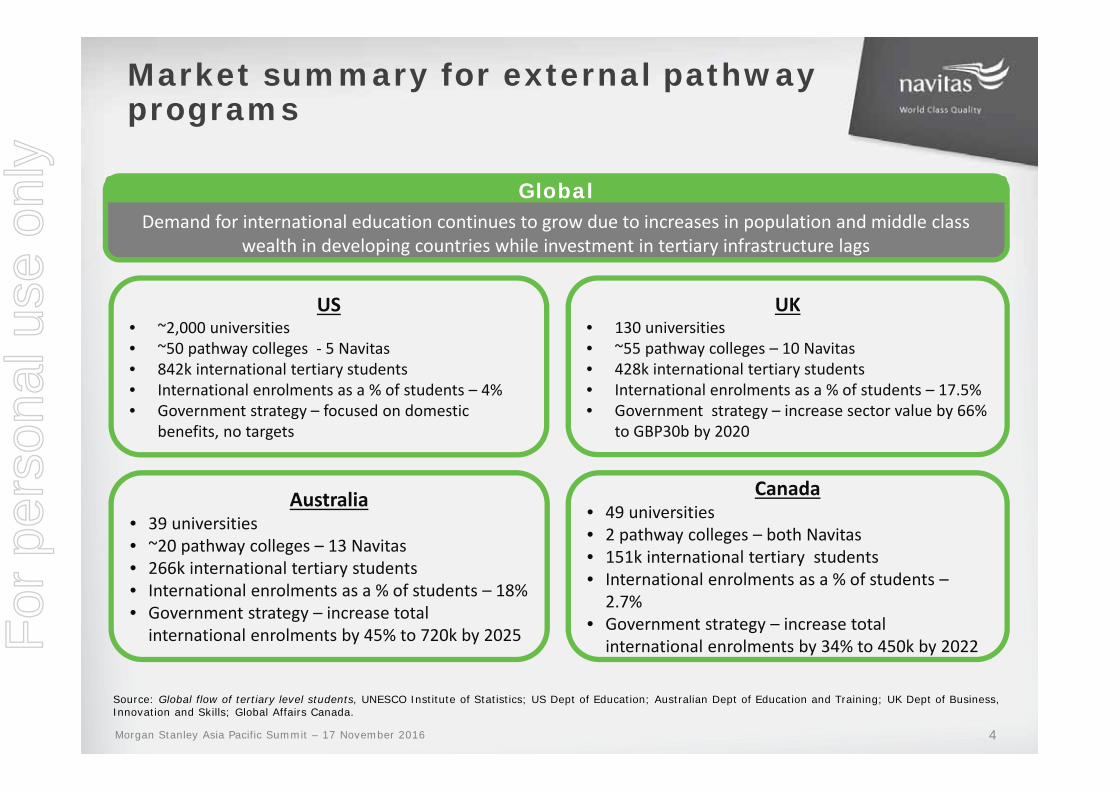
US• ~2,000 universities• ~50 pathway colleges ‐ 5 Navitas• 842k international tertiary students• International enrolments as a % of students – 4%• Government strategy – focused on domestic
benefits, no targets
Canada• 49 universities• 2 pathway colleges – both Navitas• 151k international tertiary students• International enrolments as a % of students –2.7%
• Government strategy – increase total international enrolments by 34% to 450k by 2022
UK• 130 universities• ~55 pathway colleges – 10 Navitas• 428k international tertiary students• International enrolments as a % of students – 17.5%• Government strategy – increase sector value by 66%
to GBP30b by 2020
Australia• 39 universities• ~20 pathway colleges – 13 Navitas• 266k international tertiary students• International enrolments as a % of students – 18%• Government strategy – increase total international enrolments by 45% to 720k by 2025
Market summary for external pathway programs
Source: Global flow of tertiary level students, UNESCO Institute of Statistics; US Dept of Education; Australian Dept of Education and Training; UK Dept of Business, Innovation and Skills; Global Affairs Canada.
4
Demand for international education continues to grow due to increases in population and middle class wealth in developing countries while investment in tertiary infrastructure lags
Global
Morgan Stanley Asia Pacific Summit – 17 November 2016
For
per
sona
l use
onl
y
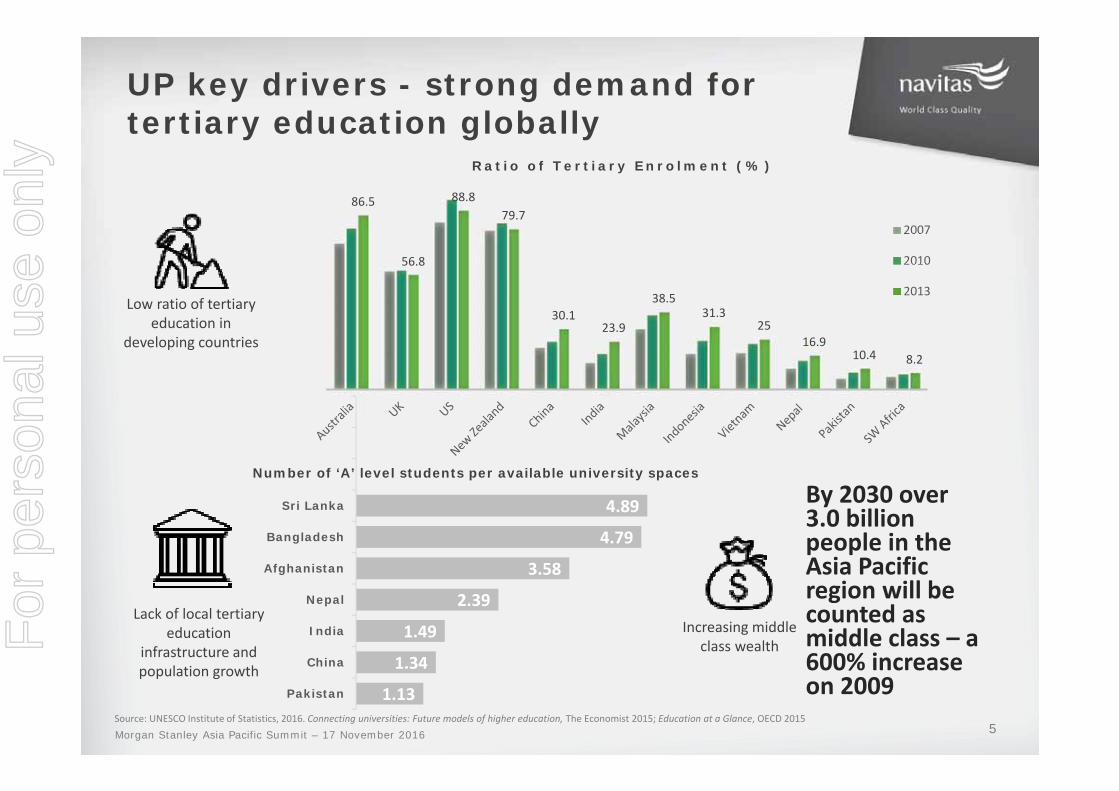
1.13
1.34
1.49
2.39
3.58
4.79
4.89
Pakistan
China
India
Nepal
Afghanistan
Bangladesh
Sri Lanka
UP key drivers - strong demand for tertiary education globally
Source: UNESCO Institute of Statistics, 2016. Connecting universities: Future models of higher education, The Economist 2015; Education at a Glance, OECD 2015
5
86.5
56.8
88.879.7
30.123.9
38.531.3
2516.9
10.4 8.2
Rat io o f Tert iary Enro lment (%)
2007
2010
2013
Number of ‘A’ level students per available university spaces
Low ratio of tertiary education in
developing countries
Lack of local tertiary education
infrastructure and population growth
5
Increasing middle class wealth
By 2030 over 3.0 billion people in the Asia Pacific region will be counted as middle class – a 600% increase on 2009
Morgan Stanley Asia Pacific Summit – 17 November 2016
For
per
sona
l use
onl
y
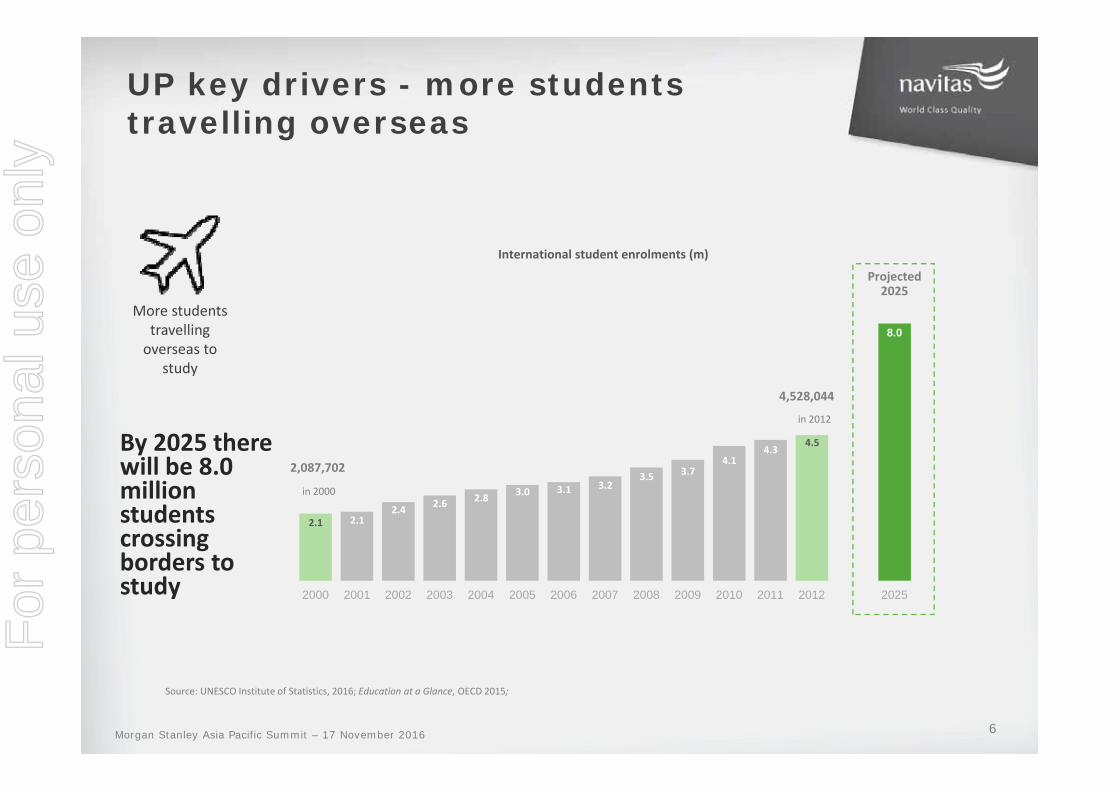
UP key drivers - more students travelling overseas
Source: UNESCO Institute of Statistics, 2016; Education at a Glance, OECD 2015;
International student enrolments (m)
2000 2001 2002 2003 2004 2005 2006 2007 2008 2009 2010 2011 2012 2025
2.12.4 2.6 2.8 3.0 3.1 3.2
3.5 3.74.1
4.3
2.1
8.0
Projected2025
2,087,702
in 2000
4,528,044
in 2012
4.5
More students travelling overseas to
study
By 2025 there will be 8.0 million students crossing borders to study
6Morgan Stanley Asia Pacific Summit – 17 November 2016
For
per
sona
l use
onl
y
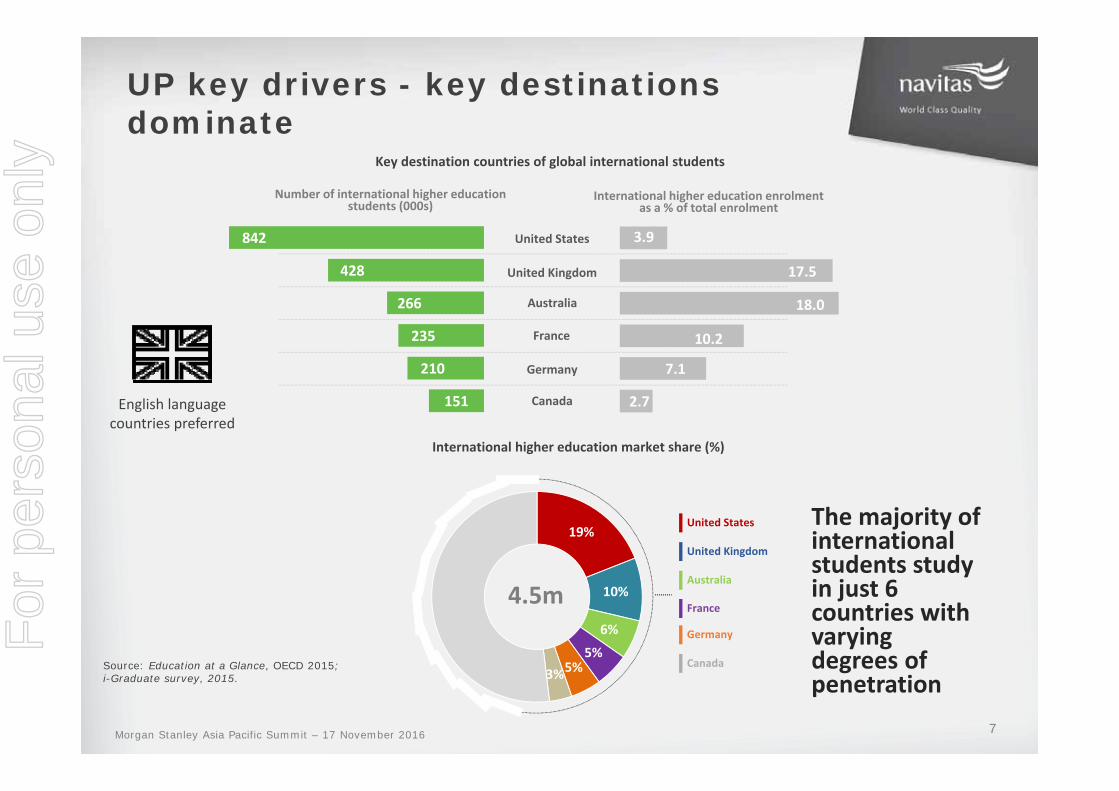
19%
10%
6%
5%5%3%
UP key drivers - key destinations dominate
The majority of international students study in just 6 countries with varying degrees of penetration
Source: Education at a Glance, OECD 2015; i-Graduate survey, 2015.
4.5m
United States
United Kingdom
Australia
France
Germany
Canada
International higher education market share (%)
English language countries preferred
Key destination countries of global international students
Number of international higher education students (000s)
International higher education enrolment as a % of total enrolment
United States
United Kingdom
France
Australia
Germany
Canada 2.7
7.1
10.2
18.0
17.5
3.9
151
210
235
266
428
842
7Morgan Stanley Asia Pacific Summit – 17 November 2016
For
per
sona
l use
onl
y
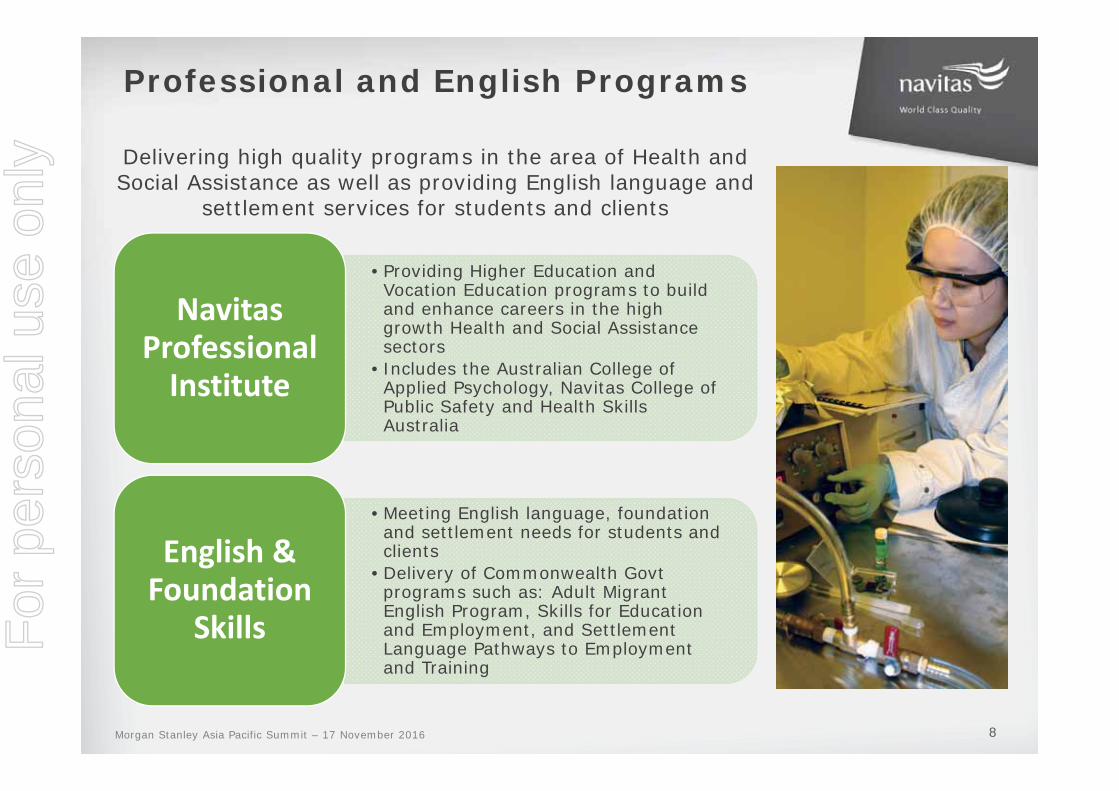
Professional and English Programs
8
•Providing Higher Education and Vocation Education programs to build and enhance careers in the high growth Health and Social Assistance sectors
• Includes the Australian College of Applied Psychology, Navitas College of Public Safety and Health Skills Australia
Navitas Professional Institute
•Meeting English language, foundation and settlement needs for students and clients
•Delivery of Commonwealth Govt programs such as: Adult Migrant English Program, Skills for Education and Employment, and Settlement Language Pathways to Employment and Training
English & Foundation
Skills
Delivering high quality programs in the area of Health and Social Assistance as well as providing English language and
settlement services for students and clients
Morgan Stanley Asia Pacific Summit – 17 November 2016
For
per
sona
l use
onl
y
0.0
200.0
400.0
600.0
800.0
1000.0
1200.0
1400.0
1600.0Em
plo
yed
peo
ple
(0
00
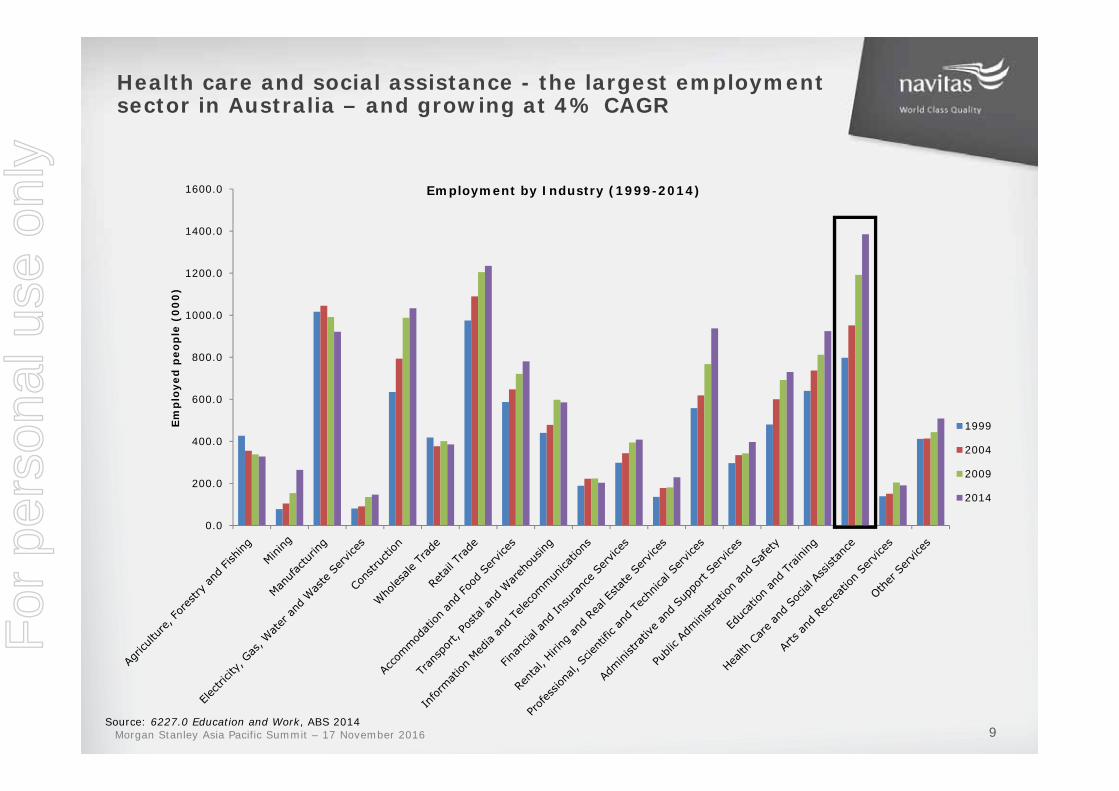
)Employment by Industry (1999-2014)
1999
2004
2009
2014
Health care and social assistance - the largest employment sector in Australia – and growing at 4% CAGR
Source: 6227.0 Education and Work, ABS 20149Morgan Stanley Asia Pacific Summit – 17 November 2016
For
per
sona
l use
onl
y
10
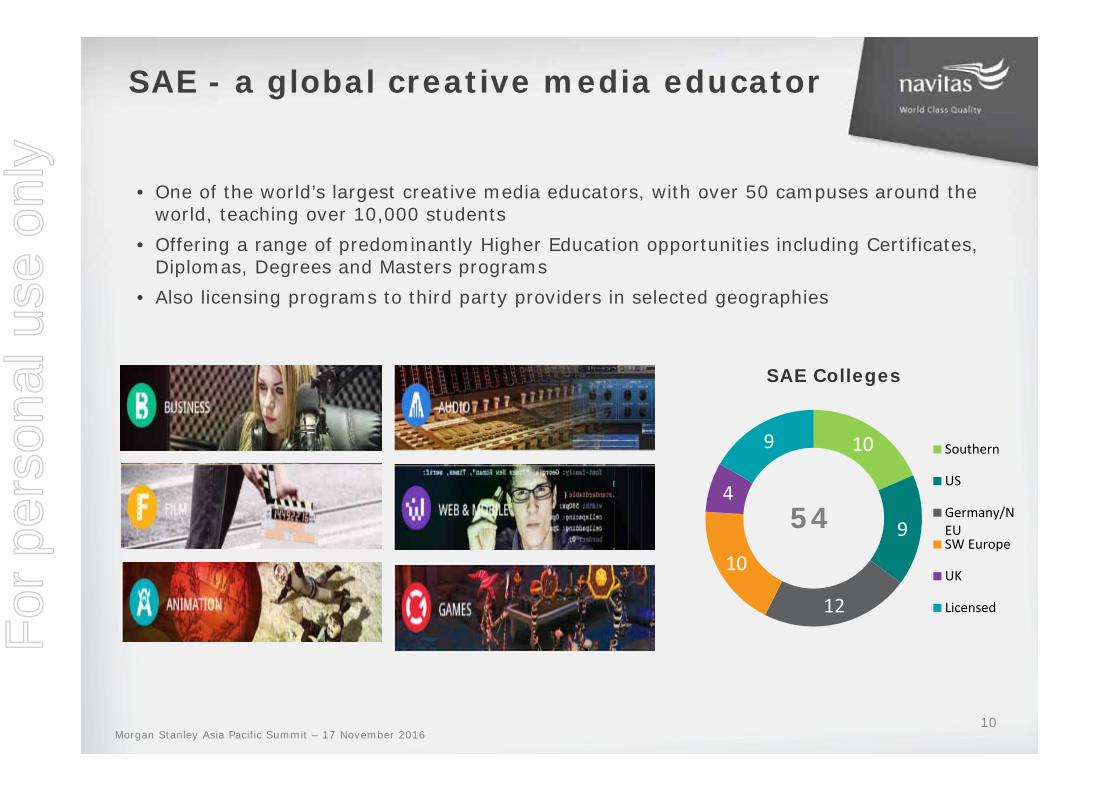
SAE - a global creative media educator
• One of the world’s largest creative media educators, with over 50 campuses around the world, teaching over 10,000 students
• Offering a range of predominantly Higher Education opportunities including Certificates, Diplomas, Degrees and Masters programs
• Also licensing programs to third party providers in selected geographies
10
9
12
10
4
9
SAE Colleges
Southern
US
Germany/NEUSW Europe
UK
Licensed
54
Morgan Stanley Asia Pacific Summit – 17 November 2016
For
per
sona
l use
onl
y
11
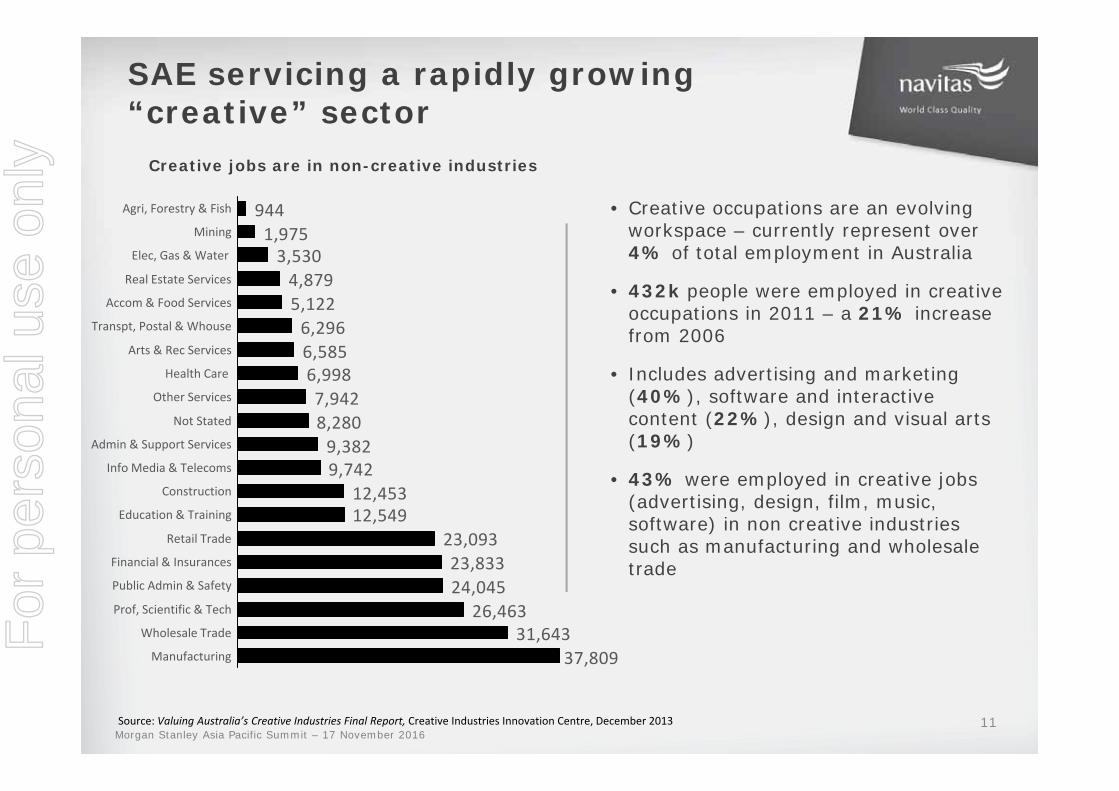
SAE servicing a rapidly growing “creative” sector
Source: Valuing Australia’s Creative Industries Final Report, Creative Industries Innovation Centre, December 2013
• Creative occupations are an evolving workspace – currently represent over 4% of total employment in Australia
• 432k people were employed in creative occupations in 2011 – a 21% increase from 2006
• Includes advertising and marketing (40%), software and interactive content (22%), design and visual arts (19%)
• 43% were employed in creative jobs (advertising, design, film, music, software) in non creative industries such as manufacturing and wholesale trade
37,80931,643
26,46324,04523,83323,093
12,54912,453
9,7429,382
8,2807,9426,9986,5856,296
5,1224,879
3,5301,975944
Accom & Food Services
Real Estate Services
Arts & Rec Services
Transpt, Postal & Whouse
Mining
Agri, Forestry & Fish
Manufacturing
Elec, Gas & Water
Public Admin & Safety
Prof, Scientific & Tech
Wholesale Trade
Retail Trade
Financial & Insurances
Other Services
Health Care
Not Stated
Admin & Support Services
Info Media & Telecoms
Construction
Education & Training
Creative jobs are in non-creative industries
Morgan Stanley Asia Pacific Summit – 17 November 2016
For
per
sona
l use
onl
y

Operational update
For
per
sona
l use
onl
y
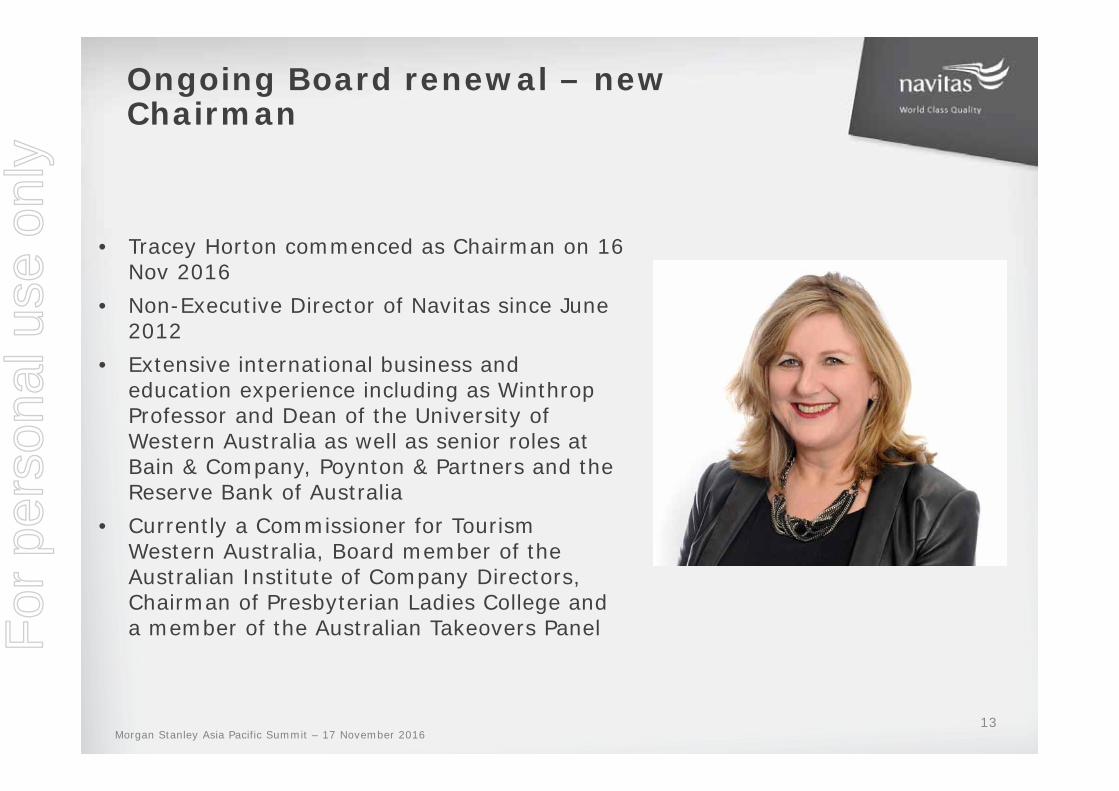
Ongoing Board renewal – new Chairman
13
• Tracey Horton commenced as Chairman on 16 Nov 2016
• Non-Executive Director of Navitas since June 2012
• Extensive international business and education experience including as Winthrop Professor and Dean of the University of Western Australia as well as senior roles at Bain & Company, Poynton & Partners and the Reserve Bank of Australia
• Currently a Commissioner for Tourism Western Australia, Board member of the Australian Institute of Company Directors, Chairman of Presbyterian Ladies College and a member of the Australian Takeovers Panel
Morgan Stanley Asia Pacific Summit – 17 November 2016
For
per
sona
l use
onl
y
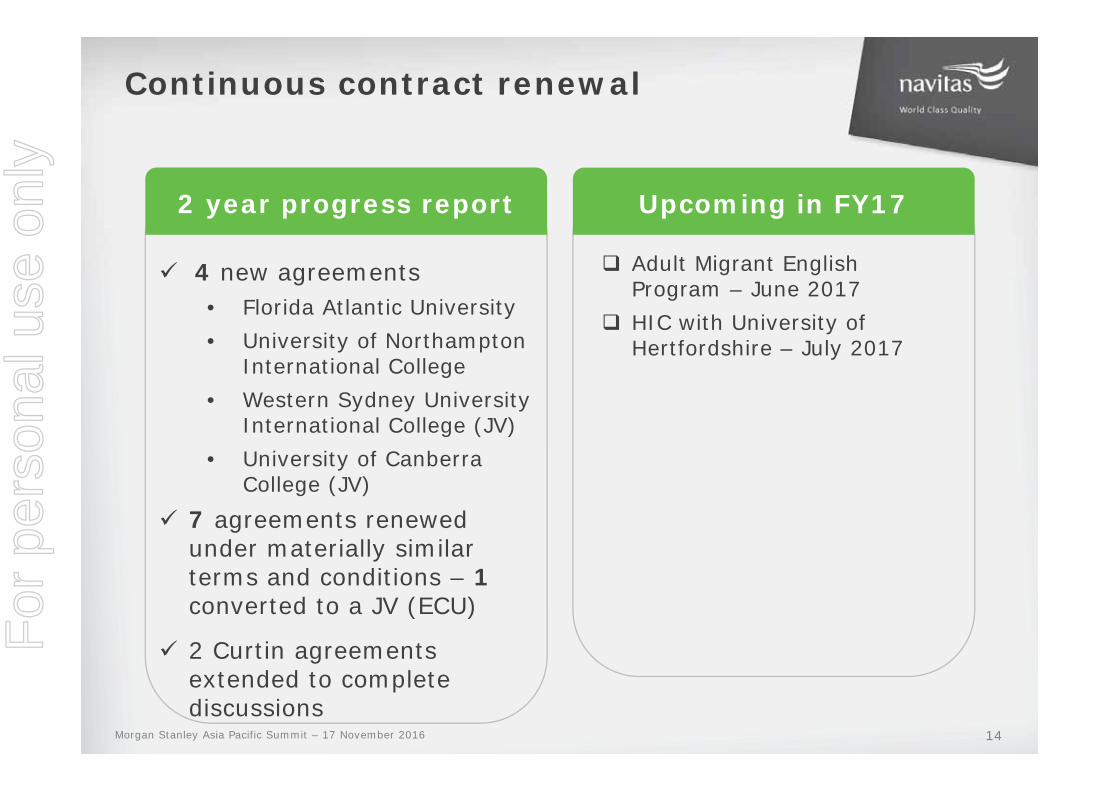
4 new agreements• Florida Atlantic University• University of Northampton
International College• Western Sydney University
International College (JV)• University of Canberra
College (JV)
7 agreements renewed under materially similar terms and conditions – 1converted to a JV (ECU)
2 Curtin agreements extended to complete discussions
Continuous contract renewal
Adult Migrant English Program – June 2017
HIC with University of Hertfordshire – July 2017
2 year progress report
14
Upcoming in FY17
Morgan Stanley Asia Pacific Summit – 17 November 2016
For
per
sona
l use
onl
y
16,4
22
14,0
97
13,6
02
17,0
67
14,7
44
15,4
26
18,8
62
16,4
20
16,5
70
19,4
70
16,3
96
16,8
70
19,2
47
15,0
54
15,4
39
-10%
-5%
0%
5%
10%
15%
2,000
4,000
6,000
8,000
10,000
12,000
14,000
16,000
18,000
20,000
1201
1202
1203
1301
1302
1303
1401
1402
1403
1501
1502
1503
1601
1602
1603
-% E
nrol
men
t gr
owth
on
pcp
(RH
S)
-% E
nrol
mne
t gr
owth
exc
ludi
ng M
QC,
SIB
T an
d CU
S
-EFS
TU (
LHS
)
-MQ
C,
SIB
T an
d C
US
Semester
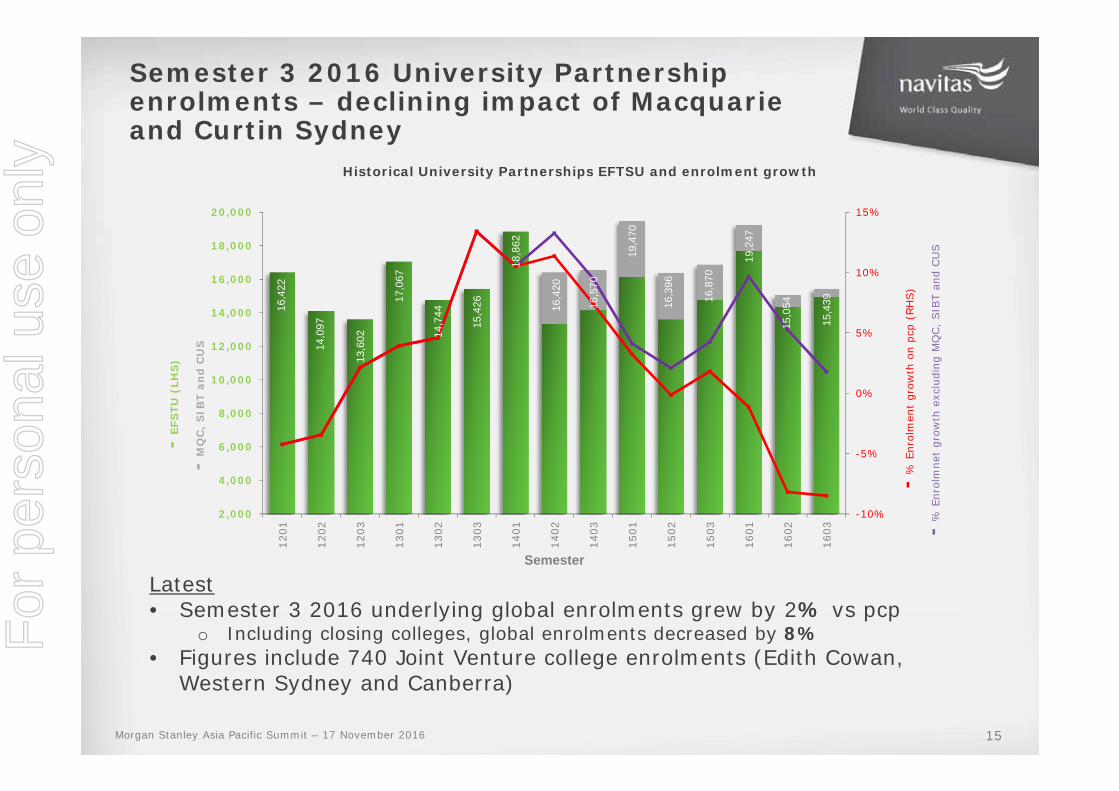
Semester 3 2016 University Partnership enrolments – declining impact of Macquarie and Curtin Sydney
15
Latest• Semester 3 2016 underlying global enrolments grew by 2% vs pcp
o Including closing colleges, global enrolments decreased by 8%• Figures include 740 Joint Venture college enrolments (Edith Cowan,
Western Sydney and Canberra)
Historical University Partnerships EFTSU and enrolment growth
Morgan Stanley Asia Pacific Summit – 17 November 2016
For
per
sona
l use
onl
y
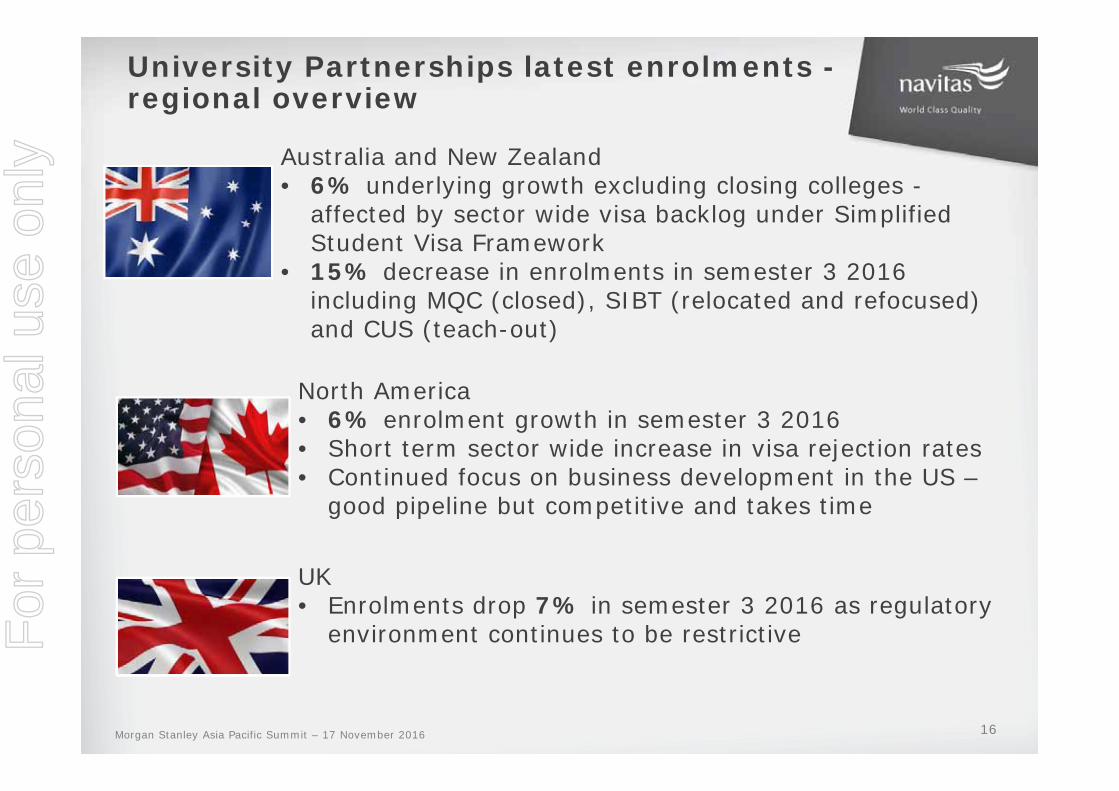
University Partnerships latest enrolments -regional overview
North America• 6% enrolment growth in semester 3 2016• Short term sector wide increase in visa rejection rates• Continued focus on business development in the US –
good pipeline but competitive and takes time
16Morgan Stanley Asia Pacific Summit – 17 November 2016
UK• Enrolments drop 7% in semester 3 2016 as regulatory
environment continues to be restrictive
Australia and New Zealand• 6% underlying growth excluding closing colleges -
affected by sector wide visa backlog under Simplified Student Visa Framework
• 15% decrease in enrolments in semester 3 2016 including MQC (closed), SIBT (relocated and refocused) and CUS (teach-out)
For
per
sona
l use
onl
y
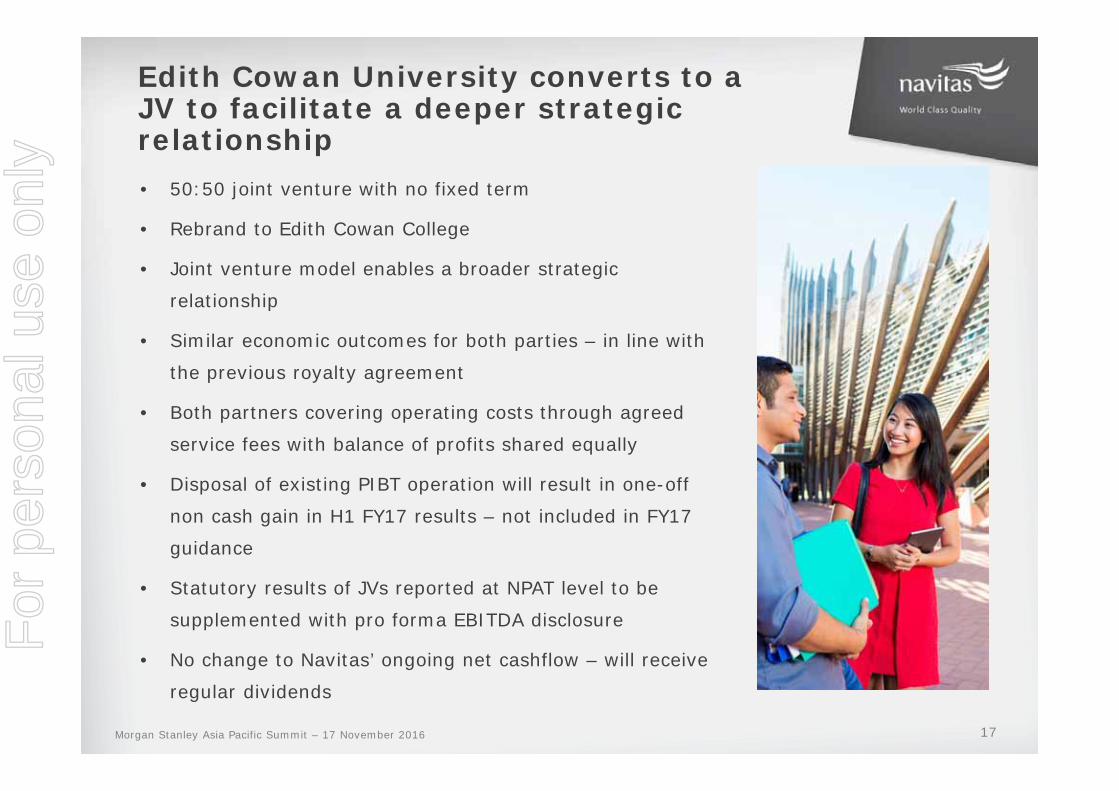
• 50:50 joint venture with no fixed term
• Rebrand to Edith Cowan College
• Joint venture model enables a broader strategic
relationship
• Similar economic outcomes for both parties – in line with
the previous royalty agreement
• Both partners covering operating costs through agreed
service fees with balance of profits shared equally
• Disposal of existing PIBT operation will result in one-off
non cash gain in H1 FY17 results – not included in FY17
guidance
• Statutory results of JVs reported at NPAT level to be
supplemented with pro forma EBITDA disclosure
• No change to Navitas’ ongoing net cashflow – will receive
regular dividends
Edith Cowan University converts to a JV to facilitate a deeper strategic relationship
17Morgan Stanley Asia Pacific Summit – 17 November 2016
For
per
sona
l use
onl
y
Creating efficiency and growth
18
Building a platform for sustained growthBuilding a platform for sustained growth
IT Shared Services
Global Learning and Teaching team
HR Shared Services
Finance Shared Services
Morgan Stanley Asia Pacific Summit – 17 November 2016
For
per
sona
l use
onl
y
19
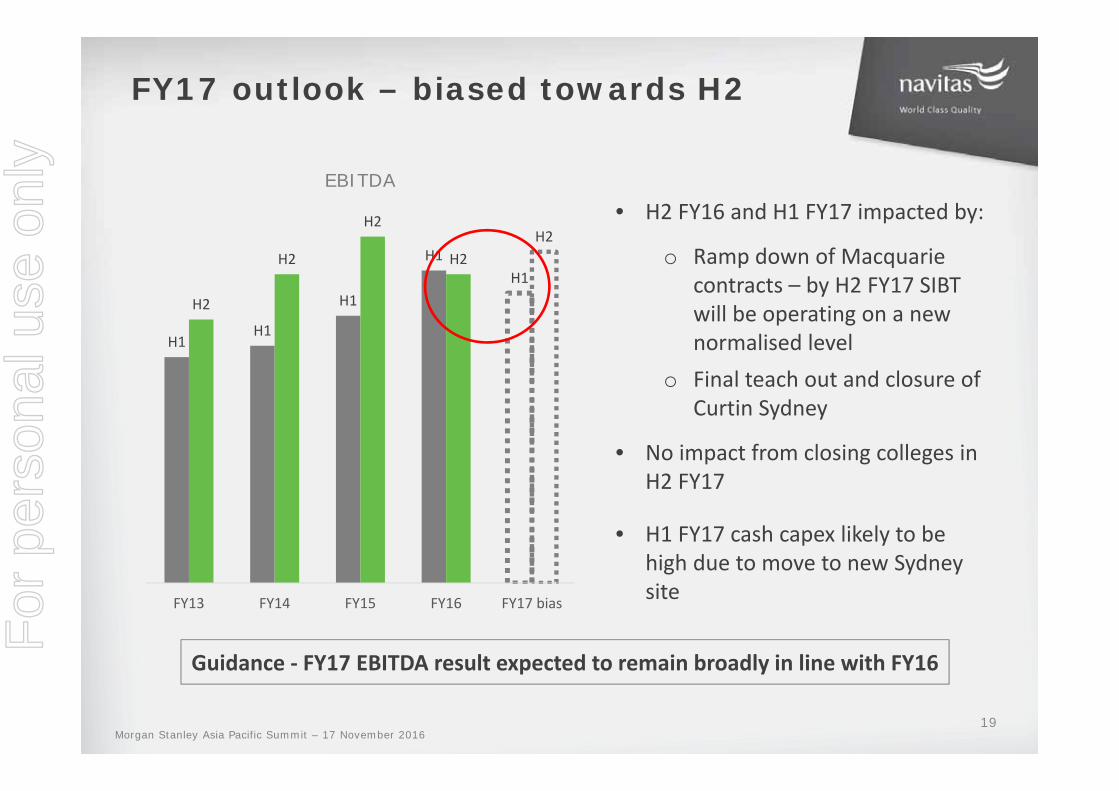
FY17 outlook – biased towards H2
H1H1
H1
H1H1
H2
H2
H2
H2H2
FY13 FY14 FY15 FY16 FY17 bias
• H2 FY16 and H1 FY17 impacted by:
o Ramp down of Macquarie contracts – by H2 FY17 SIBT will be operating on a new normalised level
o Final teach out and closure of Curtin Sydney
• No impact from closing colleges in H2 FY17
• H1 FY17 cash capex likely to be high due to move to new Sydney site
Guidance ‐ FY17 EBITDA result expected to remain broadly in line with FY16
EBITDA
Morgan Stanley Asia Pacific Summit – 17 November 2016
For
per
sona
l use
onl
y

APPENDIX
For
per
sona
l use
onl
y
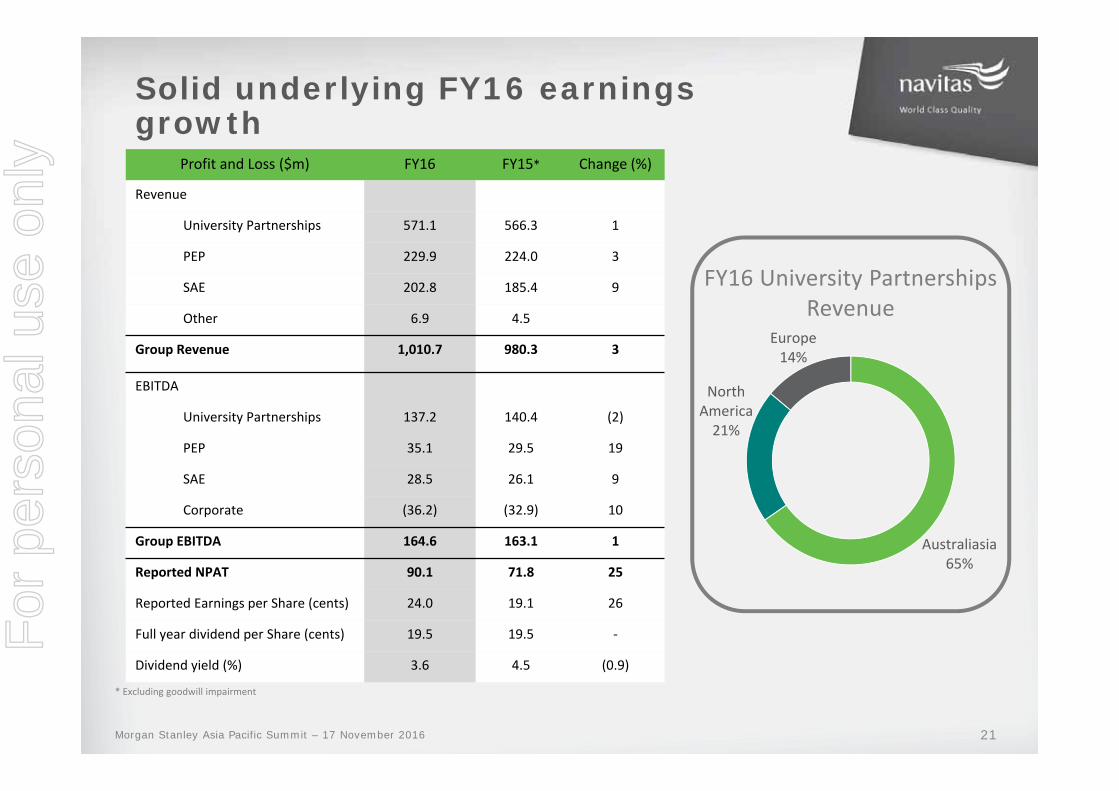
Profit and Loss ($m) FY16 FY15* Change (%)
Revenue
University Partnerships 571.1 566.3 1
PEP 229.9 224.0 3
SAE 202.8 185.4 9
Other 6.9 4.5
Group Revenue 1,010.7 980.3 3
EBITDA
University Partnerships 137.2 140.4 (2)
PEP 35.1 29.5 19
SAE 28.5 26.1 9
Corporate (36.2) (32.9) 10
Group EBITDA 164.6 163.1 1
Reported NPAT 90.1 71.8 25
Reported Earnings per Share (cents) 24.0 19.1 26
Full year dividend per Share (cents) 19.5 19.5 ‐
Dividend yield (%) 3.6 4.5 (0.9)
Solid underlying FY16 earnings growth
Australiasia65%
North America21%
Europe14%
FY16 University Partnerships Revenue
21
* Excluding goodwill impairment
Morgan Stanley Asia Pacific Summit – 17 November 2016
For
per
sona
l use
onl
y
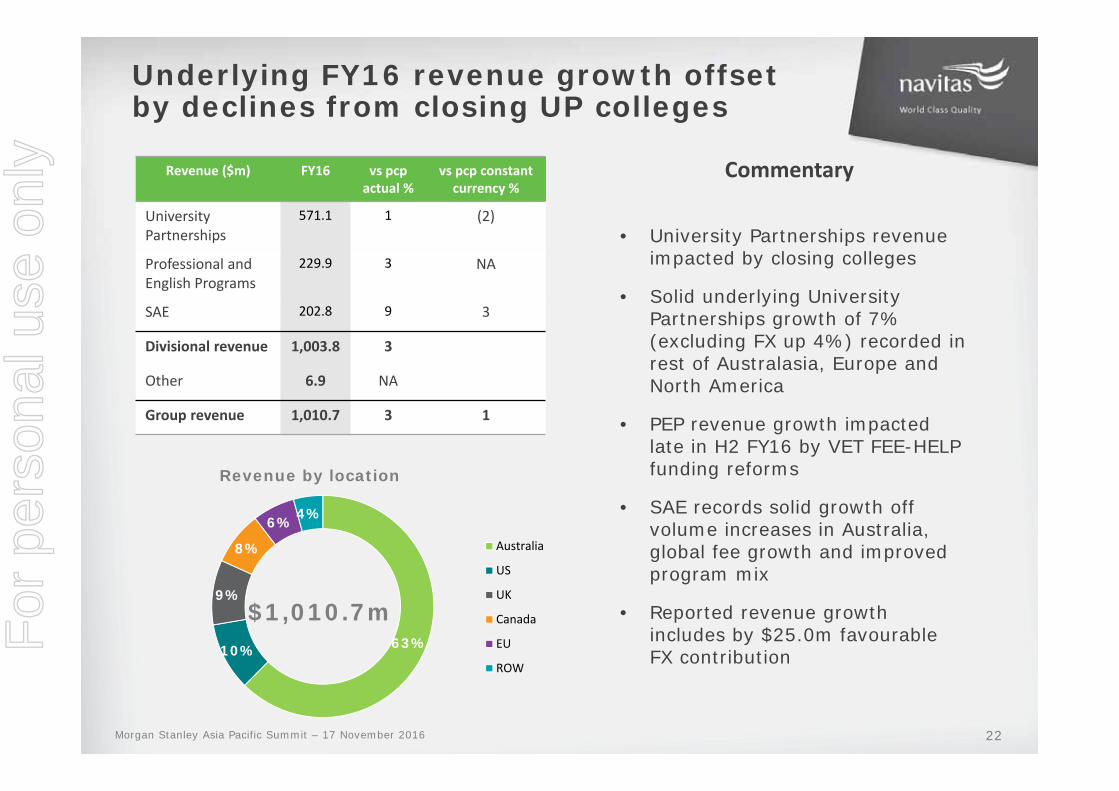
• University Partnerships revenue impacted by closing colleges
• Solid underlying University Partnerships growth of 7% (excluding FX up 4%) recorded in rest of Australasia, Europe and North America
• PEP revenue growth impacted late in H2 FY16 by VET FEE-HELP funding reforms
• SAE records solid growth off volume increases in Australia, global fee growth and improved program mix
• Reported revenue growth includes by $25.0m favourable FX contribution
63%10%
9%
8%
6%4%
Australia
US
UK
Canada
EU
ROW
Underlying FY16 revenue growth offset by declines from closing UP colleges
$1,010.7m
Revenue by location
CommentaryRevenue ($m) FY16 vs pcp actual %
vs pcp constant currency %
UniversityPartnerships
571.1 1 (2)
Professional and English Programs
229.9 3 NA
SAE 202.8 9 3
Divisional revenue 1,003.8 3
Other 6.9 NA
Group revenue 1,010.7 3 1
22Morgan Stanley Asia Pacific Summit – 17 November 2016
For
per
sona
l use
onl
y
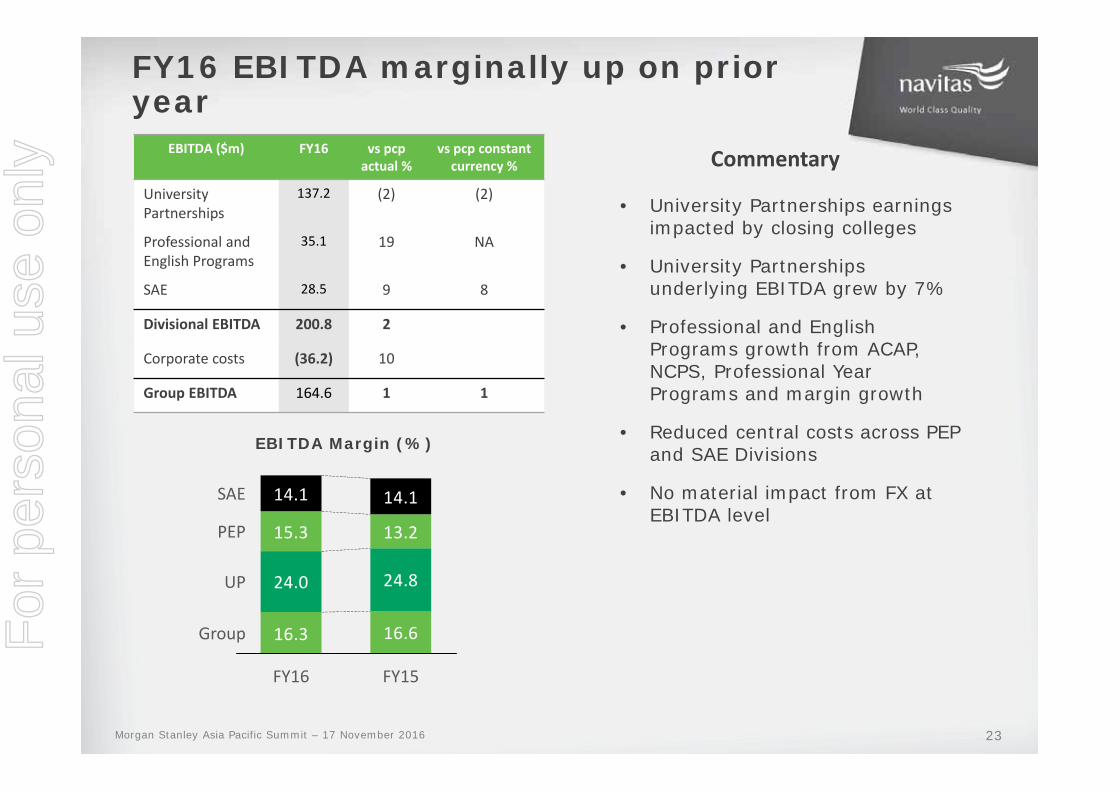
• University Partnerships earnings impacted by closing colleges
• University Partnerships underlying EBITDA grew by 7%
• Professional and English Programs growth from ACAP, NCPS, Professional Year Programs and margin growth
• Reduced central costs across PEP and SAE Divisions
• No material impact from FX at EBITDA level
FY16 EBITDA marginally up on prior year
CommentaryEBITDA ($m) FY16 vs pcp actual %
vs pcp constant currency %
UniversityPartnerships
137.2 (2) (2)
Professional and English Programs
35.1 19 NA
SAE 28.5 9 8
Divisional EBITDA 200.8 2
Corporate costs (36.2) 10
Group EBITDA 164.6 1 1
EBITDA Margin (%)
16.3 16.6
24.0 24.8
15.3 13.2
14.1 14.1
FY15
SAE
PEP
UP
Group
FY16
23Morgan Stanley Asia Pacific Summit – 17 November 2016
For
per
sona
l use
onl
y
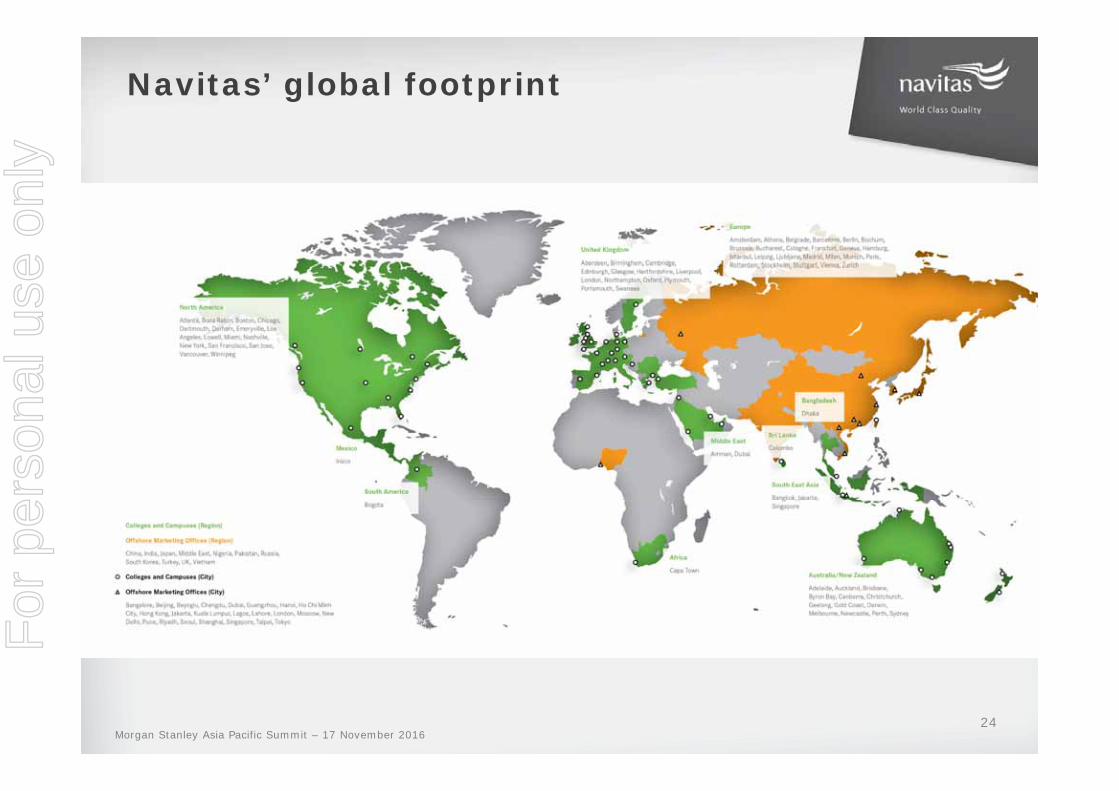
24
Navitas’ global footprint
Morgan Stanley Asia Pacific Summit – 17 November 2016
For
per
sona
l use
onl
y
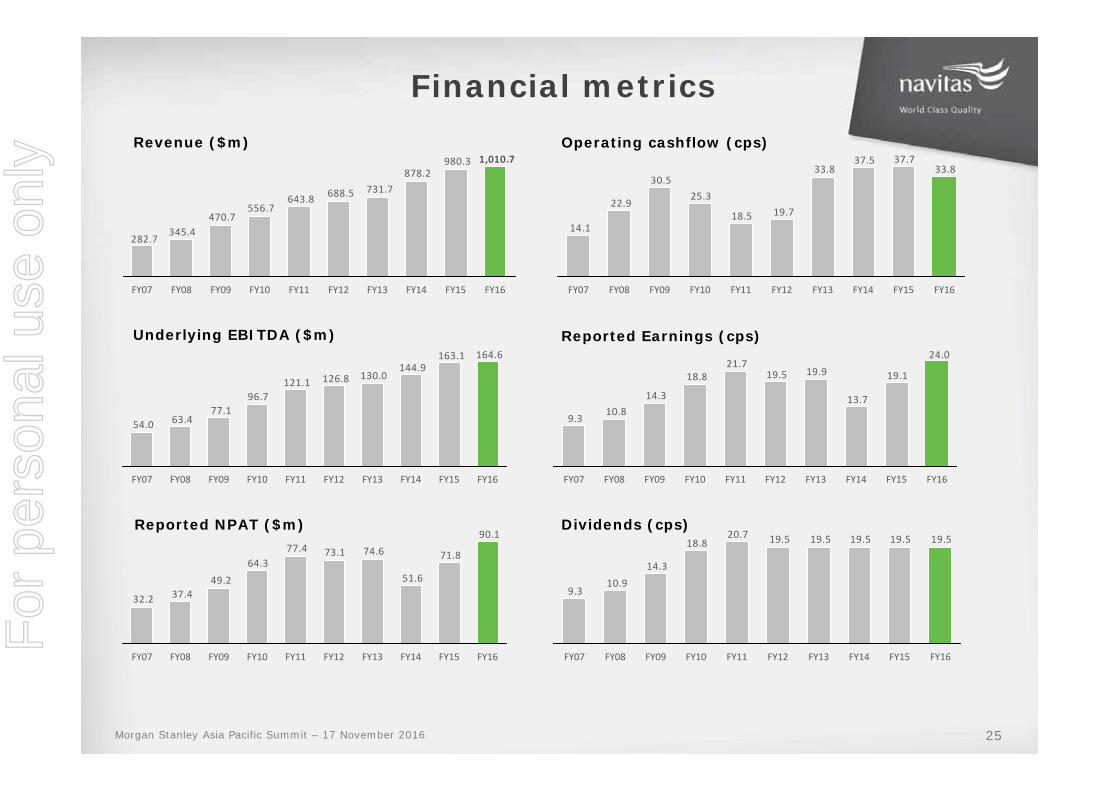
Financial metrics
980.3878.2
731.7688.5643.8556.7
470.7345.4
282.7
1,010.7
FY16FY15FY14FY13FY12FY11FY10FY09FY08FY07
90.1
71.8
51.6
74.673.177.464.3
49.237.432.2
FY16FY15FY14FY13FY12FY11FY10FY09FY08FY07
Revenue ($m)
Underlying EBITDA ($m)164.6163.1
144.9130.0126.8121.1
96.777.1
63.454.0
FY16FY15FY14FY13FY12FY11FY10FY09FY08FY07
Reported NPAT ($m)
33.837.737.5
33.8
19.718.5
25.330.5
22.9
14.1
FY16FY15FY14FY13FY12FY11FY10FY09FY08FY07
19.519.519.519.519.520.718.8
14.310.9
9.3
FY16FY15FY14FY13FY12FY11FY10FY09FY08FY07
Operating cashflow (cps)
Reported Earnings (cps)24.0
19.1
13.7
19.919.521.7
18.8
14.310.8
9.3
FY15FY14FY13FY12 FY16FY11FY10FY09FY08FY07
Dividends (cps)
25Morgan Stanley Asia Pacific Summit – 17 November 2016
For
per
sona
l use
onl
y
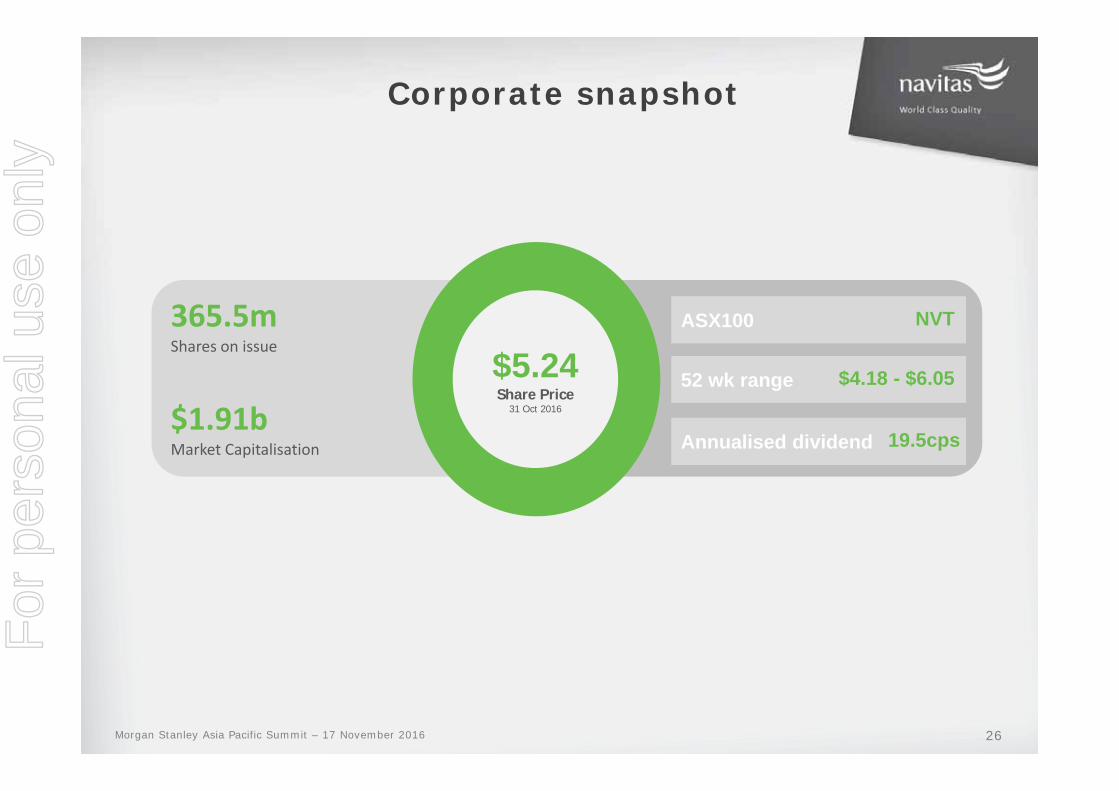
Corporate snapshot
365.5mShares on issue
$1.91bMarket Capitalisation
ASX100
52 wk range
Annualised dividend
$5.24Share Price
31 Oct 2016
NVT
$4.18 - $6.05
19.5cps
26Morgan Stanley Asia Pacific Summit – 17 November 2016
For
per
sona
l use
onl
y
Disclaimer
• This document has been prepared by Navitas Limited ABN 69 109 613 309 ("Navitas" or the "Company"). Information in this documentshould be read in conjunction with other Navitas announcements made to ASX and available at www.navitas.com or www.asx.com. By accessing or attending this presentation you acknowledge that you have read, understood and agree with the following statements.
• This document has been prepared for information purposes only and does not take into account your individual investment objectives, including the merits and risks involved in an investment in Navitas shares, or your financial situation or particular needs, and is not investment, financial product, legal, tax or accounting advice or opinion.
• You should make your own independent investigation and assessment of Navitas and its shares and obtain any professional advice you require before making any investment decision based on your investment objectives and financial circumstances. An investment in Navitas shares is subject to investment and other known and unknown risks, some of which are beyond the control of Navitas, including possible delays in repayment and loss of income and principal invested. Navitas does not guarantee any particular rate of return or the performance of Navitas, nor does it guarantee the repayment of capital from Navitas or any particular tax treatment.
• No representation, warranty or guarantee, express or implied, is made by Navitas, its subsidiaries or their respective directors, officers, employees or agents, nor any other person (the “Beneficiaries”) as to the fairness, accuracy, completeness, reliability or correctness of the information, opinions and conclusions contained in this document (including, without limitation, any estimates, calculations, projections or forward looking statements). No action should be taken on the basis of the information, and no reliance may be placed for any purpose on the accuracy or completeness of the information or opinions contained in this document. To the maximum extent permitted by law, the Beneficiaries exclude and disclaim all liability, including, without limitation, any liability arising from fault or negligence, for any direct or indirect loss or damage which may be suffered by any person through relying on anything contained in or omitted from this document.
• The distribution of this document in jurisdictions other than Australia may also be restricted by law and any such restrictions should be observed. Any failure to comply with such restrictions may constitute a violation of applicable securities laws.
• This document does not constitute an offer, invitation, solicitation, advice or recommendation with respect to the issue, purchase or sale of Navitas shares in any jurisdiction.
• All references to dollars, cents or $ in this document are to Australian currency, unless otherwise stated.
GlossaryACAP – Australian College of Applied Psychology AMEP – Adult Migrant English ProgramASX – Australian Securities Exchange CPS – Cents Per ShareEBITDA – Earnings Before Interest Tax, Depreciation and Amortisation ELICOS – English Language Intensive Courses for Overseas StudentsHSA – Health Skills Australia NCPS – Navitas College of Public SafetyNPAT – Net Profit After Tax PCP – Prior Corresponding PeriodPEP – Professional and English Programs PIBT – Perth Institute of Business TechnologySAE – School of Audio Engineering, now known as SAE SEE – Skills for Education and Employment SLPET – Settlement, Language Pathways to Employment and Training SSVF – Simplified Student Visa FrameworkUP – University Partnerships VFH – VET FEE-HELP
27Morgan Stanley Asia Pacific Summit – 17 November 2016
For
per
sona
l use
onl
y