Embed Size (px)
Citation preview

Ian Davies, Managing Director and CEO
Gary Mallett, Chief Financial Officer
20 August 2019
For
per
sona
l use
onl
y
FY19 highlights
20 August 2019FY19 full year results 2F
or p
erso
nal u
se o
nly
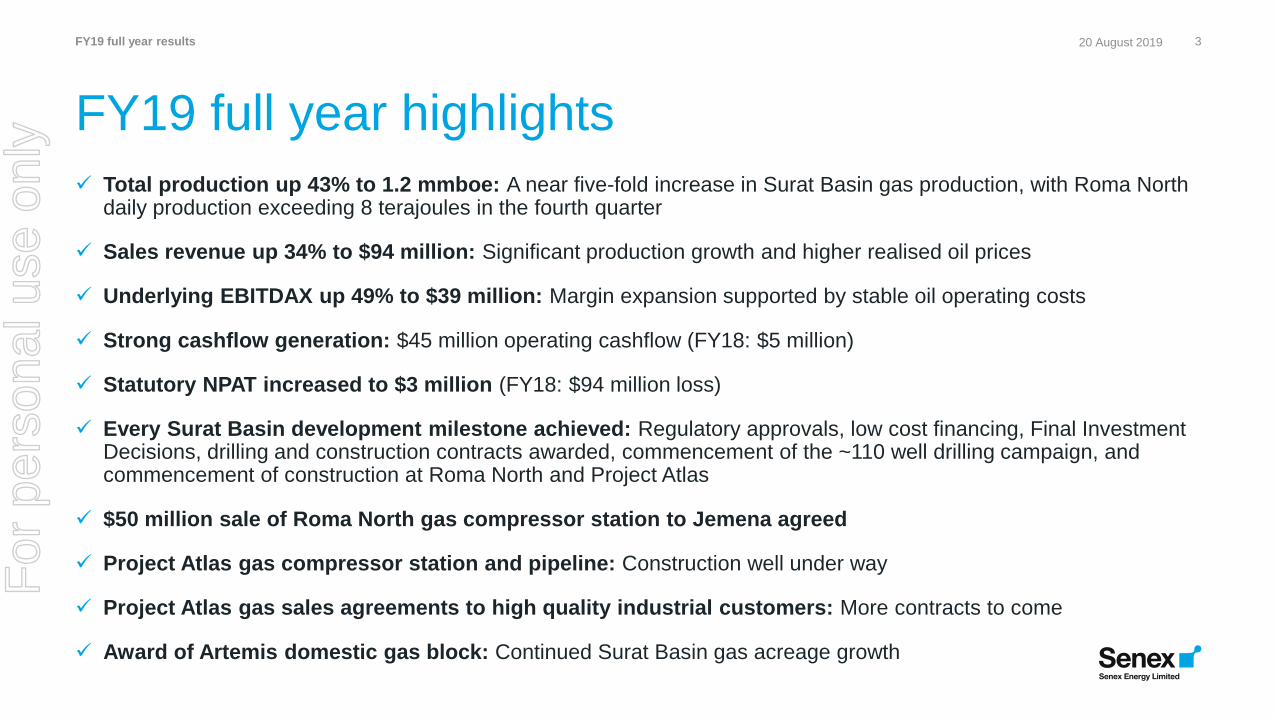
FY19 full year highlights
✓ Total production up 43% to 1.2 mmboe: A near five-fold increase in Surat Basin gas production, with Roma North daily production exceeding 8 terajoules in the fourth quarter
✓ Sales revenue up 34% to $94 million: Significant production growth and higher realised oil prices
✓ Underlying EBITDAX up 49% to $39 million: Margin expansion supported by stable oil operating costs
✓ Strong cashflow generation: $45 million operating cashflow (FY18: $5 million)
✓ Statutory NPAT increased to $3 million (FY18: $94 million loss)
✓ Every Surat Basin development milestone achieved: Regulatory approvals, low cost financing, Final Investment Decisions, drilling and construction contracts awarded, commencement of the ~110 well drilling campaign, and commencement of construction at Roma North and Project Atlas
✓ $50 million sale of Roma North gas compressor station to Jemena agreed
✓ Project Atlas gas compressor station and pipeline: Construction well under way
✓ Project Atlas gas sales agreements to high quality industrial customers: More contracts to come
✓ Award of Artemis domestic gas block: Continued Surat Basin gas acreage growth
320 August 2019FY19 full year resultsF
or p
erso
nal u
se o
nly

Improving our safety performance
• TRIFR increased slightly to 9.4 (FY18: 8.8), with no high severity injuries
• Significant focus on contractor management and behavioural safety
• Digitalised incident management system to streamline reporting and tracking
• New personal risk assessment tools to support our people
• New audit and inspection program
4
People, environment and community
Continuing strong environmental performance
• All environmental approvals received for Roma North and Project Atlas
• Strong environmental performance across all operations
• Funding for local conservation projects
• Treated water supply to drought affected graziers
• High calibre, dedicated environment team supporting project delivery and operations
Building positive and enduring relationships with our local communities
• Employing local businesses, staff and contractors through strong local content policies
• Funding a STEM program for Years 7-10 students in Roma’s secondary schools
• Supporting community initiatives where we operate, including the RFDS and Wandoan’s Photo Challenge
• Partnering with Maranoa Regional Council to fund a new small grants community program
• Sponsoring the inaugural Dieri Art Competition
Safety Environment Community
A trusted partner in our communities
FY19 full year results 20 August 2019F
or p
erso
nal u
se o
nly

5
Strong growth in earnings and cashflowTrajectory of earnings and cashflow now clearly evident
85
87
89
91
93
95
97
99
-
20.0
40.0
60.0
80.0
100.0
FY18 FY19
$70m
$94m
+34%
85
87
89
91
93
95
97
99
-
5.0
10.0
15.0
20.0
25.0
30.0
35.0
40.0
FY18 FY19
$29/
bbl
$29/
bbl
-
10.0
20.0
30.0
40.0
50.0
FY18 FY19
>100%
$45m
85
87
89
91
93
95
97
99
-
10.0
20.0
30.0
40.0
50.0
FY18 FY19
+49%
$39m
$26m
Sales revenue up 34% to $94 million
• Production up 43% to 1.2 mmboe
• Average realised oil price up 6% to $101/bbl
• Gas revenue of $17.5 million (FY18: $1.3 million)
Oil operating costs broadly flat at $29/bbl
• Proven low-cost operator
• Ongoing focus on strict cost control
Underlying EBITDAX up 49% to $39 million1
• Increased gas production, higher oil prices and stable oil operating costs
Strong increase in operating cashflow
• Leverage to higher production clearly evident
• Significant contribution to fund growth projects
FY19 full year results 20 August 2019
1. Refer to slide 16 for reconciliation of Statutory NPAT to EBITDAX and Underlying EBITDAX
+2%
$5m
For
per
sona
l use
onl
y

Production growth and Roma North ramp-up
6
Ramp-up in line with expectations;
initial workovers and optimisation activities
Production uplift
from lower inlet
pressureStart of
commissioning
• Production uplift in Q4 from gas compressor station commissioning, reducing inlet pressure
• Improved well performance evident from past optimisation activities
• Water production plateauing and showing signs of decline
• Daily production exceeded 8 TJ late in Q4 FY19
• New wells to be brought online in Q1 FY20
• Drilling program to increase production to 16 TJ/day (~6 PJ/year) by end of FY21 (exit rate)
Daily gas production (TJ) Cumulative gas production (PJ) Daily water production
FY19 full year results 20 August 2019
Full year production up 43% to 1.2 mmboe, underpinned by Roma North
Roma North gas production to 30 June 2019
For
per
sona
l use
onl
y
7
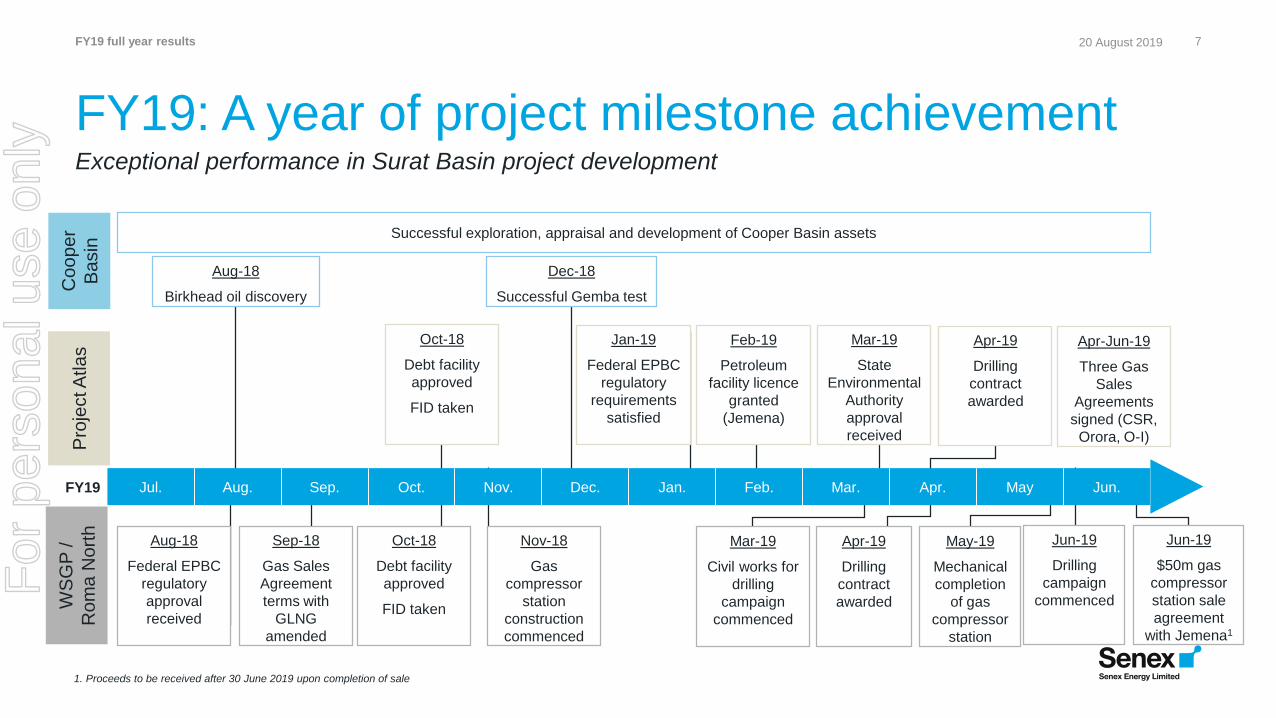
Exceptional performance in Surat Basin project development
FY19: A year of project milestone achievement
Jul. Aug. Sep. Oct. Nov. Dec. Jan. Feb. Mar. Apr. May Jun.
Pro
ject A
tla
sW
SG
P /
Ro
ma
No
rth
FY19
Aug-18
Federal EPBC
regulatory
approval
received
Sep-18
Gas Sales
Agreement
terms with
GLNG
amended
Oct-18
Debt facility
approved
FID taken
Jun-19
Drilling
campaign
commenced
Feb-19
Petroleum
facility licence
granted
(Jemena)
Nov-18
Gas
compressor
station
construction
commenced
Jan-19
Federal EPBC
regulatory
requirements
satisfied
Apr-19
Drilling
contract
awarded
Oct-18
Debt facility
approved
FID taken
Mar-19
State
Environmental
Authority
approval
received
Mar-19
Civil works for
drilling
campaign
commenced
Co
op
er
Ba
sin
Successful exploration, appraisal and development of Cooper Basin assets
Dec-18
Successful Gemba test
Aug-18
Birkhead oil discovery
May-19
Mechanical
completion
of gas
compressor
station
Jun-19
$50m gas
compressor
station sale
agreement
with Jemena1
Apr-19
Drilling
contract
awarded
Apr-Jun-19
Three Gas
Sales
Agreements
signed (CSR,
Orora, O-I)
FY19 full year results 20 August 2019
1. Proceeds to be received after 30 June 2019 upon completion of sale
For
per
sona
l use
onl
y

Construction in the field progressing rapidly
8
Roma North Project Atlas
1Roma North gas compressor
station
2, 3Separation and compression
equipment
4Separation and compression
equipment, with piles for expansion
5 Well pad and pipeline route
6 Drilling in Roma North
7Project Atlas separation and
compression equipment
8Project Atlas gas compressor
station
9 Gas export pipeline being laid
1 2 7
3
965
84
FY19 full year results 20 August 2019F
or p
erso
nal u
se o
nly

Project Atlas gas sales agreements signed
9
33% 33% 33% 33% 33% 33%
22% 21% 21% 20% 15%9%
45% 45% 45% 47% 52%58%
FY20 FY21 FY22 FY23 FY24 FY25 FY26 FY27
Roma North contracted gas Project Atlas contracted gas Project Atlas gas available for contracting
Gas production
ramp-up
~18 PJ/year initial plateau production (pre-expansion opportunities)
• Initial Project Atlas gas contracts signed with CSR, Orora and O-I
• Project Atlas volumes to diversify portfolio of gas sales arrangements
• Customer mix
• Tenors
• Pricing / terms
• Uncontracted / spot volumes
• Roma North volumes contracted to GLNG on oil-linked pricing
Negotiations ongoing with material volumes still to be contracted
FY19 full year results 20 August 2019F
or p
erso
nal u
se o
nly

10
Active and successful drilling campaigns
• Breguet 1 and Snatcher North 1 discoveries
• Northeast extension of the Growler field confirmed
• High initial production rates from Growler 16 and 17 horizontal development wells
Well Qtr Type Tenement Result
Cooper Basin (Senex 60% and operator) – All wells part of free carried campaign
Breguet 1 Q1 Oil Exploration Ex-PEL 104 On production
Growler Northeast 1 Q1 Oil appraisal Ex-PEL 104 Met all appraisal objectives
Snatcher North 1 Q1 Oil Exploration Ex-PEL 111 On production
Growler 16 Q2 Oil Development - Hz Ex-PEL 104 On production
Huey 1 Q2 Oil exploration Ex-PEL 111 P&A
Avenger 1 Q2 Oil exploration Ex-PEL 111 P&A
Flanker 1 Q2 Oil exploration Ex-PEL 111 P&A
Voodoo 1 Q2 Oil exploration Ex-PEL 111 P&A
Growler 17 Q3 Oil Development - Hz Ex-PEL 104 On production
Roma North (Senex 100% and operator)
Glenora 30 Q4 Gas development PL 1022 Awaiting connection
Glenora 31 Q4 Gas development PL 1022 Awaiting connection
Glenora 32 Q4 Gas development PL 1022 Awaiting connection
Glenora 33 Q4 Gas development PL 1022 Awaiting connection
Other Western Surat Acreage (Senex 100% and operator)
Dione 10 Q1 Gas appraisal ATP 767 Successful appraisal; future producer
Indy East 1 Q1 Gas appraisal ATP 771 Successful appraisal
Carnarvon 5 Q1 Gas appraisal ATP 771 Successful appraisal
Indy West 1 Q2 Gas appraisal ATP 771 Successful appraisal
Orallo South 3 Q2 Gas appraisal ATP 771 Successful appraisal
FY19 full year results 20 August 2019
Exploration, appraisal and development drilling successes across acreage positions
• Start of ~110-well drilling campaign across Roma North and Project Atlas
• Dione 10 commitment well cased and suspended as a future producer
• Other commitment wells met objectives
For
per
sona
l use
onl
y

Award of Artemis domestic gas block
11
• 153sq km block (Project Artemis)
• Close to existing infrastructure and located 11km south of Miles and adjacent to Condabri (operated by APLNG)
• Exploration tenure with an initial six-year term and a committed work program over first four years
• Minimal capital expenditure required over first two years
• Three wells to be drilled in FY22-23
• Subject to an Australian Market Supply Condition (as per Project Atlas)
• Builds on Senex’s existing ~1,800sq km of valuable acreage in the Surat Basin
FY19 full year results 20 August 2019
Award recognises Senex’s gas development capabilities
For
per
sona
l use
onl
y

Operational and financial results
20 August 2019FY19 full year results 12F
or p
erso
nal u
se o
nly
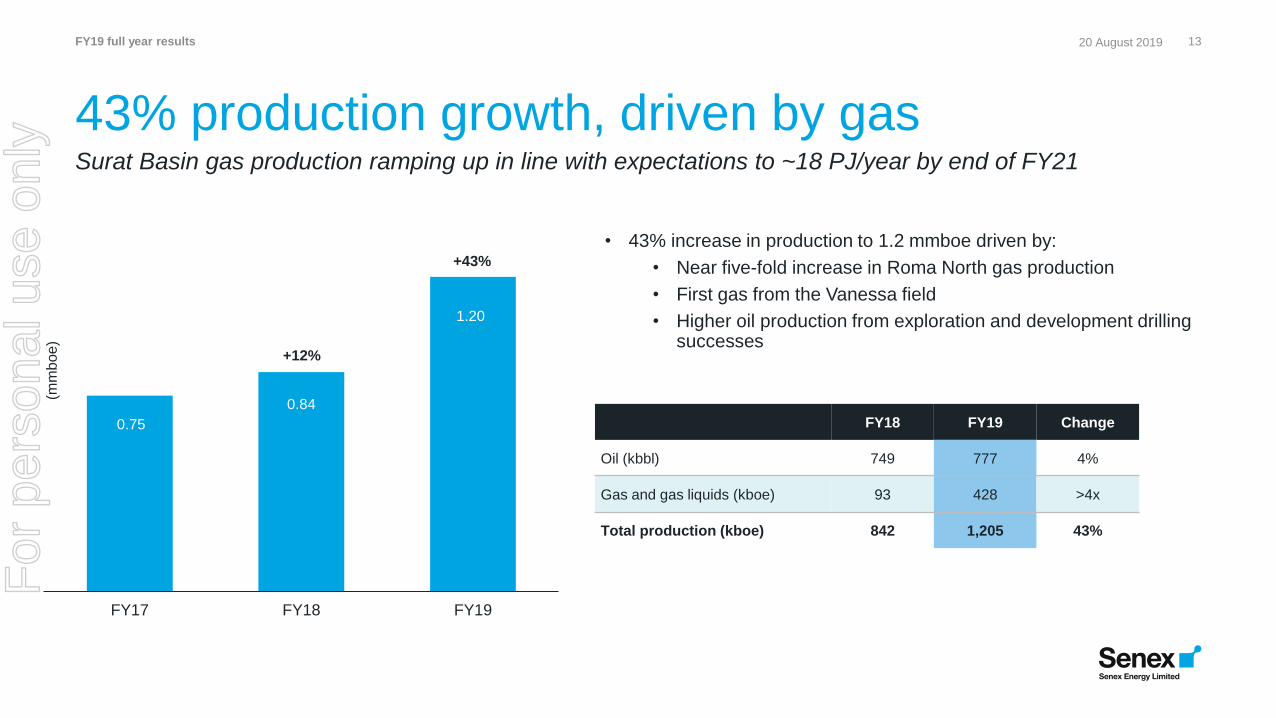
• 43% increase in production to 1.2 mmboe driven by:
• Near five-fold increase in Roma North gas production
• First gas from the Vanessa field
• Higher oil production from exploration and development drilling successes
13
43% production growth, driven by gas
FY18 FY19 Change
Oil (kbbl) 749 777 4%
Gas and gas liquids (kboe) 93 428 >4x
Total production (kboe) 842 1,205 43%
FY17 FY18 FY19
1.20
(mm
boe
)
0.75
0.84
+43%
FY19 full year results 20 August 2019
Surat Basin gas production ramping up in line with expectations to ~18 PJ/year by end of FY21
+12%
For
per
sona
l use
onl
y
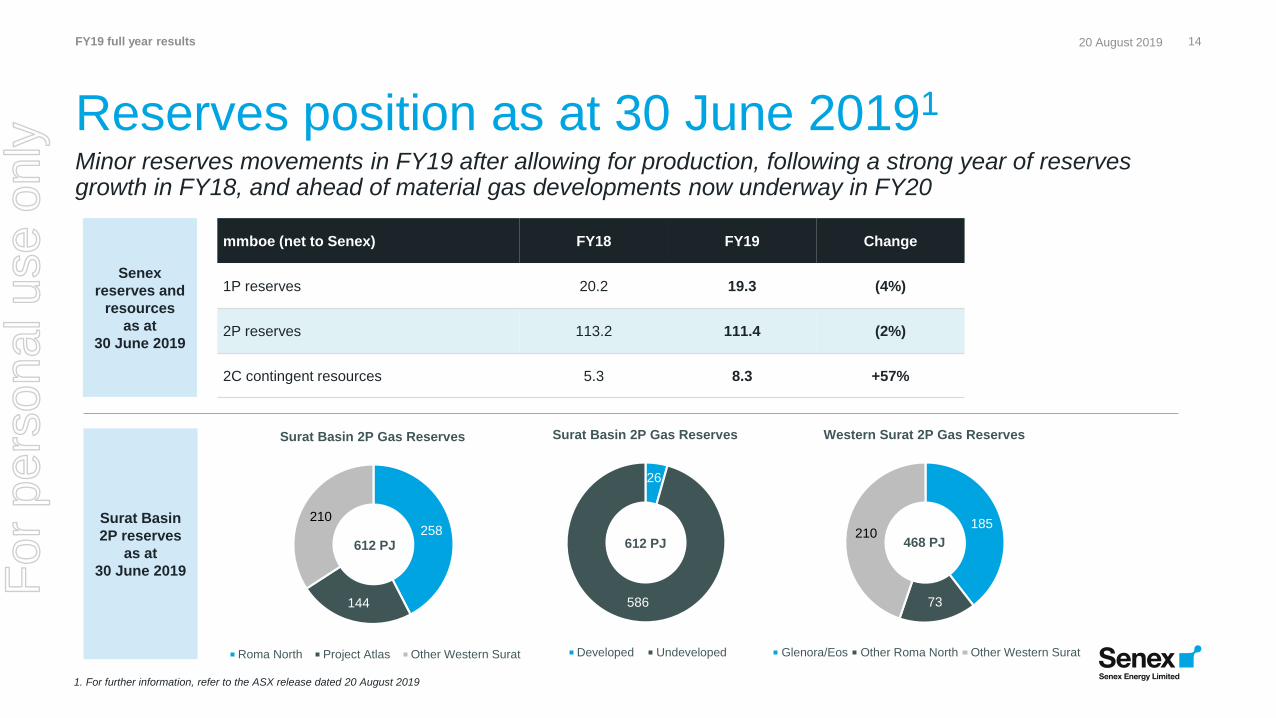
26
586
Surat Basin 2P Gas Reserves
Developed Undeveloped
14
Reserves position as at 30 June 20191
FY19 full year results 20 August 2019
Minor reserves movements in FY19 after allowing for production, following a strong year of reserves growth in FY18, and ahead of material gas developments now underway in FY20
258
144
210
Surat Basin 2P Gas Reserves
Roma North Project Atlas Other Western Surat
185
73
210
Western Surat 2P Gas Reserves
Glenora/Eos Other Roma North Other Western Surat
mmboe (net to Senex) FY18 FY19 Change
1P reserves 20.2 19.3 (4%)
2P reserves 113.2 111.4 (2%)
2C contingent resources 5.3 8.3 +57%
612 PJ 612 PJ 468 PJ
Surat Basin
2P reserves
as at
30 June 2019
Senex
reserves and
resources
as at
30 June 2019
1. For further information, refer to the ASX release dated 20 August 2019
For
per
sona
l use
onl
y

15
Results show earnings and cashflow trajectory
FY18 FY19 Change
Production (kboe) 842 1,205 43%
Sales volumes (kboe) 785 1,156 47%
Average realised oil price ($ per bbl) 95 101 6%
Average realised sales price ($ per boe) 89 81 (9%)
Sales revenue ($ million) 70.3 94.1 34%
Oil operating cost ex royalties ($/bbl produced) 28.6 29.3 2%
EBITDAX ($ million)1 43.4 42.3 (3%)
Underlying EBITDAX ($ million)1 26.1 39.0 49%
Underlying margin 37% 41% 11%
Statutory NPAT ($ million) (94.0) 3.3 >100%
Underlying NPAT ($ million) 2.0 7.2 >100%
Operating cashflow ($ million) 5.3 44.5 >100%
Capital expenditure (gross, $million) 80.1 127.8 60%
Capital expenditure (net to Senex, $ million) 80.1 109.3 36%
Net cash ($ million) 66.5 12.7 (81%)
Strong growth in earnings and cashflow demonstrates inherent leverage to higher production
• Strong earnings and cashflow growth underpinned by higher sales volumes and proven low-cost operating model
• Sales revenue up 34% to $94.1 million (FY18: $70.3 million)
• Operating cashflow up materially to $44.5 million (FY18: $5.3 million)
• Underlying EBITDAX margin expansion supported by stable oil operating costs and higher production, partly offset by a higher proportion of gas in the sales mix
• Higher capital expenditure from active Surat Basin project execution
• Net cash of $12.7 million with $75 million of undrawn debt and strong free cashflow to fund growth projects
FY19 full year results 20 August 2019
1. Refer to slide 16 for reconciliation of Statutory NPAT to EBITDAX and Underlying EBITDAX
For
per
sona
l use
onl
y

• Underlying EBITDAX up 49% to $39.0 million
• Statutory EBITDAX broadly flat
• Gain of $5.4 million recorded in FY19 (FY18: $16.9 million) on termination and transfer of the Beach free carry commitment to western flank oil assets
• Increased exploration expense due to greater Cooper Basin drilling activity
• Exploration treated for accounting purposes on a Successful Efforts basis
• Higher depreciation and amortisation in line with higher production
• Statutory NPAT significantly improved; no impairments recorded (FY18: $113.3 million)
• Significant improvement in Underlying NPAT to $7.2 million (FY18: $2.0 million)
16
Reconciliation of EBITDAX and NPAT
FY19 full year results 20 August 2019
Statutory and Underlying NPAT growth consistent with strong operating performance
$ million FY18 FY19 Change
Underlying EBITDAX 26.1 39.0 49%
(Loss) / gain on sale of exploration assets 0.4 -
Restructuring expense - (2.1)
Gain on Beach transaction 16.9 5.4
EBITDAX 43.4 42.3 (3%)
Exploration expense (3.2) (11.3)
Non-cash exploration asset impairment (113.3) -
Depreciation and amortisation (20.6) (26.8)
Net finance costs (0.4) (0.9)
Statutory NPAT (94.0) 3.3 >100%
Non-cash exploration asset impairment 113.3 -
Loss / (gain) on sale of exploration assets (0.4) -
Restructuring expense - 2.1
Net impact of Beach transaction1 (16.9) 1.8
Underlying NPAT 2.0 7.2 >100%
1. As announced on 16 April 2018, Senex and Beach agreed the transfer of up to $43 million (gross) of free carry commitment from the joint venture’s unconventional gas project to the Cooper Basin western
flank oil assets. A gain of $5.4 million (FY18: $16.9 million) was offset by $7.2 million of exploration related expenditure arising from the transaction
For
per
sona
l use
onl
y

17
Reconciliation of Underlying NPAT
• Sales revenue unit price lower due to more gas in the sales mix
• Higher cost of sales and associated costs (including royalties and D&A) with higher production; disproportionate unit fixed costs for Surat Basin gas production during ramp-up phase
• Exploration expense excludes $7.2 million from activity associated with the Beach free carry work program (refer slide 16)
FY19 full year results 20 August 2019
2.0
7.2
32.9
2.7
(9.1)
(20.4)(0.9)
(10)
(5)
-
5
10
15
20
25
30
FY18 UnderlyingNPAT
Sales Revenue -Price
Sales Revenue -Volume
Cost of Sales Exploration expense Other Underlying NPAT
$ million
For
per
sona
l use
onl
y

18
Reconciliation of cash
111.4
62.766.5
110.2
50.0
75.0
(42.8)
(17.3)(5.2)
(70.7)
(16.3) (4.4)(7.3)
0
20
40
60
80
100
120
140
160
180
Opening cash1 Jul 2018
Salesrevenue
Operatingcosts
Corporatecosts
Other Cash beforeinvesting and
financing
Surat BasinCapex
Cooper BasinCapex (net to
Senex)
Other Capex Financingcosts
Proceeds fromDebt Facility
Closing cash30 Jun 2019
$ million
Undrawn
debt
FY19 full year results 20 August 2019
• Robust liquidity comprising $63 million cash reserves and $75 million undrawn under $125 million Facility A limit1
• Cash capital expenditure of $91.4 million (as presented above) comprised Surat Basin ($70.7 million), Cooper Basin ($16.3 million) and other ($4.4 million)
• Reported capital expenditure of $109.3 million (including accruals) comprised Surat Basin ($84.6 million), Cooper Basin ($19.4 million) and other ($5.3 million)
1. Total debt facility of $150 million, comprising $125 million Facility A limit and $25 million Facility B limit; refer announcement of 29 October 2018 for further information
For
per
sona
l use
onl
y
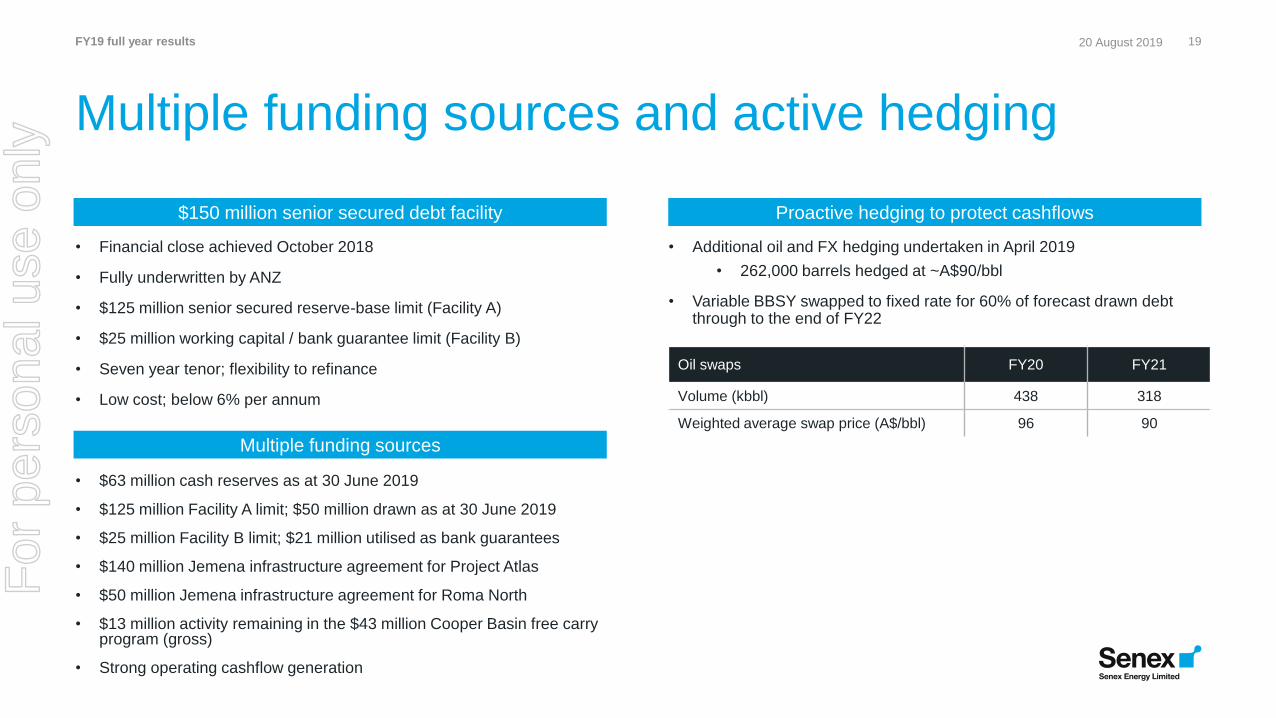
• Financial close achieved October 2018
• Fully underwritten by ANZ
• $125 million senior secured reserve-base limit (Facility A)
• $25 million working capital / bank guarantee limit (Facility B)
• Seven year tenor; flexibility to refinance
• Low cost; below 6% per annum
19
Multiple funding sources and active hedging
$150 million senior secured debt facility Proactive hedging to protect cashflows
Multiple funding sources
• Additional oil and FX hedging undertaken in April 2019
• 262,000 barrels hedged at ~A$90/bbl
• Variable BBSY swapped to fixed rate for 60% of forecast drawn debt through to the end of FY22
• $63 million cash reserves as at 30 June 2019
• $125 million Facility A limit; $50 million drawn as at 30 June 2019
• $25 million Facility B limit; $21 million utilised as bank guarantees
• $140 million Jemena infrastructure agreement for Project Atlas
• $50 million Jemena infrastructure agreement for Roma North
• $13 million activity remaining in the $43 million Cooper Basin free carry program (gross)
• Strong operating cashflow generation
Oil swaps FY20 FY21
Volume (kbbl) 438 318
Weighted average swap price (A$/bbl) 96 90
FY19 full year results 20 August 2019F
or p
erso
nal u
se o
nly
20 August 2019FY19 full year results 20
Transformation in motion
For
per
sona
l use
onl
y
21
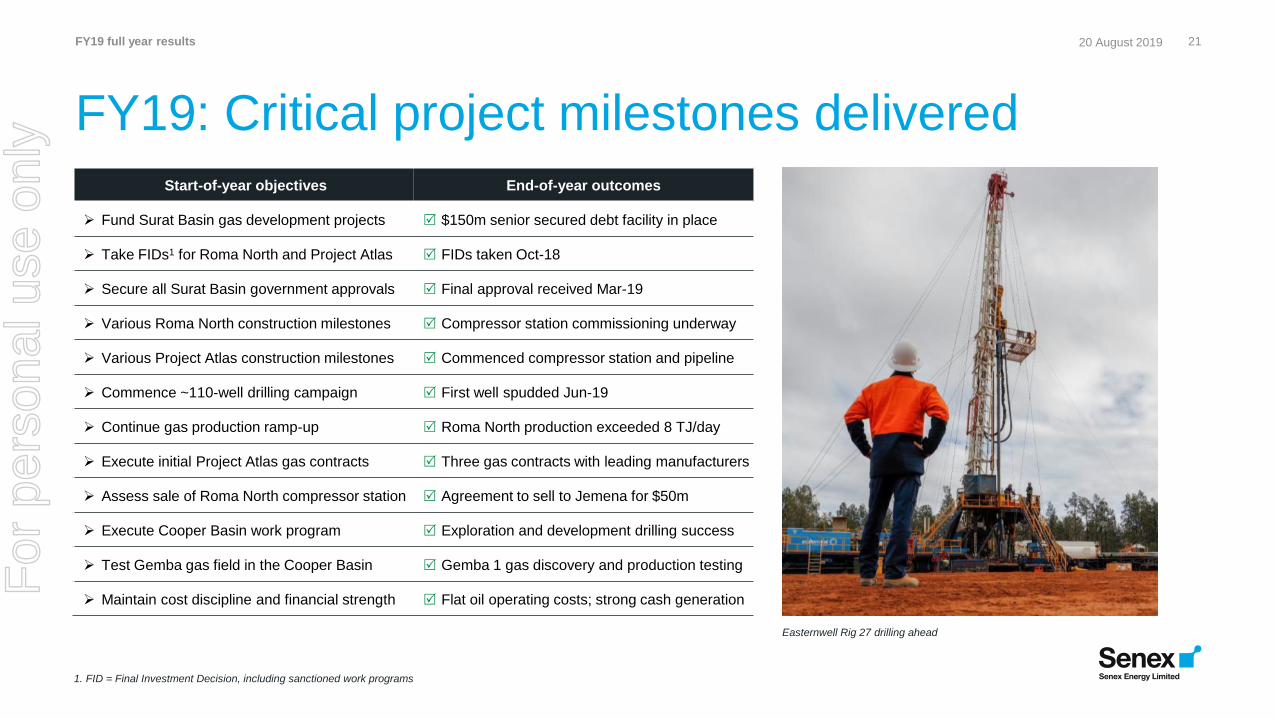
FY19: Critical project milestones delivered
Start-of-year objectives End-of-year outcomes
➢ Fund Surat Basin gas development projects $150m senior secured debt facility in place
➢ Take FIDs1 for Roma North and Project Atlas FIDs taken Oct-18
➢ Secure all Surat Basin government approvals Final approval received Mar-19
➢ Various Roma North construction milestones Compressor station commissioning underway
➢ Various Project Atlas construction milestones Commenced compressor station and pipeline
➢ Commence ~110-well drilling campaign First well spudded Jun-19
➢ Continue gas production ramp-up Roma North production exceeded 8 TJ/day
➢ Execute initial Project Atlas gas contracts Three gas contracts with leading manufacturers
➢ Assess sale of Roma North compressor station Agreement to sell to Jemena for $50m
➢ Execute Cooper Basin work program Exploration and development drilling success
➢ Test Gemba gas field in the Cooper Basin Gemba 1 gas discovery and production testing
➢ Maintain cost discipline and financial strength Flat oil operating costs; strong cash generation
FY19 full year results 20 August 2019
1. FID = Final Investment Decision, including sanctioned work programs
Easternwell Rig 27 drilling ahead
For
per
sona
l use
onl
y
22
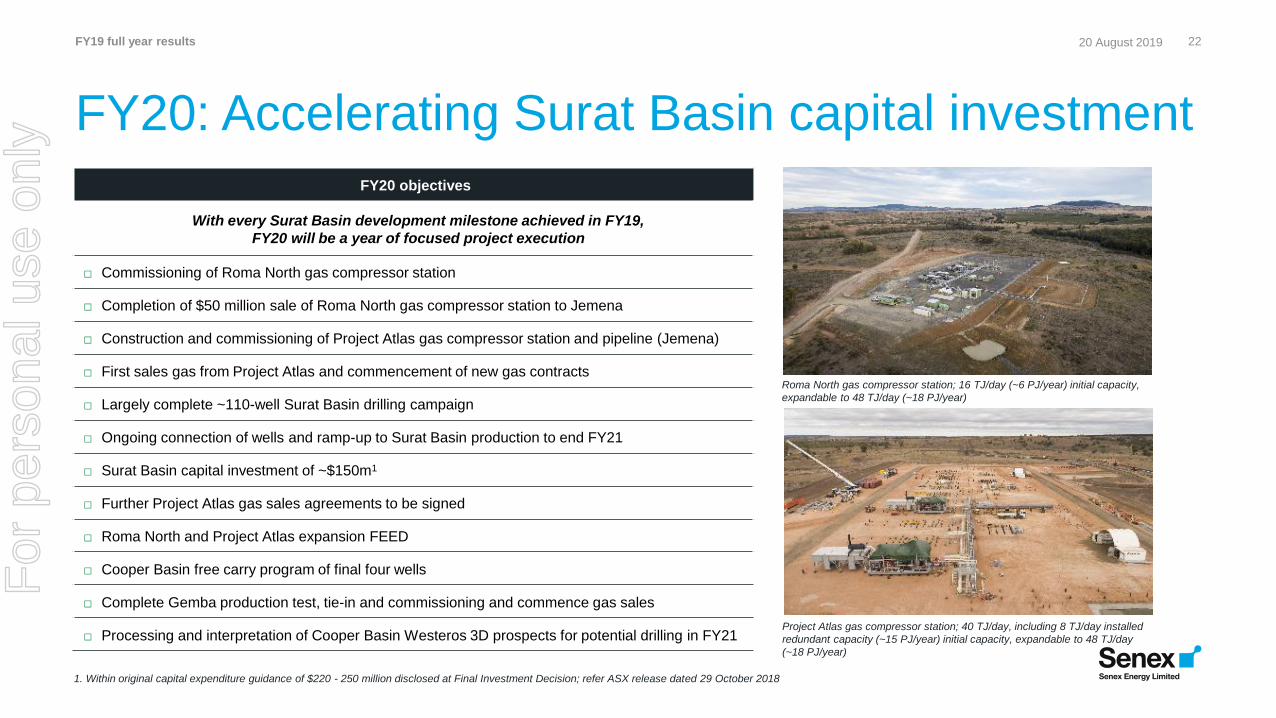
FY20: Accelerating Surat Basin capital investment
FY20 objectives
With every Surat Basin development milestone achieved in FY19,
FY20 will be a year of focused project execution
□ Commissioning of Roma North gas compressor station
□ Completion of $50 million sale of Roma North gas compressor station to Jemena
□ Construction and commissioning of Project Atlas gas compressor station and pipeline (Jemena)
□ First sales gas from Project Atlas and commencement of new gas contracts
□ Largely complete ~110-well Surat Basin drilling campaign
□ Ongoing connection of wells and ramp-up to Surat Basin production to end FY21
□ Surat Basin capital investment of ~$150m1
□ Further Project Atlas gas sales agreements to be signed
□ Roma North and Project Atlas expansion FEED
□ Cooper Basin free carry program of final four wells
□ Complete Gemba production test, tie-in and commissioning and commence gas sales
□ Processing and interpretation of Cooper Basin Westeros 3D prospects for potential drilling in FY21
FY19 full year results 20 August 2019
Project Atlas gas compressor station; 40 TJ/day, including 8 TJ/day installed
redundant capacity (~15 PJ/year) initial capacity, expandable to 48 TJ/day
(~18 PJ/year)
Roma North gas compressor station; 16 TJ/day (~6 PJ/year) initial capacity,
expandable to 48 TJ/day (~18 PJ/year)
1. Within original capital expenditure guidance of $220 - 250 million disclosed at Final Investment Decision; refer ASX release dated 29 October 2018
For
per
sona
l use
onl
y

FY21: Gas production target exit rate of ~18 PJ/year
23
0.1 0.4
3.0
FY17 FY18 FY19 End-FY21
(mm
boe
)
Surat Basin production at
initial facility capacities
- 16 TJ/day at Roma North
- 32 TJ/day at Project Atlas
- Total ~18 PJ/year
(~3.0 mmboe), with
significant expansion
potential
Senex Surat Basin
gas productionProduction target
1. FY21 target exit flow rate of 48 TJ/day
1
FY19 full year results 20 August 2019
Project execution
of transformational
Surat Basin gas projects
For
per
sona
l use
onl
y
Senex’s gas transformation is underway
✓ Material de-risking of Surat Basin gas development projects achieved
✓ ~110 well drilling campaign largely completed in FY20
✓ 56 TJ/day of gas processing capacity (~20 PJ/year) to be commissioned by end 2019
✓ Rapid rise in production, cashflow and earnings from FY21
✓ Rapid production expansion potential beyond initial investment
✓ Continue cash generation from Cooper Basin assets with good growth potential
2422 May 2019FY19 full year resultsF
or p
erso
nal u
se o
nly
Appendix
20 August 2019 25FY19 full year resultsF
or p
erso
nal u
se o
nly

Valuable Surat Basin gas acreage
26
✓ A prolific gas producing region with over 4,000 wells drilled
✓ Infrastructure connections to east coast and southern markets
✓ Project Atlas provides a near-term solution to increase east coast gas supply
✓ Material 2P reserves position (as at 30 June 2019)
• Project Atlas – 144 PJ
• Roma North – 258 PJ
• Other Western Surat Acreage – 210 PJ
✓ Future development of the broader Western Surat Acreage and Senex’s new gas block, Artemis, provide longer-term supply options
Gas supply to east
coast and southern
markets
Darling Downs Pipeline
(>200 TJ/d)
Comet Ridge to
Wallumbilla Pipeline
(GLNG) (~950 TJ/d)
FY19 full year results 20 August 2019F
or p
erso
nal u
se o
nly

• Final Investment Decision taken; work program sanctioned
• All regulatory approvals received for field development
• Well lease pad construction underway with 23 now complete
• Jemena gas compressor station progressing on schedule
• Civil works materially complete; gas processing skids delivered and installed; pipeline construction underway
• Gas sales agreements signed for supply of up to 24 PJ
27
Project Atlas overview
FY19 achievements
• Start of drilling campaign (commenced Q1 FY20)
• Complete construction and commissioning of gas compressor station
• Ongoing connection of wells and start of gas production ramp-up to 32 TJ/day (~12 PJ/year) by the end of FY21
• Complete initial ~60-well drilling program
• Sign additional domestic gas sales agreements
Project snapshot
• Top-tier resource adjoining
highly productive acreage
• 58sq km acreage
(100% Senex)
• 144 PJ of 2P reserves as
at 30 June 2019
• Domestic market obligation
• ~60-well initial drilling
campaign; over 100 wells
in total
• 32TJ/day gas compressor
station plus 8 TJ/day
redundant capacity
• 60km pipeline to Darling
Downs Pipeline allowing
access to Wallumbilla Hub
Gas compressor station commissioning and first sales gas by end of 2019
FY19 full year results 20 August 2019
FY19 achievements
FY20 catalysts
For
per
sona
l use
onl
y

• Final Investment Decision taken; work program sanctioned
• GSA amended with GLNG allowing optimal field development
• Mechanical completion and commissioning of compressor station
• Gas production exceeded 8 TJ/day and continues to ramp
• Drilling commenced early June, 10 of ~50-wells drilled
• Agreement for $50m sale of gas compressor station to Jemena
• Tolling agreement with 21 year term and 10 year option
• Provisions for low cost expansion to 24 TJ/day at Senex’s
option; design capacity at site of 48 TJ/day by end of FY21
• Capacity-based toll based on agreed production profile
28
Roma North / WSGP overview
• Complete commissioning of gas compressor station
• Complete sale of gas compressor station to Jemena; receive $50m cash consideration
• Significant progress on ~50-well drilling campaign
• Continue gas production ramp-up to 16 TJ/day (~6 PJ/year) by
the end of FY21
Project snapshot
• 839sq km total acreage
(100% Senex)
• 397 PJ total 2P reserves
as at 30 June 2019
• 20-year JCC-linked GSA
with GLNG
• Roma North is the initial
WSGP development area
• ~50-well drilling campaign
underway; approval for
425 wells
• Initial 16 TJ/day gas
compressor station, rapidly
expandable at low cost
• 5km pipeline to existing
GLNG infrastructure
Production ramping to initial processing capacity of 16 TJ/day (~6 PJ/year)
FY19 full year results 20 August 2019
FY19 achievements
FY20 catalysts
For
per
sona
l use
onl
y

• Seven-stage hydraulic fracturing undertaken in Q2 FY19
• Flow rates of ~8 mmscfd recorded on test; 44 mscf of gas and 88 barrels of oil recovered
• Preliminary interpretation of results indicated 15 Bcf pre-drill estimate may be exceeded
• Gas flow from the Dulingari group indicated a potential new play
• Well brought online for production testing in Q1 FY20
• Targeting first gas sales by end of 2019
29
Cooper Basin gas
Gemba 1 testing
Gemba 1 testing
• Vanessa gas field brought online in H1 FY19
• Gas being sold to Pelican Point Power Ltd
• Gas Sales Agreement extended in H1 FY19 with increased gas and liquids pricing
FY19 full year results 20 August 2019
A significant gas discovery at Gemba 1
Gemba 1 gas discovery
Vanessa gas field online
For
per
sona
l use
onl
y

• Full year oil production up 4% to 777 kbbl
• Oil operating costs kept broadly flat at $29/bbl
• Breguet-1 and Snatcher North-1 discoveries
• Growler-16 and Growler-17 horizontal drilling success
• Westeros 3D seismic survey acquired and processed
30
Cooper Basin oil
Production from the Cooper Basin
Drilling in the Cooper Basin
• Complete free carry program with Beach of up to four wells
• Interpret Westeros 3D seismic survey to identify prospects for potential drilling in FY21
• Ongoing focus on cost control and portfolio optimisation
FY19 full year results 20 August 2019
Exploration and horizontal development drilling successes
FY19 achievements
Upcoming activity
For
per
sona
l use
onl
y

Glossary
$ Australian dollars
ATP Authority to Prospect - granted under the Petroleum Act 1923
(Qld) or the Petroleum Gas (Production and Safety) Act 2004 (Qld)
bbl Barrels - the standard unit of measurement for all oil and
condensate production. One barrel = 159 litres or 35 imperial gallons
Bcf Billion cubic feet
Beach Beach Energy Ltd
boe Barrels of oil equivalent - the volume of hydrocarbons expressed
in terms of the volume of oil which would contain an equivalent
volume of energy
bopd Barrels of oil per day
C&S Cased and suspended
EPBC Environment Protection and Biodiversity Conservation Act
FID Final investment decision
FY Financial year
GJ Gigajoule
GLNG Gladstone Liquified Natural Gas, a JV between Santos, PETRONAS,
Total and KOGAS
GSA Gas sales agreement
JV Joint venture
H1 / H2 First / second half of financial year
kbbl Thousand barrels of oil
kboe Thousand barrels of oil equivalent
LTI Lost time injury
mmboe Million barrels of oil equivalent
mmbbl Million barrels of oil
mscfd Thousand standard cubic feet of gas per day
mmscfd Million standard cubic feet of gas per day
P&A Plugged and abandoned
PEL Petroleum Exploration Licence granted under the Petroleum and
Geothermal Energy Act 2000 (SA)
PJ Petajoule
PJ/year Petajoules per annum
PL Petroleum Lease granted under the Petroleum Act 1923 (Qld) or
the Petroleum Gas (Production and Safety) Act 2004 (Qld)
PPL Petroleum production licence granted under the Petroleum and
Geothermal Energy Act 2000 (SA)
PRL Petroleum retention licence granted under the Petroleum and
Geothermal Energy Act 2000 (SA)
Q, Qtr Quarter
RFDS Royal Flying Doctor Service
SACB JV South Australia Cooper Basin JV, which involves Santos (as operator)
and Beach
Senex Senex Energy Ltd
TJ Terajoule
TJ/day Terajoules per day
TRIFR Total recordable injury frequency rate (per million hours worked)
Underlying- Earnings before interest, tax, depreciation, amortisation, evaluation,
EBITDAX exploration expenses, impairment adjustments and restructuring
Underlying- Underlying net profit after tax excludes the impacts of asset
NPAT acquisitions, disposals and impairments, as well as items that are
subject to significant variability from one period to the next, including
the Beach Energy transaction and restructuring
WSGP Western Surat Gas Project
YTD Year to date
31FY19 full year results 20 August 2019F
or p
erso
nal u
se o
nly
Disclaimer
Important information
This presentation has been prepared by Senex Energy Limited (Senex). It is current
as at the date of this presentation. It contains information in a summary form and
should be read in conjunction with Senex’s other periodic and continuous disclosure
announcements to the Australian Securities Exchange (ASX) available at:
www.asx.com.au. Distribution of this presentation outside Australia may be restricted
by law. Recipients of this document in a jurisdiction other than Australia should
observe any restrictions in that jurisdiction. This presentation (or any part of it) may
only be reproduced or published with Senex’s prior written consent.
Risk and assumptions
An investment in Senex shares is subject to known and unknown risks, many of which
are beyond the control of Senex. In considering an investment in Senex shares,
investors should have regard to (amongst other things) the risks outlined in this
presentation and in other disclosures and announcements made by Senex to the ASX.
Refer to the 2018 Annual Report for a summary of the key risks faced by Senex. This
presentation contains statements (including forward-looking statements), opinions,
projections, forecasts and other material, based on various assumptions. Those
assumptions may or may not prove to be correct. All forward-looking statements
involve known and unknown risks, assumptions and uncertainties, many of which are
beyond Senex’s control. There can be no assurance that actual outcomes will not differ
materially from those stated or implied by these forward-looking statements, and
investors are cautioned not to place undue weight on such forward-looking statements.
No investment advice
The information contained in this presentation does not take into account the
investment objectives, financial situation or particular needs of any recipient and is not
financial advice or financial product advice. Before making an investment decision,
recipients of this presentation should consider their own needs and situation, satisfy
themselves as to the accuracy of all information contained herein and, if necessary,
seek independent professional advice.
Disclaimer
To the extent permitted by law, Senex, its directors, officers, employees, agents,
advisers and any person named in this presentation:
• give no warranty, representation or guarantee as to the accuracy or likelihood of
fulfilment of any assumptions upon which any part of this presentation is based or
the accuracy, completeness or reliability of the information contained in this
presentation; and
• accept no responsibility for any loss, claim, damages, costs or expenses arising out
of, or in connection with, the information contained in this presentation.
32FY19 full year results 20 August 2019F
or p
erso
nal u
se o
nly
Notes to the annual reserves statement
Senex prepares its petroleum reserves and contingent resources estimates in
accordance with the Petroleum Resources Management System published by the
Society of Petroleum Engineers (SPE PRMS 2018). Unless otherwise stated, all
references to reserves and resources in this statement relate to Senex’s economic
interest in those reserves and resources.
All estimates of petroleum reserves reported by Senex are prepared by, or under
the supervision of, a qualified petroleum reserves and resources evaluator. To
ensure the integrity and reliability of data used in the reserves estimation process,
the raw data is reviewed and quality controlled by senior professional production,
reservoir, petrophysical and geological staff at Senex. Access to the substantiated
data is then restricted to authorised staff members. During each petroleum
reserves review, this data is updated, analysed and checked against the previous
year’s data.
This reserves and resources statement is based on, and fairly represents,
information and supporting documentation prepared by, or under the supervision
of, a qualified petroleum reserves and resources evaluator, Mr David Spring BSc
(Hons). Mr Spring (Head of Exploration) is a member of the Society of Petroleum
Engineers and a full-time employee of Senex and has approved this statement as a
whole and has provided written consent to the form and context in which the
estimated reserves, resources and supporting information are presented.
External assessment and evaluation date
Senex engaged the services of DeGolyer and MacNaughton (D&M) and
Netherland Sewell Associates (NSAI) to independently assess the data and assess
reserves and resources prior to Senex reporting any updated estimates. D&M and
NSAI are independent resource estimating firms with considerable experience in
the Cooper Basin and the Surat Basin, respectively.
Senex reviews and updates its oil and gas reserves position on an annual basis
and reports the updated estimates as of 30 June each year.
Calculation methods, factors, ratios and reference points
Petroleum reserves and contingent resources are aggregated by arithmetic
summation by category. The arithmetic method does not account for ‘portfolio
effects’. The deterministic method was used to prepare the estimates of reserves,
and the probabilistic method was used to prepare the estimates of resources in this
statement.
In converting petajoules to million barrels of oil equivalent, Senex has applied the
following conversion rates: Surat Basin gas: 1 mmboe = 5.880 PJ, Cooper Basin
gas: 1 mmboe = 5.815 PJ.
The reference point for the Cooper Basin is the central processing plant at
Moomba, South Australia. Fuel, flare and vent consumed to the reference point are
included in reserves estimates (c. 6% of 2P oil reserves estimates may be
consumed as fuel in operations depending on operational requirements). For the
Surat Basin, the reference point is the Wallumbilla gas hub, Queensland. Fuel,
flare and vent consumed to the reference point are excluded from reserves
estimates (c. 10% of 2P gas reserves estimates have been assumed to be
consumed as fuel in operations).
Standard engineering and geoscience methods, or a combination of methods,
including volumetric analysis, analogy, and reservoir modelling, were used. Much
of these reserves are for undeveloped locations and are based on estimates of
reservoir volumes and recovery efficiencies along with analogy of properties with
similar geologic and reservoir characteristics.
33FY19 full year results 20 August 2019F
or p
erso
nal u
se o
nly

34
Level 30, 180 Ann Street
Brisbane, Queensland, 4000 Australia
(07) 3335 9000 www.senexenergy.com.au
Investor Enquiries
Ian DaviesManaging Director and CEO
(07) 3335 9000
Derek PiperSenior Advisor - Investor Relations
(07) 3335 9000
FY19 full year results 20 August 2019F
or p
erso
nal u
se o
nly