Embed Size (px)
Citation preview

ABN 86 125 049 550
Annual Report
For the year ended 30 June 2016
For
per
sona
l use
onl
y

CORPORATE DIRECTORY
ABN 86 125 049 550
Directors
Seamus Cornelius (Non-Executive Chairman)
Eamon Hannon (Managing Director)
Anthony Maslin (Non-Executive Director)
Feng Xue (Non-Executive Director)
Chief Executive Officer
Eamon Hannon
Company Secretary
Sam Wright
Registered Office
Suite 1, First Floor
14 – 16 Rowland Street
SUBIACO WA 6008
Principal Place of Business
Suite 1, First Floor
14 – 16 Rowland Street
SUBIACO WA 6008
Telephone: +61 8 9380 6063
Facsimile: +61 8 9381 4056
Postal Address
PO Box 9028
SUBIACO WA 6008
Solicitors
Fairweather Corporate Lawyers
595 Stirling Highway
Cottesloe, Western Australia 6011
Share Register
Computershare Investor Services Pty Limited Level 2, 45 St George’s Terrace
Perth, Western Australia 6000
Telephone: +61 8 9323 2000
Auditors
Rothsay Chartered Accountants
Level 1, Lincoln Building
4 Ventnor Avenue
WEST PERTH WA 6005
Stock Exchange
Australian Securities Exchange
Level 40 Central Park
152 – 158 St Gorges Terrace
Perth, Western Australia 6000
ASX code: BUX
Website Address
www.buxtonresources.com.au
@BuxtonResources
For
per
sona
l use
onl
y

CONTENTS
Letter from the Chairman 4
Review of Operations 5
Directors’ Report 24
Auditors’ Independence Declaration 38
Corporate Governance Statement 39
Statement of Profit or Loss and Other Comprehensive Income 40
Statement of Financial Position 41
Statement of Changes in Equity 42
Statement of Cash Flows 43
Notes to the Financial Statements 44
Directors’ Declaration 58
Independent Audit Report 59
ASX Additional Information 61
Location of Buxton’s exploration projects.
For
per
sona
l use
onl
y

4
Letter from the Chairman
Dear Fellow Shareholder,
On behalf of the Board it is once again my pleasure to thank you for your support over the past year. The financial year ended 30 June 2016 was another volatile year in equity and commodity markets across the globe. Despite the volatility your company enters the 2016/2017 year in a strong position. I suggest you read the Annual Report as it contains much useful information and detail on your company’s activities over the financial year just ended. Buxton is led by our Managing Director, Eamon Hannon, and the entire team including all directors, employees, consultants and advisors is working towards building shareholder wealth through successful exploration and project development. We work as a team and are conscious of the Company's responsibilities to all shareholders. I believe that we have a Board and group of consultants who have the knowledge, breadth of experience and determination to fulfil the objectives of the Company. The company is well funded and has a tight capital structure which should mean shareholders are well placed to increase their wealth should the company have exploration success. Buxton has several projects with upside potential, through which we will try to realise value for shareholders. The success of Buxton Resources Limited has been and continues to be a team effort and I take this opportunity to thank my fellow directors, geology team and our corporate advisors for their efforts and contribution to Buxton Resources Limited. I also take this opportunity to thank our shareholders and investors for their support of the Company. As Chairman, I am committed to building our shareholder wealth in the Company through the diligent focus on our objectives within a culture of strong corporate governance, integrity and the protection of the interests of our shareholders. As a small listed exploration company we are focussed on exploring for commercial mineral deposits. The majority of the company’s time, effort and expenditure will be applied to this endeavour. Successful exploration leads to real wealth creation for shareholders and that after all is why we are all shareholders. I look forward with enthusiasm to the year ahead and the development of the Company as it fulfils its objectives.
Seamus Cornelius
Non-Executive Chairman
For
per
sona
l use
onl
y

5
REVIEW OF OPERATIONS
Double Magic Ni & Cu – West Kimberley
During the year, Buxton announced that final assay results were received for both diamond core holes sampled as part of Phase 2 drill program at the Double Magic Ni-Cu Project (location in Figure 9). Three separate targets have now returned drillhole intercepts >3% Ni, with results of up to 8.14% Ni in diamond drill core (see Table 1 & 2 below).
The Double Magic Project has been confirmed by drilling as hosting better than economic Ni-Cu grades and thicknesses, marking a historic turning point for mineral exploration in the West Kimberley. Five months after entering the region, Buxton has become the first explorer to detect high grade magmatic sulphides in the Ruins Dolerite, confirming the genetic model, exploration vectors, and potential of the project area to host significant nickel-copper deposits. This success is despite more than 50 years of exploration by other parties, validating Buxton’s acquisition of the Double Magic project in late April 2015.
Importantly, all geophysical targets (conductors) drill tested to date have proven to be related to nickel-copper sulphide mineralisation, with no false conductors identified.
Summarising achievements to date, Eamon Hannon, Buxton’s CEO said: “Buxton can certainly be pleased with, and proud of, the significant advancements the small team has made at the Double Magic project in the past 12 months. Over this short period of time, the company has proven for the first time the existence of thick and high grade nickel and copper mineralisation within the Ruins Dolerite.”
“Buxton has the first mover advantage in what we now consider exceptionally prospective ground, in one of the world’s best jurisdictions for exploration.”
“The company has immediate follow up drilling targets at Conductors B, C and D and in addition numerous high priority new targets in previously unexplored areas.”
The Buxton team returned to Double Magic for Phase 3 exploration in 2016 targeting significant nickel-copper accumulations. The exploration team collected thorough and detailed geological data sets including structural, geochemical, geophysical and lithological information. With data collection ongoing, Buxton looks forward to releasing findings and interpretations to the market once works and assays are completed.
In-depth Review of Exploration Results
An in-depth review of results from the Merlin Prospect, incorporating structural data from core, full 3D analysis of geology, and a review of geophysical data, has revealed multiple additional drill targets at and around Conductors D, C and A-B.
Regionally, analysis of finalised VTEM results from the aerial survey flown in October (~55km2), combined with data from the regional heli-mapping completed in August, has identified 8 high priority targets within large volumes of completely un-explored Ruins Dolerite to the east (Fireant Prospect). The targets have primarily been identified by strong VTEM conductors which appear much longer and/or larger in area than any previously seen in the region.
Assay Results
Final assays have been received for both the diamond core holes samples sampled, DMDD0003 at Conductor C and DMDD0004 at Conductor D. Samples are of HQ3 quarter core, 1 metre in length or less as determined by geological logging. Core from the holes drilled as twins of DMRC0003 and DMRC0017 (DMDD0001 and DMDD0002) is being retained intact for ongoing technical.
Assay results have confirmed previously-reported visual assessment of core. Several different styles and types of mineralisation have been confirmed with varying levels and ratios of the main sulphides pyrrhotite, pentlandite, and chalcopyprite. Grades of up to 8.14% Ni have been intersected in core. See Figures 1, 2 and 3 for a section and plan of Conductor D, and a plan of the central area of the Double Magic Project.
See Figures 4 and 5 for core photographs of high-grade mineralisation at Conductors D and C.
A full listing of all >0.25% and >1% Ni intercepts from the two diamond core holes is provided below in Table 1. All Buxton’s RC drilling results were previously reported on 2nd November 2015. A summary of high grade >3% Ni
For
per
sona
l use
onl
y

6
intersections from all Buxton drilling (RC and diamond core) is provided below in Table 2. Full spatial detail for all Buxton’s drillholes is provided in Table 3.
The company reminds readers that mineralised intercepts reported are not to be considered as true thicknesses. At Conductor D, the interpreted general geometry of mineralisation indicates that true thickness of the 17 metre high-grade intersection in discovery hole DMRC0003, is probably around 6-8 metres. True thicknesses elsewhere at Merlin are likely to be between 40% and 100% of the drillhole intersection length. Note that massive sulphide geometries in particular can be very irregular to amorphous, making true thickness estimates difficult.
Table 1: Significant (>0.25% Ni) intersections for all Buxton diamond core drillholes sampled. Intersects and sub-intersects >1% Ni highlighted in bold font.
Table 2: >3% Ni intersections from all Buxton drilling at Double Magic. These are high-grade highlights from RC drilling results previously reported, and high-grade highlights from the diamond core results reported in Table 1 above.
For
per
sona
l use
onl
y
7
Interpretative Comments
An interpretation of mineralisation geometry and genesis at the Merlin Prospect (Double Magic Project) has been developed incorporating all new data collected during the recently completed 2015 field season.
Nickel-copper sulphide mineralisation is interpreted to occur both as primary magmatic accumulations in the original mafic-ultramafic melt, and as structurally remobilised and/or enriched veins or pods. Buxton is the first explorer to detect high grade magmatic sulphides in the Ruins Dolerite of the West Kimberley, confirming the genetic model, exploration vectors, and potential of the project to host significant deposits.
At Conductor D, the high grades, textural characteristics, overall geometry of mineralisation, litho-geochemistry, and juxtaposition of differing rock types suggest that mineralisation represents a primary accumulation of sulphides proximal to a feeder conduit. The feeder conduit or related structural feature was then subsequently stoped out by the later, barren, highly magnetic dolerite dyke identified during mapping in August. Several such dykes have been mapped in the area, generally between 10 and 30 metres thick, dipping approximately at right angles to the interpreted original Ruins Dolerite sill orientation.
Some limited remobilisation of sulphides has also occurred at Conductor D, possibly during later regional tectonism.
Figure 1 – Schematic cross-section of Conductor D, showing selected drillholes, summarised Ni/Cu assay results, interpreted geology, and interpreted mineralisation extents. Section line below in Figure 2.
For
per
sona
l use
onl
y
8
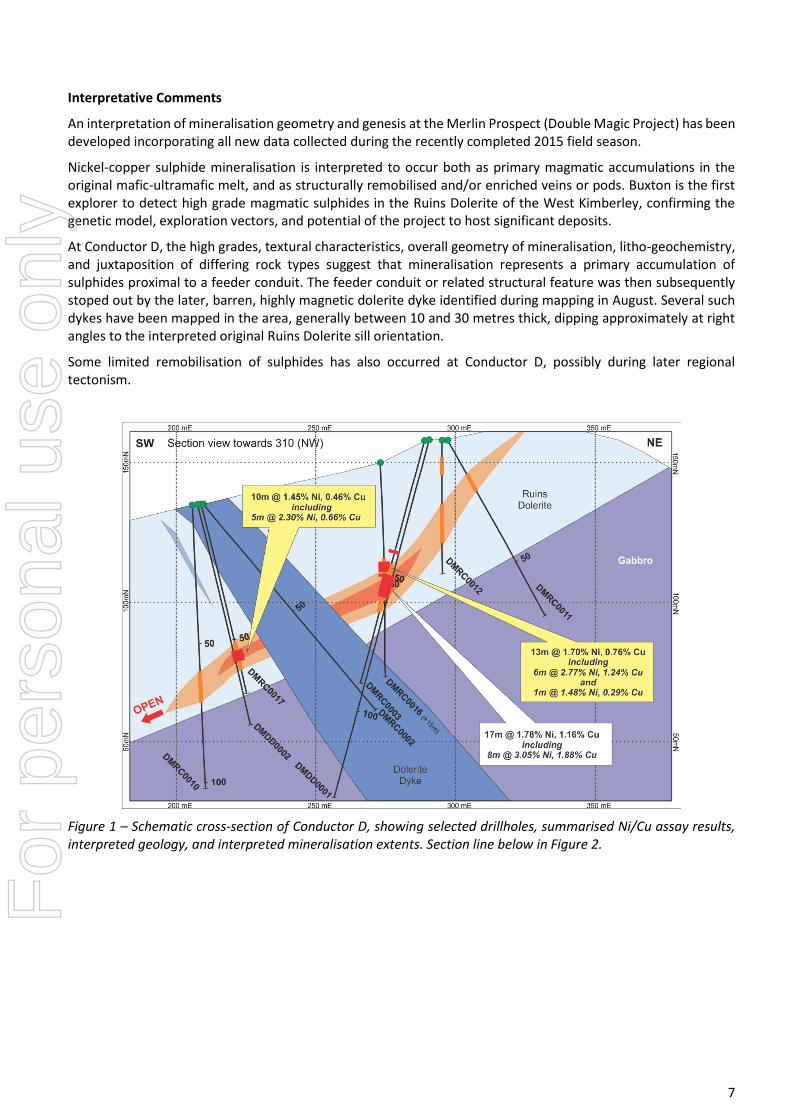
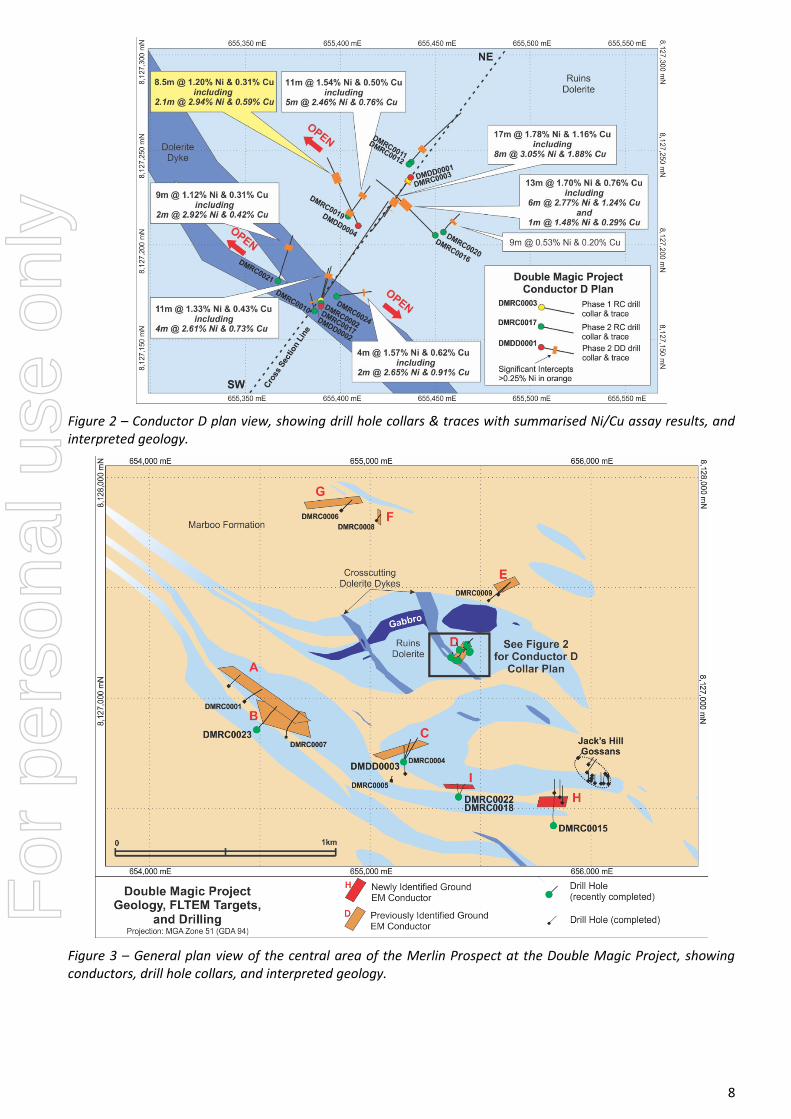
Figure 2 – Conductor D plan view, showing drill hole collars & traces with summarised Ni/Cu assay results, and interpreted geology.
Figure 3 – General plan view of the central area of the Merlin Prospect at the Double Magic Project, showing conductors, drill hole collars, and interpreted geology.
For
per
sona
l use
onl
y

9
Mineralisation seen at Conductors A, B, C, H and I (as well as at Jack’s Hill) exhibits much greater structural influence, particularly where higher grades occur. However, the enveloping low-grade disseminated sulphide zones may represent primary mineralisation, albeit much more distal from any feeder conduit than Conductor D.
Figure 4 – Close up core photo of massive sulphide intercept in DMDD0003 at Conductor C. Interval (0.2m downhole) assayed 6.35% Ni. Note core is HQ3, with a diameter of ~61.1mm.
Figure 5 – Close up core photo of irregular top contact of massive sulphide vein in DMDD0004 at Conductor D. Interval (0.5m downhole) assayed 8.14% Ni. Note core is HQ3, with a diameter of ~61.1mm.
Detailed review of ground and aerial geophysical results in conjunction with geological and structural interpretations indicate substantial un-tested potential exists at Conductors D, A-B, and possibly C. High grade mineralisation at Conductor D itself remains open along strike in both directions to the north-west and south-east, as well as down-plunge to the south-west.
The potential for additional separate, fault-dislocated high-grade pods, particularly to the west of Conductor D and/or at depth, is also considered to be excellent. Fault displacements of between 20 to 200m are documented at Panoramic Resources’ Sally Malay deposit in the East Kimberley (Savannah Operations), considered the most relevant model for mineralisation at Double Magic and Merlin. These faults are often low-angle (flat) and therefore difficult to detect with geophysical methods. Several un-explained diffuse VTEM anomalies exist at interpreted structural intersections, these may indicate the presence of deeper, fault-displaced conductors which have yet to be drill-tested.
Geophysics
Processing and evaluation of geophysical data has been completed. These datasets include the down-hole TEM
logging of 15 selected drillholes, the high power large fixed loop TEM survey, and the regional heli-borne
VTEMmax survey over the balance of Buxton’s tenements, coverage as depicted in Figure 6 below.
Preliminary DHTEM and FLTEM results were fully utilized during the field season to target drill holes. Finalisation
of data processing, interpretation and full reporting of these surveys has now further assisted Buxton during
development of mineralization and exploration models for Double Magic.
For
per
sona
l use
onl
y

10
The 2015 VTEM survey completed over previously un-explored ground numerous long, large and strong VTEM
anomalies at the Fireant Propsect. The anomalies correspond with areas mapped as Ruins Dolerite approximately
10-15km to the east of the Merlin Prospect which has been the focus of exploration up until now.
Additionally, many smaller discrete VTEM anomalies have also been identified of similar or larger size to those
initially identifying Conductors A-B and D in 2013. Ground follow-up during 2016 has included more detailed
geological mapping, rock-chip sampling and ground geochemical traverses.
Recent fieldwork has uncovered graphitic sediments that correspond with one of the large electromagnetic
responses from the 2015 VTEM survey. The voluminous Ruins dolerite that occurs in the Fireant Prospect part of
the Double Magic tenement package remains prospective for Ni-Cu mineralisation but the electrically conductive
graphitic sediments of the Marboo formation in this area could mask the response of a Ni-Cu sulphide body. Work
at the Fireant Prospect is progressing and on-going at this time.
The 2015 VTEM survey was flown on north-south, 100 metre spaced flight lines, identical with the 2013 survey
specifications. Refer to Figures 6, 7 & 8 for survey coverage areas and locations of areas of interest.
Figure 6 – Map of Buxton’s Double Magic tenement package, showing tenements, prospect areas, survey coverage
from previous (2013) and new (2015) VTEM surveys and boxes showing the extent of Figures 7 and 8.
For
per
sona
l use
onl
y

11
Figure 7 – Map of Buxton’s 2015 field season area of focus at the Merlin Prospect, highlighting Conductors A-D
(all now known to be related to Ni-Cu mineralisation), over a merged image of the 2013 & 2015 VTEM survey data
(latest VTEM channel - CH48BZ).
Figure 8 – Map of Buxton’s new Fireant prospect, showing 8 new priority VTEM anomalies to be followed up as
soon as weather permits, over an image of the 2015 VTEM survey data (latest VTEM channel - CH48BZ).
For
per
sona
l use
onl
y

12
Table 3 – Buxton’s completed drilling at the Merlin Prospect, Double Magic Project. Coordinates are MGA Zone 51 (GDA94)
For
per
sona
l use
onl
y
13
REVIEW OF OPERATIONS (CONTINUED)
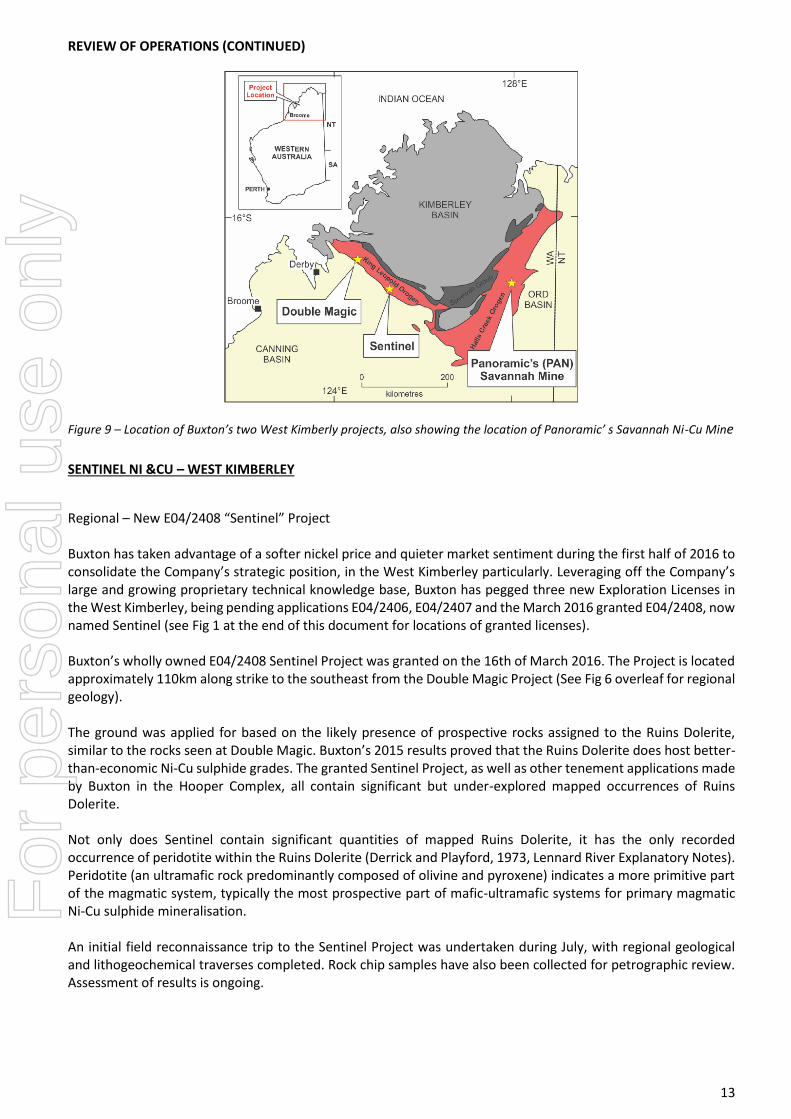
Figure 9 – Location of Buxton’s two West Kimberly projects, also showing the location of Panoramic’ s Savannah Ni-Cu Mine
SENTINEL NI &CU – WEST KIMBERLEY
Regional – New E04/2408 “Sentinel” Project Buxton has taken advantage of a softer nickel price and quieter market sentiment during the first half of 2016 to consolidate the Company’s strategic position, in the West Kimberley particularly. Leveraging off the Company’s large and growing proprietary technical knowledge base, Buxton has pegged three new Exploration Licenses in the West Kimberley, being pending applications E04/2406, E04/2407 and the March 2016 granted E04/2408, now named Sentinel (see Fig 1 at the end of this document for locations of granted licenses). Buxton’s wholly owned E04/2408 Sentinel Project was granted on the 16th of March 2016. The Project is located approximately 110km along strike to the southeast from the Double Magic Project (See Fig 6 overleaf for regional geology). The ground was applied for based on the likely presence of prospective rocks assigned to the Ruins Dolerite, similar to the rocks seen at Double Magic. Buxton’s 2015 results proved that the Ruins Dolerite does host better-than-economic Ni-Cu sulphide grades. The granted Sentinel Project, as well as other tenement applications made by Buxton in the Hooper Complex, all contain significant but under-explored mapped occurrences of Ruins Dolerite. Not only does Sentinel contain significant quantities of mapped Ruins Dolerite, it has the only recorded occurrence of peridotite within the Ruins Dolerite (Derrick and Playford, 1973, Lennard River Explanatory Notes). Peridotite (an ultramafic rock predominantly composed of olivine and pyroxene) indicates a more primitive part of the magmatic system, typically the most prospective part of mafic-ultramafic systems for primary magmatic Ni-Cu sulphide mineralisation. An initial field reconnaissance trip to the Sentinel Project was undertaken during July, with regional geological and lithogeochemical traverses completed. Rock chip samples have also been collected for petrographic review. Assessment of results is ongoing.
For
per
sona
l use
onl
y

14
REVIEW OF OPERATIONS (CONTINUED)
YALBRA GRAPHITE PROJECT
E09/1985 Yalbra, E09/2101 Olsen Well (100% Buxton) &, E09/1972 Coordewandy (90% Buxton)
The Yalbra Graphite Project is located 250km North West of Meekatharra and 280km East of Carnarvon, Western Australia, and covers an area of 37km2. The Yalbra Graphite Project has a significant preliminary global Exploration Target of 8-12 Million Tonnes @ 7 - 11% TGC (total graphitic carbon)*. * The potential quality and grade of the Yalbra Exploration Target is conceptual in nature. There has been insufficient exploration to define a Mineral Resource and it is uncertain if further exploration will result in the determination of a Mineral Resource. Buxton reported initial flotation and acid purification test-work results for its high-grade Yalbra Graphite Project in Western Australia. Flotation batch test results from a representative fresh rock diamond drill sample grading 20.0% C(t) returned a concentrate grade of 91% C(t). This concentrate showed a good proportion of medium to coarse flake material with 30% falling into categories above +149 microns in size (Table 1). The overall recovery of graphite was 80%, although this should be improved in future locked cycle tests. The process involved a primary grind, a rougher flotation stage, 2 stages of polishing grind and 5 cleaner flotation stages. A final leaching stage using a combined H2SO4/HF solution to upgrade the concentrate was also completed and showed that a final concentrate grading 99.5% C(t) could be achieved, with the coarser size fractions grading as high as 99.7% C(t). Yalbra is Australia’s highest reported grade graphite resource at 4.0Mt @ 16.2% TGC (Inferred) and has considerable potential to be expanded along strike, and for discovery of additional resources. Additionally, Buxton has shown commercial products can be produced from its very high grade Yalbra Graphite Project. As such, the Company is now in a position to seek a development and/or offtake partner to assist in commercialising the project.
Table 1. Flotation and purification results for the Yalbra Graphite Project.
Size Size Assays Assays Distribution
Flotation Conc. Purified Conc.
Microns (µm) Tyler Mesh C (t) % C (t) % C (t) %
+297 µm +48 mesh 91.8 99.7 6.6
+149 µm +100 mesh 90.6 99.7 22.8
+74 µm +200 mesh 90.0 99.5 31.2
-74 µm -200 mesh 91.7 99.1 39.5
Weighted Avg. 90.9 99.5 100.0
For
per
sona
l use
onl
y

15
REVIEW OF OPERATIONS (CONTINUED) DEMPSTER
Dempster E63/1720, E63/1595 (100% Buxton) & E63/1582 (90% Buxton
Buxton holds a significant ground position totalling 728km2 prospective for nickel-copper and gold deposits at Dempster within the Albany Fraser Orogen. This project straddles the interpreted boundary of the Archaean Yilgarn Craton and the Proterozoic Albany Fraser Orogen and has a similar tectonic position to the Tropicana Gold Deposit. In addition, historical work at the Dempster Project has identified significant nickel surface calcrete anomalies. One of these, the Prickle prospect, was drilled and shown to be underlain by a mafic-ultramafic rock package including gabbros and dunites. Peak results were 0.25% Ni and 348ppm Cu, indicating potential fertile source rocks for nickel-copper sulphide mineralisation. Historical BHP drilling also intersected 1m @ 0.7 ppm Au at the base of a RAB drill hole. Exploration work by other exploration companies in the area has defined a number of high quality Ni-Cu sulphide targets immediately along strike from Buxton’s tenements. The Company is excited about the potential at Dempster.
For
per
sona
l use
onl
y

16
Figure 10. Location of the Company’s Dempster tenements over interpreted bedrock geology
For
per
sona
l use
onl
y

17
REVIEW OF OPERATIONS (CONTINUED) NORTHAMPTON BASE METALS PROJECT (100% BUXTON) E66/87, E66/88, & E66/92
The Northampton project area is located 477km North of Perth, along the Northwest Coastal Highway between Geraldton (in the South) and Ajana (in the North). The Northampton project area consists of three granted tenements, E66/87, E66/88 and E66/92 for a total area of 985 km2 (Figure 11). The main target commodities in this project are Cu, Pb, Zn, Ag and Au. The principal target style is structurally controlled polymetallic sulphide veins and pods.
The Northampton area has been explored and mined since the early 1800s, with mining commencing in 1842. The majority of production has been centred on the towns of Northampton and Pindadanno in the Galena area.
Recorded historic production from all mines was approximately 77,000t of lead, 4,300t of copper, 42t of zinc, and 210kg of silver. Mining concentrated predominantly on lead and copper; zinc ore was discarded and ignored in exploration due to its low value at the time.
Most of the more recent (1970’s to present) exploration in the area has involved detailed sampling and drilling around known abandoned mines, looking for extensions either at depth or along strike. The deepest historic mine development in the area was to 150m although greater than 60% of the mines did not go below 50m suggesting some potential may remain below this depth at existing mines
All of the deposits found historically have outcropped at the surface. Little is documented on the exploration for “blind” ore deposits. The scarcity of outcrop in the area indicates that there is excellent potential for “blind” deposits.
Buxton’s principal focus at the Northampton Project will be to target new base metal targets in areas of thin Silurian to Permian cover along with recent cover. Many of these areas are surrounded by historic mines with mineralisation controlling structure having indicated continuity beneath the cover in aeromagnetic data. This provides a high level of encouragement that obscured mineralised positions are likely to be present.
The potential development of a deep water port at Oakajee adds additional upside to development of any discoveries made in the area as does the proximity to services and a ready labour supply in the Geraldton to Northampton region.
Buxton’s 2016 field season commenced with a field trip to BUX’s wholly owned, contiguous and large tenement holding in at Northampton. Follow up rock chip sampling for potential REE mineralisation failed to produce any significant results.
For
per
sona
l use
onl
y

18
REVIEW OF OPERATIONS (CONTINUED)
F
or p
erso
nal u
se o
nly

19
Figure 11. Map of the Company’s Northampton tenements over regional geology.
For
per
sona
l use
onl
y

20
REVIEW OF OPERATIONS (CONTINUED)
BUXTON & INDEPENDENCE GROUP ENTER INTO FRASER RANGE JOINT VENTURE
On 24 August 2016, Buxton announced that it has entered into a joint venture agreement with Independence Group NL (ASX: IGO) in respect of its Zanthus (E28/1959) and Widowmaker (E28/2201) tenements (the Tenements) located in the Fraser Range, Western Australia (Figure 12).
Figure 12: Location of the Tenements in the Fraser Range, Western Australia
Buxton’s Managing Director, Mr Eamon Hannon said “The formation of this joint venture in the Fraser Range with Independence Group is a great result for Buxton shareholders. Buxton will receive $1.5 million in cash and be free carried on all expenditure until a Decision to Mine is made on the Tenements – at which point Buxton will have a 10% interest in possibly a world-class nickel deposit. We are excited about the potential upside from this joint venture. The Fraser Range is a highly prospective ground package, however requires the significant financial resources of a leading diversified mining house like Independence Group to undertake aggressive exploration campaigns.
For
per
sona
l use
onl
y

21
REVIEW OF OPERATIONS (CONTINUED) The joint venture will enable Buxton to achieve considerable cost and administrative savings and help fast-track its highly promising flagship Double Magic Project in the Kimberley region of Western Australia.” Under the terms of the joint venture agreement, Buxton grants to IGO the sole and exclusive right to acquire a 90% interest in the Tenements by IGO immediately paying $1.5 million in cash. Buxton will maintain a 10% interest in the Tenements. Buxton and IGO will associate in an unincorporated joint venture for the purpose of exploring, and if warranted, developing and mining the Tenements in relation to all minerals other than iron ore. Buxton shall be free-carried by IGO until such time as a Decision to Mine is made in respect of the Tenements. At this point, Buxton may elect to either participate in development by contributing capital pro-rata based on its JV interest, have its remaining 10% interest purchased by IGO for market value, or dilute to a Net Smelter Return Royalty (NSR). The parties agree that IGO will grant to Buxton the exclusive right to explore and develop iron ore on the Tenements. The terms of such an exclusive right are to be finalised in a formal agreement to be entered into at the same time as the formal exploration joint venture agreement is completed. Buxton’s 100% owned Zanthus Magnetite Project is located on the Tenements and contains an Initial Inferred JORC Resource of 103.6Mt at 26.5% Fe, with good potential to expand the resource. The Zanthus Ni-Cu Project is located approximately 60km along strike from IGO’s Nova Ni-Cu-Co Project in the emerging Fraser Range Nickel Province, Western Australia. The project covers an area of 367km2. Gravity data was gathered over an area of 137km2 of the potential gneiss units interpreted as being similar to those that host "the Eye" mafic - ultramafic intrusive that contains the Nova-Bollinger deposit. Buxton’s Widowmaker Project is also located in the Fraser Range and covers an area of approximately 225km2. The Fraser Range Nickel Province is host to a number of significant discoveries, most notably IGO’s Nova Project with Buxton’s Widowmaker Project located 22km along strike. Approximately 15km of strike length of the favourable lithological host-rock package is interpreted to underlie the Widowmaker Project with multiple, significant Ni, Cu and PGE anomalies identified in a historical calcrete soil sampling database.
For
per
sona
l use
onl
y
22
REVIEW OF OPERATIONS (CONTINUED)
COMPETENT PERSONS STATEMENT
The information in this report that relates to exploration results and geology for the Double Magic Project previously reported under the 2012 edition of the Australasian Code for Reporting of Exploration Results, Mineral Resources and Ore Reserves based on information compiled by Mr Rolf Forster, Member of the Australasian Institute of Mining and Metallurgy, and Mr Derek Marshall, Member of the Australian Institute of Geoscientists. Mr Forster is an independent consultant to Buxton Resources Limited and Mr Marshall is a full-time employee. Mr Forster and Mr Marshall have sufficient experience which is relevant to activity being undertaken to qualify as a “competent person”, as defined in the 2012 edition of the Joint Ore Reserves Committee (JORC) Australasian Code for Reporting of Exploration Results, Mineral Resources and Ore Reserves. Mr Forster and Mr Marshall consent to the inclusion in this report of the matters based on the information in the form and context in which it appears. The information in this report that relates to exploration results and geology for the Yalbra and Zanthus projects is based on information previously reported under the 2012 edition of the Australasian Code for Reporting of Exploration Results, Mineral Resources and Ore Reserves based on information compiled and/or reviewed by Mr Eamon Hannon, Fellow of the Australian Institute of Geoscientists and Managing Director of Buxton Resources Limited. No material changes have occurred to this information. Mr Hannon has sufficient experience which is relevant to the activity being undertaken to qualify as a “Competent Person”, as defined in the 2012 edition of the Australasian Code for Reporting of Exploration Results, Mineral Resources and Ore Reserves and consents to the inclusion in this report of the matters reviewed by him in the form and context in which they appear. The information in this report that relates to in-situ Mineral Resources is based on information compiled by David Williams of CSA Global Pty Ltd and previously reported 25/2/2014. David Williams is a Member of the Australasian Institute of Mining and Metallurgy, and a Member of the Australian Institute of Geoscientists and has sufficient experience, which is relevant to the style of mineralisation and type of deposit under consideration, and to the activity he has undertaken, to qualify as a Competent Person in terms of the ‘Australasian Code for Reporting of Exploration Results, Mineral Resources and Ore Reserves’ (JORC Code 2012 Edition). David Williams previously consented to the inclusion of such information in the previous report in the form and context in which it appeared. There have been no material changes to the information reported in the previous report.
For
per
sona
l use
onl
y
23
REVIEW OF OPERATIONS (CONTINUED)
CORPORATE
In July 2015 the Company raised $25,000 through the issue of 250,000 shares at an issue price of 10.0 cents per share.
In August 2015 the Company raised $2,000,700 before issue costs through the issue of 10,260,000 shares at an issue price of 19.5 cents per share.
In December 2015 the Company issued 7,350,000 unlisted options to Directors, employees and consultants. The options have an exercise price of 12 cents and an expiry date of 30 November 2019.
In April 2016 the Company issued 4,000,000 unlisted options as part consideration for the acquisition of a 15% interest in the Yalbra graphite project taking Buxton’s ownership to 100%.
During the year the Company successfully applied to participate in the Federal Government’s Exploration and Development Incentive Scheme (EDI). On 30 June 2016 Buxton distributed EDI credits of $259,604.10 to eligible shareholders. Shareholders will receive the benefit pro-rata based on the number of shares held as a proportion of the total shares on issue as at 31 May 2016.
ANNUAL GENERAL MEETING
Buxton held its Annual General Meeting of Shareholders on 30 November 2015 at Steve’s Wine Cellar, 30 The Avenue, Nedlands, Western Australia and all resolutions that were put were unanimously passed on a show of hands.
For
per
sona
l use
onl
y

24
Buxton Resources Limited
Directors’ Report
Your directors submit their report for the year ended 30 June 2016.
DIRECTORS
The names of the Company's directors in office during the year and until the date of this report are as follows: Mr Seamus Cornelius - Non-Executive Chairman Mr Eamon Hannon - Managing Director (appointed 25 February 2016) Mr Anthony Maslin - Non-Executive Director Mr Feng Xue – Non –Executive Director (appointed 13 May 2016) Dr Julian Stephens - Technical Director (resigned 12 August 2015)
Mr Liu Xing Zhou - Non-Executive Director (resigned 13 May 2016)
Directors were in office for this entire period unless otherwise stated.
COMPANY SECRETARY
Mr Sam Wright
INFORMATION ON DIRECTORS
Mr Seamus Cornelius - Non-Executive Chairman Qualifications: B.Juris, LLB, LLM Mr Cornelius brings to the Board 21 years of corporate experience in both legal and commercial negotiations. Mr Cornelius has been living and working as a corporate lawyer in China for 17 years. He has been based in Shanghai and Beijing since 1993. From 2000 to 2010 he was an international partner with one of Australia’s leading law firms and specialized in dealing with cross border investments, particularly in energy and resources. Mr Cornelius has for many years advised large international companies on their investments in China and in recent years has advised Chinese state owned entities on their investments in natural resource projects outside of China including in Australia. As well as Buxton Resources Limited, Mr Cornelius is also currently the Chairman of ASX listed Duketon Mining Limited (ASX: DKM), Montezuma Mining Limited (ASX: MZM) and Danakali Limited (ASX:DNK). Mr Eamon Hannon - Managing Director (appointed 22 February 2016)
Qualifications: BSc (Geol)
Mr Hannon, a geologist and Fellow of the AusIMM, has a wealth of experience within the minerals industry from grass roots exploration through to project development., Having previously worked for Fortescue Metals Group (ASX: FMG) from early 2004 to late 2012 in the role of Director, Exploration and Evaluation, he lead the teams to delineate in excess of 10 billion tons of iron ore resources and greater than 1 billion tons of iron ore reserves. During his 20 years of experience, Mr Hannon has explored for and developed gold, base metals and industrial materials over 4 continents and more than 10 countries including Tanzania, Mexico, Mongolia, New Zealand, Sweden and Australia. He was integral to the major mining development of the Svartliden gold mine in Scandinavia. In addition, Mr Hannon was the Director for the Bankable Feasibility Study of Fortescue Metals Group’s Solomon mine. The Solomon mine at 60 million tons per annum iron ore production was the single biggest tonnage start up mine in Australia’s mining history. The feasibility was signed off for construction by the Fortescue Board with full Environmental Approval in under 18 months.
During the past 3 years Mr Hannon has not served as a director of any other listed company.
For
per
sona
l use
onl
y

25
Directors’ Report (continued) Mr Anthony Maslin - Non-Executive Director
Qualifications: B.Bus (Finance and Enterprise)
Mr Maslin was the Managing Director of Buxton Resources from December 2010 until December 2014 and brings to the Board 20 years of corporate experience in both management and promotion, along with an extensive understanding of financial markets.
In his 6 years as a stockbroker at Hartley Poynton Stockbrokers in Perth, Mr Maslin was instrumental in the capital raisings and promotion of several resource development companies. In the subsequent 7 years in his role as founding Managing Director of Solar Energy Systems Ltd (Now Solco Ltd (ASX Code: SOO)) he had significant experience in capital raisings and management of both people and projects. Mr Maslin has also worked as a corporate promotion consultant to a number of listed companies.
During the past 3 years Mr Maslin was a Non-Executive Director of ASX listed Pancontinental Oil & Gas NL (resigned 15 January 2016).
Mr Feng (Frank) Xue - Non-Executive Director (appointed 13 May 2016)
Qualifications: MBA
Mr. Xue is an experienced mining executive and entrepreneur based in Shanghai. He currently serves as one of the experts on the strategic decision committee of China CEFC Energy Company Limited and as the General Manager of Projects Management & Procurement Centre of China CEFC Energy Company Limited.
During the past 3 years Mr Xue has not served as a director of any other listed company.
Mr Liu Xing Zhou - Non-Executive Director (resigned 13 May 2016)
Qualifications: BA (Accounting), MBA, CFA, CICPA
During the past 3 years Mr Liu has not served as a director of any other listed company.
Mr Sam Wright - Company Secretary
Mr Wright is experienced in the administration of ASX listed companies, corporate governance and corporate
finance. He is a member of the Australian Institute of Company Directors, the Financial Services Institute of
Australasia, and the Chartered Secretaries of Australia.
Mr Wright is currently a Non-Executive Director and Company Secretary of ASX listed company, PharmAust
Limited. He is also Company Secretary for ASX listed companies, Buxton Resources Limited and Structural
Monitoring Systems plc. Mr Wright has also filled the role of Director and Company Secretary with a number of
unlisted companies.
Mr Wright has extensive experience in relation to public company responsibilities, including ASX and ASIC
compliance, control and implementation of corporate governance, statutory financial reporting, and
shareholder relations with both retail and institutional investors.
Mr Wright is the Managing Director of Perth-based corporate advisory firm Straight Lines Consultancy,
specialising in the provision of corporate services to public companies.
For
per
sona
l use
onl
y

26
Directors’ Report (continued)
Interests in the shares and options of the Company and related bodies corporate
As at the date of this report, the interests of the directors in the shares and options of Buxton Resources Limited were:
Ordinary shares Options over
Ordinary Shares Unlisted
Seamus Cornelius 1,415,132 2,850,000
Eamon Hannon 350,000 3,000,000
Anthony Maslin 791,197 3,900,000
Feng Xue - -
PRINCIPAL ACTIVITIES
The principal activities of the Company during the year were the acquisition of mining tenements, and the exploration and evaluation of these tenements with the objective of identifying economic mineral deposits.
DIVIDENDS
No dividends were paid or declared during the year. No recommendation for payment of dividends has been made.
For
per
sona
l use
onl
y

Buxton Resources Limited
Directors' Report continued
27
OPERATING AND FINANCIAL REVIEW
Finance Review
At the reporting date the Company has cash and other financial assets available of $1,502,221 (2015: $1,954,686). Funds are being used to actively pursue the Company’s exploration projects.
During the year total exploration expenditure incurred by the Company amounted to $1,870,382 (2015: $1,000,950). In line with the Company’s accounting policies, all exploration expenditure is written off as incurred. The operating loss after income tax for the year ended 30 June 2016 was $2,862,821 (2015: $2,525,673).
During the year the Company issued 7,350,000 unlisted options to Directors, employees and consultants. The options have an exercise price of 12 cents and an expiry date of 30 November 2019.
Operating Results for the Year
Summarised operating results are as follows:
2016
Revenues
$
Results
$
Revenues and loss from ordinary activities before income tax expense 164,706 2,857,821
Shareholder Returns
2016 2015
Basic loss per share (cents) (3.26) (3.95)
Risk Management
The board is responsible for ensuring that risks, and also opportunities, are identified on a timely basis and that activities are aligned with the risks and opportunities identified by the board.
The Company believes that it is crucial for all board members to be a part of this process, and as such the board has not established a separate risk management committee.
The board has a number of mechanisms in place to ensure that management's objectives and activities are aligned with the risks identified by the board. These include the following:
• Board approval of a strategic plan, which encompasses strategy statements designed to meet stakeholder’s needs and manage business risk.
• Implementation of board approved operating plans and budgets and board monitoring of progress against these budgets.
SIGNIFICANT CHANGES IN THE STATE OF AFFAIRS
Other than as disclosed in this Annual Report, no significant changes in the state of affairs of the Company occurred during the financial year.
For
per
sona
l use
onl
y

Buxton Resources Limited
Directors' Report continued
28
SIGNIFICANT EVENTS AFTER THE BALANCE DATE Other than what is already disclosed in the Directors’ Report, no matters or circumstances have arisen since the end of the financial year which significantly affected or may significantly affect the operations of the Company, the results of those operations, or the state of affairs of the Company in future financial years.
LIKELY DEVELOPMENTS AND EXPECTED RESULTS
The Company expects to maintain the present status and level of operations and hence there are no likely developments in the entity's operations.
ENVIRONMENTAL REGULATION AND PERFORMANCE The Company is subject to significant environmental regulation in respect to its exploration activities. The Company aims to ensure the appropriate standard of environmental care is achieved, and in doing so, that it is aware of and is in compliance with all environmental legislation. The directors of the Company are not aware of any breach of environmental legislation for the year under review. The directors have considered the National Greenhouse and Energy Reporting Act 2007 (the NGER Act) which introduces a single national reporting framework for the reporting and dissemination of information about greenhouse gas emissions, greenhouse gas projects, and energy use and production of corporations. At the current stage of development, the directors have determined that the NGER Act will have no effect on the Company for the current, nor subsequent, financial year. The directors will reassess this position as and when the need arises.
For
per
sona
l use
onl
y
Buxton Resources Limited
Directors' Report continued
29
REMUNERATION REPORT (Audited)
This report, which forms part of the directors’ report, outlines the remuneration arrangements in place for the key management personnel (“KMP”) of Buxton Resources Limited for the financial year ended 30 June 2016. The information provided in this remuneration report has been audited as required by Section 308(3C) of the Corporations Act 2001.
The remuneration report details the remuneration arrangements for KMP who are defined as those persons having authority and responsibility for planning, directing and controlling the major activities of the Company, directly or indirectly, including any director (whether executive or otherwise) of the Company.
Key Management Personnel
The directors and other key management personnel of the Company during or since the end of the financial year were:
Directors
Seamus Cornelius – Non-Executive Chairman
Eamon Hannon - Managing Director (appointed 22 February 2016)
Anthony Maslin – Non-Executive director
Feng Xue – Non-Executive Director (appointed 13 May 2016)
Liu Xing Zhou – Non-Executive director (resigned 13 May 2016)
Julian Stephens – Non-Executive director (resigned 12th August 2015)
Executive
Eamon Hannon – Chief Executive Officer (to 22 February 2016)
Except as noted, the named persons held their current positions for the whole of the financial year and since the financial year.
Principles used to determine the nature and amount of remuneration
Remuneration Policy
The remuneration policy of Buxton Resources Limited has been designed to align director and executive objectives with shareholder and business objectives by providing a fixed remuneration component and offering specific long-term incentives. The board of Buxton Resources Limited believes the remuneration policy to be appropriate and effective in its ability to attract and retain the best executives and directors to run and manage the Company.
The remuneration policy, setting the terms and conditions for the executive directors and other senior executives, was developed by the board. All executives receive a base salary (which is based on factors such as length of service and experience) and superannuation. The board reviews executive packages annually by reference to the Company’s performance, executive performance and comparable information from industry sectors and other listed companies in similar industries.
The board may exercise discretion in relation to approving incentives, bonuses and options. The policy is designed to attract the highest calibre of executives and reward them for performance that results in long-term growth in shareholder wealth.
Executives are also entitled to participate in the employee share and option arrangements.
The relevant directors and executive receive a superannuation guarantee contribution required by the government, which is currently 9.50%, and do not receive any other retirement benefits.
For
per
sona
l use
onl
y

Buxton Resources Limited
Directors' Report continued
30
REMUNERATION REPORT (Audited) (continued)
All remuneration paid to directors and executives is valued at the cost to the Company and expensed. Options are valued using the Black-Scholes methodology.
The board policy is to remunerate non-executive directors at market rates for comparable companies for time, commitment and responsibilities. The board determines payments to the non-executive directors and reviews their remuneration annually, based on market practice, duties and accountability. Independent external advice is sought when required. The maximum aggregate amount of fees that can be paid to non-executive directors is subject to approval by shareholders at the Annual General Meeting (currently $300,000). Fees for non-executive directors are not linked to the performance of the Company. However, to align directors’ interests with shareholder interests, the directors are encouraged to hold shares in the Company and are able to participate in the employee option plan.
Performance based remuneration
The Company currently has no performance based remuneration component built into director and executive remuneration packages.
Company performance, shareholder wealth and directors' and executives' remuneration
No relationship exists between shareholder wealth, director and executive remuneration and Company performance.
Details of remuneration
Details of the remuneration of the directors, the key management personnel (as defined in AASB 124 Related Party Disclosures) and specified executives of Buxton Resources Limited are set out in the following table.
The key management personnel of Buxton Resources Limited include the directors as per page 18 above.
Given the size and nature of operations of Buxton Resources Limited, there are no other employees who are required to have their remuneration disclosed in accordance with the Corporations Act 2001.
For
per
sona
l use
onl
y

Buxton Resources Limited
Directors' Report continued
31
Remuneration of Key management personnel Key Management Personnel remuneration for the years ended 30 June 2016 and 30 June 2015:
Short-term Post-
employment Share based
payments
Salary & Fees
Non-Monetary Superannuation Share options Total
Value of options as proportion of remuneration
$ $ $ $ %
Directors
Seamus Cornelius
2016 40,000 - - 53,268 93,268 57.11
2015 60,000 - - 52,609 112,609 46.72
Eamon Hannon(1)
2016 141,250 13,419 88,779 243,448 36.47
2015 65,000 - 4,845 80,188 150,033 53.44
Anthony Maslin
2016 25,000 2,375 53,268 80,643 66.05
2015 102,500 - 9,738 52,609 164,847 31.91
Feng Xue(2)
2016 3,356 - - - 3,356 -
Liu Xing Zhou(3)
2016 12,500 - - 53,268 65,768 80.99
2015 30,000 - - 52,609 82,609 63.68
Julian Stephens(4)
2016 17,493 - - - 17,493 -
2015 158,725 - - 52,609 211,334 24.89
Stuart Fogarty(5)
2015 30,000 - - 52,609 82,609 63.68
Directors total
2016 239,599 - 15,794 248,583 503,976 49.32
2015 381,225 - 9,738 263,045 654,008 40.22
Executive
Eamon Hannon(1)
2015 65,000 - 4,845 - 69,845 -
Executive total
2015 65,000 - 4,845 - 69,845 -
Total
2016 239,599 - 15,794 248,583 503,976 49.32
2015 446,225 - 14,583 343,233 804,041 42.68
For
per
sona
l use
onl
y

Buxton Resources Limited
Directors' Report continued
32
(1) Appointed CEO 1st November 2014. Appointed MD 22 February 2016
(2) Appointed 13 May 2016
(3) Resigned 13 May 2016
(4) 2016 fees include $15,181 in exploration consulting fees (2015: $126,225). Resigned 12th August 2015.
Service agreements
The Company has an Executive Service Agreement with Mr Eamon Hannon.
Under the Agreement, Mr Hannon is engaged by the Company to provide services to the Company in the capacity of Chief Executive Officer for a period of 12 months upon which time the Board will conduct a performance review. Mr Hannon is paid a salary of $150,000, plus statutory superannuation.
At any time either party may terminate the agreement without cause on 45 days written notice. There is no termination period over and above the Company’s statutory obligations.
Share-based compensation
Share-based compensation amounting to $248,583 was paid to key management personnel during the year (2015: $343,233), comprising 5,600,000 unlisted options exercisable at 12 cents per option and expiring 30th November 2019. The options vested immediately.
Share-based payments granted as compensation to key management personnel during the current financial year:
Date granted
Granted during
the year
Vested
during the
year
% of grant
vested
% of grant
forfeited
Percentage
compensation for the
year consisting of
options
Number Number % % %
Directors
Seamus Cornelius 30 November 2015 1,200,000 1,200,000 100% - 57.11
Eamon Hannon 30 November 2015 2,000,000 2,000,000 100% - 36.47
Anthony Maslin 30 November 2015 1,200,000 1,200,000 100% - 66.05
Liu Xing Zhou 30 November 2015 1,200,000 1,200,000 100% - 80.99
There were no options that were granted to key management personnel as part of their compensation exercised during the year by key management personnel.
For
per
sona
l use
onl
y
Buxton Resources Limited
Directors' Report continued
33
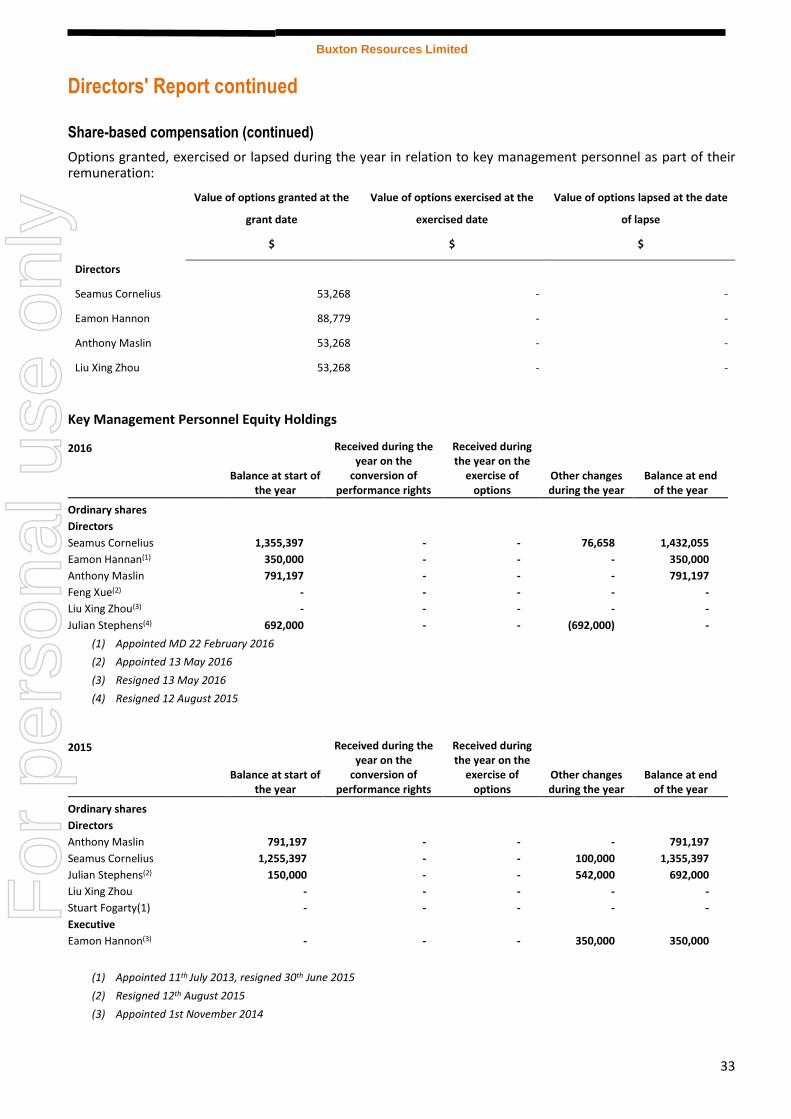
Share-based compensation (continued)
Options granted, exercised or lapsed during the year in relation to key management personnel as part of their remuneration:
Value of options granted at the
grant date
Value of options exercised at the
exercised date
Value of options lapsed at the date
of lapse
$ $ $
Directors
Seamus Cornelius 53,268 - -
Eamon Hannon 88,779 - -
Anthony Maslin 53,268 - -
Liu Xing Zhou 53,268 - -
Key Management Personnel Equity Holdings
2016
Balance at start of the year
Received during the year on the
conversion of performance rights
Received during the year on the
exercise of options
Other changes during the year
Balance at end of the year
Ordinary shares
Directors
Seamus Cornelius 1,355,397 - - 76,658 1,432,055
Eamon Hannan(1) 350,000 - - - 350,000
Anthony Maslin 791,197 - - - 791,197
Feng Xue(2) - - - - -
Liu Xing Zhou(3) - - - - -
Julian Stephens(4) 692,000 - - (692,000) -
(1) Appointed MD 22 February 2016
(2) Appointed 13 May 2016
(3) Resigned 13 May 2016
(4) Resigned 12 August 2015
2015
Balance at start of the year
Received during the year on the
conversion of performance rights
Received during the year on the
exercise of options
Other changes during the year
Balance at end of the year
Ordinary shares
Directors
Anthony Maslin 791,197 - - - 791,197
Seamus Cornelius 1,255,397 - - 100,000 1,355,397
Julian Stephens(2) 150,000 - - 542,000 692,000
Liu Xing Zhou - - - - -
Stuart Fogarty(1) - - - - -
Executive
Eamon Hannon(3) - - - 350,000 350,000
(1) Appointed 11th July 2013, resigned 30th June 2015
(2) Resigned 12th August 2015
(3) Appointed 1st November 2014
For
per
sona
l use
onl
y
Buxton Resources Limited
Directors' Report continued
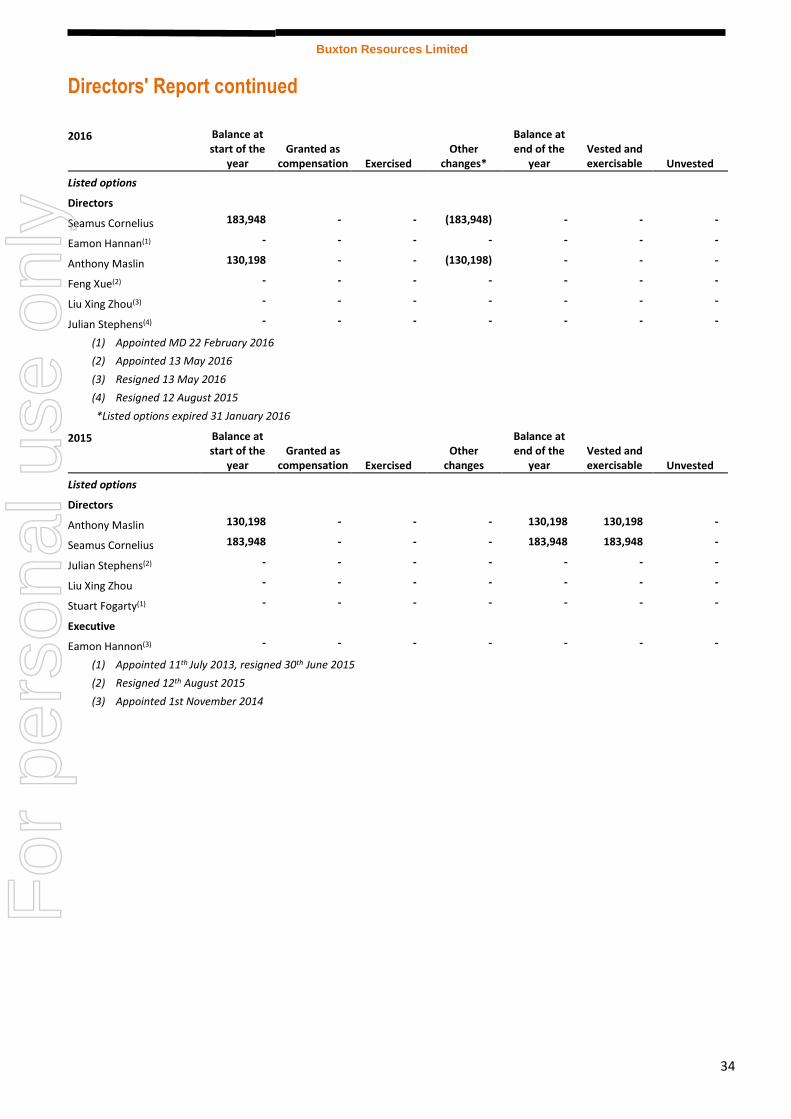
34
2016 Balance at start of the
year Granted as
compensation Exercised Other
changes*
Balance at end of the
year Vested and exercisable Unvested
Listed options
Directors
Seamus Cornelius 183,948 - - (183,948) - - -
Eamon Hannan(1) - - - - - - -
Anthony Maslin 130,198 - - (130,198) - - -
Feng Xue(2) - - - - - - -
Liu Xing Zhou(3) - - - - - - -
Julian Stephens(4) - - - - - - -
(1) Appointed MD 22 February 2016
(2) Appointed 13 May 2016
(3) Resigned 13 May 2016
(4) Resigned 12 August 2015
*Listed options expired 31 January 2016
2015 Balance at start of the
year Granted as
compensation Exercised Other
changes
Balance at end of the
year Vested and exercisable Unvested
Listed options
Directors
Anthony Maslin 130,198 - - - 130,198 130,198 -
Seamus Cornelius 183,948 - - - 183,948 183,948 -
Julian Stephens(2) - - - - - - -
Liu Xing Zhou - - - - - - -
Stuart Fogarty(1) - - - - - - -
Executive
Eamon Hannon(3) - - - - - - -
(1) Appointed 11th July 2013, resigned 30th June 2015
(2) Resigned 12th August 2015
(3) Appointed 1st November 2014
For
per
sona
l use
onl
y
Buxton Resources Limited
Directors' Report continued
35
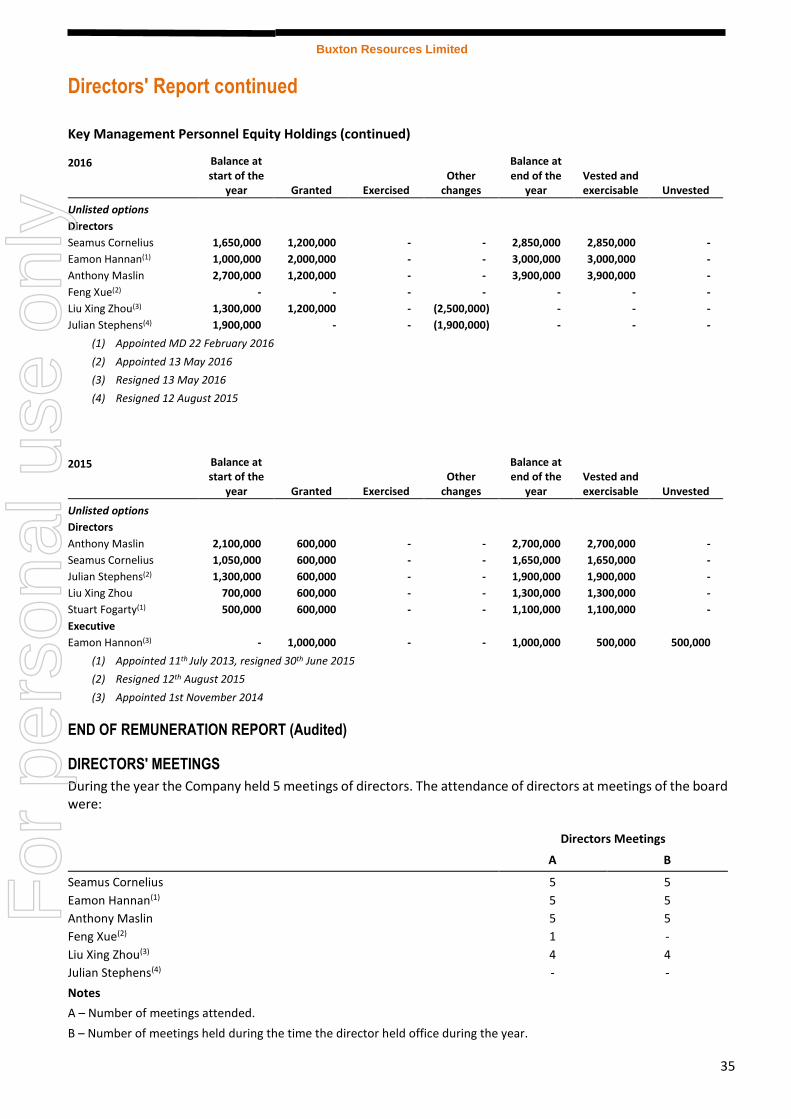
Key Management Personnel Equity Holdings (continued)
2016 Balance at start of the
year Granted Exercised Other
changes
Balance at end of the
year Vested and exercisable Unvested
Unlisted options
Directors
Seamus Cornelius 1,650,000 1,200,000 - - 2,850,000 2,850,000 -
Eamon Hannan(1) 1,000,000 2,000,000 - - 3,000,000 3,000,000 -
Anthony Maslin 2,700,000 1,200,000 - - 3,900,000 3,900,000 -
Feng Xue(2) - - - - - - -
Liu Xing Zhou(3) 1,300,000 1,200,000 - (2,500,000) - - -
Julian Stephens(4) 1,900,000 - - (1,900,000) - - -
(1) Appointed MD 22 February 2016
(2) Appointed 13 May 2016
(3) Resigned 13 May 2016
(4) Resigned 12 August 2015
2015 Balance at start of the
year Granted Exercised Other
changes
Balance at end of the
year Vested and exercisable Unvested
Unlisted options
Directors
Anthony Maslin 2,100,000 600,000 - - 2,700,000 2,700,000 -
Seamus Cornelius 1,050,000 600,000 - - 1,650,000 1,650,000 -
Julian Stephens(2) 1,300,000 600,000 - - 1,900,000 1,900,000 -
Liu Xing Zhou 700,000 600,000 - - 1,300,000 1,300,000 -
Stuart Fogarty(1) 500,000 600,000 - - 1,100,000 1,100,000 -
Executive
Eamon Hannon(3) - 1,000,000 - - 1,000,000 500,000 500,000
(1) Appointed 11th July 2013, resigned 30th June 2015
(2) Resigned 12th August 2015
(3) Appointed 1st November 2014
END OF REMUNERATION REPORT (Audited)
DIRECTORS' MEETINGS
During the year the Company held 5 meetings of directors. The attendance of directors at meetings of the board were:
Directors Meetings A B
Seamus Cornelius 5 5
Eamon Hannan(1) 5 5
Anthony Maslin 5 5
Feng Xue(2) 1 -
Liu Xing Zhou(3) 4 4
Julian Stephens(4) - -
Notes
A – Number of meetings attended.
B – Number of meetings held during the time the director held office during the year.
For
per
sona
l use
onl
y
Buxton Resources Limited
Directors' Report continued
36
(1) Appointed MD 22 February 2016
(2) Appointed 13 May 2016
(3) Resigned 13 May 2016
(4) Resigned 12 August 2015
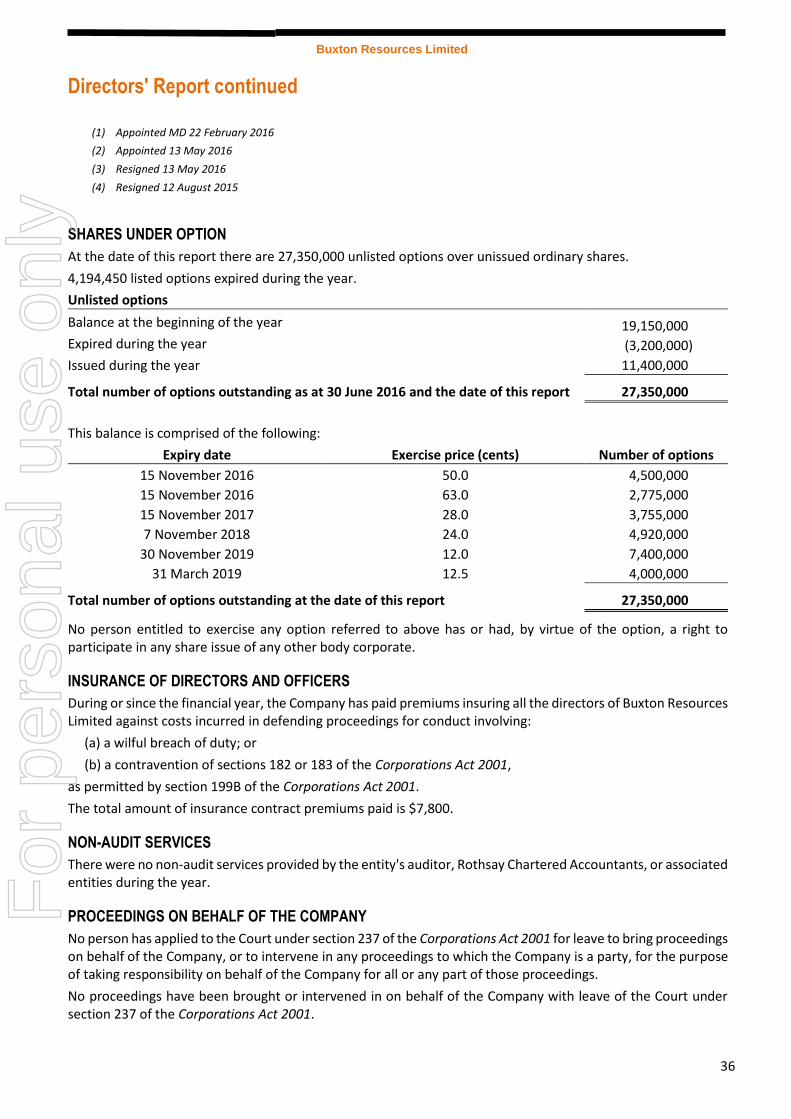
SHARES UNDER OPTION
At the date of this report there are 27,350,000 unlisted options over unissued ordinary shares.
4,194,450 listed options expired during the year.
Unlisted options
Balance at the beginning of the year
Expired during the year
Issued during the year
19,150,000
(3,200,000)
11,400,000
Total number of options outstanding as at 30 June 2016 and the date of this report 27,350,000
This balance is comprised of the following:
Expiry date Exercise price (cents) Number of options
15 November 2016 50.0 4,500,000
15 November 2016 63.0 2,775,000
15 November 2017 28.0 3,755,000
7 November 2018 24.0 4,920,000
30 November 2019 12.0 7,400,000
31 March 2019 12.5 4,000,000
Total number of options outstanding at the date of this report 27,350,000
No person entitled to exercise any option referred to above has or had, by virtue of the option, a right to participate in any share issue of any other body corporate.
INSURANCE OF DIRECTORS AND OFFICERS
During or since the financial year, the Company has paid premiums insuring all the directors of Buxton Resources Limited against costs incurred in defending proceedings for conduct involving:
(a) a wilful breach of duty; or
(b) a contravention of sections 182 or 183 of the Corporations Act 2001,
as permitted by section 199B of the Corporations Act 2001.
The total amount of insurance contract premiums paid is $7,800.
NON-AUDIT SERVICES
There were no non-audit services provided by the entity's auditor, Rothsay Chartered Accountants, or associated entities during the year.
PROCEEDINGS ON BEHALF OF THE COMPANY
No person has applied to the Court under section 237 of the Corporations Act 2001 for leave to bring proceedings on behalf of the Company, or to intervene in any proceedings to which the Company is a party, for the purpose of taking responsibility on behalf of the Company for all or any part of those proceedings.
No proceedings have been brought or intervened in on behalf of the Company with leave of the Court under section 237 of the Corporations Act 2001.
For
per
sona
l use
onl
y

Buxton Resources Limited
Directors' Report continued
37
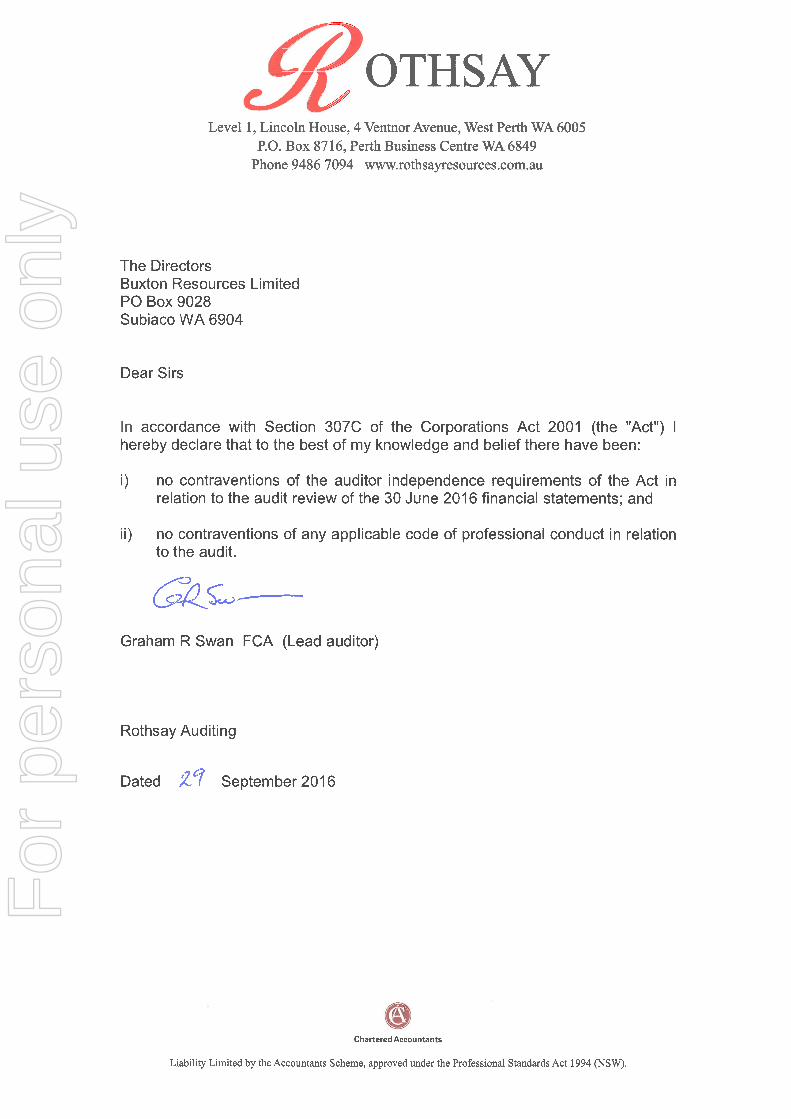
AUDITOR’S INDEPENDENCE DECLARATION
A copy of the auditor's independence declaration as required under section 307C of the Corporations Act 2001 is set out on page 38.
Signed in accordance with a resolution of the directors.
Seamus Cornelius
Non-Executive Chairman
Perth, 29 September 2016
For
per
sona
l use
onl
y
For
per
sona
l use
onl
y

39
Buxton Resources Limited
Annual Report Disclosure on Corporate Governance
Buxton Resources has established, and continues to refine and improve procedures to ensure a culture of good
corporate governance exists and is respected across the Company.
The Company has a written policy designed to ensure compliance with ASX Listing Rules and all other regulatory
requirements for disclosures. Additionally the Company has adopted a policy designed to ensure procedures to
implement the policy are suitable and effective.
The Board wishes to acknowledge that nothing has come to its attention that would lead it to conclude that its
current practices and procedures are not appropriate for an organisation of the size and maturity of the Company.
The Corporate Governance Policy and the Company’s corporate governance practices is set out on the Company’s
web site at www.buxtonresources.com.au.
For
per
sona
l use
onl
y
40
Buxton Resources Limited
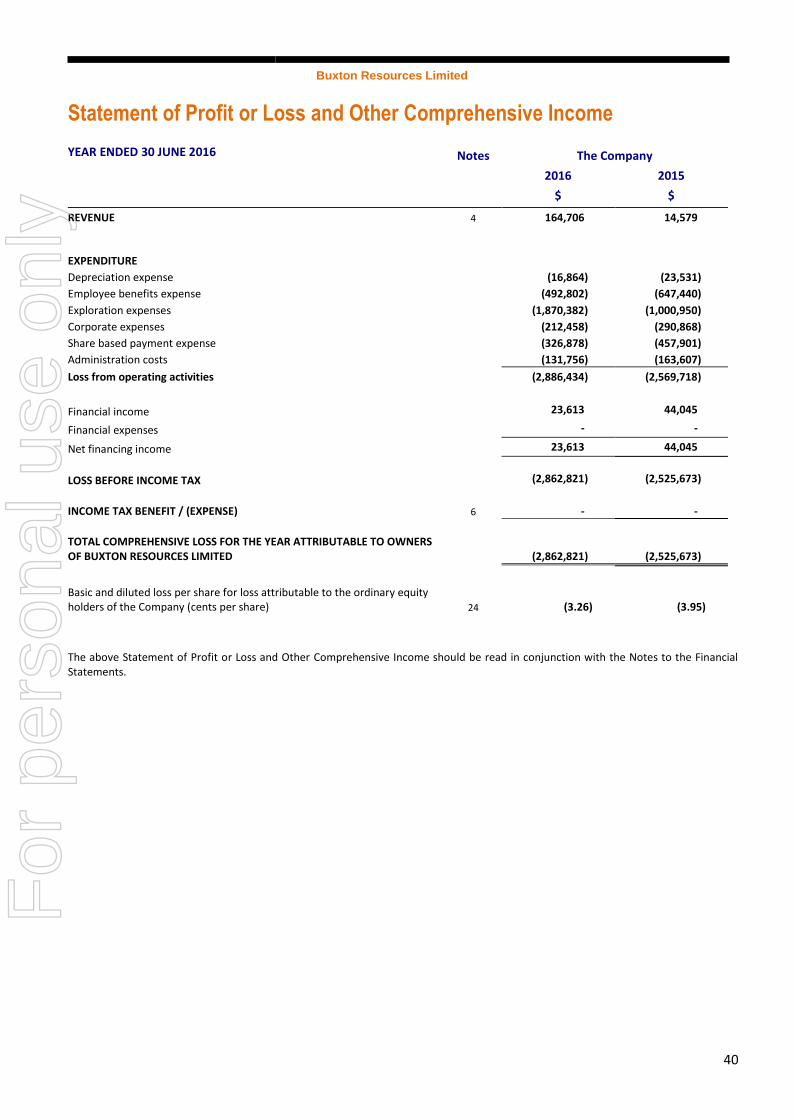
Statement of Profit or Loss and Other Comprehensive Income
YEAR ENDED 30 JUNE 2016 Notes The Company
2016 2015
$ $
REVENUE 4 164,706 14,579
EXPENDITURE
Depreciation expense (16,864) (23,531)
Employee benefits expense (492,802) (647,440)
Exploration expenses (1,870,382) (1,000,950)
Corporate expenses (212,458) (290,868)
Share based payment expense (326,878) (457,901)
Administration costs (131,756) (163,607)
Loss from operating activities (2,886,434) (2,569,718)
Financial income 23,613 44,045
Financial expenses - -
Net financing income 23,613 44,045
LOSS BEFORE INCOME TAX (2,862,821) (2,525,673)
INCOME TAX BENEFIT / (EXPENSE) 6 - -
TOTAL COMPREHENSIVE LOSS FOR THE YEAR ATTRIBUTABLE TO OWNERS OF BUXTON RESOURCES LIMITED (2,862,821) (2,525,673)
Basic and diluted loss per share for loss attributable to the ordinary equity holders of the Company (cents per share) 24 (3.26) (3.95)
The above Statement of Profit or Loss and Other Comprehensive Income should be read in conjunction with the Notes to the Financial Statements.
For
per
sona
l use
onl
y

41
Buxton Resources Limited
Statement of Financial Position
AS AT 30 JUNE 2016 Notes The Company
2016 2015
$ $
CURRENT ASSETS
Cash and cash equivalents 7 1,374,221 1,954,686
Trade and other receivables 8 25,998 111,309
Other financial assets 9 128,000 -
Other current assets 10 13,651 141,352
TOTAL CURRENT ASSETS 1,541,870 2,207,347
NON-CURRENT ASSETS
Exploration Asset 11 656,862 427,210
Plant and equipment 12 41,162 58,025
TOTAL NON-CURRENT ASSETS 698,024 485,235
TOTAL ASSETS 2,239,894 2,692,582
CURRENT LIABILITIES
Trade and other payables 13 137,642 177,691
TOTAL CURRENT LIABILITIES 137,642 177,691
TOTAL LIABILITIES 137,642 177,691
NET ASSETS 2,102,252 2,514,891
EQUITY
Issued capital 14 14,884,484 12,931,994
Reserve 15 1,973,646 1,475,954
Accumulated losses 16 (14,755,878) (11,893,057)
TOTAL EQUITY 2,102,252 2,514,891
The above Statement of Financial Position should be read in conjunction with the Notes to the Financial Statements.
For
per
sona
l use
onl
y
42
Buxton Resources Limited
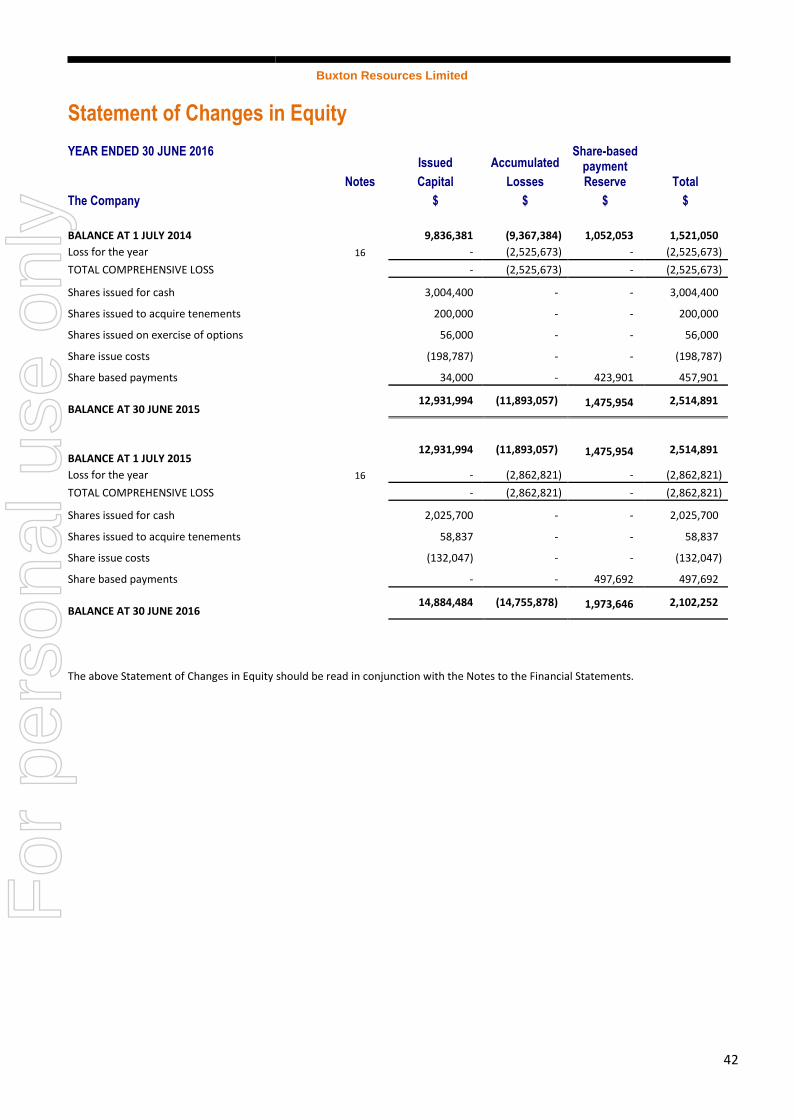
Statement of Changes in Equity
YEAR ENDED 30 JUNE 2016
Notes
Issued
Capital
Accumulated
Losses
Share-based payment Reserve Total
The Company $ $ $ $
BALANCE AT 1 JULY 2014 9,836,381 (9,367,384) 1,052,053 1,521,050
Loss for the year 16 - (2,525,673) - (2,525,673)
TOTAL COMPREHENSIVE LOSS - (2,525,673) - (2,525,673)
Shares issued for cash 3,004,400 - - 3,004,400
Shares issued to acquire tenements 200,000 - - 200,000
Shares issued on exercise of options 56,000 - - 56,000
Share issue costs (198,787) - - (198,787)
Share based payments 34,000 - 423,901 457,901
BALANCE AT 30 JUNE 2015 12,931,994 (11,893,057) 1,475,954 2,514,891
BALANCE AT 1 JULY 2015 12,931,994 (11,893,057) 1,475,954 2,514,891
Loss for the year 16 - (2,862,821) - (2,862,821)
TOTAL COMPREHENSIVE LOSS - (2,862,821) - (2,862,821)
Shares issued for cash 2,025,700 - - 2,025,700
Shares issued to acquire tenements 58,837 - - 58,837
Share issue costs (132,047) - - (132,047)
Share based payments - - 497,692 497,692
BALANCE AT 30 JUNE 2016 14,884,484 (14,755,878) 1,973,646 2,102,252
The above Statement of Changes in Equity should be read in conjunction with the Notes to the Financial Statements.
For
per
sona
l use
onl
y

43
Buxton Resources Limited
Statement of Cash Flows
YEAR ENDED 30 JUNE 2016 Notes The Company
2016 2015
$ $
CASH FLOWS FROM OPERATING ACTIVITIES
Receipts from customers 164,706 6,826
Payments to suppliers and employees (733,907) (1,170,297)
Expenditure on mining interests (1,935,058) (1,057,482)
Interest received 30,141 41,308
NET CASH OUTFLOW FROM OPERATING ACTIVITIES 23 (2,474,118) (2,179,645)
CASH FLOWS FROM INVESTING ACTIVITIES
Payments for plant and equipment - (11,038)
NET CASH OUTFLOW FROM INVESTING ACTIVITIES - (11,038)
CASH FLOWS FROM FINANCING ACTIVITIES
Proceeds from issue of shares 2,025,700 3,004,400
Proceeds from conversion of options - 56,000
Payment of share issue costs (132,047) (198,787)
NET CASH INFLOW FROM FINANCING ACTIVITIES 1,893,653 2,861,613
NET INCREASE/(DECREASE) IN CASH AND CASH EQUIVALENTS (580,465) 670,930
Cash and cash equivalents at the beginning of the financial year 1,954,686 1,283,756
CASH AND CASH EQUIVALENTS AT THE END OF THE YEAR 7 1,374,221 1,954,686
The above Statement of Cash Flows should be read in conjunction with the Notes to the Financial Statements.
For
per
sona
l use
onl
y

Buxton Resources Limited
Notes to the Financial Statements
44
30 JUNE 2016
1. SUMMARY OF SIGNIFICANT ACCOUNTING POLICIES
The principal accounting policies adopted in the preparation of the financial statements are set out below. The financial statements are for Buxton Resources Limited as an individual entity. The financial statements are presented in the Australian currency. Buxton Resources Limited is a company limited by shares, domiciled and incorporated in Australia. The financial statements were authorised for issue by the directors on 30 September 2016. The directors have the power to amend and reissue the financial statements.
(a) Basis of preparation
These general purpose financial statements have been prepared in accordance with Australian Accounting Standards and the Corporations Act 2001.
Compliance with IFRS
The financial statements of Buxton Resources Limited also comply with International Financial Reporting Standards (IFRS) as issued by the International Accounting Standards Board (IASB).
Historical cost convention
These financial statements have been prepared under the historical cost convention, as modified by the revaluation of available-for-sale financial assets, financial assets and liabilities (including derivative instruments) at fair value through profit or loss, certain classes of property, plant and equipment and investment property.
(b) Segment reporting
Operating segments are reported in a manner consistent with the internal reporting provided to the chief operating decision maker. The chief operating decision maker, who is responsible for allocating resources and assessing performance of the operating segments, has been identified as the full Board of Directors.
(c) Revenue recognition
Interest revenue is recognised on a time proportionate basis that takes into account the effective yield on the financial assets.
(d) Income tax
The income tax expense or revenue for the year is the tax payable on the current year’s taxable income based on the applicable income tax rate for each jurisdiction adjusted by changes in deferred tax assets and liabilities attributable to temporary differences and to unused tax losses.
The current income tax charge is calculated on the basis of the tax laws enacted or substantively enacted at the end of the reporting period in the countries where the Company’s subsidiaries and associated operate and generate taxable income. Management periodically evaluates positions taken in tax returns with respect to situations in which applicable tax regulation is subject to interpretation. It establishes provisions where appropriate on the basis of amounts expected to be paid to the tax authorities.
Deferred income tax is provided in full, using the liability method, on temporary differences arising between the tax bases of assets and liabilities and their carrying amounts in the consolidated financial statements. However, the deferred income tax is not accounted for if it arises from initial recognition of an asset or liability in a transaction other than a business combination that at the time of the transaction affects neither accounting nor taxable profit or loss. Deferred income tax is determined using tax rates (and laws) that have been enacted or substantially enacted by the reporting date and are expected to apply when the related deferred income tax asset is realised or the deferred income tax liability is settled.
Deferred tax assets are recognised for deductible temporary differences and unused tax losses only if it is probable that future taxable amounts will be available to utilise those temporary differences and losses. Deferred tax liabilities and assets are not recognised for temporary differences between the carrying amount and tax bases of investments in controlled entities where the parent entity is able to control the timing of the reversal of the temporary differences and it is probable that the differences will not reverse in the foreseeable future.
Deferred tax assets and liabilities are offset when there is a legally enforceable right to offset current tax assets and liabilities and when the deferred tax balances relate to the same taxation authority. Current tax assets and tax liabilities are offset where the entity has a legally enforceable right to offset and intends either to settle on a net basis, or to realise the asset and settle the liability simultaneously.
Current and deferred tax is recognised in profit or loss, except to the extent that it relates to items recognised in other comprehensive income or directly in equity. In this case, the tax is also recognised in other comprehensive income or directly in equity, respectively.
(e) Leases
Leases of property, plant and equipment where the Company, as lessee, has substantially all the risks and rewards of ownership are
For
per
sona
l use
onl
y

Buxton Resources Limited
Notes to the Financial Statements
45
classified as finance leases. Finance leases are capitalised at the lease’s inception at the fair value of the leased property or, if lower, the present value of the minimum lease payments. The corresponding rental obligations, net of finance charges, are included in other short-term and long-term payables. Each lease payment is allocated between the liability and finance cost. The finance cost is charged to profit or loss over the lease period so as to produce a constant periodic rate of interest on the remaining balance of the liability for each period. The property, plant and equipment acquired under finance leases is depreciated over the shorter of the asset’s useful life and the lease term.
Leases where a significant portion of the risks and rewards of ownership are not transferred to the Company as lessee are classified as operating leases (note 20). Payments made under operating leases (net of any incentives received from the lessor) are charged to profit or loss on a straight-line basis over the period of the lease.
(f) Impairment of assets
Goodwill and intangible assets that have an indefinite useful life are not subject to amortisation and are tested annually for impairment, or more frequently if events or changes in circumstances indicate that they might be impaired. Other assets are reviewed for impairment whenever events or changes in circumstances indicate that the carrying amount may not be recoverable. An impairment loss is recognised for the amount by which the asset’s carrying amount exceeds its recoverable amount. The recoverable amount is the higher of an asset’s fair value less costs to sell and value in use. For the purposes of assessing impairment, assets are grouped at the lowest levels for which there are separately identifiable cash inflows which are largely independent of the cash inflows from other assets or groups of assets (cash-generating units). Non-financial assets other than goodwill that suffered an impairment are reviewed for possible reversal of the impairment at each reporting date.
(g) Cash and cash equivalents
For statement of cash flows presentation purposes, cash and cash equivalents includes cash on hand, deposits held at call with financial institutions, other short-term highly liquid investments with original maturities of three months or less that are readily convertible to known amounts of cash and which are subject to insignificant risk of changes in value, and bank overdrafts. Bank overdrafts are shown within borrowings in current liabilities on the statement of financial position.
(h) Investments and other financial assets
Classification
The Company classifies its investments in the following categories: financial assets at fair value through profit or loss, loans and receivables, held-to-maturity investments and available-for-sale financial assets. The classification depends on the purpose for which the investments were acquired. Management determines the classification of its investments at initial recognition and, in the case of assets classified as held-to-maturity, re-evaluates this designation at each reporting date.
(i) Financial assets at fair value through profit or loss
Financial assets at fair value through profit or loss are financial assets held for trading. A financial asset is classified in this category if acquired principally for the purpose of selling in the short term. Derivatives are classified as held for trading unless they are designated as hedges. Assets in this category are classified as current assets.
(ii) Loans and receivables
Loans and receivables are non-derivative financial assets with fixed or determinable payments that are not quoted in an active market. They are included in current assets, except for those with maturities greater than 12 months after the reporting date which are classified as non-current assets. Loans and receivables are included in trade and other receivables in the statement of financial position. (iii) Held-to-maturity investments
Held-to-maturity investments are non-derivative financial assets with fixed or determinable payments and fixed maturities that the Company’s management has the positive intention and ability to hold to maturity. If the Company were to sell other than an insignificant amount of held-to-maturity financial assets, the whole category would be tainted and reclassified as available-for-sale. Held-to-maturity financial assets are included in non-current assets, except for those with maturities less than 12 months from the reporting date, which are classified as current assets.
(iv) Available-for-sale financial assets
Available-for-sale financial assets, comprising principally marketable equity securities, are non-derivatives that are either designated in this category or not classified in any of the other categories. They are included in non-current assets unless management intends to dispose of the investment within 12 months of the reporting date. Investments are designated available-for-sale if they do not have fixed maturities and fixed or determinable payments and management intends to hold them for the medium to long term.
Financial assets - reclassification
The Company may choose to reclassify a non-derivative trading financial asset out of the held-for-trading category if the financial asset is no longer held for the purpose of selling it in the near term. Financial assets other than loans and receivables are permitted to be
For
per
sona
l use
onl
y
Buxton Resources Limited
Notes to the Financial Statements
46
reclassified out of the held-for-trading category only in rare circumstances arising from a single event that is unusual and highly unlikely to recur in the near term. In addition, the Company may choose to reclassify financial assets that would meet the definition of loans and receivables out of the held-for-trading or available-for-sale categories if the Company has the intention and ability to hold these financial assets for the foreseeable future or until maturity at the date of reclassification.
Reclassifications are made at fair value as of the reclassification date. Fair value becomes the new cost or amortised cost as applicable, and no reversals of fair value gains or losses recorded before reclassification date are subsequently made. Effective interest rates for financial assets reclassified to loans and receivables and held-to-maturity categories are determined at the reclassification date. Further increases in estimates of cash flows adjust effective interest rates prospectively.
Recognition and derecognition
Regular purchases and sales of financial assets are recognised on trade-date – the date on which the Company commits to purchase or sell the asset. Investments are initially recognised at fair value plus transaction costs for all financial assets not carried at fair value through profit or loss. Financial assets carried at fair value through profit or loss are initially recognised at fair value and transaction costs are expensed to the statement of profit or loss and other comprehensive income. Financial assets are derecognised when the rights to receive cash flows from the financial assets have expired or have been transferred and the Company has transferred substantially all the risks and rewards of ownership.
When securities classified as available-for-sale are sold, the accumulated fair value adjustments recognised in equity are included in the statement of comprehensive income as gains and losses from investment securities.
Subsequent measurement
Loans and receivables and held-to-maturity investments are carried at amortised cost using the effective interest method.
Available-for-sale financial assets and financial assets at fair value through profit or loss are subsequently carried at fair value. Gains or losses arising from changes in the fair value of the ‘financial assets at fair value through profit or loss’ category are presented in the statement of comprehensive income within other income or other expenses in the period in which they arise. Dividend income from financial assets at fair value through profit or loss is recognised in the statement of comprehensive income as part of revenue from continuing operations when the Company’s right to receive payments is established.
Changes in the fair value of monetary securities denominated in a foreign currency and classified as available-for-sale are analysed between translation differences resulting from changes in amortised cost of the security and other changes in the carrying amount of the security. The translation differences related to changes in the amortised cost are recognised in profit or loss, and other changes in carrying amount are recognised in equity. Changes in the fair value of other monetary and non-monetary securities classified as available-for-sale are recognised in equity.
Details on how the fair value of financial investments is determined are disclosed in note 2.
Impairment
The Company assesses at each balance date whether there is objective evidence that a financial asset or group of financial assets is impaired. In the case of equity securities classified as available-for-sale, a significant or prolonged decline in the fair value of a security below its cost is considered as an indicator that the securities are impaired. If any such evidence exists for available-for-sale financial assets, the cumulative loss – measured as the difference between the acquisition cost and the current fair value, less any impairment loss on that financial asset previously recognised in profit or loss – is removed from equity and recognised in the statement of profit or loss and other comprehensive income. Impairment losses recognised in the statement of comprehensive income on equity instruments classified as available-for-sale are not reversed through the statement of profit or loss and other comprehensive income.
If there is evidence of impairment for any of the Company’s financial assets carried at amortised cost, the loss is measured as the difference between the asset’s carrying amount and the present value of estimated future cash flows, excluding future credit losses that have not been incurred. The cash flows are discounted at the financial asset’s original effective interest rate. The loss is recognised in the statement of comprehensive income. (i) Plant and equipment
All plant and equipment is stated at historical cost less depreciation. Historical cost includes expenditure that is directly attributable to the acquisition of the items.
Subsequent costs are included in the asset’s carrying amount or recognised as a separate asset, as appropriate, only when it is probable that future economic benefits associated with the item will flow to the Company and the cost of the item can be measured reliably. The carrying amount of any component accounted for as a separate asset is derecognised when replaced. All other repairs and maintenance are charged to the statement of profit or loss and other comprehensive income during the reporting period in which they are incurred.
Depreciation of plant and equipment is calculated using the reducing balance method to allocate their cost or revalued amounts, net of their residual values, over their estimated useful lives or, in the case of leasehold improvements and certain leased plant and equipment, the shorter lease term. The rates vary between 20% and 50% per annum.
The assets’ residual values and useful lives are reviewed, and adjusted if appropriate, at each reporting date.
An asset’s carrying amount is written down immediately to its recoverable amount if the asset’s carrying amount is greater than its estimated recoverable amount (note 1(f)).
Gains and losses on disposals are determined by comparing proceeds with carrying amount. These are included in the statement profit or loss and other of comprehensive income. When revalued assets are sold, it is Company policy to transfer the amounts included in
For
per
sona
l use
onl
y

Buxton Resources Limited
Notes to the Financial Statements
47
other reserves in respect of those assets to retained earnings.
(j) Exploration and evaluation costs
Exploration and evaluation costs, excluding the costs of acquiring tenements, are expensed as incurred. Acquisition costs will be assessed on a case by case basis and, if appropriate, they will be capitalised. These acquisition costs are carried forward only if the rights to tenure of the area of interest are current and either:
They are expected to be recouped through successful development and exploitation of the area of interest or;
The activities in the area of interest at the reporting date have not reached a stage which permits a reasonable assessment of the existence or otherwise of economically recoverable reserves, and active and significant operations in, or in relation to, the area of interest, are continuing.
Accumulated acquisition costs in relation to an abandoned area are written off in full to the statement of Profit or Loss and Other Comprehensive Income in the year in which the decision to abandon the area is made.
The carrying values of acquisition costs are reviewed for impairment when events or changes in circumstances indicate the carrying value may not be recoverable.
(k) Trade and other payables
These amounts represent liabilities for goods and services provided to the Company prior to the end of the financial year which are unpaid. The amounts are unsecured, non-interest bearing and are paid on normal commercial terms.
(l) Issued capital
Ordinary shares are classified as equity.
Incremental costs directly attributable to the issue of new shares or options are shown in equity as a deduction, net of tax, from the proceeds. Incremental costs directly attributable to the issue of new shares or options for the acquisition of a business are not included in the cost of the acquisition as part of the purchase consideration.
(m) Earnings per share
(i) Basic earnings per share
Basic earnings per share is calculated by dividing the profit attributable to owners of the company, excluding any costs of servicing equity other than ordinary shares, by the weighted average number of ordinary shares outstanding during the financial year, adjusted for bonus elements in ordinary shares issued during the year.
(ii) Diluted earnings per share
Diluted earnings per share adjusts the figures used in the determination of basic earnings per share to take into account the after income tax effect of interest and other financing costs associated with dilutive potential ordinary shares and the weighted average number of shares assumed to have been issued for no consideration in relation to dilutive potential ordinary shares.
(n) Goods and Services Tax (GST)
Revenues, expenses and assets are recognised net of the amount of associated GST, unless the GST incurred is not recoverable from the taxation authority. In this case it is recognised as part of the cost of acquisition of the asset or as part of the expense.
Receivables and payables are stated inclusive of the amount of GST receivable or payable. The net amount of GST recoverable from, or payable to, the taxation authority is included with other receivables or payables in the statement of financial position.
Cash flows are presented on a gross basis. The GST components of cash flows arising from investing or financing activities which are recoverable from, or payable to the taxation authority, are presented as operating cash flows.
(o) New accounting standards and interpretations
The Company has applied the following standards and amendments for the first time for their annual reporting period commencing 1 July 2016:
AASB 2015-3 ‘Amendments to Australian Accounting Standards arising from the Withdrawal of AASB 1031 Materiality’
For
per
sona
l use
onl
y
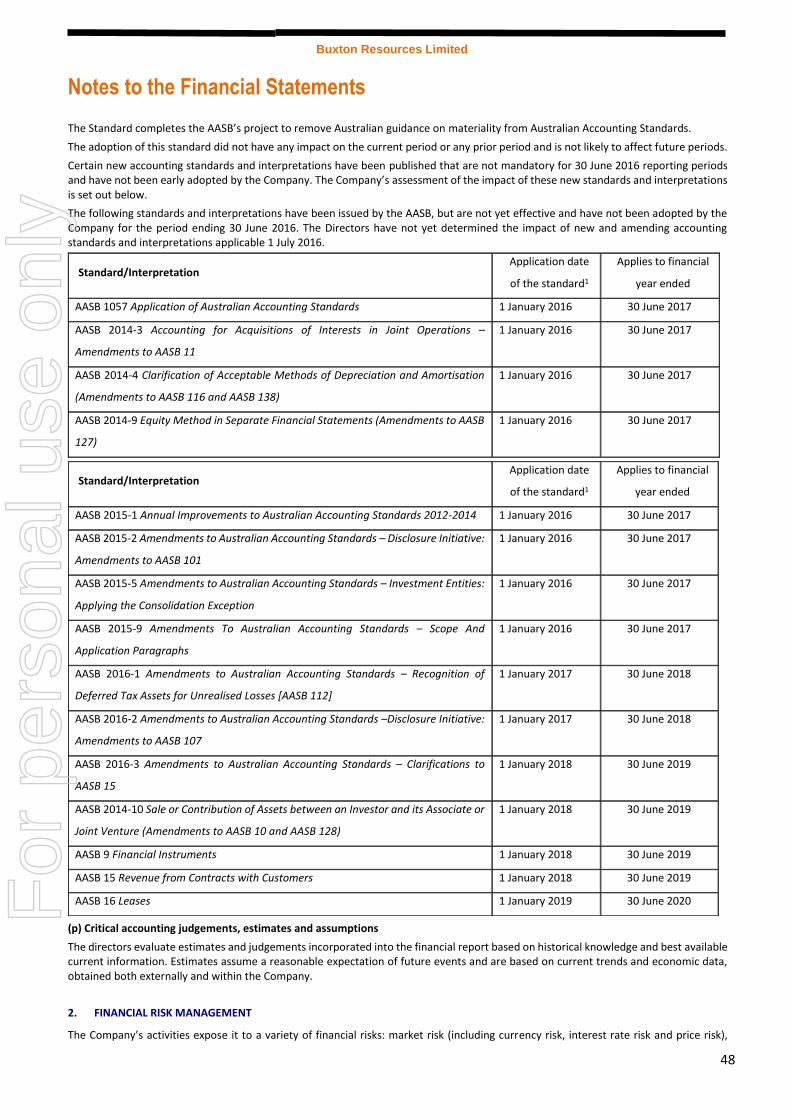
Buxton Resources Limited
Notes to the Financial Statements
48
The Standard completes the AASB’s project to remove Australian guidance on materiality from Australian Accounting Standards.
The adoption of this standard did not have any impact on the current period or any prior period and is not likely to affect future periods.
Certain new accounting standards and interpretations have been published that are not mandatory for 30 June 2016 reporting periods and have not been early adopted by the Company. The Company’s assessment of the impact of these new standards and interpretations is set out below.
The following standards and interpretations have been issued by the AASB, but are not yet effective and have not been adopted by the Company for the period ending 30 June 2016. The Directors have not yet determined the impact of new and amending accounting standards and interpretations applicable 1 July 2016.
(p) Critical accounting judgements, estimates and assumptions
Standard/Interpretation Application date
of the standard1
Applies to financial
year ended
AASB 2015-1 Annual Improvements to Australian Accounting Standards 2012-2014 1 January 2016 30 June 2017
AASB 2015-2 Amendments to Australian Accounting Standards – Disclosure Initiative:
Amendments to AASB 101
1 January 2016 30 June 2017
AASB 2015-5 Amendments to Australian Accounting Standards – Investment Entities:
Applying the Consolidation Exception
1 January 2016 30 June 2017
AASB 2015-9 Amendments To Australian Accounting Standards – Scope And
Application Paragraphs
1 January 2016 30 June 2017
AASB 2016-1 Amendments to Australian Accounting Standards – Recognition of
Deferred Tax Assets for Unrealised Losses [AASB 112]
1 January 2017 30 June 2018
AASB 2016-2 Amendments to Australian Accounting Standards –Disclosure Initiative:
Amendments to AASB 107
1 January 2017 30 June 2018
AASB 2016-3 Amendments to Australian Accounting Standards – Clarifications to
AASB 15
1 January 2018 30 June 2019
AASB 2014-10 Sale or Contribution of Assets between an Investor and its Associate or
Joint Venture (Amendments to AASB 10 and AASB 128)
1 January 2018 30 June 2019
AASB 9 Financial Instruments 1 January 2018 30 June 2019
AASB 15 Revenue from Contracts with Customers 1 January 2018 30 June 2019
AASB 16 Leases 1 January 2019 30 June 2020
The directors evaluate estimates and judgements incorporated into the financial report based on historical knowledge and best available current information. Estimates assume a reasonable expectation of future events and are based on current trends and economic data, obtained both externally and within the Company.
2. FINANCIAL RISK MANAGEMENT
The Company’s activities expose it to a variety of financial risks: market risk (including currency risk, interest rate risk and price risk),
Standard/Interpretation Application date
of the standard1
Applies to financial
year ended
AASB 1057 Application of Australian Accounting Standards 1 January 2016 30 June 2017
AASB 2014-3 Accounting for Acquisitions of Interests in Joint Operations –
Amendments to AASB 11
1 January 2016 30 June 2017
AASB 2014-4 Clarification of Acceptable Methods of Depreciation and Amortisation
(Amendments to AASB 116 and AASB 138)
1 January 2016 30 June 2017
AASB 2014-9 Equity Method in Separate Financial Statements (Amendments to AASB
127)
1 January 2016 30 June 2017
For
per
sona
l use
onl
y
Buxton Resources Limited
Notes to the Financial Statements
49
credit risk and liquidity risk. The Company’s overall risk management program focuses on the unpredictability of financial markets and seeks to minimise potential adverse effects on the financial performance of the Company.
Risk management is carried out by the full Board of Directors as the Company believes that it is crucial for all board members to be involved in this process. The Chief Executive Officer, with the assistance of senior management as required, has responsibility for identifying, assessing, treating and monitoring risks and reporting to the board on risk management.
(a) Market risk
(i) Foreign exchange risk
As all operations are currently within Australia the Company is not exposed to foreign exchange risk.
(ii) Price risk
Given the current level of operations the Company is not exposed to price risk.
(iii) Interest rate risk
The Company is exposed to movements in market interest rates on cash and cash equivalents. The Company policy is to monitor the interest rate yield curve out to six months to ensure a balance is maintained between the liquidity of cash assets and the interest rate return. The balance of cash and cash equivalents for the Company subject to interest rate risk is $1,374,221 (2015: $1,954,686). The proportional mix of floating interest rates and fixed rates to a maximum of six months fluctuate during the year depending on current working capital requirements. The weighted average interest rate received on cash and cash equivalents by the Company was 1.39% (2015: 1.99%).
Sensitivity analysis
At 30 June 2016, if interest rates had changed by -/+ 100 basis points from the weighted average rate for the year with all other variables held constant, post-tax loss for the Company would have been $16,645 lower/higher (2015: $14,547 -/+ 100 basis points) as a result of lower/higher interest income from cash and cash equivalents.
(b) Credit risk
The Company has no significant concentrations of credit risk. The maximum exposure to credit risk at balance date is the carrying amount (net of provision for impairment) of those assets as disclosed in the statement of financial position and notes to the financial statements.
As the Company does not presently have any debtors, lending, significant stock levels or any other credit risk, a formal credit risk management policy is not maintained.
(c) Liquidity risk
The Company manages liquidity risk by continuously monitoring forecast and actual cash flows and ensuring sufficient cash and marketable securities are available to meet the current and future commitments of the Company. Due to the nature of the Company’s activities, being mineral exploration, the Company does not have ready access to credit facilities, with the primary source of funding being equity raisings. The Board of Directors constantly monitor the state of equity markets in conjunction with the Company’s current and future funding requirements, with a view to initiating appropriate capital raisings as required.
The financial liabilities of the Company are confined to trade and other payables as disclosed in the statement of financial position. All trade and other payables are non-interest bearing and due within 12 months of the reporting date.
(d) Fair value estimation
The fair value of financial assets and financial liabilities must be estimated for recognition and measurement or for disclosure purposes. All financial assets and financial liabilities of the Company at the balance date are recorded at amounts approximating their carrying amount.
The fair value of financial instruments traded in active markets is based on quoted market prices at the reporting date. The quoted market price used for financial assets held by the Company is the current bid price.
The carrying value less impairment provision of trade receivables and payables are assumed to approximate their fair values due to their short-term nature.
For
per
sona
l use
onl
y
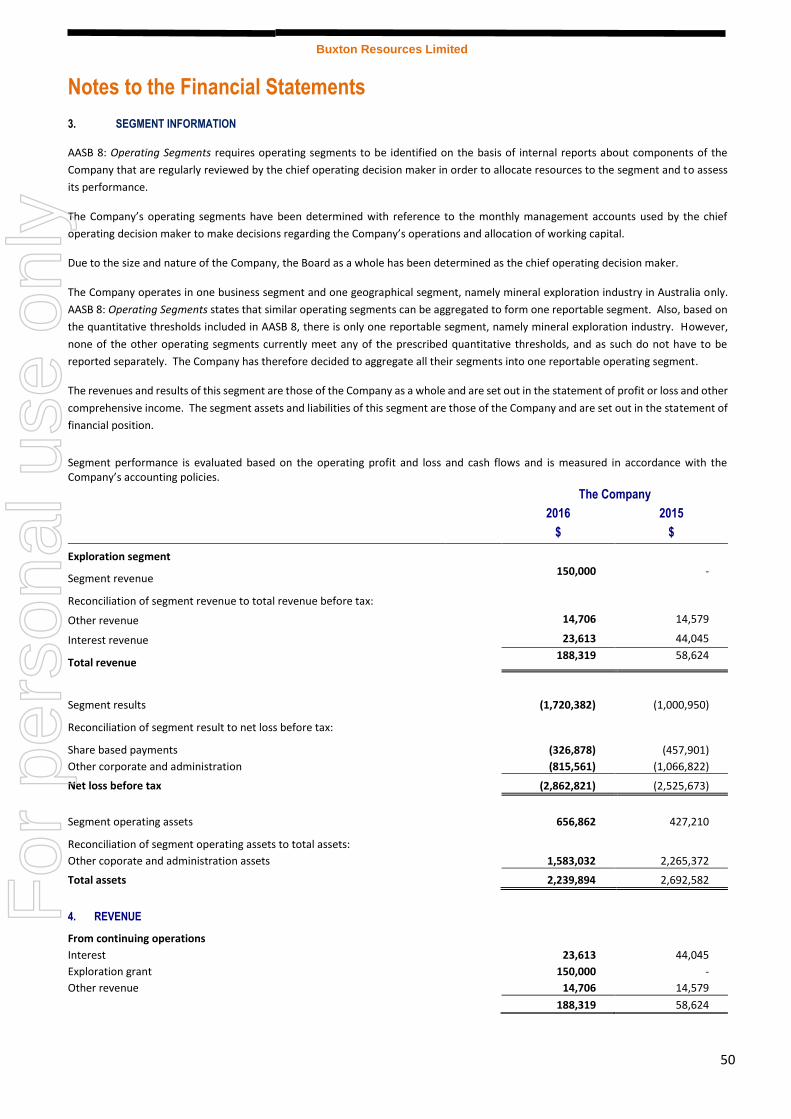
Buxton Resources Limited
Notes to the Financial Statements
50
3. SEGMENT INFORMATION
AASB 8: Operating Segments requires operating segments to be identified on the basis of internal reports about components of the
Company that are regularly reviewed by the chief operating decision maker in order to allocate resources to the segment and to assess
its performance.
The Company’s operating segments have been determined with reference to the monthly management accounts used by the chief
operating decision maker to make decisions regarding the Company’s operations and allocation of working capital.
Due to the size and nature of the Company, the Board as a whole has been determined as the chief operating decision maker.
The Company operates in one business segment and one geographical segment, namely mineral exploration industry in Australia only.
AASB 8: Operating Segments states that similar operating segments can be aggregated to form one reportable segment. Also, based on
the quantitative thresholds included in AASB 8, there is only one reportable segment, namely mineral exploration industry. However,
none of the other operating segments currently meet any of the prescribed quantitative thresholds, and as such do not have to be
reported separately. The Company has therefore decided to aggregate all their segments into one reportable operating segment.
The revenues and results of this segment are those of the Company as a whole and are set out in the statement of profit or loss and other
comprehensive income. The segment assets and liabilities of this segment are those of the Company and are set out in the statement of
financial position.
Segment performance is evaluated based on the operating profit and loss and cash flows and is measured in accordance with the Company’s accounting policies.
The Company
2016 2015
$ $
Exploration segment
Segment revenue 150,000 -
Reconciliation of segment revenue to total revenue before tax:
Other revenue 14,706 14,579
Interest revenue 23,613 44,045
Total revenue 188,319 58,624
Segment results (1,720,382) (1,000,950)
Reconciliation of segment result to net loss before tax:
Share based payments (326,878) (457,901)
Other corporate and administration (815,561) (1,066,822)
Net loss before tax (2,862,821) (2,525,673)
Segment operating assets 656,862 427,210
Reconciliation of segment operating assets to total assets:
Other coporate and administration assets 1,583,032 2,265,372
Total assets 2,239,894 2,692,582
4. REVENUE
From continuing operations
Interest 23,613 44,045
Exploration grant 150,000 -
Other revenue 14,706 14,579
188,319 58,624
For
per
sona
l use
onl
y
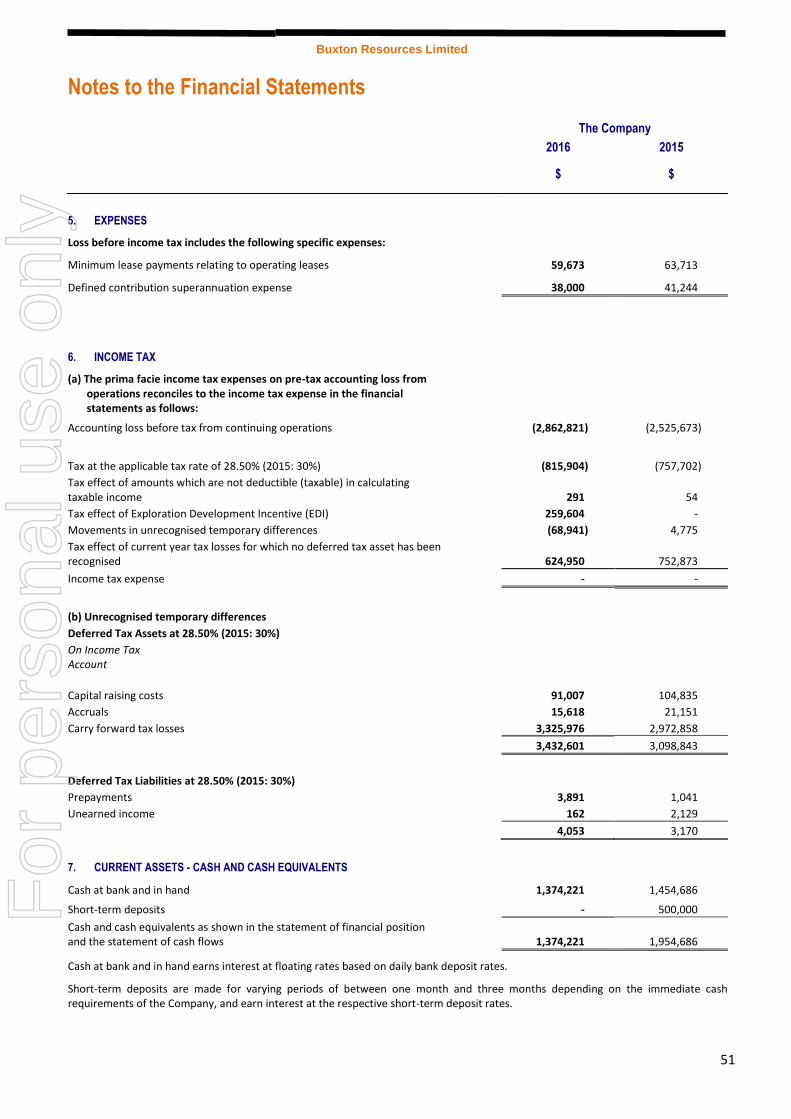
Buxton Resources Limited
Notes to the Financial Statements
51
The Company
2016 2015
$ $
5. EXPENSES
Loss before income tax includes the following specific expenses:
Minimum lease payments relating to operating leases 59,673 63,713
Defined contribution superannuation expense 38,000 41,244
6. INCOME TAX
(a) The prima facie income tax expenses on pre-tax accounting loss from operations reconciles to the income tax expense in the financial statements as follows:
Accounting loss before tax from continuing operations
(2,862,821) (2,525,673)
Tax at the applicable tax rate of 28.50% (2015: 30%) (815,904) (757,702)
Tax effect of amounts which are not deductible (taxable) in calculating taxable income 291 54
Tax effect of Exploration Development Incentive (EDI) 259,604 -
Movements in unrecognised temporary differences (68,941) 4,775
Tax effect of current year tax losses for which no deferred tax asset has been recognised 624,950 752,873
Income tax expense - -
(b) Unrecognised temporary differences
Deferred Tax Assets at 28.50% (2015: 30%)
On Income Tax Account
Capital raising costs 91,007 104,835
Accruals 15,618 21,151
Carry forward tax losses 3,325,976 2,972,858
3,432,601 3,098,843
Deferred Tax Liabilities at 28.50% (2015: 30%)
Prepayments 3,891 1,041
Unearned income 162 2,129
4,053 3,170
7. CURRENT ASSETS - CASH AND CASH EQUIVALENTS
Cash at bank and in hand
1,374,221 1,454,686
Short-term deposits
- 500,000
Cash and cash equivalents as shown in the statement of financial position and the statement of cash flows
1,374,221 1,954,686
Cash at bank and in hand earns interest at floating rates based on daily bank deposit rates.
Short-term deposits are made for varying periods of between one month and three months depending on the immediate cash requirements of the Company, and earn interest at the respective short-term deposit rates.
For
per
sona
l use
onl
y
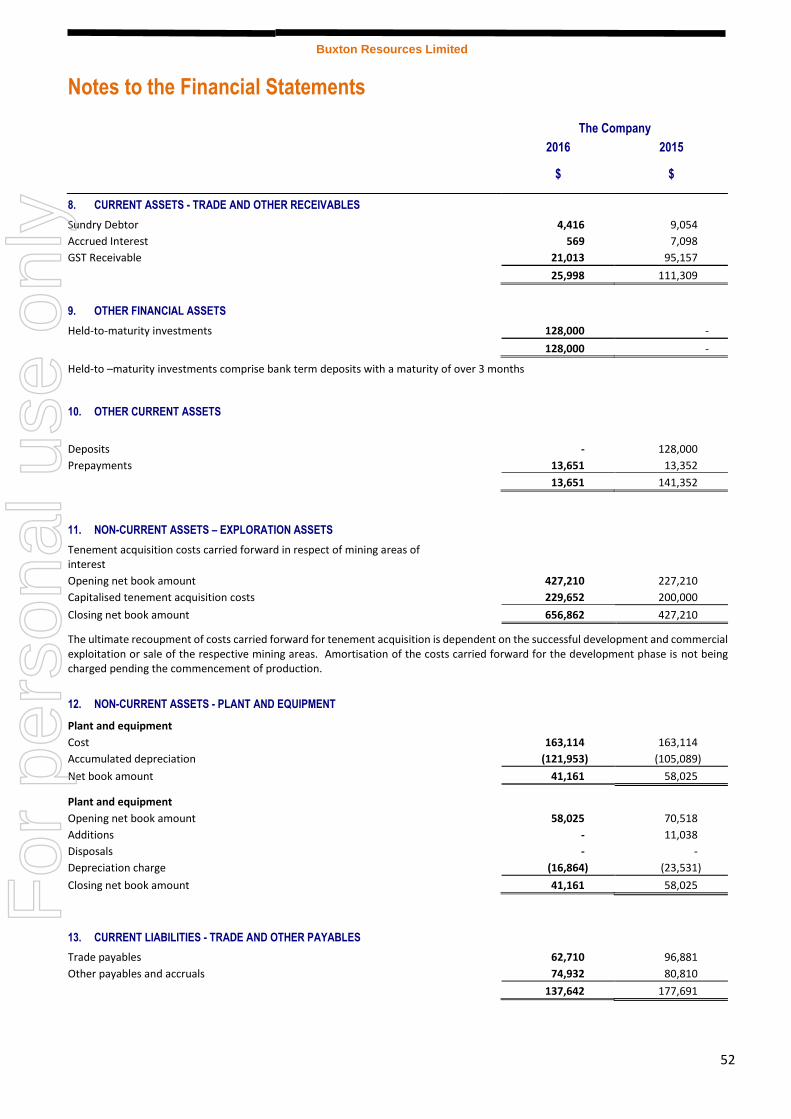
Buxton Resources Limited
Notes to the Financial Statements
52
The Company
2016 2015
$ $
8. CURRENT ASSETS - TRADE AND OTHER RECEIVABLES
Sundry Debtor 4,416 9,054
Accrued Interest 569 7,098
GST Receivable 21,013 95,157
25,998 111,309
9. OTHER FINANCIAL ASSETS
Held-to-maturity investments 128,000 -
128,000 -
Held-to –maturity investments comprise bank term deposits with a maturity of over 3 months
10. OTHER CURRENT ASSETS
Deposits - 128,000
Prepayments 13,651 13,352
13,651 141,352
11. NON-CURRENT ASSETS – EXPLORATION ASSETS
Tenement acquisition costs carried forward in respect of mining areas of interest
Opening net book amount 427,210 227,210
Capitalised tenement acquisition costs 229,652 200,000
Closing net book amount 656,862 427,210
The ultimate recoupment of costs carried forward for tenement acquisition is dependent on the successful development and commercial exploitation or sale of the respective mining areas. Amortisation of the costs carried forward for the development phase is not being charged pending the commencement of production.
12. NON-CURRENT ASSETS - PLANT AND EQUIPMENT
Plant and equipment
Cost 163,114 163,114
Accumulated depreciation (121,953) (105,089)
Net book amount 41,161 58,025
Plant and equipment
Opening net book amount 58,025 70,518
Additions - 11,038
Disposals - -
Depreciation charge (16,864) (23,531)
Closing net book amount 41,161 58,025
13. CURRENT LIABILITIES - TRADE AND OTHER PAYABLES
Trade payables 62,710 96,881
Other payables and accruals 74,932 80,810
137,642 177,691
For
per
sona
l use
onl
y
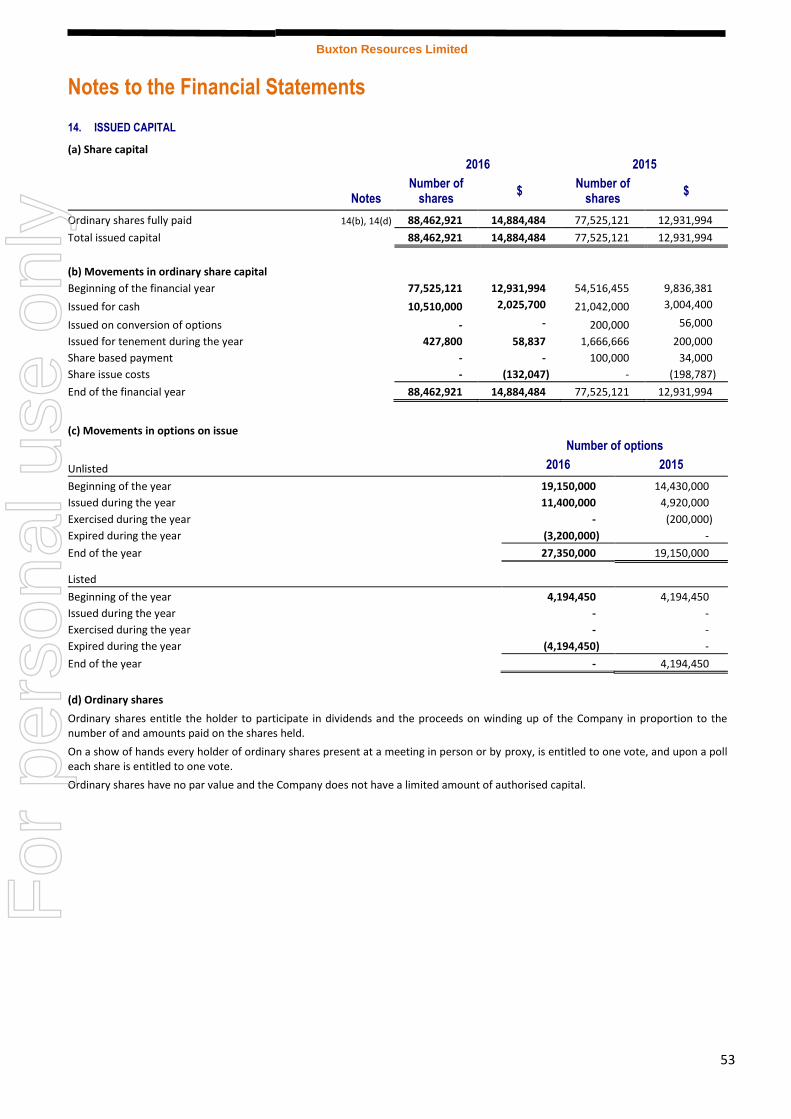
Buxton Resources Limited
Notes to the Financial Statements
53
14. ISSUED CAPITAL
(a) Share capital
2016 2015
Notes Number of
shares $
Number of shares
$
Ordinary shares fully paid 14(b), 14(d) 88,462,921 14,884,484 77,525,121 12,931,994
Total issued capital 88,462,921 14,884,484 77,525,121 12,931,994
(b) Movements in ordinary share capital
Beginning of the financial year 77,525,121 12,931,994 54,516,455 9,836,381
Issued for cash 10,510,000 2,025,700 21,042,000 3,004,400
Issued on conversion of options - - 200,000 56,000
Issued for tenement during the year 427,800 58,837 1,666,666 200,000
Share based payment - - 100,000 34,000
Share issue costs - (132,047) - (198,787)
End of the financial year 88,462,921 14,884,484 77,525,121 12,931,994
(c) Movements in options on issue
Number of options
Unlisted 2016 2015
Beginning of the year 19,150,000 14,430,000
Issued during the year 11,400,000 4,920,000
Exercised during the year - (200,000)
Expired during the year (3,200,000) -
End of the year 27,350,000 19,150,000
Listed
Beginning of the year 4,194,450 4,194,450
Issued during the year - -
Exercised during the year - -
Expired during the year (4,194,450) -
End of the year - 4,194,450
(d) Ordinary shares
Ordinary shares entitle the holder to participate in dividends and the proceeds on winding up of the Company in proportion to the number of and amounts paid on the shares held.
On a show of hands every holder of ordinary shares present at a meeting in person or by proxy, is entitled to one vote, and upon a poll each share is entitled to one vote.
Ordinary shares have no par value and the Company does not have a limited amount of authorised capital.
For
per
sona
l use
onl
y
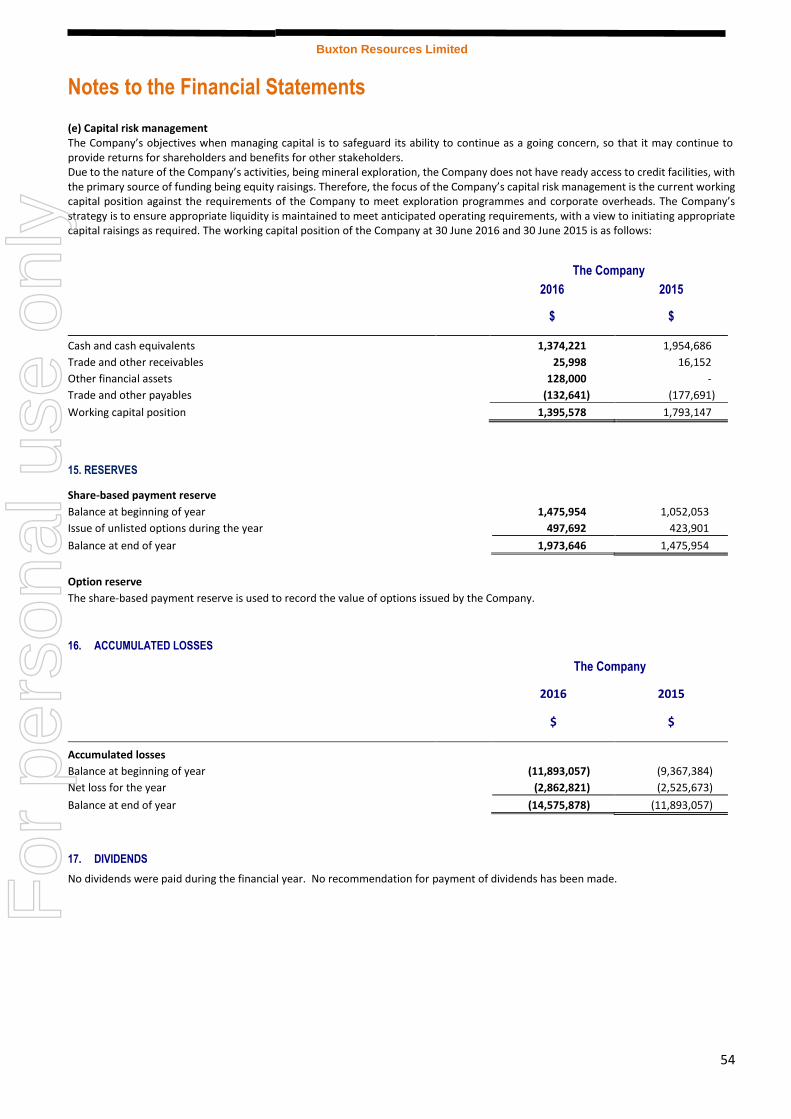
Buxton Resources Limited
Notes to the Financial Statements
54
(e) Capital risk management The Company’s objectives when managing capital is to safeguard its ability to continue as a going concern, so that it may continue to provide returns for shareholders and benefits for other stakeholders. Due to the nature of the Company’s activities, being mineral exploration, the Company does not have ready access to credit facilities, with the primary source of funding being equity raisings. Therefore, the focus of the Company’s capital risk management is the current working capital position against the requirements of the Company to meet exploration programmes and corporate overheads. The Company’s strategy is to ensure appropriate liquidity is maintained to meet anticipated operating requirements, with a view to initiating appropriate capital raisings as required. The working capital position of the Company at 30 June 2016 and 30 June 2015 is as follows:
The Company
2016 2015
$ $
Cash and cash equivalents 1,374,221 1,954,686
Trade and other receivables 25,998 16,152
Other financial assets 128,000 -
Trade and other payables (132,641) (177,691)
Working capital position 1,395,578 1,793,147
15. RESERVES
Share-based payment reserve
Balance at beginning of year 1,475,954 1,052,053
Issue of unlisted options during the year 497,692 423,901
Balance at end of year 1,973,646 1,475,954
Option reserve
The share-based payment reserve is used to record the value of options issued by the Company.
16. ACCUMULATED LOSSES
The Company
2016 2015
$ $
Accumulated losses
Balance at beginning of year (11,893,057) (9,367,384)
Net loss for the year (2,862,821) (2,525,673)
Balance at end of year (14,575,878) (11,893,057)
17. DIVIDENDS
No dividends were paid during the financial year. No recommendation for payment of dividends has been made. For
per
sona
l use
onl
y

Buxton Resources Limited
Notes to the Financial Statements
55
18. DIRECTORS AND EXECUTIVES DISCLOSURES
The aggregate compensation made to directors and other key management personnel of the Company is set out below:
The Company
2016 2015
Short-term benefits 239,599 446,225
Post-employment benefits 15,794 14,583
Share based payments 248,583 343,233
503,976 804,041
Detailed remuneration disclosures are provided in the remuneration report on page 26.
19. REMUNERATION OF AUDITORS
The Company
2016 2015
$ $
During the year the following fees were paid or payable for services provided by the auditor of the Company, its related practices and non-related audit firms:
Audit services
Rothsay Chartered Accountants - audit and review of financial reports 24,500 24,500
Total remuneration for audit services 24,500 24,500
20. CONTINGENCIES
Contingent Remuneration
There are no material contingent liabilities or contingent assets of the Company at balance date.
21. COMMITMENTS
(a) Exploration commitments
The Company has certain commitments to meet minimum expenditure requirements on the mining exploration assets it has an interest in. Outstanding exploration commitments are as follows:
2016 2015
$ $
within one year 1,175,720 775,000
later than one year but not later than five years 5,278,880 2,041,625
6,454,600 2,816,625
(b) Lease commitments: Company as lessee
2016 2015
$ $
within one year 24,900 45,125
later than one year but not later than five years 26,975 3,760
51,875 48,885
For
per
sona
l use
onl
y
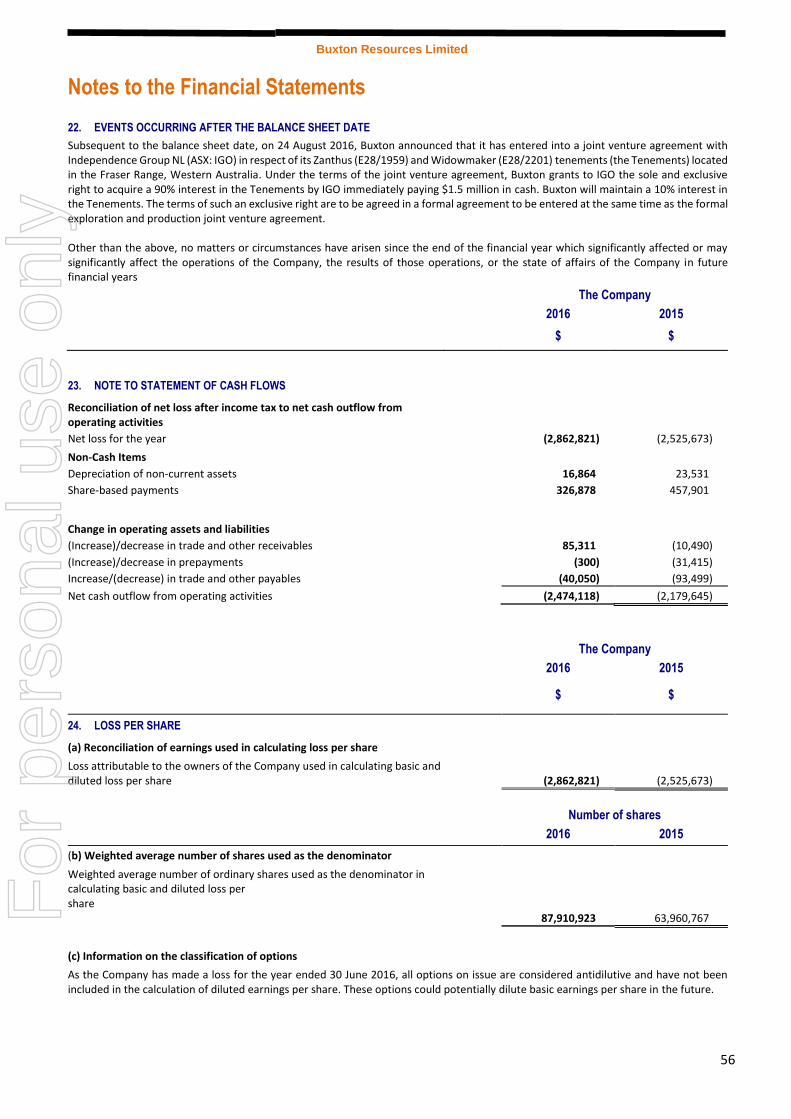
Buxton Resources Limited
Notes to the Financial Statements
56
22. EVENTS OCCURRING AFTER THE BALANCE SHEET DATE
Subsequent to the balance sheet date, on 24 August 2016, Buxton announced that it has entered into a joint venture agreement with Independence Group NL (ASX: IGO) in respect of its Zanthus (E28/1959) and Widowmaker (E28/2201) tenements (the Tenements) located in the Fraser Range, Western Australia. Under the terms of the joint venture agreement, Buxton grants to IGO the sole and exclusive right to acquire a 90% interest in the Tenements by IGO immediately paying $1.5 million in cash. Buxton will maintain a 10% interest in the Tenements. The terms of such an exclusive right are to be agreed in a formal agreement to be entered at the same time as the formal exploration and production joint venture agreement. Other than the above, no matters or circumstances have arisen since the end of the financial year which significantly affected or may significantly affect the operations of the Company, the results of those operations, or the state of affairs of the Company in future financial years The Company
2016 2015
$ $
23. NOTE TO STATEMENT OF CASH FLOWS
Reconciliation of net loss after income tax to net cash outflow from operating activities
Net loss for the year (2,862,821) (2,525,673)
Non-Cash Items
Depreciation of non-current assets 16,864 23,531
Share-based payments 326,878 457,901
Change in operating assets and liabilities
(Increase)/decrease in trade and other receivables 85,311 (10,490)
(Increase)/decrease in prepayments (300) (31,415)
Increase/(decrease) in trade and other payables (40,050) (93,499)
Net cash outflow from operating activities (2,474,118) (2,179,645)
The Company
2016 2015
$ $
24. LOSS PER SHARE
(a) Reconciliation of earnings used in calculating loss per share
Loss attributable to the owners of the Company used in calculating basic and diluted loss per share (2,862,821) (2,525,673)
Number of shares
2016 2015
(b) Weighted average number of shares used as the denominator
Weighted average number of ordinary shares used as the denominator in calculating basic and diluted loss per share 87,910,923 63,960,767
(c) Information on the classification of options
As the Company has made a loss for the year ended 30 June 2016, all options on issue are considered antidilutive and have not been included in the calculation of diluted earnings per share. These options could potentially dilute basic earnings per share in the future.
For
per
sona
l use
onl
y
57
Buxton Resources Limited
Directors' Declaration
In the directors’ opinion:
(a) the financial statements and notes set out on pages 29 to 56 are in accordance with the Corporations Act 2001, including:
(i) complying with Accounting Standards, the Corporations Regulations 2001 and other mandatory professional reporting requirements; and
(ii) giving a true and fair view of the Company’s financial position as at 30 June 2016 and of its performance for the financial year ended on that date;
(b) there are reasonable grounds to believe that the Company will be able to pay its debts as and when they become due and payable; and
(c) a statement that the attached financial statements are in compliance with International Financial Reporting Standards has been included in the notes to the financial statements.
The directors have been given the declarations by the chief executive officer and chief financial officer required by section 295A of the Corporations Act 2001.
This declaration is made in accordance with a resolution of the directors.
Seamus Cornelius
Non-Executive Chairman
Perth, 29 September 2016
For
per
sona
l use
onl
y

For
per
sona
l use
onl
y

For
per
sona
l use
onl
y

Buxton Resources Limited
ASX Additional Information
61
Additional information required by Australian Stock Exchange Ltd and not shown elsewhere in this report is as follows. Unless otherwise stated, the information is current as at 19 September 2016.
(a) Distribution of equity securities
Analysis of numbers of equity security holders by size of holding:
Ordinary shares
Number of holders Number of shares
1 - 1,000 56 11,048
1,001 - 5,000 180 587,679
5,001 - 10,000 222 1,911,143
10,001 - 100,000 530 21,436,414
100,001 and over 151 64,516,637
1,139 88,462,921
Minimum $ 500.00 parcel at $0.08 per unit 270 791,698
Unlisted Options expiring 15/11/17 @ $0.28
Number of holders Number of options
1 - 1,000 0 0
1,001 - 5,000 0 0
5,001 - 10,000 0 0
10,001 - 100,000 5 205,000
100,001 and over 7 3,550,000
12 3,755,000
The number of shareholders holding less than a marketable parcel of shares are: 0 0
For
per
sona
l use
onl
y
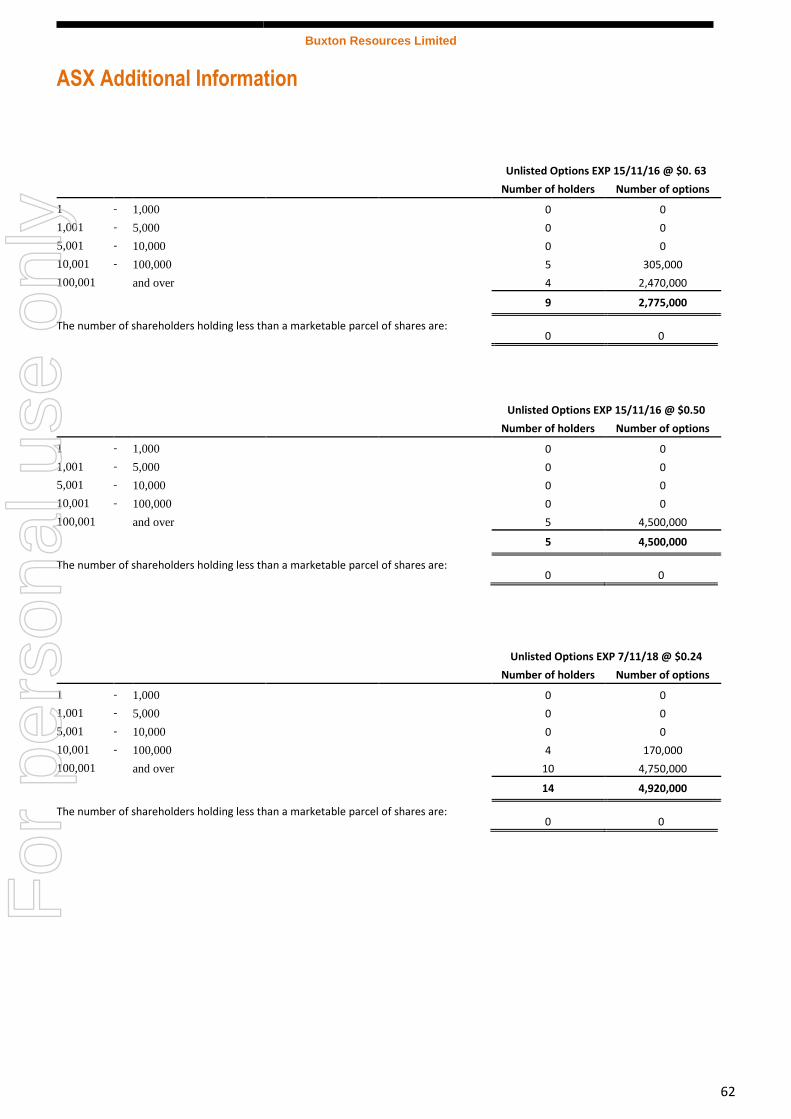
Buxton Resources Limited
ASX Additional Information
62
Unlisted Options EXP 15/11/16 @ $0. 63
Number of holders Number of options
1 - 1,000 0 0
1,001 - 5,000 0 0
5,001 - 10,000 0 0
10,001 - 100,000 5 305,000
100,001 and over 4 2,470,000
9 2,775,000
The number of shareholders holding less than a marketable parcel of shares are: 0 0
Unlisted Options EXP 15/11/16 @ $0.50
Number of holders Number of options
1 - 1,000 0 0
1,001 - 5,000 0 0
5,001 - 10,000 0 0
10,001 - 100,000 0 0
100,001 and over 5 4,500,000
5 4,500,000
The number of shareholders holding less than a marketable parcel of shares are: 0 0
Unlisted Options EXP 7/11/18 @ $0.24
Number of holders Number of options
1 - 1,000 0 0
1,001 - 5,000 0 0
5,001 - 10,000 0 0
10,001 - 100,000 4 170,000
100,001 and over 10 4,750,000
14 4,920,000
The number of shareholders holding less than a marketable parcel of shares are: 0 0
For
per
sona
l use
onl
y

Buxton Resources Limited
ASX Additional Information
63
(b) Twenty largest shareholders
The names of the twenty largest holders of quoted ordinary shares are:
(c) Substantial shareholders At the date of this report the following shareholders had lodged substantial shareholder notices with the Company, in accordance with section 671B of the Corporations Act 2001 are:
1. National Business Holding (VU) Ltd is a substantial shareholder holding a relevant interest in 8,667,728 shares representing 9.8% of the voting power.
(d) Voting rights
All ordinary shares (whether fully paid or not) carry one vote per share without restriction.
For
per
sona
l use
onl
y
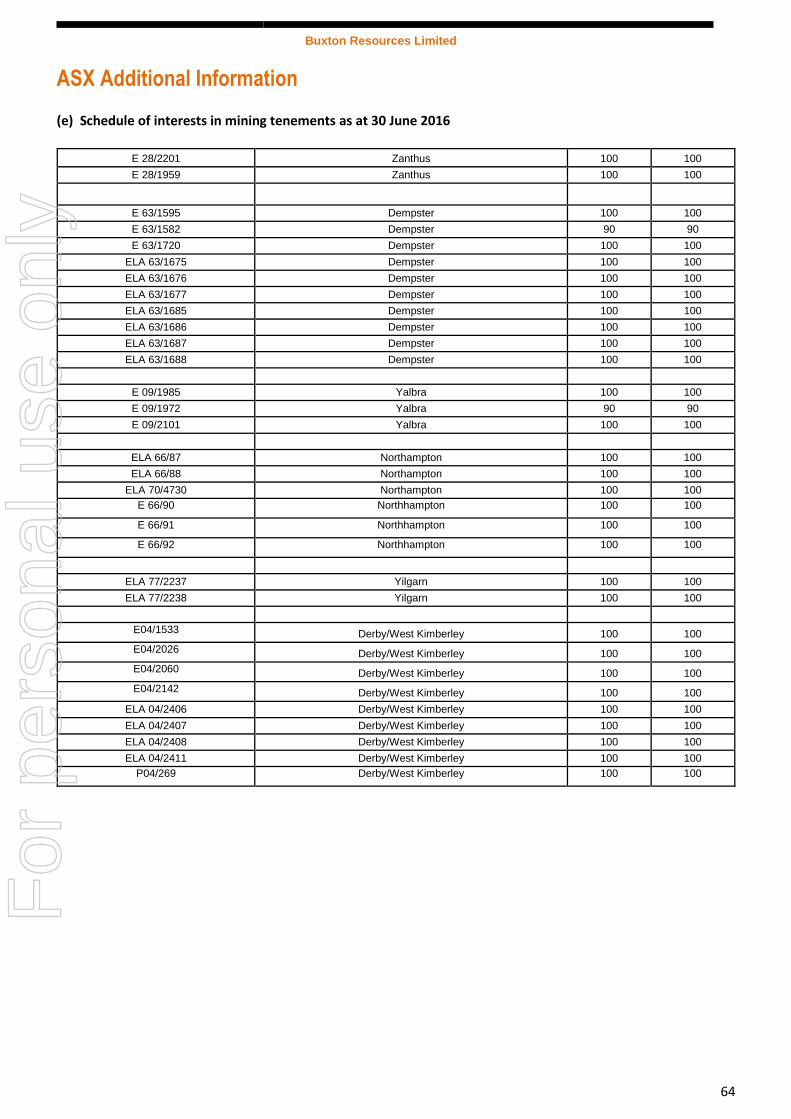
Buxton Resources Limited
ASX Additional Information
64
(e) Schedule of interests in mining tenements as at 30 June 2016
E 28/2201 Zanthus 100 100 E 28/1959 Zanthus 100 100
E 63/1595 Dempster 100 100 E 63/1582 Dempster 90 90 E 63/1720 Dempster 100 100
ELA 63/1675 Dempster 100 100 ELA 63/1676 Dempster 100 100 ELA 63/1677 Dempster 100 100 ELA 63/1685 Dempster 100 100 ELA 63/1686 Dempster 100 100 ELA 63/1687 Dempster 100 100 ELA 63/1688 Dempster 100 100
E 09/1985 Yalbra 100 100 E 09/1972 Yalbra 90 90 E 09/2101 Yalbra 100 100
ELA 66/87 Northampton 100 100 ELA 66/88 Northampton 100 100
ELA 70/4730 Northampton 100 100
E 66/90 Northhampton 100 100
E 66/91 Northhampton 100 100
E 66/92 Northhampton 100 100
ELA 77/2237 Yilgarn 100 100 ELA 77/2238 Yilgarn 100 100
E04/1533 Derby/West Kimberley 100 100
E04/2026 Derby/West Kimberley 100 100
E04/2060 Derby/West Kimberley 100 100
E04/2142 Derby/West Kimberley 100 100
ELA 04/2406 Derby/West Kimberley 100 100
ELA 04/2407 Derby/West Kimberley 100 100
ELA 04/2408 Derby/West Kimberley 100 100
ELA 04/2411 Derby/West Kimberley 100 100
P04/269 Derby/West Kimberley 100 100
For
per
sona
l use
onl
y