Upload
others
View
0
Download
0
Embed Size (px)
Citation preview

2020 Financial Results ndash 26 August 2020JIM BEYER ndash Managing Director amp CEO amp JON LATTO ndash Chief Financial Officer ASXRRL
For
per
sona
l use
onl
y
These materials prepared by Regis Resources Limited (or ldquothe Companyrdquo) include forward looking statements Often but not always forward looking statements can generally beidentified by the use of forward looking words such as ldquomayrdquo ldquowillrdquo ldquoexpectrdquo ldquointendrdquo ldquoplanrdquo ldquoestimaterdquo ldquoanticipaterdquo ldquocontinuerdquo and ldquoguidancerdquo or other similar words andmay include without limitation statements regarding plans strategies and objectives of management anticipated production or construction commencement dates and expectedcosts or production outputs
Forward looking statements inherently involve known and unknown risks uncertainties and other factors that may cause the Companyrsquos actual results performance andachievements to differ materially from any future results performance or achievements Relevant factors may include but are not limited to changes in commodity prices foreignexchange fluctuations and general economic conditions increased costs and demand for production inputs the speculative nature of exploration and project developmentincluding the risks of obtaining necessary licenses and permits and diminishing quantities or grades of reserves political and social risks changes to the regulatory frameworkwithin which the Company operates or may in the future operate environmental conditions including extreme weather conditions recruitment and retention of personnelindustrial relations issues and litigation
Forward looking statements are based on the Company and its managementrsquos good faith assumptions relating to the financial market regulatory and other relevant environmentsthat will exist and affect the Companyrsquos business and operations in the future The Company does not give any assurance that the assumptions on which forward lookingstatements are based will prove to be correct or that the Companyrsquos business or operations will not be affected in any material manner by these or other factors not foreseen orforeseeable by the Company or management or beyond the Companyrsquos control
Although the Company attempts and has attempted to identify factors that would cause actual actions events or results to differ materially from those disclosed in forward lookingstatements there may be other factors that could cause actual results performance achievements or events not to be as anticipated estimated or intended and many events arebeyond the reasonable control of the Company Accordingly readers are cautioned not to place undue reliance on forward looking statements Forward looking statements inthese materials speak only at the date of issue Subject to any continuing obligations under applicable law or any relevant stock exchange listing rules in providing this informationthe Company does not undertake any obligation to publicly update or revise any of the forward looking statements or to advise of any change in events conditions orcircumstances on which any such statement is based
ASX announcements are available on the Companyrsquos website at wwwregisresourcescomau
CAUTIONARY STATEMENT2
For
per
sona
l use
onl
y
3FY20 FINANCIAL HIGHLIGHTS
Record NPAT of $200M up 22NPAT Margin of 26
EPS up 22 to 39 cents per shareROE of 24
Cash flow from operating activities
$343m up 24
Full Year Dividends 16c per share
29 basic yield41 grossed up yield3
EBITDA1
$394m up 28EBITDA Margin 52
Cash amp Bullion$209m2
No debt
1 EBITDA is an adjusted measure of earnings before interest taxes depreciation and amortisation EBITDA is non-IFRS financial information and is not subject to audit The measure is included to assist investors to better understand the performance of the business EBITDA in FY20 was increased by $89 million as a result of the introduction of AASB16 (Leases)
2 Includes bullion on hand valued at $2576 per ounce3 Grossed up for 100 franking Annualised dividend yield of 16cps at a closing share price of $555 on 25 August 2020
For
per
sona
l use
onl
y
FY2020 FULL YEAR FINANCIAL RESULTS4
UnitFY2020
30 June 2020FY2019
30 June 2019Ounces Produced oz 352042 363418 Ounces Sold oz 353182 369721Average Realised Price $oz 2200 1765
Sales Revenue1 $m 7567 6548 Royalties $m (373) (284)Cost of Sales $m (4148) (3736)Gross Profit $m 3046 2528
Other Income(Expenses) $m (02) 44 Administration and Other Costs $m (161) (156)Finance Costs $m (20) (14)Exploration expenditure written off $m (17) (67)Profit Before Tax $m 2846 2335 Income Tax Expense $m (851) (703)Net Profit After Tax $m 1995 1631 All-in-Sustaining-Costs $oz 1246 1029
1 In FY2020 sales revenue is net of $212m in capitalised revenue generated from pre-production assets2 Includes bullion on hand valued at $2576 per ounce
Record NPAT of$200M up 22
NPAT Margin of 26EPS up 22 to 39 cents
ROE of 24
EBITDA A$394m up 28EBITDA Margin 52
Cash amp BullionA$209m2
No debt
For
per
sona
l use
onl
y
STRONG PERFORMANCE ON KEY FINANCIAL METRICS5FY20 continues the trend
181234 253
313 307
394
3947 47 52 47 52
0
20
40
60
80
100
0
100
200
300
400
500
2015 2016 2017 2018 2019 2020
EBIT
DAR
even
ue (
)
$ M
illio
ns
EBITDA and Margin
EBITDA EBITDA Margin ()
174224
276
346322
393
60
130 150 160 160 160
05
1015202530354045
2015 2016 2017 2018 2019 2020
Cent
s per
Sha
re
Earnings amp Dividend per Share
EPS Dividend per share
87 112138
174 163200
0
5
10
15
20
25
30
35
0
50
100
150
200
250
2015 2016 2017 2018 2019 2020
$Mill
ions
Net Profit After Tax and Margin
NPAT NPAT Margin
310 305 324 361 363 352
$0
$500
$1000
$1500
$2000
$2500
-
50
100
150
200
250
300
350
400
2015 2016 2017 2018 2019 2020
AISC
oz
Koz
Production withRealised Gold Price and AISC
Gold Production Realised Gold Price Per Oz AISC Per Oz
Production Realised Gold Price amp AISC
For
per
sona
l use
onl
y
EBITDA and Margin
EBITDA
20152016201720182019202018123425331330739414100000000002EBITDA Margin ()
20152016201720182019202003892473118279569704661354581673306504650735294117647205165016501650164804694189602446483052089784406937356
$ Millions
EBITDARevenue ()
Revenue
Revenue
20152016201720182019202046550254460665475665700000000004
$ Millions
Net Profit After Tax
NPAT
20152016201720182019202087112138174163199517NPAT Margin20152016201720182019202001870967741935483902231075697211155302536764705882352802871287128712871102492354740061162026368222325307239
$Millions
EBITDA
EBITDA
20152016201720182019202018123425331330739414100000000002EBITDA Margin ()
20152016201720182019202003892473118279569704661354581673306504650735294117647205165016501650164804694189602446483052089784406937356
$ Millions
EBITDARevenue ()
Earnings amp Dividend per Share
EPS
20152016201720182019202017399999999999999224275934632183926Dividend per share
20152016201720182019202061315161616
Cents per Share
Production with
Realised Gold Price and AISC
Gold Production
20152016201720182019202031002430508432435300000000001361372999999999993634180000000000135204199999999997Realised Gold Price Per Oz201520162017201820192020148816001691167617652200AISC Per Oz201520162017201820192020994926879448590103102916000000000011246
Koz
AISCoz
Cash and Bullion Balance Excl Dividends
Cash and Bullion Balance201520162017201820192020Dividends201520162017201820192020
Dividends Declared
Interim
201520162017201820192020047888Final
201520162017201820192020698888
Cents per Share
Cumulative Dividends Paid
20132014201520162017201820192020757510517024532640748832281288000001
$ Millions
Duketon Gold Reserves 2009 -2017
Ends
2009 ReserveMining DepletionDiscoveryCurrent Reserves603584002179584BeforeBudgetMLW Sales QtyMLW Sales PriceMLW COGSGDW Sales QtyGDW Sales PriceGDW COGSRMT Sales QtyRMT Sales PriceRMT COGSGIC Mvmt AllActual603584-1248353AfterBudgetMLW Sales QtyMLW Sales PriceMLW COGSGDW Sales QtyGDW Sales PriceGDW COGSRMT Sales QtyRMT Sales PriceRMT COGSGIC Mvmt AllActual-12483532179584Label Y
-18519373427937-32238454656155Line Y152535603584-12483532179584
Annual Gold Production amp Milled Grade
Ounces Recovered1234567891014268801161428873181015988838041351792984412915424319272013332356702177647158664950932090624306474577221087733917052421224493372104644162104609766314578621046097663145786Milled Grade (gt)123456789100895569124782444210946257386951172230937278942195154951007440563400282309332574237366220210928695890410962110235698630137117353452054794531462642404603127714626424046031277
Ounces
gt Au
Group Mineral Resource
Ends
31 March 2018DepletionModel UpdateNew Deposits31 March 201980547420007858905BeforeBudgetMLW Sales QtyMLW Sales PriceMLW COGSGDW Sales QtyGDW Sales PriceGDW COGSRMT Sales QtyRMT Sales PriceRMT COGSGIC Mvmt AllActual805474276590717628865AfterBudgetMLW Sales QtyMLW Sales PriceMLW COGSGDW Sales QtyGDW Sales PriceGDW COGSRMT Sales QtyRMT Sales PriceRMT COGSGIC Mvmt AllActual765907176288657858905Label Y
-395671-302062300407856906576439687743885Line Y152535458054742765907176288657858905
Group Ore Reserves
Ends31 March 2017DepletionModel UpdateNew Deposits31 March 201821818650004064752BeforeBudgetMLW Sales QtyMLW Sales PriceMLW COGSGDW Sales QtyGDW Sales PriceGDW COGSRMT Sales QtyRMT Sales PriceRMT COGSGIC Mvmt AllActual218186517861942030570AfterBudgetMLW Sales QtyMLW Sales PriceMLW COGSGDW Sales QtyGDW Sales PriceGDW COGSRMT Sales QtyRMT Sales PriceRMT COGSGIC Mvmt AllActual178619420305704064752Label Y-39567124437620341821984029519083823047661Line Y152535452181865178619420305704064752
Net Assets amp EPS
Net Assets2014201520162017201820193214104825396377164Revenue201420152016201720182019372465502544606Net Assets
201420152016201720182019321410482539637EPS
201420152016201720182019-29681739223727593463218
$ mILLIONS
Revenue amp NPAT
Revenue
201420152016201720182019372465502544606652NPAT
201420152016201720182019-14887112138174163
$ MILLIONS
Cash amp Gold on Hand - 30 June 2019
Ends
$2053m
43281OperationsDividendsMine developmentExplorationOther capexIncome taxOther43646208802950000000020524558200090003BeforeBudgetMLW Sales QtyMLW Sales PriceMLW COGSGDW Sales QtyGDW Sales PriceGDW COGSRMT Sales QtyRMT Sales PriceRMT COGSGIC Mvmt AllActual208802950537487779220900064562915852209000636015953274090004325321224320900022678751580009000321390415800090003AfterBudgetMLW Sales QtyMLW Sales PriceMLW COGSGDW Sales QtyGDW Sales PriceGDW COGSRMT Sales QtyRMT Sales PriceRMT COGSGIC Mvmt AllActual53748777922090006456291585220900063601595327409000432532122432090002267875158000900032139041580009000320524558200090003Label Y
3286848292209-81196194-96132052480000004-34838308420000002-57446066319999993-53971000-8658576373145364610450034968896822209000640822555898090005342740378530929659819116092408896580009000320957487000090003Line Y152535455565758520880295053748777922090006456291585220900063601595327409000432532122432090002267875158000900032139041580009000320524558200090003
Note Waterfall is prepared based on the Cash Flow statement as it stands when the quarterly is ready for release Changes may occur between this version and the final version of the cash flow in the management accounts
Earnings amp Dividend per Share
EPS
20152016201720182019202017399999999999999224275934632183926Dividend per share
20152016201720182019202061315161616
Cents per Share
Revenue
Revenue
20152016201720182019202046550254460665475665700000000004
$ Millions
Net Profit After Tax
NPAT
20152016201720182019202087112138174163199517NPAT Margin20152016201720182019202001870967741935483902231075697211155302536764705882352802871287128712871102492354740061162026368222325307239
$Millions
EBITDA
EBITDA
20152016201720182019202018123425331330739414100000000002EBITDA Margin ()
20152016201720182019202003892473118279569704661354581673306504650735294117647205165016501650164804694189602446483052089784406937356
$ Millions
EBITDARevenue ()
Earnings amp Dividend per Share
EPS
20152016201720182019202017399999999999999224275934632183926Dividend per share
20152016201720182019202061315161616
Cents per Share
Production with
Realised Gold Price and AISC
Gold Production
20152016201720182019202031002430508432435300000000001361372999999999993634180000000000135204199999999997Realised Gold Price Per Oz201520162017201820192020148816001691167617652200AISC Per Oz201520162017201820192020994926879448590103102916000000000011246
Koz
AISCoz
Cash and Bullion Balance Excl Dividends
Cash and Bullion Balance201520162017201820192020Dividends201520162017201820192020
Dividends Declared
Interim
201520162017201820192020047888Final
201520162017201820192020698888
Cents per Share
Cumulative Dividends Paid
20132014201520162017201820192020757510517024532640748832281288000001
$ Millions
Duketon Gold Reserves 2009 -2017
Ends
2009 ReserveMining DepletionDiscoveryCurrent Reserves603584002179584BeforeBudgetMLW Sales QtyMLW Sales PriceMLW COGSGDW Sales QtyGDW Sales PriceGDW COGSRMT Sales QtyRMT Sales PriceRMT COGSGIC Mvmt AllActual603584-1248353AfterBudgetMLW Sales QtyMLW Sales PriceMLW COGSGDW Sales QtyGDW Sales PriceGDW COGSRMT Sales QtyRMT Sales PriceRMT COGSGIC Mvmt AllActual-12483532179584Label Y
-18519373427937-32238454656155Line Y152535603584-12483532179584
Annual Gold Production amp Milled Grade
Ounces Recovered1234567891014268801161428873181015988838041351792984412915424319272013332356702177647158664950932090624306474577221087733917052421224493372104644162104609766314578621046097663145786Milled Grade (gt)123456789100895569124782444210946257386951172230937278942195154951007440563400282309332574237366220210928695890410962110235698630137117353452054794531462642404603127714626424046031277
Ounces
gt Au
Group Mineral Resource
Ends
31 March 2018DepletionModel UpdateNew Deposits31 March 201980547420007858905BeforeBudgetMLW Sales QtyMLW Sales PriceMLW COGSGDW Sales QtyGDW Sales PriceGDW COGSRMT Sales QtyRMT Sales PriceRMT COGSGIC Mvmt AllActual805474276590717628865AfterBudgetMLW Sales QtyMLW Sales PriceMLW COGSGDW Sales QtyGDW Sales PriceGDW COGSRMT Sales QtyRMT Sales PriceRMT COGSGIC Mvmt AllActual765907176288657858905Label Y
-395671-302062300407856906576439687743885Line Y152535458054742765907176288657858905
Group Ore Reserves
Ends31 March 2017DepletionModel UpdateNew Deposits31 March 201821818650004064752BeforeBudgetMLW Sales QtyMLW Sales PriceMLW COGSGDW Sales QtyGDW Sales PriceGDW COGSRMT Sales QtyRMT Sales PriceRMT COGSGIC Mvmt AllActual218186517861942030570AfterBudgetMLW Sales QtyMLW Sales PriceMLW COGSGDW Sales QtyGDW Sales PriceGDW COGSRMT Sales QtyRMT Sales PriceRMT COGSGIC Mvmt AllActual178619420305704064752Label Y-39567124437620341821984029519083823047661Line Y152535452181865178619420305704064752
Net Assets amp EPS
Net Assets2014201520162017201820193214104825396377164Revenue201420152016201720182019372465502544606Net Assets
201420152016201720182019321410482539637EPS
201420152016201720182019-29681739223727593463218
$ mILLIONS
Revenue amp NPAT
Revenue
201420152016201720182019372465502544606652NPAT
201420152016201720182019-14887112138174163
$ MILLIONS
Cash amp Gold on Hand - 30 June 2019
Ends
$2053m
43281OperationsDividendsMine developmentExplorationOther capexIncome taxOther43646208802950000000020524558200090003BeforeBudgetMLW Sales QtyMLW Sales PriceMLW COGSGDW Sales QtyGDW Sales PriceGDW COGSRMT Sales QtyRMT Sales PriceRMT COGSGIC Mvmt AllActual208802950537487779220900064562915852209000636015953274090004325321224320900022678751580009000321390415800090003AfterBudgetMLW Sales QtyMLW Sales PriceMLW COGSGDW Sales QtyGDW Sales PriceGDW COGSRMT Sales QtyRMT Sales PriceRMT COGSGIC Mvmt AllActual53748777922090006456291585220900063601595327409000432532122432090002267875158000900032139041580009000320524558200090003Label Y
3286848292209-81196194-96132052480000004-34838308420000002-57446066319999993-53971000-8658576373145364610450034968896822209000640822555898090005342740378530929659819116092408896580009000320957487000090003Line Y152535455565758520880295053748777922090006456291585220900063601595327409000432532122432090002267875158000900032139041580009000320524558200090003
Note Waterfall is prepared based on the Cash Flow statement as it stands when the quarterly is ready for release Changes may occur between this version and the final version of the cash flow in the management accounts
Net Profit After Tax and Margin
NPAT
20152016201720182019202087112138174163199517NPAT Margin20152016201720182019202001870967741935483902231075697211155302536764705882352802871287128712871102492354740061162026368222325307239
$Millions
Revenue
Revenue
20152016201720182019202046550254460665475665700000000004
$ Millions
Net Profit After Tax
NPAT
20152016201720182019202087112138174163199517NPAT Margin20152016201720182019202001870967741935483902231075697211155302536764705882352802871287128712871102492354740061162026368222325307239
$Millions
EBITDA
EBITDA
20152016201720182019202018123425331330739414100000000002EBITDA Margin ()
20152016201720182019202003892473118279569704661354581673306504650735294117647205165016501650164804694189602446483052089784406937356
$ Millions
EBITDARevenue ()
Earnings amp Dividend per Share
EPS
20152016201720182019202017399999999999999224275934632183926Dividend per share
20152016201720182019202061315161616
Cents per Share
Production with
Realised Gold Price and AISC
Gold Production
20152016201720182019202031002430508432435300000000001361372999999999993634180000000000135204199999999997Realised Gold Price Per Oz201520162017201820192020148816001691167617652200AISC Per Oz201520162017201820192020994926879448590103102916000000000011246
Koz
AISCoz
Cash and Bullion Balance Excl Dividends
Cash and Bullion Balance201520162017201820192020Dividends201520162017201820192020
Dividends Declared
Interim
201520162017201820192020047888Final
201520162017201820192020698888
Cents per Share
Cumulative Dividends Paid
20132014201520162017201820192020757510517024532640748832281288000001
$ Millions
Duketon Gold Reserves 2009 -2017
Ends
2009 ReserveMining DepletionDiscoveryCurrent Reserves603584002179584BeforeBudgetMLW Sales QtyMLW Sales PriceMLW COGSGDW Sales QtyGDW Sales PriceGDW COGSRMT Sales QtyRMT Sales PriceRMT COGSGIC Mvmt AllActual603584-1248353AfterBudgetMLW Sales QtyMLW Sales PriceMLW COGSGDW Sales QtyGDW Sales PriceGDW COGSRMT Sales QtyRMT Sales PriceRMT COGSGIC Mvmt AllActual-12483532179584Label Y
-18519373427937-32238454656155Line Y152535603584-12483532179584
Annual Gold Production amp Milled Grade
Ounces Recovered1234567891014268801161428873181015988838041351792984412915424319272013332356702177647158664950932090624306474577221087733917052421224493372104644162104609766314578621046097663145786Milled Grade (gt)123456789100895569124782444210946257386951172230937278942195154951007440563400282309332574237366220210928695890410962110235698630137117353452054794531462642404603127714626424046031277
Ounces
gt Au
Group Mineral Resource
Ends
31 March 2018DepletionModel UpdateNew Deposits31 March 201980547420007858905BeforeBudgetMLW Sales QtyMLW Sales PriceMLW COGSGDW Sales QtyGDW Sales PriceGDW COGSRMT Sales QtyRMT Sales PriceRMT COGSGIC Mvmt AllActual805474276590717628865AfterBudgetMLW Sales QtyMLW Sales PriceMLW COGSGDW Sales QtyGDW Sales PriceGDW COGSRMT Sales QtyRMT Sales PriceRMT COGSGIC Mvmt AllActual765907176288657858905Label Y
-395671-302062300407856906576439687743885Line Y152535458054742765907176288657858905
Group Ore Reserves
Ends31 March 2017DepletionModel UpdateNew Deposits31 March 201821818650004064752BeforeBudgetMLW Sales QtyMLW Sales PriceMLW COGSGDW Sales QtyGDW Sales PriceGDW COGSRMT Sales QtyRMT Sales PriceRMT COGSGIC Mvmt AllActual218186517861942030570AfterBudgetMLW Sales QtyMLW Sales PriceMLW COGSGDW Sales QtyGDW Sales PriceGDW COGSRMT Sales QtyRMT Sales PriceRMT COGSGIC Mvmt AllActual178619420305704064752Label Y-39567124437620341821984029519083823047661Line Y152535452181865178619420305704064752
Net Assets amp EPS
Net Assets2014201520162017201820193214104825396377164Revenue201420152016201720182019372465502544606Net Assets
201420152016201720182019321410482539637EPS
201420152016201720182019-29681739223727593463218
$ mILLIONS
Revenue amp NPAT
Revenue
201420152016201720182019372465502544606652NPAT
201420152016201720182019-14887112138174163
$ MILLIONS
Cash amp Gold on Hand - 30 June 2019
Ends
$2053m
43281OperationsDividendsMine developmentExplorationOther capexIncome taxOther43646208802950000000020524558200090003BeforeBudgetMLW Sales QtyMLW Sales PriceMLW COGSGDW Sales QtyGDW Sales PriceGDW COGSRMT Sales QtyRMT Sales PriceRMT COGSGIC Mvmt AllActual208802950537487779220900064562915852209000636015953274090004325321224320900022678751580009000321390415800090003AfterBudgetMLW Sales QtyMLW Sales PriceMLW COGSGDW Sales QtyGDW Sales PriceGDW COGSRMT Sales QtyRMT Sales PriceRMT COGSGIC Mvmt AllActual53748777922090006456291585220900063601595327409000432532122432090002267875158000900032139041580009000320524558200090003Label Y
3286848292209-81196194-96132052480000004-34838308420000002-57446066319999993-53971000-8658576373145364610450034968896822209000640822555898090005342740378530929659819116092408896580009000320957487000090003Line Y152535455565758520880295053748777922090006456291585220900063601595327409000432532122432090002267875158000900032139041580009000320524558200090003
Note Waterfall is prepared based on the Cash Flow statement as it stands when the quarterly is ready for release Changes may occur between this version and the final version of the cash flow in the management accounts
Production with
Realised Gold Price and AISC
Gold Production
20152016201720182019202031002430508432435300000000001361372999999999993634180000000000135204199999999997Realised Gold Price Per Oz201520162017201820192020148816001691167617652200AISC Per Oz201520162017201820192020994926879448590103102916000000000011246
Koz
AISCoz
Revenue
Revenue
20152016201720182019202046550254460665475665700000000004
$ Millions
Net Profit After Tax
NPAT
20152016201720182019202087112138174163199517NPAT Margin20152016201720182019202001870967741935483902231075697211155302536764705882352802871287128712871102492354740061162026368222325307239
$Millions
EBITDA
EBITDA
20152016201720182019202018123425331330739414100000000002EBITDA Margin ()
20152016201720182019202003892473118279569704661354581673306504650735294117647205165016501650164804694189602446483052089784406937356
$ Millions
EBITDARevenue ()
Earnings amp Dividend per Share
EPS
20152016201720182019202017399999999999999224275934632183926Dividend per share
20152016201720182019202061315161616
Cents per Share
Production with
Realised Gold Price and AISC
Gold Production
20152016201720182019202031002430508432435300000000001361372999999999993634180000000000135204199999999997Realised Gold Price Per Oz201520162017201820192020148816001691167617652200AISC Per Oz201520162017201820192020994926879448590103102916000000000011246
Koz
AISCoz
Cash and Bullion Balance and Divdends Paid
Cash and Bullion Balance After Dividends PaidFY13FY14FY15FY16FY17FY18FY19FY2080814273099999999999994123315169999999999999208820532093Cumulative Dividends PaidFY13FY14FY15FY16FY17FY18FY19FY20757510517024532640748832281288000001
$ Millions
Dividends Declared
Interim
201520162017201820192020047888Final
201520162017201820192020698888
Cents per Share
Cumulative Dividends Paid
20132014201520162017201820192020757510517024532640748832281288000001
$ Millions
Duketon Gold Reserves 2009 -2017
Ends
2009 ReserveMining DepletionDiscoveryCurrent Reserves603584002179584BeforeBudgetMLW Sales QtyMLW Sales PriceMLW COGSGDW Sales QtyGDW Sales PriceGDW COGSRMT Sales QtyRMT Sales PriceRMT COGSGIC Mvmt AllActual603584-1248353AfterBudgetMLW Sales QtyMLW Sales PriceMLW COGSGDW Sales QtyGDW Sales PriceGDW COGSRMT Sales QtyRMT Sales PriceRMT COGSGIC Mvmt AllActual-12483532179584Label Y
-18519373427937-32238454656155Line Y152535603584-12483532179584
Annual Gold Production amp Milled Grade
Ounces Recovered1234567891014268801161428873181015988838041351792984412915424319272013332356702177647158664950932090624306474577221087733917052421224493372104644162104609766314578621046097663145786Milled Grade (gt)123456789100895569124782444210946257386951172230937278942195154951007440563400282309332574237366220210928695890410962110235698630137117353452054794531462642404603127714626424046031277
Ounces
gt Au
Group Mineral Resource
Ends
31 March 2018DepletionModel UpdateNew Deposits31 March 201980547420007858905BeforeBudgetMLW Sales QtyMLW Sales PriceMLW COGSGDW Sales QtyGDW Sales PriceGDW COGSRMT Sales QtyRMT Sales PriceRMT COGSGIC Mvmt AllActual805474276590717628865AfterBudgetMLW Sales QtyMLW Sales PriceMLW COGSGDW Sales QtyGDW Sales PriceGDW COGSRMT Sales QtyRMT Sales PriceRMT COGSGIC Mvmt AllActual765907176288657858905Label Y
-395671-302062300407856906576439687743885Line Y152535458054742765907176288657858905
Group Ore Reserves
Ends31 March 2017DepletionModel UpdateNew Deposits31 March 201821818650004064752BeforeBudgetMLW Sales QtyMLW Sales PriceMLW COGSGDW Sales QtyGDW Sales PriceGDW COGSRMT Sales QtyRMT Sales PriceRMT COGSGIC Mvmt AllActual218186517861942030570AfterBudgetMLW Sales QtyMLW Sales PriceMLW COGSGDW Sales QtyGDW Sales PriceGDW COGSRMT Sales QtyRMT Sales PriceRMT COGSGIC Mvmt AllActual178619420305704064752Label Y-39567124437620341821984029519083823047661Line Y152535452181865178619420305704064752
Net Assets amp EPS
Net Assets2014201520162017201820193214104825396377164Revenue201420152016201720182019372465502544606Net Assets
201420152016201720182019321410482539637EPS
201420152016201720182019-29681739223727593463218
$ mILLIONS
Revenue amp NPAT
Revenue
201420152016201720182019372465502544606652NPAT
201420152016201720182019-14887112138174163
$ MILLIONS
Cash amp Bullion on Hand - 30 June 2020
Ends
June 2019OperationsMine developmentExplorationOther capexOtherCash and Bullion before Income Tax Acquisitions amp DividendsIncome taxDKM AcquisitionDividendsJune 2020205165482000003756792770000000600020929658200000006BeforeBudgetMLW Sales QtyMLW Sales PriceMLW COGSGDW Sales QtyGDW Sales PriceGDW COGSRMT Sales QtyRMT Sales PriceRMT COGSGIC Mvmt AllActual20516548262912235333000004494291817330000044571743027500000639216663275000006375679277000000063118868710000000629060545600000006AfterBudgetMLW Sales QtyMLW Sales PriceMLW COGSGDW Sales QtyGDW Sales PriceGDW COGSRMT Sales QtyRMT Sales PriceRMT COGSGIC Mvmt AllActual6291223533300000449429181733000004457174302750000063921666327500000637567927700000006311886871000000062906054560000000620929658200000006Label Y
$424m ($135m)($37m)($65m)($16m)($64m)($21m)($81m)4171439176650000256170708533000004475733060040000084246704677500000638392295487500006343783074000000063012461635000000624995101900000006Line Y152535455565758595105205165482629122353330000044942918173300000445717430275000006392166632750000063756792770000000637567927700000006311886871000000062906054560000000620929658200000006
Net Profit After Tax - 30 June 2020
Ends
June 2019Gross Profit - Duketon OpsExplorationRoyaltiesDampAFinanceIncome Tax ExpenseOtherJune 20201631500000000000199517000BeforeBudgetMLW Sales QtyMLW Sales PriceMLW COGSGDW Sales QtyGDW Sales PriceGDW COGSRMT Sales QtyRMT Sales PriceRMT COGSGIC Mvmt AllActual163150000259464000264507000255593000221493000220916000206096000AfterBudgetMLW Sales QtyMLW Sales PriceMLW COGSGDW Sales QtyGDW Sales PriceGDW COGSRMT Sales QtyRMT Sales PriceRMT COGSGIC Mvmt AllActual259464000264507000255593000221493000220916000206096000199517000Label Y
963140005043000-8914000-34100000-577000-14820000-6579000211307000261985500260050000238543000221204500213506000202806500Line Y1525354555657585163150000259464000264507000255593000221493000220916000206096000199517000
STRONG GROWTH IN YEAR ON YEAR NET PROFIT AFTER TAX6FY20 continues the growth trend
$163m
- - - - -
$200m
$61m
$5m ($9m) ($1m)
($15m)($5m)
-
$50m
$100m
$150m
$200m
$250m
Net Profit After Tax - 30 June 2020
For
per
sona
l use
onl
y
CIRCA HALF A BILLION DOLLARS IN DIVIDENDS SINCE 2013Regis continues to be an Australian gold industry leader on dividend payment metrics
7
Final dividend of 8 cps ($41m) fully franked payout
Total dividends for FY20 of 16 cps ($81m) fully franked
11 of FY20 revenue and 21 of EBITDA1
29 basic dividend yield 2
41 grossed up (for 100 franking) dividend yield
Regis has paid andor declared 97cps - $488 million in dividends since 2013
Dividend Reinvestment Plan announced
Level of future dividends will continuously be assessed in the context of gold price operational performance and planned cap ital expenditure
47 8 8 86
98 8 8 8
0
5
10
15
20
2015 2016 2017 2018 2019 2020
Cent
s pe
r Sh
are
Dividends Declared
Interim Final
75 75 105170
245326
407488
0
100
200
300
400
500
600
2013 2014 2015 2016 2017 2018 2019 2020
$ M
illio
ns
Cumulative Dividends Paid
1 EBITDA is an adjusted measure of earnings before interest taxes depreciation and amortisation EBITDA is non-IFRS financial information and is not subject to audit The measure is included to assist investors to better understand the performance of the business EBITDA in FY20 was increased by $89 million as a result of the introduction of AASB16 (Leases)
2 Annualised dividend yield of 16cps at a closing share price of $555 on 25 August 2020
For
per
sona
l use
onl
y
Dividends Declared
Interim
201520162017201820192020047888Final
201520162017201820192020698888
Cents per Share
Revenue
Revenue
20152016201720182019202046550254460665475665700000000004
$ Millions
Net Profit After Tax
NPAT
20152016201720182019202087112138174163199517
$Millions
EBITDA
EBITDA
20152016201720182019202018123425331330739414100000000002EBITDA Margin ()
20152016201720182019202003892473118279569704661354581673306504650735294117647205165016501650164804694189602446483052089784406937356
$ Millions
ebitdarevenue ()
Earnings amp Dividend per Share
EPS
20152016201720182019202017399999999999999224275934632183926Dividend per share
20152016201720182019202061315161616
Cents per Share
Dividends Declared
Interim
201520162017201820192020047888Final
201520162017201820192020698888
Cents per Share
Cumulative Dividends Paid
20132014201520162017201820192020757510517024532640748832281288000001
$ Millions
Duketon Gold Reserves 2009 -2017
Ends
2009 ReserveMining DepletionDiscoveryCurrent Reserves603584002179584BeforeBudgetMLW Sales QtyMLW Sales PriceMLW COGSGDW Sales QtyGDW Sales PriceGDW COGSRMT Sales QtyRMT Sales PriceRMT COGSGIC Mvmt AllActual603584-1248353AfterBudgetMLW Sales QtyMLW Sales PriceMLW COGSGDW Sales QtyGDW Sales PriceGDW COGSRMT Sales QtyRMT Sales PriceRMT COGSGIC Mvmt AllActual-12483532179584Label Y
-18519373427937-32238454656155Line Y152535603584-12483532179584
Annual Gold Production amp Milled Grade
Ounces Recovered1234567891014268801161428873181015988838041351792984412915424319272013332356702177647158664950932090624306474577221087733917052421224493372104644162104609766314578621046097663145786Milled Grade (gt)123456789100895569124782444210946257386951172230937278942195154951007440563400282309332574237366220210928695890410962110235698630137117353452054794531462642404603127714626424046031277
Ounces
gt Au
Group Mineral Resource
Ends
31 March 2018DepletionModel UpdateNew Deposits31 March 201980547420007858905BeforeBudgetMLW Sales QtyMLW Sales PriceMLW COGSGDW Sales QtyGDW Sales PriceGDW COGSRMT Sales QtyRMT Sales PriceRMT COGSGIC Mvmt AllActual805474276590717628865AfterBudgetMLW Sales QtyMLW Sales PriceMLW COGSGDW Sales QtyGDW Sales PriceGDW COGSRMT Sales QtyRMT Sales PriceRMT COGSGIC Mvmt AllActual765907176288657858905Label Y
-395671-302062300407856906576439687743885Line Y152535458054742765907176288657858905
Group Ore Reserves
Ends31 March 2017DepletionModel UpdateNew Deposits31 March 201821818650004064752BeforeBudgetMLW Sales QtyMLW Sales PriceMLW COGSGDW Sales QtyGDW Sales PriceGDW COGSRMT Sales QtyRMT Sales PriceRMT COGSGIC Mvmt AllActual218186517861942030570AfterBudgetMLW Sales QtyMLW Sales PriceMLW COGSGDW Sales QtyGDW Sales PriceGDW COGSRMT Sales QtyRMT Sales PriceRMT COGSGIC Mvmt AllActual178619420305704064752Label Y-39567124437620341821984029519083823047661Line Y152535452181865178619420305704064752
Net Assets amp EPS
Net Assets2014201520162017201820193214104825396377164Revenue201420152016201720182019372465502544606Net Assets
201420152016201720182019321410482539637EPS
201420152016201720182019-29681739223727593463218
$ mILLIONS
Revenue amp NPAT
Revenue
201420152016201720182019372465502544606652NPAT
201420152016201720182019-14887112138174163
$ MILLIONS
Cash amp Gold on Hand - 30 June 2019
Ends
$2053m
43281OperationsDividendsMine developmentExplorationOther capexIncome taxOther43646208802950000000020524558200090003BeforeBudgetMLW Sales QtyMLW Sales PriceMLW COGSGDW Sales QtyGDW Sales PriceGDW COGSRMT Sales QtyRMT Sales PriceRMT COGSGIC Mvmt AllActual208802950537487779220900064562915852209000636015953274090004325321224320900022678751580009000321390415800090003AfterBudgetMLW Sales QtyMLW Sales PriceMLW COGSGDW Sales QtyGDW Sales PriceGDW COGSRMT Sales QtyRMT Sales PriceRMT COGSGIC Mvmt AllActual53748777922090006456291585220900063601595327409000432532122432090002267875158000900032139041580009000320524558200090003Label Y
3286848292209-81196194-96132052480000004-34838308420000002-57446066319999993-53971000-8658576373145364610450034968896822209000640822555898090005342740378530929659819116092408896580009000320957487000090003Line Y152535455565758520880295053748777922090006456291585220900063601595327409000432532122432090002267875158000900032139041580009000320524558200090003
Note Waterfall is prepared based on the Cash Flow statement as it stands when the quarterly is ready for release Changes may occur between this version and the final version of the cash flow in the management accounts
Cumulative Dividends Paid
20132014201520162017201820192020757510517024532640748832281288000001
$ Millions
Revenue
Revenue
20152016201720182019202046550254460665475665700000000004
$ Millions
Net Profit After Tax
NPAT
20152016201720182019202087112138174163199517
$Millions
EBITDA
EBITDA
20152016201720182019202018123425331330739414100000000002EBITDA Margin ()
20152016201720182019202003892473118279569704661354581673306504650735294117647205165016501650164804694189602446483052089784406937356
$ Millions
ebitdarevenue ()
Earnings amp Dividend per Share
EPS
20152016201720182019202017399999999999999224275934632183926Dividend per share
20152016201720182019202061315161616
Cents per Share
Dividends Declared
Interim
201520162017201820192020047888Final
201520162017201820192020698888
Cents per Share
Cumulative Dividends Paid
20132014201520162017201820192020757510517024532640748832281288000001
$ Millions
Duketon Gold Reserves 2009 -2017
Ends
2009 ReserveMining DepletionDiscoveryCurrent Reserves603584002179584BeforeBudgetMLW Sales QtyMLW Sales PriceMLW COGSGDW Sales QtyGDW Sales PriceGDW COGSRMT Sales QtyRMT Sales PriceRMT COGSGIC Mvmt AllActual603584-1248353AfterBudgetMLW Sales QtyMLW Sales PriceMLW COGSGDW Sales QtyGDW Sales PriceGDW COGSRMT Sales QtyRMT Sales PriceRMT COGSGIC Mvmt AllActual-12483532179584Label Y
-18519373427937-32238454656155Line Y152535603584-12483532179584
Annual Gold Production amp Milled Grade
Ounces Recovered1234567891014268801161428873181015988838041351792984412915424319272013332356702177647158664950932090624306474577221087733917052421224493372104644162104609766314578621046097663145786Milled Grade (gt)123456789100895569124782444210946257386951172230937278942195154951007440563400282309332574237366220210928695890410962110235698630137117353452054794531462642404603127714626424046031277
Ounces
gt Au
Group Mineral Resource
Ends
31 March 2018DepletionModel UpdateNew Deposits31 March 201980547420007858905BeforeBudgetMLW Sales QtyMLW Sales PriceMLW COGSGDW Sales QtyGDW Sales PriceGDW COGSRMT Sales QtyRMT Sales PriceRMT COGSGIC Mvmt AllActual805474276590717628865AfterBudgetMLW Sales QtyMLW Sales PriceMLW COGSGDW Sales QtyGDW Sales PriceGDW COGSRMT Sales QtyRMT Sales PriceRMT COGSGIC Mvmt AllActual765907176288657858905Label Y
-395671-302062300407856906576439687743885Line Y152535458054742765907176288657858905
Group Ore Reserves
Ends31 March 2017DepletionModel UpdateNew Deposits31 March 201821818650004064752BeforeBudgetMLW Sales QtyMLW Sales PriceMLW COGSGDW Sales QtyGDW Sales PriceGDW COGSRMT Sales QtyRMT Sales PriceRMT COGSGIC Mvmt AllActual218186517861942030570AfterBudgetMLW Sales QtyMLW Sales PriceMLW COGSGDW Sales QtyGDW Sales PriceGDW COGSRMT Sales QtyRMT Sales PriceRMT COGSGIC Mvmt AllActual178619420305704064752Label Y-39567124437620341821984029519083823047661Line Y152535452181865178619420305704064752
Net Assets amp EPS
Net Assets2014201520162017201820193214104825396377164Revenue201420152016201720182019372465502544606Net Assets
201420152016201720182019321410482539637EPS
201420152016201720182019-29681739223727593463218
$ mILLIONS
Revenue amp NPAT
Revenue
201420152016201720182019372465502544606652NPAT
201420152016201720182019-14887112138174163
$ MILLIONS
Cash amp Gold on Hand - 30 June 2019
Ends
$2053m
43281OperationsDividendsMine developmentExplorationOther capexIncome taxOther43646208802950000000020524558200090003BeforeBudgetMLW Sales QtyMLW Sales PriceMLW COGSGDW Sales QtyGDW Sales PriceGDW COGSRMT Sales QtyRMT Sales PriceRMT COGSGIC Mvmt AllActual208802950537487779220900064562915852209000636015953274090004325321224320900022678751580009000321390415800090003AfterBudgetMLW Sales QtyMLW Sales PriceMLW COGSGDW Sales QtyGDW Sales PriceGDW COGSRMT Sales QtyRMT Sales PriceRMT COGSGIC Mvmt AllActual53748777922090006456291585220900063601595327409000432532122432090002267875158000900032139041580009000320524558200090003Label Y
3286848292209-81196194-96132052480000004-34838308420000002-57446066319999993-53971000-8658576373145364610450034968896822209000640822555898090005342740378530929659819116092408896580009000320957487000090003Line Y152535455565758520880295053748777922090006456291585220900063601595327409000432532122432090002267875158000900032139041580009000320524558200090003
Note Waterfall is prepared based on the Cash Flow statement as it stands when the quarterly is ready for release Changes may occur between this version and the final version of the cash flow in the management accounts
CASHFLOW WATERFALLStrong cashflow from operations of $424 million supported increased capital investment during FY20 and the payment of $81 million in dividends during the year
8
1 Includes bullion on hand valued at $2576 per ounce
$205m
- - - - -
$376m
$209m
$424m
($135m)($37m)
($65m) ($16m)
($64m)($21m)
($81m)
-
$100m
$200m
$300m
$400m
$500m
$600m
$700mCash amp Bullion on Hand - 30 June 2020
For
per
sona
l use
onl
y
Cash amp Bullion on Hand - 30 June 2020
Ends
June 2019OperationsMine developmentExplorationOther capexOtherIncome taxDKM AcquisitionDividendsJune 2020205165482000003756792770000000600020929658200000006BeforeBudgetMLW Sales QtyMLW Sales PriceMLW COGSGDW Sales QtyGDW Sales PriceGDW COGSRMT Sales QtyRMT Sales PriceRMT COGSGIC Mvmt AllActual20516548262912235333000004494291817330000044571743027500000639216663275000006375679277000000063118868710000000629060545600000006AfterBudgetMLW Sales QtyMLW Sales PriceMLW COGSGDW Sales QtyGDW Sales PriceGDW COGSRMT Sales QtyRMT Sales PriceRMT COGSGIC Mvmt AllActual6291223533300000449429181733000004457174302750000063921666327500000637567927700000006311886871000000062906054560000000620929658200000006Label Y
$424m ($135m)($37m)($65m)($16m)($64m)($21m)($81m)4171439176650000256170708533000004475733060040000084246704677500000638392295487500006343783074000000063012461635000000624995101900000006Line Y152535455565758595105205165482629122353330000044942918173300000445717430275000006392166632750000063756792770000000637567927700000006311886871000000062906054560000000620929658200000006
Cash amp Gold on Hand - Q1 Movements
Ends
Q4 FY19OperationsDividendsCapitalised Mining ExplorationDKM AcquisitionOther capexIncome taxOtherQ1 FY20205165481579199970000000014741309157919994BeforeBudgetMLW Sales QtyMLW Sales PriceMLW COGSGDW Sales QtyGDW Sales PriceGDW COGSRMT Sales QtyRMT Sales PriceRMT COGSGIC Mvmt AllActual2051654815791999728767825576919997247023818769199972164444927691999720629479018919995186294790189199951660754041891999515281533618919995AfterBudgetMLW Sales QtyMLW Sales PriceMLW COGSGDW Sales QtyGDW Sales PriceGDW COGSRMT Sales QtyRMT Sales PriceRMT COGSGIC Mvmt AllActual2876782557691999724702381876919997216444492769199972062947901891999518629479018919995166075404189199951528153361891999514741309157919994Label Y
82512774189999998-40654437-30579326-1014970258-20000000-20219386-13260068-540224461000000132464218686741999726735103726919997231734155769199972113696414791999519629479018919995176185097189199951594453701891999515011421388419995Line Y152535455565758595205165481579199972876782557691999724702381876919997216444492769199972062947901891999518629479018919995166075404189199951528153361891999514741309157919994
Note Waterfall is prepared based on the Cash Flow statement as it stands when the quarterly is ready for release Changes may occur between this version and the final version of the cash flow in the management accounts
Cash amp Gold on Hand - Q2 Movements
Ends
Q1 FY19OperationsMine developmentExplorationOther capexIncome taxOtherQ2 FY191474130915791999700000016414659428999993BeforeBudgetMLW Sales QtyMLW Sales PriceMLW COGSGDW Sales QtyGDW Sales PriceGDW COGSRMT Sales QtyRMT Sales PriceRMT COGSGIC Mvmt AllActual147413091579199972237779744899999520648957137999994195464900379999941852081753799999416685232837999994AfterBudgetMLW Sales QtyMLW Sales PriceMLW COGSGDW Sales QtyGDW Sales PriceGDW COGSRMT Sales QtyRMT Sales PriceRMT COGSGIC Mvmt AllActual223777974489999952064895713799999419546490037999994185208175379999941668523283799999416414659428999993Label Y
76364882910799995-17288403109999999-11024671-10256725-18355847-270573409185595533034599962151337729349999420097723587999994190336537879999941760302518799999416549946133499992Line Y1525354555657514741309157919997223777974489999952064895713799999419546490037999994185208175379999941668523283799999416414659428999993
Note Waterfall is prepared based on the Cash Flow statement as it stands when the quarterly is ready for release Changes may occur between this version and the final version of the cash flow in the management accounts
Cash amp Gold on Hand - Q2 Movements
Ends
Q1 FY20OperationsCapitalised Mining ExplorationOther capexIncome taxOtherQ2 FY201474130915791999700000016881196810859996BeforeBudgetMLW Sales QtyMLW Sales PriceMLW COGSGDW Sales QtyGDW Sales PriceGDW COGSRMT Sales QtyRMT Sales PriceRMT COGSGIC Mvmt AllActual147413091579199972473972032485999521497149024859995204533215248599951874883882485999517228720124859995AfterBudgetMLW Sales QtyMLW Sales PriceMLW COGSGDW Sales QtyGDW Sales PriceGDW COGSRMT Sales QtyRMT Sales PriceRMT COGSGIC Mvmt AllActual247397203248599952149714902485999520453321524859995187488388248599951722872012485999516881196810859996Label Y
99984111669399977-32425713-10438275-17044827-15201187-34752331399999987197405147413899962311843467485999520975235274859995196010801748599951798877947485999517054958467859995Line Y1525354555657514741309157919997247397203248599952149714902485999520453321524859995187488388248599951722872012485999516881196810859996
Note Waterfall is prepared based on the Cash Flow statement as it stands when the quarterly is ready for release Changes may occur between this version and the final version of the cash flow in the management accounts
Cash amp Gold on Hand - Q3 Movements
Ends
Q2 FY19OperationsDividendsMine developmentExplorationOther capexIncome taxOtherQ3 FY1916425052228999996000000014396948046919999BeforeBudgetMLW Sales QtyMLW Sales PriceMLW COGSGDW Sales QtyGDW Sales PriceGDW COGSRMT Sales QtyRMT Sales PriceRMT COGSGIC Mvmt AllActual16425052228999996253593527579199972129675705791999718622986097919998179564378979199981570046329791999814578446097919998AfterBudgetMLW Sales QtyMLW Sales PriceMLW COGSGDW Sales QtyGDW Sales PriceGDW COGSRMT Sales QtyRMT Sales PriceRMT COGSGIC Mvmt AllActual25359352757919997212967570579199971862298609791999817956437897919998157004632979199981457844609791999814396948046919999Label Y
89343005289200008-40625957-26737709600000001-6665482-22559746-11220172-1814980509999999820892202493459997233280549079199971995987157791999618289711997919998168284505979199981513945469791999814487697072419998Line Y15253545556575851642505222899999625359352757919997212967570579199971862298609791999817956437897919998157004632979199981457844609791999814396948046919999
Note Waterfall is prepared based on the Cash Flow statement as it stands when the quarterly is ready for release Changes may occur between this version and the final version of the cash flow in the management accounts
Cash amp Gold on Hand - 31 December 2019
Ends
June 2019OperationsDividendsMine developmentExplorationDKM AcquisitionOther capexIncome taxOtherDecember 2019205165481579199970000000016881196810859993BeforeBudgetMLW Sales QtyMLW Sales PriceMLW COGSGDW Sales QtyGDW Sales PriceGDW COGSRMT Sales QtyRMT Sales PriceRMT COGSGIC Mvmt AllActual2051654815791999738766236743859994347007930438599942840028914385999426341491385859993243414913858599932061507008585999317768944585859993AfterBudgetMLW Sales QtyMLW Sales PriceMLW COGSGDW Sales QtyGDW Sales PriceGDW COGSRMT Sales QtyRMT Sales PriceRMT COGSGIC Mvmt AllActual3876623674385999434700793043859994284002891438599942634149138585999324341491385859993206150700858599931776894458585999316881196810859993Label Y
1824968858594-40654437-63005039-20587977580000002-20000000-37264213-28461255-8877477752964139245088999336733514893859994315505410938599942737089026485999225341491385859993224782807358599931919200733585999317325070698359993Line Y152535455565758595205165481579199973876623674385999434700793043859994284002891438599942634149138585999324341491385859993206150700858599931776894458585999316881196810859993
Cash amp Gold on Hand - 31 December 2019
Ends
June 2019OperationsMine developmentExplorationOther capexIncome taxOtherDecember 2019DKM AcquisitionDividendsDecember 201920516548157919997000000229466405108599960016881196810859996BeforeBudgetMLW Sales QtyMLW Sales PriceMLW COGSGDW Sales QtyGDW Sales PriceGDW COGSRMT Sales QtyRMT Sales PriceRMT COGSGIC Mvmt AllActual205165481579199973876623674385999432465732843859994304069350858599962668051378585999623834388285859996NA2294664051085999620946640510859996AfterBudgetMLW Sales QtyMLW Sales PriceMLW COGSGDW Sales QtyGDW Sales PriceGDW COGSRMT Sales QtyRMT Sales PriceRMT COGSGIC Mvmt AllActual387662367438599943246573284385999430406935085859996266805137858599962383438828585999622946640510859996NA2094664051085999616881196810859996Label Y
$1825m ($630m)($206m)($373m)($285m)($89m)($200m)($407m)296413924508899933561598479385999431436333964859998285437244358599962525745103585999623390514398359996NA2194664051085999618913918660859996Line Y15253545556575859510520516548157919997387662367438599943246573284385999430406935085859996266805137858599962383438828585999622946640510859996229466405108599962094664051085999616881196810859996
Cash amp Bullion on Hand - 31 December 2019
Ends
June 2019OperationsMine developmentExplorationOther capexIncome taxOtherCash and Bullion before Acquisitions amp DividendsDKM AcquisitionDividendsDecember 201920516548200000022946640600168811969BeforeBudgetMLW Sales QtyMLW Sales PriceMLW COGSGDW Sales QtyGDW Sales PriceGDW COGSRMT Sales QtyRMT Sales PriceRMT COGSGIC Mvmt AllActual2051654823842603833299999832915425632999998309283452752733648667524033074975NA229466406209466406AfterBudgetMLW Sales QtyMLW Sales PriceMLW COGSGDW Sales QtyGDW Sales PriceGDW COGSRMT Sales QtyRMT Sales PriceRMT COGSGIC Mvmt AllActual3842603833299999832915425632999998309283452752733648667524033074975229466406NA209466406168811969Label Y
$1791m ($551m)($199m)($359m)($330m)($109m)($200m)($407m)2947129326649999635670731982999998319218854539999962913241597525684780825234898577875NA2194664061891391875Line Y1525354555657585951052051654823842603833299999832915425632999998309283452752733648667524033074975229466406229466406209466406168811969
Cash amp Gold on Hand - Q3 Movements
Ends
Q2 FY20OperationsCapitalised Mining ExplorationOther capexIncome taxOtherQ3 FY20DividendsQ3 FY201688119681085999600000020944739757919991016879296057919991BeforeBudgetMLW Sales QtyMLW Sales PriceMLW COGSGDW Sales QtyGDW Sales PriceGDW COGSRMT Sales QtyRMT Sales PriceRMT COGSGIC Mvmt AllActual168811968108599962761787235791999124613937157919991238428719579199912263386975791999121071124757919991NA20944739757919991AfterBudgetMLW Sales QtyMLW Sales PriceMLW COGSGDW Sales QtyGDW Sales PriceGDW COGSRMT Sales QtyRMT Sales PriceRMT COGSGIC Mvmt AllActual276178723579199912461393715791999123842871957919991226338697579199912107112475791999120944739757919991NA16879296057919991Label Y
$1074m ($300m)($77m)($121m)($156m)($13m)($407m)222495345843899942611590475791999124228404557919991232383708579199912185249725791999121007932257919991NA18912017907919991Line Y152535455565758595168811968108599962761787235791999124613937157919991238428719579199912263386975791999121071124757919991209447397579199912094473975791999116879296057919991
Note Waterfall is prepared based on the Cash Flow statement as it stands when the quarterly is ready for release Changes may occur between this version and the final version of the cash flow in the management accounts
Cash amp Gold on Hand - Q3 Movements
Ends
Q2 FY20OperationsCapitalised Mining ExplorationOther capexOtherQ3 FY20Income taxDividendsQ3 FY201688119681085999600000225074847579199910016879296057919991BeforeBudgetMLW Sales QtyMLW Sales PriceMLW COGSGDW Sales QtyGDW Sales PriceGDW COGSRMT Sales QtyRMT Sales PriceRMT COGSGIC Mvmt AllActual1688119681085999627617872357919991246139371579199912384287195791999122633869757919991NA2250748475791999120944739757919991AfterBudgetMLW Sales QtyMLW Sales PriceMLW COGSGDW Sales QtyGDW Sales PriceGDW COGSRMT Sales QtyRMT Sales PriceRMT COGSGIC Mvmt AllActual2761787235791999124613937157919991238428719579199912263386975791999122507484757919991NA2094473975791999116879296057919991Label Y
$1074m ($300m)($77m)($121m)($13m)($156m)($407m)2224953458438999426115904757919991242284045579199912323837085791999122570677257919991NA2172611225791999118912017907919991Line Y152535455565758595168811968108599962761787235791999124613937157919991238428719579199912263386975791999122507484757919991225074847579199912094473975791999116879296057919991
Note Waterfall is prepared based on the Cash Flow statement as it stands when the quarterly is ready for release Changes may occur between this version and the final version of the cash flow in the management accounts
Cash amp Gold on Hand - Q4 Movements
Ends
Q3 FY20OperationsCapitalised Mining ExplorationOther capexIncome taxOtherQ4 FY201687929605791999400000020928474457919988BeforeBudgetMLW Sales QtyMLW Sales PriceMLW COGSGDW Sales QtyGDW Sales PriceGDW COGSRMT Sales QtyRMT Sales PriceRMT COGSGIC Mvmt AllActual168792960579199942777111782291998924878052357919988237967979579199882286235965791998821349275757919988AfterBudgetMLW Sales QtyMLW Sales PriceMLW COGSGDW Sales QtyGDW Sales PriceGDW COGSRMT Sales QtyRMT Sales PriceRMT COGSGIC Mvmt AllActual277711178229199892487805235791998823796797957919988228623596579199882134927575791998820928474457919988Label Y
10891821764999998-28930654649999999-10812544-9344383-15130839-420801299999999632232520694041999263245850904199924337425157919988233295788079199882210581770791998821138875107919988Line Y1525354555657516879296057919994277711178229199892487805235791998823796797957919988228623596579199882134927575791998820928474457919988
Note Waterfall is prepared based on the Cash Flow statement as it stands when the quarterly is ready for release Changes may occur between this version and the final version of the cash flow in the management accounts
Cash amp Gold on Hand - Q4 Movements
Ends
Q3 FY20OperationsCapitalised Mining ExplorationOther capexOtherQ4 FY20Income taxQ4 FY20168792960579199940000022441558357919988020928474457919988BeforeBudgetMLW Sales QtyMLW Sales PriceMLW COGSGDW Sales QtyGDW Sales PriceGDW COGSRMT Sales QtyRMT Sales PriceRMT COGSGIC Mvmt AllActual1687929605791999427771117822919989248780523579199882379679795791998822862359657919988NA22441558357919988AfterBudgetMLW Sales QtyMLW Sales PriceMLW COGSGDW Sales QtyGDW Sales PriceGDW COGSRMT Sales QtyRMT Sales PriceRMT COGSGIC Mvmt AllActual2777111782291998924878052357919988237967979579199882286235965791998822441558357919988NA20928474457919988Label Y
$1089m ($289m)($108m)($93m)($42m)($151m)22325206940419992632458509041999243374251579199882332957880791998822651959007919988NA21685016407919988Line Y15253545556575851687929605791999427771117822919989248780523579199882379679795791998822862359657919988224415583579199882244155835791998820928474457919988
Note Waterfall is prepared based on the Cash Flow statement as it stands when the quarterly is ready for release Changes may occur between this version and the final version of the cash flow in the management accounts
Cash amp Bullion on Hand - 30 June 2020
Ends
June 2019OperationsMine developmentExplorationOther capexOtherIncome taxDKM AcquisitionDividendsJune 2020205165482000003756792770000000600020929658200000006BeforeBudgetMLW Sales QtyMLW Sales PriceMLW COGSGDW Sales QtyGDW Sales PriceGDW COGSRMT Sales QtyRMT Sales PriceRMT COGSGIC Mvmt AllActual20516548262912235333000004494291817330000044571743027500000639216663275000006375679277000000063118868710000000629060545600000006AfterBudgetMLW Sales QtyMLW Sales PriceMLW COGSGDW Sales QtyGDW Sales PriceGDW COGSRMT Sales QtyRMT Sales PriceRMT COGSGIC Mvmt AllActual6291223533300000449429181733000004457174302750000063921666327500000637567927700000006311886871000000062906054560000000620929658200000006Label Y
$424m ($135m)($37m)($65m)($16m)($64m)($21m)($81m)4171439176650000256170708533000004475733060040000084246704677500000638392295487500006343783074000000063012461635000000624995101900000006Line Y152535455565758595105205165482629122353330000044942918173300000445717430275000006392166632750000063756792770000000637567927700000006311886871000000062906054560000000620929658200000006
Cash amp Gold on Hand - FY2019 YTD
Ends
Jun-18OperationsDividendsMine developmentExplorationOther capexIncome taxOtherJun-19202277539000000018869714553999996BeforeBudgetMLW Sales QtyMLW Sales PriceMLW COGSGDW Sales QtyGDW Sales PriceGDW COGSRMT Sales QtyRMT Sales PriceRMT COGSGIC Mvmt AllActual202277539520939342759999994397431487599999934361109627999997308772787859999952513267215399999619735572153999996AfterBudgetMLW Sales QtyMLW Sales PriceMLW COGSGDW Sales QtyGDW Sales PriceGDW COGSRMT Sales QtyRMT Sales PriceRMT COGSGIC Mvmt AllActual52093934275999999439743148759999993436110962799999730877278785999995251326721539999961973557215399999618869714553999996Label Y
31866180375999999-81196194-96132052480000004-34838308420000002-57446066319999993-53971000-865857636160844088480341245759999993916771225199999832619194206999993280049754699999932243412215399999619302643353999996Line Y152535455565758520227753952093934275999999439743148759999993436110962799999730877278785999995251326721539999961973557215399999618869714553999996
Note Waterfall is prepared based on the Cash Flow statement as it stands when the quarterly is ready for release Changes may occur between this version and the final version of the cash flow in the management accounts
Cash amp Gold on Hand - FY2019 YTD
Ends
Jun-18OperationsDividendsMine developmentExplorationOther capexIncome taxOtherJun-19208802950000000021964535032372868BeforeBudgetMLW Sales QtyMLW Sales PriceMLW COGSGDW Sales QtyGDW Sales PriceGDW COGSRMT Sales QtyRMT Sales PriceRMT COGSGIC Mvmt AllActual208802950551887547543728714706913535437287137455930106372869339720992643728672822749263237286822830392632372868AfterBudgetMLW Sales QtyMLW Sales PriceMLW COGSGDW Sales QtyGDW Sales PriceGDW COGSRMT Sales QtyRMT Sales PriceRMT COGSGIC Mvmt AllActual55188754754372871470691353543728713745593010637286933972099264372867282274926323728682283039263237286821964535032372868Label Y
34308459754372871-81196194-96132052480000004-34838308420000002-57446066319999993-53971000-86585763803452487718643551128945054372871422625327303728735714014685372865310997959483728652552894263237286822397463832372868Line Y152535455565758520880295055188754754372871470691353543728713745593010637286933972099264372867282274926323728682283039263237286821964535032372868
Note Waterfall is prepared based on the Cash Flow statement as it stands when the quarterly is ready for release Changes may occur between this version and the final version of the cash flow in the management accounts
The FY21 key guidance elements are
Gold Production 355000 - 380000 ounces
C1 Cash Costs including royalties A$1030 - 1090 per ounce
All in Sustaining Cost A$1230 - 1300 per ounce
Growth Capital A$50 ndash 60 million1
Exploration A$35 million
McPhillamys A$15 million2
FY21 GUIDANCE
Regis is expecting a strong year of growth within the operations as production continues to lift in linewith the targeted growth profile heading to 400000oz pa from internal development optionsProduction rate is planned to lift above historic annual rate in the second half of the year
1 Growth Capital includes open pit and underground pre-production mining costs site infrastructure and camp expansion costs 2 McPhillamys spend for FY21 is a minimum of A$15m Regis will assess additional early long lead items and in the case of early approval of the Companyrsquos Development Application by the
Independent Planning Commission the expenditure on McPhillamys for FY21 could be approximately A$60m
9
For
per
sona
l use
onl
y
REVIEW OF FY202010
THE CURRENT BUSINESSrsquo PERFORMANCENet profit after tax of $200 million (FY19 $163 million) with a NPAT margin of 26 and ROE of 24
Dividends for FY2020 of 16 cents per share fully franked for a 41 grossed1 up yield
EBITDA of $394 million with strong EBITDA margin of 52
Cash and bullion of $2093 million2 as at 30 June 2020
Hedging reduced to ~399koz at end FY20 from approximately 452koz at end FY19 Deliveries into hedges increased to approximately 20000 ounces per quarter
1 Grossed up for 100 franking Annualised dividend yield of 16cps at a closing share price of $555 on 25 August 20202 Includes bullion on hand valued at $2576 per ounce
PROGRESSING FUTURE GROWTH
McPhillamys Development Application submitted and Responses to Submissions nearing completionTripled exploration tenure around Duketon Operations and increased Exploration budget by 32 to $35millionMoving to investment decision for Garden Well Underground Project For
per
sona
l use
onl
y
Additional Financial Information
For
per
sona
l use
onl
y
30 June 2020 30 June 2019$rsquo000 $rsquo000
Revenue 756657 654807Cost of goods sold (452011) (401970)Gross profit 304646 252837Other income (150) 4379
Investor and corporate costs (3408) (2521)Personnel costs (10062) (9360)Share-based payment expense (144) (1082)Occupancy costs (245) (1005)Other corporate administrative expenses (1052) (659)Exploration and evaluation written off (1686) (6729)Other (1215) (940)Finance costs (2024) (1447)Profit before income tax 284660 233473
Income tax expense (85143) (70323)Net profit 199517 163150
FY2020 ndash Profit amp Loss12
Earnings Per Share (cents per share) 3926 3218
For
per
sona
l use
onl
y
13
30 June 2020 30 June 2019$rsquo000 $rsquo000
Cash flows from operating activitiesReceipts from gold sales 755791 652450Payments to suppliers and employees (348923) (326680)Income tax paid (63792) (53971)Other receipts(payments) (63) 3686Net cash from operating activities 343013 275485Cash flows from investing activitiesAcquisition of plant and equipment (net) (51114) (56395)Payments for exploration and evaluation (37118) (34840)Payments for acquisition of exploration assets (21281) -Payments for mine properties under development (57307) (35632)Payments for mine properties (77524) (60500)Other receipts(payments) - 77Net cash used in investing activities (244344) (187290)Cash flows from financing activitiesProceeds from issue of shares 279 1697Payment of transaction costs (14) (65)Payment of lease liabilities (13894) (1052)Dividends paid (81309) (81196)Net cash used in financing activities (94938) (80616)Net increase(decrease) in cash and cash equivalents 3731 7579Cash and cash equivalents at 1 July 188697 181118Cash and cash equivalents at 30 June 192428 188697
FY2020 ndash Cash Flow StatementF
or p
erso
nal u
se o
nly
14 30 June 2020 30 June 2019$rsquo000 $rsquo000
Current assetsCash and cash equivalents 192428 188697Inventories 74430 56077Other current assets 10847 10141Total current assets 277705 254915Non-current assetsInventories 63503 55898Property plant and equipment 261676 242988Exploration and evaluation expenditure 230260 185748Mine properties under development 2188 44163Mine properties 275939 167713Right-of-use assets 38034 -Other 2572 2572Total non-current assets 874172 699082Total assets 1151877 953997Current liabilitiesTrade and other payables 74181 67613Income tax payable 7471 12224Lease Liabilities 15856 793Other 3994 3479Total current liabilities 101502 84109Non-current liabilitiesDeferred tax liabilities 117408 91305Provisions amp Lease liabilities 97886 62119Total non-current liabilities 215294 153424Total liabilities 316796 237533Net AssetsTotal Equity
835081835081
716464716464
FY2020 ndash Balance SheetF
or p
erso
nal u
se o
nly
ldquoSPOT DEFERREDrdquo ndash FLEXIBLE GOLD HEDGE BOOK (30 June 2020)
Regisrsquo hedge position reduced to ~399koz at an average of A$1614oz
Regis is currently actively managing the process of selling into thelowest price hedges and reduced its hedges by approximately 52000ounces in FY20
Regis has recently increased the rate at which it is delivering into itsmost out of the money hedges to 20000 ounces per quarter
Hedging Price Range Quantity (ozrsquos)
A$1400 - $1500 157000
A$1500 - $1600 15000
A$1600 - $1700 36000
A$1700 - $1800 131000
A$1800 - $1900 60000
15
Period Volume (ozrsquos)
Today ndash Dec 2020 600000
Jan 2021 ndash Dec 2021 400000
Jan 2022 ndash Dec 2022 200000
Jan 2023 ndash June 2023 100000
July 2023 Nil
Table 2 Current Hedging Volume LimitsTable 1 Hedging Volumes amp Price Ranges
2200
0
500
1000
1500
2000
2500
Gold Price
Ave spot priceRealised Price
2333
For
per
sona
l use
onl
y
FY 2020 FY2019
Physicals DNO DSO TOTAL TOTAL Variance
Ore mined (Mbcm) 136 280 416 428 -3
Waste mined (Mbcm) 681 1956 2637 2812 -6
Stripping ratio (wo) 50 70 63 66 -5
Ore mined (Mtonnes) 275 723 998 1014 -2
Ore milled (Mtonnes) 300 637 937 943 -1
Head grade (gt) 104 135 125 127 -2
Recovery () 923 940 935 940 -1
Gold production (ounces) 92184 259858 352042 363418 -3
FY2020 PHYSICALS16
For
per
sona
l use
onl
y
Further information Jim Beyer | Managing Director amp CEO+ 61 8 9442 2200
For
per
sona
l use
onl
y
| Values | Line X | Ends | Before | After | Line Y | Label Y | Y Label | CASH FLOWS FROM OPERATIONS | Category | Manual Adj | ||||||||||||||||||
| Jun-18 | 2088 | 15 | $2088m | 2088 | Receipts from gold sales | Operations | 652450151 | 652450151 | ||||||||||||||||||||
| Operations | 3431 | 25 | - | $2088m | $5519m | $5519m | $3803m | $3431m | Option premium income | Other | 1366000 | 1366000 | ||||||||||||||||
| Dividends | (812) | 35 | - | $5519m | $4707m | $4707m | $5113m | ($812m) | Other income | Other | - | - | ||||||||||||||||
| Mine development | (961) | 45 | - | $4707m | $3746m | $3746m | $4226m | ($961m) | Payments to suppliers and employees - DNO | Operations | (84224766) | (84224766) | ||||||||||||||||
| Exploration | (348) | 55 | - | $3746m | $3397m | $3397m | $3571m | ($348m) | Payments to suppliers and employees - DSO | Operations | (228404216) | (228404216) | ||||||||||||||||
| Other capex | (574) | 65 | - | $3397m | $2823m | $2823m | $3110m | ($574m) | Payments to suppliers and employees - CORP | Other | (14051447) | (14051447) | ||||||||||||||||
| Income tax | (540) | 75 | - | $2823m | $2283m | $2283m | $2553m | ($540m) | Interest received | Other | 2388192 | 2388192 | ||||||||||||||||
| Other | (87) | 85 | - | $2283m | $2196m | $2196m | $2240m | ($87m) | Income tax paid | Income tax | (53971000) | (53971000) | ||||||||||||||||
| Jun-19 | $2196m | Interest paid | Other | (85486) | (85486) | |||||||||||||||||||||||
| Proceeds from rental income | Other | 16500 | 16500 | |||||||||||||||||||||||||
| Net cash flows from(used in) operations | 275483928 | 275483928 | ||||||||||||||||||||||||||
| CASH FLOWS FROM INVESTING ACTIVITIES | ||||||||||||||||||||||||||||
| Payments for plant amp equipment | Other capex | (56425779) | (56425779) | |||||||||||||||||||||||||
| Payments for exploration amp evaluation - WA | Exploration | (24685627) | (24685627) | |||||||||||||||||||||||||
| Payments for exploration amp evaluation - NSW | Exploration | (10152682) | (10152682) | |||||||||||||||||||||||||
| Payments for development - TWL BNY DOG RMT | Mine development | (35632149) | (35632149) | |||||||||||||||||||||||||
| Payments for mine properties - DNO | Mine development | (4690352) | (4690352) | |||||||||||||||||||||||||
| Payments for mine properties - DSO | Mine development | (55809551) | (55809551) | |||||||||||||||||||||||||
| Payments for term deposits | Other | 77000 | 77000 | |||||||||||||||||||||||||
| Proceeds on disposal of term deposits | Other | (1708) | (1708) | |||||||||||||||||||||||||
| Payments for AFS investments | Other capex | - | ||||||||||||||||||||||||||
| Acquisition of exploration assets (net of cash) | Exploration | - | ||||||||||||||||||||||||||
| Proceeds on disposal of PampE | Other capex | 31346 | 31346 | |||||||||||||||||||||||||
| Net cash flows used in investing activities | (187289502) | (187289502) | ||||||||||||||||||||||||||
| CASH FLOWS FROM FINANCING ACTIVITIES | ||||||||||||||||||||||||||||
| Proceeds from equity raisings | - | |||||||||||||||||||||||||||
| Proceeds from exercise of options | Other | 1697500 | 1697500 | |||||||||||||||||||||||||
| Share issue costs | Other | (65127) | (65127) | |||||||||||||||||||||||||
| Dividends paid | Dividends | (81196194) | (81196194) | |||||||||||||||||||||||||
| Repayment of finance lease | Other capex | (1051633) | (1051633) | |||||||||||||||||||||||||
| Repayment of borrowings | - | |||||||||||||||||||||||||||
| Net cash flows from financing activities | (80615454) | (80615454) | ||||||||||||||||||||||||||
| Net increase(decrease) in cash amp equivalents | 7578972 | |||||||||||||||||||||||||||
| Cash amp bullion at the start of the period | 208802950 | |||||||||||||||||||||||||||
| Effects of exchange rate movements on cash | Operations | |||||||||||||||||||||||||||
| Movement in gold on hand | Operations | 3263429 | ||||||||||||||||||||||||||
| Cash amp bullion at the end of the period | 219645350 | |||||||||||||||||||||||||||
| Values | Line X | Ends | Before | After | Line Y | Label Y | Y Label | CASH FLOWS FROM OPERATIONS | Category | Manual Adj | ||||||||||||||||||
| Jun-18 | 2023 | 15 | $2023m | 2023 | Receipts from gold sales | Operations | 652450151 | 652450151 | ||||||||||||||||||||
| Operations | 3187 | 25 | - | $2023m | $5209m | $5209m | $3616m | $3187m | Option premium income | Other | 1366000 | 1366000 | ||||||||||||||||
| Dividends | (812) | 35 | - | $5209m | $4397m | $4397m | $4803m | ($812m) | Other income | Other | - | - | ||||||||||||||||
| Mine development | (961) | 45 | - | $4397m | $3436m | $3436m | $3917m | ($961m) | Payments to suppliers and employees - DNO | Operations | (84224766) | (84224766) | ||||||||||||||||
| Exploration | (348) | 55 | - | $3436m | $3088m | $3088m | $3262m | ($348m) | Payments to suppliers and employees - DSO | Operations | (228404216) | (228404216) | ||||||||||||||||
| Other capex | (574) | 65 | - | $3088m | $2513m | $2513m | $2800m | ($574m) | Payments to suppliers and employees - CORP | Other | (14051447) | (14051447) | ||||||||||||||||
| Income tax | (540) | 75 | - | $2513m | $1974m | $1974m | $2243m | ($540m) | Interest received | Other | 2388192 | 2388192 | ||||||||||||||||
| Other | (87) | 85 | - | $1974m | $1887m | $1887m | $1930m | ($87m) | Income tax paid | Income tax | (53971000) | (53971000) | ||||||||||||||||
| Jun-19 | $1887m | Interest paid | Other | (85486) | (85486) | |||||||||||||||||||||||
| Proceeds from rental income | Other | 16500 | 16500 | |||||||||||||||||||||||||
| Net cash flows from(used in) operations | 275483928 | 275483928 | ||||||||||||||||||||||||||
| CASH FLOWS FROM INVESTING ACTIVITIES | ||||||||||||||||||||||||||||
| Payments for plant amp equipment | Other capex | (56425779) | (56425779) | |||||||||||||||||||||||||
| Payments for exploration amp evaluation - WA | Exploration | (24685627) | (24685627) | |||||||||||||||||||||||||
| Payments for exploration amp evaluation - NSW | Exploration | (10152682) | (10152682) | |||||||||||||||||||||||||
| Payments for development - TWL BNY DOG RMT | Mine development | (35632149) | (35632149) | |||||||||||||||||||||||||
| Payments for mine properties - DNO | Mine development | (4690352) | (4690352) | |||||||||||||||||||||||||
| Payments for mine properties - DSO | Mine development | (55809551) | (55809551) | |||||||||||||||||||||||||
| Payments for term deposits | Other | 77000 | 77000 | |||||||||||||||||||||||||
| Proceeds on disposal of term deposits | Other | (1708) | (1708) | |||||||||||||||||||||||||
| Payments for AFS investments | Other capex | - | ||||||||||||||||||||||||||
| Acquisition of exploration assets (net of cash) | Exploration | - | ||||||||||||||||||||||||||
| Proceeds on disposal of PampE | Other capex | 31346 | 31346 | |||||||||||||||||||||||||
| Net cash flows used in investing activities | (187289502) | (187289502) | ||||||||||||||||||||||||||
| CASH FLOWS FROM FINANCING ACTIVITIES | ||||||||||||||||||||||||||||
| Proceeds from equity raisings | - | |||||||||||||||||||||||||||
| Proceeds from exercise of options | Other | 1697500 | 1697500 | |||||||||||||||||||||||||
| Share issue costs | Other | (65127) | (65127) | |||||||||||||||||||||||||
| Dividends paid | Dividends | (81196194) | (81196194) | |||||||||||||||||||||||||
| Repayment of finance lease | Other capex | (1051633) | (1051633) | |||||||||||||||||||||||||
| Repayment of borrowings | - | |||||||||||||||||||||||||||
| Net cash flows from financing activities | (80615454) | (80615454) | ||||||||||||||||||||||||||
| Net increase(decrease) in cash amp equivalents | 7578972 | |||||||||||||||||||||||||||
| Cash amp bullion at the start of the period | 202277539 | |||||||||||||||||||||||||||
| Effects of exchange rate movements on cash | Operations | |||||||||||||||||||||||||||
| Movement in gold on hand | Operations | (21159365) | ||||||||||||||||||||||||||
| 1764709 | Cash amp bullion at the end of the period | 188697146 | ||||||||||||||||||||||||||
| 89721 | ||||||||||||||||||||||||||||
| 369721 | 18267402 | |||||||||||||||||||||||||||
| 320732598 |
| Payments for Development | |||||||||||
| Pre-Production | MACA Invoice | Apr-19 | May-19 | Jun-19 | Q4 Total | ||||||
| DOG | Mar-19 | - 0 | 2627659 | - 0 | 2627659 | ||||||
| DOG | Apr-19 | - 0 | - 0 | 1003666 | 1003666 | ||||||
| DOG | - 0 | - 0 | - 0 | ||||||||
| - 0 | 2627659 | 1003666 | 3631325 | ||||||||
| RMT Underground | Apr-19 | May-19 | Jun-19 | Q4 Total | |||||||
| RMT UG | Mar-19 | 2468107 | - 0 | - 0 | 2468107 | ||||||
| RMT UG | Apr-19 | - 0 | 1518068 | - 0 | 1518068 | ||||||
| RMT UG | May-19 | - 0 | - 0 | 2151172 | 2151172 | ||||||
| Total | 2468107 | 1518068 | 2151172 | 6137346 | |||||||
| Payments for mine properties - DSO | |||||||||||
| Pre-Strip | MACA Invoice | Apr-19 | May-19 | Jun-19 | Q4 Total | ||||||
| ERL | Feb-19 | 683602 | 68360169 | ||||||||
| TWL | Feb-19 | 3909250 | 390925035 | ||||||||
| ERL | Mar-19 | 392619 | 39261934 | ||||||||
| TWL | Mar-19 | 4508648 | 450864805 | ||||||||
| ERL | Apr-19 | 21545847 | 21545847 | ||||||||
| TWL | Apr-19 | 330090393 | 330090393 | ||||||||
| RMT | Mar-19 | 2531 | 253117 | ||||||||
| RMT | Apr-19 | 1120185 | 112018483 | ||||||||
| RMT | May-19 | 45893944 | 45893944 | ||||||||
| Total - ERL | 683602 | 392619 | 215458 | 129167950 | |||||||
| Total - RMT | 2531 | 1120185 | 458939 | 158165544 | |||||||
| Total - TWL | 3909250 | 4508648 | 3300904 | 1171880233 | |||||||
| Total | 4595383 | 6021452 | 3975302 | 1459213727 | |||||||
| Deferred Costs | Mar-19 | Apr-19 | May-19 | Q4 Total | |||||||
| GDW | 1317665 | 1876997 | 1574726 | 4769388 | |||||||
| ERL | 45300 | - 33082 | 1052986 | 1065205 | |||||||
| RMT | - 0 | ||||||||||
| Total | 1362965 | 1843916 | 2627712 | 5834592 | |||||||
| Total by Pit | Apr-19 | May-19 | Jun-19 | Q4 Total | |||||||
| GDW | Total - GDW | 1317665 | 1876997 | 1574726 | 4769388 | ||||||
| ERL | Total - ERL | 728902 | 359538 | 1268444 | 2356884 | ||||||
| TWL | Total - TWL | 3909250 | 4508648 | 3300904 | 11718802 | ||||||
| RMT | Total - RMT | 2531 | 1120185 | 458939 | 1581655 | ||||||
| Total - DSO | 5958348 | 7865368 | 6603013 | 20426730 | |||||||
| Values | Line X | Ends | Before | After | Line Y | Label Y | Y Label | CASH FLOWS FROM OPERATIONS | Category | Statutory Adj | ||||||||||||||||||
| June 2019 | 205 | 2 | $205m | 205 | Receipts from gold sales | Operations | 755790612 | 755790612 | ||||||||||||||||||||
| Operations | 424 | 3 | - | $205m | $629m | $629m | $417m | $424m | Option premium income | Other | - | - | ||||||||||||||||
| Mine development | (135) | 4 | - | $629m | $494m | $494m | $562m | ($135m) | Other income | Other | 34894 | 34894 | ||||||||||||||||
| Exploration | (37) | 5 | - | $494m | $457m | $457m | $476m | ($37m) | Payments to suppliers and employees - DNO | Operations | (99376203) | (99376203) | ||||||||||||||||
| Other capex | (65) | 6 | - | $457m | $392m | $392m | $425m | ($65m) | Payments to suppliers and employees - DSO | Operations | (232858286) | (232858286) | ||||||||||||||||
| Other | (16) | 7 | - | $392m | $376m | $376m | $384m | ($16m) | Payments to suppliers and employees - CORP | Other | (16688243) | (16688243) | ||||||||||||||||
| 8 | $376m | $376m | Interest received | Other | 1007324 | 1007324 | ||||||||||||||||||||||
| Income tax | (64) | 9 | - | $376m | $312m | $312m | $344m | ($64m) | GIC Inventory Mvmt | GIC Mvmt | - | - | ||||||||||||||||
| DKM Acquisition | (21) | 10 | - | $312m | $291m | $291m | $301m | ($21m) | Income tax paid | Income tax | (63792406) | (63792406) | ||||||||||||||||
| Dividends | (81) | 11 | - | $291m | $209m | $209m | $250m | ($81m) | Interest paid | Other | (1104724) | (1104724) | ||||||||||||||||
| June 2020 | $209m | GIC Inventory Mvmt | GIC Mvmt | - | - | |||||||||||||||||||||||
| Net cash flows from(used in) operations | 343012969 | 343012969 | ||||||||||||||||||||||||||
| CASH FLOWS FROM INVESTING ACTIVITIES | ||||||||||||||||||||||||||||
| Payments for plant amp equipment | Other capex | (51134992) | (51134992) | |||||||||||||||||||||||||
| Payments for exploration amp evaluation - WA | Exploration | (27398818) | (27398818) | |||||||||||||||||||||||||
| Payments for exploration amp evaluation - NSW | Exploration | (9718696) | (9718696) | |||||||||||||||||||||||||
| Payments for development | Mine development | (57306547) | (57306547) | |||||||||||||||||||||||||
| Payments for mine properties - DNO | Mine development | (3078067) | (3078067) | |||||||||||||||||||||||||
| Payments for mine properties - DSO | Mine development | (74445922) | (74445922) | |||||||||||||||||||||||||
| Payments for termsecurity deposits | Other | (1221) | (1221) | |||||||||||||||||||||||||
| Proceeds on disposal of term deposits | Other | - | ||||||||||||||||||||||||||
| Payments for WALs | Other capex | - | ||||||||||||||||||||||||||
| Acquisition of exploration assets (net of cash) | DKM Acquisition | (21281415) | (21281415) | |||||||||||||||||||||||||
| Proceeds on disposal of PampE | Other capex | 21277 | 21277 | |||||||||||||||||||||||||
| Net cash flows used in investing activities | (244344402) | (244344402) | ||||||||||||||||||||||||||
| CASH FLOWS FROM FINANCING ACTIVITIES | ||||||||||||||||||||||||||||
| Proceeds from equity raisings | - | - | ||||||||||||||||||||||||||
| Proceeds from exercise of options | Other | 279000 | 279000 | |||||||||||||||||||||||||
| Share issue costs | Other | (14386) | (14386) | |||||||||||||||||||||||||
| Dividends paid | Dividends | (81308874) | (81308874) | |||||||||||||||||||||||||
| Repayment of finance lease | Other capex | (13893955) | (13893955) | |||||||||||||||||||||||||
| Repayment of borrowings | Operations | - | - | |||||||||||||||||||||||||
| Net cash flows from financing activities | (94938215) | (94938215) | ||||||||||||||||||||||||||
| Net increase(decrease) in cash amp equivalents | 3730352 | 3730352 | ||||||||||||||||||||||||||
| Cash amp bullion at the start of the period | 205165482 | Elisha Civil Elisha CivilDifference between bullion for quarterly vs accounts Adjusted agaisnt mvmt in gold on hand | 205165482 | |||||||||||||||||||||||||
| Effects of exchange rate movements on cash | Operations | - | ||||||||||||||||||||||||||
| Movement in gold on hand | Operations | 400748 | - | 400748 | ||||||||||||||||||||||||
| Cash amp bullion at the end of the period | 209296582 | 209296582 | ||||||||||||||||||||||||||
| GOH Cost for Accounts revalued to Selling Price for Quarterly | Cost | |||||||||||||||||||||||||||
| At 30-Jun | Oz | $oz | $ | |||||||||||||||||||||||||
| MLW | - | |||||||||||||||||||||||||||
| GDW | - | |||||||||||||||||||||||||||
| RMT | - | |||||||||||||||||||||||||||
| - | - | |||||||||||||||||||||||||||
| Values | Line X | Ends | Before | After | Line Y | Label Y | Y Label | CASH FLOWS FROM OPERATIONS | Category | Manual Adj | Apr-20 | May-20 | Jun-20 | |||||||||||||||||||
| Q3 FY20 | 1688 | 15 | $1688m | 1688 | Receipts from gold sales | Operations | 239209941 | 61534907 | 61116192 | 116558842 | ||||||||||||||||||||||
| Operations | 1089 | 25 | - | $1688m | $2777m | $2777m | $2233m | $1089m | Option premium income | Other | - | - | - | - | ||||||||||||||||||
| Capitalised Mining | (289) | 35 | - | $2777m | $2488m | $2488m | $2632m | ($289m) | Other income | Other | 22508 | 17836 | 2280 | 2392 | ||||||||||||||||||
| Exploration | (108) | 45 | - | $2488m | $2380m | $2380m | $2434m | ($108m) | Payments to suppliers and employees - DNO | Operations | (22933926) | (11538320) | (6158155) | (5237451) | ||||||||||||||||||
| Other capex | (93) | 55 | - | $2380m | $2286m | $2286m | $2333m | ($93m) | Payments to suppliers and employees - DSO | Operations | (72606256) | (31657306) | (16512050) | (24436900) | ||||||||||||||||||
| Other | (42) | 65 | - | $2286m | $2244m | $2244m | $2265m | ($42m) | Payments to suppliers and employees - CORP | Other | (4285083) | (1925232) | (753452) | (1606399) | ||||||||||||||||||
| Q4 FY20 | 75 | $2244m | ERRORNA | ERRORNA | $2244m | ERRORNA | Interest received | Other | 97155 | 44231 | 27040 | 25884 | ||||||||||||||||||||
| Income tax | (151) | 85 | - | $2244m | $2093m | $2093m | $2169m | ($151m) | Income tax paid | Income tax | (15130839) | (5547601) | (4808025) | (4775213) | ||||||||||||||||||
| Q4 FY20 | $2093m | Interest paid | Other | (42349) | (7863) | (7572) | (26914) | |||||||||||||||||||||||||
| - | ||||||||||||||||||||||||||||||||
| Net cash flows from(used in) operations | 124331151 | 10920652 | 32906258 | 80504241 | ||||||||||||||||||||||||||||
| CASH FLOWS FROM INVESTING ACTIVITIES | ||||||||||||||||||||||||||||||||
| Payments for plant amp equipment | Other capex | (9049407) | (3741077) | (3448433) | (1859897) | |||||||||||||||||||||||||||
| Payments for exploration amp evaluation - WA | Exploration | (7076164) | (1802844) | (3416589) | (1856731) | |||||||||||||||||||||||||||
| Payments for exploration amp evaluation - NSW | Exploration | (2454965) | (1000956) | (521105) | (932904) | |||||||||||||||||||||||||||
| Payments for development | Capitalised Mining | (29316090) | 1457447 | (6942071) | (23831466) | |||||||||||||||||||||||||||
| Payments for mine properties - DNO | Capitalised Mining | (1222223) | 106895 | (375908) | (953210) | |||||||||||||||||||||||||||
| Payments for mine properties - DSO | Capitalised Mining | 1607658 | (19271552) | (8669156) | 29548366 | |||||||||||||||||||||||||||
| Payments for term deposits | Other | (244) | - | (244) | - | |||||||||||||||||||||||||||
| Proceeds on disposal of term deposits | Other | - | - | - | - | |||||||||||||||||||||||||||
| Payments for WALs | Other capex | - | - | - | - | |||||||||||||||||||||||||||
| Acquisition of exploration assets (net of cash) | Exploration | (1281415) | (1281415) | - | - | |||||||||||||||||||||||||||
| Proceeds on disposal of PampE | Other capex | 67271 | 62726 | - | 4545 | |||||||||||||||||||||||||||
| - | ||||||||||||||||||||||||||||||||
| Net cash flows used in investing activities | (48725579) | (25470776) | (23373506) | 118703 | ||||||||||||||||||||||||||||
| CASH FLOWS FROM FINANCING ACTIVITIES | ||||||||||||||||||||||||||||||||
| Proceeds from equity raisings | - | |||||||||||||||||||||||||||||||
| Proceeds from exercise of options | - | |||||||||||||||||||||||||||||||
| Share issue costs | - | - | - | - | ||||||||||||||||||||||||||||
| Dividend paid | Dividends | - | - | - | - | |||||||||||||||||||||||||||
| Repayment of finance lease | Other capex | (362247) | (96615) | (96906) | (168726) | |||||||||||||||||||||||||||
| Repayment of borrowings | - | |||||||||||||||||||||||||||||||
| Net cash flows from financing activities | (362247) | (96615) | (96906) | (168726) | ||||||||||||||||||||||||||||
| Net increase(decrease) in cash amp equivalents | 75243325 | (14646739) | 9435846 | 80454218 | ||||||||||||||||||||||||||||
| Cash amp bullion at the start of the period | 168792961 | |||||||||||||||||||||||||||||||
| Effects of exchange rate movements on cash | Operations | - | ||||||||||||||||||||||||||||||
| Movement in gold on hand | Operations | (34751541) | 11380540 | (629847) | (45502234) | |||||||||||||||||||||||||||
| Cash amp bullion at the end of the period | 209284745 | (3266199) | 8805999 | 34951984 | ||||||||||||||||||||||||||||
| GOH Cost for Accounts revalued to Selling Price for Quarterly | Cost | Sales | ||||||||||||||||||||||||||||||
| At 30-Jun | Oz | $oz | $ | $oz | $ | |||||||||||||||||||||||||||
| MLW | 932746 | 1551 | 1446431 | 2576 | 2403015 | |||||||||||||||||||||||||||
| GDW | 3641826 | 1181 | 4302218 | 2576 | 9382364 | |||||||||||||||||||||||||||
| RMT | 1973258 | 1445 | 2851935 | 2576 | 5083665 | |||||||||||||||||||||||||||
| 6547830 | 8600584 | 16869043 |
| Values | Line X | Ends | Before | After | Line Y | Label Y | Y Label | CASH FLOWS FROM OPERATIONS | Category | Manual Adj | Apr-20 | May-20 | Jun-20 | |||||||||||||||||||
| Q3 FY20 | 1688 | 15 | $1688m | 1688 | Receipts from gold sales | Operations | 239209941 | 61534907 | 61116192 | 116558842 | ||||||||||||||||||||||
| Operations | 1089 | 25 | - | $1688m | $2777m | $2777m | $2233m | $1089m | Option premium income | Other | - | - | - | - | ||||||||||||||||||
| Capitalised Mining | (289) | 35 | - | $2777m | $2488m | $2488m | $2632m | ($289m) | Other income | Other | 22508 | 17836 | 2280 | 2392 | ||||||||||||||||||
| Exploration | (108) | 45 | - | $2488m | $2380m | $2380m | $2434m | ($108m) | Payments to suppliers and employees - DNO | Operations | (22933926) | (11538320) | (6158155) | (5237451) | ||||||||||||||||||
| Other capex | (93) | 55 | - | $2380m | $2286m | $2286m | $2333m | ($93m) | Payments to suppliers and employees - DSO | Operations | (72606256) | (31657306) | (16512050) | (24436900) | ||||||||||||||||||
| Income tax | (151) | 65 | - | $2286m | $2135m | $2135m | $2211m | ($151m) | Payments to suppliers and employees - CORP | Other | (4285083) | (1925232) | (753452) | (1606399) | ||||||||||||||||||
| Other | (42) | 75 | - | $2135m | $2093m | $2093m | $2114m | ($42m) | Interest received | Other | 97155 | 44231 | 27040 | 25884 | ||||||||||||||||||
| Q4 FY20 | $2093m | Income tax paid | Income tax | (15130839) | (5547601) | (4808025) | (4775213) | |||||||||||||||||||||||||
| Interest paid | Other | (42349) | (7863) | (7572) | (26914) | |||||||||||||||||||||||||||
| - | ||||||||||||||||||||||||||||||||
| Net cash flows from(used in) operations | 124331151 | 10920652 | 32906258 | 80504241 | ||||||||||||||||||||||||||||
| CASH FLOWS FROM INVESTING ACTIVITIES | ||||||||||||||||||||||||||||||||
| Payments for plant amp equipment | Other capex | (9049407) | (3741077) | (3448433) | (1859897) | |||||||||||||||||||||||||||
| Payments for exploration amp evaluation - WA | Exploration | (7076164) | (1802844) | (3416589) | (1856731) | |||||||||||||||||||||||||||
| Payments for exploration amp evaluation - NSW | Exploration | (2454965) | (1000956) | (521105) | (932904) | |||||||||||||||||||||||||||
| Payments for development | Capitalised Mining | (29316090) | 1457447 | (6942071) | (23831466) | |||||||||||||||||||||||||||
| Payments for mine properties - DNO | Capitalised Mining | (1222223) | 106895 | (375908) | (953210) | |||||||||||||||||||||||||||
| Payments for mine properties - DSO | Capitalised Mining | 1607658 | (19271552) | (8669156) | 29548366 | |||||||||||||||||||||||||||
| Payments for term deposits | Other | (244) | - | (244) | - | |||||||||||||||||||||||||||
| Proceeds on disposal of term deposits | Other | - | - | - | - | |||||||||||||||||||||||||||
| Payments for WALs | Other capex | - | - | - | - | |||||||||||||||||||||||||||
| Acquisition of exploration assets (net of cash) | Exploration | (1281415) | (1281415) | - | - | |||||||||||||||||||||||||||
| Proceeds on disposal of PampE | Other capex | 67271 | 62726 | - | 4545 | |||||||||||||||||||||||||||
| - | ||||||||||||||||||||||||||||||||
| Net cash flows used in investing activities | (48725579) | (25470776) | (23373506) | 118703 | ||||||||||||||||||||||||||||
| CASH FLOWS FROM FINANCING ACTIVITIES | ||||||||||||||||||||||||||||||||
| Proceeds from equity raisings | - | |||||||||||||||||||||||||||||||
| Proceeds from exercise of options | - | |||||||||||||||||||||||||||||||
| Share issue costs | - | - | - | - | ||||||||||||||||||||||||||||
| Dividend paid | Dividends | - | - | - | - | |||||||||||||||||||||||||||
| Repayment of finance lease | Other capex | (362247) | (96615) | (96906) | (168726) | |||||||||||||||||||||||||||
| Repayment of borrowings | - | |||||||||||||||||||||||||||||||
| Net cash flows from financing activities | (362247) | (96615) | (96906) | (168726) | ||||||||||||||||||||||||||||
| Net increase(decrease) in cash amp equivalents | 75243325 | (14646739) | 9435846 | 80454218 | ||||||||||||||||||||||||||||
| Cash amp bullion at the start of the period | 168792961 | |||||||||||||||||||||||||||||||
| Effects of exchange rate movements on cash | Operations | - | ||||||||||||||||||||||||||||||
| Movement in gold on hand | Operations | (34751541) | 11380540 | (629847) | (45502234) | |||||||||||||||||||||||||||
| Cash amp bullion at the end of the period | 209284745 | (3266199) | 8805999 | 34951984 | ||||||||||||||||||||||||||||
| GOH Cost for Accounts revalued to Selling Price for Quarterly | Cost | Sales | ||||||||||||||||||||||||||||||
| At 30-Jun | Oz | $oz | $ | $oz | $ | |||||||||||||||||||||||||||
| MLW | 932746 | 1551 | 1446431 | 2576 | 2403015 | |||||||||||||||||||||||||||
| GDW | 3641826 | 1181 | 4302218 | 2576 | 9382364 | |||||||||||||||||||||||||||
| RMT | 1973258 | 1445 | 2851935 | 2576 | 5083665 | |||||||||||||||||||||||||||
| 6547830 | 8600584 | 16869043 |
| Values | Line X | Ends | Before | After | Line Y | Label Y | Y Label | CASH FLOWS FROM OPERATIONS | Category | Manual Adj | Jan-20 | Feb-20 | Mar-20 | |||||||||||||||||||
| Q2 FY20 | 1688 | 15 | $1688m | 1688 | Receipts from gold sales | Operations | 160623035 | 26412330 | 63222938 | 70987767 | ||||||||||||||||||||||
| Operations | 1074 | 25 | - | $1688m | $2762m | $2762m | $2225m | $1074m | Option premium income | Other | - | - | - | - | ||||||||||||||||||
| Capitalised Mining | (300) | 35 | - | $2762m | $2461m | $2461m | $2612m | ($300m) | Other income | Other | 53843 | 17862 | 16362 | 19619 | ||||||||||||||||||
| Exploration | (77) | 45 | - | $2461m | $2384m | $2384m | $2423m | ($77m) | Payments to suppliers and employees - DNO | Operations | (27888576) | (14390523) | (5596867) | (7901186) | ||||||||||||||||||
| Other capex | (121) | 55 | - | $2384m | $2263m | $2263m | $2324m | ($121m) | Payments to suppliers and employees - DSO | Operations | (67150690) | (36688331) | (16219313) | (14243047) | ||||||||||||||||||
| Other | (13) | 65 | - | $2263m | $2251m | $2251m | $2257m | ($13m) | Payments to suppliers and employees - CORP | Other | (1537032) | 1079078 | (895045) | (1721065) | ||||||||||||||||||
| Q3 FY20 | 75 | $2251m | ERRORNA | ERRORNA | $2251m | ERRORNA | Interest received | Other | 244942 | 75732 | 94076 | 75134 | ||||||||||||||||||||
| Income tax | (156) | 85 | - | $2251m | $2094m | $2094m | $2173m | ($156m) | Income tax paid | Income tax | (15627450) | (8613666) | (2070215) | (4943569) | ||||||||||||||||||
| Dividends | (407) | 95 | - | $2094m | $1688m | $1688m | $1891m | ($407m) | Interest paid | Other | (25320) | (8728) | (8440) | (8152) | ||||||||||||||||||
| Q3 FY20 | $1688m | GIC Inventory Mvmt | GIC Mvmt | - | ||||||||||||||||||||||||||||
| Net cash flows from(used in) operations | 48692752 | (32116246) | 38543496 | 42265502 | ||||||||||||||||||||||||||||
| CASH FLOWS FROM INVESTING ACTIVITIES | ||||||||||||||||||||||||||||||||
| Payments for plant amp equipment | Other capex | (11755002) | (4822830) | (3794308) | (3137864) | |||||||||||||||||||||||||||
| Payments for exploration amp evaluation - WA | Exploration | (5925264) | (1401349) | (1807101) | (2716814) | |||||||||||||||||||||||||||
| Payments for exploration amp evaluation - NSW | Exploration | (1785388) | (516065) | (477680) | (791643) | |||||||||||||||||||||||||||
| Payments for development | Capitalised Mining | (18120061) | (6637683) | (7888434) | (3593944) | |||||||||||||||||||||||||||
| Payments for mine properties - DNO | Capitalised Mining | 682043 | 125306 | (224267) | 781004 | |||||||||||||||||||||||||||
| Payments for mine properties - DSO | Capitalised Mining | (12601334) | (5605382) | (6995952) | - | |||||||||||||||||||||||||||
| Payments for termsecurity deposits | Other | (283) | - | (283) | - | |||||||||||||||||||||||||||
| Proceeds on disposal of term deposits | Other | - | - | - | - | |||||||||||||||||||||||||||
| Payments for WALs | Other capex | - | - | - | - | |||||||||||||||||||||||||||
| Acquisition of exploration assets (net of cash) | DKM Acquisition | - | - | - | - | |||||||||||||||||||||||||||
| Proceeds on disposal of PampE | Other capex | (46908) | - | (46908) | - | |||||||||||||||||||||||||||
| Net cash flows used in investing activities | (49552197) | (18858003) | (21234933) | (9459261) | ||||||||||||||||||||||||||||
| CASH FLOWS FROM FINANCING ACTIVITIES | ||||||||||||||||||||||||||||||||
| Proceeds from equity raisings | - | - | - | - | ||||||||||||||||||||||||||||
| Proceeds from exercise of options | Other | - | - | - | - | |||||||||||||||||||||||||||
| Share issue costs | Other | - | - | - | - | |||||||||||||||||||||||||||
| Dividends paid | Dividends | (40654437) | - | - | (40654437) | |||||||||||||||||||||||||||
| Repayment of finance lease | Other capex | (288112) | (95749) | (96037) | (96326) | |||||||||||||||||||||||||||
| Repayment of borrowings | - | - | - | - | ||||||||||||||||||||||||||||
| Net cash flows from financing activities | (40942549) | (95749) | (96037) | (40750763) | ||||||||||||||||||||||||||||
| Net increase(decrease) in cash amp equivalents | (41801994) | (51069998) | 17212526 | (7944522) | ||||||||||||||||||||||||||||
| Cash amp bullion at the start of the period | 168811968 | Elisha Civil Elisha CivilDifference between bullion for quarterly vs accounts Adjusted agaisnt mvmt in gold on hand | 168811968 | 155761070 | 165924457 | |||||||||||||||||||||||||||
| Effects of exchange rate movements on cash | Operations | - | ||||||||||||||||||||||||||||||
| Movement in gold on hand | Operations | 41782986 | - | 38019099 | (7049139) | 10813026 | ||||||||||||||||||||||||||
| Cash amp bullion at the end of the period | 168792961 | 155761070 | 165924457 | 168792961 | ||||||||||||||||||||||||||||
| GOH Cost for Accounts revalued to Selling Price for Quarterly | Cost | Sales | ||||||||||||||||||||||||||||||
| At 31-Mar | Oz | $oz | $ | $oz | $ | |||||||||||||||||||||||||||
| MLW | 4427350 | 1027 | 4545234 | 2606 | 11535846 | |||||||||||||||||||||||||||
| GDW | 10428048 | 1155 | 12044939 | 2606 | 27171187 | |||||||||||||||||||||||||||
| RMT | 4956097 | 1159 | 5743676 | 2606 | 12913542 | |||||||||||||||||||||||||||
| 19811495 | 22333849 | 51620575 | ||||||||||||||||||||||||||||||
| Values | Line X | Ends | Before | After | Line Y | Label Y | Y Label | CASH FLOWS FROM OPERATIONS | Category | Manual Adj | Jan-20 | Feb-20 | Mar-20 | |||||||||||||||||||
| Q2 FY20 | 1688 | 15 | $1688m | 1688 | Receipts from gold sales | Operations | 160623035 | 26412330 | 63222938 | 70987767 | ||||||||||||||||||||||
| Operations | 1074 | 25 | - | $1688m | $2762m | $2762m | $2225m | $1074m | Option premium income | Other | - | - | - | - | ||||||||||||||||||
| Capitalised Mining | (300) | 35 | - | $2762m | $2461m | $2461m | $2612m | ($300m) | Other income | Other | 53843 | 17862 | 16362 | 19619 | ||||||||||||||||||
| Exploration | (77) | 45 | - | $2461m | $2384m | $2384m | $2423m | ($77m) | Payments to suppliers and employees - DNO | Operations | (27888576) | (14390523) | (5596867) | (7901186) | ||||||||||||||||||
| Other capex | (121) | 55 | - | $2384m | $2263m | $2263m | $2324m | ($121m) | Payments to suppliers and employees - DSO | Operations | (67150690) | (36688331) | (16219313) | (14243047) | ||||||||||||||||||
| Income tax | (156) | 65 | - | $2263m | $2107m | $2107m | $2185m | ($156m) | Payments to suppliers and employees - CORP | Other | (1537032) | 1079078 | (895045) | (1721065) | ||||||||||||||||||
| Other | (13) | 75 | - | $2107m | $2094m | $2094m | $2101m | ($13m) | Interest received | Other | 244942 | 75732 | 94076 | 75134 | ||||||||||||||||||
| Q3 FY20 | 85 | $2094m | ERRORNA | ERRORNA | $2094m | ERRORNA | Income tax paid | Income tax | (15627450) | (8613666) | (2070215) | (4943569) | ||||||||||||||||||||
| Dividends | (407) | 95 | - | $2094m | $1688m | $1688m | $1891m | ($407m) | Interest paid | Other | (25320) | (8728) | (8440) | (8152) | ||||||||||||||||||
| Q3 FY20 | $1688m | GIC Inventory Mvmt | GIC Mvmt | - | ||||||||||||||||||||||||||||
| Net cash flows from(used in) operations | 48692752 | (32116246) | 38543496 | 42265502 | ||||||||||||||||||||||||||||
| CASH FLOWS FROM INVESTING ACTIVITIES | ||||||||||||||||||||||||||||||||
| Payments for plant amp equipment | Other capex | (11755002) | (4822830) | (3794308) | (3137864) | |||||||||||||||||||||||||||
| Payments for exploration amp evaluation - WA | Exploration | (5925264) | (1401349) | (1807101) | (2716814) | |||||||||||||||||||||||||||
| Payments for exploration amp evaluation - NSW | Exploration | (1785388) | (516065) | (477680) | (791643) | |||||||||||||||||||||||||||
| Payments for development | Capitalised Mining | (18120061) | (6637683) | (7888434) | (3593944) | |||||||||||||||||||||||||||
| Payments for mine properties - DNO | Capitalised Mining | 682043 | 125306 | (224267) | 781004 | |||||||||||||||||||||||||||
| Payments for mine properties - DSO | Capitalised Mining | (12601334) | (5605382) | (6995952) | - | |||||||||||||||||||||||||||
| Payments for termsecurity deposits | Other | (283) | - | (283) | - | |||||||||||||||||||||||||||
| Proceeds on disposal of term deposits | Other | - | - | - | - | |||||||||||||||||||||||||||
| Payments for WALs | Other capex | - | - | - | - | |||||||||||||||||||||||||||
| Acquisition of exploration assets (net of cash) | DKM Acquisition | - | - | - | - | |||||||||||||||||||||||||||
| Proceeds on disposal of PampE | Other capex | (46908) | - | (46908) | - | |||||||||||||||||||||||||||
| Net cash flows used in investing activities | (49552197) | (18858003) | (21234933) | (9459261) | ||||||||||||||||||||||||||||
| CASH FLOWS FROM FINANCING ACTIVITIES | ||||||||||||||||||||||||||||||||
| Proceeds from equity raisings | - | - | - | - | ||||||||||||||||||||||||||||
| Proceeds from exercise of options | Other | - | - | - | - | |||||||||||||||||||||||||||
| Share issue costs | Other | - | - | - | - | |||||||||||||||||||||||||||
| Dividends paid | Dividends | (40654437) | - | - | (40654437) | |||||||||||||||||||||||||||
| Repayment of finance lease | Other capex | (288112) | (95749) | (96037) | (96326) | |||||||||||||||||||||||||||
| Repayment of borrowings | - | - | - | - | ||||||||||||||||||||||||||||
| Net cash flows from financing activities | (40942549) | (95749) | (96037) | (40750763) | ||||||||||||||||||||||||||||
| Net increase(decrease) in cash amp equivalents | (41801994) | (51069998) | 17212526 | (7944522) | ||||||||||||||||||||||||||||
| Cash amp bullion at the start of the period | 168811968 | Elisha Civil Elisha CivilDifference between bullion for quarterly vs accounts Adjusted agaisnt mvmt in gold on hand | 168811968 | 155761070 | 165924457 | |||||||||||||||||||||||||||
| Effects of exchange rate movements on cash | Operations | - | ||||||||||||||||||||||||||||||
| Movement in gold on hand | Operations | 41782986 | - | 38019099 | (7049139) | 10813026 | ||||||||||||||||||||||||||
| Cash amp bullion at the end of the period | 168792961 | 155761070 | 165924457 | 168792961 | ||||||||||||||||||||||||||||
| GOH Cost for Accounts revalued to Selling Price for Quarterly | Cost | Sales | ||||||||||||||||||||||||||||||
| At 31-Mar | Oz | $oz | $ | $oz | $ | |||||||||||||||||||||||||||
| MLW | 4427350 | 1027 | 4545234 | 2606 | 11535846 | |||||||||||||||||||||||||||
| GDW | 10428048 | 1155 | 12044939 | 2606 | 27171187 | |||||||||||||||||||||||||||
| RMT | 4956097 | 1159 | 5743676 | 2606 | 12913542 | |||||||||||||||||||||||||||
| 19811495 | 22333849 | 51620575 | ||||||||||||||||||||||||||||||
| Values | Line X | Ends | Before | After | Line Y | Label Y | Y Label | CASH FLOWS FROM OPERATIONS | Category | Statutory Adj | ||||||||||||||||||
| June 2019 | 2052 | 15 | $2052m | 2052 | Receipts from gold sales | Operations | 370796353 | 370796353 | ||||||||||||||||||||
| Operations | 1791 | 25 | - | $2052m | $3843m | $3843m | $2947m | $1791m | Option premium income | Other | - | - | ||||||||||||||||
| Mine development | (551) | 35 | - | $3843m | $3292m | $3292m | $3567m | ($551m) | Other income | Other | 437464 | 437464 | ||||||||||||||||
| Exploration | (199) | 45 | - | $3292m | $3093m | $3093m | $3192m | ($199m) | Payments to suppliers and employees - DNO | Operations | (48442870) | (48442870) | ||||||||||||||||
| Other capex | (359) | 55 | - | $3093m | $2734m | $2734m | $2913m | ($359m) | Payments to suppliers and employees - DSO | Operations | (131007320) | (131007320) | ||||||||||||||||
| Income tax | (330) | 65 | - | $2734m | $2403m | $2403m | $2568m | ($330m) | Payments to suppliers and employees - CORP | Other | (11556512) | (11556512) | ||||||||||||||||
| Other | (109) | 75 | - | $2403m | $2295m | $2295m | $2349m | ($109m) | Interest received | Other | 665227 | 665227 | ||||||||||||||||
| Cash and Bullion before Acquisitions amp Dividends | 85 | $2295m | ERRORNA | ERRORNA | $2295m | ERRORNA | GIC Inventory Mvmt | GIC Mvmt | - | - | ||||||||||||||||||
| DKM Acquisition | (200) | 95 | - | $2295m | $2095m | $2095m | $2195m | ($200m) | Income tax paid | Income tax | (33034117) | (33034117) | ||||||||||||||||
| Dividends | (407) | 105 | - | $2095m | $1688m | $1688m | $1891m | ($407m) | Interest paid | Other | (674443) | (674443) | ||||||||||||||||
| December 2019 | $1688m | GIC Inventory Mvmt | GIC Mvmt | - | - | |||||||||||||||||||||||
| Net cash flows from(used in) operations | 147183783 | 147183783 | ||||||||||||||||||||||||||
| CASH FLOWS FROM INVESTING ACTIVITIES | ||||||||||||||||||||||||||||
| Payments for plant amp equipment | Other capex | (35919500) | (35919500) | |||||||||||||||||||||||||
| Payments for exploration amp evaluation - WA | Exploration | (14393471) | (14393471) | |||||||||||||||||||||||||
| Payments for exploration amp evaluation - NSW | Exploration | (5477332) | (5477332) | |||||||||||||||||||||||||
| Payments for development | Mine development | (23173710) | (23173710) | |||||||||||||||||||||||||
| Payments for mine properties - DNO | Mine development | (2537890) | (2537890) | |||||||||||||||||||||||||
| Payments for mine properties - DSO | Mine development | (29394527) | (29394527) | |||||||||||||||||||||||||
| Payments for termsecurity deposits | Other | (694) | (694) | |||||||||||||||||||||||||
| Proceeds on disposal of term deposits | Other | - | - | |||||||||||||||||||||||||
| Payments for WALs | Other capex | - | - | |||||||||||||||||||||||||
| Acquisition of exploration assets (net of cash) | DKM Acquisition | (20000000) | (20000000) | |||||||||||||||||||||||||
| Proceeds on disposal of PampE | Other capex | 914 | 914 | |||||||||||||||||||||||||
| Net cash flows used in investing activities | (130896211) | (130896211) | ||||||||||||||||||||||||||
| CASH FLOWS FROM FINANCING ACTIVITIES | ||||||||||||||||||||||||||||
| Proceeds from equity raisings | - | - | ||||||||||||||||||||||||||
| Proceeds from exercise of options | Other | 279000 | 279000 | |||||||||||||||||||||||||
| Share issue costs | Other | (14386) | (14386) | |||||||||||||||||||||||||
| Dividends paid | Dividends | (40654437) | (40654437) | |||||||||||||||||||||||||
| Repayment of finance lease | Other capex | - | - | |||||||||||||||||||||||||
| Repayment of borrowings | Operations | (5620565) | (5620565) | |||||||||||||||||||||||||
| Net cash flows from financing activities | (46010388) | (46010388) | ||||||||||||||||||||||||||
| Net increase(decrease) in cash amp equivalents | (29722816) | (29722816) | ||||||||||||||||||||||||||
| Cash amp bullion at the start of the period | 205165482 | Elisha Civil Elisha CivilDifference between bullion for quarterly vs accounts Adjusted agaisnt mvmt in gold on hand | 205165482 | |||||||||||||||||||||||||
| Effects of exchange rate movements on cash | Operations | - | - | |||||||||||||||||||||||||
| Movement in gold on hand | Operations | (6630697) | - | (6630697) | ||||||||||||||||||||||||
| Cash amp bullion at the end of the period | 168811969 | 168811969 | ||||||||||||||||||||||||||
| GOH Cost for Accounts revalued to Selling Price for Quarterly | Cost | |||||||||||||||||||||||||||
| At 30-Jun | Oz | $oz | $ | |||||||||||||||||||||||||
| MLW | 2331195 | 1244 | 2901126 | |||||||||||||||||||||||||
| GDW | 3775510 | 1135 | 4286261 | |||||||||||||||||||||||||
| RMT | 1779190 | 1202 | 2137768 | |||||||||||||||||||||||||
| 7885895 | 9325154 | |||||||||||||||||||||||||||
| Values | Line X | Ends | Before | After | Line Y | Label Y | Y Label | CASH FLOWS FROM OPERATIONS | Category | Manual Adj | Jul-19 | Aug-19 | Sep-19 | Oct-19 | Nov-19 | Dec-19 | |||||||||||||||||||||||
| June 2019 | 2052 | 15 | $2052m | 2052 | Receipts from gold sales | Operations | 393628149 | 48733973 | 57888259 | 53259007 | 64607715 | 58641552 | 110497643 | ||||||||||||||||||||||||||
| Operations | 1825 | 25 | - | $2052m | $3877m | $3877m | $2964m | $1825m | Option premium income | Other | - | - | - | - | - | - | - | ||||||||||||||||||||||
| Mine development | (630) | 35 | - | $3877m | $3247m | $3247m | $3562m | ($630m) | Other income | Other | 529980 | 15362 | 16350 | 17382 | 17992 | 17599 | 445295 | ||||||||||||||||||||||
| Exploration | (206) | 45 | - | $3247m | $3041m | $3041m | $3144m | ($206m) | Payments to suppliers and employees - DNO | Operations | (55584856) | (18867571) | (5421615) | (5677647) | (10023851) | (7468076) | (8126096) | ||||||||||||||||||||||
| Other capex | (373) | 55 | - | $3041m | $2668m | $2668m | $2854m | ($373m) | Payments to suppliers and employees - DSO | Operations | (148915710) | (49555333) | (18307389) | (13961768) | (33056049) | (18400404) | (15634767) | ||||||||||||||||||||||
| Income tax | (285) | 65 | - | $2668m | $2383m | $2383m | $2526m | ($285m) | Payments to suppliers and employees - CORP | Other | (10277165) | 127934700 | (2387178) | (2286742) | (1477255) | (1202249) | (964042) | (1959699) | |||||||||||||||||||||
| Other | (89) | 75 | - | $2383m | $2295m | $2295m | $2339m | ($89m) | Interest received | Other | 665227 | 171509 | 149152 | 134191 | 87372 | 62835 | 60168 | ||||||||||||||||||||||
| December 2019 | 85 | $2295m | ERRORNA | ERRORNA | $2295m | ERRORNA | GIC Inventory Mvmt | GIC Mvmt | - | ||||||||||||||||||||||||||||||
| DKM Acquisition | (200) | 95 | - | $2295m | $2095m | $2095m | $2195m | ($200m) | Income tax paid | Income tax | (28461255) | (6214961) | (2525166) | (4519941) | (4155608) | (11045579) | - | ||||||||||||||||||||||
| Dividends | (407) | 105 | - | $2095m | $1688m | $1688m | $1891m | ($407m) | Interest paid | Other | (59440) | (6681) | (6391) | (6195) | (5997) | (5799) | (28377) | ||||||||||||||||||||||
| December 2019 | $1688m | GIC Inventory Mvmt | GIC Mvmt | - | |||||||||||||||||||||||||||||||||||
| Net cash flows from(used in) operations | 151524931 | (28110879) | 29506458 | 27767774 | 16269325 | 20838086 | 85254167 | ||||||||||||||||||||||||||||||||
| CASH FLOWS FROM INVESTING ACTIVITIES | |||||||||||||||||||||||||||||||||||||||
| Payments for plant amp equipment | Other capex | (36854389) | (10746245) | (4214487) | (5036392) | (8940874) | (2337548) | (5578843) | |||||||||||||||||||||||||||||||
| Payments for exploration amp evaluation - WA | Exploration | (15012294) | (1447005) | (2144467) | (3146413) | (2141208) | (2694944) | (3438257) | |||||||||||||||||||||||||||||||
| Payments for exploration amp evaluation - NSW | Exploration | (5575683) | (889004) | (1537672) | (985141) | (679178) | (561848) | (922840) | |||||||||||||||||||||||||||||||
| Payments for development | Mine development | (31072622) | (3407474) | (5400036) | (5465762) | (4926496) | (6438272) | (5434582) | |||||||||||||||||||||||||||||||
| Payments for mine properties - DNO | Mine development | (2537890) | 844308 | (139170) | (1108118) | (1243030) | (891880) | - | |||||||||||||||||||||||||||||||
| Payments for mine properties - DSO | Mine development | (29394527) | (8245160) | (6860356) | (797558) | (6936306) | (6184203) | (370944) | |||||||||||||||||||||||||||||||
| Payments for termsecurity deposits | Other | (694) | - | (363) | - | - | (331) | - | |||||||||||||||||||||||||||||||
| Proceeds on disposal of term deposits | Other | - | - | - | - | - | - | - | |||||||||||||||||||||||||||||||
| Payments for WALs | Other capex | - | - | - | - | - | - | - | |||||||||||||||||||||||||||||||
| Acquisition of exploration assets (net of cash) | DKM Acquisition | (20000000) | - | (20000000) | - | - | - | - | |||||||||||||||||||||||||||||||
| Proceeds on disposal of PampE | Other capex | 914 | - | - | - | - | 914 | - | |||||||||||||||||||||||||||||||
| Net cash flows used in investing activities | (140447186) | (23890581) | (40296551) | (16539384) | (24867092) | (19108112) | (15745466) | ||||||||||||||||||||||||||||||||
| CASH FLOWS FROM FINANCING ACTIVITIES | |||||||||||||||||||||||||||||||||||||||
| Proceeds from equity raisings | - | - | - | - | - | - | - | ||||||||||||||||||||||||||||||||
| Proceeds from exercise of options | Other | 279000 | 84000 | 195000 | - | - | - | - | |||||||||||||||||||||||||||||||
| Share issue costs | Other | (14386) | (10020) | (4366) | - | - | - | - | |||||||||||||||||||||||||||||||
| Dividends paid | Dividends | (40654437) | - | - | (40654437) | - | - | - | |||||||||||||||||||||||||||||||
| Repayment of finance lease | Other capex | (410738) | (97597) | (62234) | (62431) | (62627) | (62825) | (63024) | |||||||||||||||||||||||||||||||
| Repayment of borrowings | - | - | - | - | - | - | - | ||||||||||||||||||||||||||||||||
| Net cash flows from financing activities | (40800561) | (23617) | 128400 | (40716868) | (62627) | (62825) | (63024) | ||||||||||||||||||||||||||||||||
| Net increase(decrease) in cash amp equivalents | (29722816) | (52025077) | (10661693) | (29488478) | (8660394) | 1667149 | 69445677 | ||||||||||||||||||||||||||||||||
| Cash amp bullion at the start of the period | 205165482 | Elisha Civil Elisha CivilDifference between bullion for quarterly vs accounts Adjusted agaisnt mvmt in gold on hand | 205165482 | 176583719 | 165686211 | 176583719 | 171901281 | 175804668 | |||||||||||||||||||||||||||||||
| Effects of exchange rate movements on cash | Operations | - | |||||||||||||||||||||||||||||||||||||
| Movement in gold on hand | Operations | (6630697) | - | 23443314 | (235815) | 11215359 | 3977956 | 2236238 | (47267749) | ||||||||||||||||||||||||||||||
| Cash amp bullion at the end of the period | 168811968 | 176583719 | 165686211 | 147413092 | 171901281 | 175804668 | 197982595 | ||||||||||||||||||||||||||||||||
| GOH Cost for Accounts revalued to Selling Price for Quarterly | Cost | Sales | Sales | ||||||||||||||||||||||||||||||||||||
| At 30-Jun | Oz | $oz | $ | $oz | $ | $ | $oz | $ | |||||||||||||||||||||||||||||||
| MLW | 2331195 | 1244 | 2901126 | 1990 | 4639684 | 9234177798 | 2220 | 4418775 | |||||||||||||||||||||||||||||||
| GDW | 3775510 | 1135 | 4286261 | 1990 | 7514247 | 14955304304 | 2220 | 4418775 | |||||||||||||||||||||||||||||||
| RMT | 1779190 | 1202 | 2137768 | 1990 | 3541051 | 7047611545 | 2220 | 4418775 | |||||||||||||||||||||||||||||||
| 7885895 | 9325154 | 15694981 | 31237093647 | 13256326 | |||||||||||||||||||||||||||||||||||
| Values | Line X | Ends | Before | After | Line Y | Label Y | Y Label | CASH FLOWS FROM OPERATIONS | Category | Manual Adj | Jul-19 | Aug-19 | Sep-19 | Oct-19 | Nov-19 | Dec-19 | ||||||||||||||||||||||
| June 2019 | 2052 | 15 | $2052m | 2052 | Receipts from gold sales | Operations | 393628149 | 48733973 | 57888259 | 53259007 | 64607715 | 58641552 | 110497643 | |||||||||||||||||||||||||
| Operations | 1825 | 25 | - | $2052m | $3877m | $3877m | $2964m | $1825m | Option premium income | Other | - | - | - | - | - | - | - | |||||||||||||||||||||
| Dividends | (407) | 35 | - | $3877m | $3470m | $3470m | $3673m | ($407m) | Other income | Other | 529980 | 15362 | 16350 | 17382 | 17992 | 17599 | 445295 | |||||||||||||||||||||
| Mine development | (630) | 45 | - | $3470m | $2840m | $2840m | $3155m | ($630m) | Payments to suppliers and employees - DNO | Operations | (55584856) | (18867571) | (5421615) | (5677647) | (10023851) | (7468076) | (8126096) | |||||||||||||||||||||
| Exploration | (206) | 55 | - | $2840m | $2634m | $2634m | $2737m | ($206m) | Payments to suppliers and employees - DSO | Operations | (148915710) | (49555333) | (18307389) | (13961768) | (33056049) | (18400404) | (15634767) | |||||||||||||||||||||
| DKM Acquisition | (200) | 65 | - | $2634m | $2434m | $2434m | $2534m | ($200m) | Payments to suppliers and employees - CORP | Other | (10277165) | (2387178) | (2286742) | (1477255) | (1202249) | (964042) | (1959699) | |||||||||||||||||||||
| Other capex | (373) | 75 | - | $2434m | $2062m | $2062m | $2248m | ($373m) | Interest received | Other | 665227 | 171509 | 149152 | 134191 | 87372 | 62835 | 60168 | |||||||||||||||||||||
| Income tax | (285) | 85 | - | $2062m | $1777m | $1777m | $1919m | ($285m) | Income tax paid | Income tax | (28461255) | (6214961) | (2525166) | (4519941) | (4155608) | (11045579) | - | |||||||||||||||||||||
| Other | (89) | 95 | - | $1777m | $1688m | $1688m | $1733m | ($89m) | Interest paid | Other | (59440) | (6681) | (6391) | (6195) | (5997) | (5799) | (28377) | |||||||||||||||||||||
| December 2019 | $1688m | GIC Inventory Mvmt | GIC Mvmt | - | ||||||||||||||||||||||||||||||||||
| Net cash flows from(used in) operations | 151524931 | (28110879) | 29506458 | 27767774 | 16269325 | 20838086 | 85254167 | |||||||||||||||||||||||||||||||
| CASH FLOWS FROM INVESTING ACTIVITIES | ||||||||||||||||||||||||||||||||||||||
| Payments for plant amp equipment | Other capex | (36854389) | (10746245) | (4214487) | (5036392) | (8940874) | (2337548) | (5578843) | ||||||||||||||||||||||||||||||
| Payments for exploration amp evaluation - WA | Exploration | (15012294) | (1447005) | (2144467) | (3146413) | (2141208) | (2694944) | (3438257) | ||||||||||||||||||||||||||||||
| Payments for exploration amp evaluation - NSW | Exploration | (5575683) | (889004) | (1537672) | (985141) | (679178) | (561848) | (922840) | ||||||||||||||||||||||||||||||
| Payments for development | Mine development | (31072622) | (3407474) | (5400036) | (5465762) | (4926496) | (6438272) | (5434582) | ||||||||||||||||||||||||||||||
| Payments for mine properties - DNO | Mine development | (2537890) | 844308 | (139170) | (1108118) | (1243030) | (891880) | - | ||||||||||||||||||||||||||||||
| Payments for mine properties - DSO | Mine development | (29394527) | (8245160) | (6860356) | (797558) | (6936306) | (6184203) | (370944) | ||||||||||||||||||||||||||||||
| Payments for termsecurity deposits | Other | (694) | - | (363) | - | - | (331) | - | ||||||||||||||||||||||||||||||
| Proceeds on disposal of term deposits | Other | - | - | - | - | - | - | - | ||||||||||||||||||||||||||||||
| Payments for WALs | Other capex | - | - | - | - | - | - | - | ||||||||||||||||||||||||||||||
| Acquisition of exploration assets (net of cash) | DKM Acquisition | (20000000) | - | (20000000) | - | - | - | - | ||||||||||||||||||||||||||||||
| Proceeds on disposal of PampE | Other capex | 914 | - | - | - | - | 914 | - | ||||||||||||||||||||||||||||||
| Net cash flows used in investing activities | (140447186) | (23890581) | (40296551) | (16539384) | (24867092) | (19108112) | (15745466) | |||||||||||||||||||||||||||||||
| CASH FLOWS FROM FINANCING ACTIVITIES | ||||||||||||||||||||||||||||||||||||||
| Proceeds from equity raisings | - | - | - | - | - | - | - | |||||||||||||||||||||||||||||||
| Proceeds from exercise of options | Other | 279000 | 84000 | 195000 | - | - | - | - | ||||||||||||||||||||||||||||||
| Share issue costs | Other | (14386) | (10020) | (4366) | - | - | - | - | ||||||||||||||||||||||||||||||
| Dividends paid | Dividends | (40654437) | - | - | (40654437) | - | - | - | ||||||||||||||||||||||||||||||
| Repayment of finance lease | Other capex | (410738) | (97597) | (62234) | (62431) | (62627) | (62825) | (63024) | ||||||||||||||||||||||||||||||
| Repayment of borrowings | - | - | - | - | - | - | - | |||||||||||||||||||||||||||||||
| Net cash flows from financing activities | (40800561) | (23617) | 128400 | (40716868) | (62627) | (62825) | (63024) | |||||||||||||||||||||||||||||||
| Net increase(decrease) in cash amp equivalents | (29722816) | (52025077) | (10661693) | (29488478) | (8660394) | 1667149 | 69445677 | |||||||||||||||||||||||||||||||
| Cash amp bullion at the start of the period | 205165482 | Elisha Civil Elisha CivilDifference between bullion for quarterly vs accounts Adjusted agaisnt mvmt in gold on hand | 205165482 | 176583719 | 165686211 | 176583719 | 171901281 | 175804668 | ||||||||||||||||||||||||||||||
| Effects of exchange rate movements on cash | Operations | - | ||||||||||||||||||||||||||||||||||||
| Movement in gold on hand | Operations | (6630697) | - | 23443314 | (235815) | 11215359 | 3977956 | 2236238 | (47267749) | |||||||||||||||||||||||||||||
| Cash amp bullion at the end of the period | 168811968 | 176583719 | 165686211 | 147413092 | 171901281 | 175804668 | 197982595 | |||||||||||||||||||||||||||||||
| GOH Cost for Accounts revalued to Selling Price for Quarterly | Cost | Sales | Sales | |||||||||||||||||||||||||||||||||||
| At 30-Jun | Oz | $oz | $ | $oz | $ | $ | $oz | $ | ||||||||||||||||||||||||||||||
| MLW | 2331195 | 1244 | 2901126 | 1990 | 4639684 | 9234177798 | 2220 | 4418775 | ||||||||||||||||||||||||||||||
| GDW | 3775510 | 1135 | 4286261 | 1990 | 7514247 | 14955304304 | 2220 | 4418775 | ||||||||||||||||||||||||||||||
| RMT | 1779190 | 1202 | 2137768 | 1990 | 3541051 | 7047611545 | 2220 | 4418775 | ||||||||||||||||||||||||||||||
| 7885895 | 9325154 | 15694981 | 31237093647 | 13256326 | ||||||||||||||||||||||||||||||||||
| Values | Line X | Ends | Before | After | Line Y | Label Y | Y Label | CASH FLOWS FROM OPERATIONS | Category | Manual Adj | Jan-20 | Feb-20 | Mar-20 | |||||||||||||||||||
| Q2 FY19 | 1643 | 15 | $1643m | 1643 | Receipts from gold sales | Operations | 141168108 | 29410111 | 53532749 | 58225248 | ||||||||||||||||||||||
| Operations | 893 | 25 | - | $1643m | $2536m | $2536m | $2089m | $893m | Option premium income | Other | 1366000 | 1366000 | - | - | ||||||||||||||||||
| Dividends | (406) | 35 | - | $2536m | $2130m | $2130m | $2333m | ($406m) | Other income | Other | 50483 | 17780 | 16137 | 16566 | ||||||||||||||||||
| Mine development | (267) | 45 | - | $2130m | $1862m | $1862m | $1996m | ($267m) | Payments to suppliers and employees - DNO | Operations | (18868744) | (8394133) | (6571863) | (3902748) | ||||||||||||||||||
| Exploration | (67) | 55 | - | $1862m | $1796m | $1796m | $1829m | ($67m) | Payments to suppliers and employees - DSO | Operations | (59002550) | (31054273) | (14995797) | (12952479) | ||||||||||||||||||
| Other capex | (226) | 65 | - | $1796m | $1570m | $1570m | $1683m | ($226m) | Payments to suppliers and employees - CORP | Other | (3911562) | (2122227) | (654065) | (1135270) | ||||||||||||||||||
| Income tax | (112) | 75 | - | $1570m | $1458m | $1458m | $1514m | ($112m) | Interest received | Other | 614299 | 340374 | 84378 | 189547 | ||||||||||||||||||
| Other | (18) | 85 | - | $1458m | $1440m | $1440m | $1449m | ($18m) | Income tax paid | Income tax | (11220172) | (4704392) | (2330890) | (4184890) | ||||||||||||||||||
| Q3 FY19 | $1440m | Interest paid | Other | (10758) | (1127) | (1513) | (8118) | |||||||||||||||||||||||||
| Net cash flows from(used in) operations | 50185105 | (15141887) | 29079136 | 36247856 | ||||||||||||||||||||||||||||
| CASH FLOWS FROM INVESTING ACTIVITIES | ||||||||||||||||||||||||||||||||
| Payments for plant amp equipment | Other capex | (22287385) | (7475391) | (10556336) | (4255658) | |||||||||||||||||||||||||||
| Payments for exploration amp evaluation - WA | Exploration | (4530435) | (2083813) | (1008606) | (1438016) | |||||||||||||||||||||||||||
| Payments for exploration amp evaluation - NSW | Exploration | (2135047) | (637746) | (836498) | (660803) | |||||||||||||||||||||||||||
| Payments for development | Mine development | (8690080) | (342093) | (1689103) | (6658884) | |||||||||||||||||||||||||||
| Payments for mine properties - DNO | Mine development | 281159 | 0 | 396936 | (115777) | |||||||||||||||||||||||||||
| Payments for mine properties - DSO | Mine development | (18328789) | (10196278) | (9148806) | 1016295 | |||||||||||||||||||||||||||
| Payments for term deposits | Other | (443) | - | (443) | - | |||||||||||||||||||||||||||
| Proceeds on disposal of term deposits | Other | 77000 | 77000 | - | - | |||||||||||||||||||||||||||
| Payments for WALs | Other capex | - | - | - | - | |||||||||||||||||||||||||||
| Acquisition of exploration assets (net of cash) | Exploration | - | - | - | - | |||||||||||||||||||||||||||
| Proceeds on disposal of PampE | Other capex | - | - | - | - | |||||||||||||||||||||||||||
| - | ||||||||||||||||||||||||||||||||
| Net cash flows used in investing activities | (55614020) | (20658321) | (22842856) | (12112843) | ||||||||||||||||||||||||||||
| CASH FLOWS FROM FINANCING ACTIVITIES | ||||||||||||||||||||||||||||||||
| Proceeds from equity raisings | - | |||||||||||||||||||||||||||||||
| Proceeds from exercise of options | - | |||||||||||||||||||||||||||||||
| Share issue costs | (10812) | (5160) | (3768) | (1884) | ||||||||||||||||||||||||||||
| Dividend paid | Dividends | (40625957) | - | - | (40625957) | |||||||||||||||||||||||||||
| Repayment of finance lease | Other capex | (272361) | (70180) | (70367) | (131814) | |||||||||||||||||||||||||||
| Repayment of borrowings | - | |||||||||||||||||||||||||||||||
| Net cash flows from financing activities | (40909130) | (75340) | (74135) | (40759655) | ||||||||||||||||||||||||||||
| Net increase(decrease) in cash amp equivalents | (46338045) | (35875548) | 6162145 | (16624642) | ||||||||||||||||||||||||||||
| Cash amp bullion at the start of the period | 164250522 | 164250522 | 159897589 | 166588508 | ||||||||||||||||||||||||||||
| Effects of exchange rate movements on cash | Operations | - | ||||||||||||||||||||||||||||||
| Movement in gold on hand | Operations | 26046191 | - | 31522615 | 528774 | (6005198) | ||||||||||||||||||||||||||
| Cash amp bullion at the end of the period | 143958668 | 159897589 | 166588508 | 143958668 |
| Values | Line X | Ends | Before | After | Line Y | Label Y | Y Label | CASH FLOWS FROM OPERATIONS | Category | Manual Adj | Oct-19 | Nov-19 | Dec-19 | |||||||||||||||||||
| Q1 FY20 | 1474 | 15 | $1474m | 1474 | Receipts from gold sales | Operations | 233746910 | 64607715 | 58641552 | 110497643 | ||||||||||||||||||||||
| Operations | 1000 | 25 | - | $1474m | $2474m | $2474m | $1974m | $1000m | Option premium income | Other | - | - | - | - | ||||||||||||||||||
| Capitalised Mining | (324) | 35 | - | $2474m | $2150m | $2150m | $2312m | ($324m) | Other income | Other | 480886 | 17992 | 17599 | 445295 | ||||||||||||||||||
| Exploration | (104) | 45 | - | $2150m | $2045m | $2045m | $2098m | ($104m) | Payments to suppliers and employees - DNO | Operations | (25618023) | (10023851) | (7468076) | (8126096) | ||||||||||||||||||
| Other capex | (170) | 55 | - | $2045m | $1875m | $1875m | $1960m | ($170m) | Payments to suppliers and employees - DSO | Operations | (67091220) | (33056049) | (18400404) | (15634767) | ||||||||||||||||||
| Income tax | (152) | 65 | - | $1875m | $1723m | $1723m | $1799m | ($152m) | Payments to suppliers and employees - CORP | Other | (4125990) | (1202249) | (964042) | (1959699) | ||||||||||||||||||
| Other | (35) | 75 | - | $1723m | $1688m | $1688m | $1705m | ($35m) | Interest received | Other | 210375 | 87372 | 62835 | 60168 | ||||||||||||||||||
| Q2 FY20 | $1688m | Income tax paid | Income tax | (15201187) | (4155608) | (11045579) | - | |||||||||||||||||||||||||
| Interest paid | Other | (40173) | (5997) | (5799) | (28377) | |||||||||||||||||||||||||||
| GIC Inventory Mvmt | GIC Mvmt | - | ||||||||||||||||||||||||||||||
| Net cash flows from(used in) operations | 122361578 | 16269325 | 20838086 | 85254167 | ||||||||||||||||||||||||||||
| CASH FLOWS FROM INVESTING ACTIVITIES | ||||||||||||||||||||||||||||||||
| Payments for plant amp equipment | Other capex | (16857265) | (8940874) | (2337548) | (5578843) | |||||||||||||||||||||||||||
| Payments for exploration amp evaluation - WA | Exploration | (8274409) | (2141208) | (2694944) | (3438257) | |||||||||||||||||||||||||||
| Payments for exploration amp evaluation - NSW | Exploration | (2163866) | (679178) | (561848) | (922840) | |||||||||||||||||||||||||||
| Payments for development | Capitalised Mining | (16799350) | (4926496) | (6438272) | (5434582) | |||||||||||||||||||||||||||
| Payments for mine properties - DNO | Capitalised Mining | (2134910) | (1243030) | (891880) | - | |||||||||||||||||||||||||||
| Payments for mine properties - DSO | Capitalised Mining | (13491453) | (6936306) | (6184203) | (370944) | |||||||||||||||||||||||||||
| Payments for termsecurity deposits | Other | (331) | - | (331) | - | |||||||||||||||||||||||||||
| Proceeds on disposal of term deposits | Other | - | - | - | - | |||||||||||||||||||||||||||
| Payments for WALs | Other capex | - | - | - | - | |||||||||||||||||||||||||||
| Acquisition of exploration assets (net of cash) | DKM Acquisition | - | - | - | - | |||||||||||||||||||||||||||
| Proceeds on disposal of PampE | Other capex | 914 | - | 914 | - | |||||||||||||||||||||||||||
| Net cash flows used in investing activities | (59720670) | (24867092) | (19108112) | (15745466) | ||||||||||||||||||||||||||||
| CASH FLOWS FROM FINANCING ACTIVITIES | ||||||||||||||||||||||||||||||||
| Proceeds from equity raisings | - | - | - | - | ||||||||||||||||||||||||||||
| Proceeds from exercise of options | Other | - | - | - | - | |||||||||||||||||||||||||||
| Share issue costs | Other | - | - | - | - | |||||||||||||||||||||||||||
| Dividends paid | Dividends | - | - | - | - | |||||||||||||||||||||||||||
| Repayment of finance lease | Other capex | (188476) | (62627) | (62825) | (63024) | |||||||||||||||||||||||||||
| Repayment of borrowings | - | - | - | - | ||||||||||||||||||||||||||||
| Net cash flows from financing activities | (188476) | (62627) | (62825) | (63024) | ||||||||||||||||||||||||||||
| Net increase(decrease) in cash amp equivalents | 62452432 | (8660394) | 1667149 | 69445677 | ||||||||||||||||||||||||||||
| Cash amp bullion at the start of the period | 147413092 | Elisha Civil Elisha CivilDifference between bullion for quarterly vs accounts Adjusted agaisnt mvmt in gold on hand | 147413092 | 142730654 | 146634041 | |||||||||||||||||||||||||||
| Effects of exchange rate movements on cash | Operations | - | ||||||||||||||||||||||||||||||
| Movement in gold on hand | Operations | (41053555) | - | 3977956 | 2236238 | (47267749) | ||||||||||||||||||||||||||
| Cash amp bullion at the end of the period | 168811968 | 142730654 | 146634041 | 168811968 | ||||||||||||||||||||||||||||
| GOH Cost for Accounts revalued to Selling Price for Quarterly | Cost | Sales | ||||||||||||||||||||||||||||||
| At 31-Dec | Oz | $oz | $ | $oz | $ | |||||||||||||||||||||||||||
| MLW | 1043087 | 1155 | 1205224 | 2220 | 2315862 | |||||||||||||||||||||||||||
| GDW | 2096013 | 1147 | 2404709 | 2220 | 4653569 | |||||||||||||||||||||||||||
| RMT | 1291847 | 910 | 1175405 | 2220 | 2868159 | |||||||||||||||||||||||||||
| 4430947 | 4785338 | 9837589 | ||||||||||||||||||||||||||||||
| Values | Line X | Ends | Before | After | Line Y | Label Y | Y Label | CASH FLOWS FROM OPERATIONS | Category | Manual Adj | Oct-18 | Nov-18 | Dec-18 | |||||||||||||||||||
| Q1 FY19 | 1474 | 15 | $1474m | 1474 | Receipts from gold sales | Operations | 197565780 | 69872301 | 50017610 | 77675869 | ||||||||||||||||||||||
| Operations | 764 | 25 | - | $1474m | $2238m | $2238m | $1856m | $764m | Option premium income | Other | - | - | - | - | ||||||||||||||||||
| Mine development | (173) | 35 | - | $2238m | $2065m | $2065m | $2151m | ($173m) | Other income | Other | 35365 | - | 17348 | 18017 | ||||||||||||||||||
| Exploration | (110) | 45 | - | $2065m | $1955m | $1955m | $2010m | ($110m) | Payments to suppliers and employees - DNO | Operations | (26398673) | (11800291) | (4827485) | (9770897) | ||||||||||||||||||
| Other capex | (103) | 55 | - | $1955m | $1852m | $1852m | $1903m | ($103m) | Payments to suppliers and employees - DSO | Operations | (56426609) | (26236285) | (19169984) | (11020341) | ||||||||||||||||||
| Income tax | (184) | 65 | - | $1852m | $1669m | $1669m | $1760m | ($184m) | Payments to suppliers and employees - CORP | Other | (3288103) | (1764275) | (604615) | (919213) | ||||||||||||||||||
| Other | (27) | 75 | - | $1669m | $1641m | $1641m | $1655m | ($27m) | Interest received | Other | 583081 | 204671 | 183686 | 194724 | ||||||||||||||||||
| Q2 FY19 | $1641m | Income tax paid | Income tax | (18355847) | (1525368) | (13797636) | (3032843) | |||||||||||||||||||||||||
| Interest paid | Other | (35635) | (1683) | (1498) | (32454) | |||||||||||||||||||||||||||
| Net cash flows from(used in) operations | 93679358 | 28749070 | 11817426 | 53112862 | ||||||||||||||||||||||||||||
| CASH FLOWS FROM INVESTING ACTIVITIES | ||||||||||||||||||||||||||||||||
| Payments for plant amp equipment | Other capex | (10075371) | (3903432) | (3019743) | (3152196) | |||||||||||||||||||||||||||
| Payments for exploration amp evaluation - WA | Exploration | (8306306) | (3558754) | (2346579) | (2400973) | |||||||||||||||||||||||||||
| Payments for exploration amp evaluation - NSW | Exploration | (2718365) | (982413) | (718445) | (1017507) | |||||||||||||||||||||||||||
| Payments for development - TWL BNG DGB | Mine development | (7534270) | (6416098) | (77128) | (1041044) | |||||||||||||||||||||||||||
| Payments for mine properties - DNO | Mine development | 910105 | 596531 | (25819) | 339393 | |||||||||||||||||||||||||||
| Payments for mine properties - DSO | Mine development | (10664238) | (1389637) | (5788769) | (3485832) | |||||||||||||||||||||||||||
| Payments for term deposits | Other | (442) | - | (442) | - | |||||||||||||||||||||||||||
| Proceeds on disposal of term deposits | Other | - | - | - | - | |||||||||||||||||||||||||||
| Payments for WALs | Other capex | - | - | - | - | |||||||||||||||||||||||||||
| Acquisition of exploration assets (net of cash) | Exploration | - | - | - | - | |||||||||||||||||||||||||||
| Proceeds on disposal of PampE | Other capex | 28073 | - | 5 | 28068 | |||||||||||||||||||||||||||
| Net cash flows used in investing activities | (38360814) | (15653802) | (11976921) | (10730091) | ||||||||||||||||||||||||||||
| CASH FLOWS FROM FINANCING ACTIVITIES | ||||||||||||||||||||||||||||||||
| Proceeds from equity raisings | - | - | - | - | ||||||||||||||||||||||||||||
| Proceeds from exercise of options | 119000 | 21000 | 70000 | 28000 | ||||||||||||||||||||||||||||
| Share issue costs | (15072) | (5652) | (5652) | (3768) | ||||||||||||||||||||||||||||
| Dividend paid | Dividends | - | - | - | - | |||||||||||||||||||||||||||
| Repayment of finance lease | Other capex | (209427) | (69624) | (69809) | (69994) | |||||||||||||||||||||||||||
| Repayment of borrowings | - | - | - | - | ||||||||||||||||||||||||||||
| Net cash flows from financing activities | (105499) | (54276) | (5461) | (45762) | ||||||||||||||||||||||||||||
| Net increase(decrease) in cash amp equivalents | 55213045 | 13040992 | (164956) | 42337009 | ||||||||||||||||||||||||||||
| Cash amp bullion at the start of the period | 147413092 | 147413092 | 144466157 | 147835566 | ||||||||||||||||||||||||||||
| Effects of exchange rate movements on cash | Operations | - | ||||||||||||||||||||||||||||||
| Movement in gold on hand | Operations | (38375614) | - | (15987926) | 3534365 | (25922053) | ||||||||||||||||||||||||||
| Cash amp bullion at the end of the period | 164250522 | 144466157 | 147835566 | 164250522 | ||||||||||||||||||||||||||||
| Cost | Sales | |||||||||||||||||||||||||||||||
| At 31-Dec | Oz | $oz | $ | $oz | $ | |||||||||||||||||||||||||||
| MLW | - | - | ||||||||||||||||||||||||||||||
| GDW | - | - | ||||||||||||||||||||||||||||||
| RMT | - | - | ||||||||||||||||||||||||||||||
| - | - | - | ||||||||||||||||||||||||||||||
| Values | Line X | Ends | Before | After | Line Y | Label Y | Y Label | CASH FLOWS FROM OPERATIONS | Category | Manual Adj | Jul-19 | Aug-19 | Sep-19 | |||||||||||||||||||
| Q4 FY19 | 2052 | 15 | $2052m | 2052 | Receipts from gold sales | Operations | 159881239 | 48733973 | 57888259 | 53259007 | ||||||||||||||||||||||
| Operations | 825 | 25 | - | $2052m | $2877m | $2877m | $2464m | $825m | Option premium income | Other | - | - | - | - | ||||||||||||||||||
| Dividends | (407) | 35 | - | $2877m | $2470m | $2470m | $2674m | ($407m) | Other income | Other | 49094 | 15362 | 16350 | 17382 | ||||||||||||||||||
| Capitalised Mining | (306) | 45 | - | $2470m | $2164m | $2164m | $2317m | ($306m) | Payments to suppliers and employees - DNO | Operations | (29966833) | (18867571) | (5421615) | (5677647) | ||||||||||||||||||
| Exploration | (101) | 55 | - | $2164m | $2063m | $2063m | $2114m | ($101m) | Payments to suppliers and employees - DSO | Operations | (81824490) | (49555333) | (18307389) | (13961768) | ||||||||||||||||||
| DKM Acquisition | (200) | 65 | - | $2063m | $1863m | $1863m | $1963m | ($200m) | Payments to suppliers and employees - CORP | Other | (6151175) | (2387178) | (2286742) | (1477255) | ||||||||||||||||||
| Other capex | (202) | 75 | - | $1863m | $1661m | $1661m | $1762m | ($202m) | Interest received | Other | 454852 | 171509 | 149152 | 134191 | ||||||||||||||||||
| Income tax | (133) | 85 | - | $1661m | $1528m | $1528m | $1594m | ($133m) | Income tax paid | Income tax | (13260068) | (6214961) | (2525166) | (4519941) | ||||||||||||||||||
| Other | (54) | 95 | - | $1528m | $1474m | $1474m | $1501m | ($54m) | Interest paid | Other | (19267) | (6681) | (6391) | (6195) | ||||||||||||||||||
| Q1 FY20 | $1474m | GIC Inventory Mvmt | GIC Mvmt | - | ||||||||||||||||||||||||||||
| Net cash flows from(used in) operations | 29163353 | (28110879) | 29506458 | 27767774 | ||||||||||||||||||||||||||||
| CASH FLOWS FROM INVESTING ACTIVITIES | ||||||||||||||||||||||||||||||||
| Payments for plant amp equipment | Other capex | (19997124) | (10746245) | (4214487) | (5036392) | |||||||||||||||||||||||||||
| Payments for exploration amp evaluation - WA | Exploration | (6737885) | (1447005) | (2144467) | (3146413) | |||||||||||||||||||||||||||
| Payments for exploration amp evaluation - NSW | Exploration | (3411817) | (889004) | (1537672) | (985141) | |||||||||||||||||||||||||||
| Payments for development | Capitalised Mining | (14273272) | (3407474) | (5400036) | (5465762) | |||||||||||||||||||||||||||
| Payments for mine properties - DNO | Capitalised Mining | (402980) | 844308 | (139170) | (1108118) | |||||||||||||||||||||||||||
| Payments for mine properties - DSO | Capitalised Mining | (15903074) | (8245160) | (6860356) | (797558) | |||||||||||||||||||||||||||
| Payments for termsecurity deposits | Other | (363) | - | (363) | - | |||||||||||||||||||||||||||
| Proceeds on disposal of term deposits | Other | - | - | - | - | |||||||||||||||||||||||||||
| Payments for WALs | Other capex | - | - | - | - | |||||||||||||||||||||||||||
| Acquisition of exploration assets (net of cash) | DKM Acquisition | (20000000) | - | (20000000) | - | |||||||||||||||||||||||||||
| Proceeds on disposal of PampE | Other capex | - | - | - | - | |||||||||||||||||||||||||||
| Net cash flows used in investing activities | (80726516) | (23890581) | (40296551) | (16539384) | ||||||||||||||||||||||||||||
| CASH FLOWS FROM FINANCING ACTIVITIES | ||||||||||||||||||||||||||||||||
| Proceeds from equity raisings | - | - | - | - | ||||||||||||||||||||||||||||
| Proceeds from exercise of options | Other | 279000 | 84000 | 195000 | - | |||||||||||||||||||||||||||
| Share issue costs | Other | (14386) | (10020) | (4366) | - | |||||||||||||||||||||||||||
| Dividends paid | Dividends | (40654437) | - | - | (40654437) | |||||||||||||||||||||||||||
| Repayment of finance lease | Other capex | (222262) | (97597) | (62234) | (62431) | |||||||||||||||||||||||||||
| Repayment of borrowings | - | - | - | - | ||||||||||||||||||||||||||||
| Net cash flows from financing activities | (40612085) | (23617) | 128400 | (40716868) | ||||||||||||||||||||||||||||
| Net increase(decrease) in cash amp equivalents | (92175248) | (52025077) | (10661693) | (29488478) | ||||||||||||||||||||||||||||
| Cash amp bullion at the start of the period | 205165482 | Elisha Civil Elisha CivilDifference between bullion for quarterly vs accounts Adjusted agaisnt mvmt in gold on hand | 205165482 | 176583719 | 165686211 | |||||||||||||||||||||||||||
| Effects of exchange rate movements on cash | Operations | - | ||||||||||||||||||||||||||||||
| Movement in gold on hand | Operations | 34422858 | - | 23443314 | (235815) | 11215359 | ||||||||||||||||||||||||||
| Cash amp bullion at the end of the period | 147413092 | 176583719 | 165686211 | 147413092 | ||||||||||||||||||||||||||||
| GOH Cost for Accounts revalued to Selling Price for Quarterly | Cost | Sales | ||||||||||||||||||||||||||||||
| At 30-Jun | Oz | $oz | $ | $oz | $ | |||||||||||||||||||||||||||
| MLW | 2331195 | 1244 | 2901126 | 1990 | 4639684 | |||||||||||||||||||||||||||
| GDW | 3775510 | 1135 | 4286261 | 1990 | 7514247 | |||||||||||||||||||||||||||
| RMT | 1779190 | 1202 | 2137768 | 1990 | 3541051 | |||||||||||||||||||||||||||
| 7885895 | 9325154 | 15694981 | ||||||||||||||||||||||||||||||
| Cash amp GOH | Jun-20 | Mar-20 | Dec-19 | Sep-19 | Jun-19 | Mar-19 | Dec-18 | Sep-18 | Jun-18 | $m | Q4FY20 | Q3FY20 | Q2FY20 | Q1FY20 | Q4FY19 | Q3FY19 | Q2FY19 | Q1FY19 | Q4FY18 | |||||||||||||||||||||
| $000s | $000s | $000s | $000s | $000s | $000s | $000s | $000s | $000s | Cash | 1924 | 1172 | 1590 | 965 | 1887 | 1407 | 1871 | 1319 | 1811 | ||||||||||||||||||||||
| Cash | 192403 | 117162 | 158962 | 96512 | 188687 | 140737 | 187076 | 131862 | 181108 | Gold | - | 310 | 98 | 509 | 166 | 458 | 198 | 581 | 277 | |||||||||||||||||||||
| Total | 1924 | 1481 | 1688 | 1474 | 2052 | 1865 | 2068 | 1900 | 2088 | |||||||||||||||||||||||||||||||
| GOH (Mint) | 17119 | - | 11495 | 864 | 23842 | 2376 | 33426 | 21159 | Adjustments | |||||||||||||||||||||||||||||||
| GOH (site) | 13840 | 9838 | 39397 | 15695 | 21957 | 17389 | 24702 | 6525 | Debt repay | - | 00 | |||||||||||||||||||||||||||||
| Total GOH | - | 30959 | 9838 | 50891 | 16559 | 45798 | 19764 | 58128 | 27685 | CMM purchase(sale) | - | (43) | ||||||||||||||||||||||||||||
| GOH (oz) | 11933 | 4431 | 23815 | 8321 | 25233 | 10625 | 34331 | 16285 | Land amp WAL purchase | 117 | ||||||||||||||||||||||||||||||
| Avg $oz | 2594 | 2220 | 2137 | 1990 | 1815 | 1860 | 1693 | 1700 | Tax | 98 | 90 | |||||||||||||||||||||||||||||
| Total Cash amp Gold | 192403 | 148121 | 168800 | 147403 | 205246 | 186535 | 206841 | 189990 | 208793 | Divs | 407 | 407 | 403 | - | ||||||||||||||||||||||||||
| Adjusted cash | 1924 | 1888 | 1688 | 1881 | 2052 | 1865 | 2068 | 2517 | 2135 | |||||||||||||||||||||||||||||||
| Gold on hand that is in the metals account amp still on site at month end has been measured at expected selling price in the above table At June year-end and December half-year end these ounces are measured at cost and included in inventory for financial reporting purposes | Cash build | 443 | 200 | 214 | (172) | 187 | (203) | 169 | 382 | |||||||||||||||||||||||||||||||
| Gold sold (oz) | 69922 | 111106 | 71702 | 106628 | 76817 | 114966 | 71310 | 88551 | ||||||||||||||||||||||||||||||||
| CURRENT MONTH END WORKINGS | Avg price ($oz) | 2297 | 2104 | 2000 | 1832 | 1838 | 1718 | 1660 | 1678 | |||||||||||||||||||||||||||||||
| Cash Yana Goncharova Yana Goncharovabank recs | Jun-20 | Sales ($m) | 1606 | 2337 | 1434 | 1953 | 1412 | 1976 | 1184 | 1486 | ||||||||||||||||||||||||||||||
| ANZCH | 83196 | uuml | ||||||||||||||||||||||||||||||||||||||
| MBLBG + CBABG | 460536 | uuml | ||||||||||||||||||||||||||||||||||||||
| MBLBG x2 | 42900 | uuml | ||||||||||||||||||||||||||||||||||||||
| MBLCHQ | 17035 | uuml | ||||||||||||||||||||||||||||||||||||||
| CBA CALL | 65311911 | uuml | ||||||||||||||||||||||||||||||||||||||
| MBLPR | 125283665 | uuml | ||||||||||||||||||||||||||||||||||||||
| CBACHQ | 397837 | uuml | ||||||||||||||||||||||||||||||||||||||
| CBALFB | 119698 | uuml | ||||||||||||||||||||||||||||||||||||||
| CBASA | 306497 | uuml | ||||||||||||||||||||||||||||||||||||||
| CBASI | 379878 | uuml | ||||||||||||||||||||||||||||||||||||||
| TOTAL | 192403154 | |||||||||||||||||||||||||||||||||||||||
| Gold on Site | Oz | $oz | $ | |||||||||||||||||||||||||||||||||||||
| Estimate - MLW | 35879 | 257628 | 924335 | (on site) | ||||||||||||||||||||||||||||||||||||
| Estimate - GDW | 2789448 | 257628 | 7186395 | (on site) | ||||||||||||||||||||||||||||||||||||
| Estimate - RMT | 2198695 | 260559 | 5728891 | |||||||||||||||||||||||||||||||||||||
| Total | 5346930 | 258833 | 13839622 | (Estimated selling price) | ||||||||||||||||||||||||||||||||||||
| At Mint | Oz | $oz | $ | |||||||||||||||||||||||||||||||||||||
| In metal account | 3544726 | 260559 | 9236092 | Bars 3256 to 3265 | ||||||||||||||||||||||||||||||||||||
| MLW | 573959 Yana Goncharova Yana Goncharovafrom D1-D3 | Yana Goncharova Yana Goncharovabank recs | 257628 | 1478678 | Bars 1776 to 1779 | |||||||||||||||||||||||||||||||||||
| GDW | 852378 | 257628 | 2195963 | Bars 3266 to 3275 | ||||||||||||||||||||||||||||||||||||
| RMT | 1615113 | 260559 | 4208318 | Bars 3266 to 3275 | ||||||||||||||||||||||||||||||||||||
| - | ||||||||||||||||||||||||||||||||||||||||
| - | ||||||||||||||||||||||||||||||||||||||||
| 6586176 | 259924 | 17119051 | (Estimated selling price) | |||||||||||||||||||||||||||||||||||||
| Total GOH | 11933106 | 259435 | 30958673 | |||||||||||||||||||||||||||||||||||||
| FY20 | FY19 | ||||||
| Ore mined | Mbcm | 43 | |||||
| Waste mined | Mbcm | 281 | |||||
| Strip ratio | wo | 66 | |||||
| Ore mined | Mt | 101 | |||||
| Ore milled | Mt | 94 | |||||
| Head grade | gt | 127 | |||||
| Recovery | 94 | ||||||
| Gold produced | 000 ozs | 363 | |||||
| Cash cost | A$oz | 819 | |||||
| Cash cost inc royalties | A$oz | 897 | |||||
| All-in Sustaining Cost | A$oz | 1029 | |||||
| Physicals | Unit | Year Ended 30 June 2019 | |||||
| Ounces Produced | oz | 363418 | |||||
| Ounces sold | oz | 369721 | |||||
| Bullion on Hand | oz | - 0 | |||||
| Average Realised Price | $oz | 1765 | |||||
| Sales Revenue | $m | 6525 | |||||
| Interest Income | $m | 23 | |||||
| Cost of Sales | $m | (4020) | |||||
| Gross Profit | $m | 2528 | |||||
| Other Income | $m | 44 | |||||
| Administration and Other Costs | $m | (157) | |||||
| Finance Costs | $m | (14) | |||||
| Impairment of Non Current Assets | $m | (67) | |||||
| Profit Before Tax | $m | 2335 | |||||
| Income Tax Expense | $m | (703) | |||||
| Net Profit After Tax | $m | 1631 |
| Values | Line X | Ends | Before | After | Line Y | Label Y | Y Label | CASH FLOWS FROM OPERATIONS | Category | Manual Adj | ||||||||||||||||||
| Jun-18 | 2088 | 15 | $2088m | 2088 | Receipts from gold sales | Operations | 652450151 | 652450151 | ||||||||||||||||||||
| Operations | 3287 | 25 | - | $2088m | $5375m | $5375m | $3732m | $3287m | Option premium income | Other | 1366000 | 1366000 | ||||||||||||||||
| Dividends | (812) | 35 | - | $5375m | $4563m | $4563m | $4969m | ($812m) | Other income | Other | - | - | ||||||||||||||||
| Mine development | (961) | 45 | - | $4563m | $3602m | $3602m | $4082m | ($961m) | Payments to suppliers and employees - DNO | Operations | (84224766) | (84224766) | ||||||||||||||||
| Exploration | (348) | 55 | - | $3602m | $3253m | $3253m | $3428m | ($348m) | Payments to suppliers and employees - DSO | Operations | (228404216) | (228404216) | ||||||||||||||||
| Other capex | (574) | 65 | - | $3253m | $2679m | $2679m | $2966m | ($574m) | Payments to suppliers and employees - CORP | Other | (14051447) | (14051447) | ||||||||||||||||
| Income tax | (540) | 75 | - | $2679m | $2139m | $2139m | $2409m | ($540m) | Interest received | Other | 2388192 | 2388192 | ||||||||||||||||
| Other | (87) | 85 | - | $2139m | $2053m | $2053m | $2096m | ($87m) | Income tax paid | Income tax | (53971000) | (53971000) | ||||||||||||||||
| Jun-19 | $2053m | Interest paid | Other | (85486) | (85486) | |||||||||||||||||||||||
| Proceeds from rental income | Other | 16500 | 16500 | |||||||||||||||||||||||||
| Net cash flows from(used in) operations | 275483928 | 275483928 | ||||||||||||||||||||||||||
| CASH FLOWS FROM INVESTING ACTIVITIES | ||||||||||||||||||||||||||||
| Payments for plant amp equipment | Other capex | (56425779) | (56425779) | |||||||||||||||||||||||||
| Payments for exploration amp evaluation - WA | Exploration | (24685627) | (24685627) | |||||||||||||||||||||||||
| Payments for exploration amp evaluation - NSW | Exploration | (10152682) | (10152682) | |||||||||||||||||||||||||
| Payments for development - TWL BNY DOG RMT | Mine development | (35632149) | (35632149) | |||||||||||||||||||||||||
| Payments for mine properties - DNO | Mine development | (4690352) | (4690352) | |||||||||||||||||||||||||
| Payments for mine properties - DSO | Mine development | (55809551) | (55809551) | |||||||||||||||||||||||||
| Payments for term deposits | Other | 77000 | 77000 | |||||||||||||||||||||||||
| Proceeds on disposal of term deposits | Other | (1708) | (1708) | |||||||||||||||||||||||||
| Payments for AFS investments | Other capex | - | ||||||||||||||||||||||||||
| Acquisition of exploration assets (net of cash) | Exploration | - | ||||||||||||||||||||||||||
| Proceeds on disposal of PampE | Other capex | 31346 | 31346 | |||||||||||||||||||||||||
| Net cash flows used in investing activities | (187289502) | (187289502) | ||||||||||||||||||||||||||
| CASH FLOWS FROM FINANCING ACTIVITIES | ||||||||||||||||||||||||||||
| Proceeds from equity raisings | - | |||||||||||||||||||||||||||
| Proceeds from exercise of options | Other | 1697500 | 1697500 | |||||||||||||||||||||||||
| Share issue costs | Other | (65127) | (65127) | |||||||||||||||||||||||||
| Dividends paid | Dividends | (81196194) | (81196194) | |||||||||||||||||||||||||
| Repayment of finance lease | Other capex | (1051633) | (1051633) | |||||||||||||||||||||||||
| Repayment of borrowings | - | |||||||||||||||||||||||||||
| Net cash flows from financing activities | (80615454) | (80615454) | ||||||||||||||||||||||||||
| Net increase(decrease) in cash amp equivalents | 7578972 | |||||||||||||||||||||||||||
| Cash amp bullion at the start of the period | 208802950 | |||||||||||||||||||||||||||
| Effects of exchange rate movements on cash | Operations | |||||||||||||||||||||||||||
| Movement in gold on hand | Operations | (11125871) | ||||||||||||||||||||||||||
| Cash amp bullion at the end of the period | 205256052 | |||||||||||||||||||||||||||
| 2014 | 2015 | 2016 | 2017 | 2018 | 2019 | ||||||||||
| Revenue | 372 | 465 | 502 | 544 | 606 | 652 | 1 | ||||||||
| NPAT | -148 | 87 | 112 | 138 | 174 | 163 | 2 | ||||||||
| Net Assets | 3210 | 4100 | 4820 | 5390 | 6370 | 7164 | 3 | ||||||||
| EPS | -2968 | 1739 | 2237 | 2759 | 346 | 3218 | 4 | ||||||||
| 5 | |||||||||||||||
| 6 | |||||||||||||||
| 7 | |||||||||||||||
| 8 | |||||||||||||||
| 9 | |||||||||||||||
| 10 | |||||||||||||||
| 11 | |||||||||||||||
| 12 | |||||||||||||||
| 13 | |||||||||||||||
| 1 | |||||||||||||||
| 2 | |||||||||||||||
| 3 | |||||||||||||||
| 4 | |||||||||||||||
| 5 | |||||||||||||||
| 6 | |||||||||||||||
| 7 | |||||||||||||||
| 8 | |||||||||||||||
| 9 | |||||||||||||||
| 10 | |||||||||||||||
| 11 | |||||||||||||||
| 12 | |||||||||||||||
| 13 |
| Values | Line X | Ends | Before | After | Line Y | Label Y | Y Label | ||||||||||
| 31 March 2018 | 805 | 15 | 805 | 805 | |||||||||||||
| Depletion | (040) | 25 | - | 805 | 766 | 766 | 786 | (040) | |||||||||
| Model Update | (003) | 35 | - | 766 | 763 | 763 | 764 | (003) | |||||||||
| New Deposits | 023 | 45 | - | 763 | 786 | 786 | 774 | 023 | |||||||||
| 31 March 2019 | 786 | ||||||||||||||||
| Values | Line X | Ends | Before | After | Line Y | Label Y | Y Label | ||||||||||
| 31 March 2017 | 218 | 15 | 218 | 218 | |||||||||||||
| Depletion | (040) | 25 | - | 218 | 179 | 179 | 198 | (040) | |||||||||
| Model Update | 024 | 35 | - | 179 | 203 | 203 | 191 | 024 | |||||||||
| New Deposits | 203 | 45 | - | 203 | 406 | 406 | 305 | 203 | |||||||||
| 31 March 2018 | 406 | ||||||||||||||||
| 212540855741674 |
| 1 | 2 | 3 | 4 | 5 | 6 | 7 | 8 | 9 | 10 | ||||||||||||
| Ounces Recovered | 142688 | 181016 | 179298 | 192720 | 177647 | 209062 | 210877 | 224493 | 210461 | 210461 | |||||||||||
| Milled Grade (gt) | 090 | 095 | 094 | 101 | 093 | 109 | 110 | 117 | 146 | 146 |
| Values | Line X | Ends | Before | After | Line Y | Label Y | Y Label | ||||||||||
| 2009 Reserve | 06Moz | 15 | 06Moz | 06Moz | |||||||||||||
| Mining Depletion | (19Moz) | 25 | - | 06Moz | (12Moz) | (12Moz) | (03Moz) | (19Moz) | |||||||||
| Discovery | 34Moz | 35 | - | (12Moz) | 22Moz | 22Moz | 05Moz | 34Moz | |||||||||
| Current Reserves | 22Moz | ||||||||||||||||
| Dividend | |||||||||||||||||
| 2015 | 2016 | 2017 | 2018 | 2019 | 2020 | ||||||||||||
| Interim | 0 | 4 | 7 | 8 | 8 | 8 | |||||||||||
| Final | 6 | 9 | 8 | 8 | 8 | 8 | |||||||||||
| Dividends Paid | 2013 | 2014 | 2015 | 2016 | 2017 | 2018 | 2019 | 2020 | |||||||||
| 75 | 75 | 105 | 170 | 245 | 326 | 407 | 488 |
| 2015 | 2016 | 2017 | 2018 | 2019 | 2020 | |||||||||||||||||||||
| Revenue | 465 | 502 | 544 | 606 | 654 | 757 | 1 | |||||||||||||||||||
| NPAT | 87 | 112 | 138 | 174 | 163 | 200 | 2 | |||||||||||||||||||
| EBITDA | 181 | 234 | 253 | 313 | 307 | 394 Jon Latto Jon LattoNumber from stats Diff to calc below | 3 | |||||||||||||||||||
| EBITDA Margin () | 389 | 466 | 465 | 517 | 469 | 521 | 4 | |||||||||||||||||||
| EPS | 174 | 224 | 276 | 346 | 322 | 393 | 5 | |||||||||||||||||||
| Dividend per share | 60 | 130 | 150 | 160 | 160 | 160 | 6 | |||||||||||||||||||
| 7 | ||||||||||||||||||||||||||
| Dividend of Revenue | 134 | 124 | 107 | 8 | ||||||||||||||||||||||
| Dividend of EBITDA | 259 | 264 | 206 | 9 | ||||||||||||||||||||||
| 10 | ||||||||||||||||||||||||||
| 11 | ||||||||||||||||||||||||||
| 12 | ||||||||||||||||||||||||||
| 13 | ||||||||||||||||||||||||||
| 1 | ||||||||||||||||||||||||||
| 2 | ||||||||||||||||||||||||||
| 3 | ||||||||||||||||||||||||||
| 4 | ||||||||||||||||||||||||||
| 5 | ||||||||||||||||||||||||||
| 6 | ||||||||||||||||||||||||||
| 7 | ||||||||||||||||||||||||||
| 8 | ||||||||||||||||||||||||||
| 9 | ||||||||||||||||||||||||||
| 10 | ||||||||||||||||||||||||||
| 11 | ||||||||||||||||||||||||||
| 12 | ||||||||||||||||||||||||||
| 13 | ||||||||||||||||||||||||||
| Dividends Paid | ||||||||||||||||||||||||||
| FY13 | FY14 | FY15 | FY16 | FY17 | FY18 | FY19 | FY20 | |||||||||||||||||||
| 75 | 0 | 30 | 65 | 75 | 81 | 81 | 81 Jon Latto Jon LattoBased on shares on issue from Appendix 3B immediately prior to interim dividend payment and Appendix 2A immediately prior to full year dividend payment | |||||||||||||||||||
| Calculation of EBITDA for FY20 | ||||||||||||||||||||||||||
| Profit before tax | 284660 Jon Latto Jon LattoExtracted from FY20 Financial Report PampL | |||||||||||||||||||||||||
| Add Back | ||||||||||||||||||||||||||
| Interest expense | 1105 Jon Latto Jon LattoExtracted from Note 18 to FY20 Financial Report | |||||||||||||||||||||||||
| Depreciation | 50626 Jon Latto Jon LattoExtracted from Note 3 to FY20 Financial Report | |||||||||||||||||||||||||
| Amortisation | 57280 Jon Latto Jon LattoExtracted from Note 3 to FY20 Financial Report | |||||||||||||||||||||||||
| Less | ||||||||||||||||||||||||||
| Interest Income | 866 Jon Latto Jon LattoExtracted from Note 2 to FY20 Financial Report | |||||||||||||||||||||||||
Jon Latto Jon LattoBased on shares on issue from Appendix 3B immediately prior to interim dividend payment and Appendix 2A immediately prior to full year dividend payment | Jon Latto Jon LattoNumber from stats Diff to calc below | Jon Latto Jon LattoExtracted from FY20 Financial Report PampL | Jon Latto Jon LattoExtracted from Note 18 to FY20 Financial Report | Jon Latto Jon LattoExtracted from Note 3 to FY20 Financial Report | EBITDA | 392805 |
| FY20 | FY19 | ||||||
| Ore mined | Mbcm | 43 | |||||
| Waste mined | Mbcm | 281 | |||||
| Strip ratio | wo | 66 | |||||
| Ore mined | Mt | 101 | |||||
| Ore milled | Mt | 94 | |||||
| Head grade | gt | 127 | |||||
| Recovery | 94 | ||||||
| Gold produced | 000 ozs | 363 | |||||
| Cash cost | A$oz | 819 | |||||
| Cash cost inc royalties | A$oz | 897 | |||||
| All-in Sustaining Cost | A$oz | 1029 | |||||
| Physicals | Unit | Year Ended 30 June 2019 | |||||
| Ounces Produced | oz | 363418 | |||||
| Ounces sold | oz | 369721 | |||||
| Bullion on Hand | oz | - 0 | |||||
| Average Realised Price | $oz | 1765 | |||||
| Sales Revenue | $m | 6525 | |||||
| Interest Income | $m | 23 | |||||
| Cost of Sales | $m | (4020) | |||||
| Gross Profit | $m | 2528 | |||||
| Other Income | $m | 44 | |||||
| Administration and Other Costs | $m | (157) | |||||
| Finance Costs | $m | (14) | |||||
| Impairment of Non Current Assets | $m | (67) | |||||
| Profit Before Tax | $m | 2335 | |||||
| Income Tax Expense | $m | (703) | |||||
| Net Profit After Tax | $m | 1631 |
| Values | Line X | Ends | Before | After | Line Y | Label Y | Y Label | Continuing operations | Category | Movement | FY20 | FY19 | |||||||||||||||||
| June 2019 | 163 | 2 | $163m | 163 | Sale of goods | Gross Profit - Duketon Ops | 103341000 | 755791000 | 652450000 | ||||||||||||||||||||
| Gross Profit - Duketon Ops | 96 | 3 | - | $163m | $259m | $259m | $211m | $96m | Interest reveue | Other | (1491000) | 866000 | 2357000 | ||||||||||||||||
| Exploration | 5 | 4 | - | $259m | $265m | $265m | $262m | $5m | Revenue | 101850000 | 756657000 | 654807000 | |||||||||||||||||
| Royalties | (9) | 5 | - | $265m | $256m | $256m | $260m | ($9m) | 0 | ||||||||||||||||||||
| DampA | (34) | 6 | - | $256m | $221m | $221m | $239m | ($34m) | Cost of goods sold (net of royalties amp DampA) | Gross Profit - Duketon Ops | (7027000) | (306327000) | (299300000) | ||||||||||||||||
| Finance | (1) | 7 | - | $221m | $221m | $221m | $221m | ($1m) | 0 | ||||||||||||||||||||
| Income Tax Expense | (15) | 8 | - | $221m | $206m | $206m | $214m | ($15m) | Gross profit | 51809000 | 304646000 | 252837000 | |||||||||||||||||
| Other | (7) | 9 | - | $206m | $200m | $200m | $203m | ($7m) | 0 | ||||||||||||||||||||
| June 2020 | $200m | Other income | Other | (4529000) | (150000) | 4379000 | |||||||||||||||||||||||
| 0 | |||||||||||||||||||||||||||||
| Investor and corporate costs | Other | (887000) | (3408000) | (2521000) | |||||||||||||||||||||||||
| Personnel costs | Other | (702000) | (10062000) | (9360000) | |||||||||||||||||||||||||
| Share-based payment expense | Other | 938000 | (144000) | (1082000) | |||||||||||||||||||||||||
| Occupancy costs | Other | 760000 | (245000) | (1005000) | |||||||||||||||||||||||||
| Other corporate administrative expenses | Other | (393000) | (1052000) | (659000) | |||||||||||||||||||||||||
| Exploration expenditure written off | Exploration | 5043000 | (1686000) | (6729000) | |||||||||||||||||||||||||
| Other expenses | Other | (275000) | (1215000) | (940000) | |||||||||||||||||||||||||
| Finance costs | Finance | (577000) | (2024000) | (1447000) | |||||||||||||||||||||||||
| Royalties | Royalties | (8914000) | (37361000) | (28447000) | |||||||||||||||||||||||||
| Depreciation amp Amortisation | DampA | (34100000) | (108323000) | (74223000) | |||||||||||||||||||||||||
| Profit from continuing operations before tax | 51187000 | 284660000 | 233473000 | ||||||||||||||||||||||||||
| Income tax expense | Income Tax Expense | (14820000) | (85143000) | (70323000) | |||||||||||||||||||||||||
| Net profit for the period | 36367000 | 199517000 | 163150000 | ||||||||||||||||||||||||||
| Notes | |||||||||||||||||||||||||||||
| Other income | |||||||||||||||||||||||||||||
| Option premium | (1366000) | - | 1366000 | ||||||||||||||||||||||||||
| Net gain(loss) on derivatives | - | - | - | ||||||||||||||||||||||||||
| Net gain(loss) on CF hedge | - | - | - | ||||||||||||||||||||||||||
| Movement in rehab provision | (3186000) | (210000) | 2976000 | ||||||||||||||||||||||||||
| Exploration rent refunds | 5000 | 25000 | 20000 | ||||||||||||||||||||||||||
| Other income | - | - | - | ||||||||||||||||||||||||||
| Rental income | 18000 | 35000 | 17000 | ||||||||||||||||||||||||||
| (4529000) | (150000) | 4379000 | |||||||||||||||||||||||||||
| Check | - | - | - | ||||||||||||||||||||||||||
| Cost of goods sold | |||||||||||||||||||||||||||||
| Cash costs of production | 7123000 | 306744000 | 299621000 | ||||||||||||||||||||||||||
| Royalties | 8914000 | 37361000 | 28447000 | ||||||||||||||||||||||||||
| Depreciation | 19612000 | 50626000 | 31014000 | ||||||||||||||||||||||||||
| Amortisation | 14392000 | 57280000 | 42888000 | ||||||||||||||||||||||||||
| 50041000 | 452011000 | 401970000 | |||||||||||||||||||||||||||
| Check | - | - | - | ||||||||||||||||||||||||||
| Other expenses | |||||||||||||||||||||||||||||
| Swap fees | - | - | - | ||||||||||||||||||||||||||
| Impairment of PPE | - | - | - | ||||||||||||||||||||||||||
| Loss on sale of assets | 75000 | 130000 | 55000 | ||||||||||||||||||||||||||
| Exploration license application fees | 200000 | 1085000 | 885000 | ||||||||||||||||||||||||||
| 275000 | 1215000 | 940000 | |||||||||||||||||||||||||||
| Check | - | - | - | ||||||||||||||||||||||||||
| Depreciation impairment amp amortisation | |||||||||||||||||||||||||||||
| Depreciation | 19788000 | 51331000 | 31543000 | ||||||||||||||||||||||||||
| Amortisation | 14391000 | 57280000 | 42889000 | ||||||||||||||||||||||||||
| Less Charged to exploration projects | (79000) | (288000) | (209000) | ||||||||||||||||||||||||||
| Depreciation amp amortisation in the SCI | 34100000 | 108323000 | 74223000 | ||||||||||||||||||||||||||
| - | |||||||||||||||||||||||||||||
| Lease payments | |||||||||||||||||||||||||||||
| Minimum lease payments - operating lease | (861000) | (95000) | 766000 | ||||||||||||||||||||||||||
| Less Amounts capitalised | 258000 | 28000 | (230000) | ||||||||||||||||||||||||||
| Recognised in the SCI | (603000) | (67000) | 536000 | ||||||||||||||||||||||||||
| Finance costs | |||||||||||||||||||||||||||||
| Interest expense | - | - | - | ||||||||||||||||||||||||||
| Other borrowing costs | 1020000 | 1105000 | 85000 | ||||||||||||||||||||||||||
| Unwinding of discount | (443000) | 919000 | 1362000 | ||||||||||||||||||||||||||
| 577000 | 2024000 | 1447000 | |||||||||||||||||||||||||||
| Check |
| Values | Line X | Ends | Before | After | Line Y | Label Y | Y Label | CASH FLOWS FROM OPERATIONS | Category | Statutory Adj | ||||||||||||||||||
| June 2019 | 205 | 2 | $205m | 205 | Receipts from gold sales | Operations | 755790612 | 755790612 | ||||||||||||||||||||
| Operations | 424 | 3 | - | $205m | $629m | $629m | $417m | $424m | Option premium income | Other | - | - | ||||||||||||||||
| Mine development | (135) | 4 | - | $629m | $494m | $494m | $562m | ($135m) | Other income | Other | 34894 | 34894 | ||||||||||||||||
| Exploration | (37) | 5 | - | $494m | $457m | $457m | $476m | ($37m) | Payments to suppliers and employees - DNO | Operations | (99376203) | (99376203) | ||||||||||||||||
| Other capex | (65) | 6 | - | $457m | $392m | $392m | $425m | ($65m) | Payments to suppliers and employees - DSO | Operations | (232858286) | (232858286) | ||||||||||||||||
| Other | (16) | 7 | - | $392m | $376m | $376m | $384m | ($16m) | Payments to suppliers and employees - CORP | Other | (16688243) | (16688243) | ||||||||||||||||
| Cash and Bullion before Income Tax Acquisitions amp Dividends | 8 | $376m | $376m | Interest received | Other | 1007324 | 1007324 | |||||||||||||||||||||
| Income tax | (64) | 9 | - | $376m | $312m | $312m | $344m | ($64m) | GIC Inventory Mvmt | GIC Mvmt | - | - | ||||||||||||||||
| DKM Acquisition | (21) | 10 | - | $312m | $291m | $291m | $301m | ($21m) | Income tax paid | Income tax | (63792406) | (63792406) | ||||||||||||||||
| Dividends | (81) | 11 | - | $291m | $209m | $209m | $250m | ($81m) | Interest paid | Other | (1104724) | (1104724) | ||||||||||||||||
| June 2020 | $209m | GIC Inventory Mvmt | GIC Mvmt | - | - | |||||||||||||||||||||||
| Net cash flows from(used in) operations | 343012969 | 343012969 | ||||||||||||||||||||||||||
| CASH FLOWS FROM INVESTING ACTIVITIES | ||||||||||||||||||||||||||||
| Payments for plant amp equipment | Other capex | (51134992) | (51134992) | |||||||||||||||||||||||||
| Payments for exploration amp evaluation - WA | Exploration | (27398818) | (27398818) | |||||||||||||||||||||||||
| Payments for exploration amp evaluation - NSW | Exploration | (9718696) | (9718696) | |||||||||||||||||||||||||
| Payments for development | Mine development | (57306547) | (57306547) | |||||||||||||||||||||||||
| Payments for mine properties - DNO | Mine development | (3078067) | (3078067) | |||||||||||||||||||||||||
| Payments for mine properties - DSO | Mine development | (74445922) | (74445922) | |||||||||||||||||||||||||
| Payments for termsecurity deposits | Other | (1221) | (1221) | |||||||||||||||||||||||||
| Proceeds on disposal of term deposits | Other | - | ||||||||||||||||||||||||||
| Payments for WALs | Other capex | - | ||||||||||||||||||||||||||
| Acquisition of exploration assets (net of cash) | DKM Acquisition | (21281415) | (21281415) | |||||||||||||||||||||||||
| Proceeds on disposal of PampE | Other capex | 21277 | 21277 | |||||||||||||||||||||||||
| Net cash flows used in investing activities | (244344402) | (244344402) | ||||||||||||||||||||||||||
| CASH FLOWS FROM FINANCING ACTIVITIES | ||||||||||||||||||||||||||||
| Proceeds from equity raisings | - | - | ||||||||||||||||||||||||||
| Proceeds from exercise of options | Other | 279000 | 279000 | |||||||||||||||||||||||||
| Share issue costs | Other | (14386) | (14386) | |||||||||||||||||||||||||
| Dividends paid | Dividends | (81308874) | (81308874) | |||||||||||||||||||||||||
| Repayment of finance lease | Other capex | (13893955) | (13893955) | |||||||||||||||||||||||||
| Repayment of borrowings | Operations | - | - | |||||||||||||||||||||||||
| Net cash flows from financing activities | (94938215) | (94938215) | ||||||||||||||||||||||||||
| Net increase(decrease) in cash amp equivalents | 3730352 | 3730352 | ||||||||||||||||||||||||||
| Cash amp bullion at the start of the period | 205165482 | Elisha Civil Elisha CivilDifference between bullion for quarterly vs accounts Adjusted agaisnt mvmt in gold on hand | 205165482 | |||||||||||||||||||||||||
| Effects of exchange rate movements on cash | Operations | - | ||||||||||||||||||||||||||
| Movement in gold on hand | Operations | 400748 | - | 400748 | ||||||||||||||||||||||||
| Cash amp bullion at the end of the period | 209296582 | 209296582 | ||||||||||||||||||||||||||
| GOH Cost for Accounts revalued to Selling Price for Quarterly | Cost | |||||||||||||||||||||||||||
| At 30-Jun | Oz | $oz | $ | |||||||||||||||||||||||||
| MLW | - | |||||||||||||||||||||||||||
| GDW | - | |||||||||||||||||||||||||||
| RMT | - | |||||||||||||||||||||||||||
| - | - | |||||||||||||||||||||||||||
| 2014 | 2015 | 2016 | 2017 | 2018 | 2019 | ||||||||||
| Revenue | 372 | 465 | 502 | 544 | 606 | 652 | 1 | ||||||||
| NPAT | -148 | 87 | 112 | 138 | 174 | 163 | 2 | ||||||||
| Net Assets | 3210 | 4100 | 4820 | 5390 | 6370 | 7164 | 3 | ||||||||
| EPS | -2968 | 1739 | 2237 | 2759 | 346 | 3218 | 4 | ||||||||
| 5 | |||||||||||||||
| 6 | |||||||||||||||
| 7 | |||||||||||||||
| 8 | |||||||||||||||
| 9 | |||||||||||||||
| 10 | |||||||||||||||
| 11 | |||||||||||||||
| 12 | |||||||||||||||
| 13 | |||||||||||||||
| 1 | |||||||||||||||
| 2 | |||||||||||||||
| 3 | |||||||||||||||
| 4 | |||||||||||||||
| 5 | |||||||||||||||
| 6 | |||||||||||||||
| 7 | |||||||||||||||
| 8 | |||||||||||||||
| 9 | |||||||||||||||
| 10 | |||||||||||||||
| 11 | |||||||||||||||
| 12 | |||||||||||||||
| 13 |
| Values | Line X | Ends | Before | After | Line Y | Label Y | Y Label | ||||||||||
| 31 March 2018 | 805 | 15 | 805 | 805 | |||||||||||||
| Depletion | (040) | 25 | - | 805 | 766 | 766 | 786 | (040) | |||||||||
| Model Update | (003) | 35 | - | 766 | 763 | 763 | 764 | (003) | |||||||||
| New Deposits | 023 | 45 | - | 763 | 786 | 786 | 774 | 023 | |||||||||
| 31 March 2019 | 786 | ||||||||||||||||
| Values | Line X | Ends | Before | After | Line Y | Label Y | Y Label | ||||||||||
| 31 March 2017 | 218 | 15 | 218 | 218 | |||||||||||||
| Depletion | (040) | 25 | - | 218 | 179 | 179 | 198 | (040) | |||||||||
| Model Update | 024 | 35 | - | 179 | 203 | 203 | 191 | 024 | |||||||||
| New Deposits | 203 | 45 | - | 203 | 406 | 406 | 305 | 203 | |||||||||
| 31 March 2018 | 406 | ||||||||||||||||
| 212540855741674 |
| 1 | 2 | 3 | 4 | 5 | 6 | 7 | 8 | 9 | 10 | ||||||||||||
| Ounces Recovered | 142688 | 181016 | 179298 | 192720 | 177647 | 209062 | 210877 | 224493 | 210461 | 210461 | |||||||||||
| Milled Grade (gt) | 090 | 095 | 094 | 101 | 093 | 109 | 110 | 117 | 146 | 146 |
| Values | Line X | Ends | Before | After | Line Y | Label Y | Y Label | ||||||||||
| 2009 Reserve | 06Moz | 15 | 06Moz | 06Moz | |||||||||||||
| Mining Depletion | (19Moz) | 25 | - | 06Moz | (12Moz) | (12Moz) | (03Moz) | (19Moz) | |||||||||
| Discovery | 34Moz | 35 | - | (12Moz) | 22Moz | 22Moz | 05Moz | 34Moz | |||||||||
| Current Reserves | 22Moz | ||||||||||||||||
| Dividend | |||||||||||||||||
| 2015 | 2016 | 2017 | 2018 | 2019 | 2020 | ||||||||||||
| Interim | 0 | 4 | 7 | 8 | 8 | 8 | |||||||||||
| Final | 6 | 9 | 8 | 8 | 8 | 8 | |||||||||||
| Dividends Paid | 2013 | 2014 | 2015 | 2016 | 2017 | 2018 | 2019 | 2020 | |||||||||
| 75 | 75 | 105 | 170 | 245 | 326 | 407 | 488 |
| 2015 | 2016 | 2017 | 2018 | 2019 | 2020 | ||||||||||||||||||||||
| Revenue | 465 | 502 | 544 | 606 | 654 | 757 | 1 | ||||||||||||||||||||
| NPAT | 87 | 112 | 138 | 174 | 163 | 200 | 2 | ||||||||||||||||||||
| NPAT Margin | 19 | 22 | 25 | 29 | 25 | 26 | |||||||||||||||||||||
| EBITDA | 181 | 234 | 253 | 313 | 307 | 394 Jon Latto Jon LattoNumber taken from stats | 3 | ||||||||||||||||||||
| EBITDA Margin () | 39 | 47 | 47 | 52 | 47 | 52 | 4 | ||||||||||||||||||||
| EPS | 174 | 224 | 276 | 346 | 322 | 393 | 5 | ||||||||||||||||||||
| Dividend per share | 60 | 130 | 150 | 160 | 160 | 160 | 6 | ||||||||||||||||||||
| 7 | |||||||||||||||||||||||||||
| Dividend of Revenue | 134 | 124 | 107 | 8 | |||||||||||||||||||||||
| Dividend of EBITDA | 259 | 264 | 206 | 9 | |||||||||||||||||||||||
| 10 | |||||||||||||||||||||||||||
| Gold Production | 310 | 305 | 324 | 361 | 363 | 352 | 11 | ||||||||||||||||||||
| Realised Gold Price Per Oz Jon Latto Jon LattoData Extracted from Full Year Flash Reports | 1488 | 1600 | 1691 | 1676 | 1765 | 2200 | 12 | ||||||||||||||||||||
| AISC Per Oz | 994 | 927 | 945 | 901 | 1029 | 1246 | 13 | ||||||||||||||||||||
| AISC Marginoz | 494 | 673 | 746 | 775 | 736 | 954 | |||||||||||||||||||||
| 1 | |||||||||||||||||||||||||||
| AISC Margin in 2015 | 494 | 2 | |||||||||||||||||||||||||
| AISC Margin in 2020 | 954 | 3 | |||||||||||||||||||||||||
| Increase | 93 | 4 | |||||||||||||||||||||||||
| 5 | |||||||||||||||||||||||||||
| 6 | |||||||||||||||||||||||||||
| 7 | |||||||||||||||||||||||||||
| 8 | |||||||||||||||||||||||||||
| 9 | |||||||||||||||||||||||||||
| 10 | |||||||||||||||||||||||||||
| 11 | |||||||||||||||||||||||||||
| 12 | |||||||||||||||||||||||||||
| 13 | |||||||||||||||||||||||||||
| FY13 | FY14 | FY15 | FY16 | FY17 | FY18 | FY19 | FY20 | ||||||||||||||||||||
| Dividends Paid | 75 | 0 | 30 | 65 | 75 | 81 | 81 | 81 Jon Latto Jon LattoBased on shares on issue from Appendix 3B immediately prior to interim dividend payment and Appendix 2A immediately prior to full year dividend payment | |||||||||||||||||||
Jon Latto Jon LattoNumber taken from stats | Jon Latto Jon LattoData Extracted from Full Year Flash Reports | Cash and Bullion Balance After Dividends Paid | 81 | 14 | 73 | 123 | 152 | 209 | 205 | 209 | |||||||||||||||||
| Cumulative Dividends Paid | 75 | 75 | 105 | 170 | 245 | 326 | 407 | 488 | |||||||||||||||||||
| FY20 | FY19 | ||||||
| Ore mined | Mbcm | 43 | |||||
| Waste mined | Mbcm | 281 | |||||
| Strip ratio | wo | 66 | |||||
| Ore mined | Mt | 101 | |||||
| Ore milled | Mt | 94 | |||||
| Head grade | gt | 127 | |||||
| Recovery | 94 | ||||||
| Gold produced | 000 ozs | 363 | |||||
| Cash cost | A$oz | 819 | |||||
| Cash cost inc royalties | A$oz | 897 | |||||
| All-in Sustaining Cost | A$oz | 1029 | |||||
| Physicals | Unit | Year Ended 30 June 2019 | |||||
| Ounces Produced | oz | 363418 | |||||
| Ounces sold | oz | 369721 | |||||
| Bullion on Hand | oz | - 0 | |||||
| Average Realised Price | $oz | 1765 | |||||
| Sales Revenue | $m | 6525 | |||||
| Interest Income | $m | 23 | |||||
| Cost of Sales | $m | (4020) | |||||
| Gross Profit | $m | 2528 | |||||
| Other Income | $m | 44 | |||||
| Administration and Other Costs | $m | (157) | |||||
| Finance Costs | $m | (14) | |||||
| Impairment of Non Current Assets | $m | (67) | |||||
| Profit Before Tax | $m | 2335 | |||||
| Income Tax Expense | $m | (703) | |||||
| Net Profit After Tax | $m | 1631 |
| Values | Line X | Ends | Before | After | Line Y | Label Y | Y Label | CASH FLOWS FROM OPERATIONS | Category | Manual Adj | ||||||||||||||||||
| Jun-18 | 2088 | 15 | $2088m | 2088 | Receipts from gold sales | Operations | 652450151 | 652450151 | ||||||||||||||||||||
| Operations | 3287 | 25 | - | $2088m | $5375m | $5375m | $3732m | $3287m | Option premium income | Other | 1366000 | 1366000 | ||||||||||||||||
| Dividends | (812) | 35 | - | $5375m | $4563m | $4563m | $4969m | ($812m) | Other income | Other | - | - | ||||||||||||||||
| Mine development | (961) | 45 | - | $4563m | $3602m | $3602m | $4082m | ($961m) | Payments to suppliers and employees - DNO | Operations | (84224766) | (84224766) | ||||||||||||||||
| Exploration | (348) | 55 | - | $3602m | $3253m | $3253m | $3428m | ($348m) | Payments to suppliers and employees - DSO | Operations | (228404216) | (228404216) | ||||||||||||||||
| Other capex | (574) | 65 | - | $3253m | $2679m | $2679m | $2966m | ($574m) | Payments to suppliers and employees - CORP | Other | (14051447) | (14051447) | ||||||||||||||||
| Income tax | (540) | 75 | - | $2679m | $2139m | $2139m | $2409m | ($540m) | Interest received | Other | 2388192 | 2388192 | ||||||||||||||||
| Other | (87) | 85 | - | $2139m | $2053m | $2053m | $2096m | ($87m) | Income tax paid | Income tax | (53971000) | (53971000) | ||||||||||||||||
| Jun-19 | $2053m | Interest paid | Other | (85486) | (85486) | |||||||||||||||||||||||
| Proceeds from rental income | Other | 16500 | 16500 | |||||||||||||||||||||||||
| Net cash flows from(used in) operations | 275483928 | 275483928 | ||||||||||||||||||||||||||
| CASH FLOWS FROM INVESTING ACTIVITIES | ||||||||||||||||||||||||||||
| Payments for plant amp equipment | Other capex | (56425779) | (56425779) | |||||||||||||||||||||||||
| Payments for exploration amp evaluation - WA | Exploration | (24685627) | (24685627) | |||||||||||||||||||||||||
| Payments for exploration amp evaluation - NSW | Exploration | (10152682) | (10152682) | |||||||||||||||||||||||||
| Payments for development - TWL BNY DOG RMT | Mine development | (35632149) | (35632149) | |||||||||||||||||||||||||
| Payments for mine properties - DNO | Mine development | (4690352) | (4690352) | |||||||||||||||||||||||||
| Payments for mine properties - DSO | Mine development | (55809551) | (55809551) | |||||||||||||||||||||||||
| Payments for term deposits | Other | 77000 | 77000 | |||||||||||||||||||||||||
| Proceeds on disposal of term deposits | Other | (1708) | (1708) | |||||||||||||||||||||||||
| Payments for AFS investments | Other capex | - | ||||||||||||||||||||||||||
| Acquisition of exploration assets (net of cash) | Exploration | - | ||||||||||||||||||||||||||
| Proceeds on disposal of PampE | Other capex | 31346 | 31346 | |||||||||||||||||||||||||
| Net cash flows used in investing activities | (187289502) | (187289502) | ||||||||||||||||||||||||||
| CASH FLOWS FROM FINANCING ACTIVITIES | ||||||||||||||||||||||||||||
| Proceeds from equity raisings | - | |||||||||||||||||||||||||||
| Proceeds from exercise of options | Other | 1697500 | 1697500 | |||||||||||||||||||||||||
| Share issue costs | Other | (65127) | (65127) | |||||||||||||||||||||||||
| Dividends paid | Dividends | (81196194) | (81196194) | |||||||||||||||||||||||||
| Repayment of finance lease | Other capex | (1051633) | (1051633) | |||||||||||||||||||||||||
| Repayment of borrowings | - | |||||||||||||||||||||||||||
| Net cash flows from financing activities | (80615454) | (80615454) | ||||||||||||||||||||||||||
| Net increase(decrease) in cash amp equivalents | 7578972 | |||||||||||||||||||||||||||
| Cash amp bullion at the start of the period | 208802950 | |||||||||||||||||||||||||||
| Effects of exchange rate movements on cash | Operations | |||||||||||||||||||||||||||
| Movement in gold on hand | Operations | (11125871) | ||||||||||||||||||||||||||
| Cash amp bullion at the end of the period | 205256052 | |||||||||||||||||||||||||||
| 2014 | 2015 | 2016 | 2017 | 2018 | 2019 | ||||||||||
| Revenue | 372 | 465 | 502 | 544 | 606 | 652 | 1 | ||||||||
| NPAT | -148 | 87 | 112 | 138 | 174 | 163 | 2 | ||||||||
| Net Assets | 3210 | 4100 | 4820 | 5390 | 6370 | 7164 | 3 | ||||||||
| EPS | -2968 | 1739 | 2237 | 2759 | 346 | 3218 | 4 | ||||||||
| 5 | |||||||||||||||
| 6 | |||||||||||||||
| 7 | |||||||||||||||
| 8 | |||||||||||||||
| 9 | |||||||||||||||
| 10 | |||||||||||||||
| 11 | |||||||||||||||
| 12 | |||||||||||||||
| 13 | |||||||||||||||
| 1 | |||||||||||||||
| 2 | |||||||||||||||
| 3 | |||||||||||||||
| 4 | |||||||||||||||
| 5 | |||||||||||||||
| 6 | |||||||||||||||
| 7 | |||||||||||||||
| 8 | |||||||||||||||
| 9 | |||||||||||||||
| 10 | |||||||||||||||
| 11 | |||||||||||||||
| 12 | |||||||||||||||
| 13 |
| Values | Line X | Ends | Before | After | Line Y | Label Y | Y Label | ||||||||||
| 31 March 2018 | 805 | 15 | 805 | 805 | |||||||||||||
| Depletion | (040) | 25 | - | 805 | 766 | 766 | 786 | (040) | |||||||||
| Model Update | (003) | 35 | - | 766 | 763 | 763 | 764 | (003) | |||||||||
| New Deposits | 023 | 45 | - | 763 | 786 | 786 | 774 | 023 | |||||||||
| 31 March 2019 | 786 | ||||||||||||||||
| Values | Line X | Ends | Before | After | Line Y | Label Y | Y Label | ||||||||||
| 31 March 2017 | 218 | 15 | 218 | 218 | |||||||||||||
| Depletion | (040) | 25 | - | 218 | 179 | 179 | 198 | (040) | |||||||||
| Model Update | 024 | 35 | - | 179 | 203 | 203 | 191 | 024 | |||||||||
| New Deposits | 203 | 45 | - | 203 | 406 | 406 | 305 | 203 | |||||||||
| 31 March 2018 | 406 | ||||||||||||||||
| 212540855741674 |
| 1 | 2 | 3 | 4 | 5 | 6 | 7 | 8 | 9 | 10 | ||||||||||||
| Ounces Recovered | 142688 | 181016 | 179298 | 192720 | 177647 | 209062 | 210877 | 224493 | 210461 | 210461 | |||||||||||
| Milled Grade (gt) | 090 | 095 | 094 | 101 | 093 | 109 | 110 | 117 | 146 | 146 |
| Values | Line X | Ends | Before | After | Line Y | Label Y | Y Label | ||||||||||
| 2009 Reserve | 06Moz | 15 | 06Moz | 06Moz | |||||||||||||
| Mining Depletion | (19Moz) | 25 | - | 06Moz | (12Moz) | (12Moz) | (03Moz) | (19Moz) | |||||||||
| Discovery | 34Moz | 35 | - | (12Moz) | 22Moz | 22Moz | 05Moz | 34Moz | |||||||||
| Current Reserves | 22Moz | ||||||||||||||||
| Dividend | |||||||||||||||||
| 2015 | 2016 | 2017 | 2018 | 2019 | 2020 | ||||||||||||
| Interim | 0 | 4 | 7 | 8 | 8 | 8 | |||||||||||
| Final | 6 | 9 | 8 | 8 | 8 | 8 | |||||||||||
| Dividends Paid | 2013 | 2014 | 2015 | 2016 | 2017 | 2018 | 2019 | 2020 | |||||||||
| 75 | 75 | 105 | 170 | 245 | 326 | 407 | 488 |
| 2015 | 2016 | 2017 | 2018 | 2019 | 2020 | ||||||||||||
| Revenue | 465 | 502 | 544 | 606 | 654 | 757 | 1 | ||||||||||
| NPAT | 87 | 112 | 138 | 174 | 163 | 200 | 2 | ||||||||||
| NPAT Margin | 19 | 22 | 25 | 29 | 25 | 26 | |||||||||||
| EBITDA | 181 | 234 | 253 | 313 | 307 | 394 Jon Latto Jon LattoNumber taken from stats | 3 | ||||||||||
| EBITDA Margin () | 39 | 47 | 47 | 52 | 47 | 52 | 4 | ||||||||||
| EPS | 174 | 224 | 276 | 346 | 322 | 393 | 5 | ||||||||||
| Dividend per share | 60 | 130 | 150 | 160 | 160 | 160 | 6 | ||||||||||
| 7 | |||||||||||||||||
| Dividend of Revenue | 134 | 124 | 107 | 8 | |||||||||||||
| Dividend of EBITDA | 259 | 264 | 206 | 9 | |||||||||||||
| 10 | |||||||||||||||||
| Gold Production | 310 | 305 | 324 | 361 | 363 | 352 | 11 | ||||||||||
| Realised Gold Price Per Oz Jon Latto Jon LattoData Extracted from Full Year Flash Reports | 1488 | 1600 | 1691 | 1676 | 1765 | 2200 | 12 | ||||||||||
| AISC Per Oz | 994 | 927 | 945 | 901 | 1029 | 1246 | 13 | ||||||||||
| AISC Marginoz | 494 | 673 | 746 | 775 | 736 | 954 | |||||||||||
| 1 | |||||||||||||||||
| AISC Margin in 2015 | 494 | 2 | |||||||||||||||
| AISC Margin in 2020 | 954 | 3 | |||||||||||||||
| Increase | 93 | 4 | |||||||||||||||
| 5 | |||||||||||||||||
| 6 | |||||||||||||||||
| 7 | |||||||||||||||||
| 8 | |||||||||||||||||
| 9 | |||||||||||||||||
| 10 | |||||||||||||||||
| 11 | |||||||||||||||||
| 12 | |||||||||||||||||
| 13 | |||||||||||||||||
| FY13 | FY14 | FY15 | FY16 | FY17 | FY18 | FY19 | FY20 | ||||||||||
| Dividends Paid | 75 | 0 | 30 | 65 | 75 | 81 | 81 | 81 Jon Latto Jon LattoBased on shares on issue from Appendix 3B immediately prior to interim dividend payment and Appendix 2A immediately prior to full year dividend payment | |||||||||
Jon Latto Jon LattoNumber taken from stats | Jon Latto Jon LattoData Extracted from Full Year Flash Reports | Cash and Bullion Balance | |||||||||||||||
| Dividends | |||||||||||||||||
| Cash and Bullion Balance Pre Dividends |
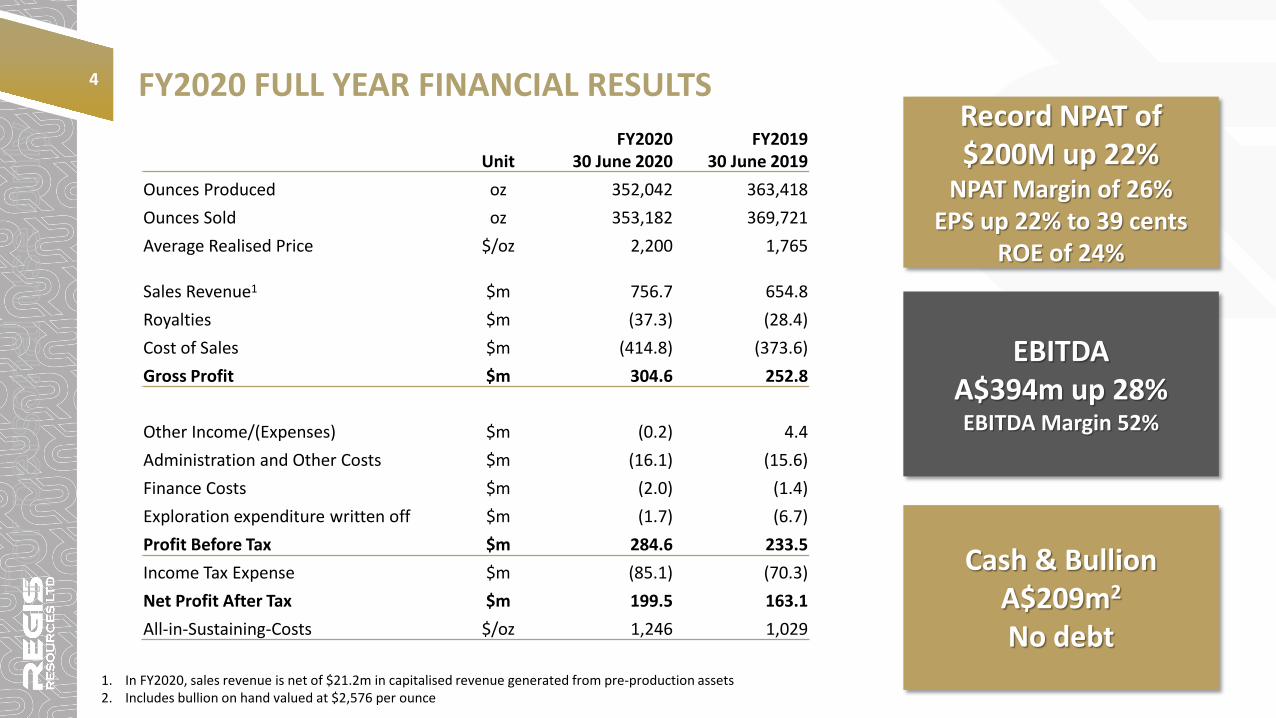
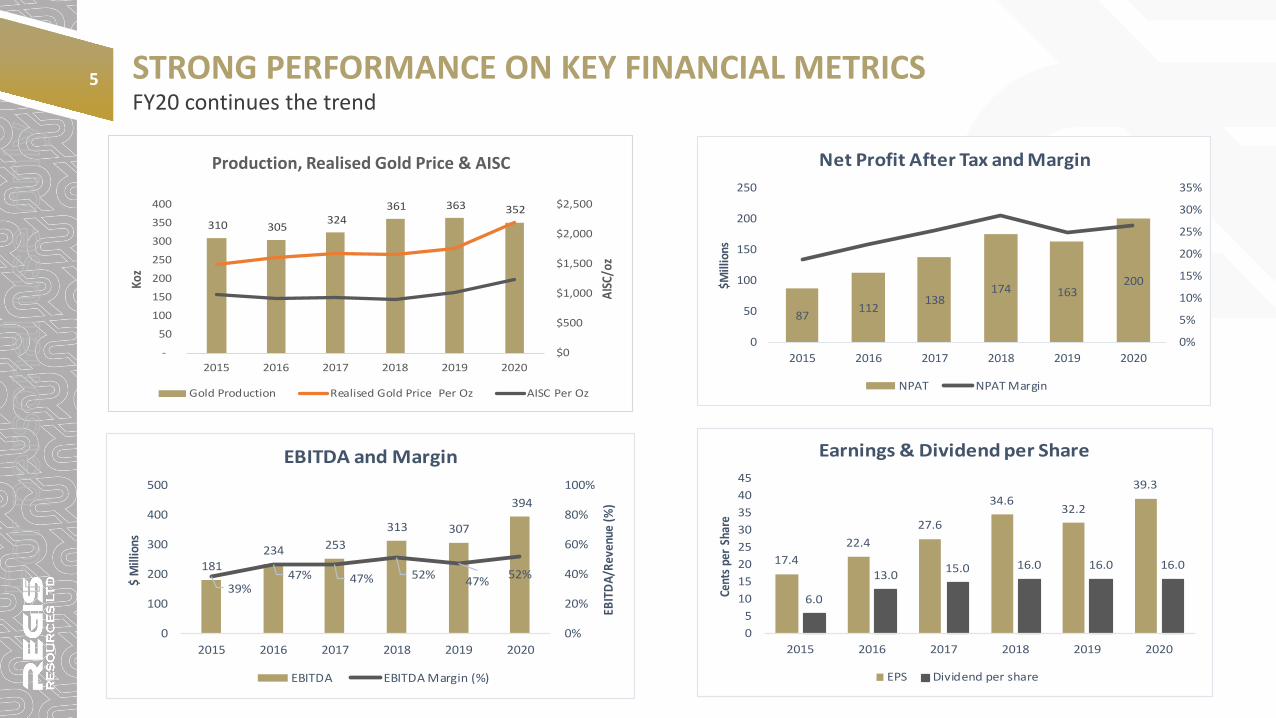

STRONG GROWTH IN YEAR ON YEAR NET PROFIT AFTER TAX6FY20 continues the growth trend
$163m
- - - - -
$200m
$61m
$5m ($9m) ($1m)
($15m)($5m)
-
$50m
$100m
$150m
$200m
$250m
Net Profit After Tax - 30 June 2020
For
per
sona
l use
onl
y
CIRCA HALF A BILLION DOLLARS IN DIVIDENDS SINCE 2013Regis continues to be an Australian gold industry leader on dividend payment metrics
7
Final dividend of 8 cps ($41m) fully franked payout
Total dividends for FY20 of 16 cps ($81m) fully franked
11 of FY20 revenue and 21 of EBITDA1
29 basic dividend yield 2
41 grossed up (for 100 franking) dividend yield
Regis has paid andor declared 97cps - $488 million in dividends since 2013
Dividend Reinvestment Plan announced
Level of future dividends will continuously be assessed in the context of gold price operational performance and planned cap ital expenditure
47 8 8 86
98 8 8 8
0
5
10
15
20
2015 2016 2017 2018 2019 2020
Cent
s pe
r Sh
are
Dividends Declared
Interim Final
75 75 105170
245326
407488
0
100
200
300
400
500
600
2013 2014 2015 2016 2017 2018 2019 2020
$ M
illio
ns
Cumulative Dividends Paid
1 EBITDA is an adjusted measure of earnings before interest taxes depreciation and amortisation EBITDA is non-IFRS financial information and is not subject to audit The measure is included to assist investors to better understand the performance of the business EBITDA in FY20 was increased by $89 million as a result of the introduction of AASB16 (Leases)
2 Annualised dividend yield of 16cps at a closing share price of $555 on 25 August 2020
For
per
sona
l use
onl
y
Dividends Declared
Interim
201520162017201820192020047888Final
201520162017201820192020698888
Cents per Share
Revenue
Revenue
20152016201720182019202046550254460665475665700000000004
$ Millions
Net Profit After Tax
NPAT
20152016201720182019202087112138174163199517
$Millions
EBITDA
EBITDA
20152016201720182019202018123425331330739414100000000002EBITDA Margin ()
20152016201720182019202003892473118279569704661354581673306504650735294117647205165016501650164804694189602446483052089784406937356
$ Millions
ebitdarevenue ()
Earnings amp Dividend per Share
EPS
20152016201720182019202017399999999999999224275934632183926Dividend per share
20152016201720182019202061315161616
Cents per Share
Dividends Declared
Interim
201520162017201820192020047888Final
201520162017201820192020698888
Cents per Share
Cumulative Dividends Paid
20132014201520162017201820192020757510517024532640748832281288000001
$ Millions
Duketon Gold Reserves 2009 -2017
Ends
2009 ReserveMining DepletionDiscoveryCurrent Reserves603584002179584BeforeBudgetMLW Sales QtyMLW Sales PriceMLW COGSGDW Sales QtyGDW Sales PriceGDW COGSRMT Sales QtyRMT Sales PriceRMT COGSGIC Mvmt AllActual603584-1248353AfterBudgetMLW Sales QtyMLW Sales PriceMLW COGSGDW Sales QtyGDW Sales PriceGDW COGSRMT Sales QtyRMT Sales PriceRMT COGSGIC Mvmt AllActual-12483532179584Label Y
-18519373427937-32238454656155Line Y152535603584-12483532179584
Annual Gold Production amp Milled Grade
Ounces Recovered1234567891014268801161428873181015988838041351792984412915424319272013332356702177647158664950932090624306474577221087733917052421224493372104644162104609766314578621046097663145786Milled Grade (gt)123456789100895569124782444210946257386951172230937278942195154951007440563400282309332574237366220210928695890410962110235698630137117353452054794531462642404603127714626424046031277
Ounces
gt Au
Group Mineral Resource
Ends
31 March 2018DepletionModel UpdateNew Deposits31 March 201980547420007858905BeforeBudgetMLW Sales QtyMLW Sales PriceMLW COGSGDW Sales QtyGDW Sales PriceGDW COGSRMT Sales QtyRMT Sales PriceRMT COGSGIC Mvmt AllActual805474276590717628865AfterBudgetMLW Sales QtyMLW Sales PriceMLW COGSGDW Sales QtyGDW Sales PriceGDW COGSRMT Sales QtyRMT Sales PriceRMT COGSGIC Mvmt AllActual765907176288657858905Label Y
-395671-302062300407856906576439687743885Line Y152535458054742765907176288657858905
Group Ore Reserves
Ends31 March 2017DepletionModel UpdateNew Deposits31 March 201821818650004064752BeforeBudgetMLW Sales QtyMLW Sales PriceMLW COGSGDW Sales QtyGDW Sales PriceGDW COGSRMT Sales QtyRMT Sales PriceRMT COGSGIC Mvmt AllActual218186517861942030570AfterBudgetMLW Sales QtyMLW Sales PriceMLW COGSGDW Sales QtyGDW Sales PriceGDW COGSRMT Sales QtyRMT Sales PriceRMT COGSGIC Mvmt AllActual178619420305704064752Label Y-39567124437620341821984029519083823047661Line Y152535452181865178619420305704064752
Net Assets amp EPS
Net Assets2014201520162017201820193214104825396377164Revenue201420152016201720182019372465502544606Net Assets
201420152016201720182019321410482539637EPS
201420152016201720182019-29681739223727593463218
$ mILLIONS
Revenue amp NPAT
Revenue
201420152016201720182019372465502544606652NPAT
201420152016201720182019-14887112138174163
$ MILLIONS
Cash amp Gold on Hand - 30 June 2019
Ends
$2053m
43281OperationsDividendsMine developmentExplorationOther capexIncome taxOther43646208802950000000020524558200090003BeforeBudgetMLW Sales QtyMLW Sales PriceMLW COGSGDW Sales QtyGDW Sales PriceGDW COGSRMT Sales QtyRMT Sales PriceRMT COGSGIC Mvmt AllActual208802950537487779220900064562915852209000636015953274090004325321224320900022678751580009000321390415800090003AfterBudgetMLW Sales QtyMLW Sales PriceMLW COGSGDW Sales QtyGDW Sales PriceGDW COGSRMT Sales QtyRMT Sales PriceRMT COGSGIC Mvmt AllActual53748777922090006456291585220900063601595327409000432532122432090002267875158000900032139041580009000320524558200090003Label Y
3286848292209-81196194-96132052480000004-34838308420000002-57446066319999993-53971000-8658576373145364610450034968896822209000640822555898090005342740378530929659819116092408896580009000320957487000090003Line Y152535455565758520880295053748777922090006456291585220900063601595327409000432532122432090002267875158000900032139041580009000320524558200090003
Note Waterfall is prepared based on the Cash Flow statement as it stands when the quarterly is ready for release Changes may occur between this version and the final version of the cash flow in the management accounts
Cumulative Dividends Paid
20132014201520162017201820192020757510517024532640748832281288000001
$ Millions
Revenue
Revenue
20152016201720182019202046550254460665475665700000000004
$ Millions
Net Profit After Tax
NPAT
20152016201720182019202087112138174163199517
$Millions
EBITDA
EBITDA
20152016201720182019202018123425331330739414100000000002EBITDA Margin ()
20152016201720182019202003892473118279569704661354581673306504650735294117647205165016501650164804694189602446483052089784406937356
$ Millions
ebitdarevenue ()
Earnings amp Dividend per Share
EPS
20152016201720182019202017399999999999999224275934632183926Dividend per share
20152016201720182019202061315161616
Cents per Share
Dividends Declared
Interim
201520162017201820192020047888Final
201520162017201820192020698888
Cents per Share
Cumulative Dividends Paid
20132014201520162017201820192020757510517024532640748832281288000001
$ Millions
Duketon Gold Reserves 2009 -2017
Ends
2009 ReserveMining DepletionDiscoveryCurrent Reserves603584002179584BeforeBudgetMLW Sales QtyMLW Sales PriceMLW COGSGDW Sales QtyGDW Sales PriceGDW COGSRMT Sales QtyRMT Sales PriceRMT COGSGIC Mvmt AllActual603584-1248353AfterBudgetMLW Sales QtyMLW Sales PriceMLW COGSGDW Sales QtyGDW Sales PriceGDW COGSRMT Sales QtyRMT Sales PriceRMT COGSGIC Mvmt AllActual-12483532179584Label Y
-18519373427937-32238454656155Line Y152535603584-12483532179584
Annual Gold Production amp Milled Grade
Ounces Recovered1234567891014268801161428873181015988838041351792984412915424319272013332356702177647158664950932090624306474577221087733917052421224493372104644162104609766314578621046097663145786Milled Grade (gt)123456789100895569124782444210946257386951172230937278942195154951007440563400282309332574237366220210928695890410962110235698630137117353452054794531462642404603127714626424046031277
Ounces
gt Au
Group Mineral Resource
Ends
31 March 2018DepletionModel UpdateNew Deposits31 March 201980547420007858905BeforeBudgetMLW Sales QtyMLW Sales PriceMLW COGSGDW Sales QtyGDW Sales PriceGDW COGSRMT Sales QtyRMT Sales PriceRMT COGSGIC Mvmt AllActual805474276590717628865AfterBudgetMLW Sales QtyMLW Sales PriceMLW COGSGDW Sales QtyGDW Sales PriceGDW COGSRMT Sales QtyRMT Sales PriceRMT COGSGIC Mvmt AllActual765907176288657858905Label Y
-395671-302062300407856906576439687743885Line Y152535458054742765907176288657858905
Group Ore Reserves
Ends31 March 2017DepletionModel UpdateNew Deposits31 March 201821818650004064752BeforeBudgetMLW Sales QtyMLW Sales PriceMLW COGSGDW Sales QtyGDW Sales PriceGDW COGSRMT Sales QtyRMT Sales PriceRMT COGSGIC Mvmt AllActual218186517861942030570AfterBudgetMLW Sales QtyMLW Sales PriceMLW COGSGDW Sales QtyGDW Sales PriceGDW COGSRMT Sales QtyRMT Sales PriceRMT COGSGIC Mvmt AllActual178619420305704064752Label Y-39567124437620341821984029519083823047661Line Y152535452181865178619420305704064752
Net Assets amp EPS
Net Assets2014201520162017201820193214104825396377164Revenue201420152016201720182019372465502544606Net Assets
201420152016201720182019321410482539637EPS
201420152016201720182019-29681739223727593463218
$ mILLIONS
Revenue amp NPAT
Revenue
201420152016201720182019372465502544606652NPAT
201420152016201720182019-14887112138174163
$ MILLIONS
Cash amp Gold on Hand - 30 June 2019
Ends
$2053m
43281OperationsDividendsMine developmentExplorationOther capexIncome taxOther43646208802950000000020524558200090003BeforeBudgetMLW Sales QtyMLW Sales PriceMLW COGSGDW Sales QtyGDW Sales PriceGDW COGSRMT Sales QtyRMT Sales PriceRMT COGSGIC Mvmt AllActual208802950537487779220900064562915852209000636015953274090004325321224320900022678751580009000321390415800090003AfterBudgetMLW Sales QtyMLW Sales PriceMLW COGSGDW Sales QtyGDW Sales PriceGDW COGSRMT Sales QtyRMT Sales PriceRMT COGSGIC Mvmt AllActual53748777922090006456291585220900063601595327409000432532122432090002267875158000900032139041580009000320524558200090003Label Y
3286848292209-81196194-96132052480000004-34838308420000002-57446066319999993-53971000-8658576373145364610450034968896822209000640822555898090005342740378530929659819116092408896580009000320957487000090003Line Y152535455565758520880295053748777922090006456291585220900063601595327409000432532122432090002267875158000900032139041580009000320524558200090003
Note Waterfall is prepared based on the Cash Flow statement as it stands when the quarterly is ready for release Changes may occur between this version and the final version of the cash flow in the management accounts
CASHFLOW WATERFALLStrong cashflow from operations of $424 million supported increased capital investment during FY20 and the payment of $81 million in dividends during the year
8
1 Includes bullion on hand valued at $2576 per ounce
$205m
- - - - -
$376m
$209m
$424m
($135m)($37m)
($65m) ($16m)
($64m)($21m)
($81m)
-
$100m
$200m
$300m
$400m
$500m
$600m
$700mCash amp Bullion on Hand - 30 June 2020
For
per
sona
l use
onl
y
Cash amp Bullion on Hand - 30 June 2020
Ends
June 2019OperationsMine developmentExplorationOther capexOtherIncome taxDKM AcquisitionDividendsJune 2020205165482000003756792770000000600020929658200000006BeforeBudgetMLW Sales QtyMLW Sales PriceMLW COGSGDW Sales QtyGDW Sales PriceGDW COGSRMT Sales QtyRMT Sales PriceRMT COGSGIC Mvmt AllActual20516548262912235333000004494291817330000044571743027500000639216663275000006375679277000000063118868710000000629060545600000006AfterBudgetMLW Sales QtyMLW Sales PriceMLW COGSGDW Sales QtyGDW Sales PriceGDW COGSRMT Sales QtyRMT Sales PriceRMT COGSGIC Mvmt AllActual6291223533300000449429181733000004457174302750000063921666327500000637567927700000006311886871000000062906054560000000620929658200000006Label Y
$424m ($135m)($37m)($65m)($16m)($64m)($21m)($81m)4171439176650000256170708533000004475733060040000084246704677500000638392295487500006343783074000000063012461635000000624995101900000006Line Y152535455565758595105205165482629122353330000044942918173300000445717430275000006392166632750000063756792770000000637567927700000006311886871000000062906054560000000620929658200000006
Cash amp Gold on Hand - Q1 Movements
Ends
Q4 FY19OperationsDividendsCapitalised Mining ExplorationDKM AcquisitionOther capexIncome taxOtherQ1 FY20205165481579199970000000014741309157919994BeforeBudgetMLW Sales QtyMLW Sales PriceMLW COGSGDW Sales QtyGDW Sales PriceGDW COGSRMT Sales QtyRMT Sales PriceRMT COGSGIC Mvmt AllActual2051654815791999728767825576919997247023818769199972164444927691999720629479018919995186294790189199951660754041891999515281533618919995AfterBudgetMLW Sales QtyMLW Sales PriceMLW COGSGDW Sales QtyGDW Sales PriceGDW COGSRMT Sales QtyRMT Sales PriceRMT COGSGIC Mvmt AllActual2876782557691999724702381876919997216444492769199972062947901891999518629479018919995166075404189199951528153361891999514741309157919994Label Y
82512774189999998-40654437-30579326-1014970258-20000000-20219386-13260068-540224461000000132464218686741999726735103726919997231734155769199972113696414791999519629479018919995176185097189199951594453701891999515011421388419995Line Y152535455565758595205165481579199972876782557691999724702381876919997216444492769199972062947901891999518629479018919995166075404189199951528153361891999514741309157919994
Note Waterfall is prepared based on the Cash Flow statement as it stands when the quarterly is ready for release Changes may occur between this version and the final version of the cash flow in the management accounts
Cash amp Gold on Hand - Q2 Movements
Ends
Q1 FY19OperationsMine developmentExplorationOther capexIncome taxOtherQ2 FY191474130915791999700000016414659428999993BeforeBudgetMLW Sales QtyMLW Sales PriceMLW COGSGDW Sales QtyGDW Sales PriceGDW COGSRMT Sales QtyRMT Sales PriceRMT COGSGIC Mvmt AllActual147413091579199972237779744899999520648957137999994195464900379999941852081753799999416685232837999994AfterBudgetMLW Sales QtyMLW Sales PriceMLW COGSGDW Sales QtyGDW Sales PriceGDW COGSRMT Sales QtyRMT Sales PriceRMT COGSGIC Mvmt AllActual223777974489999952064895713799999419546490037999994185208175379999941668523283799999416414659428999993Label Y
76364882910799995-17288403109999999-11024671-10256725-18355847-270573409185595533034599962151337729349999420097723587999994190336537879999941760302518799999416549946133499992Line Y1525354555657514741309157919997223777974489999952064895713799999419546490037999994185208175379999941668523283799999416414659428999993
Note Waterfall is prepared based on the Cash Flow statement as it stands when the quarterly is ready for release Changes may occur between this version and the final version of the cash flow in the management accounts
Cash amp Gold on Hand - Q2 Movements
Ends
Q1 FY20OperationsCapitalised Mining ExplorationOther capexIncome taxOtherQ2 FY201474130915791999700000016881196810859996BeforeBudgetMLW Sales QtyMLW Sales PriceMLW COGSGDW Sales QtyGDW Sales PriceGDW COGSRMT Sales QtyRMT Sales PriceRMT COGSGIC Mvmt AllActual147413091579199972473972032485999521497149024859995204533215248599951874883882485999517228720124859995AfterBudgetMLW Sales QtyMLW Sales PriceMLW COGSGDW Sales QtyGDW Sales PriceGDW COGSRMT Sales QtyRMT Sales PriceRMT COGSGIC Mvmt AllActual247397203248599952149714902485999520453321524859995187488388248599951722872012485999516881196810859996Label Y
99984111669399977-32425713-10438275-17044827-15201187-34752331399999987197405147413899962311843467485999520975235274859995196010801748599951798877947485999517054958467859995Line Y1525354555657514741309157919997247397203248599952149714902485999520453321524859995187488388248599951722872012485999516881196810859996
Note Waterfall is prepared based on the Cash Flow statement as it stands when the quarterly is ready for release Changes may occur between this version and the final version of the cash flow in the management accounts
Cash amp Gold on Hand - Q3 Movements
Ends
Q2 FY19OperationsDividendsMine developmentExplorationOther capexIncome taxOtherQ3 FY1916425052228999996000000014396948046919999BeforeBudgetMLW Sales QtyMLW Sales PriceMLW COGSGDW Sales QtyGDW Sales PriceGDW COGSRMT Sales QtyRMT Sales PriceRMT COGSGIC Mvmt AllActual16425052228999996253593527579199972129675705791999718622986097919998179564378979199981570046329791999814578446097919998AfterBudgetMLW Sales QtyMLW Sales PriceMLW COGSGDW Sales QtyGDW Sales PriceGDW COGSRMT Sales QtyRMT Sales PriceRMT COGSGIC Mvmt AllActual25359352757919997212967570579199971862298609791999817956437897919998157004632979199981457844609791999814396948046919999Label Y
89343005289200008-40625957-26737709600000001-6665482-22559746-11220172-1814980509999999820892202493459997233280549079199971995987157791999618289711997919998168284505979199981513945469791999814487697072419998Line Y15253545556575851642505222899999625359352757919997212967570579199971862298609791999817956437897919998157004632979199981457844609791999814396948046919999
Note Waterfall is prepared based on the Cash Flow statement as it stands when the quarterly is ready for release Changes may occur between this version and the final version of the cash flow in the management accounts
Cash amp Gold on Hand - 31 December 2019
Ends
June 2019OperationsDividendsMine developmentExplorationDKM AcquisitionOther capexIncome taxOtherDecember 2019205165481579199970000000016881196810859993BeforeBudgetMLW Sales QtyMLW Sales PriceMLW COGSGDW Sales QtyGDW Sales PriceGDW COGSRMT Sales QtyRMT Sales PriceRMT COGSGIC Mvmt AllActual2051654815791999738766236743859994347007930438599942840028914385999426341491385859993243414913858599932061507008585999317768944585859993AfterBudgetMLW Sales QtyMLW Sales PriceMLW COGSGDW Sales QtyGDW Sales PriceGDW COGSRMT Sales QtyRMT Sales PriceRMT COGSGIC Mvmt AllActual3876623674385999434700793043859994284002891438599942634149138585999324341491385859993206150700858599931776894458585999316881196810859993Label Y
1824968858594-40654437-63005039-20587977580000002-20000000-37264213-28461255-8877477752964139245088999336733514893859994315505410938599942737089026485999225341491385859993224782807358599931919200733585999317325070698359993Line Y152535455565758595205165481579199973876623674385999434700793043859994284002891438599942634149138585999324341491385859993206150700858599931776894458585999316881196810859993
Cash amp Gold on Hand - 31 December 2019
Ends
June 2019OperationsMine developmentExplorationOther capexIncome taxOtherDecember 2019DKM AcquisitionDividendsDecember 201920516548157919997000000229466405108599960016881196810859996BeforeBudgetMLW Sales QtyMLW Sales PriceMLW COGSGDW Sales QtyGDW Sales PriceGDW COGSRMT Sales QtyRMT Sales PriceRMT COGSGIC Mvmt AllActual205165481579199973876623674385999432465732843859994304069350858599962668051378585999623834388285859996NA2294664051085999620946640510859996AfterBudgetMLW Sales QtyMLW Sales PriceMLW COGSGDW Sales QtyGDW Sales PriceGDW COGSRMT Sales QtyRMT Sales PriceRMT COGSGIC Mvmt AllActual387662367438599943246573284385999430406935085859996266805137858599962383438828585999622946640510859996NA2094664051085999616881196810859996Label Y
$1825m ($630m)($206m)($373m)($285m)($89m)($200m)($407m)296413924508899933561598479385999431436333964859998285437244358599962525745103585999623390514398359996NA2194664051085999618913918660859996Line Y15253545556575859510520516548157919997387662367438599943246573284385999430406935085859996266805137858599962383438828585999622946640510859996229466405108599962094664051085999616881196810859996
Cash amp Bullion on Hand - 31 December 2019
Ends
June 2019OperationsMine developmentExplorationOther capexIncome taxOtherCash and Bullion before Acquisitions amp DividendsDKM AcquisitionDividendsDecember 201920516548200000022946640600168811969BeforeBudgetMLW Sales QtyMLW Sales PriceMLW COGSGDW Sales QtyGDW Sales PriceGDW COGSRMT Sales QtyRMT Sales PriceRMT COGSGIC Mvmt AllActual2051654823842603833299999832915425632999998309283452752733648667524033074975NA229466406209466406AfterBudgetMLW Sales QtyMLW Sales PriceMLW COGSGDW Sales QtyGDW Sales PriceGDW COGSRMT Sales QtyRMT Sales PriceRMT COGSGIC Mvmt AllActual3842603833299999832915425632999998309283452752733648667524033074975229466406NA209466406168811969Label Y
$1791m ($551m)($199m)($359m)($330m)($109m)($200m)($407m)2947129326649999635670731982999998319218854539999962913241597525684780825234898577875NA2194664061891391875Line Y1525354555657585951052051654823842603833299999832915425632999998309283452752733648667524033074975229466406229466406209466406168811969
Cash amp Gold on Hand - Q3 Movements
Ends
Q2 FY20OperationsCapitalised Mining ExplorationOther capexIncome taxOtherQ3 FY20DividendsQ3 FY201688119681085999600000020944739757919991016879296057919991BeforeBudgetMLW Sales QtyMLW Sales PriceMLW COGSGDW Sales QtyGDW Sales PriceGDW COGSRMT Sales QtyRMT Sales PriceRMT COGSGIC Mvmt AllActual168811968108599962761787235791999124613937157919991238428719579199912263386975791999121071124757919991NA20944739757919991AfterBudgetMLW Sales QtyMLW Sales PriceMLW COGSGDW Sales QtyGDW Sales PriceGDW COGSRMT Sales QtyRMT Sales PriceRMT COGSGIC Mvmt AllActual276178723579199912461393715791999123842871957919991226338697579199912107112475791999120944739757919991NA16879296057919991Label Y
$1074m ($300m)($77m)($121m)($156m)($13m)($407m)222495345843899942611590475791999124228404557919991232383708579199912185249725791999121007932257919991NA18912017907919991Line Y152535455565758595168811968108599962761787235791999124613937157919991238428719579199912263386975791999121071124757919991209447397579199912094473975791999116879296057919991
Note Waterfall is prepared based on the Cash Flow statement as it stands when the quarterly is ready for release Changes may occur between this version and the final version of the cash flow in the management accounts
Cash amp Gold on Hand - Q3 Movements
Ends
Q2 FY20OperationsCapitalised Mining ExplorationOther capexOtherQ3 FY20Income taxDividendsQ3 FY201688119681085999600000225074847579199910016879296057919991BeforeBudgetMLW Sales QtyMLW Sales PriceMLW COGSGDW Sales QtyGDW Sales PriceGDW COGSRMT Sales QtyRMT Sales PriceRMT COGSGIC Mvmt AllActual1688119681085999627617872357919991246139371579199912384287195791999122633869757919991NA2250748475791999120944739757919991AfterBudgetMLW Sales QtyMLW Sales PriceMLW COGSGDW Sales QtyGDW Sales PriceGDW COGSRMT Sales QtyRMT Sales PriceRMT COGSGIC Mvmt AllActual2761787235791999124613937157919991238428719579199912263386975791999122507484757919991NA2094473975791999116879296057919991Label Y
$1074m ($300m)($77m)($121m)($13m)($156m)($407m)2224953458438999426115904757919991242284045579199912323837085791999122570677257919991NA2172611225791999118912017907919991Line Y152535455565758595168811968108599962761787235791999124613937157919991238428719579199912263386975791999122507484757919991225074847579199912094473975791999116879296057919991
Note Waterfall is prepared based on the Cash Flow statement as it stands when the quarterly is ready for release Changes may occur between this version and the final version of the cash flow in the management accounts
Cash amp Gold on Hand - Q4 Movements
Ends
Q3 FY20OperationsCapitalised Mining ExplorationOther capexIncome taxOtherQ4 FY201687929605791999400000020928474457919988BeforeBudgetMLW Sales QtyMLW Sales PriceMLW COGSGDW Sales QtyGDW Sales PriceGDW COGSRMT Sales QtyRMT Sales PriceRMT COGSGIC Mvmt AllActual168792960579199942777111782291998924878052357919988237967979579199882286235965791998821349275757919988AfterBudgetMLW Sales QtyMLW Sales PriceMLW COGSGDW Sales QtyGDW Sales PriceGDW COGSRMT Sales QtyRMT Sales PriceRMT COGSGIC Mvmt AllActual277711178229199892487805235791998823796797957919988228623596579199882134927575791998820928474457919988Label Y
10891821764999998-28930654649999999-10812544-9344383-15130839-420801299999999632232520694041999263245850904199924337425157919988233295788079199882210581770791998821138875107919988Line Y1525354555657516879296057919994277711178229199892487805235791998823796797957919988228623596579199882134927575791998820928474457919988
Note Waterfall is prepared based on the Cash Flow statement as it stands when the quarterly is ready for release Changes may occur between this version and the final version of the cash flow in the management accounts
Cash amp Gold on Hand - Q4 Movements
Ends
Q3 FY20OperationsCapitalised Mining ExplorationOther capexOtherQ4 FY20Income taxQ4 FY20168792960579199940000022441558357919988020928474457919988BeforeBudgetMLW Sales QtyMLW Sales PriceMLW COGSGDW Sales QtyGDW Sales PriceGDW COGSRMT Sales QtyRMT Sales PriceRMT COGSGIC Mvmt AllActual1687929605791999427771117822919989248780523579199882379679795791998822862359657919988NA22441558357919988AfterBudgetMLW Sales QtyMLW Sales PriceMLW COGSGDW Sales QtyGDW Sales PriceGDW COGSRMT Sales QtyRMT Sales PriceRMT COGSGIC Mvmt AllActual2777111782291998924878052357919988237967979579199882286235965791998822441558357919988NA20928474457919988Label Y
$1089m ($289m)($108m)($93m)($42m)($151m)22325206940419992632458509041999243374251579199882332957880791998822651959007919988NA21685016407919988Line Y15253545556575851687929605791999427771117822919989248780523579199882379679795791998822862359657919988224415583579199882244155835791998820928474457919988
Note Waterfall is prepared based on the Cash Flow statement as it stands when the quarterly is ready for release Changes may occur between this version and the final version of the cash flow in the management accounts
Cash amp Bullion on Hand - 30 June 2020
Ends
June 2019OperationsMine developmentExplorationOther capexOtherIncome taxDKM AcquisitionDividendsJune 2020205165482000003756792770000000600020929658200000006BeforeBudgetMLW Sales QtyMLW Sales PriceMLW COGSGDW Sales QtyGDW Sales PriceGDW COGSRMT Sales QtyRMT Sales PriceRMT COGSGIC Mvmt AllActual20516548262912235333000004494291817330000044571743027500000639216663275000006375679277000000063118868710000000629060545600000006AfterBudgetMLW Sales QtyMLW Sales PriceMLW COGSGDW Sales QtyGDW Sales PriceGDW COGSRMT Sales QtyRMT Sales PriceRMT COGSGIC Mvmt AllActual6291223533300000449429181733000004457174302750000063921666327500000637567927700000006311886871000000062906054560000000620929658200000006Label Y
$424m ($135m)($37m)($65m)($16m)($64m)($21m)($81m)4171439176650000256170708533000004475733060040000084246704677500000638392295487500006343783074000000063012461635000000624995101900000006Line Y152535455565758595105205165482629122353330000044942918173300000445717430275000006392166632750000063756792770000000637567927700000006311886871000000062906054560000000620929658200000006
Cash amp Gold on Hand - FY2019 YTD
Ends
Jun-18OperationsDividendsMine developmentExplorationOther capexIncome taxOtherJun-19202277539000000018869714553999996BeforeBudgetMLW Sales QtyMLW Sales PriceMLW COGSGDW Sales QtyGDW Sales PriceGDW COGSRMT Sales QtyRMT Sales PriceRMT COGSGIC Mvmt AllActual202277539520939342759999994397431487599999934361109627999997308772787859999952513267215399999619735572153999996AfterBudgetMLW Sales QtyMLW Sales PriceMLW COGSGDW Sales QtyGDW Sales PriceGDW COGSRMT Sales QtyRMT Sales PriceRMT COGSGIC Mvmt AllActual52093934275999999439743148759999993436110962799999730877278785999995251326721539999961973557215399999618869714553999996Label Y
31866180375999999-81196194-96132052480000004-34838308420000002-57446066319999993-53971000-865857636160844088480341245759999993916771225199999832619194206999993280049754699999932243412215399999619302643353999996Line Y152535455565758520227753952093934275999999439743148759999993436110962799999730877278785999995251326721539999961973557215399999618869714553999996
Note Waterfall is prepared based on the Cash Flow statement as it stands when the quarterly is ready for release Changes may occur between this version and the final version of the cash flow in the management accounts
Cash amp Gold on Hand - FY2019 YTD
Ends
Jun-18OperationsDividendsMine developmentExplorationOther capexIncome taxOtherJun-19208802950000000021964535032372868BeforeBudgetMLW Sales QtyMLW Sales PriceMLW COGSGDW Sales QtyGDW Sales PriceGDW COGSRMT Sales QtyRMT Sales PriceRMT COGSGIC Mvmt AllActual208802950551887547543728714706913535437287137455930106372869339720992643728672822749263237286822830392632372868AfterBudgetMLW Sales QtyMLW Sales PriceMLW COGSGDW Sales QtyGDW Sales PriceGDW COGSRMT Sales QtyRMT Sales PriceRMT COGSGIC Mvmt AllActual55188754754372871470691353543728713745593010637286933972099264372867282274926323728682283039263237286821964535032372868Label Y
34308459754372871-81196194-96132052480000004-34838308420000002-57446066319999993-53971000-86585763803452487718643551128945054372871422625327303728735714014685372865310997959483728652552894263237286822397463832372868Line Y152535455565758520880295055188754754372871470691353543728713745593010637286933972099264372867282274926323728682283039263237286821964535032372868
Note Waterfall is prepared based on the Cash Flow statement as it stands when the quarterly is ready for release Changes may occur between this version and the final version of the cash flow in the management accounts
The FY21 key guidance elements are
Gold Production 355000 - 380000 ounces
C1 Cash Costs including royalties A$1030 - 1090 per ounce
All in Sustaining Cost A$1230 - 1300 per ounce
Growth Capital A$50 ndash 60 million1
Exploration A$35 million
McPhillamys A$15 million2
FY21 GUIDANCE
Regis is expecting a strong year of growth within the operations as production continues to lift in linewith the targeted growth profile heading to 400000oz pa from internal development optionsProduction rate is planned to lift above historic annual rate in the second half of the year
1 Growth Capital includes open pit and underground pre-production mining costs site infrastructure and camp expansion costs 2 McPhillamys spend for FY21 is a minimum of A$15m Regis will assess additional early long lead items and in the case of early approval of the Companyrsquos Development Application by the
Independent Planning Commission the expenditure on McPhillamys for FY21 could be approximately A$60m
9
For
per
sona
l use
onl
y
REVIEW OF FY202010
THE CURRENT BUSINESSrsquo PERFORMANCENet profit after tax of $200 million (FY19 $163 million) with a NPAT margin of 26 and ROE of 24
Dividends for FY2020 of 16 cents per share fully franked for a 41 grossed1 up yield
EBITDA of $394 million with strong EBITDA margin of 52
Cash and bullion of $2093 million2 as at 30 June 2020
Hedging reduced to ~399koz at end FY20 from approximately 452koz at end FY19 Deliveries into hedges increased to approximately 20000 ounces per quarter
1 Grossed up for 100 franking Annualised dividend yield of 16cps at a closing share price of $555 on 25 August 20202 Includes bullion on hand valued at $2576 per ounce
PROGRESSING FUTURE GROWTH
McPhillamys Development Application submitted and Responses to Submissions nearing completionTripled exploration tenure around Duketon Operations and increased Exploration budget by 32 to $35millionMoving to investment decision for Garden Well Underground Project For
per
sona
l use
onl
y
Additional Financial Information
For
per
sona
l use
onl
y
30 June 2020 30 June 2019$rsquo000 $rsquo000
Revenue 756657 654807Cost of goods sold (452011) (401970)Gross profit 304646 252837Other income (150) 4379
Investor and corporate costs (3408) (2521)Personnel costs (10062) (9360)Share-based payment expense (144) (1082)Occupancy costs (245) (1005)Other corporate administrative expenses (1052) (659)Exploration and evaluation written off (1686) (6729)Other (1215) (940)Finance costs (2024) (1447)Profit before income tax 284660 233473
Income tax expense (85143) (70323)Net profit 199517 163150
FY2020 ndash Profit amp Loss12
Earnings Per Share (cents per share) 3926 3218
For
per
sona
l use
onl
y
13
30 June 2020 30 June 2019$rsquo000 $rsquo000
Cash flows from operating activitiesReceipts from gold sales 755791 652450Payments to suppliers and employees (348923) (326680)Income tax paid (63792) (53971)Other receipts(payments) (63) 3686Net cash from operating activities 343013 275485Cash flows from investing activitiesAcquisition of plant and equipment (net) (51114) (56395)Payments for exploration and evaluation (37118) (34840)Payments for acquisition of exploration assets (21281) -Payments for mine properties under development (57307) (35632)Payments for mine properties (77524) (60500)Other receipts(payments) - 77Net cash used in investing activities (244344) (187290)Cash flows from financing activitiesProceeds from issue of shares 279 1697Payment of transaction costs (14) (65)Payment of lease liabilities (13894) (1052)Dividends paid (81309) (81196)Net cash used in financing activities (94938) (80616)Net increase(decrease) in cash and cash equivalents 3731 7579Cash and cash equivalents at 1 July 188697 181118Cash and cash equivalents at 30 June 192428 188697
FY2020 ndash Cash Flow StatementF
or p
erso
nal u
se o
nly
14 30 June 2020 30 June 2019$rsquo000 $rsquo000
Current assetsCash and cash equivalents 192428 188697Inventories 74430 56077Other current assets 10847 10141Total current assets 277705 254915Non-current assetsInventories 63503 55898Property plant and equipment 261676 242988Exploration and evaluation expenditure 230260 185748Mine properties under development 2188 44163Mine properties 275939 167713Right-of-use assets 38034 -Other 2572 2572Total non-current assets 874172 699082Total assets 1151877 953997Current liabilitiesTrade and other payables 74181 67613Income tax payable 7471 12224Lease Liabilities 15856 793Other 3994 3479Total current liabilities 101502 84109Non-current liabilitiesDeferred tax liabilities 117408 91305Provisions amp Lease liabilities 97886 62119Total non-current liabilities 215294 153424Total liabilities 316796 237533Net AssetsTotal Equity
835081835081
716464716464
FY2020 ndash Balance SheetF
or p
erso
nal u
se o
nly
ldquoSPOT DEFERREDrdquo ndash FLEXIBLE GOLD HEDGE BOOK (30 June 2020)
Regisrsquo hedge position reduced to ~399koz at an average of A$1614oz
Regis is currently actively managing the process of selling into thelowest price hedges and reduced its hedges by approximately 52000ounces in FY20
Regis has recently increased the rate at which it is delivering into itsmost out of the money hedges to 20000 ounces per quarter
Hedging Price Range Quantity (ozrsquos)
A$1400 - $1500 157000
A$1500 - $1600 15000
A$1600 - $1700 36000
A$1700 - $1800 131000
A$1800 - $1900 60000
15
Period Volume (ozrsquos)
Today ndash Dec 2020 600000
Jan 2021 ndash Dec 2021 400000
Jan 2022 ndash Dec 2022 200000
Jan 2023 ndash June 2023 100000
July 2023 Nil
Table 2 Current Hedging Volume LimitsTable 1 Hedging Volumes amp Price Ranges
2200
0
500
1000
1500
2000
2500
Gold Price
Ave spot priceRealised Price
2333
For
per
sona
l use
onl
y
FY 2020 FY2019
Physicals DNO DSO TOTAL TOTAL Variance
Ore mined (Mbcm) 136 280 416 428 -3
Waste mined (Mbcm) 681 1956 2637 2812 -6
Stripping ratio (wo) 50 70 63 66 -5
Ore mined (Mtonnes) 275 723 998 1014 -2
Ore milled (Mtonnes) 300 637 937 943 -1
Head grade (gt) 104 135 125 127 -2
Recovery () 923 940 935 940 -1
Gold production (ounces) 92184 259858 352042 363418 -3
FY2020 PHYSICALS16
For
per
sona
l use
onl
y
Further information Jim Beyer | Managing Director amp CEO+ 61 8 9442 2200
For
per
sona
l use
onl
y
| Values | Line X | Ends | Before | After | Line Y | Label Y | Y Label | CASH FLOWS FROM OPERATIONS | Category | Manual Adj | ||||||||||||||||||
| Jun-18 | 2088 | 15 | $2088m | 2088 | Receipts from gold sales | Operations | 652450151 | 652450151 | ||||||||||||||||||||
| Operations | 3431 | 25 | - | $2088m | $5519m | $5519m | $3803m | $3431m | Option premium income | Other | 1366000 | 1366000 | ||||||||||||||||
| Dividends | (812) | 35 | - | $5519m | $4707m | $4707m | $5113m | ($812m) | Other income | Other | - | - | ||||||||||||||||
| Mine development | (961) | 45 | - | $4707m | $3746m | $3746m | $4226m | ($961m) | Payments to suppliers and employees - DNO | Operations | (84224766) | (84224766) | ||||||||||||||||
| Exploration | (348) | 55 | - | $3746m | $3397m | $3397m | $3571m | ($348m) | Payments to suppliers and employees - DSO | Operations | (228404216) | (228404216) | ||||||||||||||||
| Other capex | (574) | 65 | - | $3397m | $2823m | $2823m | $3110m | ($574m) | Payments to suppliers and employees - CORP | Other | (14051447) | (14051447) | ||||||||||||||||
| Income tax | (540) | 75 | - | $2823m | $2283m | $2283m | $2553m | ($540m) | Interest received | Other | 2388192 | 2388192 | ||||||||||||||||
| Other | (87) | 85 | - | $2283m | $2196m | $2196m | $2240m | ($87m) | Income tax paid | Income tax | (53971000) | (53971000) | ||||||||||||||||
| Jun-19 | $2196m | Interest paid | Other | (85486) | (85486) | |||||||||||||||||||||||
| Proceeds from rental income | Other | 16500 | 16500 | |||||||||||||||||||||||||
| Net cash flows from(used in) operations | 275483928 | 275483928 | ||||||||||||||||||||||||||
| CASH FLOWS FROM INVESTING ACTIVITIES | ||||||||||||||||||||||||||||
| Payments for plant amp equipment | Other capex | (56425779) | (56425779) | |||||||||||||||||||||||||
| Payments for exploration amp evaluation - WA | Exploration | (24685627) | (24685627) | |||||||||||||||||||||||||
| Payments for exploration amp evaluation - NSW | Exploration | (10152682) | (10152682) | |||||||||||||||||||||||||
| Payments for development - TWL BNY DOG RMT | Mine development | (35632149) | (35632149) | |||||||||||||||||||||||||
| Payments for mine properties - DNO | Mine development | (4690352) | (4690352) | |||||||||||||||||||||||||
| Payments for mine properties - DSO | Mine development | (55809551) | (55809551) | |||||||||||||||||||||||||
| Payments for term deposits | Other | 77000 | 77000 | |||||||||||||||||||||||||
| Proceeds on disposal of term deposits | Other | (1708) | (1708) | |||||||||||||||||||||||||
| Payments for AFS investments | Other capex | - | ||||||||||||||||||||||||||
| Acquisition of exploration assets (net of cash) | Exploration | - | ||||||||||||||||||||||||||
| Proceeds on disposal of PampE | Other capex | 31346 | 31346 | |||||||||||||||||||||||||
| Net cash flows used in investing activities | (187289502) | (187289502) | ||||||||||||||||||||||||||
| CASH FLOWS FROM FINANCING ACTIVITIES | ||||||||||||||||||||||||||||
| Proceeds from equity raisings | - | |||||||||||||||||||||||||||
| Proceeds from exercise of options | Other | 1697500 | 1697500 | |||||||||||||||||||||||||
| Share issue costs | Other | (65127) | (65127) | |||||||||||||||||||||||||
| Dividends paid | Dividends | (81196194) | (81196194) | |||||||||||||||||||||||||
| Repayment of finance lease | Other capex | (1051633) | (1051633) | |||||||||||||||||||||||||
| Repayment of borrowings | - | |||||||||||||||||||||||||||
| Net cash flows from financing activities | (80615454) | (80615454) | ||||||||||||||||||||||||||
| Net increase(decrease) in cash amp equivalents | 7578972 | |||||||||||||||||||||||||||
| Cash amp bullion at the start of the period | 208802950 | |||||||||||||||||||||||||||
| Effects of exchange rate movements on cash | Operations | |||||||||||||||||||||||||||
| Movement in gold on hand | Operations | 3263429 | ||||||||||||||||||||||||||
| Cash amp bullion at the end of the period | 219645350 | |||||||||||||||||||||||||||
| Values | Line X | Ends | Before | After | Line Y | Label Y | Y Label | CASH FLOWS FROM OPERATIONS | Category | Manual Adj | ||||||||||||||||||
| Jun-18 | 2023 | 15 | $2023m | 2023 | Receipts from gold sales | Operations | 652450151 | 652450151 | ||||||||||||||||||||
| Operations | 3187 | 25 | - | $2023m | $5209m | $5209m | $3616m | $3187m | Option premium income | Other | 1366000 | 1366000 | ||||||||||||||||
| Dividends | (812) | 35 | - | $5209m | $4397m | $4397m | $4803m | ($812m) | Other income | Other | - | - | ||||||||||||||||
| Mine development | (961) | 45 | - | $4397m | $3436m | $3436m | $3917m | ($961m) | Payments to suppliers and employees - DNO | Operations | (84224766) | (84224766) | ||||||||||||||||
| Exploration | (348) | 55 | - | $3436m | $3088m | $3088m | $3262m | ($348m) | Payments to suppliers and employees - DSO | Operations | (228404216) | (228404216) | ||||||||||||||||
| Other capex | (574) | 65 | - | $3088m | $2513m | $2513m | $2800m | ($574m) | Payments to suppliers and employees - CORP | Other | (14051447) | (14051447) | ||||||||||||||||
| Income tax | (540) | 75 | - | $2513m | $1974m | $1974m | $2243m | ($540m) | Interest received | Other | 2388192 | 2388192 | ||||||||||||||||
| Other | (87) | 85 | - | $1974m | $1887m | $1887m | $1930m | ($87m) | Income tax paid | Income tax | (53971000) | (53971000) | ||||||||||||||||
| Jun-19 | $1887m | Interest paid | Other | (85486) | (85486) | |||||||||||||||||||||||
| Proceeds from rental income | Other | 16500 | 16500 | |||||||||||||||||||||||||
| Net cash flows from(used in) operations | 275483928 | 275483928 | ||||||||||||||||||||||||||
| CASH FLOWS FROM INVESTING ACTIVITIES | ||||||||||||||||||||||||||||
| Payments for plant amp equipment | Other capex | (56425779) | (56425779) | |||||||||||||||||||||||||
| Payments for exploration amp evaluation - WA | Exploration | (24685627) | (24685627) | |||||||||||||||||||||||||
| Payments for exploration amp evaluation - NSW | Exploration | (10152682) | (10152682) | |||||||||||||||||||||||||
| Payments for development - TWL BNY DOG RMT | Mine development | (35632149) | (35632149) | |||||||||||||||||||||||||
| Payments for mine properties - DNO | Mine development | (4690352) | (4690352) | |||||||||||||||||||||||||
| Payments for mine properties - DSO | Mine development | (55809551) | (55809551) | |||||||||||||||||||||||||
| Payments for term deposits | Other | 77000 | 77000 | |||||||||||||||||||||||||
| Proceeds on disposal of term deposits | Other | (1708) | (1708) | |||||||||||||||||||||||||
| Payments for AFS investments | Other capex | - | ||||||||||||||||||||||||||
| Acquisition of exploration assets (net of cash) | Exploration | - | ||||||||||||||||||||||||||
| Proceeds on disposal of PampE | Other capex | 31346 | 31346 | |||||||||||||||||||||||||
| Net cash flows used in investing activities | (187289502) | (187289502) | ||||||||||||||||||||||||||
| CASH FLOWS FROM FINANCING ACTIVITIES | ||||||||||||||||||||||||||||
| Proceeds from equity raisings | - | |||||||||||||||||||||||||||
| Proceeds from exercise of options | Other | 1697500 | 1697500 | |||||||||||||||||||||||||
| Share issue costs | Other | (65127) | (65127) | |||||||||||||||||||||||||
| Dividends paid | Dividends | (81196194) | (81196194) | |||||||||||||||||||||||||
| Repayment of finance lease | Other capex | (1051633) | (1051633) | |||||||||||||||||||||||||
| Repayment of borrowings | - | |||||||||||||||||||||||||||
| Net cash flows from financing activities | (80615454) | (80615454) | ||||||||||||||||||||||||||
| Net increase(decrease) in cash amp equivalents | 7578972 | |||||||||||||||||||||||||||
| Cash amp bullion at the start of the period | 202277539 | |||||||||||||||||||||||||||
| Effects of exchange rate movements on cash | Operations | |||||||||||||||||||||||||||
| Movement in gold on hand | Operations | (21159365) | ||||||||||||||||||||||||||
| 1764709 | Cash amp bullion at the end of the period | 188697146 | ||||||||||||||||||||||||||
| 89721 | ||||||||||||||||||||||||||||
| 369721 | 18267402 | |||||||||||||||||||||||||||
| 320732598 |
| Payments for Development | |||||||||||
| Pre-Production | MACA Invoice | Apr-19 | May-19 | Jun-19 | Q4 Total | ||||||
| DOG | Mar-19 | - 0 | 2627659 | - 0 | 2627659 | ||||||
| DOG | Apr-19 | - 0 | - 0 | 1003666 | 1003666 | ||||||
| DOG | - 0 | - 0 | - 0 | ||||||||
| - 0 | 2627659 | 1003666 | 3631325 | ||||||||
| RMT Underground | Apr-19 | May-19 | Jun-19 | Q4 Total | |||||||
| RMT UG | Mar-19 | 2468107 | - 0 | - 0 | 2468107 | ||||||
| RMT UG | Apr-19 | - 0 | 1518068 | - 0 | 1518068 | ||||||
| RMT UG | May-19 | - 0 | - 0 | 2151172 | 2151172 | ||||||
| Total | 2468107 | 1518068 | 2151172 | 6137346 | |||||||
| Payments for mine properties - DSO | |||||||||||
| Pre-Strip | MACA Invoice | Apr-19 | May-19 | Jun-19 | Q4 Total | ||||||
| ERL | Feb-19 | 683602 | 68360169 | ||||||||
| TWL | Feb-19 | 3909250 | 390925035 | ||||||||
| ERL | Mar-19 | 392619 | 39261934 | ||||||||
| TWL | Mar-19 | 4508648 | 450864805 | ||||||||
| ERL | Apr-19 | 21545847 | 21545847 | ||||||||
| TWL | Apr-19 | 330090393 | 330090393 | ||||||||
| RMT | Mar-19 | 2531 | 253117 | ||||||||
| RMT | Apr-19 | 1120185 | 112018483 | ||||||||
| RMT | May-19 | 45893944 | 45893944 | ||||||||
| Total - ERL | 683602 | 392619 | 215458 | 129167950 | |||||||
| Total - RMT | 2531 | 1120185 | 458939 | 158165544 | |||||||
| Total - TWL | 3909250 | 4508648 | 3300904 | 1171880233 | |||||||
| Total | 4595383 | 6021452 | 3975302 | 1459213727 | |||||||
| Deferred Costs | Mar-19 | Apr-19 | May-19 | Q4 Total | |||||||
| GDW | 1317665 | 1876997 | 1574726 | 4769388 | |||||||
| ERL | 45300 | - 33082 | 1052986 | 1065205 | |||||||
| RMT | - 0 | ||||||||||
| Total | 1362965 | 1843916 | 2627712 | 5834592 | |||||||
| Total by Pit | Apr-19 | May-19 | Jun-19 | Q4 Total | |||||||
| GDW | Total - GDW | 1317665 | 1876997 | 1574726 | 4769388 | ||||||
| ERL | Total - ERL | 728902 | 359538 | 1268444 | 2356884 | ||||||
| TWL | Total - TWL | 3909250 | 4508648 | 3300904 | 11718802 | ||||||
| RMT | Total - RMT | 2531 | 1120185 | 458939 | 1581655 | ||||||
| Total - DSO | 5958348 | 7865368 | 6603013 | 20426730 | |||||||
| Values | Line X | Ends | Before | After | Line Y | Label Y | Y Label | CASH FLOWS FROM OPERATIONS | Category | Statutory Adj | ||||||||||||||||||
| June 2019 | 205 | 2 | $205m | 205 | Receipts from gold sales | Operations | 755790612 | 755790612 | ||||||||||||||||||||
| Operations | 424 | 3 | - | $205m | $629m | $629m | $417m | $424m | Option premium income | Other | - | - | ||||||||||||||||
| Mine development | (135) | 4 | - | $629m | $494m | $494m | $562m | ($135m) | Other income | Other | 34894 | 34894 | ||||||||||||||||
| Exploration | (37) | 5 | - | $494m | $457m | $457m | $476m | ($37m) | Payments to suppliers and employees - DNO | Operations | (99376203) | (99376203) | ||||||||||||||||
| Other capex | (65) | 6 | - | $457m | $392m | $392m | $425m | ($65m) | Payments to suppliers and employees - DSO | Operations | (232858286) | (232858286) | ||||||||||||||||
| Other | (16) | 7 | - | $392m | $376m | $376m | $384m | ($16m) | Payments to suppliers and employees - CORP | Other | (16688243) | (16688243) | ||||||||||||||||
| 8 | $376m | $376m | Interest received | Other | 1007324 | 1007324 | ||||||||||||||||||||||
| Income tax | (64) | 9 | - | $376m | $312m | $312m | $344m | ($64m) | GIC Inventory Mvmt | GIC Mvmt | - | - | ||||||||||||||||
| DKM Acquisition | (21) | 10 | - | $312m | $291m | $291m | $301m | ($21m) | Income tax paid | Income tax | (63792406) | (63792406) | ||||||||||||||||
| Dividends | (81) | 11 | - | $291m | $209m | $209m | $250m | ($81m) | Interest paid | Other | (1104724) | (1104724) | ||||||||||||||||
| June 2020 | $209m | GIC Inventory Mvmt | GIC Mvmt | - | - | |||||||||||||||||||||||
| Net cash flows from(used in) operations | 343012969 | 343012969 | ||||||||||||||||||||||||||
| CASH FLOWS FROM INVESTING ACTIVITIES | ||||||||||||||||||||||||||||
| Payments for plant amp equipment | Other capex | (51134992) | (51134992) | |||||||||||||||||||||||||
| Payments for exploration amp evaluation - WA | Exploration | (27398818) | (27398818) | |||||||||||||||||||||||||
| Payments for exploration amp evaluation - NSW | Exploration | (9718696) | (9718696) | |||||||||||||||||||||||||
| Payments for development | Mine development | (57306547) | (57306547) | |||||||||||||||||||||||||
| Payments for mine properties - DNO | Mine development | (3078067) | (3078067) | |||||||||||||||||||||||||
| Payments for mine properties - DSO | Mine development | (74445922) | (74445922) | |||||||||||||||||||||||||
| Payments for termsecurity deposits | Other | (1221) | (1221) | |||||||||||||||||||||||||
| Proceeds on disposal of term deposits | Other | - | ||||||||||||||||||||||||||
| Payments for WALs | Other capex | - | ||||||||||||||||||||||||||
| Acquisition of exploration assets (net of cash) | DKM Acquisition | (21281415) | (21281415) | |||||||||||||||||||||||||
| Proceeds on disposal of PampE | Other capex | 21277 | 21277 | |||||||||||||||||||||||||
| Net cash flows used in investing activities | (244344402) | (244344402) | ||||||||||||||||||||||||||
| CASH FLOWS FROM FINANCING ACTIVITIES | ||||||||||||||||||||||||||||
| Proceeds from equity raisings | - | - | ||||||||||||||||||||||||||
| Proceeds from exercise of options | Other | 279000 | 279000 | |||||||||||||||||||||||||
| Share issue costs | Other | (14386) | (14386) | |||||||||||||||||||||||||
| Dividends paid | Dividends | (81308874) | (81308874) | |||||||||||||||||||||||||
| Repayment of finance lease | Other capex | (13893955) | (13893955) | |||||||||||||||||||||||||
| Repayment of borrowings | Operations | - | - | |||||||||||||||||||||||||
| Net cash flows from financing activities | (94938215) | (94938215) | ||||||||||||||||||||||||||
| Net increase(decrease) in cash amp equivalents | 3730352 | 3730352 | ||||||||||||||||||||||||||
| Cash amp bullion at the start of the period | 205165482 | Elisha Civil Elisha CivilDifference between bullion for quarterly vs accounts Adjusted agaisnt mvmt in gold on hand | 205165482 | |||||||||||||||||||||||||
| Effects of exchange rate movements on cash | Operations | - | ||||||||||||||||||||||||||
| Movement in gold on hand | Operations | 400748 | - | 400748 | ||||||||||||||||||||||||
| Cash amp bullion at the end of the period | 209296582 | 209296582 | ||||||||||||||||||||||||||
| GOH Cost for Accounts revalued to Selling Price for Quarterly | Cost | |||||||||||||||||||||||||||
| At 30-Jun | Oz | $oz | $ | |||||||||||||||||||||||||
| MLW | - | |||||||||||||||||||||||||||
| GDW | - | |||||||||||||||||||||||||||
| RMT | - | |||||||||||||||||||||||||||
| - | - | |||||||||||||||||||||||||||
| Values | Line X | Ends | Before | After | Line Y | Label Y | Y Label | CASH FLOWS FROM OPERATIONS | Category | Manual Adj | Apr-20 | May-20 | Jun-20 | |||||||||||||||||||
| Q3 FY20 | 1688 | 15 | $1688m | 1688 | Receipts from gold sales | Operations | 239209941 | 61534907 | 61116192 | 116558842 | ||||||||||||||||||||||
| Operations | 1089 | 25 | - | $1688m | $2777m | $2777m | $2233m | $1089m | Option premium income | Other | - | - | - | - | ||||||||||||||||||
| Capitalised Mining | (289) | 35 | - | $2777m | $2488m | $2488m | $2632m | ($289m) | Other income | Other | 22508 | 17836 | 2280 | 2392 | ||||||||||||||||||
| Exploration | (108) | 45 | - | $2488m | $2380m | $2380m | $2434m | ($108m) | Payments to suppliers and employees - DNO | Operations | (22933926) | (11538320) | (6158155) | (5237451) | ||||||||||||||||||
| Other capex | (93) | 55 | - | $2380m | $2286m | $2286m | $2333m | ($93m) | Payments to suppliers and employees - DSO | Operations | (72606256) | (31657306) | (16512050) | (24436900) | ||||||||||||||||||
| Other | (42) | 65 | - | $2286m | $2244m | $2244m | $2265m | ($42m) | Payments to suppliers and employees - CORP | Other | (4285083) | (1925232) | (753452) | (1606399) | ||||||||||||||||||
| Q4 FY20 | 75 | $2244m | ERRORNA | ERRORNA | $2244m | ERRORNA | Interest received | Other | 97155 | 44231 | 27040 | 25884 | ||||||||||||||||||||
| Income tax | (151) | 85 | - | $2244m | $2093m | $2093m | $2169m | ($151m) | Income tax paid | Income tax | (15130839) | (5547601) | (4808025) | (4775213) | ||||||||||||||||||
| Q4 FY20 | $2093m | Interest paid | Other | (42349) | (7863) | (7572) | (26914) | |||||||||||||||||||||||||
| - | ||||||||||||||||||||||||||||||||
| Net cash flows from(used in) operations | 124331151 | 10920652 | 32906258 | 80504241 | ||||||||||||||||||||||||||||
| CASH FLOWS FROM INVESTING ACTIVITIES | ||||||||||||||||||||||||||||||||
| Payments for plant amp equipment | Other capex | (9049407) | (3741077) | (3448433) | (1859897) | |||||||||||||||||||||||||||
| Payments for exploration amp evaluation - WA | Exploration | (7076164) | (1802844) | (3416589) | (1856731) | |||||||||||||||||||||||||||
| Payments for exploration amp evaluation - NSW | Exploration | (2454965) | (1000956) | (521105) | (932904) | |||||||||||||||||||||||||||
| Payments for development | Capitalised Mining | (29316090) | 1457447 | (6942071) | (23831466) | |||||||||||||||||||||||||||
| Payments for mine properties - DNO | Capitalised Mining | (1222223) | 106895 | (375908) | (953210) | |||||||||||||||||||||||||||
| Payments for mine properties - DSO | Capitalised Mining | 1607658 | (19271552) | (8669156) | 29548366 | |||||||||||||||||||||||||||
| Payments for term deposits | Other | (244) | - | (244) | - | |||||||||||||||||||||||||||
| Proceeds on disposal of term deposits | Other | - | - | - | - | |||||||||||||||||||||||||||
| Payments for WALs | Other capex | - | - | - | - | |||||||||||||||||||||||||||
| Acquisition of exploration assets (net of cash) | Exploration | (1281415) | (1281415) | - | - | |||||||||||||||||||||||||||
| Proceeds on disposal of PampE | Other capex | 67271 | 62726 | - | 4545 | |||||||||||||||||||||||||||
| - | ||||||||||||||||||||||||||||||||
| Net cash flows used in investing activities | (48725579) | (25470776) | (23373506) | 118703 | ||||||||||||||||||||||||||||
| CASH FLOWS FROM FINANCING ACTIVITIES | ||||||||||||||||||||||||||||||||
| Proceeds from equity raisings | - | |||||||||||||||||||||||||||||||
| Proceeds from exercise of options | - | |||||||||||||||||||||||||||||||
| Share issue costs | - | - | - | - | ||||||||||||||||||||||||||||
| Dividend paid | Dividends | - | - | - | - | |||||||||||||||||||||||||||
| Repayment of finance lease | Other capex | (362247) | (96615) | (96906) | (168726) | |||||||||||||||||||||||||||
| Repayment of borrowings | - | |||||||||||||||||||||||||||||||
| Net cash flows from financing activities | (362247) | (96615) | (96906) | (168726) | ||||||||||||||||||||||||||||
| Net increase(decrease) in cash amp equivalents | 75243325 | (14646739) | 9435846 | 80454218 | ||||||||||||||||||||||||||||
| Cash amp bullion at the start of the period | 168792961 | |||||||||||||||||||||||||||||||
| Effects of exchange rate movements on cash | Operations | - | ||||||||||||||||||||||||||||||
| Movement in gold on hand | Operations | (34751541) | 11380540 | (629847) | (45502234) | |||||||||||||||||||||||||||
| Cash amp bullion at the end of the period | 209284745 | (3266199) | 8805999 | 34951984 | ||||||||||||||||||||||||||||
| GOH Cost for Accounts revalued to Selling Price for Quarterly | Cost | Sales | ||||||||||||||||||||||||||||||
| At 30-Jun | Oz | $oz | $ | $oz | $ | |||||||||||||||||||||||||||
| MLW | 932746 | 1551 | 1446431 | 2576 | 2403015 | |||||||||||||||||||||||||||
| GDW | 3641826 | 1181 | 4302218 | 2576 | 9382364 | |||||||||||||||||||||||||||
| RMT | 1973258 | 1445 | 2851935 | 2576 | 5083665 | |||||||||||||||||||||||||||
| 6547830 | 8600584 | 16869043 |
| Values | Line X | Ends | Before | After | Line Y | Label Y | Y Label | CASH FLOWS FROM OPERATIONS | Category | Manual Adj | Apr-20 | May-20 | Jun-20 | |||||||||||||||||||
| Q3 FY20 | 1688 | 15 | $1688m | 1688 | Receipts from gold sales | Operations | 239209941 | 61534907 | 61116192 | 116558842 | ||||||||||||||||||||||
| Operations | 1089 | 25 | - | $1688m | $2777m | $2777m | $2233m | $1089m | Option premium income | Other | - | - | - | - | ||||||||||||||||||
| Capitalised Mining | (289) | 35 | - | $2777m | $2488m | $2488m | $2632m | ($289m) | Other income | Other | 22508 | 17836 | 2280 | 2392 | ||||||||||||||||||
| Exploration | (108) | 45 | - | $2488m | $2380m | $2380m | $2434m | ($108m) | Payments to suppliers and employees - DNO | Operations | (22933926) | (11538320) | (6158155) | (5237451) | ||||||||||||||||||
| Other capex | (93) | 55 | - | $2380m | $2286m | $2286m | $2333m | ($93m) | Payments to suppliers and employees - DSO | Operations | (72606256) | (31657306) | (16512050) | (24436900) | ||||||||||||||||||
| Income tax | (151) | 65 | - | $2286m | $2135m | $2135m | $2211m | ($151m) | Payments to suppliers and employees - CORP | Other | (4285083) | (1925232) | (753452) | (1606399) | ||||||||||||||||||
| Other | (42) | 75 | - | $2135m | $2093m | $2093m | $2114m | ($42m) | Interest received | Other | 97155 | 44231 | 27040 | 25884 | ||||||||||||||||||
| Q4 FY20 | $2093m | Income tax paid | Income tax | (15130839) | (5547601) | (4808025) | (4775213) | |||||||||||||||||||||||||
| Interest paid | Other | (42349) | (7863) | (7572) | (26914) | |||||||||||||||||||||||||||
| - | ||||||||||||||||||||||||||||||||
| Net cash flows from(used in) operations | 124331151 | 10920652 | 32906258 | 80504241 | ||||||||||||||||||||||||||||
| CASH FLOWS FROM INVESTING ACTIVITIES | ||||||||||||||||||||||||||||||||
| Payments for plant amp equipment | Other capex | (9049407) | (3741077) | (3448433) | (1859897) | |||||||||||||||||||||||||||
| Payments for exploration amp evaluation - WA | Exploration | (7076164) | (1802844) | (3416589) | (1856731) | |||||||||||||||||||||||||||
| Payments for exploration amp evaluation - NSW | Exploration | (2454965) | (1000956) | (521105) | (932904) | |||||||||||||||||||||||||||
| Payments for development | Capitalised Mining | (29316090) | 1457447 | (6942071) | (23831466) | |||||||||||||||||||||||||||
| Payments for mine properties - DNO | Capitalised Mining | (1222223) | 106895 | (375908) | (953210) | |||||||||||||||||||||||||||
| Payments for mine properties - DSO | Capitalised Mining | 1607658 | (19271552) | (8669156) | 29548366 | |||||||||||||||||||||||||||
| Payments for term deposits | Other | (244) | - | (244) | - | |||||||||||||||||||||||||||
| Proceeds on disposal of term deposits | Other | - | - | - | - | |||||||||||||||||||||||||||
| Payments for WALs | Other capex | - | - | - | - | |||||||||||||||||||||||||||
| Acquisition of exploration assets (net of cash) | Exploration | (1281415) | (1281415) | - | - | |||||||||||||||||||||||||||
| Proceeds on disposal of PampE | Other capex | 67271 | 62726 | - | 4545 | |||||||||||||||||||||||||||
| - | ||||||||||||||||||||||||||||||||
| Net cash flows used in investing activities | (48725579) | (25470776) | (23373506) | 118703 | ||||||||||||||||||||||||||||
| CASH FLOWS FROM FINANCING ACTIVITIES | ||||||||||||||||||||||||||||||||
| Proceeds from equity raisings | - | |||||||||||||||||||||||||||||||
| Proceeds from exercise of options | - | |||||||||||||||||||||||||||||||
| Share issue costs | - | - | - | - | ||||||||||||||||||||||||||||
| Dividend paid | Dividends | - | - | - | - | |||||||||||||||||||||||||||
| Repayment of finance lease | Other capex | (362247) | (96615) | (96906) | (168726) | |||||||||||||||||||||||||||
| Repayment of borrowings | - | |||||||||||||||||||||||||||||||
| Net cash flows from financing activities | (362247) | (96615) | (96906) | (168726) | ||||||||||||||||||||||||||||
| Net increase(decrease) in cash amp equivalents | 75243325 | (14646739) | 9435846 | 80454218 | ||||||||||||||||||||||||||||
| Cash amp bullion at the start of the period | 168792961 | |||||||||||||||||||||||||||||||
| Effects of exchange rate movements on cash | Operations | - | ||||||||||||||||||||||||||||||
| Movement in gold on hand | Operations | (34751541) | 11380540 | (629847) | (45502234) | |||||||||||||||||||||||||||
| Cash amp bullion at the end of the period | 209284745 | (3266199) | 8805999 | 34951984 | ||||||||||||||||||||||||||||
| GOH Cost for Accounts revalued to Selling Price for Quarterly | Cost | Sales | ||||||||||||||||||||||||||||||
| At 30-Jun | Oz | $oz | $ | $oz | $ | |||||||||||||||||||||||||||
| MLW | 932746 | 1551 | 1446431 | 2576 | 2403015 | |||||||||||||||||||||||||||
| GDW | 3641826 | 1181 | 4302218 | 2576 | 9382364 | |||||||||||||||||||||||||||
| RMT | 1973258 | 1445 | 2851935 | 2576 | 5083665 | |||||||||||||||||||||||||||
| 6547830 | 8600584 | 16869043 |
| Values | Line X | Ends | Before | After | Line Y | Label Y | Y Label | CASH FLOWS FROM OPERATIONS | Category | Manual Adj | Jan-20 | Feb-20 | Mar-20 | |||||||||||||||||||
| Q2 FY20 | 1688 | 15 | $1688m | 1688 | Receipts from gold sales | Operations | 160623035 | 26412330 | 63222938 | 70987767 | ||||||||||||||||||||||
| Operations | 1074 | 25 | - | $1688m | $2762m | $2762m | $2225m | $1074m | Option premium income | Other | - | - | - | - | ||||||||||||||||||
| Capitalised Mining | (300) | 35 | - | $2762m | $2461m | $2461m | $2612m | ($300m) | Other income | Other | 53843 | 17862 | 16362 | 19619 | ||||||||||||||||||
| Exploration | (77) | 45 | - | $2461m | $2384m | $2384m | $2423m | ($77m) | Payments to suppliers and employees - DNO | Operations | (27888576) | (14390523) | (5596867) | (7901186) | ||||||||||||||||||
| Other capex | (121) | 55 | - | $2384m | $2263m | $2263m | $2324m | ($121m) | Payments to suppliers and employees - DSO | Operations | (67150690) | (36688331) | (16219313) | (14243047) | ||||||||||||||||||
| Other | (13) | 65 | - | $2263m | $2251m | $2251m | $2257m | ($13m) | Payments to suppliers and employees - CORP | Other | (1537032) | 1079078 | (895045) | (1721065) | ||||||||||||||||||
| Q3 FY20 | 75 | $2251m | ERRORNA | ERRORNA | $2251m | ERRORNA | Interest received | Other | 244942 | 75732 | 94076 | 75134 | ||||||||||||||||||||
| Income tax | (156) | 85 | - | $2251m | $2094m | $2094m | $2173m | ($156m) | Income tax paid | Income tax | (15627450) | (8613666) | (2070215) | (4943569) | ||||||||||||||||||
| Dividends | (407) | 95 | - | $2094m | $1688m | $1688m | $1891m | ($407m) | Interest paid | Other | (25320) | (8728) | (8440) | (8152) | ||||||||||||||||||
| Q3 FY20 | $1688m | GIC Inventory Mvmt | GIC Mvmt | - | ||||||||||||||||||||||||||||
| Net cash flows from(used in) operations | 48692752 | (32116246) | 38543496 | 42265502 | ||||||||||||||||||||||||||||
| CASH FLOWS FROM INVESTING ACTIVITIES | ||||||||||||||||||||||||||||||||
| Payments for plant amp equipment | Other capex | (11755002) | (4822830) | (3794308) | (3137864) | |||||||||||||||||||||||||||
| Payments for exploration amp evaluation - WA | Exploration | (5925264) | (1401349) | (1807101) | (2716814) | |||||||||||||||||||||||||||
| Payments for exploration amp evaluation - NSW | Exploration | (1785388) | (516065) | (477680) | (791643) | |||||||||||||||||||||||||||
| Payments for development | Capitalised Mining | (18120061) | (6637683) | (7888434) | (3593944) | |||||||||||||||||||||||||||
| Payments for mine properties - DNO | Capitalised Mining | 682043 | 125306 | (224267) | 781004 | |||||||||||||||||||||||||||
| Payments for mine properties - DSO | Capitalised Mining | (12601334) | (5605382) | (6995952) | - | |||||||||||||||||||||||||||
| Payments for termsecurity deposits | Other | (283) | - | (283) | - | |||||||||||||||||||||||||||
| Proceeds on disposal of term deposits | Other | - | - | - | - | |||||||||||||||||||||||||||
| Payments for WALs | Other capex | - | - | - | - | |||||||||||||||||||||||||||
| Acquisition of exploration assets (net of cash) | DKM Acquisition | - | - | - | - | |||||||||||||||||||||||||||
| Proceeds on disposal of PampE | Other capex | (46908) | - | (46908) | - | |||||||||||||||||||||||||||
| Net cash flows used in investing activities | (49552197) | (18858003) | (21234933) | (9459261) | ||||||||||||||||||||||||||||
| CASH FLOWS FROM FINANCING ACTIVITIES | ||||||||||||||||||||||||||||||||
| Proceeds from equity raisings | - | - | - | - | ||||||||||||||||||||||||||||
| Proceeds from exercise of options | Other | - | - | - | - | |||||||||||||||||||||||||||
| Share issue costs | Other | - | - | - | - | |||||||||||||||||||||||||||
| Dividends paid | Dividends | (40654437) | - | - | (40654437) | |||||||||||||||||||||||||||
| Repayment of finance lease | Other capex | (288112) | (95749) | (96037) | (96326) | |||||||||||||||||||||||||||
| Repayment of borrowings | - | - | - | - | ||||||||||||||||||||||||||||
| Net cash flows from financing activities | (40942549) | (95749) | (96037) | (40750763) | ||||||||||||||||||||||||||||
| Net increase(decrease) in cash amp equivalents | (41801994) | (51069998) | 17212526 | (7944522) | ||||||||||||||||||||||||||||
| Cash amp bullion at the start of the period | 168811968 | Elisha Civil Elisha CivilDifference between bullion for quarterly vs accounts Adjusted agaisnt mvmt in gold on hand | 168811968 | 155761070 | 165924457 | |||||||||||||||||||||||||||
| Effects of exchange rate movements on cash | Operations | - | ||||||||||||||||||||||||||||||
| Movement in gold on hand | Operations | 41782986 | - | 38019099 | (7049139) | 10813026 | ||||||||||||||||||||||||||
| Cash amp bullion at the end of the period | 168792961 | 155761070 | 165924457 | 168792961 | ||||||||||||||||||||||||||||
| GOH Cost for Accounts revalued to Selling Price for Quarterly | Cost | Sales | ||||||||||||||||||||||||||||||
| At 31-Mar | Oz | $oz | $ | $oz | $ | |||||||||||||||||||||||||||
| MLW | 4427350 | 1027 | 4545234 | 2606 | 11535846 | |||||||||||||||||||||||||||
| GDW | 10428048 | 1155 | 12044939 | 2606 | 27171187 | |||||||||||||||||||||||||||
| RMT | 4956097 | 1159 | 5743676 | 2606 | 12913542 | |||||||||||||||||||||||||||
| 19811495 | 22333849 | 51620575 | ||||||||||||||||||||||||||||||
| Values | Line X | Ends | Before | After | Line Y | Label Y | Y Label | CASH FLOWS FROM OPERATIONS | Category | Manual Adj | Jan-20 | Feb-20 | Mar-20 | |||||||||||||||||||
| Q2 FY20 | 1688 | 15 | $1688m | 1688 | Receipts from gold sales | Operations | 160623035 | 26412330 | 63222938 | 70987767 | ||||||||||||||||||||||
| Operations | 1074 | 25 | - | $1688m | $2762m | $2762m | $2225m | $1074m | Option premium income | Other | - | - | - | - | ||||||||||||||||||
| Capitalised Mining | (300) | 35 | - | $2762m | $2461m | $2461m | $2612m | ($300m) | Other income | Other | 53843 | 17862 | 16362 | 19619 | ||||||||||||||||||
| Exploration | (77) | 45 | - | $2461m | $2384m | $2384m | $2423m | ($77m) | Payments to suppliers and employees - DNO | Operations | (27888576) | (14390523) | (5596867) | (7901186) | ||||||||||||||||||
| Other capex | (121) | 55 | - | $2384m | $2263m | $2263m | $2324m | ($121m) | Payments to suppliers and employees - DSO | Operations | (67150690) | (36688331) | (16219313) | (14243047) | ||||||||||||||||||
| Income tax | (156) | 65 | - | $2263m | $2107m | $2107m | $2185m | ($156m) | Payments to suppliers and employees - CORP | Other | (1537032) | 1079078 | (895045) | (1721065) | ||||||||||||||||||
| Other | (13) | 75 | - | $2107m | $2094m | $2094m | $2101m | ($13m) | Interest received | Other | 244942 | 75732 | 94076 | 75134 | ||||||||||||||||||
| Q3 FY20 | 85 | $2094m | ERRORNA | ERRORNA | $2094m | ERRORNA | Income tax paid | Income tax | (15627450) | (8613666) | (2070215) | (4943569) | ||||||||||||||||||||
| Dividends | (407) | 95 | - | $2094m | $1688m | $1688m | $1891m | ($407m) | Interest paid | Other | (25320) | (8728) | (8440) | (8152) | ||||||||||||||||||
| Q3 FY20 | $1688m | GIC Inventory Mvmt | GIC Mvmt | - | ||||||||||||||||||||||||||||
| Net cash flows from(used in) operations | 48692752 | (32116246) | 38543496 | 42265502 | ||||||||||||||||||||||||||||
| CASH FLOWS FROM INVESTING ACTIVITIES | ||||||||||||||||||||||||||||||||
| Payments for plant amp equipment | Other capex | (11755002) | (4822830) | (3794308) | (3137864) | |||||||||||||||||||||||||||
| Payments for exploration amp evaluation - WA | Exploration | (5925264) | (1401349) | (1807101) | (2716814) | |||||||||||||||||||||||||||
| Payments for exploration amp evaluation - NSW | Exploration | (1785388) | (516065) | (477680) | (791643) | |||||||||||||||||||||||||||
| Payments for development | Capitalised Mining | (18120061) | (6637683) | (7888434) | (3593944) | |||||||||||||||||||||||||||
| Payments for mine properties - DNO | Capitalised Mining | 682043 | 125306 | (224267) | 781004 | |||||||||||||||||||||||||||
| Payments for mine properties - DSO | Capitalised Mining | (12601334) | (5605382) | (6995952) | - | |||||||||||||||||||||||||||
| Payments for termsecurity deposits | Other | (283) | - | (283) | - | |||||||||||||||||||||||||||
| Proceeds on disposal of term deposits | Other | - | - | - | - | |||||||||||||||||||||||||||
| Payments for WALs | Other capex | - | - | - | - | |||||||||||||||||||||||||||
| Acquisition of exploration assets (net of cash) | DKM Acquisition | - | - | - | - | |||||||||||||||||||||||||||
| Proceeds on disposal of PampE | Other capex | (46908) | - | (46908) | - | |||||||||||||||||||||||||||
| Net cash flows used in investing activities | (49552197) | (18858003) | (21234933) | (9459261) | ||||||||||||||||||||||||||||
| CASH FLOWS FROM FINANCING ACTIVITIES | ||||||||||||||||||||||||||||||||
| Proceeds from equity raisings | - | - | - | - | ||||||||||||||||||||||||||||
| Proceeds from exercise of options | Other | - | - | - | - | |||||||||||||||||||||||||||
| Share issue costs | Other | - | - | - | - | |||||||||||||||||||||||||||
| Dividends paid | Dividends | (40654437) | - | - | (40654437) | |||||||||||||||||||||||||||
| Repayment of finance lease | Other capex | (288112) | (95749) | (96037) | (96326) | |||||||||||||||||||||||||||
| Repayment of borrowings | - | - | - | - | ||||||||||||||||||||||||||||
| Net cash flows from financing activities | (40942549) | (95749) | (96037) | (40750763) | ||||||||||||||||||||||||||||
| Net increase(decrease) in cash amp equivalents | (41801994) | (51069998) | 17212526 | (7944522) | ||||||||||||||||||||||||||||
| Cash amp bullion at the start of the period | 168811968 | Elisha Civil Elisha CivilDifference between bullion for quarterly vs accounts Adjusted agaisnt mvmt in gold on hand | 168811968 | 155761070 | 165924457 | |||||||||||||||||||||||||||
| Effects of exchange rate movements on cash | Operations | - | ||||||||||||||||||||||||||||||
| Movement in gold on hand | Operations | 41782986 | - | 38019099 | (7049139) | 10813026 | ||||||||||||||||||||||||||
| Cash amp bullion at the end of the period | 168792961 | 155761070 | 165924457 | 168792961 | ||||||||||||||||||||||||||||
| GOH Cost for Accounts revalued to Selling Price for Quarterly | Cost | Sales | ||||||||||||||||||||||||||||||
| At 31-Mar | Oz | $oz | $ | $oz | $ | |||||||||||||||||||||||||||
| MLW | 4427350 | 1027 | 4545234 | 2606 | 11535846 | |||||||||||||||||||||||||||
| GDW | 10428048 | 1155 | 12044939 | 2606 | 27171187 | |||||||||||||||||||||||||||
| RMT | 4956097 | 1159 | 5743676 | 2606 | 12913542 | |||||||||||||||||||||||||||
| 19811495 | 22333849 | 51620575 | ||||||||||||||||||||||||||||||
| Values | Line X | Ends | Before | After | Line Y | Label Y | Y Label | CASH FLOWS FROM OPERATIONS | Category | Statutory Adj | ||||||||||||||||||
| June 2019 | 2052 | 15 | $2052m | 2052 | Receipts from gold sales | Operations | 370796353 | 370796353 | ||||||||||||||||||||
| Operations | 1791 | 25 | - | $2052m | $3843m | $3843m | $2947m | $1791m | Option premium income | Other | - | - | ||||||||||||||||
| Mine development | (551) | 35 | - | $3843m | $3292m | $3292m | $3567m | ($551m) | Other income | Other | 437464 | 437464 | ||||||||||||||||
| Exploration | (199) | 45 | - | $3292m | $3093m | $3093m | $3192m | ($199m) | Payments to suppliers and employees - DNO | Operations | (48442870) | (48442870) | ||||||||||||||||
| Other capex | (359) | 55 | - | $3093m | $2734m | $2734m | $2913m | ($359m) | Payments to suppliers and employees - DSO | Operations | (131007320) | (131007320) | ||||||||||||||||
| Income tax | (330) | 65 | - | $2734m | $2403m | $2403m | $2568m | ($330m) | Payments to suppliers and employees - CORP | Other | (11556512) | (11556512) | ||||||||||||||||
| Other | (109) | 75 | - | $2403m | $2295m | $2295m | $2349m | ($109m) | Interest received | Other | 665227 | 665227 | ||||||||||||||||
| Cash and Bullion before Acquisitions amp Dividends | 85 | $2295m | ERRORNA | ERRORNA | $2295m | ERRORNA | GIC Inventory Mvmt | GIC Mvmt | - | - | ||||||||||||||||||
| DKM Acquisition | (200) | 95 | - | $2295m | $2095m | $2095m | $2195m | ($200m) | Income tax paid | Income tax | (33034117) | (33034117) | ||||||||||||||||
| Dividends | (407) | 105 | - | $2095m | $1688m | $1688m | $1891m | ($407m) | Interest paid | Other | (674443) | (674443) | ||||||||||||||||
| December 2019 | $1688m | GIC Inventory Mvmt | GIC Mvmt | - | - | |||||||||||||||||||||||
| Net cash flows from(used in) operations | 147183783 | 147183783 | ||||||||||||||||||||||||||
| CASH FLOWS FROM INVESTING ACTIVITIES | ||||||||||||||||||||||||||||
| Payments for plant amp equipment | Other capex | (35919500) | (35919500) | |||||||||||||||||||||||||
| Payments for exploration amp evaluation - WA | Exploration | (14393471) | (14393471) | |||||||||||||||||||||||||
| Payments for exploration amp evaluation - NSW | Exploration | (5477332) | (5477332) | |||||||||||||||||||||||||
| Payments for development | Mine development | (23173710) | (23173710) | |||||||||||||||||||||||||
| Payments for mine properties - DNO | Mine development | (2537890) | (2537890) | |||||||||||||||||||||||||
| Payments for mine properties - DSO | Mine development | (29394527) | (29394527) | |||||||||||||||||||||||||
| Payments for termsecurity deposits | Other | (694) | (694) | |||||||||||||||||||||||||
| Proceeds on disposal of term deposits | Other | - | - | |||||||||||||||||||||||||
| Payments for WALs | Other capex | - | - | |||||||||||||||||||||||||
| Acquisition of exploration assets (net of cash) | DKM Acquisition | (20000000) | (20000000) | |||||||||||||||||||||||||
| Proceeds on disposal of PampE | Other capex | 914 | 914 | |||||||||||||||||||||||||
| Net cash flows used in investing activities | (130896211) | (130896211) | ||||||||||||||||||||||||||
| CASH FLOWS FROM FINANCING ACTIVITIES | ||||||||||||||||||||||||||||
| Proceeds from equity raisings | - | - | ||||||||||||||||||||||||||
| Proceeds from exercise of options | Other | 279000 | 279000 | |||||||||||||||||||||||||
| Share issue costs | Other | (14386) | (14386) | |||||||||||||||||||||||||
| Dividends paid | Dividends | (40654437) | (40654437) | |||||||||||||||||||||||||
| Repayment of finance lease | Other capex | - | - | |||||||||||||||||||||||||
| Repayment of borrowings | Operations | (5620565) | (5620565) | |||||||||||||||||||||||||
| Net cash flows from financing activities | (46010388) | (46010388) | ||||||||||||||||||||||||||
| Net increase(decrease) in cash amp equivalents | (29722816) | (29722816) | ||||||||||||||||||||||||||
| Cash amp bullion at the start of the period | 205165482 | Elisha Civil Elisha CivilDifference between bullion for quarterly vs accounts Adjusted agaisnt mvmt in gold on hand | 205165482 | |||||||||||||||||||||||||
| Effects of exchange rate movements on cash | Operations | - | - | |||||||||||||||||||||||||
| Movement in gold on hand | Operations | (6630697) | - | (6630697) | ||||||||||||||||||||||||
| Cash amp bullion at the end of the period | 168811969 | 168811969 | ||||||||||||||||||||||||||
| GOH Cost for Accounts revalued to Selling Price for Quarterly | Cost | |||||||||||||||||||||||||||
| At 30-Jun | Oz | $oz | $ | |||||||||||||||||||||||||
| MLW | 2331195 | 1244 | 2901126 | |||||||||||||||||||||||||
| GDW | 3775510 | 1135 | 4286261 | |||||||||||||||||||||||||
| RMT | 1779190 | 1202 | 2137768 | |||||||||||||||||||||||||
| 7885895 | 9325154 | |||||||||||||||||||||||||||
| Values | Line X | Ends | Before | After | Line Y | Label Y | Y Label | CASH FLOWS FROM OPERATIONS | Category | Manual Adj | Jul-19 | Aug-19 | Sep-19 | Oct-19 | Nov-19 | Dec-19 | |||||||||||||||||||||||
| June 2019 | 2052 | 15 | $2052m | 2052 | Receipts from gold sales | Operations | 393628149 | 48733973 | 57888259 | 53259007 | 64607715 | 58641552 | 110497643 | ||||||||||||||||||||||||||
| Operations | 1825 | 25 | - | $2052m | $3877m | $3877m | $2964m | $1825m | Option premium income | Other | - | - | - | - | - | - | - | ||||||||||||||||||||||
| Mine development | (630) | 35 | - | $3877m | $3247m | $3247m | $3562m | ($630m) | Other income | Other | 529980 | 15362 | 16350 | 17382 | 17992 | 17599 | 445295 | ||||||||||||||||||||||
| Exploration | (206) | 45 | - | $3247m | $3041m | $3041m | $3144m | ($206m) | Payments to suppliers and employees - DNO | Operations | (55584856) | (18867571) | (5421615) | (5677647) | (10023851) | (7468076) | (8126096) | ||||||||||||||||||||||
| Other capex | (373) | 55 | - | $3041m | $2668m | $2668m | $2854m | ($373m) | Payments to suppliers and employees - DSO | Operations | (148915710) | (49555333) | (18307389) | (13961768) | (33056049) | (18400404) | (15634767) | ||||||||||||||||||||||
| Income tax | (285) | 65 | - | $2668m | $2383m | $2383m | $2526m | ($285m) | Payments to suppliers and employees - CORP | Other | (10277165) | 127934700 | (2387178) | (2286742) | (1477255) | (1202249) | (964042) | (1959699) | |||||||||||||||||||||
| Other | (89) | 75 | - | $2383m | $2295m | $2295m | $2339m | ($89m) | Interest received | Other | 665227 | 171509 | 149152 | 134191 | 87372 | 62835 | 60168 | ||||||||||||||||||||||
| December 2019 | 85 | $2295m | ERRORNA | ERRORNA | $2295m | ERRORNA | GIC Inventory Mvmt | GIC Mvmt | - | ||||||||||||||||||||||||||||||
| DKM Acquisition | (200) | 95 | - | $2295m | $2095m | $2095m | $2195m | ($200m) | Income tax paid | Income tax | (28461255) | (6214961) | (2525166) | (4519941) | (4155608) | (11045579) | - | ||||||||||||||||||||||
| Dividends | (407) | 105 | - | $2095m | $1688m | $1688m | $1891m | ($407m) | Interest paid | Other | (59440) | (6681) | (6391) | (6195) | (5997) | (5799) | (28377) | ||||||||||||||||||||||
| December 2019 | $1688m | GIC Inventory Mvmt | GIC Mvmt | - | |||||||||||||||||||||||||||||||||||
| Net cash flows from(used in) operations | 151524931 | (28110879) | 29506458 | 27767774 | 16269325 | 20838086 | 85254167 | ||||||||||||||||||||||||||||||||
| CASH FLOWS FROM INVESTING ACTIVITIES | |||||||||||||||||||||||||||||||||||||||
| Payments for plant amp equipment | Other capex | (36854389) | (10746245) | (4214487) | (5036392) | (8940874) | (2337548) | (5578843) | |||||||||||||||||||||||||||||||
| Payments for exploration amp evaluation - WA | Exploration | (15012294) | (1447005) | (2144467) | (3146413) | (2141208) | (2694944) | (3438257) | |||||||||||||||||||||||||||||||
| Payments for exploration amp evaluation - NSW | Exploration | (5575683) | (889004) | (1537672) | (985141) | (679178) | (561848) | (922840) | |||||||||||||||||||||||||||||||
| Payments for development | Mine development | (31072622) | (3407474) | (5400036) | (5465762) | (4926496) | (6438272) | (5434582) | |||||||||||||||||||||||||||||||
| Payments for mine properties - DNO | Mine development | (2537890) | 844308 | (139170) | (1108118) | (1243030) | (891880) | - | |||||||||||||||||||||||||||||||
| Payments for mine properties - DSO | Mine development | (29394527) | (8245160) | (6860356) | (797558) | (6936306) | (6184203) | (370944) | |||||||||||||||||||||||||||||||
| Payments for termsecurity deposits | Other | (694) | - | (363) | - | - | (331) | - | |||||||||||||||||||||||||||||||
| Proceeds on disposal of term deposits | Other | - | - | - | - | - | - | - | |||||||||||||||||||||||||||||||
| Payments for WALs | Other capex | - | - | - | - | - | - | - | |||||||||||||||||||||||||||||||
| Acquisition of exploration assets (net of cash) | DKM Acquisition | (20000000) | - | (20000000) | - | - | - | - | |||||||||||||||||||||||||||||||
| Proceeds on disposal of PampE | Other capex | 914 | - | - | - | - | 914 | - | |||||||||||||||||||||||||||||||
| Net cash flows used in investing activities | (140447186) | (23890581) | (40296551) | (16539384) | (24867092) | (19108112) | (15745466) | ||||||||||||||||||||||||||||||||
| CASH FLOWS FROM FINANCING ACTIVITIES | |||||||||||||||||||||||||||||||||||||||
| Proceeds from equity raisings | - | - | - | - | - | - | - | ||||||||||||||||||||||||||||||||
| Proceeds from exercise of options | Other | 279000 | 84000 | 195000 | - | - | - | - | |||||||||||||||||||||||||||||||
| Share issue costs | Other | (14386) | (10020) | (4366) | - | - | - | - | |||||||||||||||||||||||||||||||
| Dividends paid | Dividends | (40654437) | - | - | (40654437) | - | - | - | |||||||||||||||||||||||||||||||
| Repayment of finance lease | Other capex | (410738) | (97597) | (62234) | (62431) | (62627) | (62825) | (63024) | |||||||||||||||||||||||||||||||
| Repayment of borrowings | - | - | - | - | - | - | - | ||||||||||||||||||||||||||||||||
| Net cash flows from financing activities | (40800561) | (23617) | 128400 | (40716868) | (62627) | (62825) | (63024) | ||||||||||||||||||||||||||||||||
| Net increase(decrease) in cash amp equivalents | (29722816) | (52025077) | (10661693) | (29488478) | (8660394) | 1667149 | 69445677 | ||||||||||||||||||||||||||||||||
| Cash amp bullion at the start of the period | 205165482 | Elisha Civil Elisha CivilDifference between bullion for quarterly vs accounts Adjusted agaisnt mvmt in gold on hand | 205165482 | 176583719 | 165686211 | 176583719 | 171901281 | 175804668 | |||||||||||||||||||||||||||||||
| Effects of exchange rate movements on cash | Operations | - | |||||||||||||||||||||||||||||||||||||
| Movement in gold on hand | Operations | (6630697) | - | 23443314 | (235815) | 11215359 | 3977956 | 2236238 | (47267749) | ||||||||||||||||||||||||||||||
| Cash amp bullion at the end of the period | 168811968 | 176583719 | 165686211 | 147413092 | 171901281 | 175804668 | 197982595 | ||||||||||||||||||||||||||||||||
| GOH Cost for Accounts revalued to Selling Price for Quarterly | Cost | Sales | Sales | ||||||||||||||||||||||||||||||||||||
| At 30-Jun | Oz | $oz | $ | $oz | $ | $ | $oz | $ | |||||||||||||||||||||||||||||||
| MLW | 2331195 | 1244 | 2901126 | 1990 | 4639684 | 9234177798 | 2220 | 4418775 | |||||||||||||||||||||||||||||||
| GDW | 3775510 | 1135 | 4286261 | 1990 | 7514247 | 14955304304 | 2220 | 4418775 | |||||||||||||||||||||||||||||||
| RMT | 1779190 | 1202 | 2137768 | 1990 | 3541051 | 7047611545 | 2220 | 4418775 | |||||||||||||||||||||||||||||||
| 7885895 | 9325154 | 15694981 | 31237093647 | 13256326 | |||||||||||||||||||||||||||||||||||
| Values | Line X | Ends | Before | After | Line Y | Label Y | Y Label | CASH FLOWS FROM OPERATIONS | Category | Manual Adj | Jul-19 | Aug-19 | Sep-19 | Oct-19 | Nov-19 | Dec-19 | ||||||||||||||||||||||
| June 2019 | 2052 | 15 | $2052m | 2052 | Receipts from gold sales | Operations | 393628149 | 48733973 | 57888259 | 53259007 | 64607715 | 58641552 | 110497643 | |||||||||||||||||||||||||
| Operations | 1825 | 25 | - | $2052m | $3877m | $3877m | $2964m | $1825m | Option premium income | Other | - | - | - | - | - | - | - | |||||||||||||||||||||
| Dividends | (407) | 35 | - | $3877m | $3470m | $3470m | $3673m | ($407m) | Other income | Other | 529980 | 15362 | 16350 | 17382 | 17992 | 17599 | 445295 | |||||||||||||||||||||
| Mine development | (630) | 45 | - | $3470m | $2840m | $2840m | $3155m | ($630m) | Payments to suppliers and employees - DNO | Operations | (55584856) | (18867571) | (5421615) | (5677647) | (10023851) | (7468076) | (8126096) | |||||||||||||||||||||
| Exploration | (206) | 55 | - | $2840m | $2634m | $2634m | $2737m | ($206m) | Payments to suppliers and employees - DSO | Operations | (148915710) | (49555333) | (18307389) | (13961768) | (33056049) | (18400404) | (15634767) | |||||||||||||||||||||
| DKM Acquisition | (200) | 65 | - | $2634m | $2434m | $2434m | $2534m | ($200m) | Payments to suppliers and employees - CORP | Other | (10277165) | (2387178) | (2286742) | (1477255) | (1202249) | (964042) | (1959699) | |||||||||||||||||||||
| Other capex | (373) | 75 | - | $2434m | $2062m | $2062m | $2248m | ($373m) | Interest received | Other | 665227 | 171509 | 149152 | 134191 | 87372 | 62835 | 60168 | |||||||||||||||||||||
| Income tax | (285) | 85 | - | $2062m | $1777m | $1777m | $1919m | ($285m) | Income tax paid | Income tax | (28461255) | (6214961) | (2525166) | (4519941) | (4155608) | (11045579) | - | |||||||||||||||||||||
| Other | (89) | 95 | - | $1777m | $1688m | $1688m | $1733m | ($89m) | Interest paid | Other | (59440) | (6681) | (6391) | (6195) | (5997) | (5799) | (28377) | |||||||||||||||||||||
| December 2019 | $1688m | GIC Inventory Mvmt | GIC Mvmt | - | ||||||||||||||||||||||||||||||||||
| Net cash flows from(used in) operations | 151524931 | (28110879) | 29506458 | 27767774 | 16269325 | 20838086 | 85254167 | |||||||||||||||||||||||||||||||
| CASH FLOWS FROM INVESTING ACTIVITIES | ||||||||||||||||||||||||||||||||||||||
| Payments for plant amp equipment | Other capex | (36854389) | (10746245) | (4214487) | (5036392) | (8940874) | (2337548) | (5578843) | ||||||||||||||||||||||||||||||
| Payments for exploration amp evaluation - WA | Exploration | (15012294) | (1447005) | (2144467) | (3146413) | (2141208) | (2694944) | (3438257) | ||||||||||||||||||||||||||||||
| Payments for exploration amp evaluation - NSW | Exploration | (5575683) | (889004) | (1537672) | (985141) | (679178) | (561848) | (922840) | ||||||||||||||||||||||||||||||
| Payments for development | Mine development | (31072622) | (3407474) | (5400036) | (5465762) | (4926496) | (6438272) | (5434582) | ||||||||||||||||||||||||||||||
| Payments for mine properties - DNO | Mine development | (2537890) | 844308 | (139170) | (1108118) | (1243030) | (891880) | - | ||||||||||||||||||||||||||||||
| Payments for mine properties - DSO | Mine development | (29394527) | (8245160) | (6860356) | (797558) | (6936306) | (6184203) | (370944) | ||||||||||||||||||||||||||||||
| Payments for termsecurity deposits | Other | (694) | - | (363) | - | - | (331) | - | ||||||||||||||||||||||||||||||
| Proceeds on disposal of term deposits | Other | - | - | - | - | - | - | - | ||||||||||||||||||||||||||||||
| Payments for WALs | Other capex | - | - | - | - | - | - | - | ||||||||||||||||||||||||||||||
| Acquisition of exploration assets (net of cash) | DKM Acquisition | (20000000) | - | (20000000) | - | - | - | - | ||||||||||||||||||||||||||||||
| Proceeds on disposal of PampE | Other capex | 914 | - | - | - | - | 914 | - | ||||||||||||||||||||||||||||||
| Net cash flows used in investing activities | (140447186) | (23890581) | (40296551) | (16539384) | (24867092) | (19108112) | (15745466) | |||||||||||||||||||||||||||||||
| CASH FLOWS FROM FINANCING ACTIVITIES | ||||||||||||||||||||||||||||||||||||||
| Proceeds from equity raisings | - | - | - | - | - | - | - | |||||||||||||||||||||||||||||||
| Proceeds from exercise of options | Other | 279000 | 84000 | 195000 | - | - | - | - | ||||||||||||||||||||||||||||||
| Share issue costs | Other | (14386) | (10020) | (4366) | - | - | - | - | ||||||||||||||||||||||||||||||
| Dividends paid | Dividends | (40654437) | - | - | (40654437) | - | - | - | ||||||||||||||||||||||||||||||
| Repayment of finance lease | Other capex | (410738) | (97597) | (62234) | (62431) | (62627) | (62825) | (63024) | ||||||||||||||||||||||||||||||
| Repayment of borrowings | - | - | - | - | - | - | - | |||||||||||||||||||||||||||||||
| Net cash flows from financing activities | (40800561) | (23617) | 128400 | (40716868) | (62627) | (62825) | (63024) | |||||||||||||||||||||||||||||||
| Net increase(decrease) in cash amp equivalents | (29722816) | (52025077) | (10661693) | (29488478) | (8660394) | 1667149 | 69445677 | |||||||||||||||||||||||||||||||
| Cash amp bullion at the start of the period | 205165482 | Elisha Civil Elisha CivilDifference between bullion for quarterly vs accounts Adjusted agaisnt mvmt in gold on hand | 205165482 | 176583719 | 165686211 | 176583719 | 171901281 | 175804668 | ||||||||||||||||||||||||||||||
| Effects of exchange rate movements on cash | Operations | - | ||||||||||||||||||||||||||||||||||||
| Movement in gold on hand | Operations | (6630697) | - | 23443314 | (235815) | 11215359 | 3977956 | 2236238 | (47267749) | |||||||||||||||||||||||||||||
| Cash amp bullion at the end of the period | 168811968 | 176583719 | 165686211 | 147413092 | 171901281 | 175804668 | 197982595 | |||||||||||||||||||||||||||||||
| GOH Cost for Accounts revalued to Selling Price for Quarterly | Cost | Sales | Sales | |||||||||||||||||||||||||||||||||||
| At 30-Jun | Oz | $oz | $ | $oz | $ | $ | $oz | $ | ||||||||||||||||||||||||||||||
| MLW | 2331195 | 1244 | 2901126 | 1990 | 4639684 | 9234177798 | 2220 | 4418775 | ||||||||||||||||||||||||||||||
| GDW | 3775510 | 1135 | 4286261 | 1990 | 7514247 | 14955304304 | 2220 | 4418775 | ||||||||||||||||||||||||||||||
| RMT | 1779190 | 1202 | 2137768 | 1990 | 3541051 | 7047611545 | 2220 | 4418775 | ||||||||||||||||||||||||||||||
| 7885895 | 9325154 | 15694981 | 31237093647 | 13256326 | ||||||||||||||||||||||||||||||||||
| Values | Line X | Ends | Before | After | Line Y | Label Y | Y Label | CASH FLOWS FROM OPERATIONS | Category | Manual Adj | Jan-20 | Feb-20 | Mar-20 | |||||||||||||||||||
| Q2 FY19 | 1643 | 15 | $1643m | 1643 | Receipts from gold sales | Operations | 141168108 | 29410111 | 53532749 | 58225248 | ||||||||||||||||||||||
| Operations | 893 | 25 | - | $1643m | $2536m | $2536m | $2089m | $893m | Option premium income | Other | 1366000 | 1366000 | - | - | ||||||||||||||||||
| Dividends | (406) | 35 | - | $2536m | $2130m | $2130m | $2333m | ($406m) | Other income | Other | 50483 | 17780 | 16137 | 16566 | ||||||||||||||||||
| Mine development | (267) | 45 | - | $2130m | $1862m | $1862m | $1996m | ($267m) | Payments to suppliers and employees - DNO | Operations | (18868744) | (8394133) | (6571863) | (3902748) | ||||||||||||||||||
| Exploration | (67) | 55 | - | $1862m | $1796m | $1796m | $1829m | ($67m) | Payments to suppliers and employees - DSO | Operations | (59002550) | (31054273) | (14995797) | (12952479) | ||||||||||||||||||
| Other capex | (226) | 65 | - | $1796m | $1570m | $1570m | $1683m | ($226m) | Payments to suppliers and employees - CORP | Other | (3911562) | (2122227) | (654065) | (1135270) | ||||||||||||||||||
| Income tax | (112) | 75 | - | $1570m | $1458m | $1458m | $1514m | ($112m) | Interest received | Other | 614299 | 340374 | 84378 | 189547 | ||||||||||||||||||
| Other | (18) | 85 | - | $1458m | $1440m | $1440m | $1449m | ($18m) | Income tax paid | Income tax | (11220172) | (4704392) | (2330890) | (4184890) | ||||||||||||||||||
| Q3 FY19 | $1440m | Interest paid | Other | (10758) | (1127) | (1513) | (8118) | |||||||||||||||||||||||||
| Net cash flows from(used in) operations | 50185105 | (15141887) | 29079136 | 36247856 | ||||||||||||||||||||||||||||
| CASH FLOWS FROM INVESTING ACTIVITIES | ||||||||||||||||||||||||||||||||
| Payments for plant amp equipment | Other capex | (22287385) | (7475391) | (10556336) | (4255658) | |||||||||||||||||||||||||||
| Payments for exploration amp evaluation - WA | Exploration | (4530435) | (2083813) | (1008606) | (1438016) | |||||||||||||||||||||||||||
| Payments for exploration amp evaluation - NSW | Exploration | (2135047) | (637746) | (836498) | (660803) | |||||||||||||||||||||||||||
| Payments for development | Mine development | (8690080) | (342093) | (1689103) | (6658884) | |||||||||||||||||||||||||||
| Payments for mine properties - DNO | Mine development | 281159 | 0 | 396936 | (115777) | |||||||||||||||||||||||||||
| Payments for mine properties - DSO | Mine development | (18328789) | (10196278) | (9148806) | 1016295 | |||||||||||||||||||||||||||
| Payments for term deposits | Other | (443) | - | (443) | - | |||||||||||||||||||||||||||
| Proceeds on disposal of term deposits | Other | 77000 | 77000 | - | - | |||||||||||||||||||||||||||
| Payments for WALs | Other capex | - | - | - | - | |||||||||||||||||||||||||||
| Acquisition of exploration assets (net of cash) | Exploration | - | - | - | - | |||||||||||||||||||||||||||
| Proceeds on disposal of PampE | Other capex | - | - | - | - | |||||||||||||||||||||||||||
| - | ||||||||||||||||||||||||||||||||
| Net cash flows used in investing activities | (55614020) | (20658321) | (22842856) | (12112843) | ||||||||||||||||||||||||||||
| CASH FLOWS FROM FINANCING ACTIVITIES | ||||||||||||||||||||||||||||||||
| Proceeds from equity raisings | - | |||||||||||||||||||||||||||||||
| Proceeds from exercise of options | - | |||||||||||||||||||||||||||||||
| Share issue costs | (10812) | (5160) | (3768) | (1884) | ||||||||||||||||||||||||||||
| Dividend paid | Dividends | (40625957) | - | - | (40625957) | |||||||||||||||||||||||||||
| Repayment of finance lease | Other capex | (272361) | (70180) | (70367) | (131814) | |||||||||||||||||||||||||||
| Repayment of borrowings | - | |||||||||||||||||||||||||||||||
| Net cash flows from financing activities | (40909130) | (75340) | (74135) | (40759655) | ||||||||||||||||||||||||||||
| Net increase(decrease) in cash amp equivalents | (46338045) | (35875548) | 6162145 | (16624642) | ||||||||||||||||||||||||||||
| Cash amp bullion at the start of the period | 164250522 | 164250522 | 159897589 | 166588508 | ||||||||||||||||||||||||||||
| Effects of exchange rate movements on cash | Operations | - | ||||||||||||||||||||||||||||||
| Movement in gold on hand | Operations | 26046191 | - | 31522615 | 528774 | (6005198) | ||||||||||||||||||||||||||
| Cash amp bullion at the end of the period | 143958668 | 159897589 | 166588508 | 143958668 |
| Values | Line X | Ends | Before | After | Line Y | Label Y | Y Label | CASH FLOWS FROM OPERATIONS | Category | Manual Adj | Oct-19 | Nov-19 | Dec-19 | |||||||||||||||||||
| Q1 FY20 | 1474 | 15 | $1474m | 1474 | Receipts from gold sales | Operations | 233746910 | 64607715 | 58641552 | 110497643 | ||||||||||||||||||||||
| Operations | 1000 | 25 | - | $1474m | $2474m | $2474m | $1974m | $1000m | Option premium income | Other | - | - | - | - | ||||||||||||||||||
| Capitalised Mining | (324) | 35 | - | $2474m | $2150m | $2150m | $2312m | ($324m) | Other income | Other | 480886 | 17992 | 17599 | 445295 | ||||||||||||||||||
| Exploration | (104) | 45 | - | $2150m | $2045m | $2045m | $2098m | ($104m) | Payments to suppliers and employees - DNO | Operations | (25618023) | (10023851) | (7468076) | (8126096) | ||||||||||||||||||
| Other capex | (170) | 55 | - | $2045m | $1875m | $1875m | $1960m | ($170m) | Payments to suppliers and employees - DSO | Operations | (67091220) | (33056049) | (18400404) | (15634767) | ||||||||||||||||||
| Income tax | (152) | 65 | - | $1875m | $1723m | $1723m | $1799m | ($152m) | Payments to suppliers and employees - CORP | Other | (4125990) | (1202249) | (964042) | (1959699) | ||||||||||||||||||
| Other | (35) | 75 | - | $1723m | $1688m | $1688m | $1705m | ($35m) | Interest received | Other | 210375 | 87372 | 62835 | 60168 | ||||||||||||||||||
| Q2 FY20 | $1688m | Income tax paid | Income tax | (15201187) | (4155608) | (11045579) | - | |||||||||||||||||||||||||
| Interest paid | Other | (40173) | (5997) | (5799) | (28377) | |||||||||||||||||||||||||||
| GIC Inventory Mvmt | GIC Mvmt | - | ||||||||||||||||||||||||||||||
| Net cash flows from(used in) operations | 122361578 | 16269325 | 20838086 | 85254167 | ||||||||||||||||||||||||||||
| CASH FLOWS FROM INVESTING ACTIVITIES | ||||||||||||||||||||||||||||||||
| Payments for plant amp equipment | Other capex | (16857265) | (8940874) | (2337548) | (5578843) | |||||||||||||||||||||||||||
| Payments for exploration amp evaluation - WA | Exploration | (8274409) | (2141208) | (2694944) | (3438257) | |||||||||||||||||||||||||||
| Payments for exploration amp evaluation - NSW | Exploration | (2163866) | (679178) | (561848) | (922840) | |||||||||||||||||||||||||||
| Payments for development | Capitalised Mining | (16799350) | (4926496) | (6438272) | (5434582) | |||||||||||||||||||||||||||
| Payments for mine properties - DNO | Capitalised Mining | (2134910) | (1243030) | (891880) | - | |||||||||||||||||||||||||||
| Payments for mine properties - DSO | Capitalised Mining | (13491453) | (6936306) | (6184203) | (370944) | |||||||||||||||||||||||||||
| Payments for termsecurity deposits | Other | (331) | - | (331) | - | |||||||||||||||||||||||||||
| Proceeds on disposal of term deposits | Other | - | - | - | - | |||||||||||||||||||||||||||
| Payments for WALs | Other capex | - | - | - | - | |||||||||||||||||||||||||||
| Acquisition of exploration assets (net of cash) | DKM Acquisition | - | - | - | - | |||||||||||||||||||||||||||
| Proceeds on disposal of PampE | Other capex | 914 | - | 914 | - | |||||||||||||||||||||||||||
| Net cash flows used in investing activities | (59720670) | (24867092) | (19108112) | (15745466) | ||||||||||||||||||||||||||||
| CASH FLOWS FROM FINANCING ACTIVITIES | ||||||||||||||||||||||||||||||||
| Proceeds from equity raisings | - | - | - | - | ||||||||||||||||||||||||||||
| Proceeds from exercise of options | Other | - | - | - | - | |||||||||||||||||||||||||||
| Share issue costs | Other | - | - | - | - | |||||||||||||||||||||||||||
| Dividends paid | Dividends | - | - | - | - | |||||||||||||||||||||||||||
| Repayment of finance lease | Other capex | (188476) | (62627) | (62825) | (63024) | |||||||||||||||||||||||||||
| Repayment of borrowings | - | - | - | - | ||||||||||||||||||||||||||||
| Net cash flows from financing activities | (188476) | (62627) | (62825) | (63024) | ||||||||||||||||||||||||||||
| Net increase(decrease) in cash amp equivalents | 62452432 | (8660394) | 1667149 | 69445677 | ||||||||||||||||||||||||||||
| Cash amp bullion at the start of the period | 147413092 | Elisha Civil Elisha CivilDifference between bullion for quarterly vs accounts Adjusted agaisnt mvmt in gold on hand | 147413092 | 142730654 | 146634041 | |||||||||||||||||||||||||||
| Effects of exchange rate movements on cash | Operations | - | ||||||||||||||||||||||||||||||
| Movement in gold on hand | Operations | (41053555) | - | 3977956 | 2236238 | (47267749) | ||||||||||||||||||||||||||
| Cash amp bullion at the end of the period | 168811968 | 142730654 | 146634041 | 168811968 | ||||||||||||||||||||||||||||
| GOH Cost for Accounts revalued to Selling Price for Quarterly | Cost | Sales | ||||||||||||||||||||||||||||||
| At 31-Dec | Oz | $oz | $ | $oz | $ | |||||||||||||||||||||||||||
| MLW | 1043087 | 1155 | 1205224 | 2220 | 2315862 | |||||||||||||||||||||||||||
| GDW | 2096013 | 1147 | 2404709 | 2220 | 4653569 | |||||||||||||||||||||||||||
| RMT | 1291847 | 910 | 1175405 | 2220 | 2868159 | |||||||||||||||||||||||||||
| 4430947 | 4785338 | 9837589 | ||||||||||||||||||||||||||||||
| Values | Line X | Ends | Before | After | Line Y | Label Y | Y Label | CASH FLOWS FROM OPERATIONS | Category | Manual Adj | Oct-18 | Nov-18 | Dec-18 | |||||||||||||||||||
| Q1 FY19 | 1474 | 15 | $1474m | 1474 | Receipts from gold sales | Operations | 197565780 | 69872301 | 50017610 | 77675869 | ||||||||||||||||||||||
| Operations | 764 | 25 | - | $1474m | $2238m | $2238m | $1856m | $764m | Option premium income | Other | - | - | - | - | ||||||||||||||||||
| Mine development | (173) | 35 | - | $2238m | $2065m | $2065m | $2151m | ($173m) | Other income | Other | 35365 | - | 17348 | 18017 | ||||||||||||||||||
| Exploration | (110) | 45 | - | $2065m | $1955m | $1955m | $2010m | ($110m) | Payments to suppliers and employees - DNO | Operations | (26398673) | (11800291) | (4827485) | (9770897) | ||||||||||||||||||
| Other capex | (103) | 55 | - | $1955m | $1852m | $1852m | $1903m | ($103m) | Payments to suppliers and employees - DSO | Operations | (56426609) | (26236285) | (19169984) | (11020341) | ||||||||||||||||||
| Income tax | (184) | 65 | - | $1852m | $1669m | $1669m | $1760m | ($184m) | Payments to suppliers and employees - CORP | Other | (3288103) | (1764275) | (604615) | (919213) | ||||||||||||||||||
| Other | (27) | 75 | - | $1669m | $1641m | $1641m | $1655m | ($27m) | Interest received | Other | 583081 | 204671 | 183686 | 194724 | ||||||||||||||||||
| Q2 FY19 | $1641m | Income tax paid | Income tax | (18355847) | (1525368) | (13797636) | (3032843) | |||||||||||||||||||||||||
| Interest paid | Other | (35635) | (1683) | (1498) | (32454) | |||||||||||||||||||||||||||
| Net cash flows from(used in) operations | 93679358 | 28749070 | 11817426 | 53112862 | ||||||||||||||||||||||||||||
| CASH FLOWS FROM INVESTING ACTIVITIES | ||||||||||||||||||||||||||||||||
| Payments for plant amp equipment | Other capex | (10075371) | (3903432) | (3019743) | (3152196) | |||||||||||||||||||||||||||
| Payments for exploration amp evaluation - WA | Exploration | (8306306) | (3558754) | (2346579) | (2400973) | |||||||||||||||||||||||||||
| Payments for exploration amp evaluation - NSW | Exploration | (2718365) | (982413) | (718445) | (1017507) | |||||||||||||||||||||||||||
| Payments for development - TWL BNG DGB | Mine development | (7534270) | (6416098) | (77128) | (1041044) | |||||||||||||||||||||||||||
| Payments for mine properties - DNO | Mine development | 910105 | 596531 | (25819) | 339393 | |||||||||||||||||||||||||||
| Payments for mine properties - DSO | Mine development | (10664238) | (1389637) | (5788769) | (3485832) | |||||||||||||||||||||||||||
| Payments for term deposits | Other | (442) | - | (442) | - | |||||||||||||||||||||||||||
| Proceeds on disposal of term deposits | Other | - | - | - | - | |||||||||||||||||||||||||||
| Payments for WALs | Other capex | - | - | - | - | |||||||||||||||||||||||||||
| Acquisition of exploration assets (net of cash) | Exploration | - | - | - | - | |||||||||||||||||||||||||||
| Proceeds on disposal of PampE | Other capex | 28073 | - | 5 | 28068 | |||||||||||||||||||||||||||
| Net cash flows used in investing activities | (38360814) | (15653802) | (11976921) | (10730091) | ||||||||||||||||||||||||||||
| CASH FLOWS FROM FINANCING ACTIVITIES | ||||||||||||||||||||||||||||||||
| Proceeds from equity raisings | - | - | - | - | ||||||||||||||||||||||||||||
| Proceeds from exercise of options | 119000 | 21000 | 70000 | 28000 | ||||||||||||||||||||||||||||
| Share issue costs | (15072) | (5652) | (5652) | (3768) | ||||||||||||||||||||||||||||
| Dividend paid | Dividends | - | - | - | - | |||||||||||||||||||||||||||
| Repayment of finance lease | Other capex | (209427) | (69624) | (69809) | (69994) | |||||||||||||||||||||||||||
| Repayment of borrowings | - | - | - | - | ||||||||||||||||||||||||||||
| Net cash flows from financing activities | (105499) | (54276) | (5461) | (45762) | ||||||||||||||||||||||||||||
| Net increase(decrease) in cash amp equivalents | 55213045 | 13040992 | (164956) | 42337009 | ||||||||||||||||||||||||||||
| Cash amp bullion at the start of the period | 147413092 | 147413092 | 144466157 | 147835566 | ||||||||||||||||||||||||||||
| Effects of exchange rate movements on cash | Operations | - | ||||||||||||||||||||||||||||||
| Movement in gold on hand | Operations | (38375614) | - | (15987926) | 3534365 | (25922053) | ||||||||||||||||||||||||||
| Cash amp bullion at the end of the period | 164250522 | 144466157 | 147835566 | 164250522 | ||||||||||||||||||||||||||||
| Cost | Sales | |||||||||||||||||||||||||||||||
| At 31-Dec | Oz | $oz | $ | $oz | $ | |||||||||||||||||||||||||||
| MLW | - | - | ||||||||||||||||||||||||||||||
| GDW | - | - | ||||||||||||||||||||||||||||||
| RMT | - | - | ||||||||||||||||||||||||||||||
| - | - | - | ||||||||||||||||||||||||||||||
| Values | Line X | Ends | Before | After | Line Y | Label Y | Y Label | CASH FLOWS FROM OPERATIONS | Category | Manual Adj | Jul-19 | Aug-19 | Sep-19 | |||||||||||||||||||
| Q4 FY19 | 2052 | 15 | $2052m | 2052 | Receipts from gold sales | Operations | 159881239 | 48733973 | 57888259 | 53259007 | ||||||||||||||||||||||
| Operations | 825 | 25 | - | $2052m | $2877m | $2877m | $2464m | $825m | Option premium income | Other | - | - | - | - | ||||||||||||||||||
| Dividends | (407) | 35 | - | $2877m | $2470m | $2470m | $2674m | ($407m) | Other income | Other | 49094 | 15362 | 16350 | 17382 | ||||||||||||||||||
| Capitalised Mining | (306) | 45 | - | $2470m | $2164m | $2164m | $2317m | ($306m) | Payments to suppliers and employees - DNO | Operations | (29966833) | (18867571) | (5421615) | (5677647) | ||||||||||||||||||
| Exploration | (101) | 55 | - | $2164m | $2063m | $2063m | $2114m | ($101m) | Payments to suppliers and employees - DSO | Operations | (81824490) | (49555333) | (18307389) | (13961768) | ||||||||||||||||||
| DKM Acquisition | (200) | 65 | - | $2063m | $1863m | $1863m | $1963m | ($200m) | Payments to suppliers and employees - CORP | Other | (6151175) | (2387178) | (2286742) | (1477255) | ||||||||||||||||||
| Other capex | (202) | 75 | - | $1863m | $1661m | $1661m | $1762m | ($202m) | Interest received | Other | 454852 | 171509 | 149152 | 134191 | ||||||||||||||||||
| Income tax | (133) | 85 | - | $1661m | $1528m | $1528m | $1594m | ($133m) | Income tax paid | Income tax | (13260068) | (6214961) | (2525166) | (4519941) | ||||||||||||||||||
| Other | (54) | 95 | - | $1528m | $1474m | $1474m | $1501m | ($54m) | Interest paid | Other | (19267) | (6681) | (6391) | (6195) | ||||||||||||||||||
| Q1 FY20 | $1474m | GIC Inventory Mvmt | GIC Mvmt | - | ||||||||||||||||||||||||||||
| Net cash flows from(used in) operations | 29163353 | (28110879) | 29506458 | 27767774 | ||||||||||||||||||||||||||||
| CASH FLOWS FROM INVESTING ACTIVITIES | ||||||||||||||||||||||||||||||||
| Payments for plant amp equipment | Other capex | (19997124) | (10746245) | (4214487) | (5036392) | |||||||||||||||||||||||||||
| Payments for exploration amp evaluation - WA | Exploration | (6737885) | (1447005) | (2144467) | (3146413) | |||||||||||||||||||||||||||
| Payments for exploration amp evaluation - NSW | Exploration | (3411817) | (889004) | (1537672) | (985141) | |||||||||||||||||||||||||||
| Payments for development | Capitalised Mining | (14273272) | (3407474) | (5400036) | (5465762) | |||||||||||||||||||||||||||
| Payments for mine properties - DNO | Capitalised Mining | (402980) | 844308 | (139170) | (1108118) | |||||||||||||||||||||||||||
| Payments for mine properties - DSO | Capitalised Mining | (15903074) | (8245160) | (6860356) | (797558) | |||||||||||||||||||||||||||
| Payments for termsecurity deposits | Other | (363) | - | (363) | - | |||||||||||||||||||||||||||
| Proceeds on disposal of term deposits | Other | - | - | - | - | |||||||||||||||||||||||||||
| Payments for WALs | Other capex | - | - | - | - | |||||||||||||||||||||||||||
| Acquisition of exploration assets (net of cash) | DKM Acquisition | (20000000) | - | (20000000) | - | |||||||||||||||||||||||||||
| Proceeds on disposal of PampE | Other capex | - | - | - | - | |||||||||||||||||||||||||||
| Net cash flows used in investing activities | (80726516) | (23890581) | (40296551) | (16539384) | ||||||||||||||||||||||||||||
| CASH FLOWS FROM FINANCING ACTIVITIES | ||||||||||||||||||||||||||||||||
| Proceeds from equity raisings | - | - | - | - | ||||||||||||||||||||||||||||
| Proceeds from exercise of options | Other | 279000 | 84000 | 195000 | - | |||||||||||||||||||||||||||
| Share issue costs | Other | (14386) | (10020) | (4366) | - | |||||||||||||||||||||||||||
| Dividends paid | Dividends | (40654437) | - | - | (40654437) | |||||||||||||||||||||||||||
| Repayment of finance lease | Other capex | (222262) | (97597) | (62234) | (62431) | |||||||||||||||||||||||||||
| Repayment of borrowings | - | - | - | - | ||||||||||||||||||||||||||||
| Net cash flows from financing activities | (40612085) | (23617) | 128400 | (40716868) | ||||||||||||||||||||||||||||
| Net increase(decrease) in cash amp equivalents | (92175248) | (52025077) | (10661693) | (29488478) | ||||||||||||||||||||||||||||
| Cash amp bullion at the start of the period | 205165482 | Elisha Civil Elisha CivilDifference between bullion for quarterly vs accounts Adjusted agaisnt mvmt in gold on hand | 205165482 | 176583719 | 165686211 | |||||||||||||||||||||||||||
| Effects of exchange rate movements on cash | Operations | - | ||||||||||||||||||||||||||||||
| Movement in gold on hand | Operations | 34422858 | - | 23443314 | (235815) | 11215359 | ||||||||||||||||||||||||||
| Cash amp bullion at the end of the period | 147413092 | 176583719 | 165686211 | 147413092 | ||||||||||||||||||||||||||||
| GOH Cost for Accounts revalued to Selling Price for Quarterly | Cost | Sales | ||||||||||||||||||||||||||||||
| At 30-Jun | Oz | $oz | $ | $oz | $ | |||||||||||||||||||||||||||
| MLW | 2331195 | 1244 | 2901126 | 1990 | 4639684 | |||||||||||||||||||||||||||
| GDW | 3775510 | 1135 | 4286261 | 1990 | 7514247 | |||||||||||||||||||||||||||
| RMT | 1779190 | 1202 | 2137768 | 1990 | 3541051 | |||||||||||||||||||||||||||
| 7885895 | 9325154 | 15694981 | ||||||||||||||||||||||||||||||
| Cash amp GOH | Jun-20 | Mar-20 | Dec-19 | Sep-19 | Jun-19 | Mar-19 | Dec-18 | Sep-18 | Jun-18 | $m | Q4FY20 | Q3FY20 | Q2FY20 | Q1FY20 | Q4FY19 | Q3FY19 | Q2FY19 | Q1FY19 | Q4FY18 | |||||||||||||||||||||
| $000s | $000s | $000s | $000s | $000s | $000s | $000s | $000s | $000s | Cash | 1924 | 1172 | 1590 | 965 | 1887 | 1407 | 1871 | 1319 | 1811 | ||||||||||||||||||||||
| Cash | 192403 | 117162 | 158962 | 96512 | 188687 | 140737 | 187076 | 131862 | 181108 | Gold | - | 310 | 98 | 509 | 166 | 458 | 198 | 581 | 277 | |||||||||||||||||||||
| Total | 1924 | 1481 | 1688 | 1474 | 2052 | 1865 | 2068 | 1900 | 2088 | |||||||||||||||||||||||||||||||
| GOH (Mint) | 17119 | - | 11495 | 864 | 23842 | 2376 | 33426 | 21159 | Adjustments | |||||||||||||||||||||||||||||||
| GOH (site) | 13840 | 9838 | 39397 | 15695 | 21957 | 17389 | 24702 | 6525 | Debt repay | - | 00 | |||||||||||||||||||||||||||||
| Total GOH | - | 30959 | 9838 | 50891 | 16559 | 45798 | 19764 | 58128 | 27685 | CMM purchase(sale) | - | (43) | ||||||||||||||||||||||||||||
| GOH (oz) | 11933 | 4431 | 23815 | 8321 | 25233 | 10625 | 34331 | 16285 | Land amp WAL purchase | 117 | ||||||||||||||||||||||||||||||
| Avg $oz | 2594 | 2220 | 2137 | 1990 | 1815 | 1860 | 1693 | 1700 | Tax | 98 | 90 | |||||||||||||||||||||||||||||
| Total Cash amp Gold | 192403 | 148121 | 168800 | 147403 | 205246 | 186535 | 206841 | 189990 | 208793 | Divs | 407 | 407 | 403 | - | ||||||||||||||||||||||||||
| Adjusted cash | 1924 | 1888 | 1688 | 1881 | 2052 | 1865 | 2068 | 2517 | 2135 | |||||||||||||||||||||||||||||||
| Gold on hand that is in the metals account amp still on site at month end has been measured at expected selling price in the above table At June year-end and December half-year end these ounces are measured at cost and included in inventory for financial reporting purposes | Cash build | 443 | 200 | 214 | (172) | 187 | (203) | 169 | 382 | |||||||||||||||||||||||||||||||
| Gold sold (oz) | 69922 | 111106 | 71702 | 106628 | 76817 | 114966 | 71310 | 88551 | ||||||||||||||||||||||||||||||||
| CURRENT MONTH END WORKINGS | Avg price ($oz) | 2297 | 2104 | 2000 | 1832 | 1838 | 1718 | 1660 | 1678 | |||||||||||||||||||||||||||||||
| Cash Yana Goncharova Yana Goncharovabank recs | Jun-20 | Sales ($m) | 1606 | 2337 | 1434 | 1953 | 1412 | 1976 | 1184 | 1486 | ||||||||||||||||||||||||||||||
| ANZCH | 83196 | uuml | ||||||||||||||||||||||||||||||||||||||
| MBLBG + CBABG | 460536 | uuml | ||||||||||||||||||||||||||||||||||||||
| MBLBG x2 | 42900 | uuml | ||||||||||||||||||||||||||||||||||||||
| MBLCHQ | 17035 | uuml | ||||||||||||||||||||||||||||||||||||||
| CBA CALL | 65311911 | uuml | ||||||||||||||||||||||||||||||||||||||
| MBLPR | 125283665 | uuml | ||||||||||||||||||||||||||||||||||||||
| CBACHQ | 397837 | uuml | ||||||||||||||||||||||||||||||||||||||
| CBALFB | 119698 | uuml | ||||||||||||||||||||||||||||||||||||||
| CBASA | 306497 | uuml | ||||||||||||||||||||||||||||||||||||||
| CBASI | 379878 | uuml | ||||||||||||||||||||||||||||||||||||||
| TOTAL | 192403154 | |||||||||||||||||||||||||||||||||||||||
| Gold on Site | Oz | $oz | $ | |||||||||||||||||||||||||||||||||||||
| Estimate - MLW | 35879 | 257628 | 924335 | (on site) | ||||||||||||||||||||||||||||||||||||
| Estimate - GDW | 2789448 | 257628 | 7186395 | (on site) | ||||||||||||||||||||||||||||||||||||
| Estimate - RMT | 2198695 | 260559 | 5728891 | |||||||||||||||||||||||||||||||||||||
| Total | 5346930 | 258833 | 13839622 | (Estimated selling price) | ||||||||||||||||||||||||||||||||||||
| At Mint | Oz | $oz | $ | |||||||||||||||||||||||||||||||||||||
| In metal account | 3544726 | 260559 | 9236092 | Bars 3256 to 3265 | ||||||||||||||||||||||||||||||||||||
| MLW | 573959 Yana Goncharova Yana Goncharovafrom D1-D3 | Yana Goncharova Yana Goncharovabank recs | 257628 | 1478678 | Bars 1776 to 1779 | |||||||||||||||||||||||||||||||||||
| GDW | 852378 | 257628 | 2195963 | Bars 3266 to 3275 | ||||||||||||||||||||||||||||||||||||
| RMT | 1615113 | 260559 | 4208318 | Bars 3266 to 3275 | ||||||||||||||||||||||||||||||||||||
| - | ||||||||||||||||||||||||||||||||||||||||
| - | ||||||||||||||||||||||||||||||||||||||||
| 6586176 | 259924 | 17119051 | (Estimated selling price) | |||||||||||||||||||||||||||||||||||||
| Total GOH | 11933106 | 259435 | 30958673 | |||||||||||||||||||||||||||||||||||||
| FY20 | FY19 | ||||||
| Ore mined | Mbcm | 43 | |||||
| Waste mined | Mbcm | 281 | |||||
| Strip ratio | wo | 66 | |||||
| Ore mined | Mt | 101 | |||||
| Ore milled | Mt | 94 | |||||
| Head grade | gt | 127 | |||||
| Recovery | 94 | ||||||
| Gold produced | 000 ozs | 363 | |||||
| Cash cost | A$oz | 819 | |||||
| Cash cost inc royalties | A$oz | 897 | |||||
| All-in Sustaining Cost | A$oz | 1029 | |||||
| Physicals | Unit | Year Ended 30 June 2019 | |||||
| Ounces Produced | oz | 363418 | |||||
| Ounces sold | oz | 369721 | |||||
| Bullion on Hand | oz | - 0 | |||||
| Average Realised Price | $oz | 1765 | |||||
| Sales Revenue | $m | 6525 | |||||
| Interest Income | $m | 23 | |||||
| Cost of Sales | $m | (4020) | |||||
| Gross Profit | $m | 2528 | |||||
| Other Income | $m | 44 | |||||
| Administration and Other Costs | $m | (157) | |||||
| Finance Costs | $m | (14) | |||||
| Impairment of Non Current Assets | $m | (67) | |||||
| Profit Before Tax | $m | 2335 | |||||
| Income Tax Expense | $m | (703) | |||||
| Net Profit After Tax | $m | 1631 |
| Values | Line X | Ends | Before | After | Line Y | Label Y | Y Label | CASH FLOWS FROM OPERATIONS | Category | Manual Adj | ||||||||||||||||||
| Jun-18 | 2088 | 15 | $2088m | 2088 | Receipts from gold sales | Operations | 652450151 | 652450151 | ||||||||||||||||||||
| Operations | 3287 | 25 | - | $2088m | $5375m | $5375m | $3732m | $3287m | Option premium income | Other | 1366000 | 1366000 | ||||||||||||||||
| Dividends | (812) | 35 | - | $5375m | $4563m | $4563m | $4969m | ($812m) | Other income | Other | - | - | ||||||||||||||||
| Mine development | (961) | 45 | - | $4563m | $3602m | $3602m | $4082m | ($961m) | Payments to suppliers and employees - DNO | Operations | (84224766) | (84224766) | ||||||||||||||||
| Exploration | (348) | 55 | - | $3602m | $3253m | $3253m | $3428m | ($348m) | Payments to suppliers and employees - DSO | Operations | (228404216) | (228404216) | ||||||||||||||||
| Other capex | (574) | 65 | - | $3253m | $2679m | $2679m | $2966m | ($574m) | Payments to suppliers and employees - CORP | Other | (14051447) | (14051447) | ||||||||||||||||
| Income tax | (540) | 75 | - | $2679m | $2139m | $2139m | $2409m | ($540m) | Interest received | Other | 2388192 | 2388192 | ||||||||||||||||
| Other | (87) | 85 | - | $2139m | $2053m | $2053m | $2096m | ($87m) | Income tax paid | Income tax | (53971000) | (53971000) | ||||||||||||||||
| Jun-19 | $2053m | Interest paid | Other | (85486) | (85486) | |||||||||||||||||||||||
| Proceeds from rental income | Other | 16500 | 16500 | |||||||||||||||||||||||||
| Net cash flows from(used in) operations | 275483928 | 275483928 | ||||||||||||||||||||||||||
| CASH FLOWS FROM INVESTING ACTIVITIES | ||||||||||||||||||||||||||||
| Payments for plant amp equipment | Other capex | (56425779) | (56425779) | |||||||||||||||||||||||||
| Payments for exploration amp evaluation - WA | Exploration | (24685627) | (24685627) | |||||||||||||||||||||||||
| Payments for exploration amp evaluation - NSW | Exploration | (10152682) | (10152682) | |||||||||||||||||||||||||
| Payments for development - TWL BNY DOG RMT | Mine development | (35632149) | (35632149) | |||||||||||||||||||||||||
| Payments for mine properties - DNO | Mine development | (4690352) | (4690352) | |||||||||||||||||||||||||
| Payments for mine properties - DSO | Mine development | (55809551) | (55809551) | |||||||||||||||||||||||||
| Payments for term deposits | Other | 77000 | 77000 | |||||||||||||||||||||||||
| Proceeds on disposal of term deposits | Other | (1708) | (1708) | |||||||||||||||||||||||||
| Payments for AFS investments | Other capex | - | ||||||||||||||||||||||||||
| Acquisition of exploration assets (net of cash) | Exploration | - | ||||||||||||||||||||||||||
| Proceeds on disposal of PampE | Other capex | 31346 | 31346 | |||||||||||||||||||||||||
| Net cash flows used in investing activities | (187289502) | (187289502) | ||||||||||||||||||||||||||
| CASH FLOWS FROM FINANCING ACTIVITIES | ||||||||||||||||||||||||||||
| Proceeds from equity raisings | - | |||||||||||||||||||||||||||
| Proceeds from exercise of options | Other | 1697500 | 1697500 | |||||||||||||||||||||||||
| Share issue costs | Other | (65127) | (65127) | |||||||||||||||||||||||||
| Dividends paid | Dividends | (81196194) | (81196194) | |||||||||||||||||||||||||
| Repayment of finance lease | Other capex | (1051633) | (1051633) | |||||||||||||||||||||||||
| Repayment of borrowings | - | |||||||||||||||||||||||||||
| Net cash flows from financing activities | (80615454) | (80615454) | ||||||||||||||||||||||||||
| Net increase(decrease) in cash amp equivalents | 7578972 | |||||||||||||||||||||||||||
| Cash amp bullion at the start of the period | 208802950 | |||||||||||||||||||||||||||
| Effects of exchange rate movements on cash | Operations | |||||||||||||||||||||||||||
| Movement in gold on hand | Operations | (11125871) | ||||||||||||||||||||||||||
| Cash amp bullion at the end of the period | 205256052 | |||||||||||||||||||||||||||
| 2014 | 2015 | 2016 | 2017 | 2018 | 2019 | ||||||||||
| Revenue | 372 | 465 | 502 | 544 | 606 | 652 | 1 | ||||||||
| NPAT | -148 | 87 | 112 | 138 | 174 | 163 | 2 | ||||||||
| Net Assets | 3210 | 4100 | 4820 | 5390 | 6370 | 7164 | 3 | ||||||||
| EPS | -2968 | 1739 | 2237 | 2759 | 346 | 3218 | 4 | ||||||||
| 5 | |||||||||||||||
| 6 | |||||||||||||||
| 7 | |||||||||||||||
| 8 | |||||||||||||||
| 9 | |||||||||||||||
| 10 | |||||||||||||||
| 11 | |||||||||||||||
| 12 | |||||||||||||||
| 13 | |||||||||||||||
| 1 | |||||||||||||||
| 2 | |||||||||||||||
| 3 | |||||||||||||||
| 4 | |||||||||||||||
| 5 | |||||||||||||||
| 6 | |||||||||||||||
| 7 | |||||||||||||||
| 8 | |||||||||||||||
| 9 | |||||||||||||||
| 10 | |||||||||||||||
| 11 | |||||||||||||||
| 12 | |||||||||||||||
| 13 |
| Values | Line X | Ends | Before | After | Line Y | Label Y | Y Label | ||||||||||
| 31 March 2018 | 805 | 15 | 805 | 805 | |||||||||||||
| Depletion | (040) | 25 | - | 805 | 766 | 766 | 786 | (040) | |||||||||
| Model Update | (003) | 35 | - | 766 | 763 | 763 | 764 | (003) | |||||||||
| New Deposits | 023 | 45 | - | 763 | 786 | 786 | 774 | 023 | |||||||||
| 31 March 2019 | 786 | ||||||||||||||||
| Values | Line X | Ends | Before | After | Line Y | Label Y | Y Label | ||||||||||
| 31 March 2017 | 218 | 15 | 218 | 218 | |||||||||||||
| Depletion | (040) | 25 | - | 218 | 179 | 179 | 198 | (040) | |||||||||
| Model Update | 024 | 35 | - | 179 | 203 | 203 | 191 | 024 | |||||||||
| New Deposits | 203 | 45 | - | 203 | 406 | 406 | 305 | 203 | |||||||||
| 31 March 2018 | 406 | ||||||||||||||||
| 212540855741674 |
| 1 | 2 | 3 | 4 | 5 | 6 | 7 | 8 | 9 | 10 | ||||||||||||
| Ounces Recovered | 142688 | 181016 | 179298 | 192720 | 177647 | 209062 | 210877 | 224493 | 210461 | 210461 | |||||||||||
| Milled Grade (gt) | 090 | 095 | 094 | 101 | 093 | 109 | 110 | 117 | 146 | 146 |
| Values | Line X | Ends | Before | After | Line Y | Label Y | Y Label | ||||||||||
| 2009 Reserve | 06Moz | 15 | 06Moz | 06Moz | |||||||||||||
| Mining Depletion | (19Moz) | 25 | - | 06Moz | (12Moz) | (12Moz) | (03Moz) | (19Moz) | |||||||||
| Discovery | 34Moz | 35 | - | (12Moz) | 22Moz | 22Moz | 05Moz | 34Moz | |||||||||
| Current Reserves | 22Moz | ||||||||||||||||
| Dividend | |||||||||||||||||
| 2015 | 2016 | 2017 | 2018 | 2019 | 2020 | ||||||||||||
| Interim | 0 | 4 | 7 | 8 | 8 | 8 | |||||||||||
| Final | 6 | 9 | 8 | 8 | 8 | 8 | |||||||||||
| Dividends Paid | 2013 | 2014 | 2015 | 2016 | 2017 | 2018 | 2019 | 2020 | |||||||||
| 75 | 75 | 105 | 170 | 245 | 326 | 407 | 488 |
| 2015 | 2016 | 2017 | 2018 | 2019 | 2020 | |||||||||||||||||||||
| Revenue | 465 | 502 | 544 | 606 | 654 | 757 | 1 | |||||||||||||||||||
| NPAT | 87 | 112 | 138 | 174 | 163 | 200 | 2 | |||||||||||||||||||
| EBITDA | 181 | 234 | 253 | 313 | 307 | 394 Jon Latto Jon LattoNumber from stats Diff to calc below | 3 | |||||||||||||||||||
| EBITDA Margin () | 389 | 466 | 465 | 517 | 469 | 521 | 4 | |||||||||||||||||||
| EPS | 174 | 224 | 276 | 346 | 322 | 393 | 5 | |||||||||||||||||||
| Dividend per share | 60 | 130 | 150 | 160 | 160 | 160 | 6 | |||||||||||||||||||
| 7 | ||||||||||||||||||||||||||
| Dividend of Revenue | 134 | 124 | 107 | 8 | ||||||||||||||||||||||
| Dividend of EBITDA | 259 | 264 | 206 | 9 | ||||||||||||||||||||||
| 10 | ||||||||||||||||||||||||||
| 11 | ||||||||||||||||||||||||||
| 12 | ||||||||||||||||||||||||||
| 13 | ||||||||||||||||||||||||||
| 1 | ||||||||||||||||||||||||||
| 2 | ||||||||||||||||||||||||||
| 3 | ||||||||||||||||||||||||||
| 4 | ||||||||||||||||||||||||||
| 5 | ||||||||||||||||||||||||||
| 6 | ||||||||||||||||||||||||||
| 7 | ||||||||||||||||||||||||||
| 8 | ||||||||||||||||||||||||||
| 9 | ||||||||||||||||||||||||||
| 10 | ||||||||||||||||||||||||||
| 11 | ||||||||||||||||||||||||||
| 12 | ||||||||||||||||||||||||||
| 13 | ||||||||||||||||||||||||||
| Dividends Paid | ||||||||||||||||||||||||||
| FY13 | FY14 | FY15 | FY16 | FY17 | FY18 | FY19 | FY20 | |||||||||||||||||||
| 75 | 0 | 30 | 65 | 75 | 81 | 81 | 81 Jon Latto Jon LattoBased on shares on issue from Appendix 3B immediately prior to interim dividend payment and Appendix 2A immediately prior to full year dividend payment | |||||||||||||||||||
| Calculation of EBITDA for FY20 | ||||||||||||||||||||||||||
| Profit before tax | 284660 Jon Latto Jon LattoExtracted from FY20 Financial Report PampL | |||||||||||||||||||||||||
| Add Back | ||||||||||||||||||||||||||
| Interest expense | 1105 Jon Latto Jon LattoExtracted from Note 18 to FY20 Financial Report | |||||||||||||||||||||||||
| Depreciation | 50626 Jon Latto Jon LattoExtracted from Note 3 to FY20 Financial Report | |||||||||||||||||||||||||
| Amortisation | 57280 Jon Latto Jon LattoExtracted from Note 3 to FY20 Financial Report | |||||||||||||||||||||||||
| Less | ||||||||||||||||||||||||||
| Interest Income | 866 Jon Latto Jon LattoExtracted from Note 2 to FY20 Financial Report | |||||||||||||||||||||||||
Jon Latto Jon LattoBased on shares on issue from Appendix 3B immediately prior to interim dividend payment and Appendix 2A immediately prior to full year dividend payment | Jon Latto Jon LattoNumber from stats Diff to calc below | Jon Latto Jon LattoExtracted from FY20 Financial Report PampL | Jon Latto Jon LattoExtracted from Note 18 to FY20 Financial Report | Jon Latto Jon LattoExtracted from Note 3 to FY20 Financial Report | EBITDA | 392805 |
| FY20 | FY19 | ||||||
| Ore mined | Mbcm | 43 | |||||
| Waste mined | Mbcm | 281 | |||||
| Strip ratio | wo | 66 | |||||
| Ore mined | Mt | 101 | |||||
| Ore milled | Mt | 94 | |||||
| Head grade | gt | 127 | |||||
| Recovery | 94 | ||||||
| Gold produced | 000 ozs | 363 | |||||
| Cash cost | A$oz | 819 | |||||
| Cash cost inc royalties | A$oz | 897 | |||||
| All-in Sustaining Cost | A$oz | 1029 | |||||
| Physicals | Unit | Year Ended 30 June 2019 | |||||
| Ounces Produced | oz | 363418 | |||||
| Ounces sold | oz | 369721 | |||||
| Bullion on Hand | oz | - 0 | |||||
| Average Realised Price | $oz | 1765 | |||||
| Sales Revenue | $m | 6525 | |||||
| Interest Income | $m | 23 | |||||
| Cost of Sales | $m | (4020) | |||||
| Gross Profit | $m | 2528 | |||||
| Other Income | $m | 44 | |||||
| Administration and Other Costs | $m | (157) | |||||
| Finance Costs | $m | (14) | |||||
| Impairment of Non Current Assets | $m | (67) | |||||
| Profit Before Tax | $m | 2335 | |||||
| Income Tax Expense | $m | (703) | |||||
| Net Profit After Tax | $m | 1631 |
| Values | Line X | Ends | Before | After | Line Y | Label Y | Y Label | CASH FLOWS FROM OPERATIONS | Category | Manual Adj | ||||||||||||||||||
| Jun-18 | 2088 | 15 | $2088m | 2088 | Receipts from gold sales | Operations | 652450151 | 652450151 | ||||||||||||||||||||
| Operations | 3287 | 25 | - | $2088m | $5375m | $5375m | $3732m | $3287m | Option premium income | Other | 1366000 | 1366000 | ||||||||||||||||
| Dividends | (812) | 35 | - | $5375m | $4563m | $4563m | $4969m | ($812m) | Other income | Other | - | - | ||||||||||||||||
| Mine development | (961) | 45 | - | $4563m | $3602m | $3602m | $4082m | ($961m) | Payments to suppliers and employees - DNO | Operations | (84224766) | (84224766) | ||||||||||||||||
| Exploration | (348) | 55 | - | $3602m | $3253m | $3253m | $3428m | ($348m) | Payments to suppliers and employees - DSO | Operations | (228404216) | (228404216) | ||||||||||||||||
| Other capex | (574) | 65 | - | $3253m | $2679m | $2679m | $2966m | ($574m) | Payments to suppliers and employees - CORP | Other | (14051447) | (14051447) | ||||||||||||||||
| Income tax | (540) | 75 | - | $2679m | $2139m | $2139m | $2409m | ($540m) | Interest received | Other | 2388192 | 2388192 | ||||||||||||||||
| Other | (87) | 85 | - | $2139m | $2053m | $2053m | $2096m | ($87m) | Income tax paid | Income tax | (53971000) | (53971000) | ||||||||||||||||
| Jun-19 | $2053m | Interest paid | Other | (85486) | (85486) | |||||||||||||||||||||||
| Proceeds from rental income | Other | 16500 | 16500 | |||||||||||||||||||||||||
| Net cash flows from(used in) operations | 275483928 | 275483928 | ||||||||||||||||||||||||||
| CASH FLOWS FROM INVESTING ACTIVITIES | ||||||||||||||||||||||||||||
| Payments for plant amp equipment | Other capex | (56425779) | (56425779) | |||||||||||||||||||||||||
| Payments for exploration amp evaluation - WA | Exploration | (24685627) | (24685627) | |||||||||||||||||||||||||
| Payments for exploration amp evaluation - NSW | Exploration | (10152682) | (10152682) | |||||||||||||||||||||||||
| Payments for development - TWL BNY DOG RMT | Mine development | (35632149) | (35632149) | |||||||||||||||||||||||||
| Payments for mine properties - DNO | Mine development | (4690352) | (4690352) | |||||||||||||||||||||||||
| Payments for mine properties - DSO | Mine development | (55809551) | (55809551) | |||||||||||||||||||||||||
| Payments for term deposits | Other | 77000 | 77000 | |||||||||||||||||||||||||
| Proceeds on disposal of term deposits | Other | (1708) | (1708) | |||||||||||||||||||||||||
| Payments for AFS investments | Other capex | - | ||||||||||||||||||||||||||
| Acquisition of exploration assets (net of cash) | Exploration | - | ||||||||||||||||||||||||||
| Proceeds on disposal of PampE | Other capex | 31346 | 31346 | |||||||||||||||||||||||||
| Net cash flows used in investing activities | (187289502) | (187289502) | ||||||||||||||||||||||||||
| CASH FLOWS FROM FINANCING ACTIVITIES | ||||||||||||||||||||||||||||
| Proceeds from equity raisings | - | |||||||||||||||||||||||||||
| Proceeds from exercise of options | Other | 1697500 | 1697500 | |||||||||||||||||||||||||
| Share issue costs | Other | (65127) | (65127) | |||||||||||||||||||||||||
| Dividends paid | Dividends | (81196194) | (81196194) | |||||||||||||||||||||||||
| Repayment of finance lease | Other capex | (1051633) | (1051633) | |||||||||||||||||||||||||
| Repayment of borrowings | - | |||||||||||||||||||||||||||
| Net cash flows from financing activities | (80615454) | (80615454) | ||||||||||||||||||||||||||
| Net increase(decrease) in cash amp equivalents | 7578972 | |||||||||||||||||||||||||||
| Cash amp bullion at the start of the period | 208802950 | |||||||||||||||||||||||||||
| Effects of exchange rate movements on cash | Operations | |||||||||||||||||||||||||||
| Movement in gold on hand | Operations | (11125871) | ||||||||||||||||||||||||||
| Cash amp bullion at the end of the period | 205256052 | |||||||||||||||||||||||||||
| 2014 | 2015 | 2016 | 2017 | 2018 | 2019 | ||||||||||
| Revenue | 372 | 465 | 502 | 544 | 606 | 652 | 1 | ||||||||
| NPAT | -148 | 87 | 112 | 138 | 174 | 163 | 2 | ||||||||
| Net Assets | 3210 | 4100 | 4820 | 5390 | 6370 | 7164 | 3 | ||||||||
| EPS | -2968 | 1739 | 2237 | 2759 | 346 | 3218 | 4 | ||||||||
| 5 | |||||||||||||||
| 6 | |||||||||||||||
| 7 | |||||||||||||||
| 8 | |||||||||||||||
| 9 | |||||||||||||||
| 10 | |||||||||||||||
| 11 | |||||||||||||||
| 12 | |||||||||||||||
| 13 | |||||||||||||||
| 1 | |||||||||||||||
| 2 | |||||||||||||||
| 3 | |||||||||||||||
| 4 | |||||||||||||||
| 5 | |||||||||||||||
| 6 | |||||||||||||||
| 7 | |||||||||||||||
| 8 | |||||||||||||||
| 9 | |||||||||||||||
| 10 | |||||||||||||||
| 11 | |||||||||||||||
| 12 | |||||||||||||||
| 13 |
| Values | Line X | Ends | Before | After | Line Y | Label Y | Y Label | ||||||||||
| 31 March 2018 | 805 | 15 | 805 | 805 | |||||||||||||
| Depletion | (040) | 25 | - | 805 | 766 | 766 | 786 | (040) | |||||||||
| Model Update | (003) | 35 | - | 766 | 763 | 763 | 764 | (003) | |||||||||
| New Deposits | 023 | 45 | - | 763 | 786 | 786 | 774 | 023 | |||||||||
| 31 March 2019 | 786 | ||||||||||||||||
| Values | Line X | Ends | Before | After | Line Y | Label Y | Y Label | ||||||||||
| 31 March 2017 | 218 | 15 | 218 | 218 | |||||||||||||
| Depletion | (040) | 25 | - | 218 | 179 | 179 | 198 | (040) | |||||||||
| Model Update | 024 | 35 | - | 179 | 203 | 203 | 191 | 024 | |||||||||
| New Deposits | 203 | 45 | - | 203 | 406 | 406 | 305 | 203 | |||||||||
| 31 March 2018 | 406 | ||||||||||||||||
| 212540855741674 |
| 1 | 2 | 3 | 4 | 5 | 6 | 7 | 8 | 9 | 10 | ||||||||||||
| Ounces Recovered | 142688 | 181016 | 179298 | 192720 | 177647 | 209062 | 210877 | 224493 | 210461 | 210461 | |||||||||||
| Milled Grade (gt) | 090 | 095 | 094 | 101 | 093 | 109 | 110 | 117 | 146 | 146 |
| Values | Line X | Ends | Before | After | Line Y | Label Y | Y Label | ||||||||||
| 2009 Reserve | 06Moz | 15 | 06Moz | 06Moz | |||||||||||||
| Mining Depletion | (19Moz) | 25 | - | 06Moz | (12Moz) | (12Moz) | (03Moz) | (19Moz) | |||||||||
| Discovery | 34Moz | 35 | - | (12Moz) | 22Moz | 22Moz | 05Moz | 34Moz | |||||||||
| Current Reserves | 22Moz | ||||||||||||||||
| Dividend | |||||||||||||||||
| 2015 | 2016 | 2017 | 2018 | 2019 | 2020 | ||||||||||||
| Interim | 0 | 4 | 7 | 8 | 8 | 8 | |||||||||||
| Final | 6 | 9 | 8 | 8 | 8 | 8 | |||||||||||
| Dividends Paid | 2013 | 2014 | 2015 | 2016 | 2017 | 2018 | 2019 | 2020 | |||||||||
| 75 | 75 | 105 | 170 | 245 | 326 | 407 | 488 |
| 2015 | 2016 | 2017 | 2018 | 2019 | 2020 | |||||||||||||||||||||
| Revenue | 465 | 502 | 544 | 606 | 654 | 757 | 1 | |||||||||||||||||||
| NPAT | 87 | 112 | 138 | 174 | 163 | 200 | 2 | |||||||||||||||||||
| EBITDA | 181 | 234 | 253 | 313 | 307 | 394 Jon Latto Jon LattoNumber from stats Diff to calc below | 3 | |||||||||||||||||||
| EBITDA Margin () | 389 | 466 | 465 | 517 | 469 | 521 | 4 | |||||||||||||||||||
| EPS | 174 | 224 | 276 | 346 | 322 | 393 | 5 | |||||||||||||||||||
| Dividend per share | 60 | 130 | 150 | 160 | 160 | 160 | 6 | |||||||||||||||||||
| 7 | ||||||||||||||||||||||||||
| Dividend of Revenue | 134 | 124 | 107 | 8 | ||||||||||||||||||||||
| Dividend of EBITDA | 259 | 264 | 206 | 9 | ||||||||||||||||||||||
| 10 | ||||||||||||||||||||||||||
| 11 | ||||||||||||||||||||||||||
| 12 | ||||||||||||||||||||||||||
| 13 | ||||||||||||||||||||||||||
| 1 | ||||||||||||||||||||||||||
| 2 | ||||||||||||||||||||||||||
| 3 | ||||||||||||||||||||||||||
| 4 | ||||||||||||||||||||||||||
| 5 | ||||||||||||||||||||||||||
| 6 | ||||||||||||||||||||||||||
| 7 | ||||||||||||||||||||||||||
| 8 | ||||||||||||||||||||||||||
| 9 | ||||||||||||||||||||||||||
| 10 | ||||||||||||||||||||||||||
| 11 | ||||||||||||||||||||||||||
| 12 | ||||||||||||||||||||||||||
| 13 | ||||||||||||||||||||||||||
| Dividends Paid | ||||||||||||||||||||||||||
| FY13 | FY14 | FY15 | FY16 | FY17 | FY18 | FY19 | FY20 | |||||||||||||||||||
| 75 | 0 | 30 | 65 | 75 | 81 | 81 | 81 Jon Latto Jon LattoBased on shares on issue from Appendix 3B immediately prior to interim dividend payment and Appendix 2A immediately prior to full year dividend payment | |||||||||||||||||||
| Calculation of EBITDA for FY20 | ||||||||||||||||||||||||||
| Profit before tax | 284660 Jon Latto Jon LattoExtracted from FY20 Financial Report PampL | |||||||||||||||||||||||||
| Add Back | ||||||||||||||||||||||||||
| Interest expense | 1105 Jon Latto Jon LattoExtracted from Note 18 to FY20 Financial Report | |||||||||||||||||||||||||
| Depreciation | 50626 Jon Latto Jon LattoExtracted from Note 3 to FY20 Financial Report | |||||||||||||||||||||||||
| Amortisation | 57280 Jon Latto Jon LattoExtracted from Note 3 to FY20 Financial Report | |||||||||||||||||||||||||
| Less | ||||||||||||||||||||||||||
| Interest Income | 866 Jon Latto Jon LattoExtracted from Note 2 to FY20 Financial Report | |||||||||||||||||||||||||
Jon Latto Jon LattoBased on shares on issue from Appendix 3B immediately prior to interim dividend payment and Appendix 2A immediately prior to full year dividend payment | Jon Latto Jon LattoNumber from stats Diff to calc below | Jon Latto Jon LattoExtracted from FY20 Financial Report PampL | Jon Latto Jon LattoExtracted from Note 18 to FY20 Financial Report | Jon Latto Jon LattoExtracted from Note 3 to FY20 Financial Report | EBITDA | 392805 |
CASHFLOW WATERFALLStrong cashflow from operations of $424 million supported increased capital investment during FY20 and the payment of $81 million in dividends during the year
8
1 Includes bullion on hand valued at $2576 per ounce
$205m
- - - - -
$376m
$209m
$424m
($135m)($37m)
($65m) ($16m)
($64m)($21m)
($81m)
-
$100m
$200m
$300m
$400m
$500m
$600m
$700mCash amp Bullion on Hand - 30 June 2020
For
per
sona
l use
onl
y
Cash amp Bullion on Hand - 30 June 2020
Ends
June 2019OperationsMine developmentExplorationOther capexOtherIncome taxDKM AcquisitionDividendsJune 2020205165482000003756792770000000600020929658200000006BeforeBudgetMLW Sales QtyMLW Sales PriceMLW COGSGDW Sales QtyGDW Sales PriceGDW COGSRMT Sales QtyRMT Sales PriceRMT COGSGIC Mvmt AllActual20516548262912235333000004494291817330000044571743027500000639216663275000006375679277000000063118868710000000629060545600000006AfterBudgetMLW Sales QtyMLW Sales PriceMLW COGSGDW Sales QtyGDW Sales PriceGDW COGSRMT Sales QtyRMT Sales PriceRMT COGSGIC Mvmt AllActual6291223533300000449429181733000004457174302750000063921666327500000637567927700000006311886871000000062906054560000000620929658200000006Label Y
$424m ($135m)($37m)($65m)($16m)($64m)($21m)($81m)4171439176650000256170708533000004475733060040000084246704677500000638392295487500006343783074000000063012461635000000624995101900000006Line Y152535455565758595105205165482629122353330000044942918173300000445717430275000006392166632750000063756792770000000637567927700000006311886871000000062906054560000000620929658200000006
Cash amp Gold on Hand - Q1 Movements
Ends
Q4 FY19OperationsDividendsCapitalised Mining ExplorationDKM AcquisitionOther capexIncome taxOtherQ1 FY20205165481579199970000000014741309157919994BeforeBudgetMLW Sales QtyMLW Sales PriceMLW COGSGDW Sales QtyGDW Sales PriceGDW COGSRMT Sales QtyRMT Sales PriceRMT COGSGIC Mvmt AllActual2051654815791999728767825576919997247023818769199972164444927691999720629479018919995186294790189199951660754041891999515281533618919995AfterBudgetMLW Sales QtyMLW Sales PriceMLW COGSGDW Sales QtyGDW Sales PriceGDW COGSRMT Sales QtyRMT Sales PriceRMT COGSGIC Mvmt AllActual2876782557691999724702381876919997216444492769199972062947901891999518629479018919995166075404189199951528153361891999514741309157919994Label Y
82512774189999998-40654437-30579326-1014970258-20000000-20219386-13260068-540224461000000132464218686741999726735103726919997231734155769199972113696414791999519629479018919995176185097189199951594453701891999515011421388419995Line Y152535455565758595205165481579199972876782557691999724702381876919997216444492769199972062947901891999518629479018919995166075404189199951528153361891999514741309157919994
Note Waterfall is prepared based on the Cash Flow statement as it stands when the quarterly is ready for release Changes may occur between this version and the final version of the cash flow in the management accounts
Cash amp Gold on Hand - Q2 Movements
Ends
Q1 FY19OperationsMine developmentExplorationOther capexIncome taxOtherQ2 FY191474130915791999700000016414659428999993BeforeBudgetMLW Sales QtyMLW Sales PriceMLW COGSGDW Sales QtyGDW Sales PriceGDW COGSRMT Sales QtyRMT Sales PriceRMT COGSGIC Mvmt AllActual147413091579199972237779744899999520648957137999994195464900379999941852081753799999416685232837999994AfterBudgetMLW Sales QtyMLW Sales PriceMLW COGSGDW Sales QtyGDW Sales PriceGDW COGSRMT Sales QtyRMT Sales PriceRMT COGSGIC Mvmt AllActual223777974489999952064895713799999419546490037999994185208175379999941668523283799999416414659428999993Label Y
76364882910799995-17288403109999999-11024671-10256725-18355847-270573409185595533034599962151337729349999420097723587999994190336537879999941760302518799999416549946133499992Line Y1525354555657514741309157919997223777974489999952064895713799999419546490037999994185208175379999941668523283799999416414659428999993
Note Waterfall is prepared based on the Cash Flow statement as it stands when the quarterly is ready for release Changes may occur between this version and the final version of the cash flow in the management accounts
Cash amp Gold on Hand - Q2 Movements
Ends
Q1 FY20OperationsCapitalised Mining ExplorationOther capexIncome taxOtherQ2 FY201474130915791999700000016881196810859996BeforeBudgetMLW Sales QtyMLW Sales PriceMLW COGSGDW Sales QtyGDW Sales PriceGDW COGSRMT Sales QtyRMT Sales PriceRMT COGSGIC Mvmt AllActual147413091579199972473972032485999521497149024859995204533215248599951874883882485999517228720124859995AfterBudgetMLW Sales QtyMLW Sales PriceMLW COGSGDW Sales QtyGDW Sales PriceGDW COGSRMT Sales QtyRMT Sales PriceRMT COGSGIC Mvmt AllActual247397203248599952149714902485999520453321524859995187488388248599951722872012485999516881196810859996Label Y
99984111669399977-32425713-10438275-17044827-15201187-34752331399999987197405147413899962311843467485999520975235274859995196010801748599951798877947485999517054958467859995Line Y1525354555657514741309157919997247397203248599952149714902485999520453321524859995187488388248599951722872012485999516881196810859996
Note Waterfall is prepared based on the Cash Flow statement as it stands when the quarterly is ready for release Changes may occur between this version and the final version of the cash flow in the management accounts
Cash amp Gold on Hand - Q3 Movements
Ends
Q2 FY19OperationsDividendsMine developmentExplorationOther capexIncome taxOtherQ3 FY1916425052228999996000000014396948046919999BeforeBudgetMLW Sales QtyMLW Sales PriceMLW COGSGDW Sales QtyGDW Sales PriceGDW COGSRMT Sales QtyRMT Sales PriceRMT COGSGIC Mvmt AllActual16425052228999996253593527579199972129675705791999718622986097919998179564378979199981570046329791999814578446097919998AfterBudgetMLW Sales QtyMLW Sales PriceMLW COGSGDW Sales QtyGDW Sales PriceGDW COGSRMT Sales QtyRMT Sales PriceRMT COGSGIC Mvmt AllActual25359352757919997212967570579199971862298609791999817956437897919998157004632979199981457844609791999814396948046919999Label Y
89343005289200008-40625957-26737709600000001-6665482-22559746-11220172-1814980509999999820892202493459997233280549079199971995987157791999618289711997919998168284505979199981513945469791999814487697072419998Line Y15253545556575851642505222899999625359352757919997212967570579199971862298609791999817956437897919998157004632979199981457844609791999814396948046919999
Note Waterfall is prepared based on the Cash Flow statement as it stands when the quarterly is ready for release Changes may occur between this version and the final version of the cash flow in the management accounts
Cash amp Gold on Hand - 31 December 2019
Ends
June 2019OperationsDividendsMine developmentExplorationDKM AcquisitionOther capexIncome taxOtherDecember 2019205165481579199970000000016881196810859993BeforeBudgetMLW Sales QtyMLW Sales PriceMLW COGSGDW Sales QtyGDW Sales PriceGDW COGSRMT Sales QtyRMT Sales PriceRMT COGSGIC Mvmt AllActual2051654815791999738766236743859994347007930438599942840028914385999426341491385859993243414913858599932061507008585999317768944585859993AfterBudgetMLW Sales QtyMLW Sales PriceMLW COGSGDW Sales QtyGDW Sales PriceGDW COGSRMT Sales QtyRMT Sales PriceRMT COGSGIC Mvmt AllActual3876623674385999434700793043859994284002891438599942634149138585999324341491385859993206150700858599931776894458585999316881196810859993Label Y
1824968858594-40654437-63005039-20587977580000002-20000000-37264213-28461255-8877477752964139245088999336733514893859994315505410938599942737089026485999225341491385859993224782807358599931919200733585999317325070698359993Line Y152535455565758595205165481579199973876623674385999434700793043859994284002891438599942634149138585999324341491385859993206150700858599931776894458585999316881196810859993
Cash amp Gold on Hand - 31 December 2019
Ends
June 2019OperationsMine developmentExplorationOther capexIncome taxOtherDecember 2019DKM AcquisitionDividendsDecember 201920516548157919997000000229466405108599960016881196810859996BeforeBudgetMLW Sales QtyMLW Sales PriceMLW COGSGDW Sales QtyGDW Sales PriceGDW COGSRMT Sales QtyRMT Sales PriceRMT COGSGIC Mvmt AllActual205165481579199973876623674385999432465732843859994304069350858599962668051378585999623834388285859996NA2294664051085999620946640510859996AfterBudgetMLW Sales QtyMLW Sales PriceMLW COGSGDW Sales QtyGDW Sales PriceGDW COGSRMT Sales QtyRMT Sales PriceRMT COGSGIC Mvmt AllActual387662367438599943246573284385999430406935085859996266805137858599962383438828585999622946640510859996NA2094664051085999616881196810859996Label Y
$1825m ($630m)($206m)($373m)($285m)($89m)($200m)($407m)296413924508899933561598479385999431436333964859998285437244358599962525745103585999623390514398359996NA2194664051085999618913918660859996Line Y15253545556575859510520516548157919997387662367438599943246573284385999430406935085859996266805137858599962383438828585999622946640510859996229466405108599962094664051085999616881196810859996
Cash amp Bullion on Hand - 31 December 2019
Ends
June 2019OperationsMine developmentExplorationOther capexIncome taxOtherCash and Bullion before Acquisitions amp DividendsDKM AcquisitionDividendsDecember 201920516548200000022946640600168811969BeforeBudgetMLW Sales QtyMLW Sales PriceMLW COGSGDW Sales QtyGDW Sales PriceGDW COGSRMT Sales QtyRMT Sales PriceRMT COGSGIC Mvmt AllActual2051654823842603833299999832915425632999998309283452752733648667524033074975NA229466406209466406AfterBudgetMLW Sales QtyMLW Sales PriceMLW COGSGDW Sales QtyGDW Sales PriceGDW COGSRMT Sales QtyRMT Sales PriceRMT COGSGIC Mvmt AllActual3842603833299999832915425632999998309283452752733648667524033074975229466406NA209466406168811969Label Y
$1791m ($551m)($199m)($359m)($330m)($109m)($200m)($407m)2947129326649999635670731982999998319218854539999962913241597525684780825234898577875NA2194664061891391875Line Y1525354555657585951052051654823842603833299999832915425632999998309283452752733648667524033074975229466406229466406209466406168811969
Cash amp Gold on Hand - Q3 Movements
Ends
Q2 FY20OperationsCapitalised Mining ExplorationOther capexIncome taxOtherQ3 FY20DividendsQ3 FY201688119681085999600000020944739757919991016879296057919991BeforeBudgetMLW Sales QtyMLW Sales PriceMLW COGSGDW Sales QtyGDW Sales PriceGDW COGSRMT Sales QtyRMT Sales PriceRMT COGSGIC Mvmt AllActual168811968108599962761787235791999124613937157919991238428719579199912263386975791999121071124757919991NA20944739757919991AfterBudgetMLW Sales QtyMLW Sales PriceMLW COGSGDW Sales QtyGDW Sales PriceGDW COGSRMT Sales QtyRMT Sales PriceRMT COGSGIC Mvmt AllActual276178723579199912461393715791999123842871957919991226338697579199912107112475791999120944739757919991NA16879296057919991Label Y
$1074m ($300m)($77m)($121m)($156m)($13m)($407m)222495345843899942611590475791999124228404557919991232383708579199912185249725791999121007932257919991NA18912017907919991Line Y152535455565758595168811968108599962761787235791999124613937157919991238428719579199912263386975791999121071124757919991209447397579199912094473975791999116879296057919991
Note Waterfall is prepared based on the Cash Flow statement as it stands when the quarterly is ready for release Changes may occur between this version and the final version of the cash flow in the management accounts
Cash amp Gold on Hand - Q3 Movements
Ends
Q2 FY20OperationsCapitalised Mining ExplorationOther capexOtherQ3 FY20Income taxDividendsQ3 FY201688119681085999600000225074847579199910016879296057919991BeforeBudgetMLW Sales QtyMLW Sales PriceMLW COGSGDW Sales QtyGDW Sales PriceGDW COGSRMT Sales QtyRMT Sales PriceRMT COGSGIC Mvmt AllActual1688119681085999627617872357919991246139371579199912384287195791999122633869757919991NA2250748475791999120944739757919991AfterBudgetMLW Sales QtyMLW Sales PriceMLW COGSGDW Sales QtyGDW Sales PriceGDW COGSRMT Sales QtyRMT Sales PriceRMT COGSGIC Mvmt AllActual2761787235791999124613937157919991238428719579199912263386975791999122507484757919991NA2094473975791999116879296057919991Label Y
$1074m ($300m)($77m)($121m)($13m)($156m)($407m)2224953458438999426115904757919991242284045579199912323837085791999122570677257919991NA2172611225791999118912017907919991Line Y152535455565758595168811968108599962761787235791999124613937157919991238428719579199912263386975791999122507484757919991225074847579199912094473975791999116879296057919991
Note Waterfall is prepared based on the Cash Flow statement as it stands when the quarterly is ready for release Changes may occur between this version and the final version of the cash flow in the management accounts
Cash amp Gold on Hand - Q4 Movements
Ends
Q3 FY20OperationsCapitalised Mining ExplorationOther capexIncome taxOtherQ4 FY201687929605791999400000020928474457919988BeforeBudgetMLW Sales QtyMLW Sales PriceMLW COGSGDW Sales QtyGDW Sales PriceGDW COGSRMT Sales QtyRMT Sales PriceRMT COGSGIC Mvmt AllActual168792960579199942777111782291998924878052357919988237967979579199882286235965791998821349275757919988AfterBudgetMLW Sales QtyMLW Sales PriceMLW COGSGDW Sales QtyGDW Sales PriceGDW COGSRMT Sales QtyRMT Sales PriceRMT COGSGIC Mvmt AllActual277711178229199892487805235791998823796797957919988228623596579199882134927575791998820928474457919988Label Y
10891821764999998-28930654649999999-10812544-9344383-15130839-420801299999999632232520694041999263245850904199924337425157919988233295788079199882210581770791998821138875107919988Line Y1525354555657516879296057919994277711178229199892487805235791998823796797957919988228623596579199882134927575791998820928474457919988
Note Waterfall is prepared based on the Cash Flow statement as it stands when the quarterly is ready for release Changes may occur between this version and the final version of the cash flow in the management accounts
Cash amp Gold on Hand - Q4 Movements
Ends
Q3 FY20OperationsCapitalised Mining ExplorationOther capexOtherQ4 FY20Income taxQ4 FY20168792960579199940000022441558357919988020928474457919988BeforeBudgetMLW Sales QtyMLW Sales PriceMLW COGSGDW Sales QtyGDW Sales PriceGDW COGSRMT Sales QtyRMT Sales PriceRMT COGSGIC Mvmt AllActual1687929605791999427771117822919989248780523579199882379679795791998822862359657919988NA22441558357919988AfterBudgetMLW Sales QtyMLW Sales PriceMLW COGSGDW Sales QtyGDW Sales PriceGDW COGSRMT Sales QtyRMT Sales PriceRMT COGSGIC Mvmt AllActual2777111782291998924878052357919988237967979579199882286235965791998822441558357919988NA20928474457919988Label Y
$1089m ($289m)($108m)($93m)($42m)($151m)22325206940419992632458509041999243374251579199882332957880791998822651959007919988NA21685016407919988Line Y15253545556575851687929605791999427771117822919989248780523579199882379679795791998822862359657919988224415583579199882244155835791998820928474457919988
Note Waterfall is prepared based on the Cash Flow statement as it stands when the quarterly is ready for release Changes may occur between this version and the final version of the cash flow in the management accounts
Cash amp Bullion on Hand - 30 June 2020
Ends
June 2019OperationsMine developmentExplorationOther capexOtherIncome taxDKM AcquisitionDividendsJune 2020205165482000003756792770000000600020929658200000006BeforeBudgetMLW Sales QtyMLW Sales PriceMLW COGSGDW Sales QtyGDW Sales PriceGDW COGSRMT Sales QtyRMT Sales PriceRMT COGSGIC Mvmt AllActual20516548262912235333000004494291817330000044571743027500000639216663275000006375679277000000063118868710000000629060545600000006AfterBudgetMLW Sales QtyMLW Sales PriceMLW COGSGDW Sales QtyGDW Sales PriceGDW COGSRMT Sales QtyRMT Sales PriceRMT COGSGIC Mvmt AllActual6291223533300000449429181733000004457174302750000063921666327500000637567927700000006311886871000000062906054560000000620929658200000006Label Y
$424m ($135m)($37m)($65m)($16m)($64m)($21m)($81m)4171439176650000256170708533000004475733060040000084246704677500000638392295487500006343783074000000063012461635000000624995101900000006Line Y152535455565758595105205165482629122353330000044942918173300000445717430275000006392166632750000063756792770000000637567927700000006311886871000000062906054560000000620929658200000006
Cash amp Gold on Hand - FY2019 YTD
Ends
Jun-18OperationsDividendsMine developmentExplorationOther capexIncome taxOtherJun-19202277539000000018869714553999996BeforeBudgetMLW Sales QtyMLW Sales PriceMLW COGSGDW Sales QtyGDW Sales PriceGDW COGSRMT Sales QtyRMT Sales PriceRMT COGSGIC Mvmt AllActual202277539520939342759999994397431487599999934361109627999997308772787859999952513267215399999619735572153999996AfterBudgetMLW Sales QtyMLW Sales PriceMLW COGSGDW Sales QtyGDW Sales PriceGDW COGSRMT Sales QtyRMT Sales PriceRMT COGSGIC Mvmt AllActual52093934275999999439743148759999993436110962799999730877278785999995251326721539999961973557215399999618869714553999996Label Y
31866180375999999-81196194-96132052480000004-34838308420000002-57446066319999993-53971000-865857636160844088480341245759999993916771225199999832619194206999993280049754699999932243412215399999619302643353999996Line Y152535455565758520227753952093934275999999439743148759999993436110962799999730877278785999995251326721539999961973557215399999618869714553999996
Note Waterfall is prepared based on the Cash Flow statement as it stands when the quarterly is ready for release Changes may occur between this version and the final version of the cash flow in the management accounts
Cash amp Gold on Hand - FY2019 YTD
Ends
Jun-18OperationsDividendsMine developmentExplorationOther capexIncome taxOtherJun-19208802950000000021964535032372868BeforeBudgetMLW Sales QtyMLW Sales PriceMLW COGSGDW Sales QtyGDW Sales PriceGDW COGSRMT Sales QtyRMT Sales PriceRMT COGSGIC Mvmt AllActual208802950551887547543728714706913535437287137455930106372869339720992643728672822749263237286822830392632372868AfterBudgetMLW Sales QtyMLW Sales PriceMLW COGSGDW Sales QtyGDW Sales PriceGDW COGSRMT Sales QtyRMT Sales PriceRMT COGSGIC Mvmt AllActual55188754754372871470691353543728713745593010637286933972099264372867282274926323728682283039263237286821964535032372868Label Y
34308459754372871-81196194-96132052480000004-34838308420000002-57446066319999993-53971000-86585763803452487718643551128945054372871422625327303728735714014685372865310997959483728652552894263237286822397463832372868Line Y152535455565758520880295055188754754372871470691353543728713745593010637286933972099264372867282274926323728682283039263237286821964535032372868
Note Waterfall is prepared based on the Cash Flow statement as it stands when the quarterly is ready for release Changes may occur between this version and the final version of the cash flow in the management accounts
The FY21 key guidance elements are
Gold Production 355000 - 380000 ounces
C1 Cash Costs including royalties A$1030 - 1090 per ounce
All in Sustaining Cost A$1230 - 1300 per ounce
Growth Capital A$50 ndash 60 million1
Exploration A$35 million
McPhillamys A$15 million2
FY21 GUIDANCE
Regis is expecting a strong year of growth within the operations as production continues to lift in linewith the targeted growth profile heading to 400000oz pa from internal development optionsProduction rate is planned to lift above historic annual rate in the second half of the year
1 Growth Capital includes open pit and underground pre-production mining costs site infrastructure and camp expansion costs 2 McPhillamys spend for FY21 is a minimum of A$15m Regis will assess additional early long lead items and in the case of early approval of the Companyrsquos Development Application by the
Independent Planning Commission the expenditure on McPhillamys for FY21 could be approximately A$60m
9
For
per
sona
l use
onl
y
REVIEW OF FY202010
THE CURRENT BUSINESSrsquo PERFORMANCENet profit after tax of $200 million (FY19 $163 million) with a NPAT margin of 26 and ROE of 24
Dividends for FY2020 of 16 cents per share fully franked for a 41 grossed1 up yield
EBITDA of $394 million with strong EBITDA margin of 52
Cash and bullion of $2093 million2 as at 30 June 2020
Hedging reduced to ~399koz at end FY20 from approximately 452koz at end FY19 Deliveries into hedges increased to approximately 20000 ounces per quarter
1 Grossed up for 100 franking Annualised dividend yield of 16cps at a closing share price of $555 on 25 August 20202 Includes bullion on hand valued at $2576 per ounce
PROGRESSING FUTURE GROWTH
McPhillamys Development Application submitted and Responses to Submissions nearing completionTripled exploration tenure around Duketon Operations and increased Exploration budget by 32 to $35millionMoving to investment decision for Garden Well Underground Project For
per
sona
l use
onl
y
Additional Financial Information
For
per
sona
l use
onl
y
30 June 2020 30 June 2019$rsquo000 $rsquo000
Revenue 756657 654807Cost of goods sold (452011) (401970)Gross profit 304646 252837Other income (150) 4379
Investor and corporate costs (3408) (2521)Personnel costs (10062) (9360)Share-based payment expense (144) (1082)Occupancy costs (245) (1005)Other corporate administrative expenses (1052) (659)Exploration and evaluation written off (1686) (6729)Other (1215) (940)Finance costs (2024) (1447)Profit before income tax 284660 233473
Income tax expense (85143) (70323)Net profit 199517 163150
FY2020 ndash Profit amp Loss12
Earnings Per Share (cents per share) 3926 3218
For
per
sona
l use
onl
y
13
30 June 2020 30 June 2019$rsquo000 $rsquo000
Cash flows from operating activitiesReceipts from gold sales 755791 652450Payments to suppliers and employees (348923) (326680)Income tax paid (63792) (53971)Other receipts(payments) (63) 3686Net cash from operating activities 343013 275485Cash flows from investing activitiesAcquisition of plant and equipment (net) (51114) (56395)Payments for exploration and evaluation (37118) (34840)Payments for acquisition of exploration assets (21281) -Payments for mine properties under development (57307) (35632)Payments for mine properties (77524) (60500)Other receipts(payments) - 77Net cash used in investing activities (244344) (187290)Cash flows from financing activitiesProceeds from issue of shares 279 1697Payment of transaction costs (14) (65)Payment of lease liabilities (13894) (1052)Dividends paid (81309) (81196)Net cash used in financing activities (94938) (80616)Net increase(decrease) in cash and cash equivalents 3731 7579Cash and cash equivalents at 1 July 188697 181118Cash and cash equivalents at 30 June 192428 188697
FY2020 ndash Cash Flow StatementF
or p
erso
nal u
se o
nly
14 30 June 2020 30 June 2019$rsquo000 $rsquo000
Current assetsCash and cash equivalents 192428 188697Inventories 74430 56077Other current assets 10847 10141Total current assets 277705 254915Non-current assetsInventories 63503 55898Property plant and equipment 261676 242988Exploration and evaluation expenditure 230260 185748Mine properties under development 2188 44163Mine properties 275939 167713Right-of-use assets 38034 -Other 2572 2572Total non-current assets 874172 699082Total assets 1151877 953997Current liabilitiesTrade and other payables 74181 67613Income tax payable 7471 12224Lease Liabilities 15856 793Other 3994 3479Total current liabilities 101502 84109Non-current liabilitiesDeferred tax liabilities 117408 91305Provisions amp Lease liabilities 97886 62119Total non-current liabilities 215294 153424Total liabilities 316796 237533Net AssetsTotal Equity
835081835081
716464716464
FY2020 ndash Balance SheetF
or p
erso
nal u
se o
nly
ldquoSPOT DEFERREDrdquo ndash FLEXIBLE GOLD HEDGE BOOK (30 June 2020)
Regisrsquo hedge position reduced to ~399koz at an average of A$1614oz
Regis is currently actively managing the process of selling into thelowest price hedges and reduced its hedges by approximately 52000ounces in FY20
Regis has recently increased the rate at which it is delivering into itsmost out of the money hedges to 20000 ounces per quarter
Hedging Price Range Quantity (ozrsquos)
A$1400 - $1500 157000
A$1500 - $1600 15000
A$1600 - $1700 36000
A$1700 - $1800 131000
A$1800 - $1900 60000
15
Period Volume (ozrsquos)
Today ndash Dec 2020 600000
Jan 2021 ndash Dec 2021 400000
Jan 2022 ndash Dec 2022 200000
Jan 2023 ndash June 2023 100000
July 2023 Nil
Table 2 Current Hedging Volume LimitsTable 1 Hedging Volumes amp Price Ranges
2200
0
500
1000
1500
2000
2500
Gold Price
Ave spot priceRealised Price
2333
For
per
sona
l use
onl
y
FY 2020 FY2019
Physicals DNO DSO TOTAL TOTAL Variance
Ore mined (Mbcm) 136 280 416 428 -3
Waste mined (Mbcm) 681 1956 2637 2812 -6
Stripping ratio (wo) 50 70 63 66 -5
Ore mined (Mtonnes) 275 723 998 1014 -2
Ore milled (Mtonnes) 300 637 937 943 -1
Head grade (gt) 104 135 125 127 -2
Recovery () 923 940 935 940 -1
Gold production (ounces) 92184 259858 352042 363418 -3
FY2020 PHYSICALS16
For
per
sona
l use
onl
y
Further information Jim Beyer | Managing Director amp CEO+ 61 8 9442 2200
For
per
sona
l use
onl
y
| Values | Line X | Ends | Before | After | Line Y | Label Y | Y Label | CASH FLOWS FROM OPERATIONS | Category | Manual Adj | ||||||||||||||||||
| Jun-18 | 2088 | 15 | $2088m | 2088 | Receipts from gold sales | Operations | 652450151 | 652450151 | ||||||||||||||||||||
| Operations | 3431 | 25 | - | $2088m | $5519m | $5519m | $3803m | $3431m | Option premium income | Other | 1366000 | 1366000 | ||||||||||||||||
| Dividends | (812) | 35 | - | $5519m | $4707m | $4707m | $5113m | ($812m) | Other income | Other | - | - | ||||||||||||||||
| Mine development | (961) | 45 | - | $4707m | $3746m | $3746m | $4226m | ($961m) | Payments to suppliers and employees - DNO | Operations | (84224766) | (84224766) | ||||||||||||||||
| Exploration | (348) | 55 | - | $3746m | $3397m | $3397m | $3571m | ($348m) | Payments to suppliers and employees - DSO | Operations | (228404216) | (228404216) | ||||||||||||||||
| Other capex | (574) | 65 | - | $3397m | $2823m | $2823m | $3110m | ($574m) | Payments to suppliers and employees - CORP | Other | (14051447) | (14051447) | ||||||||||||||||
| Income tax | (540) | 75 | - | $2823m | $2283m | $2283m | $2553m | ($540m) | Interest received | Other | 2388192 | 2388192 | ||||||||||||||||
| Other | (87) | 85 | - | $2283m | $2196m | $2196m | $2240m | ($87m) | Income tax paid | Income tax | (53971000) | (53971000) | ||||||||||||||||
| Jun-19 | $2196m | Interest paid | Other | (85486) | (85486) | |||||||||||||||||||||||
| Proceeds from rental income | Other | 16500 | 16500 | |||||||||||||||||||||||||
| Net cash flows from(used in) operations | 275483928 | 275483928 | ||||||||||||||||||||||||||
| CASH FLOWS FROM INVESTING ACTIVITIES | ||||||||||||||||||||||||||||
| Payments for plant amp equipment | Other capex | (56425779) | (56425779) | |||||||||||||||||||||||||
| Payments for exploration amp evaluation - WA | Exploration | (24685627) | (24685627) | |||||||||||||||||||||||||
| Payments for exploration amp evaluation - NSW | Exploration | (10152682) | (10152682) | |||||||||||||||||||||||||
| Payments for development - TWL BNY DOG RMT | Mine development | (35632149) | (35632149) | |||||||||||||||||||||||||
| Payments for mine properties - DNO | Mine development | (4690352) | (4690352) | |||||||||||||||||||||||||
| Payments for mine properties - DSO | Mine development | (55809551) | (55809551) | |||||||||||||||||||||||||
| Payments for term deposits | Other | 77000 | 77000 | |||||||||||||||||||||||||
| Proceeds on disposal of term deposits | Other | (1708) | (1708) | |||||||||||||||||||||||||
| Payments for AFS investments | Other capex | - | ||||||||||||||||||||||||||
| Acquisition of exploration assets (net of cash) | Exploration | - | ||||||||||||||||||||||||||
| Proceeds on disposal of PampE | Other capex | 31346 | 31346 | |||||||||||||||||||||||||
| Net cash flows used in investing activities | (187289502) | (187289502) | ||||||||||||||||||||||||||
| CASH FLOWS FROM FINANCING ACTIVITIES | ||||||||||||||||||||||||||||
| Proceeds from equity raisings | - | |||||||||||||||||||||||||||
| Proceeds from exercise of options | Other | 1697500 | 1697500 | |||||||||||||||||||||||||
| Share issue costs | Other | (65127) | (65127) | |||||||||||||||||||||||||
| Dividends paid | Dividends | (81196194) | (81196194) | |||||||||||||||||||||||||
| Repayment of finance lease | Other capex | (1051633) | (1051633) | |||||||||||||||||||||||||
| Repayment of borrowings | - | |||||||||||||||||||||||||||
| Net cash flows from financing activities | (80615454) | (80615454) | ||||||||||||||||||||||||||
| Net increase(decrease) in cash amp equivalents | 7578972 | |||||||||||||||||||||||||||
| Cash amp bullion at the start of the period | 208802950 | |||||||||||||||||||||||||||
| Effects of exchange rate movements on cash | Operations | |||||||||||||||||||||||||||
| Movement in gold on hand | Operations | 3263429 | ||||||||||||||||||||||||||
| Cash amp bullion at the end of the period | 219645350 | |||||||||||||||||||||||||||
| Values | Line X | Ends | Before | After | Line Y | Label Y | Y Label | CASH FLOWS FROM OPERATIONS | Category | Manual Adj | ||||||||||||||||||
| Jun-18 | 2023 | 15 | $2023m | 2023 | Receipts from gold sales | Operations | 652450151 | 652450151 | ||||||||||||||||||||
| Operations | 3187 | 25 | - | $2023m | $5209m | $5209m | $3616m | $3187m | Option premium income | Other | 1366000 | 1366000 | ||||||||||||||||
| Dividends | (812) | 35 | - | $5209m | $4397m | $4397m | $4803m | ($812m) | Other income | Other | - | - | ||||||||||||||||
| Mine development | (961) | 45 | - | $4397m | $3436m | $3436m | $3917m | ($961m) | Payments to suppliers and employees - DNO | Operations | (84224766) | (84224766) | ||||||||||||||||
| Exploration | (348) | 55 | - | $3436m | $3088m | $3088m | $3262m | ($348m) | Payments to suppliers and employees - DSO | Operations | (228404216) | (228404216) | ||||||||||||||||
| Other capex | (574) | 65 | - | $3088m | $2513m | $2513m | $2800m | ($574m) | Payments to suppliers and employees - CORP | Other | (14051447) | (14051447) | ||||||||||||||||
| Income tax | (540) | 75 | - | $2513m | $1974m | $1974m | $2243m | ($540m) | Interest received | Other | 2388192 | 2388192 | ||||||||||||||||
| Other | (87) | 85 | - | $1974m | $1887m | $1887m | $1930m | ($87m) | Income tax paid | Income tax | (53971000) | (53971000) | ||||||||||||||||
| Jun-19 | $1887m | Interest paid | Other | (85486) | (85486) | |||||||||||||||||||||||
| Proceeds from rental income | Other | 16500 | 16500 | |||||||||||||||||||||||||
| Net cash flows from(used in) operations | 275483928 | 275483928 | ||||||||||||||||||||||||||
| CASH FLOWS FROM INVESTING ACTIVITIES | ||||||||||||||||||||||||||||
| Payments for plant amp equipment | Other capex | (56425779) | (56425779) | |||||||||||||||||||||||||
| Payments for exploration amp evaluation - WA | Exploration | (24685627) | (24685627) | |||||||||||||||||||||||||
| Payments for exploration amp evaluation - NSW | Exploration | (10152682) | (10152682) | |||||||||||||||||||||||||
| Payments for development - TWL BNY DOG RMT | Mine development | (35632149) | (35632149) | |||||||||||||||||||||||||
| Payments for mine properties - DNO | Mine development | (4690352) | (4690352) | |||||||||||||||||||||||||
| Payments for mine properties - DSO | Mine development | (55809551) | (55809551) | |||||||||||||||||||||||||
| Payments for term deposits | Other | 77000 | 77000 | |||||||||||||||||||||||||
| Proceeds on disposal of term deposits | Other | (1708) | (1708) | |||||||||||||||||||||||||
| Payments for AFS investments | Other capex | - | ||||||||||||||||||||||||||
| Acquisition of exploration assets (net of cash) | Exploration | - | ||||||||||||||||||||||||||
| Proceeds on disposal of PampE | Other capex | 31346 | 31346 | |||||||||||||||||||||||||
| Net cash flows used in investing activities | (187289502) | (187289502) | ||||||||||||||||||||||||||
| CASH FLOWS FROM FINANCING ACTIVITIES | ||||||||||||||||||||||||||||
| Proceeds from equity raisings | - | |||||||||||||||||||||||||||
| Proceeds from exercise of options | Other | 1697500 | 1697500 | |||||||||||||||||||||||||
| Share issue costs | Other | (65127) | (65127) | |||||||||||||||||||||||||
| Dividends paid | Dividends | (81196194) | (81196194) | |||||||||||||||||||||||||
| Repayment of finance lease | Other capex | (1051633) | (1051633) | |||||||||||||||||||||||||
| Repayment of borrowings | - | |||||||||||||||||||||||||||
| Net cash flows from financing activities | (80615454) | (80615454) | ||||||||||||||||||||||||||
| Net increase(decrease) in cash amp equivalents | 7578972 | |||||||||||||||||||||||||||
| Cash amp bullion at the start of the period | 202277539 | |||||||||||||||||||||||||||
| Effects of exchange rate movements on cash | Operations | |||||||||||||||||||||||||||
| Movement in gold on hand | Operations | (21159365) | ||||||||||||||||||||||||||
| 1764709 | Cash amp bullion at the end of the period | 188697146 | ||||||||||||||||||||||||||
| 89721 | ||||||||||||||||||||||||||||
| 369721 | 18267402 | |||||||||||||||||||||||||||
| 320732598 |
| Payments for Development | |||||||||||
| Pre-Production | MACA Invoice | Apr-19 | May-19 | Jun-19 | Q4 Total | ||||||
| DOG | Mar-19 | - 0 | 2627659 | - 0 | 2627659 | ||||||
| DOG | Apr-19 | - 0 | - 0 | 1003666 | 1003666 | ||||||
| DOG | - 0 | - 0 | - 0 | ||||||||
| - 0 | 2627659 | 1003666 | 3631325 | ||||||||
| RMT Underground | Apr-19 | May-19 | Jun-19 | Q4 Total | |||||||
| RMT UG | Mar-19 | 2468107 | - 0 | - 0 | 2468107 | ||||||
| RMT UG | Apr-19 | - 0 | 1518068 | - 0 | 1518068 | ||||||
| RMT UG | May-19 | - 0 | - 0 | 2151172 | 2151172 | ||||||
| Total | 2468107 | 1518068 | 2151172 | 6137346 | |||||||
| Payments for mine properties - DSO | |||||||||||
| Pre-Strip | MACA Invoice | Apr-19 | May-19 | Jun-19 | Q4 Total | ||||||
| ERL | Feb-19 | 683602 | 68360169 | ||||||||
| TWL | Feb-19 | 3909250 | 390925035 | ||||||||
| ERL | Mar-19 | 392619 | 39261934 | ||||||||
| TWL | Mar-19 | 4508648 | 450864805 | ||||||||
| ERL | Apr-19 | 21545847 | 21545847 | ||||||||
| TWL | Apr-19 | 330090393 | 330090393 | ||||||||
| RMT | Mar-19 | 2531 | 253117 | ||||||||
| RMT | Apr-19 | 1120185 | 112018483 | ||||||||
| RMT | May-19 | 45893944 | 45893944 | ||||||||
| Total - ERL | 683602 | 392619 | 215458 | 129167950 | |||||||
| Total - RMT | 2531 | 1120185 | 458939 | 158165544 | |||||||
| Total - TWL | 3909250 | 4508648 | 3300904 | 1171880233 | |||||||
| Total | 4595383 | 6021452 | 3975302 | 1459213727 | |||||||
| Deferred Costs | Mar-19 | Apr-19 | May-19 | Q4 Total | |||||||
| GDW | 1317665 | 1876997 | 1574726 | 4769388 | |||||||
| ERL | 45300 | - 33082 | 1052986 | 1065205 | |||||||
| RMT | - 0 | ||||||||||
| Total | 1362965 | 1843916 | 2627712 | 5834592 | |||||||
| Total by Pit | Apr-19 | May-19 | Jun-19 | Q4 Total | |||||||
| GDW | Total - GDW | 1317665 | 1876997 | 1574726 | 4769388 | ||||||
| ERL | Total - ERL | 728902 | 359538 | 1268444 | 2356884 | ||||||
| TWL | Total - TWL | 3909250 | 4508648 | 3300904 | 11718802 | ||||||
| RMT | Total - RMT | 2531 | 1120185 | 458939 | 1581655 | ||||||
| Total - DSO | 5958348 | 7865368 | 6603013 | 20426730 | |||||||
| Values | Line X | Ends | Before | After | Line Y | Label Y | Y Label | CASH FLOWS FROM OPERATIONS | Category | Statutory Adj | ||||||||||||||||||
| June 2019 | 205 | 2 | $205m | 205 | Receipts from gold sales | Operations | 755790612 | 755790612 | ||||||||||||||||||||
| Operations | 424 | 3 | - | $205m | $629m | $629m | $417m | $424m | Option premium income | Other | - | - | ||||||||||||||||
| Mine development | (135) | 4 | - | $629m | $494m | $494m | $562m | ($135m) | Other income | Other | 34894 | 34894 | ||||||||||||||||
| Exploration | (37) | 5 | - | $494m | $457m | $457m | $476m | ($37m) | Payments to suppliers and employees - DNO | Operations | (99376203) | (99376203) | ||||||||||||||||
| Other capex | (65) | 6 | - | $457m | $392m | $392m | $425m | ($65m) | Payments to suppliers and employees - DSO | Operations | (232858286) | (232858286) | ||||||||||||||||
| Other | (16) | 7 | - | $392m | $376m | $376m | $384m | ($16m) | Payments to suppliers and employees - CORP | Other | (16688243) | (16688243) | ||||||||||||||||
| 8 | $376m | $376m | Interest received | Other | 1007324 | 1007324 | ||||||||||||||||||||||
| Income tax | (64) | 9 | - | $376m | $312m | $312m | $344m | ($64m) | GIC Inventory Mvmt | GIC Mvmt | - | - | ||||||||||||||||
| DKM Acquisition | (21) | 10 | - | $312m | $291m | $291m | $301m | ($21m) | Income tax paid | Income tax | (63792406) | (63792406) | ||||||||||||||||
| Dividends | (81) | 11 | - | $291m | $209m | $209m | $250m | ($81m) | Interest paid | Other | (1104724) | (1104724) | ||||||||||||||||
| June 2020 | $209m | GIC Inventory Mvmt | GIC Mvmt | - | - | |||||||||||||||||||||||
| Net cash flows from(used in) operations | 343012969 | 343012969 | ||||||||||||||||||||||||||
| CASH FLOWS FROM INVESTING ACTIVITIES | ||||||||||||||||||||||||||||
| Payments for plant amp equipment | Other capex | (51134992) | (51134992) | |||||||||||||||||||||||||
| Payments for exploration amp evaluation - WA | Exploration | (27398818) | (27398818) | |||||||||||||||||||||||||
| Payments for exploration amp evaluation - NSW | Exploration | (9718696) | (9718696) | |||||||||||||||||||||||||
| Payments for development | Mine development | (57306547) | (57306547) | |||||||||||||||||||||||||
| Payments for mine properties - DNO | Mine development | (3078067) | (3078067) | |||||||||||||||||||||||||
| Payments for mine properties - DSO | Mine development | (74445922) | (74445922) | |||||||||||||||||||||||||
| Payments for termsecurity deposits | Other | (1221) | (1221) | |||||||||||||||||||||||||
| Proceeds on disposal of term deposits | Other | - | ||||||||||||||||||||||||||
| Payments for WALs | Other capex | - | ||||||||||||||||||||||||||
| Acquisition of exploration assets (net of cash) | DKM Acquisition | (21281415) | (21281415) | |||||||||||||||||||||||||
| Proceeds on disposal of PampE | Other capex | 21277 | 21277 | |||||||||||||||||||||||||
| Net cash flows used in investing activities | (244344402) | (244344402) | ||||||||||||||||||||||||||
| CASH FLOWS FROM FINANCING ACTIVITIES | ||||||||||||||||||||||||||||
| Proceeds from equity raisings | - | - | ||||||||||||||||||||||||||
| Proceeds from exercise of options | Other | 279000 | 279000 | |||||||||||||||||||||||||
| Share issue costs | Other | (14386) | (14386) | |||||||||||||||||||||||||
| Dividends paid | Dividends | (81308874) | (81308874) | |||||||||||||||||||||||||
| Repayment of finance lease | Other capex | (13893955) | (13893955) | |||||||||||||||||||||||||
| Repayment of borrowings | Operations | - | - | |||||||||||||||||||||||||
| Net cash flows from financing activities | (94938215) | (94938215) | ||||||||||||||||||||||||||
| Net increase(decrease) in cash amp equivalents | 3730352 | 3730352 | ||||||||||||||||||||||||||
| Cash amp bullion at the start of the period | 205165482 | Elisha Civil Elisha CivilDifference between bullion for quarterly vs accounts Adjusted agaisnt mvmt in gold on hand | 205165482 | |||||||||||||||||||||||||
| Effects of exchange rate movements on cash | Operations | - | ||||||||||||||||||||||||||
| Movement in gold on hand | Operations | 400748 | - | 400748 | ||||||||||||||||||||||||
| Cash amp bullion at the end of the period | 209296582 | 209296582 | ||||||||||||||||||||||||||
| GOH Cost for Accounts revalued to Selling Price for Quarterly | Cost | |||||||||||||||||||||||||||
| At 30-Jun | Oz | $oz | $ | |||||||||||||||||||||||||
| MLW | - | |||||||||||||||||||||||||||
| GDW | - | |||||||||||||||||||||||||||
| RMT | - | |||||||||||||||||||||||||||
| - | - | |||||||||||||||||||||||||||
| Values | Line X | Ends | Before | After | Line Y | Label Y | Y Label | CASH FLOWS FROM OPERATIONS | Category | Manual Adj | Apr-20 | May-20 | Jun-20 | |||||||||||||||||||
| Q3 FY20 | 1688 | 15 | $1688m | 1688 | Receipts from gold sales | Operations | 239209941 | 61534907 | 61116192 | 116558842 | ||||||||||||||||||||||
| Operations | 1089 | 25 | - | $1688m | $2777m | $2777m | $2233m | $1089m | Option premium income | Other | - | - | - | - | ||||||||||||||||||
| Capitalised Mining | (289) | 35 | - | $2777m | $2488m | $2488m | $2632m | ($289m) | Other income | Other | 22508 | 17836 | 2280 | 2392 | ||||||||||||||||||
| Exploration | (108) | 45 | - | $2488m | $2380m | $2380m | $2434m | ($108m) | Payments to suppliers and employees - DNO | Operations | (22933926) | (11538320) | (6158155) | (5237451) | ||||||||||||||||||
| Other capex | (93) | 55 | - | $2380m | $2286m | $2286m | $2333m | ($93m) | Payments to suppliers and employees - DSO | Operations | (72606256) | (31657306) | (16512050) | (24436900) | ||||||||||||||||||
| Other | (42) | 65 | - | $2286m | $2244m | $2244m | $2265m | ($42m) | Payments to suppliers and employees - CORP | Other | (4285083) | (1925232) | (753452) | (1606399) | ||||||||||||||||||
| Q4 FY20 | 75 | $2244m | ERRORNA | ERRORNA | $2244m | ERRORNA | Interest received | Other | 97155 | 44231 | 27040 | 25884 | ||||||||||||||||||||
| Income tax | (151) | 85 | - | $2244m | $2093m | $2093m | $2169m | ($151m) | Income tax paid | Income tax | (15130839) | (5547601) | (4808025) | (4775213) | ||||||||||||||||||
| Q4 FY20 | $2093m | Interest paid | Other | (42349) | (7863) | (7572) | (26914) | |||||||||||||||||||||||||
| - | ||||||||||||||||||||||||||||||||
| Net cash flows from(used in) operations | 124331151 | 10920652 | 32906258 | 80504241 | ||||||||||||||||||||||||||||
| CASH FLOWS FROM INVESTING ACTIVITIES | ||||||||||||||||||||||||||||||||
| Payments for plant amp equipment | Other capex | (9049407) | (3741077) | (3448433) | (1859897) | |||||||||||||||||||||||||||
| Payments for exploration amp evaluation - WA | Exploration | (7076164) | (1802844) | (3416589) | (1856731) | |||||||||||||||||||||||||||
| Payments for exploration amp evaluation - NSW | Exploration | (2454965) | (1000956) | (521105) | (932904) | |||||||||||||||||||||||||||
| Payments for development | Capitalised Mining | (29316090) | 1457447 | (6942071) | (23831466) | |||||||||||||||||||||||||||
| Payments for mine properties - DNO | Capitalised Mining | (1222223) | 106895 | (375908) | (953210) | |||||||||||||||||||||||||||
| Payments for mine properties - DSO | Capitalised Mining | 1607658 | (19271552) | (8669156) | 29548366 | |||||||||||||||||||||||||||
| Payments for term deposits | Other | (244) | - | (244) | - | |||||||||||||||||||||||||||
| Proceeds on disposal of term deposits | Other | - | - | - | - | |||||||||||||||||||||||||||
| Payments for WALs | Other capex | - | - | - | - | |||||||||||||||||||||||||||
| Acquisition of exploration assets (net of cash) | Exploration | (1281415) | (1281415) | - | - | |||||||||||||||||||||||||||
| Proceeds on disposal of PampE | Other capex | 67271 | 62726 | - | 4545 | |||||||||||||||||||||||||||
| - | ||||||||||||||||||||||||||||||||
| Net cash flows used in investing activities | (48725579) | (25470776) | (23373506) | 118703 | ||||||||||||||||||||||||||||
| CASH FLOWS FROM FINANCING ACTIVITIES | ||||||||||||||||||||||||||||||||
| Proceeds from equity raisings | - | |||||||||||||||||||||||||||||||
| Proceeds from exercise of options | - | |||||||||||||||||||||||||||||||
| Share issue costs | - | - | - | - | ||||||||||||||||||||||||||||
| Dividend paid | Dividends | - | - | - | - | |||||||||||||||||||||||||||
| Repayment of finance lease | Other capex | (362247) | (96615) | (96906) | (168726) | |||||||||||||||||||||||||||
| Repayment of borrowings | - | |||||||||||||||||||||||||||||||
| Net cash flows from financing activities | (362247) | (96615) | (96906) | (168726) | ||||||||||||||||||||||||||||
| Net increase(decrease) in cash amp equivalents | 75243325 | (14646739) | 9435846 | 80454218 | ||||||||||||||||||||||||||||
| Cash amp bullion at the start of the period | 168792961 | |||||||||||||||||||||||||||||||
| Effects of exchange rate movements on cash | Operations | - | ||||||||||||||||||||||||||||||
| Movement in gold on hand | Operations | (34751541) | 11380540 | (629847) | (45502234) | |||||||||||||||||||||||||||
| Cash amp bullion at the end of the period | 209284745 | (3266199) | 8805999 | 34951984 | ||||||||||||||||||||||||||||
| GOH Cost for Accounts revalued to Selling Price for Quarterly | Cost | Sales | ||||||||||||||||||||||||||||||
| At 30-Jun | Oz | $oz | $ | $oz | $ | |||||||||||||||||||||||||||
| MLW | 932746 | 1551 | 1446431 | 2576 | 2403015 | |||||||||||||||||||||||||||
| GDW | 3641826 | 1181 | 4302218 | 2576 | 9382364 | |||||||||||||||||||||||||||
| RMT | 1973258 | 1445 | 2851935 | 2576 | 5083665 | |||||||||||||||||||||||||||
| 6547830 | 8600584 | 16869043 |
| Values | Line X | Ends | Before | After | Line Y | Label Y | Y Label | CASH FLOWS FROM OPERATIONS | Category | Manual Adj | Apr-20 | May-20 | Jun-20 | |||||||||||||||||||
| Q3 FY20 | 1688 | 15 | $1688m | 1688 | Receipts from gold sales | Operations | 239209941 | 61534907 | 61116192 | 116558842 | ||||||||||||||||||||||
| Operations | 1089 | 25 | - | $1688m | $2777m | $2777m | $2233m | $1089m | Option premium income | Other | - | - | - | - | ||||||||||||||||||
| Capitalised Mining | (289) | 35 | - | $2777m | $2488m | $2488m | $2632m | ($289m) | Other income | Other | 22508 | 17836 | 2280 | 2392 | ||||||||||||||||||
| Exploration | (108) | 45 | - | $2488m | $2380m | $2380m | $2434m | ($108m) | Payments to suppliers and employees - DNO | Operations | (22933926) | (11538320) | (6158155) | (5237451) | ||||||||||||||||||
| Other capex | (93) | 55 | - | $2380m | $2286m | $2286m | $2333m | ($93m) | Payments to suppliers and employees - DSO | Operations | (72606256) | (31657306) | (16512050) | (24436900) | ||||||||||||||||||
| Income tax | (151) | 65 | - | $2286m | $2135m | $2135m | $2211m | ($151m) | Payments to suppliers and employees - CORP | Other | (4285083) | (1925232) | (753452) | (1606399) | ||||||||||||||||||
| Other | (42) | 75 | - | $2135m | $2093m | $2093m | $2114m | ($42m) | Interest received | Other | 97155 | 44231 | 27040 | 25884 | ||||||||||||||||||
| Q4 FY20 | $2093m | Income tax paid | Income tax | (15130839) | (5547601) | (4808025) | (4775213) | |||||||||||||||||||||||||
| Interest paid | Other | (42349) | (7863) | (7572) | (26914) | |||||||||||||||||||||||||||
| - | ||||||||||||||||||||||||||||||||
| Net cash flows from(used in) operations | 124331151 | 10920652 | 32906258 | 80504241 | ||||||||||||||||||||||||||||
| CASH FLOWS FROM INVESTING ACTIVITIES | ||||||||||||||||||||||||||||||||
| Payments for plant amp equipment | Other capex | (9049407) | (3741077) | (3448433) | (1859897) | |||||||||||||||||||||||||||
| Payments for exploration amp evaluation - WA | Exploration | (7076164) | (1802844) | (3416589) | (1856731) | |||||||||||||||||||||||||||
| Payments for exploration amp evaluation - NSW | Exploration | (2454965) | (1000956) | (521105) | (932904) | |||||||||||||||||||||||||||
| Payments for development | Capitalised Mining | (29316090) | 1457447 | (6942071) | (23831466) | |||||||||||||||||||||||||||
| Payments for mine properties - DNO | Capitalised Mining | (1222223) | 106895 | (375908) | (953210) | |||||||||||||||||||||||||||
| Payments for mine properties - DSO | Capitalised Mining | 1607658 | (19271552) | (8669156) | 29548366 | |||||||||||||||||||||||||||
| Payments for term deposits | Other | (244) | - | (244) | - | |||||||||||||||||||||||||||
| Proceeds on disposal of term deposits | Other | - | - | - | - | |||||||||||||||||||||||||||
| Payments for WALs | Other capex | - | - | - | - | |||||||||||||||||||||||||||
| Acquisition of exploration assets (net of cash) | Exploration | (1281415) | (1281415) | - | - | |||||||||||||||||||||||||||
| Proceeds on disposal of PampE | Other capex | 67271 | 62726 | - | 4545 | |||||||||||||||||||||||||||
| - | ||||||||||||||||||||||||||||||||
| Net cash flows used in investing activities | (48725579) | (25470776) | (23373506) | 118703 | ||||||||||||||||||||||||||||
| CASH FLOWS FROM FINANCING ACTIVITIES | ||||||||||||||||||||||||||||||||
| Proceeds from equity raisings | - | |||||||||||||||||||||||||||||||
| Proceeds from exercise of options | - | |||||||||||||||||||||||||||||||
| Share issue costs | - | - | - | - | ||||||||||||||||||||||||||||
| Dividend paid | Dividends | - | - | - | - | |||||||||||||||||||||||||||
| Repayment of finance lease | Other capex | (362247) | (96615) | (96906) | (168726) | |||||||||||||||||||||||||||
| Repayment of borrowings | - | |||||||||||||||||||||||||||||||
| Net cash flows from financing activities | (362247) | (96615) | (96906) | (168726) | ||||||||||||||||||||||||||||
| Net increase(decrease) in cash amp equivalents | 75243325 | (14646739) | 9435846 | 80454218 | ||||||||||||||||||||||||||||
| Cash amp bullion at the start of the period | 168792961 | |||||||||||||||||||||||||||||||
| Effects of exchange rate movements on cash | Operations | - | ||||||||||||||||||||||||||||||
| Movement in gold on hand | Operations | (34751541) | 11380540 | (629847) | (45502234) | |||||||||||||||||||||||||||
| Cash amp bullion at the end of the period | 209284745 | (3266199) | 8805999 | 34951984 | ||||||||||||||||||||||||||||
| GOH Cost for Accounts revalued to Selling Price for Quarterly | Cost | Sales | ||||||||||||||||||||||||||||||
| At 30-Jun | Oz | $oz | $ | $oz | $ | |||||||||||||||||||||||||||
| MLW | 932746 | 1551 | 1446431 | 2576 | 2403015 | |||||||||||||||||||||||||||
| GDW | 3641826 | 1181 | 4302218 | 2576 | 9382364 | |||||||||||||||||||||||||||
| RMT | 1973258 | 1445 | 2851935 | 2576 | 5083665 | |||||||||||||||||||||||||||
| 6547830 | 8600584 | 16869043 |
| Values | Line X | Ends | Before | After | Line Y | Label Y | Y Label | CASH FLOWS FROM OPERATIONS | Category | Manual Adj | Jan-20 | Feb-20 | Mar-20 | |||||||||||||||||||
| Q2 FY20 | 1688 | 15 | $1688m | 1688 | Receipts from gold sales | Operations | 160623035 | 26412330 | 63222938 | 70987767 | ||||||||||||||||||||||
| Operations | 1074 | 25 | - | $1688m | $2762m | $2762m | $2225m | $1074m | Option premium income | Other | - | - | - | - | ||||||||||||||||||
| Capitalised Mining | (300) | 35 | - | $2762m | $2461m | $2461m | $2612m | ($300m) | Other income | Other | 53843 | 17862 | 16362 | 19619 | ||||||||||||||||||
| Exploration | (77) | 45 | - | $2461m | $2384m | $2384m | $2423m | ($77m) | Payments to suppliers and employees - DNO | Operations | (27888576) | (14390523) | (5596867) | (7901186) | ||||||||||||||||||
| Other capex | (121) | 55 | - | $2384m | $2263m | $2263m | $2324m | ($121m) | Payments to suppliers and employees - DSO | Operations | (67150690) | (36688331) | (16219313) | (14243047) | ||||||||||||||||||
| Other | (13) | 65 | - | $2263m | $2251m | $2251m | $2257m | ($13m) | Payments to suppliers and employees - CORP | Other | (1537032) | 1079078 | (895045) | (1721065) | ||||||||||||||||||
| Q3 FY20 | 75 | $2251m | ERRORNA | ERRORNA | $2251m | ERRORNA | Interest received | Other | 244942 | 75732 | 94076 | 75134 | ||||||||||||||||||||
| Income tax | (156) | 85 | - | $2251m | $2094m | $2094m | $2173m | ($156m) | Income tax paid | Income tax | (15627450) | (8613666) | (2070215) | (4943569) | ||||||||||||||||||
| Dividends | (407) | 95 | - | $2094m | $1688m | $1688m | $1891m | ($407m) | Interest paid | Other | (25320) | (8728) | (8440) | (8152) | ||||||||||||||||||
| Q3 FY20 | $1688m | GIC Inventory Mvmt | GIC Mvmt | - | ||||||||||||||||||||||||||||
| Net cash flows from(used in) operations | 48692752 | (32116246) | 38543496 | 42265502 | ||||||||||||||||||||||||||||
| CASH FLOWS FROM INVESTING ACTIVITIES | ||||||||||||||||||||||||||||||||
| Payments for plant amp equipment | Other capex | (11755002) | (4822830) | (3794308) | (3137864) | |||||||||||||||||||||||||||
| Payments for exploration amp evaluation - WA | Exploration | (5925264) | (1401349) | (1807101) | (2716814) | |||||||||||||||||||||||||||
| Payments for exploration amp evaluation - NSW | Exploration | (1785388) | (516065) | (477680) | (791643) | |||||||||||||||||||||||||||
| Payments for development | Capitalised Mining | (18120061) | (6637683) | (7888434) | (3593944) | |||||||||||||||||||||||||||
| Payments for mine properties - DNO | Capitalised Mining | 682043 | 125306 | (224267) | 781004 | |||||||||||||||||||||||||||
| Payments for mine properties - DSO | Capitalised Mining | (12601334) | (5605382) | (6995952) | - | |||||||||||||||||||||||||||
| Payments for termsecurity deposits | Other | (283) | - | (283) | - | |||||||||||||||||||||||||||
| Proceeds on disposal of term deposits | Other | - | - | - | - | |||||||||||||||||||||||||||
| Payments for WALs | Other capex | - | - | - | - | |||||||||||||||||||||||||||
| Acquisition of exploration assets (net of cash) | DKM Acquisition | - | - | - | - | |||||||||||||||||||||||||||
| Proceeds on disposal of PampE | Other capex | (46908) | - | (46908) | - | |||||||||||||||||||||||||||
| Net cash flows used in investing activities | (49552197) | (18858003) | (21234933) | (9459261) | ||||||||||||||||||||||||||||
| CASH FLOWS FROM FINANCING ACTIVITIES | ||||||||||||||||||||||||||||||||
| Proceeds from equity raisings | - | - | - | - | ||||||||||||||||||||||||||||
| Proceeds from exercise of options | Other | - | - | - | - | |||||||||||||||||||||||||||
| Share issue costs | Other | - | - | - | - | |||||||||||||||||||||||||||
| Dividends paid | Dividends | (40654437) | - | - | (40654437) | |||||||||||||||||||||||||||
| Repayment of finance lease | Other capex | (288112) | (95749) | (96037) | (96326) | |||||||||||||||||||||||||||
| Repayment of borrowings | - | - | - | - | ||||||||||||||||||||||||||||
| Net cash flows from financing activities | (40942549) | (95749) | (96037) | (40750763) | ||||||||||||||||||||||||||||
| Net increase(decrease) in cash amp equivalents | (41801994) | (51069998) | 17212526 | (7944522) | ||||||||||||||||||||||||||||
| Cash amp bullion at the start of the period | 168811968 | Elisha Civil Elisha CivilDifference between bullion for quarterly vs accounts Adjusted agaisnt mvmt in gold on hand | 168811968 | 155761070 | 165924457 | |||||||||||||||||||||||||||
| Effects of exchange rate movements on cash | Operations | - | ||||||||||||||||||||||||||||||
| Movement in gold on hand | Operations | 41782986 | - | 38019099 | (7049139) | 10813026 | ||||||||||||||||||||||||||
| Cash amp bullion at the end of the period | 168792961 | 155761070 | 165924457 | 168792961 | ||||||||||||||||||||||||||||
| GOH Cost for Accounts revalued to Selling Price for Quarterly | Cost | Sales | ||||||||||||||||||||||||||||||
| At 31-Mar | Oz | $oz | $ | $oz | $ | |||||||||||||||||||||||||||
| MLW | 4427350 | 1027 | 4545234 | 2606 | 11535846 | |||||||||||||||||||||||||||
| GDW | 10428048 | 1155 | 12044939 | 2606 | 27171187 | |||||||||||||||||||||||||||
| RMT | 4956097 | 1159 | 5743676 | 2606 | 12913542 | |||||||||||||||||||||||||||
| 19811495 | 22333849 | 51620575 | ||||||||||||||||||||||||||||||
| Values | Line X | Ends | Before | After | Line Y | Label Y | Y Label | CASH FLOWS FROM OPERATIONS | Category | Manual Adj | Jan-20 | Feb-20 | Mar-20 | |||||||||||||||||||
| Q2 FY20 | 1688 | 15 | $1688m | 1688 | Receipts from gold sales | Operations | 160623035 | 26412330 | 63222938 | 70987767 | ||||||||||||||||||||||
| Operations | 1074 | 25 | - | $1688m | $2762m | $2762m | $2225m | $1074m | Option premium income | Other | - | - | - | - | ||||||||||||||||||
| Capitalised Mining | (300) | 35 | - | $2762m | $2461m | $2461m | $2612m | ($300m) | Other income | Other | 53843 | 17862 | 16362 | 19619 | ||||||||||||||||||
| Exploration | (77) | 45 | - | $2461m | $2384m | $2384m | $2423m | ($77m) | Payments to suppliers and employees - DNO | Operations | (27888576) | (14390523) | (5596867) | (7901186) | ||||||||||||||||||
| Other capex | (121) | 55 | - | $2384m | $2263m | $2263m | $2324m | ($121m) | Payments to suppliers and employees - DSO | Operations | (67150690) | (36688331) | (16219313) | (14243047) | ||||||||||||||||||
| Income tax | (156) | 65 | - | $2263m | $2107m | $2107m | $2185m | ($156m) | Payments to suppliers and employees - CORP | Other | (1537032) | 1079078 | (895045) | (1721065) | ||||||||||||||||||
| Other | (13) | 75 | - | $2107m | $2094m | $2094m | $2101m | ($13m) | Interest received | Other | 244942 | 75732 | 94076 | 75134 | ||||||||||||||||||
| Q3 FY20 | 85 | $2094m | ERRORNA | ERRORNA | $2094m | ERRORNA | Income tax paid | Income tax | (15627450) | (8613666) | (2070215) | (4943569) | ||||||||||||||||||||
| Dividends | (407) | 95 | - | $2094m | $1688m | $1688m | $1891m | ($407m) | Interest paid | Other | (25320) | (8728) | (8440) | (8152) | ||||||||||||||||||
| Q3 FY20 | $1688m | GIC Inventory Mvmt | GIC Mvmt | - | ||||||||||||||||||||||||||||
| Net cash flows from(used in) operations | 48692752 | (32116246) | 38543496 | 42265502 | ||||||||||||||||||||||||||||
| CASH FLOWS FROM INVESTING ACTIVITIES | ||||||||||||||||||||||||||||||||
| Payments for plant amp equipment | Other capex | (11755002) | (4822830) | (3794308) | (3137864) | |||||||||||||||||||||||||||
| Payments for exploration amp evaluation - WA | Exploration | (5925264) | (1401349) | (1807101) | (2716814) | |||||||||||||||||||||||||||
| Payments for exploration amp evaluation - NSW | Exploration | (1785388) | (516065) | (477680) | (791643) | |||||||||||||||||||||||||||
| Payments for development | Capitalised Mining | (18120061) | (6637683) | (7888434) | (3593944) | |||||||||||||||||||||||||||
| Payments for mine properties - DNO | Capitalised Mining | 682043 | 125306 | (224267) | 781004 | |||||||||||||||||||||||||||
| Payments for mine properties - DSO | Capitalised Mining | (12601334) | (5605382) | (6995952) | - | |||||||||||||||||||||||||||
| Payments for termsecurity deposits | Other | (283) | - | (283) | - | |||||||||||||||||||||||||||
| Proceeds on disposal of term deposits | Other | - | - | - | - | |||||||||||||||||||||||||||
| Payments for WALs | Other capex | - | - | - | - | |||||||||||||||||||||||||||
| Acquisition of exploration assets (net of cash) | DKM Acquisition | - | - | - | - | |||||||||||||||||||||||||||
| Proceeds on disposal of PampE | Other capex | (46908) | - | (46908) | - | |||||||||||||||||||||||||||
| Net cash flows used in investing activities | (49552197) | (18858003) | (21234933) | (9459261) | ||||||||||||||||||||||||||||
| CASH FLOWS FROM FINANCING ACTIVITIES | ||||||||||||||||||||||||||||||||
| Proceeds from equity raisings | - | - | - | - | ||||||||||||||||||||||||||||
| Proceeds from exercise of options | Other | - | - | - | - | |||||||||||||||||||||||||||
| Share issue costs | Other | - | - | - | - | |||||||||||||||||||||||||||
| Dividends paid | Dividends | (40654437) | - | - | (40654437) | |||||||||||||||||||||||||||
| Repayment of finance lease | Other capex | (288112) | (95749) | (96037) | (96326) | |||||||||||||||||||||||||||
| Repayment of borrowings | - | - | - | - | ||||||||||||||||||||||||||||
| Net cash flows from financing activities | (40942549) | (95749) | (96037) | (40750763) | ||||||||||||||||||||||||||||
| Net increase(decrease) in cash amp equivalents | (41801994) | (51069998) | 17212526 | (7944522) | ||||||||||||||||||||||||||||
| Cash amp bullion at the start of the period | 168811968 | Elisha Civil Elisha CivilDifference between bullion for quarterly vs accounts Adjusted agaisnt mvmt in gold on hand | 168811968 | 155761070 | 165924457 | |||||||||||||||||||||||||||
| Effects of exchange rate movements on cash | Operations | - | ||||||||||||||||||||||||||||||
| Movement in gold on hand | Operations | 41782986 | - | 38019099 | (7049139) | 10813026 | ||||||||||||||||||||||||||
| Cash amp bullion at the end of the period | 168792961 | 155761070 | 165924457 | 168792961 | ||||||||||||||||||||||||||||
| GOH Cost for Accounts revalued to Selling Price for Quarterly | Cost | Sales | ||||||||||||||||||||||||||||||
| At 31-Mar | Oz | $oz | $ | $oz | $ | |||||||||||||||||||||||||||
| MLW | 4427350 | 1027 | 4545234 | 2606 | 11535846 | |||||||||||||||||||||||||||
| GDW | 10428048 | 1155 | 12044939 | 2606 | 27171187 | |||||||||||||||||||||||||||
| RMT | 4956097 | 1159 | 5743676 | 2606 | 12913542 | |||||||||||||||||||||||||||
| 19811495 | 22333849 | 51620575 | ||||||||||||||||||||||||||||||
| Values | Line X | Ends | Before | After | Line Y | Label Y | Y Label | CASH FLOWS FROM OPERATIONS | Category | Statutory Adj | ||||||||||||||||||
| June 2019 | 2052 | 15 | $2052m | 2052 | Receipts from gold sales | Operations | 370796353 | 370796353 | ||||||||||||||||||||
| Operations | 1791 | 25 | - | $2052m | $3843m | $3843m | $2947m | $1791m | Option premium income | Other | - | - | ||||||||||||||||
| Mine development | (551) | 35 | - | $3843m | $3292m | $3292m | $3567m | ($551m) | Other income | Other | 437464 | 437464 | ||||||||||||||||
| Exploration | (199) | 45 | - | $3292m | $3093m | $3093m | $3192m | ($199m) | Payments to suppliers and employees - DNO | Operations | (48442870) | (48442870) | ||||||||||||||||
| Other capex | (359) | 55 | - | $3093m | $2734m | $2734m | $2913m | ($359m) | Payments to suppliers and employees - DSO | Operations | (131007320) | (131007320) | ||||||||||||||||
| Income tax | (330) | 65 | - | $2734m | $2403m | $2403m | $2568m | ($330m) | Payments to suppliers and employees - CORP | Other | (11556512) | (11556512) | ||||||||||||||||
| Other | (109) | 75 | - | $2403m | $2295m | $2295m | $2349m | ($109m) | Interest received | Other | 665227 | 665227 | ||||||||||||||||
| Cash and Bullion before Acquisitions amp Dividends | 85 | $2295m | ERRORNA | ERRORNA | $2295m | ERRORNA | GIC Inventory Mvmt | GIC Mvmt | - | - | ||||||||||||||||||
| DKM Acquisition | (200) | 95 | - | $2295m | $2095m | $2095m | $2195m | ($200m) | Income tax paid | Income tax | (33034117) | (33034117) | ||||||||||||||||
| Dividends | (407) | 105 | - | $2095m | $1688m | $1688m | $1891m | ($407m) | Interest paid | Other | (674443) | (674443) | ||||||||||||||||
| December 2019 | $1688m | GIC Inventory Mvmt | GIC Mvmt | - | - | |||||||||||||||||||||||
| Net cash flows from(used in) operations | 147183783 | 147183783 | ||||||||||||||||||||||||||
| CASH FLOWS FROM INVESTING ACTIVITIES | ||||||||||||||||||||||||||||
| Payments for plant amp equipment | Other capex | (35919500) | (35919500) | |||||||||||||||||||||||||
| Payments for exploration amp evaluation - WA | Exploration | (14393471) | (14393471) | |||||||||||||||||||||||||
| Payments for exploration amp evaluation - NSW | Exploration | (5477332) | (5477332) | |||||||||||||||||||||||||
| Payments for development | Mine development | (23173710) | (23173710) | |||||||||||||||||||||||||
| Payments for mine properties - DNO | Mine development | (2537890) | (2537890) | |||||||||||||||||||||||||
| Payments for mine properties - DSO | Mine development | (29394527) | (29394527) | |||||||||||||||||||||||||
| Payments for termsecurity deposits | Other | (694) | (694) | |||||||||||||||||||||||||
| Proceeds on disposal of term deposits | Other | - | - | |||||||||||||||||||||||||
| Payments for WALs | Other capex | - | - | |||||||||||||||||||||||||
| Acquisition of exploration assets (net of cash) | DKM Acquisition | (20000000) | (20000000) | |||||||||||||||||||||||||
| Proceeds on disposal of PampE | Other capex | 914 | 914 | |||||||||||||||||||||||||
| Net cash flows used in investing activities | (130896211) | (130896211) | ||||||||||||||||||||||||||
| CASH FLOWS FROM FINANCING ACTIVITIES | ||||||||||||||||||||||||||||
| Proceeds from equity raisings | - | - | ||||||||||||||||||||||||||
| Proceeds from exercise of options | Other | 279000 | 279000 | |||||||||||||||||||||||||
| Share issue costs | Other | (14386) | (14386) | |||||||||||||||||||||||||
| Dividends paid | Dividends | (40654437) | (40654437) | |||||||||||||||||||||||||
| Repayment of finance lease | Other capex | - | - | |||||||||||||||||||||||||
| Repayment of borrowings | Operations | (5620565) | (5620565) | |||||||||||||||||||||||||
| Net cash flows from financing activities | (46010388) | (46010388) | ||||||||||||||||||||||||||
| Net increase(decrease) in cash amp equivalents | (29722816) | (29722816) | ||||||||||||||||||||||||||
| Cash amp bullion at the start of the period | 205165482 | Elisha Civil Elisha CivilDifference between bullion for quarterly vs accounts Adjusted agaisnt mvmt in gold on hand | 205165482 | |||||||||||||||||||||||||
| Effects of exchange rate movements on cash | Operations | - | - | |||||||||||||||||||||||||
| Movement in gold on hand | Operations | (6630697) | - | (6630697) | ||||||||||||||||||||||||
| Cash amp bullion at the end of the period | 168811969 | 168811969 | ||||||||||||||||||||||||||
| GOH Cost for Accounts revalued to Selling Price for Quarterly | Cost | |||||||||||||||||||||||||||
| At 30-Jun | Oz | $oz | $ | |||||||||||||||||||||||||
| MLW | 2331195 | 1244 | 2901126 | |||||||||||||||||||||||||
| GDW | 3775510 | 1135 | 4286261 | |||||||||||||||||||||||||
| RMT | 1779190 | 1202 | 2137768 | |||||||||||||||||||||||||
| 7885895 | 9325154 | |||||||||||||||||||||||||||
| Values | Line X | Ends | Before | After | Line Y | Label Y | Y Label | CASH FLOWS FROM OPERATIONS | Category | Manual Adj | Jul-19 | Aug-19 | Sep-19 | Oct-19 | Nov-19 | Dec-19 | |||||||||||||||||||||||
| June 2019 | 2052 | 15 | $2052m | 2052 | Receipts from gold sales | Operations | 393628149 | 48733973 | 57888259 | 53259007 | 64607715 | 58641552 | 110497643 | ||||||||||||||||||||||||||
| Operations | 1825 | 25 | - | $2052m | $3877m | $3877m | $2964m | $1825m | Option premium income | Other | - | - | - | - | - | - | - | ||||||||||||||||||||||
| Mine development | (630) | 35 | - | $3877m | $3247m | $3247m | $3562m | ($630m) | Other income | Other | 529980 | 15362 | 16350 | 17382 | 17992 | 17599 | 445295 | ||||||||||||||||||||||
| Exploration | (206) | 45 | - | $3247m | $3041m | $3041m | $3144m | ($206m) | Payments to suppliers and employees - DNO | Operations | (55584856) | (18867571) | (5421615) | (5677647) | (10023851) | (7468076) | (8126096) | ||||||||||||||||||||||
| Other capex | (373) | 55 | - | $3041m | $2668m | $2668m | $2854m | ($373m) | Payments to suppliers and employees - DSO | Operations | (148915710) | (49555333) | (18307389) | (13961768) | (33056049) | (18400404) | (15634767) | ||||||||||||||||||||||
| Income tax | (285) | 65 | - | $2668m | $2383m | $2383m | $2526m | ($285m) | Payments to suppliers and employees - CORP | Other | (10277165) | 127934700 | (2387178) | (2286742) | (1477255) | (1202249) | (964042) | (1959699) | |||||||||||||||||||||
| Other | (89) | 75 | - | $2383m | $2295m | $2295m | $2339m | ($89m) | Interest received | Other | 665227 | 171509 | 149152 | 134191 | 87372 | 62835 | 60168 | ||||||||||||||||||||||
| December 2019 | 85 | $2295m | ERRORNA | ERRORNA | $2295m | ERRORNA | GIC Inventory Mvmt | GIC Mvmt | - | ||||||||||||||||||||||||||||||
| DKM Acquisition | (200) | 95 | - | $2295m | $2095m | $2095m | $2195m | ($200m) | Income tax paid | Income tax | (28461255) | (6214961) | (2525166) | (4519941) | (4155608) | (11045579) | - | ||||||||||||||||||||||
| Dividends | (407) | 105 | - | $2095m | $1688m | $1688m | $1891m | ($407m) | Interest paid | Other | (59440) | (6681) | (6391) | (6195) | (5997) | (5799) | (28377) | ||||||||||||||||||||||
| December 2019 | $1688m | GIC Inventory Mvmt | GIC Mvmt | - | |||||||||||||||||||||||||||||||||||
| Net cash flows from(used in) operations | 151524931 | (28110879) | 29506458 | 27767774 | 16269325 | 20838086 | 85254167 | ||||||||||||||||||||||||||||||||
| CASH FLOWS FROM INVESTING ACTIVITIES | |||||||||||||||||||||||||||||||||||||||
| Payments for plant amp equipment | Other capex | (36854389) | (10746245) | (4214487) | (5036392) | (8940874) | (2337548) | (5578843) | |||||||||||||||||||||||||||||||
| Payments for exploration amp evaluation - WA | Exploration | (15012294) | (1447005) | (2144467) | (3146413) | (2141208) | (2694944) | (3438257) | |||||||||||||||||||||||||||||||
| Payments for exploration amp evaluation - NSW | Exploration | (5575683) | (889004) | (1537672) | (985141) | (679178) | (561848) | (922840) | |||||||||||||||||||||||||||||||
| Payments for development | Mine development | (31072622) | (3407474) | (5400036) | (5465762) | (4926496) | (6438272) | (5434582) | |||||||||||||||||||||||||||||||
| Payments for mine properties - DNO | Mine development | (2537890) | 844308 | (139170) | (1108118) | (1243030) | (891880) | - | |||||||||||||||||||||||||||||||
| Payments for mine properties - DSO | Mine development | (29394527) | (8245160) | (6860356) | (797558) | (6936306) | (6184203) | (370944) | |||||||||||||||||||||||||||||||
| Payments for termsecurity deposits | Other | (694) | - | (363) | - | - | (331) | - | |||||||||||||||||||||||||||||||
| Proceeds on disposal of term deposits | Other | - | - | - | - | - | - | - | |||||||||||||||||||||||||||||||
| Payments for WALs | Other capex | - | - | - | - | - | - | - | |||||||||||||||||||||||||||||||
| Acquisition of exploration assets (net of cash) | DKM Acquisition | (20000000) | - | (20000000) | - | - | - | - | |||||||||||||||||||||||||||||||
| Proceeds on disposal of PampE | Other capex | 914 | - | - | - | - | 914 | - | |||||||||||||||||||||||||||||||
| Net cash flows used in investing activities | (140447186) | (23890581) | (40296551) | (16539384) | (24867092) | (19108112) | (15745466) | ||||||||||||||||||||||||||||||||
| CASH FLOWS FROM FINANCING ACTIVITIES | |||||||||||||||||||||||||||||||||||||||
| Proceeds from equity raisings | - | - | - | - | - | - | - | ||||||||||||||||||||||||||||||||
| Proceeds from exercise of options | Other | 279000 | 84000 | 195000 | - | - | - | - | |||||||||||||||||||||||||||||||
| Share issue costs | Other | (14386) | (10020) | (4366) | - | - | - | - | |||||||||||||||||||||||||||||||
| Dividends paid | Dividends | (40654437) | - | - | (40654437) | - | - | - | |||||||||||||||||||||||||||||||
| Repayment of finance lease | Other capex | (410738) | (97597) | (62234) | (62431) | (62627) | (62825) | (63024) | |||||||||||||||||||||||||||||||
| Repayment of borrowings | - | - | - | - | - | - | - | ||||||||||||||||||||||||||||||||
| Net cash flows from financing activities | (40800561) | (23617) | 128400 | (40716868) | (62627) | (62825) | (63024) | ||||||||||||||||||||||||||||||||
| Net increase(decrease) in cash amp equivalents | (29722816) | (52025077) | (10661693) | (29488478) | (8660394) | 1667149 | 69445677 | ||||||||||||||||||||||||||||||||
| Cash amp bullion at the start of the period | 205165482 | Elisha Civil Elisha CivilDifference between bullion for quarterly vs accounts Adjusted agaisnt mvmt in gold on hand | 205165482 | 176583719 | 165686211 | 176583719 | 171901281 | 175804668 | |||||||||||||||||||||||||||||||
| Effects of exchange rate movements on cash | Operations | - | |||||||||||||||||||||||||||||||||||||
| Movement in gold on hand | Operations | (6630697) | - | 23443314 | (235815) | 11215359 | 3977956 | 2236238 | (47267749) | ||||||||||||||||||||||||||||||
| Cash amp bullion at the end of the period | 168811968 | 176583719 | 165686211 | 147413092 | 171901281 | 175804668 | 197982595 | ||||||||||||||||||||||||||||||||
| GOH Cost for Accounts revalued to Selling Price for Quarterly | Cost | Sales | Sales | ||||||||||||||||||||||||||||||||||||
| At 30-Jun | Oz | $oz | $ | $oz | $ | $ | $oz | $ | |||||||||||||||||||||||||||||||
| MLW | 2331195 | 1244 | 2901126 | 1990 | 4639684 | 9234177798 | 2220 | 4418775 | |||||||||||||||||||||||||||||||
| GDW | 3775510 | 1135 | 4286261 | 1990 | 7514247 | 14955304304 | 2220 | 4418775 | |||||||||||||||||||||||||||||||
| RMT | 1779190 | 1202 | 2137768 | 1990 | 3541051 | 7047611545 | 2220 | 4418775 | |||||||||||||||||||||||||||||||
| 7885895 | 9325154 | 15694981 | 31237093647 | 13256326 | |||||||||||||||||||||||||||||||||||
| Values | Line X | Ends | Before | After | Line Y | Label Y | Y Label | CASH FLOWS FROM OPERATIONS | Category | Manual Adj | Jul-19 | Aug-19 | Sep-19 | Oct-19 | Nov-19 | Dec-19 | ||||||||||||||||||||||
| June 2019 | 2052 | 15 | $2052m | 2052 | Receipts from gold sales | Operations | 393628149 | 48733973 | 57888259 | 53259007 | 64607715 | 58641552 | 110497643 | |||||||||||||||||||||||||
| Operations | 1825 | 25 | - | $2052m | $3877m | $3877m | $2964m | $1825m | Option premium income | Other | - | - | - | - | - | - | - | |||||||||||||||||||||
| Dividends | (407) | 35 | - | $3877m | $3470m | $3470m | $3673m | ($407m) | Other income | Other | 529980 | 15362 | 16350 | 17382 | 17992 | 17599 | 445295 | |||||||||||||||||||||
| Mine development | (630) | 45 | - | $3470m | $2840m | $2840m | $3155m | ($630m) | Payments to suppliers and employees - DNO | Operations | (55584856) | (18867571) | (5421615) | (5677647) | (10023851) | (7468076) | (8126096) | |||||||||||||||||||||
| Exploration | (206) | 55 | - | $2840m | $2634m | $2634m | $2737m | ($206m) | Payments to suppliers and employees - DSO | Operations | (148915710) | (49555333) | (18307389) | (13961768) | (33056049) | (18400404) | (15634767) | |||||||||||||||||||||
| DKM Acquisition | (200) | 65 | - | $2634m | $2434m | $2434m | $2534m | ($200m) | Payments to suppliers and employees - CORP | Other | (10277165) | (2387178) | (2286742) | (1477255) | (1202249) | (964042) | (1959699) | |||||||||||||||||||||
| Other capex | (373) | 75 | - | $2434m | $2062m | $2062m | $2248m | ($373m) | Interest received | Other | 665227 | 171509 | 149152 | 134191 | 87372 | 62835 | 60168 | |||||||||||||||||||||
| Income tax | (285) | 85 | - | $2062m | $1777m | $1777m | $1919m | ($285m) | Income tax paid | Income tax | (28461255) | (6214961) | (2525166) | (4519941) | (4155608) | (11045579) | - | |||||||||||||||||||||
| Other | (89) | 95 | - | $1777m | $1688m | $1688m | $1733m | ($89m) | Interest paid | Other | (59440) | (6681) | (6391) | (6195) | (5997) | (5799) | (28377) | |||||||||||||||||||||
| December 2019 | $1688m | GIC Inventory Mvmt | GIC Mvmt | - | ||||||||||||||||||||||||||||||||||
| Net cash flows from(used in) operations | 151524931 | (28110879) | 29506458 | 27767774 | 16269325 | 20838086 | 85254167 | |||||||||||||||||||||||||||||||
| CASH FLOWS FROM INVESTING ACTIVITIES | ||||||||||||||||||||||||||||||||||||||
| Payments for plant amp equipment | Other capex | (36854389) | (10746245) | (4214487) | (5036392) | (8940874) | (2337548) | (5578843) | ||||||||||||||||||||||||||||||
| Payments for exploration amp evaluation - WA | Exploration | (15012294) | (1447005) | (2144467) | (3146413) | (2141208) | (2694944) | (3438257) | ||||||||||||||||||||||||||||||
| Payments for exploration amp evaluation - NSW | Exploration | (5575683) | (889004) | (1537672) | (985141) | (679178) | (561848) | (922840) | ||||||||||||||||||||||||||||||
| Payments for development | Mine development | (31072622) | (3407474) | (5400036) | (5465762) | (4926496) | (6438272) | (5434582) | ||||||||||||||||||||||||||||||
| Payments for mine properties - DNO | Mine development | (2537890) | 844308 | (139170) | (1108118) | (1243030) | (891880) | - | ||||||||||||||||||||||||||||||
| Payments for mine properties - DSO | Mine development | (29394527) | (8245160) | (6860356) | (797558) | (6936306) | (6184203) | (370944) | ||||||||||||||||||||||||||||||
| Payments for termsecurity deposits | Other | (694) | - | (363) | - | - | (331) | - | ||||||||||||||||||||||||||||||
| Proceeds on disposal of term deposits | Other | - | - | - | - | - | - | - | ||||||||||||||||||||||||||||||
| Payments for WALs | Other capex | - | - | - | - | - | - | - | ||||||||||||||||||||||||||||||
| Acquisition of exploration assets (net of cash) | DKM Acquisition | (20000000) | - | (20000000) | - | - | - | - | ||||||||||||||||||||||||||||||
| Proceeds on disposal of PampE | Other capex | 914 | - | - | - | - | 914 | - | ||||||||||||||||||||||||||||||
| Net cash flows used in investing activities | (140447186) | (23890581) | (40296551) | (16539384) | (24867092) | (19108112) | (15745466) | |||||||||||||||||||||||||||||||
| CASH FLOWS FROM FINANCING ACTIVITIES | ||||||||||||||||||||||||||||||||||||||
| Proceeds from equity raisings | - | - | - | - | - | - | - | |||||||||||||||||||||||||||||||
| Proceeds from exercise of options | Other | 279000 | 84000 | 195000 | - | - | - | - | ||||||||||||||||||||||||||||||
| Share issue costs | Other | (14386) | (10020) | (4366) | - | - | - | - | ||||||||||||||||||||||||||||||
| Dividends paid | Dividends | (40654437) | - | - | (40654437) | - | - | - | ||||||||||||||||||||||||||||||
| Repayment of finance lease | Other capex | (410738) | (97597) | (62234) | (62431) | (62627) | (62825) | (63024) | ||||||||||||||||||||||||||||||
| Repayment of borrowings | - | - | - | - | - | - | - | |||||||||||||||||||||||||||||||
| Net cash flows from financing activities | (40800561) | (23617) | 128400 | (40716868) | (62627) | (62825) | (63024) | |||||||||||||||||||||||||||||||
| Net increase(decrease) in cash amp equivalents | (29722816) | (52025077) | (10661693) | (29488478) | (8660394) | 1667149 | 69445677 | |||||||||||||||||||||||||||||||
| Cash amp bullion at the start of the period | 205165482 | Elisha Civil Elisha CivilDifference between bullion for quarterly vs accounts Adjusted agaisnt mvmt in gold on hand | 205165482 | 176583719 | 165686211 | 176583719 | 171901281 | 175804668 | ||||||||||||||||||||||||||||||
| Effects of exchange rate movements on cash | Operations | - | ||||||||||||||||||||||||||||||||||||
| Movement in gold on hand | Operations | (6630697) | - | 23443314 | (235815) | 11215359 | 3977956 | 2236238 | (47267749) | |||||||||||||||||||||||||||||
| Cash amp bullion at the end of the period | 168811968 | 176583719 | 165686211 | 147413092 | 171901281 | 175804668 | 197982595 | |||||||||||||||||||||||||||||||
| GOH Cost for Accounts revalued to Selling Price for Quarterly | Cost | Sales | Sales | |||||||||||||||||||||||||||||||||||
| At 30-Jun | Oz | $oz | $ | $oz | $ | $ | $oz | $ | ||||||||||||||||||||||||||||||
| MLW | 2331195 | 1244 | 2901126 | 1990 | 4639684 | 9234177798 | 2220 | 4418775 | ||||||||||||||||||||||||||||||
| GDW | 3775510 | 1135 | 4286261 | 1990 | 7514247 | 14955304304 | 2220 | 4418775 | ||||||||||||||||||||||||||||||
| RMT | 1779190 | 1202 | 2137768 | 1990 | 3541051 | 7047611545 | 2220 | 4418775 | ||||||||||||||||||||||||||||||
| 7885895 | 9325154 | 15694981 | 31237093647 | 13256326 | ||||||||||||||||||||||||||||||||||
| Values | Line X | Ends | Before | After | Line Y | Label Y | Y Label | CASH FLOWS FROM OPERATIONS | Category | Manual Adj | Jan-20 | Feb-20 | Mar-20 | |||||||||||||||||||
| Q2 FY19 | 1643 | 15 | $1643m | 1643 | Receipts from gold sales | Operations | 141168108 | 29410111 | 53532749 | 58225248 | ||||||||||||||||||||||
| Operations | 893 | 25 | - | $1643m | $2536m | $2536m | $2089m | $893m | Option premium income | Other | 1366000 | 1366000 | - | - | ||||||||||||||||||
| Dividends | (406) | 35 | - | $2536m | $2130m | $2130m | $2333m | ($406m) | Other income | Other | 50483 | 17780 | 16137 | 16566 | ||||||||||||||||||
| Mine development | (267) | 45 | - | $2130m | $1862m | $1862m | $1996m | ($267m) | Payments to suppliers and employees - DNO | Operations | (18868744) | (8394133) | (6571863) | (3902748) | ||||||||||||||||||
| Exploration | (67) | 55 | - | $1862m | $1796m | $1796m | $1829m | ($67m) | Payments to suppliers and employees - DSO | Operations | (59002550) | (31054273) | (14995797) | (12952479) | ||||||||||||||||||
| Other capex | (226) | 65 | - | $1796m | $1570m | $1570m | $1683m | ($226m) | Payments to suppliers and employees - CORP | Other | (3911562) | (2122227) | (654065) | (1135270) | ||||||||||||||||||
| Income tax | (112) | 75 | - | $1570m | $1458m | $1458m | $1514m | ($112m) | Interest received | Other | 614299 | 340374 | 84378 | 189547 | ||||||||||||||||||
| Other | (18) | 85 | - | $1458m | $1440m | $1440m | $1449m | ($18m) | Income tax paid | Income tax | (11220172) | (4704392) | (2330890) | (4184890) | ||||||||||||||||||
| Q3 FY19 | $1440m | Interest paid | Other | (10758) | (1127) | (1513) | (8118) | |||||||||||||||||||||||||
| Net cash flows from(used in) operations | 50185105 | (15141887) | 29079136 | 36247856 | ||||||||||||||||||||||||||||
| CASH FLOWS FROM INVESTING ACTIVITIES | ||||||||||||||||||||||||||||||||
| Payments for plant amp equipment | Other capex | (22287385) | (7475391) | (10556336) | (4255658) | |||||||||||||||||||||||||||
| Payments for exploration amp evaluation - WA | Exploration | (4530435) | (2083813) | (1008606) | (1438016) | |||||||||||||||||||||||||||
| Payments for exploration amp evaluation - NSW | Exploration | (2135047) | (637746) | (836498) | (660803) | |||||||||||||||||||||||||||
| Payments for development | Mine development | (8690080) | (342093) | (1689103) | (6658884) | |||||||||||||||||||||||||||
| Payments for mine properties - DNO | Mine development | 281159 | 0 | 396936 | (115777) | |||||||||||||||||||||||||||
| Payments for mine properties - DSO | Mine development | (18328789) | (10196278) | (9148806) | 1016295 | |||||||||||||||||||||||||||
| Payments for term deposits | Other | (443) | - | (443) | - | |||||||||||||||||||||||||||
| Proceeds on disposal of term deposits | Other | 77000 | 77000 | - | - | |||||||||||||||||||||||||||
| Payments for WALs | Other capex | - | - | - | - | |||||||||||||||||||||||||||
| Acquisition of exploration assets (net of cash) | Exploration | - | - | - | - | |||||||||||||||||||||||||||
| Proceeds on disposal of PampE | Other capex | - | - | - | - | |||||||||||||||||||||||||||
| - | ||||||||||||||||||||||||||||||||
| Net cash flows used in investing activities | (55614020) | (20658321) | (22842856) | (12112843) | ||||||||||||||||||||||||||||
| CASH FLOWS FROM FINANCING ACTIVITIES | ||||||||||||||||||||||||||||||||
| Proceeds from equity raisings | - | |||||||||||||||||||||||||||||||
| Proceeds from exercise of options | - | |||||||||||||||||||||||||||||||
| Share issue costs | (10812) | (5160) | (3768) | (1884) | ||||||||||||||||||||||||||||
| Dividend paid | Dividends | (40625957) | - | - | (40625957) | |||||||||||||||||||||||||||
| Repayment of finance lease | Other capex | (272361) | (70180) | (70367) | (131814) | |||||||||||||||||||||||||||
| Repayment of borrowings | - | |||||||||||||||||||||||||||||||
| Net cash flows from financing activities | (40909130) | (75340) | (74135) | (40759655) | ||||||||||||||||||||||||||||
| Net increase(decrease) in cash amp equivalents | (46338045) | (35875548) | 6162145 | (16624642) | ||||||||||||||||||||||||||||
| Cash amp bullion at the start of the period | 164250522 | 164250522 | 159897589 | 166588508 | ||||||||||||||||||||||||||||
| Effects of exchange rate movements on cash | Operations | - | ||||||||||||||||||||||||||||||
| Movement in gold on hand | Operations | 26046191 | - | 31522615 | 528774 | (6005198) | ||||||||||||||||||||||||||
| Cash amp bullion at the end of the period | 143958668 | 159897589 | 166588508 | 143958668 |
| Values | Line X | Ends | Before | After | Line Y | Label Y | Y Label | CASH FLOWS FROM OPERATIONS | Category | Manual Adj | Oct-19 | Nov-19 | Dec-19 | |||||||||||||||||||
| Q1 FY20 | 1474 | 15 | $1474m | 1474 | Receipts from gold sales | Operations | 233746910 | 64607715 | 58641552 | 110497643 | ||||||||||||||||||||||
| Operations | 1000 | 25 | - | $1474m | $2474m | $2474m | $1974m | $1000m | Option premium income | Other | - | - | - | - | ||||||||||||||||||
| Capitalised Mining | (324) | 35 | - | $2474m | $2150m | $2150m | $2312m | ($324m) | Other income | Other | 480886 | 17992 | 17599 | 445295 | ||||||||||||||||||
| Exploration | (104) | 45 | - | $2150m | $2045m | $2045m | $2098m | ($104m) | Payments to suppliers and employees - DNO | Operations | (25618023) | (10023851) | (7468076) | (8126096) | ||||||||||||||||||
| Other capex | (170) | 55 | - | $2045m | $1875m | $1875m | $1960m | ($170m) | Payments to suppliers and employees - DSO | Operations | (67091220) | (33056049) | (18400404) | (15634767) | ||||||||||||||||||
| Income tax | (152) | 65 | - | $1875m | $1723m | $1723m | $1799m | ($152m) | Payments to suppliers and employees - CORP | Other | (4125990) | (1202249) | (964042) | (1959699) | ||||||||||||||||||
| Other | (35) | 75 | - | $1723m | $1688m | $1688m | $1705m | ($35m) | Interest received | Other | 210375 | 87372 | 62835 | 60168 | ||||||||||||||||||
| Q2 FY20 | $1688m | Income tax paid | Income tax | (15201187) | (4155608) | (11045579) | - | |||||||||||||||||||||||||
| Interest paid | Other | (40173) | (5997) | (5799) | (28377) | |||||||||||||||||||||||||||
| GIC Inventory Mvmt | GIC Mvmt | - | ||||||||||||||||||||||||||||||
| Net cash flows from(used in) operations | 122361578 | 16269325 | 20838086 | 85254167 | ||||||||||||||||||||||||||||
| CASH FLOWS FROM INVESTING ACTIVITIES | ||||||||||||||||||||||||||||||||
| Payments for plant amp equipment | Other capex | (16857265) | (8940874) | (2337548) | (5578843) | |||||||||||||||||||||||||||
| Payments for exploration amp evaluation - WA | Exploration | (8274409) | (2141208) | (2694944) | (3438257) | |||||||||||||||||||||||||||
| Payments for exploration amp evaluation - NSW | Exploration | (2163866) | (679178) | (561848) | (922840) | |||||||||||||||||||||||||||
| Payments for development | Capitalised Mining | (16799350) | (4926496) | (6438272) | (5434582) | |||||||||||||||||||||||||||
| Payments for mine properties - DNO | Capitalised Mining | (2134910) | (1243030) | (891880) | - | |||||||||||||||||||||||||||
| Payments for mine properties - DSO | Capitalised Mining | (13491453) | (6936306) | (6184203) | (370944) | |||||||||||||||||||||||||||
| Payments for termsecurity deposits | Other | (331) | - | (331) | - | |||||||||||||||||||||||||||
| Proceeds on disposal of term deposits | Other | - | - | - | - | |||||||||||||||||||||||||||
| Payments for WALs | Other capex | - | - | - | - | |||||||||||||||||||||||||||
| Acquisition of exploration assets (net of cash) | DKM Acquisition | - | - | - | - | |||||||||||||||||||||||||||
| Proceeds on disposal of PampE | Other capex | 914 | - | 914 | - | |||||||||||||||||||||||||||
| Net cash flows used in investing activities | (59720670) | (24867092) | (19108112) | (15745466) | ||||||||||||||||||||||||||||
| CASH FLOWS FROM FINANCING ACTIVITIES | ||||||||||||||||||||||||||||||||
| Proceeds from equity raisings | - | - | - | - | ||||||||||||||||||||||||||||
| Proceeds from exercise of options | Other | - | - | - | - | |||||||||||||||||||||||||||
| Share issue costs | Other | - | - | - | - | |||||||||||||||||||||||||||
| Dividends paid | Dividends | - | - | - | - | |||||||||||||||||||||||||||
| Repayment of finance lease | Other capex | (188476) | (62627) | (62825) | (63024) | |||||||||||||||||||||||||||
| Repayment of borrowings | - | - | - | - | ||||||||||||||||||||||||||||
| Net cash flows from financing activities | (188476) | (62627) | (62825) | (63024) | ||||||||||||||||||||||||||||
| Net increase(decrease) in cash amp equivalents | 62452432 | (8660394) | 1667149 | 69445677 | ||||||||||||||||||||||||||||
| Cash amp bullion at the start of the period | 147413092 | Elisha Civil Elisha CivilDifference between bullion for quarterly vs accounts Adjusted agaisnt mvmt in gold on hand | 147413092 | 142730654 | 146634041 | |||||||||||||||||||||||||||
| Effects of exchange rate movements on cash | Operations | - | ||||||||||||||||||||||||||||||
| Movement in gold on hand | Operations | (41053555) | - | 3977956 | 2236238 | (47267749) | ||||||||||||||||||||||||||
| Cash amp bullion at the end of the period | 168811968 | 142730654 | 146634041 | 168811968 | ||||||||||||||||||||||||||||
| GOH Cost for Accounts revalued to Selling Price for Quarterly | Cost | Sales | ||||||||||||||||||||||||||||||
| At 31-Dec | Oz | $oz | $ | $oz | $ | |||||||||||||||||||||||||||
| MLW | 1043087 | 1155 | 1205224 | 2220 | 2315862 | |||||||||||||||||||||||||||
| GDW | 2096013 | 1147 | 2404709 | 2220 | 4653569 | |||||||||||||||||||||||||||
| RMT | 1291847 | 910 | 1175405 | 2220 | 2868159 | |||||||||||||||||||||||||||
| 4430947 | 4785338 | 9837589 | ||||||||||||||||||||||||||||||
| Values | Line X | Ends | Before | After | Line Y | Label Y | Y Label | CASH FLOWS FROM OPERATIONS | Category | Manual Adj | Oct-18 | Nov-18 | Dec-18 | |||||||||||||||||||
| Q1 FY19 | 1474 | 15 | $1474m | 1474 | Receipts from gold sales | Operations | 197565780 | 69872301 | 50017610 | 77675869 | ||||||||||||||||||||||
| Operations | 764 | 25 | - | $1474m | $2238m | $2238m | $1856m | $764m | Option premium income | Other | - | - | - | - | ||||||||||||||||||
| Mine development | (173) | 35 | - | $2238m | $2065m | $2065m | $2151m | ($173m) | Other income | Other | 35365 | - | 17348 | 18017 | ||||||||||||||||||
| Exploration | (110) | 45 | - | $2065m | $1955m | $1955m | $2010m | ($110m) | Payments to suppliers and employees - DNO | Operations | (26398673) | (11800291) | (4827485) | (9770897) | ||||||||||||||||||
| Other capex | (103) | 55 | - | $1955m | $1852m | $1852m | $1903m | ($103m) | Payments to suppliers and employees - DSO | Operations | (56426609) | (26236285) | (19169984) | (11020341) | ||||||||||||||||||
| Income tax | (184) | 65 | - | $1852m | $1669m | $1669m | $1760m | ($184m) | Payments to suppliers and employees - CORP | Other | (3288103) | (1764275) | (604615) | (919213) | ||||||||||||||||||
| Other | (27) | 75 | - | $1669m | $1641m | $1641m | $1655m | ($27m) | Interest received | Other | 583081 | 204671 | 183686 | 194724 | ||||||||||||||||||
| Q2 FY19 | $1641m | Income tax paid | Income tax | (18355847) | (1525368) | (13797636) | (3032843) | |||||||||||||||||||||||||
| Interest paid | Other | (35635) | (1683) | (1498) | (32454) | |||||||||||||||||||||||||||
| Net cash flows from(used in) operations | 93679358 | 28749070 | 11817426 | 53112862 | ||||||||||||||||||||||||||||
| CASH FLOWS FROM INVESTING ACTIVITIES | ||||||||||||||||||||||||||||||||
| Payments for plant amp equipment | Other capex | (10075371) | (3903432) | (3019743) | (3152196) | |||||||||||||||||||||||||||
| Payments for exploration amp evaluation - WA | Exploration | (8306306) | (3558754) | (2346579) | (2400973) | |||||||||||||||||||||||||||
| Payments for exploration amp evaluation - NSW | Exploration | (2718365) | (982413) | (718445) | (1017507) | |||||||||||||||||||||||||||
| Payments for development - TWL BNG DGB | Mine development | (7534270) | (6416098) | (77128) | (1041044) | |||||||||||||||||||||||||||
| Payments for mine properties - DNO | Mine development | 910105 | 596531 | (25819) | 339393 | |||||||||||||||||||||||||||
| Payments for mine properties - DSO | Mine development | (10664238) | (1389637) | (5788769) | (3485832) | |||||||||||||||||||||||||||
| Payments for term deposits | Other | (442) | - | (442) | - | |||||||||||||||||||||||||||
| Proceeds on disposal of term deposits | Other | - | - | - | - | |||||||||||||||||||||||||||
| Payments for WALs | Other capex | - | - | - | - | |||||||||||||||||||||||||||
| Acquisition of exploration assets (net of cash) | Exploration | - | - | - | - | |||||||||||||||||||||||||||
| Proceeds on disposal of PampE | Other capex | 28073 | - | 5 | 28068 | |||||||||||||||||||||||||||
| Net cash flows used in investing activities | (38360814) | (15653802) | (11976921) | (10730091) | ||||||||||||||||||||||||||||
| CASH FLOWS FROM FINANCING ACTIVITIES | ||||||||||||||||||||||||||||||||
| Proceeds from equity raisings | - | - | - | - | ||||||||||||||||||||||||||||
| Proceeds from exercise of options | 119000 | 21000 | 70000 | 28000 | ||||||||||||||||||||||||||||
| Share issue costs | (15072) | (5652) | (5652) | (3768) | ||||||||||||||||||||||||||||
| Dividend paid | Dividends | - | - | - | - | |||||||||||||||||||||||||||
| Repayment of finance lease | Other capex | (209427) | (69624) | (69809) | (69994) | |||||||||||||||||||||||||||
| Repayment of borrowings | - | - | - | - | ||||||||||||||||||||||||||||
| Net cash flows from financing activities | (105499) | (54276) | (5461) | (45762) | ||||||||||||||||||||||||||||
| Net increase(decrease) in cash amp equivalents | 55213045 | 13040992 | (164956) | 42337009 | ||||||||||||||||||||||||||||
| Cash amp bullion at the start of the period | 147413092 | 147413092 | 144466157 | 147835566 | ||||||||||||||||||||||||||||
| Effects of exchange rate movements on cash | Operations | - | ||||||||||||||||||||||||||||||
| Movement in gold on hand | Operations | (38375614) | - | (15987926) | 3534365 | (25922053) | ||||||||||||||||||||||||||
| Cash amp bullion at the end of the period | 164250522 | 144466157 | 147835566 | 164250522 | ||||||||||||||||||||||||||||
| Cost | Sales | |||||||||||||||||||||||||||||||
| At 31-Dec | Oz | $oz | $ | $oz | $ | |||||||||||||||||||||||||||
| MLW | - | - | ||||||||||||||||||||||||||||||
| GDW | - | - | ||||||||||||||||||||||||||||||
| RMT | - | - | ||||||||||||||||||||||||||||||
| - | - | - | ||||||||||||||||||||||||||||||
| Values | Line X | Ends | Before | After | Line Y | Label Y | Y Label | CASH FLOWS FROM OPERATIONS | Category | Manual Adj | Jul-19 | Aug-19 | Sep-19 | |||||||||||||||||||
| Q4 FY19 | 2052 | 15 | $2052m | 2052 | Receipts from gold sales | Operations | 159881239 | 48733973 | 57888259 | 53259007 | ||||||||||||||||||||||
| Operations | 825 | 25 | - | $2052m | $2877m | $2877m | $2464m | $825m | Option premium income | Other | - | - | - | - | ||||||||||||||||||
| Dividends | (407) | 35 | - | $2877m | $2470m | $2470m | $2674m | ($407m) | Other income | Other | 49094 | 15362 | 16350 | 17382 | ||||||||||||||||||
| Capitalised Mining | (306) | 45 | - | $2470m | $2164m | $2164m | $2317m | ($306m) | Payments to suppliers and employees - DNO | Operations | (29966833) | (18867571) | (5421615) | (5677647) | ||||||||||||||||||
| Exploration | (101) | 55 | - | $2164m | $2063m | $2063m | $2114m | ($101m) | Payments to suppliers and employees - DSO | Operations | (81824490) | (49555333) | (18307389) | (13961768) | ||||||||||||||||||
| DKM Acquisition | (200) | 65 | - | $2063m | $1863m | $1863m | $1963m | ($200m) | Payments to suppliers and employees - CORP | Other | (6151175) | (2387178) | (2286742) | (1477255) | ||||||||||||||||||
| Other capex | (202) | 75 | - | $1863m | $1661m | $1661m | $1762m | ($202m) | Interest received | Other | 454852 | 171509 | 149152 | 134191 | ||||||||||||||||||
| Income tax | (133) | 85 | - | $1661m | $1528m | $1528m | $1594m | ($133m) | Income tax paid | Income tax | (13260068) | (6214961) | (2525166) | (4519941) | ||||||||||||||||||
| Other | (54) | 95 | - | $1528m | $1474m | $1474m | $1501m | ($54m) | Interest paid | Other | (19267) | (6681) | (6391) | (6195) | ||||||||||||||||||
| Q1 FY20 | $1474m | GIC Inventory Mvmt | GIC Mvmt | - | ||||||||||||||||||||||||||||
| Net cash flows from(used in) operations | 29163353 | (28110879) | 29506458 | 27767774 | ||||||||||||||||||||||||||||
| CASH FLOWS FROM INVESTING ACTIVITIES | ||||||||||||||||||||||||||||||||
| Payments for plant amp equipment | Other capex | (19997124) | (10746245) | (4214487) | (5036392) | |||||||||||||||||||||||||||
| Payments for exploration amp evaluation - WA | Exploration | (6737885) | (1447005) | (2144467) | (3146413) | |||||||||||||||||||||||||||
| Payments for exploration amp evaluation - NSW | Exploration | (3411817) | (889004) | (1537672) | (985141) | |||||||||||||||||||||||||||
| Payments for development | Capitalised Mining | (14273272) | (3407474) | (5400036) | (5465762) | |||||||||||||||||||||||||||
| Payments for mine properties - DNO | Capitalised Mining | (402980) | 844308 | (139170) | (1108118) | |||||||||||||||||||||||||||
| Payments for mine properties - DSO | Capitalised Mining | (15903074) | (8245160) | (6860356) | (797558) | |||||||||||||||||||||||||||
| Payments for termsecurity deposits | Other | (363) | - | (363) | - | |||||||||||||||||||||||||||
| Proceeds on disposal of term deposits | Other | - | - | - | - | |||||||||||||||||||||||||||
| Payments for WALs | Other capex | - | - | - | - | |||||||||||||||||||||||||||
| Acquisition of exploration assets (net of cash) | DKM Acquisition | (20000000) | - | (20000000) | - | |||||||||||||||||||||||||||
| Proceeds on disposal of PampE | Other capex | - | - | - | - | |||||||||||||||||||||||||||
| Net cash flows used in investing activities | (80726516) | (23890581) | (40296551) | (16539384) | ||||||||||||||||||||||||||||
| CASH FLOWS FROM FINANCING ACTIVITIES | ||||||||||||||||||||||||||||||||
| Proceeds from equity raisings | - | - | - | - | ||||||||||||||||||||||||||||
| Proceeds from exercise of options | Other | 279000 | 84000 | 195000 | - | |||||||||||||||||||||||||||
| Share issue costs | Other | (14386) | (10020) | (4366) | - | |||||||||||||||||||||||||||
| Dividends paid | Dividends | (40654437) | - | - | (40654437) | |||||||||||||||||||||||||||
| Repayment of finance lease | Other capex | (222262) | (97597) | (62234) | (62431) | |||||||||||||||||||||||||||
| Repayment of borrowings | - | - | - | - | ||||||||||||||||||||||||||||
| Net cash flows from financing activities | (40612085) | (23617) | 128400 | (40716868) | ||||||||||||||||||||||||||||
| Net increase(decrease) in cash amp equivalents | (92175248) | (52025077) | (10661693) | (29488478) | ||||||||||||||||||||||||||||
| Cash amp bullion at the start of the period | 205165482 | Elisha Civil Elisha CivilDifference between bullion for quarterly vs accounts Adjusted agaisnt mvmt in gold on hand | 205165482 | 176583719 | 165686211 | |||||||||||||||||||||||||||
| Effects of exchange rate movements on cash | Operations | - | ||||||||||||||||||||||||||||||
| Movement in gold on hand | Operations | 34422858 | - | 23443314 | (235815) | 11215359 | ||||||||||||||||||||||||||
| Cash amp bullion at the end of the period | 147413092 | 176583719 | 165686211 | 147413092 | ||||||||||||||||||||||||||||
| GOH Cost for Accounts revalued to Selling Price for Quarterly | Cost | Sales | ||||||||||||||||||||||||||||||
| At 30-Jun | Oz | $oz | $ | $oz | $ | |||||||||||||||||||||||||||
| MLW | 2331195 | 1244 | 2901126 | 1990 | 4639684 | |||||||||||||||||||||||||||
| GDW | 3775510 | 1135 | 4286261 | 1990 | 7514247 | |||||||||||||||||||||||||||
| RMT | 1779190 | 1202 | 2137768 | 1990 | 3541051 | |||||||||||||||||||||||||||
| 7885895 | 9325154 | 15694981 | ||||||||||||||||||||||||||||||
| Cash amp GOH | Jun-20 | Mar-20 | Dec-19 | Sep-19 | Jun-19 | Mar-19 | Dec-18 | Sep-18 | Jun-18 | $m | Q4FY20 | Q3FY20 | Q2FY20 | Q1FY20 | Q4FY19 | Q3FY19 | Q2FY19 | Q1FY19 | Q4FY18 | |||||||||||||||||||||
| $000s | $000s | $000s | $000s | $000s | $000s | $000s | $000s | $000s | Cash | 1924 | 1172 | 1590 | 965 | 1887 | 1407 | 1871 | 1319 | 1811 | ||||||||||||||||||||||
| Cash | 192403 | 117162 | 158962 | 96512 | 188687 | 140737 | 187076 | 131862 | 181108 | Gold | - | 310 | 98 | 509 | 166 | 458 | 198 | 581 | 277 | |||||||||||||||||||||
| Total | 1924 | 1481 | 1688 | 1474 | 2052 | 1865 | 2068 | 1900 | 2088 | |||||||||||||||||||||||||||||||
| GOH (Mint) | 17119 | - | 11495 | 864 | 23842 | 2376 | 33426 | 21159 | Adjustments | |||||||||||||||||||||||||||||||
| GOH (site) | 13840 | 9838 | 39397 | 15695 | 21957 | 17389 | 24702 | 6525 | Debt repay | - | 00 | |||||||||||||||||||||||||||||
| Total GOH | - | 30959 | 9838 | 50891 | 16559 | 45798 | 19764 | 58128 | 27685 | CMM purchase(sale) | - | (43) | ||||||||||||||||||||||||||||
| GOH (oz) | 11933 | 4431 | 23815 | 8321 | 25233 | 10625 | 34331 | 16285 | Land amp WAL purchase | 117 | ||||||||||||||||||||||||||||||
| Avg $oz | 2594 | 2220 | 2137 | 1990 | 1815 | 1860 | 1693 | 1700 | Tax | 98 | 90 | |||||||||||||||||||||||||||||
| Total Cash amp Gold | 192403 | 148121 | 168800 | 147403 | 205246 | 186535 | 206841 | 189990 | 208793 | Divs | 407 | 407 | 403 | - | ||||||||||||||||||||||||||
| Adjusted cash | 1924 | 1888 | 1688 | 1881 | 2052 | 1865 | 2068 | 2517 | 2135 | |||||||||||||||||||||||||||||||
| Gold on hand that is in the metals account amp still on site at month end has been measured at expected selling price in the above table At June year-end and December half-year end these ounces are measured at cost and included in inventory for financial reporting purposes | Cash build | 443 | 200 | 214 | (172) | 187 | (203) | 169 | 382 | |||||||||||||||||||||||||||||||
| Gold sold (oz) | 69922 | 111106 | 71702 | 106628 | 76817 | 114966 | 71310 | 88551 | ||||||||||||||||||||||||||||||||
| CURRENT MONTH END WORKINGS | Avg price ($oz) | 2297 | 2104 | 2000 | 1832 | 1838 | 1718 | 1660 | 1678 | |||||||||||||||||||||||||||||||
| Cash Yana Goncharova Yana Goncharovabank recs | Jun-20 | Sales ($m) | 1606 | 2337 | 1434 | 1953 | 1412 | 1976 | 1184 | 1486 | ||||||||||||||||||||||||||||||
| ANZCH | 83196 | uuml | ||||||||||||||||||||||||||||||||||||||
| MBLBG + CBABG | 460536 | uuml | ||||||||||||||||||||||||||||||||||||||
| MBLBG x2 | 42900 | uuml | ||||||||||||||||||||||||||||||||||||||
| MBLCHQ | 17035 | uuml | ||||||||||||||||||||||||||||||||||||||
| CBA CALL | 65311911 | uuml | ||||||||||||||||||||||||||||||||||||||
| MBLPR | 125283665 | uuml | ||||||||||||||||||||||||||||||||||||||
| CBACHQ | 397837 | uuml | ||||||||||||||||||||||||||||||||||||||
| CBALFB | 119698 | uuml | ||||||||||||||||||||||||||||||||||||||
| CBASA | 306497 | uuml | ||||||||||||||||||||||||||||||||||||||
| CBASI | 379878 | uuml | ||||||||||||||||||||||||||||||||||||||
| TOTAL | 192403154 | |||||||||||||||||||||||||||||||||||||||
| Gold on Site | Oz | $oz | $ | |||||||||||||||||||||||||||||||||||||
| Estimate - MLW | 35879 | 257628 | 924335 | (on site) | ||||||||||||||||||||||||||||||||||||
| Estimate - GDW | 2789448 | 257628 | 7186395 | (on site) | ||||||||||||||||||||||||||||||||||||
| Estimate - RMT | 2198695 | 260559 | 5728891 | |||||||||||||||||||||||||||||||||||||
| Total | 5346930 | 258833 | 13839622 | (Estimated selling price) | ||||||||||||||||||||||||||||||||||||
| At Mint | Oz | $oz | $ | |||||||||||||||||||||||||||||||||||||
| In metal account | 3544726 | 260559 | 9236092 | Bars 3256 to 3265 | ||||||||||||||||||||||||||||||||||||
| MLW | 573959 Yana Goncharova Yana Goncharovafrom D1-D3 | Yana Goncharova Yana Goncharovabank recs | 257628 | 1478678 | Bars 1776 to 1779 | |||||||||||||||||||||||||||||||||||
| GDW | 852378 | 257628 | 2195963 | Bars 3266 to 3275 | ||||||||||||||||||||||||||||||||||||
| RMT | 1615113 | 260559 | 4208318 | Bars 3266 to 3275 | ||||||||||||||||||||||||||||||||||||
| - | ||||||||||||||||||||||||||||||||||||||||
| - | ||||||||||||||||||||||||||||||||||||||||
| 6586176 | 259924 | 17119051 | (Estimated selling price) | |||||||||||||||||||||||||||||||||||||
| Total GOH | 11933106 | 259435 | 30958673 | |||||||||||||||||||||||||||||||||||||
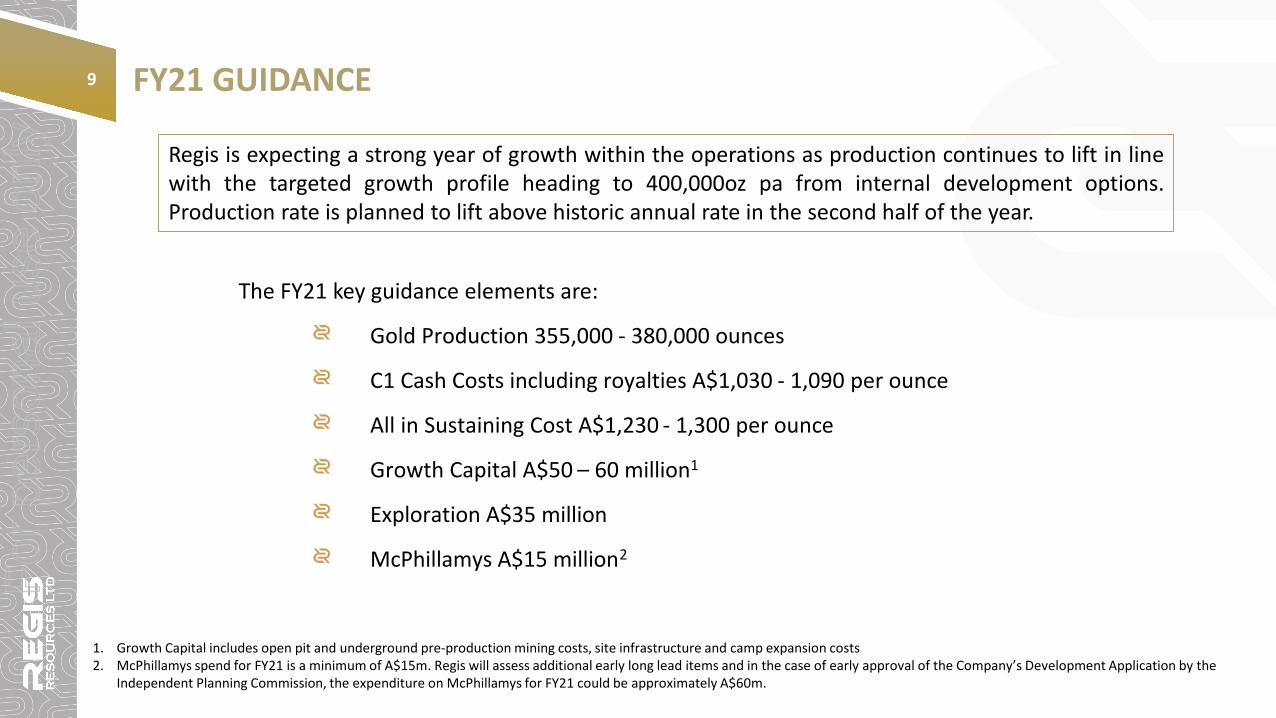
The FY21 key guidance elements are
Gold Production 355000 - 380000 ounces
C1 Cash Costs including royalties A$1030 - 1090 per ounce
All in Sustaining Cost A$1230 - 1300 per ounce
Growth Capital A$50 ndash 60 million1
Exploration A$35 million
McPhillamys A$15 million2
FY21 GUIDANCE
Regis is expecting a strong year of growth within the operations as production continues to lift in linewith the targeted growth profile heading to 400000oz pa from internal development optionsProduction rate is planned to lift above historic annual rate in the second half of the year
1 Growth Capital includes open pit and underground pre-production mining costs site infrastructure and camp expansion costs 2 McPhillamys spend for FY21 is a minimum of A$15m Regis will assess additional early long lead items and in the case of early approval of the Companyrsquos Development Application by the
Independent Planning Commission the expenditure on McPhillamys for FY21 could be approximately A$60m
9
For
per
sona
l use
onl
y
REVIEW OF FY202010
THE CURRENT BUSINESSrsquo PERFORMANCENet profit after tax of $200 million (FY19 $163 million) with a NPAT margin of 26 and ROE of 24
Dividends for FY2020 of 16 cents per share fully franked for a 41 grossed1 up yield
EBITDA of $394 million with strong EBITDA margin of 52
Cash and bullion of $2093 million2 as at 30 June 2020
Hedging reduced to ~399koz at end FY20 from approximately 452koz at end FY19 Deliveries into hedges increased to approximately 20000 ounces per quarter
1 Grossed up for 100 franking Annualised dividend yield of 16cps at a closing share price of $555 on 25 August 20202 Includes bullion on hand valued at $2576 per ounce
PROGRESSING FUTURE GROWTH
McPhillamys Development Application submitted and Responses to Submissions nearing completionTripled exploration tenure around Duketon Operations and increased Exploration budget by 32 to $35millionMoving to investment decision for Garden Well Underground Project For
per
sona
l use
onl
y
Additional Financial Information
For
per
sona
l use
onl
y
30 June 2020 30 June 2019$rsquo000 $rsquo000
Revenue 756657 654807Cost of goods sold (452011) (401970)Gross profit 304646 252837Other income (150) 4379
Investor and corporate costs (3408) (2521)Personnel costs (10062) (9360)Share-based payment expense (144) (1082)Occupancy costs (245) (1005)Other corporate administrative expenses (1052) (659)Exploration and evaluation written off (1686) (6729)Other (1215) (940)Finance costs (2024) (1447)Profit before income tax 284660 233473
Income tax expense (85143) (70323)Net profit 199517 163150
FY2020 ndash Profit amp Loss12
Earnings Per Share (cents per share) 3926 3218
For
per
sona
l use
onl
y
13
30 June 2020 30 June 2019$rsquo000 $rsquo000
Cash flows from operating activitiesReceipts from gold sales 755791 652450Payments to suppliers and employees (348923) (326680)Income tax paid (63792) (53971)Other receipts(payments) (63) 3686Net cash from operating activities 343013 275485Cash flows from investing activitiesAcquisition of plant and equipment (net) (51114) (56395)Payments for exploration and evaluation (37118) (34840)Payments for acquisition of exploration assets (21281) -Payments for mine properties under development (57307) (35632)Payments for mine properties (77524) (60500)Other receipts(payments) - 77Net cash used in investing activities (244344) (187290)Cash flows from financing activitiesProceeds from issue of shares 279 1697Payment of transaction costs (14) (65)Payment of lease liabilities (13894) (1052)Dividends paid (81309) (81196)Net cash used in financing activities (94938) (80616)Net increase(decrease) in cash and cash equivalents 3731 7579Cash and cash equivalents at 1 July 188697 181118Cash and cash equivalents at 30 June 192428 188697
FY2020 ndash Cash Flow StatementF
or p
erso
nal u
se o
nly
14 30 June 2020 30 June 2019$rsquo000 $rsquo000
Current assetsCash and cash equivalents 192428 188697Inventories 74430 56077Other current assets 10847 10141Total current assets 277705 254915Non-current assetsInventories 63503 55898Property plant and equipment 261676 242988Exploration and evaluation expenditure 230260 185748Mine properties under development 2188 44163Mine properties 275939 167713Right-of-use assets 38034 -Other 2572 2572Total non-current assets 874172 699082Total assets 1151877 953997Current liabilitiesTrade and other payables 74181 67613Income tax payable 7471 12224Lease Liabilities 15856 793Other 3994 3479Total current liabilities 101502 84109Non-current liabilitiesDeferred tax liabilities 117408 91305Provisions amp Lease liabilities 97886 62119Total non-current liabilities 215294 153424Total liabilities 316796 237533Net AssetsTotal Equity
835081835081
716464716464
FY2020 ndash Balance SheetF
or p
erso
nal u
se o
nly
ldquoSPOT DEFERREDrdquo ndash FLEXIBLE GOLD HEDGE BOOK (30 June 2020)
Regisrsquo hedge position reduced to ~399koz at an average of A$1614oz
Regis is currently actively managing the process of selling into thelowest price hedges and reduced its hedges by approximately 52000ounces in FY20
Regis has recently increased the rate at which it is delivering into itsmost out of the money hedges to 20000 ounces per quarter
Hedging Price Range Quantity (ozrsquos)
A$1400 - $1500 157000
A$1500 - $1600 15000
A$1600 - $1700 36000
A$1700 - $1800 131000
A$1800 - $1900 60000
15
Period Volume (ozrsquos)
Today ndash Dec 2020 600000
Jan 2021 ndash Dec 2021 400000
Jan 2022 ndash Dec 2022 200000
Jan 2023 ndash June 2023 100000
July 2023 Nil
Table 2 Current Hedging Volume LimitsTable 1 Hedging Volumes amp Price Ranges
2200
0
500
1000
1500
2000
2500
Gold Price
Ave spot priceRealised Price
2333
For
per
sona
l use
onl
y
FY 2020 FY2019
Physicals DNO DSO TOTAL TOTAL Variance
Ore mined (Mbcm) 136 280 416 428 -3
Waste mined (Mbcm) 681 1956 2637 2812 -6
Stripping ratio (wo) 50 70 63 66 -5
Ore mined (Mtonnes) 275 723 998 1014 -2
Ore milled (Mtonnes) 300 637 937 943 -1
Head grade (gt) 104 135 125 127 -2
Recovery () 923 940 935 940 -1
Gold production (ounces) 92184 259858 352042 363418 -3
FY2020 PHYSICALS16
For
per
sona
l use
onl
y
Further information Jim Beyer | Managing Director amp CEO+ 61 8 9442 2200
For
per
sona
l use
onl
y
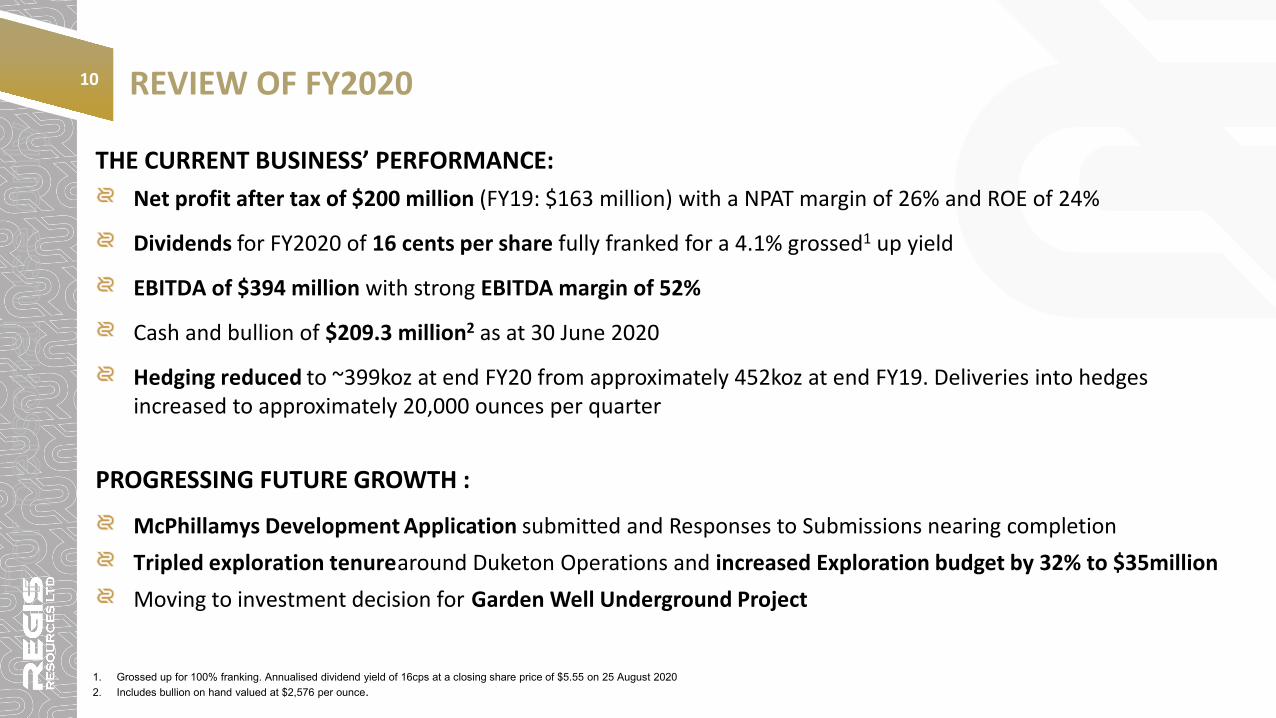

30 June 2020 30 June 2019$rsquo000 $rsquo000
Revenue 756657 654807Cost of goods sold (452011) (401970)Gross profit 304646 252837Other income (150) 4379
Investor and corporate costs (3408) (2521)Personnel costs (10062) (9360)Share-based payment expense (144) (1082)Occupancy costs (245) (1005)Other corporate administrative expenses (1052) (659)Exploration and evaluation written off (1686) (6729)Other (1215) (940)Finance costs (2024) (1447)Profit before income tax 284660 233473
Income tax expense (85143) (70323)Net profit 199517 163150
FY2020 ndash Profit amp Loss12
Earnings Per Share (cents per share) 3926 3218
For
per
sona
l use
onl
y
13
30 June 2020 30 June 2019$rsquo000 $rsquo000
Cash flows from operating activitiesReceipts from gold sales 755791 652450Payments to suppliers and employees (348923) (326680)Income tax paid (63792) (53971)Other receipts(payments) (63) 3686Net cash from operating activities 343013 275485Cash flows from investing activitiesAcquisition of plant and equipment (net) (51114) (56395)Payments for exploration and evaluation (37118) (34840)Payments for acquisition of exploration assets (21281) -Payments for mine properties under development (57307) (35632)Payments for mine properties (77524) (60500)Other receipts(payments) - 77Net cash used in investing activities (244344) (187290)Cash flows from financing activitiesProceeds from issue of shares 279 1697Payment of transaction costs (14) (65)Payment of lease liabilities (13894) (1052)Dividends paid (81309) (81196)Net cash used in financing activities (94938) (80616)Net increase(decrease) in cash and cash equivalents 3731 7579Cash and cash equivalents at 1 July 188697 181118Cash and cash equivalents at 30 June 192428 188697
FY2020 ndash Cash Flow StatementF
or p
erso
nal u
se o
nly
14 30 June 2020 30 June 2019$rsquo000 $rsquo000
Current assetsCash and cash equivalents 192428 188697Inventories 74430 56077Other current assets 10847 10141Total current assets 277705 254915Non-current assetsInventories 63503 55898Property plant and equipment 261676 242988Exploration and evaluation expenditure 230260 185748Mine properties under development 2188 44163Mine properties 275939 167713Right-of-use assets 38034 -Other 2572 2572Total non-current assets 874172 699082Total assets 1151877 953997Current liabilitiesTrade and other payables 74181 67613Income tax payable 7471 12224Lease Liabilities 15856 793Other 3994 3479Total current liabilities 101502 84109Non-current liabilitiesDeferred tax liabilities 117408 91305Provisions amp Lease liabilities 97886 62119Total non-current liabilities 215294 153424Total liabilities 316796 237533Net AssetsTotal Equity
835081835081
716464716464
FY2020 ndash Balance SheetF
or p
erso
nal u
se o
nly
ldquoSPOT DEFERREDrdquo ndash FLEXIBLE GOLD HEDGE BOOK (30 June 2020)
Regisrsquo hedge position reduced to ~399koz at an average of A$1614oz
Regis is currently actively managing the process of selling into thelowest price hedges and reduced its hedges by approximately 52000ounces in FY20
Regis has recently increased the rate at which it is delivering into itsmost out of the money hedges to 20000 ounces per quarter
Hedging Price Range Quantity (ozrsquos)
A$1400 - $1500 157000
A$1500 - $1600 15000
A$1600 - $1700 36000
A$1700 - $1800 131000
A$1800 - $1900 60000
15
Period Volume (ozrsquos)
Today ndash Dec 2020 600000
Jan 2021 ndash Dec 2021 400000
Jan 2022 ndash Dec 2022 200000
Jan 2023 ndash June 2023 100000
July 2023 Nil
Table 2 Current Hedging Volume LimitsTable 1 Hedging Volumes amp Price Ranges
2200
0
500
1000
1500
2000
2500
Gold Price
Ave spot priceRealised Price
2333
For
per
sona
l use
onl
y
FY 2020 FY2019
Physicals DNO DSO TOTAL TOTAL Variance
Ore mined (Mbcm) 136 280 416 428 -3
Waste mined (Mbcm) 681 1956 2637 2812 -6
Stripping ratio (wo) 50 70 63 66 -5
Ore mined (Mtonnes) 275 723 998 1014 -2
Ore milled (Mtonnes) 300 637 937 943 -1
Head grade (gt) 104 135 125 127 -2
Recovery () 923 940 935 940 -1
Gold production (ounces) 92184 259858 352042 363418 -3
FY2020 PHYSICALS16
For
per
sona
l use
onl
y
Further information Jim Beyer | Managing Director amp CEO+ 61 8 9442 2200
For
per
sona
l use
onl
y
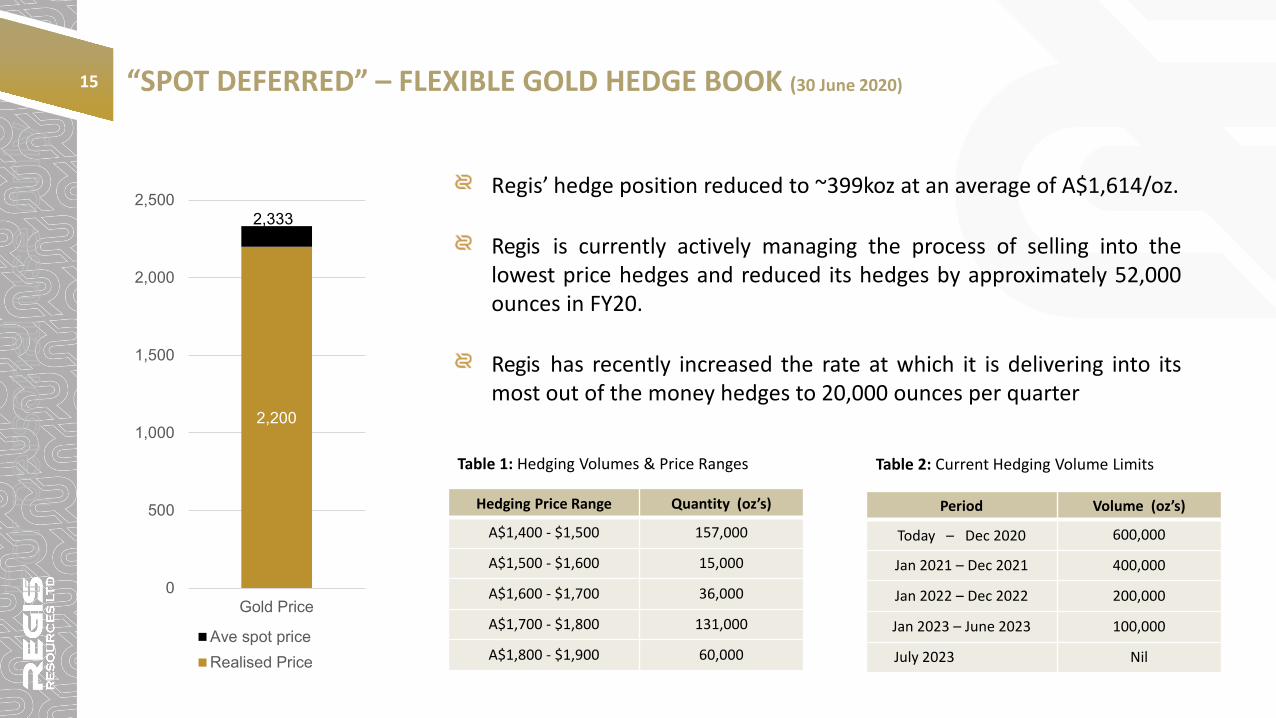
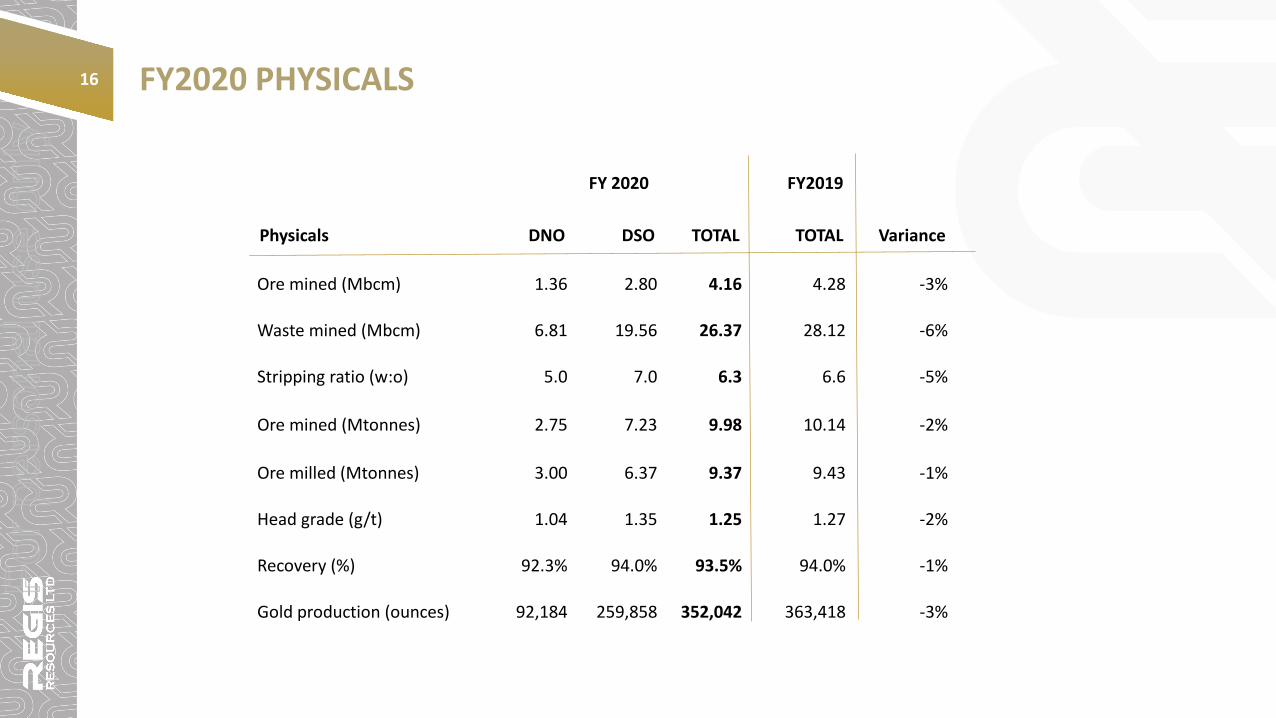

Further information Jim Beyer | Managing Director amp CEO+ 61 8 9442 2200
For
per
sona
l use
onl
y


![$ EDUCATIONAL FACILITIES REVENUE [AND REVENUE REFUNDING… · EDUCATIONAL FACILITIES REVENUE [AND REVENUE REFUNDING] ... Educational Facilities Revenue [and Revenue ... Aeronautical](https://img.pdfslide.us/doc/110x75/5b16e1207f8b9a686d8e7aa7/-educational-facilities-revenue-and-revenue-refunding-educational-facilities.jpg)